Embed Size (px)
Citation preview

July 2000
INCO – Port Colborne (1999)
Phytotoxicology Soil Investigation:
Environment Ministry of the
Phytotoxicology Soil Investigation:INCO – Port Colborne (1999)
Phytotoxicology Investigator/Author: Allen KujaContributing Scientists:
Randall JonesWilliam McIlveen
Phytotoxicology and Soils Standards Section, Standards Development BranchOntario Ministry of the Environment
July 2000
Cette publication technique n’est disponible qu’en anglais.
Copyright: Queen’s Printer for Ontario, 2001 This publication may be reproduced for non-commercial
purposes with appropriate attribution.Report No. SDB-031-3511-2000
Printed on 50% recycled paper including 10% post-consumer fibre
PIBS 4010e

1.0 Executive Summary
The objective of this investigation was to undertake additional sampling of soil in the two areas of impact for which contour mapping based on 1998 survey results may 1) overestimate the 100-200 ug/g Ni contamination zone, west of INCO, or 2) underestimate the 200-500 ug/g Ni contamination zone, northeast of INCO. In addition, the extent of the area for which soil Ni concentrations exceeded the soil background concentration (43 ug/g) was only approximated by the computer-generated contour map because soil nickel background concentrations continued to remain well over 43 ug/g at the furthest sample site from Port Colborne, located 13 km northeast of INCO.
Computer contour maps were derived using Surfer/Arview based on sample data provided from both 1999 and 1998 survey sites, and historical survey results with the purpose of filling in data gaps in the 1998 survey results. Inclusion of the additional data resulted in changes to the shape and size of the 43-100 ug/g soil Ni, 100-200 ug/g soil Ni and 200-500 ug/g soil Ni contour intervals, respectively. The MOE Table F soil background value for Ni is exceeded beyond a distance of 28 km northeast of INCO and over a area of 345 km2. The Cu and Co Table F soil values are exceeded in surface soil beyond a 3 km distance in the same direction, and over areas of 7.9 and 7.2 km2 , respectively. Soil Ni concentrations are shown to exceed the MOE Table A soil remediation criterion for up to 3 km northeast of INCO and is estimated to cover an area of almost 29 km2. Table A Cu and Co criteria are exceeded over areas of 0.2 and 0.8 km2, respectively. As previously mentioned, soil concentrations of Ni, Cu and Co which exceed their corresponding Table A criterion are potentially phytotoxic. The substantial increase in sample sites (a total of 200 sites) has provided a more precise estimate of the area in and around the city of Port Colborne that has been impacted by over sixty-six years of INCO emissions and atmospheric deposition.
The soil metal contamination in Port Colborne is not a threat to human health but can be potentially phytotoxic with Ni being the most toxic. Agricultural liming and fertilizer amendments should allow for remediation of the areas above the Table A ‘effects-based’ criteria with marginal disturbance to the impacted properties. The amount of lime and application rate will depend on the contaminant concentration, the soil physical and chemical characteristics of the soils to be remediated. At sites where the soil Ni, Cu and Co contamination only marginally exceeds Table A criteria, and the contamination is concentrated in the surface soil, deep cultivation may lower metal concentrations in the rooting zone of plants sufficiently that soil is no longer potentially phytotoxic.
Report No. SDB-032-3511-2000 1
2.0 Table of Contents
2.0 Table of Contents . . . . . . . . . . . . . . . . . . . . . . . . . . . . . . . . . . . . . . . . . . . . . . . . . . . . . . . . . . . 2
3.0 List of Tables . . . . . . . . . . . . . . . . . . . . . . . . . . . . . . . . . . . . . . . . . . . . . . . . . . . . . . . . . . . . . . 3
4.0 List of Appendices . . . . . . . . . . . . . . . . . . . . . . . . . . . . . . . . . . . . . . . . . . . . . . . . . . . . . . . . . . 4
5.0 List of Maps . . . . . . . . . . . . . . . . . . . . . . . . . . . . . . . . . . . . . . . . . . . . . . . . . . . . . . . . . . . . . . 6
6.0 Introduction . . . . . . . . . . . . . . . . . . . . . . . . . . . . . . . . . . . . . . . . . . . . . . . . . . . . . . . . . . . . . . . 7
7.0 Objectives of 1999 Soil Investigation . . . . . . . . . . . . . . . . . . . . . . . . . . . . . . . . . . . . . . . . . . . 8
8.0 Methodology . . . . . . . . . . . . . . . . . . . . . . . . . . . . . . . . . . . . . . . . . . . . . . . . . . . . . . . . . . . . . . 88.1 Soil Survey . . . . . . . . . . . . . . . . . . . . . . . . . . . . . . . . . . . . . . . . . . . . . . . . . . . . . . . . . . 88.2 Use of Historical Survey Data . . . . . . . . . . . . . . . . . . . . . . . . . . . . . . . . . . . . . . . . . . . 98.3 Sample Preparation and Analysis . . . . . . . . . . . . . . . . . . . . . . . . . . . . . . . . . . . . . . . . 98.4 Data Analysis, Presentation and Interpretation . . . . . . . . . . . . . . . . . . . . . . . . . . . . . . 98.5 Contour Maps . . . . . . . . . . . . . . . . . . . . . . . . . . . . . . . . . . . . . . . . . . . . . . . . . . . . . . . 10
9.0 Results . . . . . . . . . . . . . . . . . . . . . . . . . . . . . . . . . . . . . . . . . . . . . . . . . . . . . . . . . . . . . . . . . . 119.1 Analytical Data . . . . . . . . . . . . . . . . . . . . . . . . . . . . . . . . . . . . . . . . . . . . . . . . . . . . . 11
9.1.1 Soil Nickel, Copper and Cobalt . . . . . . . . . . . . . . . . . . . . . . . . . . . . . . . . . 119.1.2 Other Inorganic Elements . . . . . . . . . . . . . . . . . . . . . . . . . . . . . . . . . . . . . . 11
10.0 Discussion . . . . . . . . . . . . . . . . . . . . . . . . . . . . . . . . . . . . . . . . . . . . . . . . . . . . . . . . . . . . . . 1210.1 Total Areas Estimated to Exceed Table F/Table A Guidelines for Ni, Cu, and Co.
. . . . . . . . . . . . . . . . . . . . . . . . . . . . . . . . . . . . . . . . . . . . . . . . . . . . . . . . . . . . . . . 1410.2 Phytotoxicity . . . . . . . . . . . . . . . . . . . . . . . . . . . . . . . . . . . . . . . . . . . . . . . . . . . . . . 1510.3 Human Health Risks . . . . . . . . . . . . . . . . . . . . . . . . . . . . . . . . . . . . . . . . . . . . . . . . 16
11.0 Conclusions . . . . . . . . . . . . . . . . . . . . . . . . . . . . . . . . . . . . . . . . . . . . . . . . . . . . . . . . . . . . . 16
12.0 References . . . . . . . . . . . . . . . . . . . . . . . . . . . . . . . . . . . . . . . . . . . . . . . . . . . . . . . . . . . . . . 18
Report No. SDB-032-3511-2000 2
3.0 List of Tables
Table 1: Station Identification, Location, Description of Samples 18 - 1999 INCO Port Colborne Soil Survey (soil depth 0-5 cm).
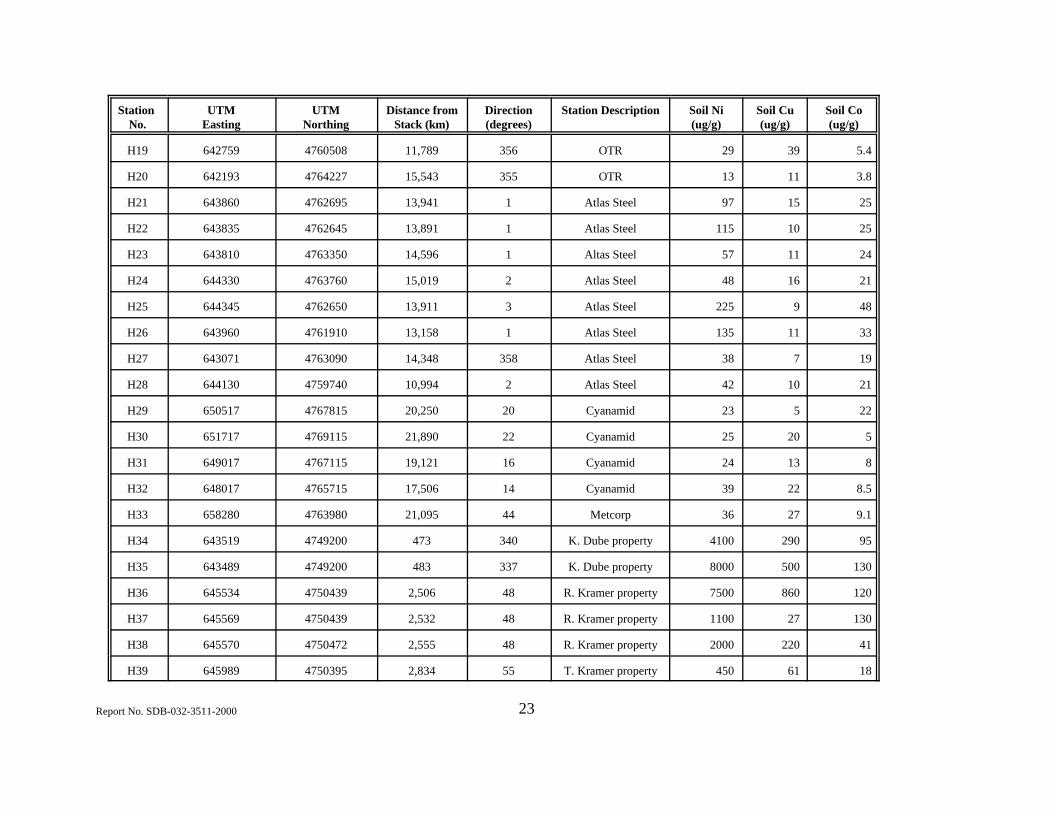
Table 2: Additional Historical Stations Used in Preparation of Ni, Cu, Co 21Contour Maps for the INCO Pt.Colborne Soil Survey (soil depth 0-5 cm).
Table 3: Concentrations of Nickel, Copper and Cobalt in soil (0-5 cm) 24collected in November 1999 - INCO Pt.Colborne Soil Survey (ug/g).
Table 4: Estimate of Areas that Exceed the MOE Table F and Table A 25Soil Criteria as determined by Surfer/ArcView (1999 vs. 1998 data).
Report No. SDB-032-3511-2000 3

4.0 List of Appendices
A1: Concentration of Aluminum (Al) in soil (0-5 cm depth) collected in the Port Colbornearea (November 1999). (ug/g) 27
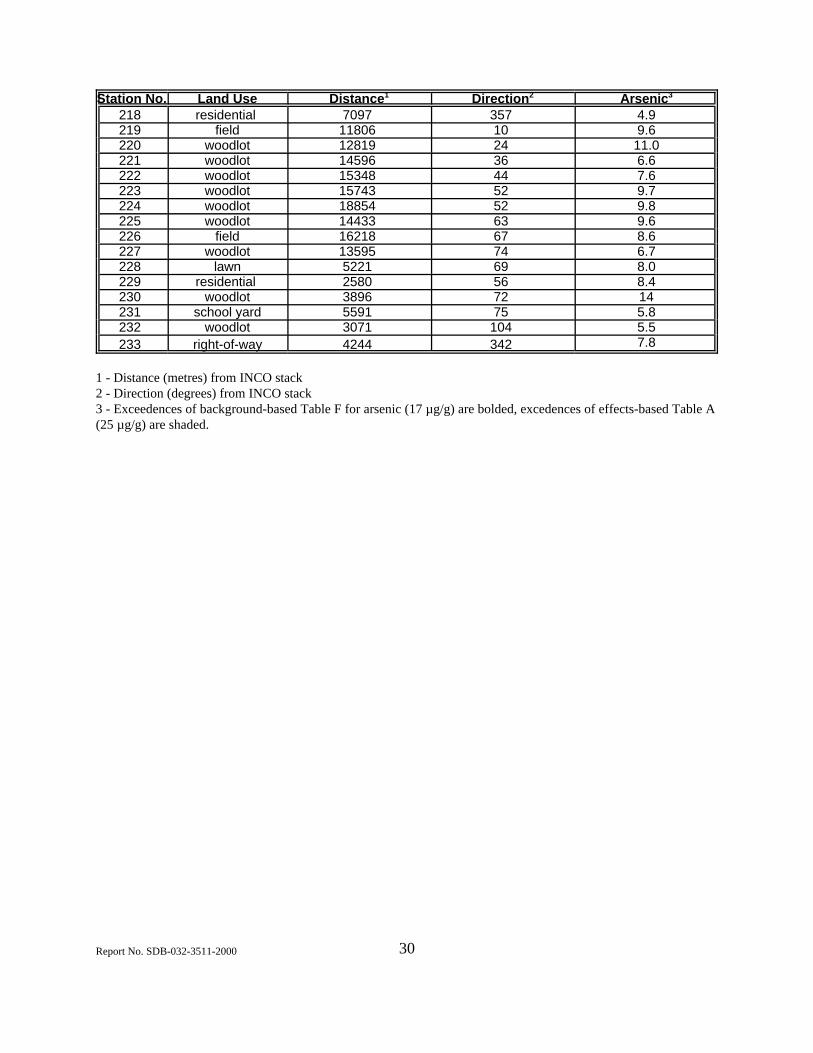
A2: Concentration of Arsenic (As) in soil (0-5 cm depth) collected in the Port Colborne area(November 1999). (ug/g) 29
A3: Concentration of Barium (Ba) in soil (0-5 cm depth) collected in the Port Colborne area(November 1999). (ug/g) 31
A4: Concentration of Berylium (Be) in soil (0-5 cm depth) collected in the Port Colborne area(November 1999). (ug/g) 33
A5: Concentration of Calcium (Ca) in soil (0-5 cm depth) collected in the Port Colborne area(November 1999). (ug/g) 35
A6: Concentration of Cadmium (Cd) in soil (0-5 cm depth) collected in the Port Colbornearea (November 1999). (ug/g) 37
A7: Concentration of Chromium (Cr) in soil (0-5 cm depth) collected in the Port Colbornearea (November 1999). (ug/g) 39
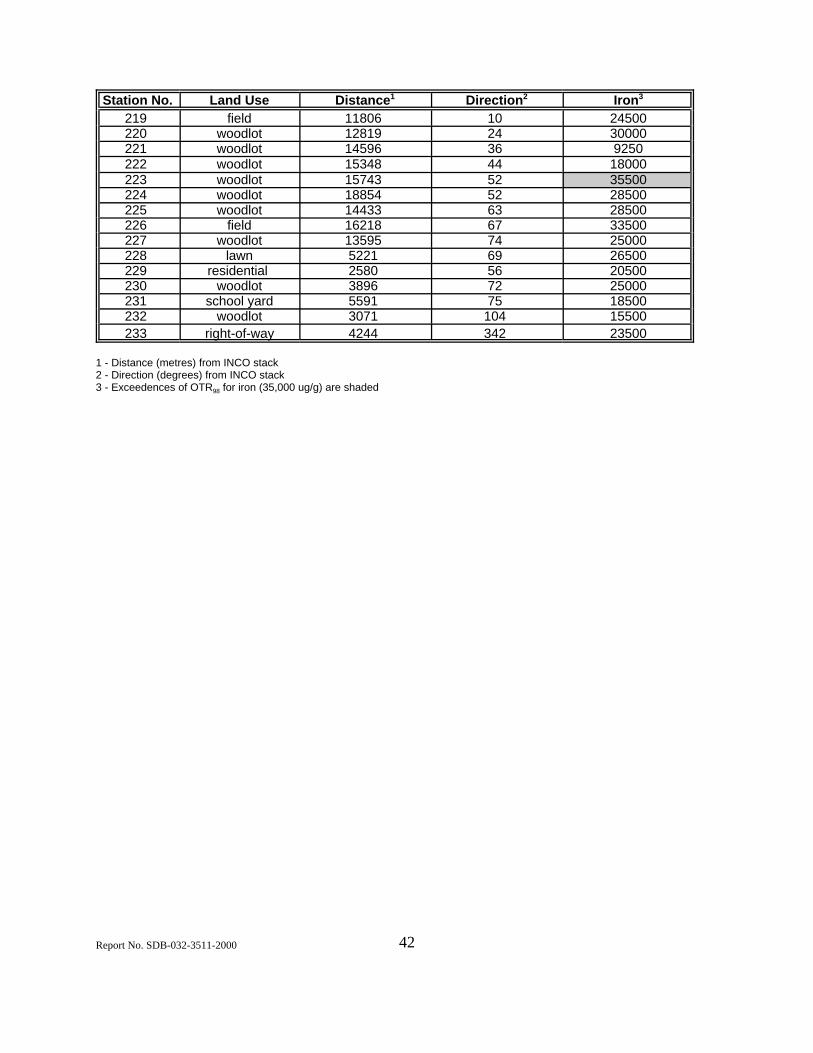
A8: Concentration of Iron (Fe) in soil (0-5 cm depth) collected in the Port Colborne area(November 1999). (ug/g) 41
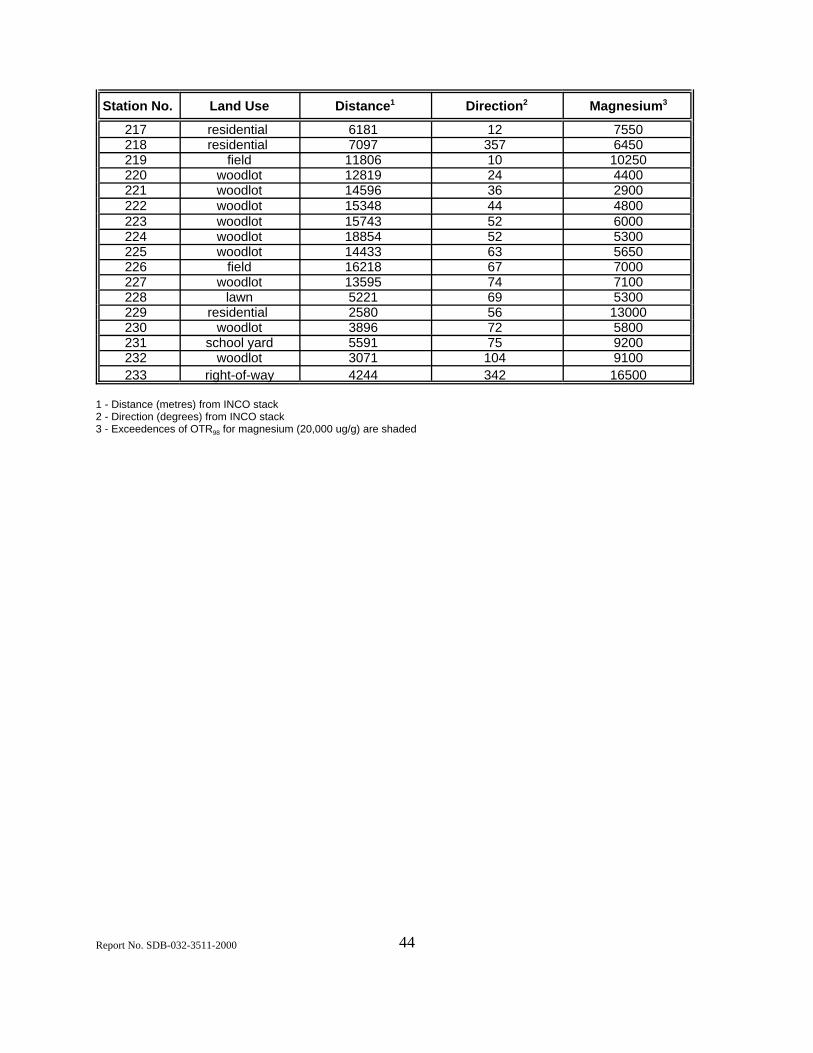
A9: Concentration of Magnesium (Mg) in soil (0-5 cm depth) collected in the Port Colbornearea (November 1999). (ug/g) 43
A10: Concentration of Manganese (Mn) in soil (0-5 cm depth) collected in the Port Colbornearea (November 1999). (ug/g) 45
A11: Concentration of Molybdenum (Mo) in soil (0-5 cm depth) collected in the Port Colbornearea (November 1999). (ug/g) 47
A12: Concentration of Lead (Pb) in soil (0-5 cm depth) collected in the Port Colborne area(November 1999). (ug/g) 49
A13: Concentration of Strontium (Sr) in soil (0-5 cm depth) collected in the Port Colborne area(November 1999). (ug/g) 51
A14: Concentration of Vanadium (V) in soil (0-5 cm depth) collected in the Port Colborne area(November 1999). (ug/g) 53
Report No. SDB-032-3511-2000 4
A15: Concentration of Zinc (Zn) in soil (0-5 cm depth) collected in the Port Colborne area(November 1999). (ug/g) 55
B: Derivation of MOE Phytotoxicology Ontario Typical Range Values. 57
C: Derivation of MOE Guideline for Use at Contaminated Sites in Ontario. 58
D: Methodology for Producing Surfer/Arcview Soil Contamination Maps. 59
E: List of MOE Phytotoxicology Investigations conducted in the Vicnity of INCO, PortColbornbe (excluding investigations on private property conducted at the ownersrequest). 62
Report No. SDB-032-3511-2000 5

5.0 List of Maps
Map 1: Regional Soil Sampling Locations - Surface Soil (0-5 cm) -1999; Surface Soil (0-5 cm) - 1998; Surface Soil (0-5 cm) Historical Surveys (0-5 cm); Soil Profiles (0-5, 5-10, 10-15 cm), 1998.
Map 2: City Sampling Locations (Port Colborne) - Surface Soil (0-5 cm), 1999; Surface Soil (0-5cm), 1998; Surface Soil (0-5 cm), Historical Surveys; Soil Profile (0-5 cm, 5-10 cm, 10-15 cm), 1998.
Map 3: City Sampling Locations (Welland) - Surface Soil (0-5 cm), 1999; Surface Soil (0-5 cm), Historical Surveys.
Map 4: Nickel in Surface (0-5 cm) Soil - Port Colborne 1998-1999.
Map 5: Copper in Surface (0-5 cm) Soil - Port Colborne 1998- 1999.
Map 6: Cobalt in Surface (0-5 cm) Soil - Port Colborne 1998- 1999.
Map 7: Nickel Table A and F - Port Colborne 1998 - 1999.
Map 8: Copper in Surface (0-5 cm) Soil - Port Colborne 1998-1999.
Map 9: Cobalt Table A and F - Port Colborne 1998-1999.
Report No. SDB-032-3511-2000 6

Phytotoxicology Soil Investigation - INCO Port Colborne (1999)
6.0 Introduction
Results of a 1998 Phytotoxicology investigation confirmed that soil to a depth of at least 15 cm in Port Colborne area is severely contaminated with nickel, and to a lesser extent with copper and cobalt [Ref. 1]. Soil nickel background concentrations (43 ug/g) are exceeded beyond 13 km northeast of INCO and extend over an area greater than 159 km2, and more than 4 km in the same direction for copper 85 ug/g, 8.9 km2 and cobalt (21 ug/g, 6.1 km2). Soil nickel concentrations exceed the effects-based MOE soil remediation criterion (200 ug/g) up to 8 km northeast of the refinery, and extend over an a 19 km2 area. The soil remediation criteria for copper (300 ug/g) and cobalt (50 ug/g) are exceeded over a 0.3 km2 and 1.6 km2 area, respectively.
Soil nickel concentrations exceeding the MOE generic soil criterion are potentially phytotoxic; for example, a reduction in crop yield and/or foliar injury on sensitive species of vegetation. A health study conducted by the MOE (Technical Report: Assessment of Potential Health Risks of Reported Soil Levels of Nickel, Copper, and Cobalt in Port Colborne and Vicinity, May 1997) and based on a multi-media assessment of potential risks concluded that no adverse health effects are anticipated to result from exposure to soil metal contamination in the Port Colborne area.
Despite an intensive sample strategy, the complete area impacted was not determined in the 1998 soil investigation. Soil nickel concentrations collected from the farthest downwind sites (>13 km) were still approximately twice expected soil background values. The computergenerated contour maps produced for the 1998 soil investigation report were statistical approximations of the spatial distribution of the different contaminants. Soil concentrations are only known with certainty at those sites for which soil was actually sampled and chemically analyzed.
Contour intervals produced by the computer program are significantly affected by the spatial distribution of the sampling sites, the accuracy of the position information of the sampling sites, and the program options used to generate the contours. The accuracy of the contours diminishes at the edges of the maps and in large areas where there are no or very few sample sites. Also, local site disturbances and data variability may have skewed the computer-generated contaminant contours resulting in an overestimation of the area to the northwest of Port Colborne with soil nickel concentrations in the 100-200 ug/g range, and an underestimation of the 200-500 ug/g nickel contamination zone lying to the northeast of INCO. Based on the 1998 investigation findings, and the contour maps that resulted from the input data, it was decided that additional sampling was warranted to identify and delineate the extent of soil Ni, Cu and Co contamination in the city of Port Colborne and the surrounding municipalities.
Report No. SDB-032-3511-2000 7

7.0 Objectives of 1999 Soil Investigation
The objective of this investigation was to undertake additional sampling of soil in the two areas of impact for which contour mapping based on 1998 survey results may 1) overestimate the 100-200 ug/g Ni contamination zone, northwest of INCO, or 2) underestimate the 200-500 ug/g Ni contamination zone, northeast of INCO. In addition, the extent of the area for which soil Ni concentrations exceeded the soil background concentration (43 ug/g) was only approximated by the computer-generated contour map because soil nickel background concentrations continued to remain well over 43 ug/g at the furthest sample site from Port Colborne, located 13 km northeast of INCO.
Further sampling of the surface soil (0-5 cm depth) was to be conducted at addition sites located withing the two areas of impact, as well at greater distances to the north, east and northeast of the city of Port Colborne (as far away as 18.8 km from INCO) for the purpose of filling in gaps in the 1998 data in order to generate contour maps which better define and delineate the extent of soil nickel, copper and cobalt levels in the city of Port Colborne and the surrounding region. In addition, the decision was made to include additional soil data collected from historical Phytotoxicology surveys (going back to 1990) to better define the total area for which soil nickel background concentrations (43 ug/g) have been exceeded.
8.0 Methodology
8.1 Soil Survey
Ecological Standards and Toxicology Section staff conducted this soil investigation on November 2 and 3, 1999. A total of 64 new surface soil (0-5 cm depth) sites were established in the city of Port Colborne and the surrounding region to more accurately delineate the spatial extent of soil nickel, copper and cobalt contamination estimated from soil data obtained from the 1998 soil survey (refer to Table 1). Details of sample sites (description, and location relative to local roads and landscape features, as well as UTM co-ordinates are summarized in Table 1. These geo-referenced co-ordinates were obtained with a Garmin 12XL satellite global positioning unit. As in the 1998 survey, selected sites included, street boulevards, residential lawns, parks, right-of-ways, commercial lawns and wood lots.
The locations of 1999 sample sites which established within the city of Port Colborne, as well as the surrounding region, are shown as open circles in Map 1. Map 1 also provides the location of 1998 surface soil sites (solid circles), 1998 soil profile sites (squares) and historical survey sites (black pentagons) going back to 1990. The more intensive network of 1999 sample sites established in and around the city of Port Colborne are shown in Map 2. Again, Map 2 also shows the location of 1998 survey sites from which data was used in developing contour maps of soil nickel, copper and cobalt concentrations in the previous Phytotoxicology survey report.
Report No. SDB-032-3511-2000 8

All soil samples were collected in duplicate using standard MOE field protocols [Ref. 2]. This involves using a soil coring device which cuts a cylindrical core, two centimeters in diameter, to the depth to which the corer is inserted. Each sample consists of approximately 30 cores taken throughout the designated sampling area. Soil cores were placed directly into a labelled polyethylene bag.
8.2 Use of Historical Survey Data
Surface soil data were utilized from 48 historical survey sites, dating back no further than 1990 and located in and around the municipalities of Welland, Niagara Falls and Fort Erie, for the purpose of providing additional information for developing more accurate contour maps of soil nickel, copper and cobalt concentrations in and around the city of Port Colborne. These historical sites includ Ontario Typical Range (OTR) sites, as well as industrial and residential survey sites. Information on the chosen historical survey sites, and corresponding soil concentrations of nickel, copper and cobalt associated with these sites, are shown in Table 2. The positions of historical survey sites located to the east and northeast of the city of Port Colborne, are shown in Map 2. Due to the close proximity of the 27 historical survey sites selected from within the city of Welland, the location of these sampling sites are also shown in Map 3 for greater clarity.
8.3 Sample Preparation and Analysis
Soil samples were processed at the Ecological Standards and Toxicology processing laboratory (air-dried, homogenized, ground and sieved to 355 micron size fraction, and stored in glass jars) using standard MOE protocols [Ref. 3]. Samples were then forwarded to the MOE Laboratory Services Branch for analysis of trace metals on a dry weight basis by inductivelycoupled plasma-atomic emission spectrometry (ICP-AES) for total aluminum (Al), barium (Ba), beryllium (Be), calcium (Ca), cadmium (Cd), cobalt (Co), copper (Cu), chromium (Cr), iron (Fe), magnesium (Mg), Manganese (Mn), molybdenum (Mo), nickel (Ni), lead (Pb) strontium (Sr), vanadium (V) and zinc (Zn). Arsenic (As) was analyzed using flameless atomic absorption spectrophotometry. A select number of soil samples, collected during the 1998 soil investigation, were re-analyzed along with the 1999 survey samples to verify data comparability and compatability.
8.4 Data Analysis, Presentation and Interpretation
Soil analytical results for each of the 18 inorganic elements were compared with Ontario soil background concentrations for non-agricultural soils (Table F Guidelines). These values represent the expected distribution of chemical concentrations resulting from natural geological processes and normal human activity remote from the influence of known point sources of
Report No. SDB-032-3511-2000 9
emissions. For those inorganic elements for which there is no Table F Guideline (i.e. Al, Ca, Fe, Mg, Mn, Sr), MOE ‘Ontario Typical Range’ (OTR) guidelines were utilized for comparative purposes. The OTRs are a province-wide background-based set of guidelines derived for a large number of inorganic elements and organic compounds (see Appendix B). Table F Guidelines are based on the OTRs. In addition, the analytical results were also compared with the effects-based Table A Guidelines for residential/parkland land uses.
For this soil investigation, Table A criteria for medium/fine textured soils were utilized as they are more appropriate for the fine textured soils encountered during the survey than the generic criteria for coarse textured soils. Table A criteria apply to potable groundwater situations (i.e. drinking water is obtained from a groundwater aquifer), which apply to most of the area of Port Colborne outside of the city core. Some areas in the investigation may be served by a municipal drinking water supply that does not rely on local groundwater. Table B Guideline criteria would apply to such sites but only if present or future groundwater (or surface water) sources of drinking water will not be adversely affected, including water for agricultural uses. For inorganic elements, the MOE Tables A and B Guideline criteria are identical. Therefore, Table A criteria will be referenced throughout this report for all sites regardless of the groundwater situation at a particular site.
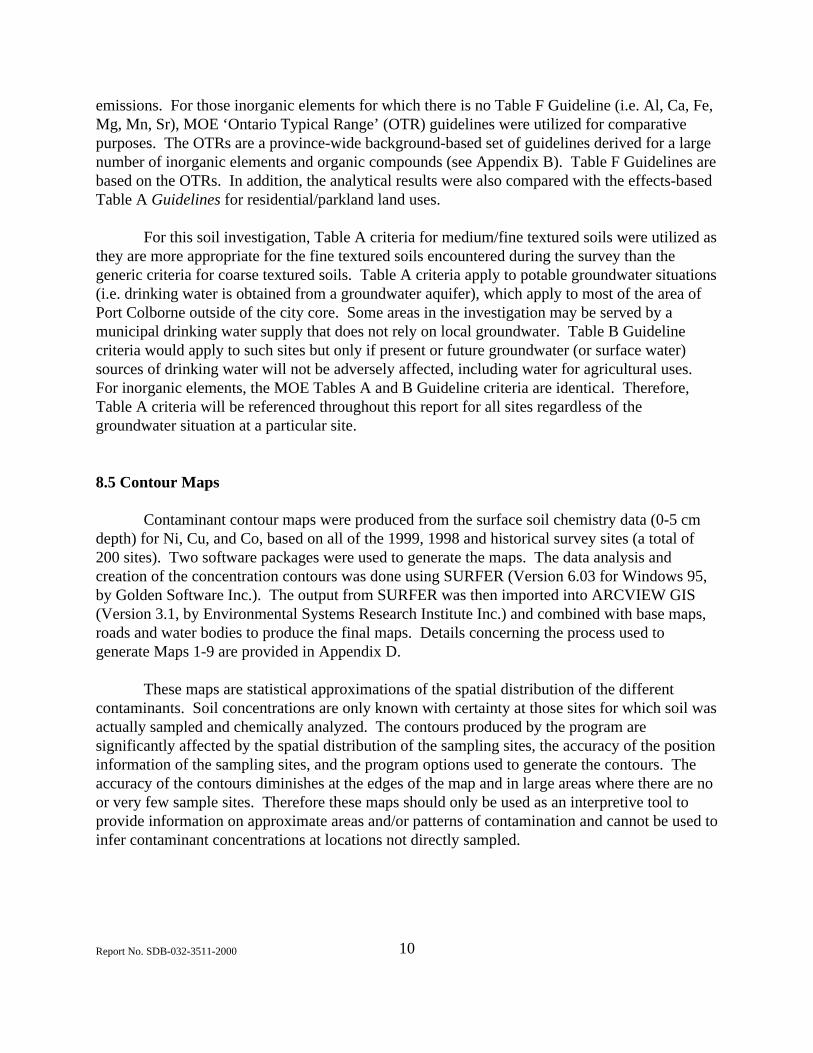
8.5 Contour Maps
Contaminant contour maps were produced from the surface soil chemistry data (0-5 cm depth) for Ni, Cu, and Co, based on all of the 1999, 1998 and historical survey sites (a total of 200 sites). Two software packages were used to generate the maps. The data analysis and creation of the concentration contours was done using SURFER (Version 6.03 for Windows 95, by Golden Software Inc.). The output from SURFER was then imported into ARCVIEW GIS (Version 3.1, by Environmental Systems Research Institute Inc.) and combined with base maps, roads and water bodies to produce the final maps. Details concerning the process used to generate Maps 1-9 are provided in Appendix D.
These maps are statistical approximations of the spatial distribution of the different contaminants. Soil concentrations are only known with certainty at those sites for which soil was actually sampled and chemically analyzed. The contours produced by the program are significantly affected by the spatial distribution of the sampling sites, the accuracy of the position information of the sampling sites, and the program options used to generate the contours. The accuracy of the contours diminishes at the edges of the map and in large areas where there are no or very few sample sites. Therefore these maps should only be used as an interpretive tool to provide information on approximate areas and/or patterns of contamination and cannot be used to infer contaminant concentrations at locations not directly sampled.
Report No. SDB-032-3511-2000 10

9.0 Results
9.1 Analytical Data
The results for chemical analysis of 18 inorganic elements in soil collected from the November 1999 survey sites in the Port Colborne area are summarized in Table 2 (Ni, Cu, Co) and Appendices A1-A15 (Al, As, Ba, Be, Ca, Cd, Cr, Fe, Mg, Mn, Mo, Pb, Sr, V, Zn. All data are the average of duplicate soil samples (0-5 cm depth) in ug/g air-dry weight. In Table 2, and in each Appendix, values shown in bold face exceed the corresponding non-agricultural Table F soil background Guideline. For those inorganic elements for which Table F criteria have not been established (e.g. Al, Ca, Fe, Mg, Mn, Sr), the rural Ontario Typical Range (OTR) value was used as an indicator of expected soil background concentration. Data in shaded cells exceed the effects-based Table A generic soil Guideline for medium/fine textured soils.
9.1.1 Soil Nickel, Copper and Cobalt
The soil Ni, Cu and Co data are summarized in Table 2. Nickel concentrations in surface soil (0-5cm) exceed the Table F Guideline for non-agricultural land use (43 ug/g), at all but five of the 64 survey sites sampled in November 1999; 23 of these sites exceeded the Table A Guideline for Ni (200 ug/g). The furthest site from the source, with Ni exceeding the Table A criterion, was located 8.3 km northeast of INCO. Copper concentrations in surface soil exceeded the Table F Guideline for non-agricultural land use (85 ug/g) at four of the 64 survey sites; surface soil concentrations of cobalt exceed the Table F Guideline for non-agricultural land use (50 ug/g) at three sites of these four sites. The sites with elevated soil Cu and Co were also the sites with the highest soil Ni concentrations (i.e. sites 183, 184, 200, and 230).
9.1.2 Other Inorganic Elements
The soil Al, As, Ba, Be, Ca, Cd, Cr, Fe, Mg, Mn, Mo, Pb, Sr, V and Zn data are summarized in Appendices A1 through A15, respectively. .The analytical results show that for each sampling site, the soil concentrations for As, Ba, Cd, Cr, Mn and Pb were all within the range expected for soil background (i.e. Table F or OTR98 values were not exceeded). Soil Be concentrations were slightly elevated above the Table F soil background concentration at two wood lot sites (refer to Appendix A4). It has been shown that certain shale deposits can contain elevated levels of Be [Ref 4]. The soils at these two sites are very likely associated with natural shale formations.
For some of the inorganic parameters, Ca, Fe, Mg, Mo and Zn, soil concentrations exceeded background-based Table F or OTR values at a some sites (refer to Appendices A5, A8, A9, A10, and A14, respectively); MOE Table A effects–based criteria for these chemical parameters were not exceeded at any of the 1999 survey sites. Based on the random distribution
Report No. SDB-032-3511-2000 11
of the various exceedances for Ca, Fe, Mg, Mo and Zn, and knowledge of the refinery process of INCO, there is little reason to suspect these elevated soil concentrations to be related to emissions from the INCO smelter.
Soil Sr (Appendix A13) concentrations exceeded the background-based OTR guideline at 28 sites across the sampling area. However, there is no consistent spatial relationship between soil Sr concentrations and proximity to INCO and it is very unlikely that Sr is associated with emissions from the smelter. The unusually high frequency of OTR exceedances for Sr suggests that soil Sr concentrations in the Port Colborne area are naturally higher than the normal range for background in soil in the rest of the province.
10.0 Discussion
Like the 1998 survey results [Ref.1], the analytical results from the 64 new sites sampled in November 1999, show considerable variability in soil Ni concentrations vs. distance from the refinery. Soil Ni concentrations at some sites are relatively low compared to other sites located at similar or greater distances from INCO (refer to Table 3). This trend is also evident for both Cu and Co. This can be explained by the fact that this investigation extends across a large urban and rural area that has been impacted by INCO refinery emissions over a long period, followed by 16 years during which time the stack has not operated and any impacts would be attributed to marginal fugitive emissions only.
Sample sites were chosen that appeared to the investigators to be undisturbed or were selected based on information provided by property owners confirming the undisturbed status of the site. However, site disturbance is often not evident, or property owners may not have knowledge of changes to the property that occurred before their tenure. Landscaping activities such as the addition of topsoil or sod, places clean soil overtop of metal contaminated soil. As the sampling procedure at each of the 1999 survey sites consisted of only surface soil sampling (0 to 5 cm depth), the resultant sample would contain low metal concentrations, and therefore, the contamination at these sites is underestimated.
In the 1998 survey report, background soil Ni concentrations were not achieved in a northeast direction, the direction of the prevailing winds, even at a distance of 13 km. The 1998 survey sites farthest downwind from INCO (Sites 68, 69 and 87) had surface soil Ni concentrations that exceeded the Table F value for soil Ni (43 ug/g). The sampling strategy in the 1998 survey was not adequate to determine the total extent of soil Ni contamination in the region to the northeast of Port Colborne; i.e. the northeast contour boundary for soil Ni (43-100 ug/g) was an estimate generated by the computer mapping program. However, the area that exceeds the Table F soil background concentration for Ni, may extend much further in the directions of the municipalities of Niagara Falls and Fort Erie.
Report No. SDB-032-3511-2000 12

Likewise, in the 1998 soil investigation it became apparent that soil Ni concentrations likely exceeded the Table A criterion over a larger area than was represented by the 200-500 ug/g contour. The 200-500 ug/g contour interval is significant because it corresponds to the effectsbased Table A Guideline soil Ni criterion (200 ug/g). The report concluded that additional sampling was warranted between Sites 12 and 50, and Sites 62 and 63, to more accurately define the extent of the area in which soil Ni might exceed the Table A criterion.
Contaminant contour maps were produced from the surface soil chemistry data (0 to 5cm depth) for Ni, Cu and Co, using Surfer/ArcView (Maps 4,5 and 6). These maps were based on the combined data from 1999 and 1998 survey sites, and the additional historical survey sites located in and around the cities of Welland, Niagara Falls and Fort Erie (for a total of 200 sites). With a greater number of sites, the computer was able to better define the true extent of the Ni, Cu and Co contamination that have resulted from over sixty years of INCO stack emissions. Note: For comparison purposes, Map 4 also provides an outline of the 1998 contours for the Table F and Table A soil Ni guideline criteria (dotted lines), which were based on the 1998 sampling data alone.
The addition of data from both the 1999 survey sites and historical survey sites changed the shape and size of all contour intervals for soil Ni, Cu and Co that were based on the more limited 1998 sampling data (refer to Maps, 4,5 and 6). Changes to the Cu and Co contour intervals were minor, because the deposition of the these metals was confined to a much smaller area that was adequately represented by 1998 survey site data. In contrast, soil Ni contour intervals were modified significantly in the regions both to the west and northeast of Port Colborne. To the west of INCO the 100- 200 ug/g soil Ni contour interval is reduced significantly in area compared to that generated from the 1998 survey data. To the northeast of INCO, both the 43-100 ug/g and 200-500 ug/g Ni contour intervals changed markedly in shape and size compared to the contour intervals that were based on the more limited 198 sampling data only (represented in Map 4 by dotted and dashed lines, respectively).
At present, soil Ni concentrations are shown to exceed the Ontario soil background concentration (Table F value of 43 ug/g) as far west as Wainfleet marsh. In a northerly direction, soil Ni concentrations exceed the Table F criterion as far north as Biggar Rd. (Hwy 47). In an northeasterly direction, the Table F value is exceeded beyond the Queen Elizabeth Way (just south of Niagara Falls), and to the east as far as the Niagara River near the towns of Black Creek and Douglastown, including the north end of the city of Ft. Erie. It is apparent that the estimated area that has been impacted (i.e. surface soil Ni concentrations exceed the soil background criterion of 43 ug/g) is significantly greater than was originally estimated from data compiled during the 1998 soil investigation.
With the inclusion of the data from the additional 1999 sampling sites, the 200-500 ug/g soil Ni contour interval determined by Surfer/ArcView was modified from that based on the 1998 data only. At present, soil Ni concentrations that exceed the Table A soil Ni criterion (200 ug/g) do not extend as far to the west as was previously predicted from the 1998 survey results.
Report No. SDB-032-3511-2000 13

Also, the apparent gap in the 200-500 ug/g contour interval which was located to the east of the city of Port Colborne (i.e. between Sites 12 and 50, and the island contour around Sites 62 and 63) is now included within the 200-500 ug/g contour interval based on 1999 and 1998 data combined. Soil Ni concentrations now appear to exceed the Table A criterion as far east as Whites Rd. and extends to the northeast as far as the intersection of Chippawa Rd. and Carl Rd., a distance of over 5 km from the INCO site.
Two new contour islands have appeared for the 200-500 ug/g contour interval, both to the north and northeast of the city of Port Colborne. Again, as was the case in the 1998 survey, additional sampling could be conducted at sites that lie between these contour islands and the sites on which the main 200-500 ug/g contour interval was generated by the computer mapping program to better define whether or not these contour islands should be contained within one 200-500 ug/g contour interval around the INCO stack. It should also be noted that the generation of a 100-200 ug/g soil Ni contour island in the east end of the city of Welland may in fact be the result of a local source of Ni emissions, unrelated to INCO in Port Colborne (refer to Map 4).
10.1 Total Areas Estimated to Exceed Table F/Table A Guidelines for Ni, Cu, and Co.
Three additional maps were produced for Ni, Cu and Co to display the two contour polygons that correspond to a) the Ontario soil background (Table F) value, and b) the MOE generic soil remediation (Table A) criterion based on the 1999, 1998 and historical survey data (refer to Maps, 7, 8 and 9). These polygons are statistical approximations only; soil concentrations are known with certainty only at those sites for which soil was actually sampled.
The surface areas represented by the Table A and F polygons for Ni, Cu, and Co were calculated using a feature in ArcView. These calculated areas were converted to square kilometers. The calculated areas are provided in the legends of each of Maps 7, 8 and 9. In each map, the area designated as exceeding Table F only includes the polygon where the Table F value is exceeded but does not include the area of the polygon that corresponds to the Table A guideline criterion. The total area exceeding Table F is obtained by summing the two areas calculated for the Table A polygon and the Table F polygon.
In Map 7, the polygon in mustard yellow (dark shade) represents the total area in which soil Ni concentrations in surface soil (0-5cm) has been estimated to exceed the Table A soil remediation using the Surfer/ArcView contour mapping program and the data from 1999, 1998 and historical surveys. Map 7 also shows the 1998 contour (dotted line) for the Table A soil Ni guideline based on 1998 sampling data only. The area of impact is approximately 3 km long going in an northeasterly direction from the INCO site to the Chippawa Rd./Carl Rd. intersection and as far east as Whites Rd. The impacted area is estimated to exceed the Table A soil Ni criterion is approximately 29 km2.
Report No. SDB-032-3511-2000 14

The total area that exceeds the soil Ni Table F soil background criterion goes beyond the scale of Map 7. It is estimated to be 345 km2 in area (based on addition of the Table A and F polygons) and, as previously stated, extends north into Welland, northeast to the Niagara River, as far as Grand Island N.Y., and east into the north end of Ft. Erie.
In Map 8, the polygons in dark green represent the total area in which surface soil Cu is estimated to exceed the Table A soil remediation criterion for Cu (300 ug/g). The three polygons represent less area (0.2 km2 than was estimated using 1998 survey data only (0.3 km2). One polygon is centered on the intersection of Davis St. and Kinnear St., a second is located north of Killaly St., east of Elizabeth St. and a third is further east and centred on Killaly St. between Snider Rd. and Lorraine Rd. The area estimated to exceed the Table F soil background value for Cu (85 ug/g) is 7.9 km2 and is represented in pale green (light shade). The polygon extends from the Welland canal in the west, northward to Main St. East and past Lorraine Rd. to the east.
Map 9 illustrates the total areas estimated to exceed the Table A (50 ug/g) and Table F (21 ug/g) soil criteria for Co. The three polygons (in bright yellow) represent the area estimated to exceed the Table A soil Co criterion (0.8 km2). Although larger in size, each Co polygon coincides with the polygons representing soil Cu concentrations that exceed the Table A Cu criterion. The four Co polygons represent an area (0.8 km2) which is approximately half of the area estimated from 1998 survey data only (1.6 km2).
The computer estimates of the areas that exceed MOE Table F and Table A soil criteria for Ni, Cu and Co are summarized in Table 4. These area estimates are derived using data from 1999, 1998 survey sites, as well as selected historical survey sites. For comparison purposes, the area estimates which were based on 1998 survey results are included.
10.2 Phytotoxicity
The MOE Table A Criteria for Ni, Cu and Co is based on phytotoxicity, as these metals are each potentially toxic to vegetation at soil concentrations much lower than those that can cause health effect, with Ni being the most toxic of the three. The mechanism for Ni phytotoxicity is not known precisely, but excessive Ni is believed to induce Fe deficiency in plants. The MOE soil nickel Table A Guideline was set at 200 ug/g for medium/fine textured soil as are found in the Port Colborne region. This criterion is based on lowest observable effects levels. Soil Ni concentrations in excess of 200 ug/g have the potential to cause injury to sensitive plant species (i.e. either in the form of reduced growth, reduced yield or foliar injury). Cereal grains such as oats, barley and ryegrass are amongst the most sensitive plants to nickel; deciduous plants and garden crops are more variable, ranging from moderately sensitive to moderately tolerant. The potential for soil contaminated with Ni, as well as Cu and Co, to cause adverse effects to vegetation is dependent on the physical and chemical characteristics of the soil and form of metal present in the soil. The areas in and around Port Colborne, which have been determined to have soil Ni concentrations above the Table A soil Ni criterion contain clay soils
Report No. SDB-032-3511-2000 15
with neutral soil pH. Generally Ni (as well as Cu and Co) is more available for plant uptake in more acidic soil (lower pH), sandy in nature and having a lower cation exchange capacity and little organic content. The Ni in the impacted soils is not likely to be very bioavailable because of the soil characteristics in the region. Also, soil Ni readily complexes with other elements in the soil, such as sulphur (S), iron (Fe), manganese Mn), and calcium (Ca) that will further reduce Ni availability for plant uptake.
10.3 Human Health Risks
The 1999 Phytotoxicology study better defined the areas impacted by soil Ni, Cu and Co above the Table A “effects-based” criteria. The MOE site-specific risk assessment [Ref. 5] that was done for the Port Colborne area considered all potential exposure pathways (e.g. ingestion of soil, water, garden produce; inhalation; and dermal contact with soil). The MOE risk assessment report concluded there are no adverse health effects anticipated from expose to the soil Ni, Cu and Co levels in the city of Port Colborne or the surrounding region. Also, a review of population health data did not indicate any adverse health effects were evident which may have resulted from environmental exposures to these metals in the soil.
11.0 Conclusions
Inclusion of the additional sampling data provided from the 1999 sampling stations and historical survey results, along with the 1998 survey data, produced modifications to the shape and size of the 43-100 ug/g soil Ni, 100-200 ug/g soil Ni and 200-500 ug/g soil Ni contour intervals, respectively in the computer generated maps for Port Colborne and the surrounding region. The MOE Table F soil background value for Ni is exceeded beyond a distance of 28 km northeast of INCO and over a area of 345 km2. The Cu and Co Table F soil values are exceeded in surface soil beyond a 3 km distance in the same direction, and over areas of 7.9 and 7.2 km2 , respectively. Soil Ni concentrations are shown to exceed the MOE Table A soil remediation criterion for up to 3 km northeast of INCO and is estimated to cover an area of almost 29 km2. Table A Cu and Co criteria are exceeded over areas of 0.2 and 0.8 km2, respectively. As previously mentioned, soil concentrations of Ni, Cu and Co which exceed their corresponding Table A criterion are potentially phytotoxic. The substantial increase in sample sites (a total of 200 sites) has provided a more precise estimate of the area in and around the city of Port Colborne that has been impacted by over sixty-six years of INCO emissions and atmospheric deposition.
The soil metal contamination in Port Colborne is not a threat to human health but can be potentially phytotoxic with Ni being the most toxic. Agricultural liming and fertilizer amendments should allow for remediation of the areas above the Table A ‘effects-based’ criteria with marginal disturbance to the impacted properties. The amount of lime and application rate will depend on the contaminant concentration, the soil physical and chemical characteristics of
Report No. SDB-032-3511-2000 16
the soils to be remediated. At sites where the soil Ni, Cu and Co contamination only marginally exceeds Table A criteria, and the contamination is concentrated in the surface soil, deep cultivation may lower metal concentrations in the rooting zone of plants sufficiently that soil is no longer potentially phytotoxic.
Report No. SDB-032-3511-2000 17

12.0 References
1. Ontario Ministry of the Environment. Sept 1999. Phytotoxicology Soil Investigation: INCO - Port Colborne (1998). Report No. SDB-031-3511-1999.
2. Ontario Ministry of the Environment. 1993. Phytotoxicology Investigation Manual: Part 1. Methodology for Phytotoxicology Investigators. Report No. 015-3512-93.
3. Ontario Ministry of the Environment. 1994. Procedures Manual for Vegetation and Soils Processing Laboratory. Phytotoxicology Section, Air Resources Branch, April 1994.
4. Ontario Ministry of the Environment. 1997. Investigation into the Chemical Composition of Shales in Ontario 1997 Report No. SDB-023-3511-1998.
5. Ontario Ministry of the Environment. 1997. Technical Report: Assessment of Potential Health Risks of Reported Soil Levels of Nickel, Copper, and Cobalt in Port Colborne and Vicinity, May 1997.
Report No. SDB-032-3511-2000 18

Table 1: Station Identification, Location, Description - 1999 INCO Pt. Colborne Soil Survey (Sample depth 0-5 cm)
Station No.
UTM Easting
UTM Northing
Distance from Stack
(km)
Direction (degrees)
Station Description
170 640115 4748108 3,621 260 Right-of-way on north side of Lakeshore Rd. W (west of Cement Rd.)
171 640422 4748590 3,260 267 Right-of-way on west side of Cement Rd. (500 m north of Lakeshore Rd)
172 640784 4747668 3,091 249 Vacant lot on south side of Orchard Dr. (west of Cedar Dr.)
173 641168 4748461 2,527 263 Residential property at bottom end of Hampton Rd (at turn)
174 641368 4748814 2,311 271 Front yard of residence at Sugarloaf and Laketown Dr.
175 641818 4749022 1,879 278 Side yard of residence on northeast corner of Ash and Clarke
176 642307 4748844 1,374 274 H.H. Knoll Lakeview Park (Steele and Sugarloaf)
177 642860 4748740 818 269 City of Pt. Colborne Operations and Communications Services Div. site
178 640774 4749253 2,946 280 Wooded lot at southeast corner of Clarence Rd. and Westwood Dr.
179 641107 4749341 2,637 283 Side yard of residence on southwest corner of Clarence and Hampton Rd.
180 642063 4749368 1,727 291 Front lawn of Pt. Colborne Public School
181 642276 4749300 1,504 291 Boulevard in front of residence on south side of Charlott St. west of Fieldon
182 643322 4750037 1,331 344 Lawn in front of transformer station on northwest corner Janet and Killaly.
183 644182 4749948 1,295 23 Boulevard of residence on north side of Cross St. east of Elizabeh St.
184 644932 4749524 1,471 58 Right of way on Snyder Rd. south of Killaly Rd. (near RR)
185 647468 4747728 3,927 105 East side of Miller Rd. allowance (north of Pine Crest Lane)
186 647538 4745452 5,080 131 Clay road 550 m North of Pinecrest Lane W. (south of Killaly St. E)
187 643385 4750557 1,826 351 Side yard of residence on northwest corner of Crescent and Clarke
188 644125 4750550 1,850 14 Woodlot on east side of Elizabeth St. (500 m south of Hwy 3)
189 643669 4751026 2,271 360 Front yard of residence on east side of Wellington St. opposite Chestnut
190 644957 4751158 2,722 28 Boulevard of residence on north side of Hwy 3 east of Snyder Rd.
191 645776 4751210 3,229 41 Front yard of residence on west side of Babion Rd., north of Hwy 3
192 646580 4751210 3,801 50 Roadside of Carl Rd. approx. 300m North of Hwy 3 (at field entrance).
193 647421 4751264 4,506 56 Along fenceline, east side of Miller Rd., just south of Killaly Rd.
Report No. SDB-032-3511-2000 19

Station No.
UTM Easting
UTM Northing
Distance from Stack
(km)
Direction (degrees)
Station Description
194 648267 4750989 5,104 64 East side of White Rd., 1.2 km south of 2nd Concession line.
195 649099 4751030 5,879 67 West side of right of way on Sherk Rd, 1.1 km S of 2 nd Concession Rd.
196 655615 4748457 11,941 91 West side of Pt. Albino Rd. at Mitchener Rd. (in front of cottonwoods)
197 642980 4752181 3,496 348 Boulevard of residence at end of Barrick Rd (just west of RR tracks)
198 643524 4752092 3,341 357 Right-of-way on east side of Barber Rd., south of the 2nd
Concession Rd.
199 644916 4752198 3,659 20 Right-of-way on west side of Snyder Rd at intersection with 2ndConcession
200 646592 4752138 4,465 41 Woods on southwest corner of Carl Rd. and 2nd Concession Rd.
201 647416 4752165 5,060 48 SW corner of 2nd Concession and Miller Rd. (triangle between rd and field).
202 641586 4753315 5,017 335 Industrial park lawn at southwest corner of Stonebridge Rd. and Hwy 58
203 642329 4753133 4,581 343 Front lawn of Pt. Colborne Animal Control Centre (Elm and Stoneridge Rd)
204 642342 4754621 6,016 347 Side yard of residence on east side of Elm St. (½ km south of Mud Lake)
205 642866 4753686 4,997 351 Right-of-way on Invertose Dr., 50 m west of turning circle (near CASCO)
206 643306 4754390 5,647 356 Park area along Kingway , east side of canal, south of the bridge.
207 643612 4752682 3,928 359 Right-of-way at end of Barber Rd. by canal north of the Can. Seaway Corp.
208 644923 4752837 4,268 17 Right of way on west side of Snyder Rd. north of Chippawa Rd. (clay road)
209 645790 4753034 4,772 26 Right of way on west side of Babion Rd., north of the 2nd
Concession Rd.
210 646575 4753128 5,246 34 West side of Carl St., 1.1 km south of 3rd Concession Rd.
211 647393 4753457 5,992 38 Right of way on east side of Miller Rd., 1.2 km N of 2nd
concessioni
212 648232 4753115 6,305 46 West side of White Rd, 1.1 km south of 3rd Concession Rd.
213 649927 4752940 7,521 56 Open wooded area, east side of Brookfield Rd., 1.3 km S of 3rd
Concession
214 652373 4754345 10,337 57 West side of Wilheim Rd, just south of 3rd Concession road allowance.
215 650751 4754373 9,033 52 NE corner of Concession 3 and Troup Rd.
216 649884 4754323 8,338 48 NE corner of Brookfield and 3rd Concession
Report No. SDB-032-3511-2000 20

Station No.
UTM Easting
UTM Northing
Distance from Stack
(km)
Direction (degrees)
Station Description
217 644929 4754808 6,181 12 Backyard of residence at north end of Synder Rd. (north of Concession 3)
218 643278 4755841 7,097 357 Front yard of residence on NE corner of Crescent Dr. and Glenwood Pkwy.
219 645764 4760375 11,806 10 North side of Buchner Rd, 100m east of dead end (east of field entrance).
220 648858 4760481 12,819 24 South side of Buchner Rd., edge of woodlot east of Pearson Rd.
221 652183 4760617 14,596 36 West side of Meisener Rd., north edge of hardwood stand
222 654268 4759864 15,348 44 East end of Snyder Rd. (in a wooded area)
223 656157 4758353 15,743 52 Wooded area in ortheast corner of Lapp Rd and Netherby Rd.
224 658435 4760490 18,854 52 Open woods northeast corner of Morningstar Rd. and Sodom Rd.
225 656565 4755253 14,433 63 West side of House Rd., 3/4 way to next road south of Church St.
226 658650 4754988 16,218 67 Right-of-way on south side of Bowen Rd. just west of Hwy 116
227 656755 4752472 13,595 74 Hedgerow on south side of unopened Bertie Rd. (30 m east of House Rd)
228 648542 4750653 5,221 69 Elm tree grove on north side of Nigh Rd (west of pumping station).
229 645818 4750197 2,580 56 Side yard of resideon northeast corner of Lorraine Rd. and Killaly Rd.
230 647386 4749951 3,896 72 East side of Miller Rd. approx. 100m south of Killaly Rd.
231 649067 4750244 5,591 75 Front lawn of Gasline School, SW corner of Hwy 3 and Sherk Rd.
232 646656 4748004 3,071 104 West side of small concrete bridge near south end of Weaver Rd.
233 642353 4752787 4,244 342 Right of way on west side of Elm St. south of Stonebridge Rd.
Report No. SDB-032-3511-2000 21

Table 2: Additional Historical Stations used in preparation of Ni, Cu and Co Contour Maps (Sample depth 0-5 cm)
Station No.
UTM Easting
UTM Northing
Distance from Stack (km)
Direction (degrees)
Station Description Soil Ni (ug/g)
Soil Cu (ug/g)
Soil Co (ug/g)
H1 659956 4751715 16,545 80 OTR 48 25 6.1
H2 656369 4770615 25,277 30 OTR 20 24 5.9
H3 642559 4760975 12,271 355 OTR 30 33 9.8
H4 643222 4778325 29,574 359 OTR 25 25 17
H5 641919 4761964 13,326 352 OTR 34 17 7.7
H6 644193 4761140 12,396 2 OTR 47 18 7.4
H7 642519 4761104 12,403 355 OTR 47 27 9.9
H8 641700 4758694 10,134 349 OTR 46 28 9.3
H9 654570 4772612 26,226 25 OTR 16 18 4.8
H10 654488 4772045 25,676 25 OTR 21 20 5.8
H11 652254 4771419 24,232 21 OTR 15 27 5.3
H12 653612 4770144 23,583 25 OTR 14 12 6.3
H13 654088 4772045 25,511 24 OTR 10 13 3.3
H14 652030 4772049 24,746 20 OTR 13 14 4.4
H15 642931 4761251 12,518 357 OTR 53 58 8.6
H16 642213 4762221 13,545 354 OTR 27 20 7.6
H17 642133 4764375 15,696 354 OTR 16 10 3.7
H18 641496 4763323 14,731 351 OTR 18 13 5.7
Report No. SDB-032-3511-2000 22
Station No.
UTM Easting
UTM Northing
Distance from Stack (km)
Direction (degrees)
Station Description Soil Ni (ug/g)
Soil Cu (ug/g)
Soil Co (ug/g)
H19 642759 4760508 11,789 356 OTR 29 39 5.4
H20 642193 4764227 15,543 355 OTR 13 11 3.8
H21 643860 4762695 13,941 1 Atlas Steel 97 15 25
H22 643835 4762645 13,891 1 Atlas Steel 115 10 25
H23 643810 4763350 14,596 1 Altas Steel 57 11 24
H24 644330 4763760 15,019 2 Atlas Steel 48 16 21
H25 644345 4762650 13,911 3 Atlas Steel 225 9 48
H26 643960 4761910 13,158 1 Atlas Steel 135 11 33
H27 643071 4763090 14,348 358 Atlas Steel 38 7 19
H28 644130 4759740 10,994 2 Atlas Steel 42 10 21
H29 650517 4767815 20,250 20 Cyanamid 23 5 22
H30 651717 4769115 21,890 22 Cyanamid 25 20 5
H31 649017 4767115 19,121 16 Cyanamid 24 13 8
H32 648017 4765715 17,506 14 Cyanamid 39 22 8.5
H33 658280 4763980 21,095 44 Metcorp 36 27 9.1
H34 643519 4749200 473 340 K. Dube property 4100 290 95
H35 643489 4749200 483 337 K. Dube property 8000 500 130
H36 645534 4750439 2,506 48 R. Kramer property 7500 860 120
H37 645569 4750439 2,532 48 R. Kramer property 1100 27 130
H38 645570 4750472 2,555 48 R. Kramer property 2000 220 41
H39 645989 4750395 2,834 55 T. Kramer property 450 61 18
Report No. SDB-032-3511-2000 23

Station No.
UTM Easting
UTM Northing
Distance from Stack (km)
Direction (degrees)
Station Description Soil Ni (ug/g)
Soil Cu (ug/g)
Soil Co (ug/g)
H40 645989 4750436 2,858 54 T. Kramer property 340 53 17
H41 643537 4762125 13,371 359 Gencorp (Atlas) 260 50 20
H42 643427 4762075 13,322 359 Gencorp (Atlas) 40 13 5
H43 643317 4762015 13,265 358 Gencorp (Atlas) 89 25 10
H44 643217 4761945 13,198 358 Gencorp (Atlas) 83 43 11
H45 643807 4762525 13,771 1 Gencorp (Atlas) 78 33 9
H46 643617 4762525 13,770 360 Gencorp (Atlas) 75 31 13
H47 643757 4761835 13,080 0 Gencorp (Atlas) 260 64 14
H48 643757 4761655 12,900 0 Gencorp (Atlas) 59 38 14
Report No. SDB-032-3511-2000 24

Table 3: Concentrations of nickel, copper and cobalt in soil (0-5 cm depth) collected in the Port Colborne area (November, 1999) (ug/g)
Station No. Land Use Distance1 Direction2 NIckel3 Copper4 Cobalt5
170 right-of-way 3621 260 185 21 6 171 right-of-way 3260 267 115 36 8 172 vacant lot 3091 249 110 20 5 173 vacant lot 2527 263 43 11 5 174 residential 2311 271 91 26 8 175 residential 1879 278 103 26 9 176 park 1374 274 20 42 5 177 lawn 818 269 430 69 14 178 woodlot 2946 280 145 31 12 179 residential 2637 283 83 19 7 180 school yard 1727 291 70 21 10 181 boulevard 1504 291 92 25 7 182 lawn 1331 344 350 63 16 183 boulevard 1295 23 1050 135 30 184 right-of-way 1471 58 1250 170 33 185 woodlot 3927 105 120 19 5 186 woodlot 5080 131 320 63 11 187 residential 1826 351 370 55 17 188 woodlot 1850 14 550 81 21 189 residential 2271 360 180 42 13 190 boulevard 2722 28 490 70 18 191 residential 3229 41 285 48 14 192 field 3801 50 430 57 14 193 field 4506 56 265 44 10 194 woodlot 5104 64 535 66 17 195 woodlot 5879 67 195 32 16 196 woodlot 11941 91 43 27 7 197 boulevard 3496 348 290 49 11 198 right-of-way 3341 357 145 58 8 199 right-of-way 3659 20 180 39 10 200 woodlot 4465 41 525 89 17 201 lawn 5060 48 305 50 14 202 lawn 5017 335 105 27 9 203 lawn 4581 343 71 28 8 204 residential 6016 347 91 42 10 205 right-of-way 4997 351 65 18 8 206 park 5647 356 185 40 13 207 boulevard 3928 359 255 64 12 208 right-of-way 4268 17 130 30 18 209 right-of-way 4772 26 165 33 15 210 field 5246 34 340 48 11 211 field 5992 38 160 42 8 212 field 6305 46 215 41 16 213 woodlot 7521 56 330 52 14 214 woodlot 10337 57 170 42 13 215 woodlot 9033 52 81 29 14 216 field 8338 48 225 49 11
217 residential 6181 12 95 32 15
218 residential 7097 357 72 27 8 219 field 11806 10 60 32 12 220 woodlot 12819 24 75 20 14
Report No. SDB-032-3511-2000 25

Station No. Land Use Distance1 Direction2 NIckel3 Copper4 Cobalt5
221 woodlot 14596 36 102 18 6 222 woodlot 15348 44 93 41 12 223 woodlot 15743 52 71 25 18 224 woodlot 18854 52 78 22 12 225 woodlot 14433 63 85 24 14 226 field 16218 67 60 25 18 227 woodlot 13595 74 40 18 12 228 lawn 5221 69 43 15 13 229 residential 2580 56 515 83 19 230 woodlot 3896 72 735 105 24 231 school yard 5591 75 71 29 8 232 woodlot 3071 104 108 31 9
233 right-of-way 4244 342 390 67 16
1 - Distance (metres) from INCO stack 2 - Direction (degrees) from INCO stack 3 - Exceedences of background-based Table F for nickel (43 µg/g) are bolded, exceedences of effects-based
Table A (200 µg/g) are shaded 4 - Exceedences of background-based Table F for copper (85 µg/g) are bolded, exceedences of effects-based
Table A (300 µg/g) are shaded 5 - Exceedences of background-based Table F for cobalt (21 µg/g) are bolded, exceedences of effects-based
Table A (50 µg/g) are shade
Table 4: Estimate of Areas that Exceed the MOE Table F and Table A Soil Criteria as determined by Surfer/ArcView (1999 vs. 1998 data)
Port Colborne Region Soil Nickel Soil Copper Soil Cobalt
Surveys 1999 1998 1999 1998 1999 1998
Area where 0-5 cm soil concentrations exceed Table F criterion.
345 km2 >159 km2 7.9 km2 8.9 km2 7.2 km2 6.1 km2
Area in which 0-5 cm soil concentrations exceed Table A criterion.
28.6 km2 19 km2 0.2 km2 0.3 km2 0.8 km2 1.6 km2
Report No. SDB-032-3511-2000 26
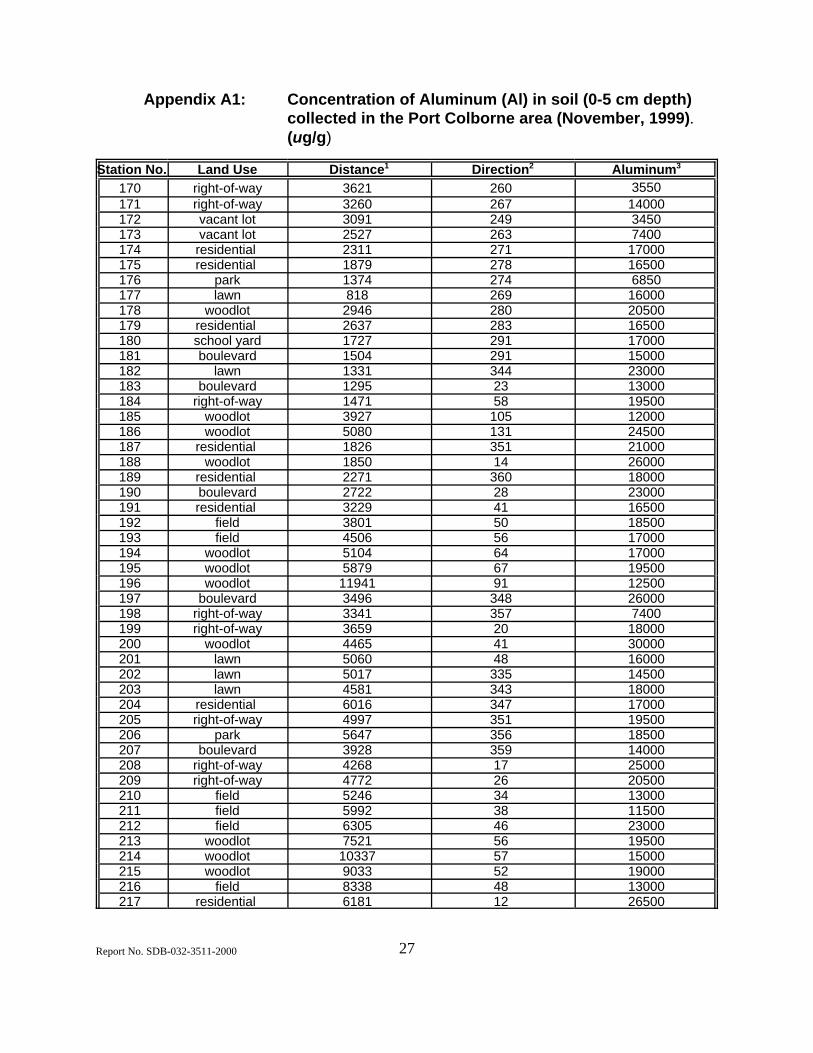
Appendix A1: Concentration of Aluminum (Al) in soil (0-5 cm depth) collected in the Port Colborne area (November, 1999). (ug/g)
Station No. Land Use Distance1 Direction2 Aluminum3
170 right-of-way 3621 260 3550 171 right-of-way 3260 267 14000 172 vacant lot 3091 249 3450 173 vacant lot 2527 263 7400 174 residential 2311 271 17000 175 residential 1879 278 16500 176 park 1374 274 6850 177 lawn 818 269 16000 178 woodlot 2946 280 20500 179 residential 2637 283 16500 180 school yard 1727 291 17000 181 boulevard 1504 291 15000 182 lawn 1331 344 23000 183 boulevard 1295 23 13000 184 right-of-way 1471 58 19500 185 woodlot 3927 105 12000 186 woodlot 5080 131 24500 187 residential 1826 351 21000 188 woodlot 1850 14 26000 189 residential 2271 360 18000 190 boulevard 2722 28 23000 191 residential 3229 41 16500 192 field 3801 50 18500 193 field 4506 56 17000 194 woodlot 5104 64 17000 195 woodlot 5879 67 19500 196 woodlot 11941 91 12500 197 boulevard 3496 348 26000 198 right-of-way 3341 357 7400 199 right-of-way 3659 20 18000 200 woodlot 4465 41 30000 201 lawn 5060 48 16000 202 lawn 5017 335 14500 203 lawn 4581 343 18000 204 residential 6016 347 17000 205 right-of-way 4997 351 19500 206 park 5647 356 18500 207 boulevard 3928 359 14000 208 right-of-way 4268 17 25000 209 right-of-way 4772 26 20500 210 field 5246 34 13000 211 field 5992 38 11500 212 field 6305 46 23000 213 woodlot 7521 56 19500 214 woodlot 10337 57 15000 215 woodlot 9033 52 19000 216 field 8338 48 13000 217 residential 6181 12 26500
Report No. SDB-032-3511-2000 27

Station No. Land Use Distance1 Direction2 Aluminum3
218 residential 7097 357 19000 219 field 11806 10 17000 220 woodlot 12819 24 22500 221 woodlot 14596 36 21000 222 woodlot 15348 44 26000 223 woodlot 15743 52 22500 224 woodlot 18854 52 22000 225 woodlot 14433 63 21500 226 field 16218 67 24500 227 woodlot 13595 74 20000 228 lawn 5221 69 19000 229 residential 2580 56 16500 230 woodlot 3896 72 27500 231 school yard 5591 75 14500 232 woodlot 3071 104 12000 233 right-of-way 4244 342 19500
1 - Distance (metres) from INCO stack2 - Direction (degrees) from INCO stack3 - Excedences of OTR98 for aluminum (30,000 ug/g) are shaded.
Report No. SDB-032-3511-2000 28
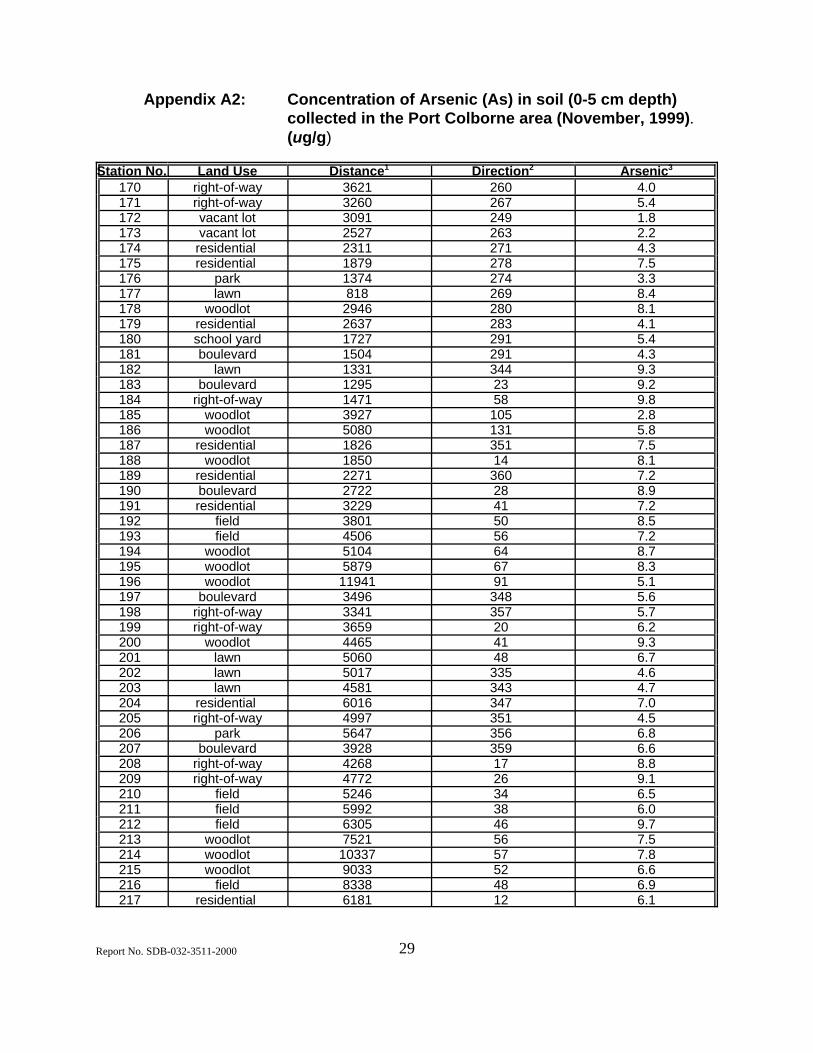
Appendix A2: Concentration of Arsenic (As) in soil (0-5 cm depth) collected in the Port Colborne area (November, 1999). (ug/g)
Station No. Land Use Distance1 Direction2 Arsenic3
170 right-of-way 3621 260 4.0 171 right-of-way 3260 267 5.4 172 vacant lot 3091 249 1.8 173 vacant lot 2527 263 2.2 174 residential 2311 271 4.3 175 residential 1879 278 7.5 176 park 1374 274 3.3 177 lawn 818 269 8.4 178 woodlot 2946 280 8.1 179 residential 2637 283 4.1 180 school yard 1727 291 5.4 181 boulevard 1504 291 4.3 182 lawn 1331 344 9.3 183 boulevard 1295 23 9.2 184 right-of-way 1471 58 9.8 185 woodlot 3927 105 2.8 186 woodlot 5080 131 5.8 187 residential 1826 351 7.5 188 woodlot 1850 14 8.1 189 residential 2271 360 7.2 190 boulevard 2722 28 8.9 191 residential 3229 41 7.2 192 field 3801 50 8.5 193 field 4506 56 7.2 194 woodlot 5104 64 8.7 195 woodlot 5879 67 8.3 196 woodlot 11941 91 5.1 197 boulevard 3496 348 5.6 198 right-of-way 3341 357 5.7 199 right-of-way 3659 20 6.2 200 woodlot 4465 41 9.3 201 lawn 5060 48 6.7 202 lawn 5017 335 4.6 203 lawn 4581 343 4.7 204 residential 6016 347 7.0 205 right-of-way 4997 351 4.5 206 park 5647 356 6.8 207 boulevard 3928 359 6.6 208 right-of-way 4268 17 8.8 209 right-of-way 4772 26 9.1 210 field 5246 34 6.5 211 field 5992 38 6.0 212 field 6305 46 9.7 213 woodlot 7521 56 7.5 214 woodlot 10337 57 7.8 215 woodlot 9033 52 6.6 216 field 8338 48 6.9 217 residential 6181 12 6.1
Report No. SDB-032-3511-2000 29
Station No. Land Use Distance1 Direction2 Arsenic3
218 residential 7097 357 4.9 219 field 11806 10 9.6 220 woodlot 12819 24 11.0 221 woodlot 14596 36 6.6 222 woodlot 15348 44 7.6 223 woodlot 15743 52 9.7 224 woodlot 18854 52 9.8 225 woodlot 14433 63 9.6 226 field 16218 67 8.6 227 woodlot 13595 74 6.7 228 lawn 5221 69 8.0 229 residential 2580 56 8.4 230 woodlot 3896 72 14 231 school yard 5591 75 5.8 232 woodlot 3071 104 5.5 233 right-of-way 4244 342 7.8
1 - Distance (metres) from INCO stack2 - Direction (degrees) from INCO stack3 - Exceedences of background-based Table F for arsenic (17 µg/g) are bolded, excedences of effects-based Table A(25 µg/g) are shaded.
Report No. SDB-032-3511-2000 30

Appendix A3: Concentration of Barium (Ba) in soil (0-5 cm depth) collected in the Port Colborne area (November, 1999). (ug/g)
Station No. Land Use Distance1 Direction2 Barium3
170 right-of-way 3621 260 24.5 171 right-of-way 3260 267 85 172 vacant lot 3091 249 30 173 vacant lot 2527 263 35.5 174 residential 2311 271 92.5 175 residential 1879 278 93 176 park 1374 274 87.5 177 lawn 818 269 105 178 woodlot 2946 280 115 179 residential 2637 283 81 180 school yard 1727 291 88.5 181 boulevard 1504 291 71 182 lawn 1331 344 130 183 boulevard 1295 23 99 184 right-of-way 1471 58 125 185 woodlot 3927 105 45.5 186 woodlot 5080 131 155 187 residential 1826 351 110 188 woodlot 1850 14 150 189 residential 2271 360 110 190 boulevard 2722 28 130 191 residential 3229 41 100 192 field 3801 50 110 193 field 4506 56 94 194 woodlot 5104 64 110 195 woodlot 5879 67 130 196 woodlot 11941 91 48.5 197 boulevard 3496 348 140 198 right-of-way 3341 357 66 199 right-of-way 3659 20 98.5 200 woodlot 4465 41 170 201 lawn 5060 48 110 202 lawn 5017 335 99 203 lawn 4581 343 90 204 residential 6016 347 120 205 right-of-way 4997 351 89 206 park 5647 356 97.5 207 boulevard 3928 359 93.5 208 right-of-way 4268 17 155 209 right-of-way 4772 26 120 210 field 5246 34 59.5 211 field 5992 38 76 212 field 6305 46 150 213 woodlot 7521 56 150 214 woodlot 10337 57 125 215 woodlot 9033 52 115 216 field 8338 48 95 217 residential 6181 12 140 218 residential 7097 357 89.5
Report No. SDB-032-3511-2000 31

Station No. Land Use Distance1 Direction2 Barium3
219 field 11806 10 130 220 woodlot 12819 24 150 221 woodlot 14596 36 105 222 woodlot 15348 44 145 223 woodlot 15743 52 105 224 woodlot 18854 52 110 225 woodlot 14433 63 100 226 field 16218 67 115 227 woodlot 13595 74 115 228 lawn 5221 69 88.5 229 residential 2580 56 100.5 230 woodlot 3896 72 155 231 school yard 5591 75 85.5 232 woodlot 3071 104 88.5 233 right-of-way 4244 342 135
1 - Distance (metres) from INCO stack2 - Direction (degrees) from INCO stack3 - Exceedences of background-based Table F for barium (210 µg/g) are bolded, exceedences of effects-based
Table A (1000 µg/g) are shaded
Report No. SDB-032-3511-2000 32

Appendix A4: Concentration of Beryllium (Be) in soil (0-5 cm depth) collected in the Port Colborne area (November, 1999). (ug/g)
Station No. Land Use Distance1 Direction2 Beryllium3
170 right-of-way 3621 260 0.5 < W 171 right-of-way 3260 267 0.7 < T 172 vacant lot 3091 249 0.5 < W 173 vacant lot 2527 263 0.5 < W 174 residential 2311 271 0.8 < T 175 residential 1879 278 0.7 < T 176 park 1374 274 0.5 < W 177 lawn 818 269 0.8 < T 178 woodlot 2946 280 1.0 < T 179 residential 2637 283 0.8 < T 180 school yard 1727 291 0.7 < T 181 boulevard 1504 291 0.7 < T 182 lawn 1331 344 1.1 < T 183 boulevard 1295 23 0.6 < T 184 right-of-way 1471 58 1.0 < T 185 woodlot 3927 105 1.0 < T 186 woodlot 5080 131 1.1 < T 187 residential 1826 351 0.9 < T 188 woodlot 1850 14 1.2 < T 189 residential 2271 360 0.9 < T 190 boulevard 2722 28 1.1 <T 191 residential 3229 41 0.8 < T 192 field 3801 50 0.8 < T 193 field 4506 56 0.6 < T 194 woodlot 5104 64 0.6 < T 195 woodlot 5879 67 0.9 < T 196 woodlot 11941 91 1.1 < T 197 boulevard 3496 348 1.1 < T 198 right-of-way 3341 357 0.5 < W 199 right-of-way 3659 20 0.8 < T 200 woodlot 4465 41 1.3 < T 201 lawn 5060 48 0.7 < T 202 lawn 5017 335 0.7 < T 203 lawn 4581 343 0.7 < T 204 residential 6016 347 0.8 < T 205 right-of-way 4997 351 0.7 < T 206 park 5647 356 0.9 < T 207 boulevard 3928 359 0.9 < T 208 right-of-way 4268 17 1.2 < T 209 right-of-way 4772 26 1.0 < T 210 field 5246 34 0.7 < T 211 field 5992 38 0.5 < W 212 field 6305 46 1.1 < T 213 woodlot 7521 56 0.8 < T 214 woodlot 10337 57 0.9 < T 215 woodlot 9033 52 1.0 < T 216 field 8338 48 0.7 < T
Report No. SDB-032-3511-2000 33

Station No. Land Use Distance1 Direction2 Beryllium3
217 residential 6181 12 1.1 < T 218 residential 7097 357 0.8 < T 219 field 11806 10 0.8 < T 220 woodlot 12819 24 0.9 < T 221 woodlot 14596 36 0.9 < T 222 woodlot 15348 44 1.6 < T 223 woodlot 15743 52 1.1 < T 224 woodlot 18854 52 0.9 < T 225 woodlot 14433 63 1.0 < T 226 field 16218 67 1.2 < T 227 woodlot 13595 74 0.9 < T 228 lawn 5221 69 0.9 < T 229 residential 2580 56 0.8 < T 230 woodlot 3896 72 1.2 < T 231 school yard 5591 75 0.6 < T 232 woodlot 3071 104 0.9 < T 233 right-of-way 4244 342 0.6 < T
1 - Distance (metres) from INCO stack2 - Direction (degrees) from INCO stack3 - Exceedences of background-based Table F for beryllium (1.2 µg/g) are bolded, exceedences of effects-based
Table A (1.2 µg/g) are shaded
Report No. SDB-032-3511-2000 34
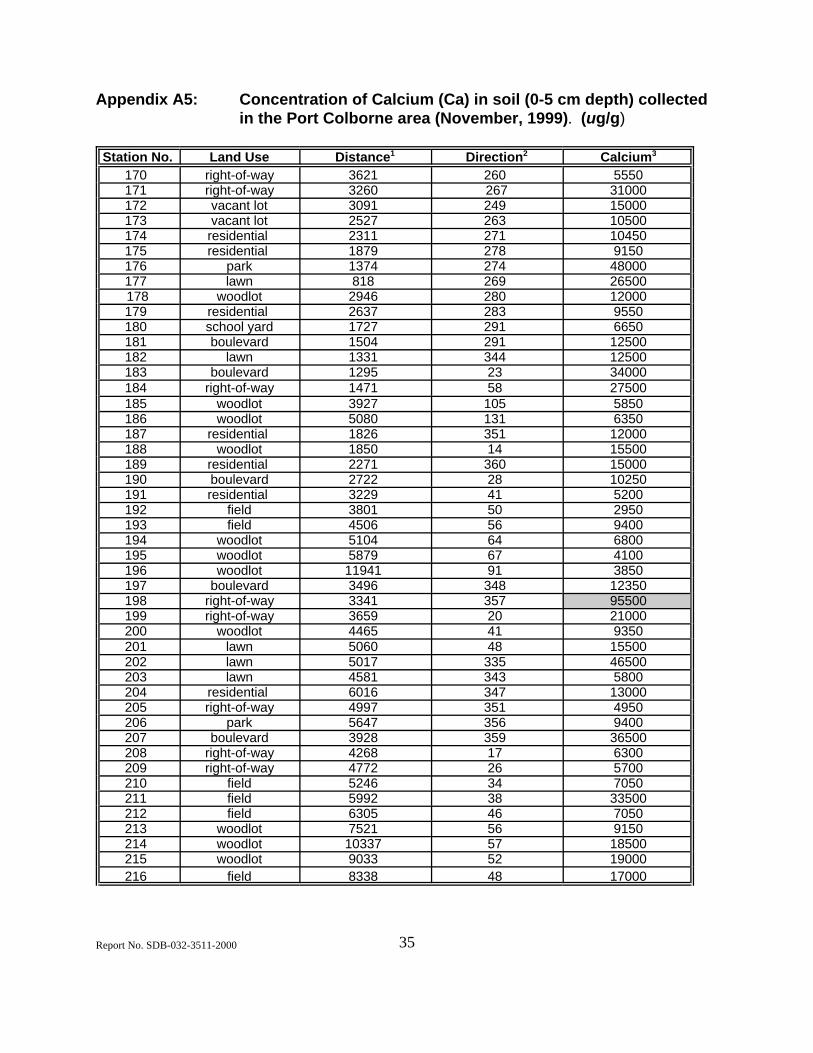
Appendix A5: Concentration of Calcium (Ca) in soil (0-5 cm depth) collected in the Port Colborne area (November, 1999). (ug/g)
Station No. Land Use Distance1 Direction2 Calcium3
170 right-of-way 3621 260 5550 171 right-of-way 3260 267 31000 172 vacant lot 3091 249 15000 173 vacant lot 2527 263 10500 174 residential 2311 271 10450 175 residential 1879 278 9150 176 park 1374 274 48000 177 lawn 818 269 26500 178 woodlot 2946 280 12000 179 residential 2637 283 9550 180 school yard 1727 291 6650 181 boulevard 1504 291 12500 182 lawn 1331 344 12500 183 boulevard 1295 23 34000 184 right-of-way 1471 58 27500 185 woodlot 3927 105 5850 186 woodlot 5080 131 6350 187 residential 1826 351 12000 188 woodlot 1850 14 15500 189 residential 2271 360 15000 190 boulevard 2722 28 10250 191 residential 3229 41 5200 192 field 3801 50 2950 193 field 4506 56 9400 194 woodlot 5104 64 6800 195 woodlot 5879 67 4100 196 woodlot 11941 91 3850 197 boulevard 3496 348 12350 198 right-of-way 3341 357 95500 199 right-of-way 3659 20 21000 200 woodlot 4465 41 9350 201 lawn 5060 48 15500 202 lawn 5017 335 46500 203 lawn 4581 343 5800 204 residential 6016 347 13000 205 right-of-way 4997 351 4950 206 park 5647 356 9400 207 boulevard 3928 359 36500 208 right-of-way 4268 17 6300 209 right-of-way 4772 26 5700 210 field 5246 34 7050 211 field 5992 38 33500 212 field 6305 46 7050 213 woodlot 7521 56 9150 214 woodlot 10337 57 18500 215 woodlot 9033 52 19000 216 field 8338 48 17000
Report No. SDB-032-3511-2000 35

Station No. Land Use Distance1 Direction2 Calcium3
Station No. Land Use Distance1 Direction2 Calcium3
217 residential 6181 12 12500 218 residential 7097 357 11950 219 field 11806 10 21500 220 woodlot 12819 24 6500 221 woodlot 14596 36 2750 222 woodlot 15348 44 5300 223 woodlot 15743 52 4750 224 woodlot 18854 52 5200 225 woodlot 14433 63 4950 226 field 16218 67 7650 227 woodlot 13595 74 6600 228 lawn 5221 69 2900 229 residential 2580 56 25500 230 woodlot 3896 72 8800 231 school yard 5591 75 15000 232 woodlot 3071 104 19000 233 right-of-way 4244 342 34500
1 - Distance (metres) from INCO stack2 - Direction (degrees) from INCO stack3 - Exceedences of OTR98 for calcium (55,000 ug/g) are shaded
Report No. SDB-032-3511-2000 36

Appendix A6: Concentration of Cadmium (Cd) in soil (0-5 cm depth) collected in the Port Colborne area (November, 1999). (ug/g)
Station No. Land Use Distance1 Direction2 Cadmium3
170 right-of-way 3621 260 0.4 171 right-of-way 3260 267 0.7 172 vacant lot 3091 249 0.4 173 vacant lot 2527 263 0.3 174 residential 2311 271 0.5 175 residential 1879 278 0.5 176 park 1374 274 0.5 177 lawn 818 269 0.7 178 woodlot 2946 280 0.8 179 residential 2637 283 0.4 180 school yard 1727 291 0.5 181 boulevard 1504 291 0.6 182 lawn 1331 344 0.6 183 boulevard 1295 23 0.4 184 right-of-way 1471 58 0.6 185 woodlot 3927 105 0.5 186 woodlot 5080 131 1.3 187 residential 1826 351 0.7 188 woodlot 1850 14 0.6 189 residential 2271 360 0.7 190 boulevard 2722 28 0.7 191 residential 3229 41 0.4 192 field 3801 50 0.3 193 field 4506 56 0.3 194 woodlot 5104 64 0.4 195 woodlot 5879 67 0.8 196 woodlot 11941 91 0.5 197 boulevard 3496 348 0.7 198 right-of-way 3341 357 0.4 199 right-of-way 3659 20 0.4 200 woodlot 4465 41 1.3 201 lawn 5060 48 0.4 202 lawn 5017 335 0.6 203 lawn 4581 343 0.3 204 residential 6016 347 0.5 205 right-of-way 4997 351 0.4 206 park 5647 356 0.9 207 boulevard 3928 359 0.6 208 right-of-way 4268 17 0.4 209 right-of-way 4772 26 0.4 210 field 5246 34 0.6 211 field 5992 38 0.4 212 field 6305 46 0.5 213 woodlot 7521 56 0.6 214 woodlot 10337 57 0.5 215 woodlot 9033 52 0.6 216 field 8338 48 0.8 217 residential 6181 12 0.7 218 residential 7097 357 0.5
Report No. SDB-032-3511-2000 37

Station No. Land Use Distance1 Direction2 Cadmium3
219 field 11806 10 0.6 220 woodlot 12819 24 0.9 221 woodlot 14596 36 0.7 222 woodlot 15348 44 1.3 223 woodlot 15743 52 0.6 224 woodlot 18854 52 0.7 225 woodlot 14433 63 0.5 226 field 16218 67 0.7 227 woodlot 13595 74 0.5 228 lawn 5221 69 0.5 229 residential 2580 56 0.4 230 woodlot 3896 72 1.0 231 school yard 5591 75 0.6 232 woodlot 3071 104 0.7 233 right-of-way 4244 342 0.4
1 - Distance (metres) from INCO stack2 - Direction (degrees) from INCO stack3 - Exceedences of background-based Table F for cadmium (1.0 µg/g) are bolded, exceedences of effects-based
Table A (12 µg/g) are shaded
Report No. SDB-032-3511-2000 38

Appendix A7: Concentration of Chromium (Cr) in soil (0-5 cm depth) collected in the Port Colborne area (November, 1999). (ug/g)
Station No. Land Use Distance1 Direction2 Chromium3
170 right-of-way 3621 260 13 171 right-of-way 3260 267 21 172 vacant lot 3091 249 11 173 vacant lot 2527 263 12 174 residential 2311 271 23 175 residential 1879 278 24.5 176 park 1374 274 13.5 177 lawn 818 269 24.5 178 woodlot 2946 280 32 179 residential 2637 283 21 180 school yard 1727 291 22.5 181 boulevard 1504 291 20.5 182 lawn 1331 344 34 183 boulevard 1295 23 23 184 right-of-way 1471 58 29.5 185 woodlot 3927 105 17 186 woodlot 5080 131 30.5 187 residential 1826 351 31 188 woodlot 1850 14 39 189 residential 2271 360 29.5 190 boulevard 2722 28 39 191 residential 3229 41 24 192 field 3801 50 26.5 193 field 4506 56 24 194 woodlot 5104 64 26 195 woodlot 5879 67 30.5 196 woodlot 11941 91 18.5 197 boulevard 3496 348 36 198 right-of-way 3341 357 18 199 right-of-way 3659 20 24.5 200 woodlot 4465 41 39.5 201 lawn 5060 48 23.5 202 lawn 5017 335 23.5 203 lawn 4581 343 27 204 residential 6016 347 26.5 205 right-of-way 4997 351 25.5 206 park 5647 356 25.5 207 boulevard 3928 359 24.5 208 right-of-way 4268 17 42 209 right-of-way 4772 26 32.5 210 field 5246 34 21 211 field 5992 38 20.5 212 field 6305 46 33.5 213 woodlot 7521 56 29.5 214 woodlot 10337 57 25.5 215 woodlot 9033 52 31 216 field 8338 48 25
Report No. SDB-032-3511-2000 39

Station No. Land Use Distance1 Direction2 Chromium3
217 residential 6181 12 43 218 residential 7097 357 28.5 219 field 11806 10 35.5 220 woodlot 12819 24 36.5 221 woodlot 14596 36 24.5 222 woodlot 15348 44 36 223 woodlot 15743 52 40.5 224 woodlot 18854 52 37 225 woodlot 14433 63 36.5 226 field 16218 67 40.5 227 woodlot 13595 74 34.5 228 lawn 5221 69 29 229 residential 2580 56 46 230 woodlot 3896 72 36 231 school yard 5591 75 22.5 232 woodlot 3071 104 22.5 233 right-of-way 4244 342 35.5
1 - Distance (metres) from INCO stack2 - Direction (degrees) from INCO stack3 - Exceedences of background-based Table F for chromium (71 µg/g) are bolded, exceedences of effects-based
Table A (1000 µg/g) are shaded
Report No. SDB-032-3511-2000 40

Appendix A8: Concentration of Iron (Fe) in soil (0-5 cm depth) collected in the Port Colborne area (November, 1999). (ug/g)
Station No. Land Use Distance1 Direction2 Iron3
170 right-of-way 3621 260 13000 171 right-of-way 3260 267 15000 172 vacant lot 3091 249 12000 173 vacant lot 2527 263 10000 174 residential 2311 271 17000 175 residential 1879 278 18500 176 park 1374 274 12500 177 lawn 818 269 18500 178 woodlot 2946 280 22500 179 residential 2637 283 17000 180 school yard 1727 291 19000 181 boulevard 1504 291 16000 182 lawn 1331 344 27500 183 boulevard 1295 23 17000 184 right-of-way 1471 58 21000 185 woodlot 3927 105 9950 186 woodlot 5080 131 12000 187 residential 1826 351 23500 188 woodlot 1850 14 24500 189 residential 2271 360 20500 190 boulevard 2722 28 27000 191 residential 3229 41 22000 192 field 3801 50 21500 193 field 4506 56 18500 194 woodlot 5104 64 14000 195 woodlot 5879 67 26500 196 woodlot 11941 91 19000 197 boulevard 3496 348 17500 198 right-of-way 3341 357 12500 199 right-of-way 3659 20 19000 200 woodlot 4465 41 23000 201 lawn 5060 48 20000 202 lawn 5017 335 17000 203 lawn 4581 343 20500 204 residential 6016 347 17500 205 right-of-way 4997 351 21500 206 park 5647 356 18500 207 boulevard 3928 359 18500 208 right-of-way 4268 17 32000 209 right-of-way 4772 26 27500 210 field 5246 34 15000 211 field 5992 38 15500 212 field 6305 46 28500 213 woodlot 7521 56 18000 214 woodlot 10337 57 19500 215 woodlot 9033 52 22000 216 field 8338 48 14000 217 residential 6181 12 26000 218 residential 7097 357 17500
Report No. SDB-032-3511-2000 41
Station No. Land Use Distance1 Direction2 Iron3
219 field 11806 10 24500 220 woodlot 12819 24 30000 221 woodlot 14596 36 9250 222 woodlot 15348 44 18000 223 woodlot 15743 52 35500 224 woodlot 18854 52 28500 225 woodlot 14433 63 28500 226 field 16218 67 33500 227 woodlot 13595 74 25000 228 lawn 5221 69 26500 229 residential 2580 56 20500 230 woodlot 3896 72 25000 231 school yard 5591 75 18500 232 woodlot 3071 104 15500 233 right-of-way 4244 342 23500
1 - Distance (metres) from INCO stack2 - Direction (degrees) from INCO stack3 - Exceedences of OTR98 for iron (35,000 ug/g) are shaded
Report No. SDB-032-3511-2000 42

Appendix A9: Concentration of Magnesium (Mg) in soil (0-5 cm depth) collected in the Port Colborne area (November, 1999). (ug/g)
Station No. Land Use Distance1 Direction2 Magnesium3
170 right-of-way 3621 260 1150 171 right-of-way 3260 267 12000 172 vacant lot 3091 249 5750 173 vacant lot 2527 263 5300 174 residential 2311 271 5450 175 residential 1879 278 5200 176 park 1374 274 9500 177 lawn 818 269 12500 178 woodlot 2946 280 4950 179 residential 2637 283 5500 180 school yard 1727 291 4850 181 boulevard 1504 291 6900 182 lawn 1331 344 7700 183 boulevard 1295 23 16000 184 right-of-way 1471 58 15500 185 woodlot 3927 105 2300 186 woodlot 5080 131 3350 187 residential 1826 351 7000 188 woodlot 1850 14 10250 189 residential 2271 360 7900 190 boulevard 2722 28 7650 191 residential 3229 41 5100 192 field 3801 50 4000 193 field 4506 56 5500 194 woodlot 5104 64 4600 195 woodlot 5879 67 4950 196 woodlot 11941 91 3750 197 boulevard 3496 348 5900 198 right-of-way 3341 357 50500 199 right-of-way 3659 20 12500 200 woodlot 4465 41 6800 201 lawn 5060 48 8100 202 lawn 5017 335 24000 203 lawn 4581 343 4850 204 residential 6016 347 4350 205 right-of-way 4997 351 4650 206 park 5647 356 4450 207 boulevard 3928 359 20000 208 right-of-way 4268 17 8100 209 right-of-way 4772 26 6400 210 field 5246 34 3350 211 field 5992 38 17500 212 field 6305 46 7450 213 woodlot 7521 56 4600 214 woodlot 10337 57 5400 215 woodlot 9033 52 8000 216 field 8338 48 5250
Report No. SDB-032-3511-2000 43
Station No. Land Use Distance1 Direction2 Magnesium3
217 residential 6181 12 7550 218 residential 7097 357 6450 219 field 11806 10 10250 220 woodlot 12819 24 4400 221 woodlot 14596 36 2900 222 woodlot 15348 44 4800 223 woodlot 15743 52 6000 224 woodlot 18854 52 5300 225 woodlot 14433 63 5650 226 field 16218 67 7000 227 woodlot 13595 74 7100 228 lawn 5221 69 5300 229 residential 2580 56 13000 230 woodlot 3896 72 5800 231 school yard 5591 75 9200 232 woodlot 3071 104 9100 233 right-of-way 4244 342 16500
1 - Distance (metres) from INCO stack2 - Direction (degrees) from INCO stack3 - Exceedences of OTR98 for magnesium (20,000 ug/g) are shaded
Report No. SDB-032-3511-2000 44
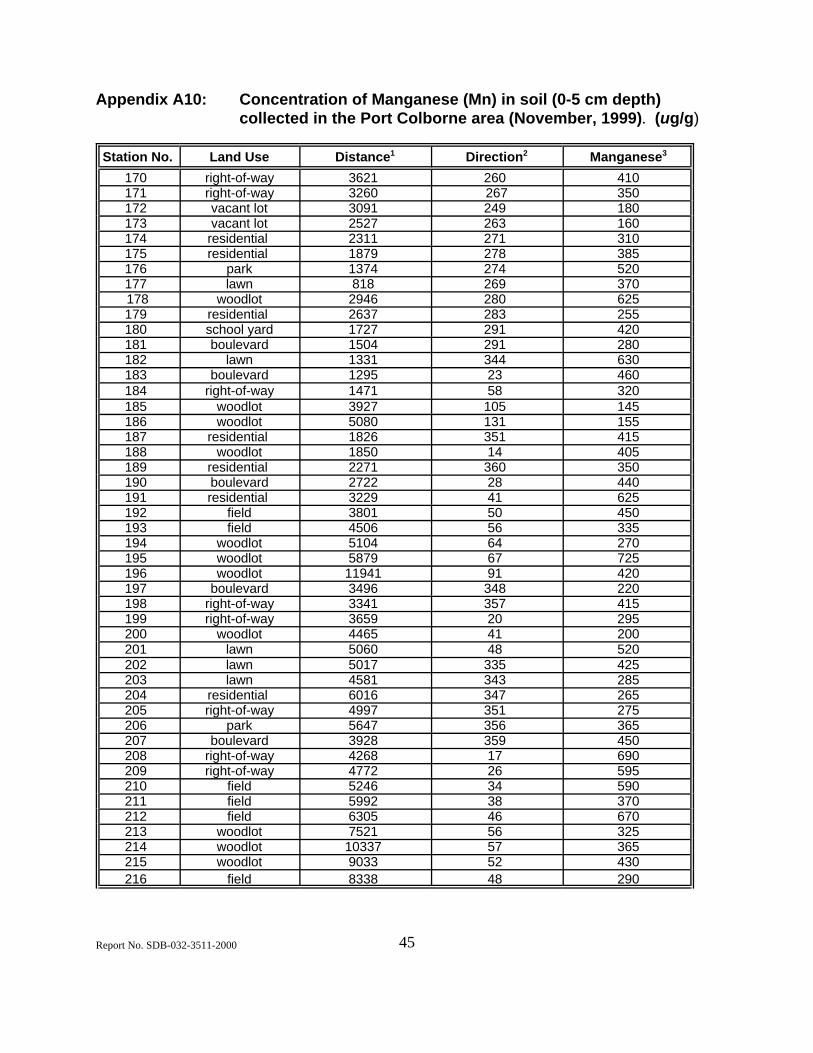
Appendix A10: Concentration of Manganese (Mn) in soil (0-5 cm depth) collected in the Port Colborne area (November, 1999). (ug/g)
Station No. Land Use Distance1 Direction2 Manganese3
170 right-of-way 3621 260 410 171 right-of-way 3260 267 350 172 vacant lot 3091 249 180 173 vacant lot 2527 263 160 174 residential 2311 271 310 175 residential 1879 278 385 176 park 1374 274 520 177 lawn 818 269 370 178 woodlot 2946 280 625 179 residential 2637 283 255 180 school yard 1727 291 420 181 boulevard 1504 291 280 182 lawn 1331 344 630 183 boulevard 1295 23 460 184 right-of-way 1471 58 320 185 woodlot 3927 105 145 186 woodlot 5080 131 155 187 residential 1826 351 415 188 woodlot 1850 14 405 189 residential 2271 360 350 190 boulevard 2722 28 440 191 residential 3229 41 625 192 field 3801 50 450 193 field 4506 56 335 194 woodlot 5104 64 270 195 woodlot 5879 67 725 196 woodlot 11941 91 420 197 boulevard 3496 348 220 198 right-of-way 3341 357 415 199 right-of-way 3659 20 295 200 woodlot 4465 41 200 201 lawn 5060 48 520 202 lawn 5017 335 425 203 lawn 4581 343 285 204 residential 6016 347 265 205 right-of-way 4997 351 275 206 park 5647 356 365 207 boulevard 3928 359 450 208 right-of-way 4268 17 690 209 right-of-way 4772 26 595 210 field 5246 34 590 211 field 5992 38 370 212 field 6305 46 670 213 woodlot 7521 56 325 214 woodlot 10337 57 365 215 woodlot 9033 52 430 216 field 8338 48 290
Report No. SDB-032-3511-2000 45

Station No. Land Use Distance1 Direction2 Manganese3
217 residential 6181 12 375 218 residential 7097 357 275 219 field 11806 10 715 220 woodlot 12819 24 1250 221 woodlot 14596 36 126 222 woodlot 15348 44 370 223 woodlot 15743 52 750 224 woodlot 18854 52 475 225 woodlot 14433 63 650 226 field 16218 67 1900 227 woodlot 13595 74 635 228 lawn 5221 69 675 229 residential 2580 56 445 230 woodlot 3896 72 405 231 school yard 5591 75 575 232 woodlot 3071 104 270 233 right-of-way 4244 342 460
1 - Distance (metres) from INCO stack2 - Direction (degrees) from INCO stack3 - Exceedences of OTR98 for manganese (2,200 ug/g) are shaded
Report No. SDB-032-3511-2000 46

Appendix 11: Concentration of Molybdenum (Mo) in soil (0-5 cm depth) collected in the Port Colborne area (November, 1999). (ug/g)
Station No. Land Use Distance1 Direction2 Molybdenum3
170 right-of-way 3621 260 0.5 171 right-of-way 3260 267 0.5 172 vacant lot 3091 249 0.5 173 vacant lot 2527 263 0.5 174 residential 2311 271 0.5 175 residential 1879 278 0.5 176 park 1374 274 0.5 177 lawn 818 269 0.6 178 woodlot 2946 280 0.5 179 residential 2637 283 0.5 180 school yard 1727 291 0.5 181 boulevard 1504 291 0.5 182 lawn 1331 344 0.9 183 boulevard 1295 23 0.6 184 right-of-way 1471 58 1.4 185 woodlot 3927 105 0.5 186 woodlot 5080 131 0.8 187 residential 1826 351 0.8 188 woodlot 1850 14 1.3 189 residential 2271 360 0.8 190 boulevard 2722 28 1.2 191 residential 3229 41 0.5 192 field 3801 50 0.5 193 field 4506 56 0.5 194 woodlot 5104 64 0.5 195 woodlot 5879 67 0.9 196 woodlot 11941 91 0.5 197 boulevard 3496 348 0.9 198 right-of-way 3341 357 1.2 199 right-of-way 3659 20 0.7 200 woodlot 4465 41 0.7 201 lawn 5060 48 0.6 202 lawn 5017 335 0.5 203 lawn 4581 343 0.9 204 residential 6016 347 0.7 205 right-of-way 4997 351 0.6 206 park 5647 356 0.5 207 boulevard 3928 359 0.8 208 right-of-way 4268 17 1.2 209 right-of-way 4772 26 0.9 210 field 5246 34 0.5 211 field 5992 38 0.5 212 field 6305 46 0.7 213 woodlot 7521 56 0.8 214 woodlot 10337 57 0.7 215 woodlot 9033 52 0.6 216 field 8338 48 1.1
Report No. SDB-032-3511-2000 47

Station No. Land Use Distance1 Direction2 Molybdenum3
217 residential 6181 12 0.8 218 residential 7097 357 0.5 219 field 11806 10 1.2 220 woodlot 12819 24 1.1 221 woodlot 14596 36 1.1 222 woodlot 15348 44 1.1 223 woodlot 15743 52 1.1 224 woodlot 18854 52 7.2 225 woodlot 14433 63 1.2 226 field 16218 67 1.1 227 woodlot 13595 74 1.1 228 lawn 5221 69 0.8 229 residential 2580 56 1.2 230 woodlot 3896 72 0.9 231 school yard 5591 75 0.5 232 woodlot 3071 104 0.5 233 right-of-way 4244 342 1.0
1 - Distance (metres) from INCO stack2 - Direction (degrees) from INCO stack3 - Exceedences of background-based Table F for molybdenum (2.5 µg/g) are bolded, exceedences of effects-based
Table A (40 µg/g) are shaded
Report No. SDB-032-3511-2000 48
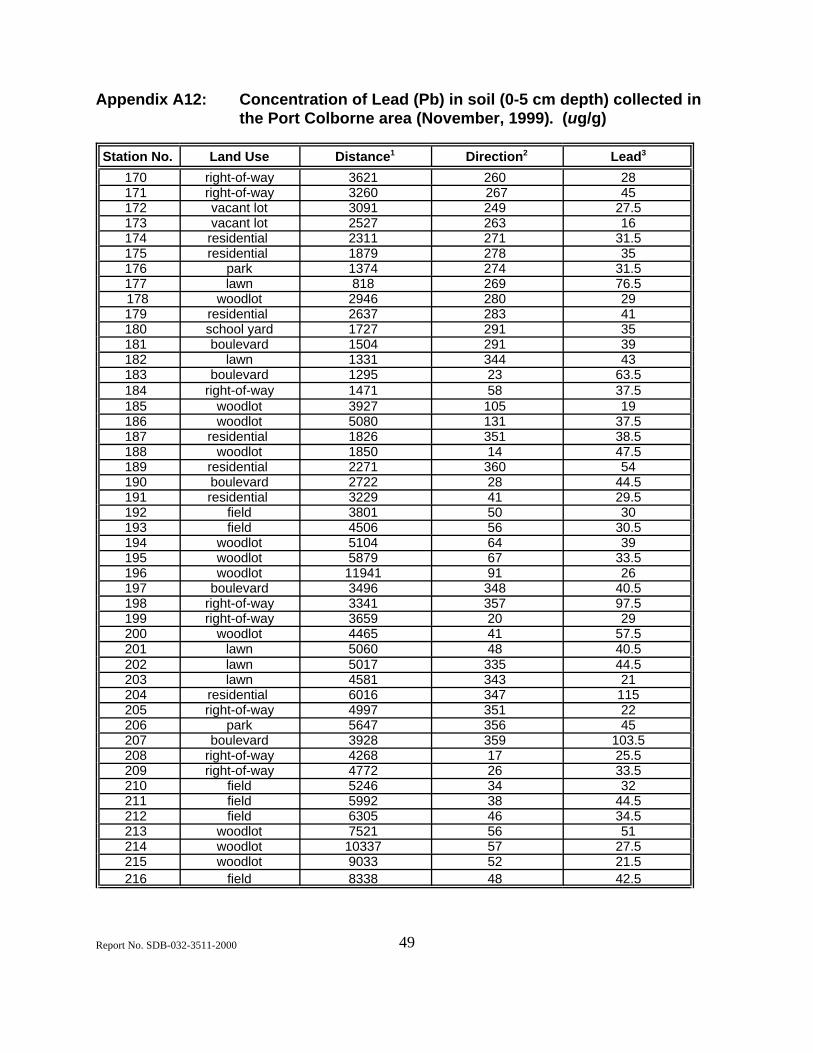
Appendix A12: Concentration of Lead (Pb) in soil (0-5 cm depth) collected in the Port Colborne area (November, 1999). (ug/g)
Station No. Land Use Distance1 Direction2 Lead3
170 right-of-way 3621 260 28 171 right-of-way 3260 267 45 172 vacant lot 3091 249 27.5 173 vacant lot 2527 263 16 174 residential 2311 271 31.5 175 residential 1879 278 35 176 park 1374 274 31.5 177 lawn 818 269 76.5 178 woodlot 2946 280 29 179 residential 2637 283 41 180 school yard 1727 291 35 181 boulevard 1504 291 39 182 lawn 1331 344 43 183 boulevard 1295 23 63.5 184 right-of-way 1471 58 37.5 185 woodlot 3927 105 19 186 woodlot 5080 131 37.5 187 residential 1826 351 38.5 188 woodlot 1850 14 47.5 189 residential 2271 360 54 190 boulevard 2722 28 44.5 191 residential 3229 41 29.5 192 field 3801 50 30 193 field 4506 56 30.5 194 woodlot 5104 64 39 195 woodlot 5879 67 33.5 196 woodlot 11941 91 26 197 boulevard 3496 348 40.5 198 right-of-way 3341 357 97.5 199 right-of-way 3659 20 29 200 woodlot 4465 41 57.5 201 lawn 5060 48 40.5 202 lawn 5017 335 44.5 203 lawn 4581 343 21 204 residential 6016 347 115 205 right-of-way 4997 351 22 206 park 5647 356 45 207 boulevard 3928 359 103.5 208 right-of-way 4268 17 25.5 209 right-of-way 4772 26 33.5 210 field 5246 34 32 211 field 5992 38 44.5 212 field 6305 46 34.5 213 woodlot 7521 56 51 214 woodlot 10337 57 27.5 215 woodlot 9033 52 21.5 216 field 8338 48 42.5
Report No. SDB-032-3511-2000 49
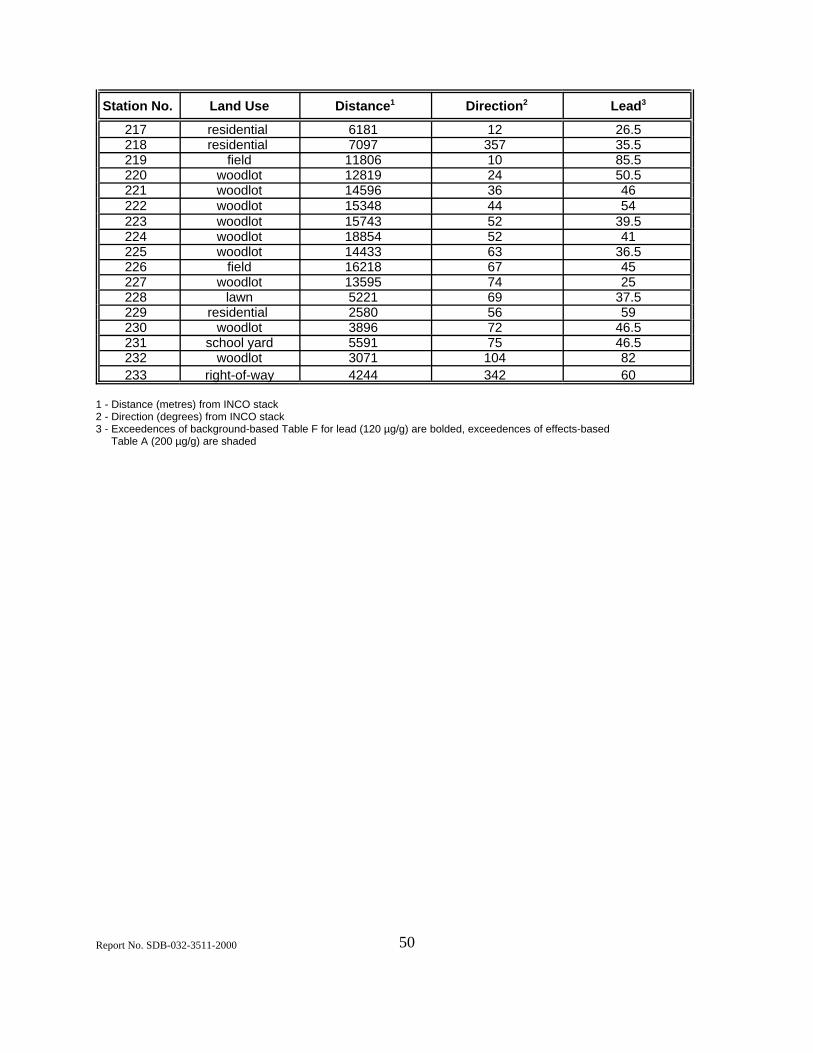
Station No. Land Use Distance1 Direction2 Lead3
217 residential 6181 12 26.5 218 residential 7097 357 35.5 219 field 11806 10 85.5 220 woodlot 12819 24 50.5 221 woodlot 14596 36 46 222 woodlot 15348 44 54 223 woodlot 15743 52 39.5 224 woodlot 18854 52 41 225 woodlot 14433 63 36.5 226 field 16218 67 45 227 woodlot 13595 74 25 228 lawn 5221 69 37.5 229 residential 2580 56 59 230 woodlot 3896 72 46.5 231 school yard 5591 75 46.5 232 woodlot 3071 104 82 233 right-of-way 4244 342 60
1 - Distance (metres) from INCO stack2 - Direction (degrees) from INCO stack3 - Exceedences of background-based Table F for lead (120 µg/g) are bolded, exceedences of effects-based
Table A (200 µg/g) are shaded
Report No. SDB-032-3511-2000 50
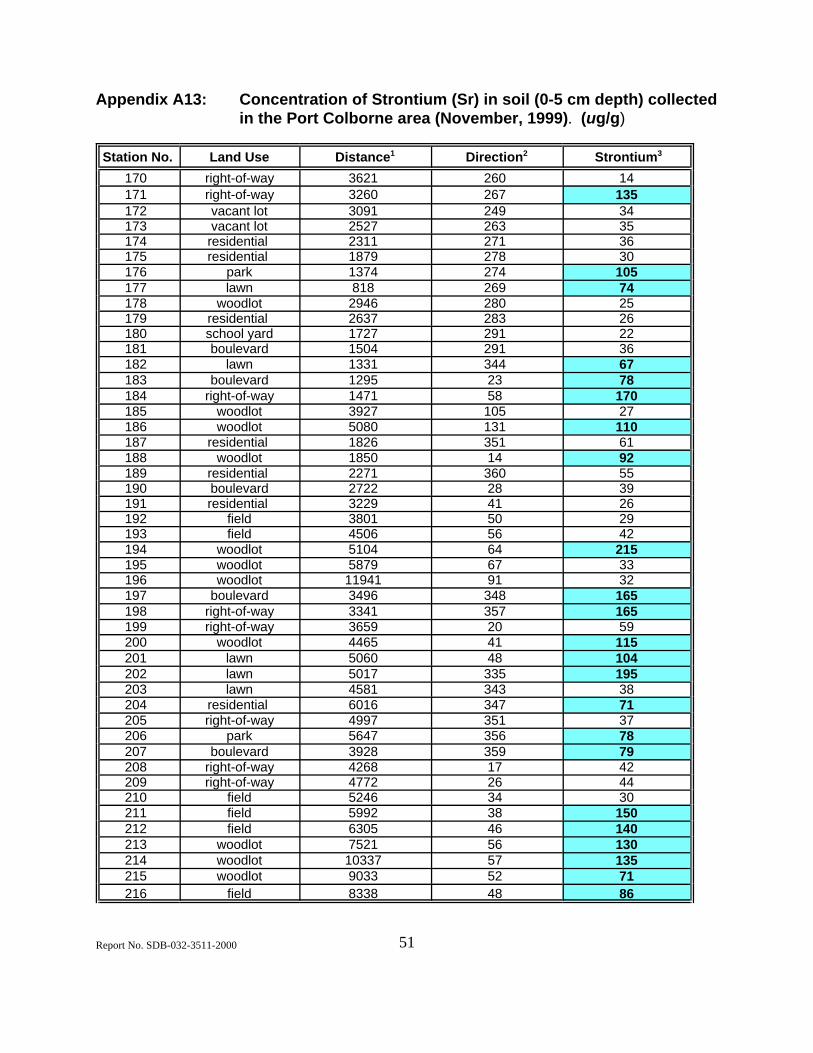
Appendix A13: Concentration of Strontium (Sr) in soil (0-5 cm depth) collected in the Port Colborne area (November, 1999). (ug/g)
Station No. Land Use Distance1 Direction2 Strontium3
170 right-of-way 3621 260 14 171 right-of-way 3260 267 135 172 vacant lot 3091 249 34 173 vacant lot 2527 263 35 174 residential 2311 271 36 175 residential 1879 278 30 176 park 1374 274 105 177 lawn 818 269 74 178 woodlot 2946 280 25 179 residential 2637 283 26 180 school yard 1727 291 22 181 boulevard 1504 291 36 182 lawn 1331 344 67 183 boulevard 1295 23 78 184 right-of-way 1471 58 170 185 woodlot 3927 105 27 186 woodlot 5080 131 110 187 residential 1826 351 61 188 woodlot 1850 14 92 189 residential 2271 360 55 190 boulevard 2722 28 39 191 residential 3229 41 26 192 field 3801 50 29 193 field 4506 56 42 194 woodlot 5104 64 215 195 woodlot 5879 67 33 196 woodlot 11941 91 32 197 boulevard 3496 348 165 198 right-of-way 3341 357 165 199 right-of-way 3659 20 59 200 woodlot 4465 41 115 201 lawn 5060 48 104 202 lawn 5017 335 195 203 lawn 4581 343 38 204 residential 6016 347 71 205 right-of-way 4997 351 37 206 park 5647 356 78 207 boulevard 3928 359 79 208 right-of-way 4268 17 42 209 right-of-way 4772 26 44 210 field 5246 34 30 211 field 5992 38 150 212 field 6305 46 140 213 woodlot 7521 56 130 214 woodlot 10337 57 135 215 woodlot 9033 52 71 216 field 8338 48 86
Report No. SDB-032-3511-2000 51
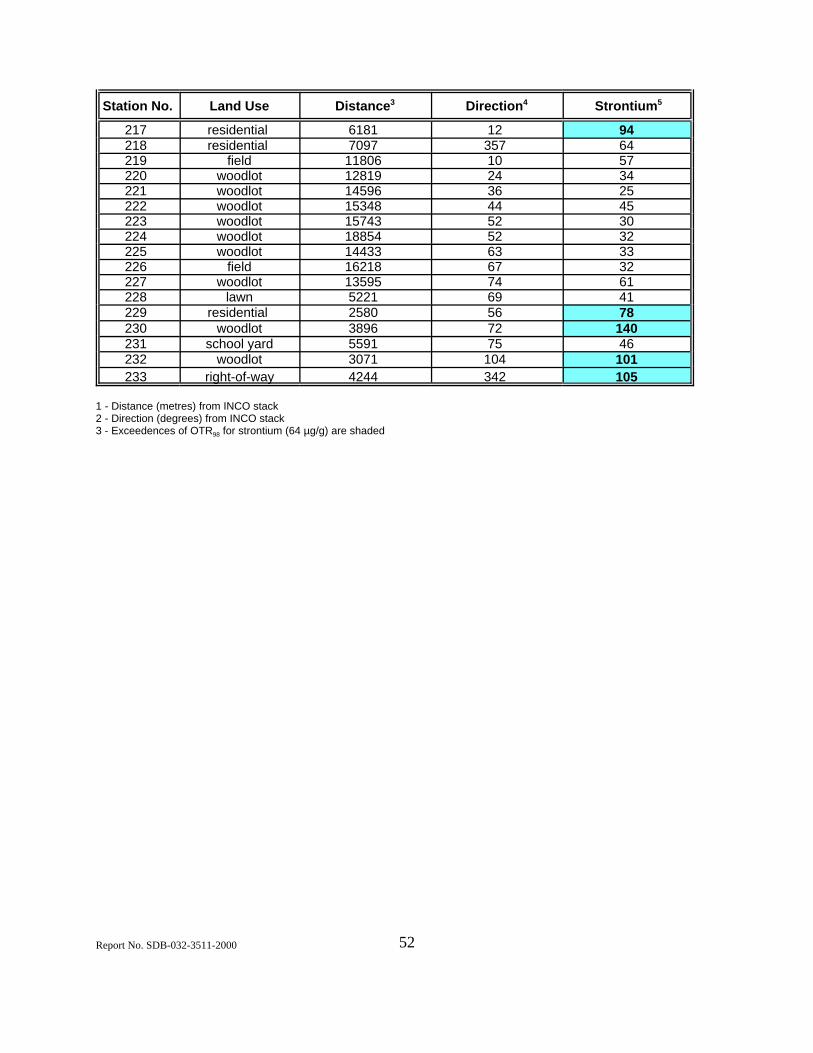
Station No. Land Use Distance3 Direction4 Strontium5
217 residential 6181 12 94 218 residential 7097 357 64 219 field 11806 10 57 220 woodlot 12819 24 34 221 woodlot 14596 36 25 222 woodlot 15348 44 45 223 woodlot 15743 52 30 224 woodlot 18854 52 32 225 woodlot 14433 63 33 226 field 16218 67 32 227 woodlot 13595 74 61 228 lawn 5221 69 41 229 residential 2580 56 78 230 woodlot 3896 72 140 231 school yard 5591 75 46 232 woodlot 3071 104 101 233 right-of-way 4244 342 105
1 - Distance (metres) from INCO stack2 - Direction (degrees) from INCO stack3 - Exceedences of OTR98 for strontium (64 µg/g) are shaded
Report No. SDB-032-3511-2000 52
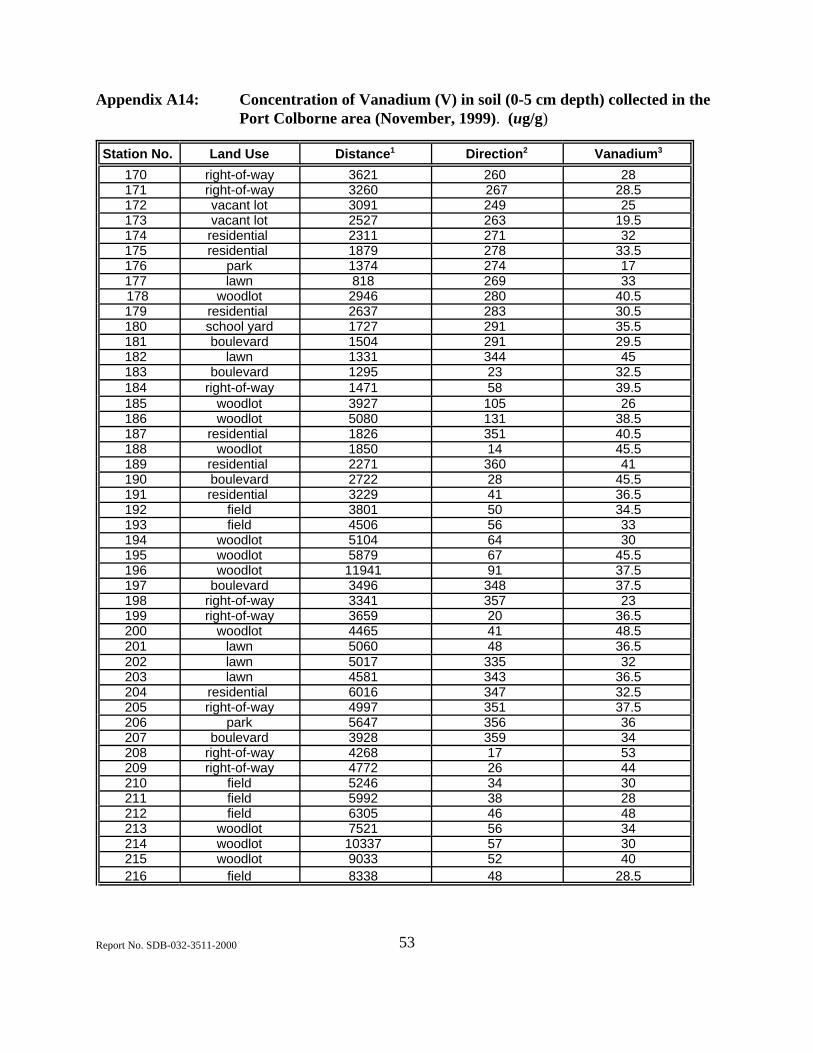
Appendix A14: Concentration of Vanadium (V) in soil (0-5 cm depth) collected in the Port Colborne area (November, 1999). (ug/g)
Station No. Land Use Distance1 Direction2 Vanadium3
170 right-of-way 3621 260 28 171 right-of-way 3260 267 28.5 172 vacant lot 3091 249 25 173 vacant lot 2527 263 19.5 174 residential 2311 271 32 175 residential 1879 278 33.5 176 park 1374 274 17 177 lawn 818 269 33 178 woodlot 2946 280 40.5 179 residential 2637 283 30.5 180 school yard 1727 291 35.5 181 boulevard 1504 291 29.5 182 lawn 1331 344 45 183 boulevard 1295 23 32.5 184 right-of-way 1471 58 39.5 185 woodlot 3927 105 26 186 woodlot 5080 131 38.5 187 residential 1826 351 40.5 188 woodlot 1850 14 45.5 189 residential 2271 360 41 190 boulevard 2722 28 45.5 191 residential 3229 41 36.5 192 field 3801 50 34.5 193 field 4506 56 33 194 woodlot 5104 64 30 195 woodlot 5879 67 45.5 196 woodlot 11941 91 37.5 197 boulevard 3496 348 37.5 198 right-of-way 3341 357 23 199 right-of-way 3659 20 36.5 200 woodlot 4465 41 48.5 201 lawn 5060 48 36.5 202 lawn 5017 335 32 203 lawn 4581 343 36.5 204 residential 6016 347 32.5 205 right-of-way 4997 351 37.5 206 park 5647 356 36 207 boulevard 3928 359 34 208 right-of-way 4268 17 53 209 right-of-way 4772 26 44 210 field 5246 34 30 211 field 5992 38 28 212 field 6305 46 48 213 woodlot 7521 56 34 214 woodlot 10337 57 30 215 woodlot 9033 52 40 216 field 8338 48 28.5
Report No. SDB-032-3511-2000 53

Station No. Land Use Distance1 Direction2 Vanadium3
217 residential 6181 12 45.5 218 residential 7097 357 35.5 219 field 11806 10 35.5 220 woodlot 12819 24 55 221 woodlot 14596 36 29.5 222 woodlot 15348 44 41.5 223 woodlot 15743 52 57.5 224 woodlot 18854 52 45.5 225 woodlot 14433 63 48.5 226 field 16218 67 60 227 woodlot 13595 74 44 228 lawn 5221 69 45 229 residential 2580 56 35.5 230 woodlot 3896 72 46.5 231 school yard 5591 75 33 232 woodlot 3071 104 29.5 233 right-of-way 4244 342 40
1 - Distance (metres) from INCO stack2 - Direction (degrees) from INCO stack3 - Exceedences of background-based Table F for vanadium (91 µg/g) are bolded, exceedences of effects-based
Table A (250 µg/g) are shaded
Report No. SDB-032-3511-2000 54

Appendix A15: Concentration of Zinc (Z) in soil (0-5 cm depth) collected in the Port Colborne area (November, 1999). (ug/g)
Station No. Land Use Distance1 Direction2 Zinc3
170 right-of-way 3621 260 62 171 right-of-way 3260 267 93.5 172 vacant lot 3091 249 66.5 173 vacant lot 2527 263 58.5 174 residential 2311 271 77 175 residential 1879 278 145 176 park 1374 274 160 177 lawn 818 269 140 178 woodlot 2946 280 97 179 residential 2637 283 81 180 school yard 1727 291 82.5 181 boulevard 1504 291 100 182 lawn 1331 344 130 183 boulevard 1295 23 125 184 right-of-way 1471 58 135 185 woodlot 3927 105 72 186 woodlot 5080 131 95.5 187 residential 1826 351 105 188 woodlot 1850 14 130 189 residential 2271 360 115 190 boulevard 2722 28 125 191 residential 3229 41 105 192 field 3801 50 100 193 field 4506 56 160 194 woodlot 5104 64 100 195 woodlot 5879 67 100 196 woodlot 11941 91 97.5 197 boulevard 3496 348 180 198 right-of-way 3341 357 110 199 right-of-way 3659 20 115 200 woodlot 4465 41 160 201 lawn 5060 48 98.5 202 lawn 5017 335 95 203 lawn 4581 343 70.5 204 residential 6016 347 235 205 right-of-way 4997 351 66 206 park 5647 356 130 207 boulevard 3928 359 125 208 right-of-way 4268 17 87 209 right-of-way 4772 26 94 210 field 5246 34 135 211 field 5992 38 110 212 field 6305 46 125 213 woodlot 7521 56 130 214 woodlot 10337 57 79 215 woodlot 9033 52 79.5 216 field 8338 48 150
Report No. SDB-032-3511-2000 55

Station No. Land Use Distance1 Direction2 Zinc3
217 residential 6181 12 135 218 residential 7097 357 87 219 field 11806 10 190 220 woodlot 12819 24 185 221 woodlot 14596 36 74 222 woodlot 15348 44 120 223 woodlot 15743 52 94 224 woodlot 18854 52 130 225 woodlot 14433 63 99.5 226 field 16218 67 165 227 woodlot 13595 74 105 228 lawn 5221 69 96 229 residential 2580 56 135 230 woodlot 3896 72 170 231 school yard 5591 75 110 232 woodlot 3071 104 99.5 233 right-of-way 4244 342 135
1 - Distance (metres) from INCO stack2 - Direction (degrees) from INCO stack3 - Exceedences of background-based Table F for zinc (160 µg/g) are bolded, exceedences of effects-based
Table A (800 µg/g) are shaded
Report No. SDB-032-3511-2000 56

Appendix BDerivation and Significance of the MOEE "Ontario Typical Range" Soil Guidelines.
The MOEE "Ontario Typical Range" (OTR) guidelines are being developed to assist in interpreting analytical data and evaluating source-related impacts on the terrestrial environment. The OTRs are used to determine if the level of a chemical parameter in soil, plants, moss bags, or snow is significantly greater than the normal background range. An exceedence of the OTR98 (the OTR98 is the actual guideline number) may indicate the presence of a potential point source of contamination.
The OTR98 represents the expected range of concentrations of chemical parameters in surface soil, plants, moss bags, and snow from areas in Ontario not subjected to the influence of known point sources of pollution. The OTR98 represents 97.5 percent of the data in the OTR distribution. This is equivalent to the mean plus two standard deviations, which is similar to the previous MOEE "Upper Limit of Normal" (ULN) guidelines. In other words, 98 out of every 100 background samples should be lower than the OTR98.
The OTR98 may vary between land use categories even in the absence of a point source of pollution because of natural variation and the amount and type of human activity, both past and present. Therefore, OTRs are being developed for several land use categories. The three main land use categories are Rural, New Urban, and Old Urban. Urban is defined as an area that has municipal water and sewage services. Old Urban is any area that has been developed as an urban area for more than 40 years. Rural is all other areas. These major land use categories are further broken into three subcategories; Parkland (which includes greenbelts and woodlands), Residential, and Industrial (which includes heavy industry, commercial properties such as malls, and transportation rights-of-way). Rural also includes an Agricultural category.
The OTR guidelines apply only to samples collected using standard MOEE sampling, sample preparation, and analytical protocols. Because the background data were collected in Ontario, the OTRs represent Ontario environmental conditions.
The OTRs are not the only means by which results are interpreted. Data interpretation should involve reviewing results from control samples, examining all the survey data for evidence of a pattern of contamination relative to the suspected source, and where available, comparison with effects-based guidelines. The OTRs are particularly useful where there is uncertainty regarding local background concentrations and/or insufficient samples were collected to determine a contamination gradient. OTRs are also used to determine where in the anticipated range a result falls. This can identify a potential concern even when a result falls within the guideline. For example, if all of the results from a survey are close to the OTR98 this could indicate that the local environment has been contaminated above the anticipated average, and therefore the pollution source should be more closely monitored.
The OTRs identify a range of chemical parameters resulting from natural variation and normal human activity. As a result, it must be stressed that values falling within a specific OTR98 should not be considered as acceptable or desirable levels; nor does the OTR98 imply toxicity to plants, animals or humans. Rather, the OTR98 is a level which, if exceeded, prompts further investigation on a case by case basis to determine the significance, if any, of the above normal concentration. Incidental, isolated or spurious exceedences of an OTR98 do not necessarily indicate a need for regulatory or abatement activity. However, repeated and/or extensive exceedences of an OTR98 that appears to be related to a potential pollution source does indicate the need for a thorough evaluation of the regulatory or abatement program. The OTR98 supersedes Phytotoxicology ULN guideline. The OTR program is on-going. The number of OTRs will be continuous updated as sampling is completed for the various land use categories and sample types. For more information on these guidelines please refer to Ontario Typical Range of Chemical Parameters in Soil, Vegetation, Moss Bags, and Snow. MOEE Report Number HCB-151-3512-93, PIBs Number 2792, ISBN 0-778-1979-1.
Report No. SDB-032-3511-2000 57
Appendix C Derivation and Significance of the MOE Soil Clean-up Guidelines
The MOE soil clean-up Guidelines have been developed to provide guidance for cleaning up contaminated soil. The Guidelines are not legislated Regulations. Also, the Guidelines are not action levels, in that an exceedence does not automatically mean that a clean-up must be conducted. The Guidelines were prepared to help industrial property owners decide how to clean-up contaminated soil when property is sold and/or the land-use changes. Most municipalities insist that contaminated soil is cleaned up according to the MOE Guidelines before they will approve a zoning change for redevelopment, therefore, even though the Guideline is voluntary most industrial property owners and developers are obliged to use it. For example, the owner of an industrial property who plans to sell the land to a developer who intends to build residential housing can use the Guideline to clean up the soil to meet the residential land-use criteria. In this way previously-contaminated industrial land can be re-used for residential housing without concern for adverse environmental effects.
The Guideline contains a series of Tables (A through F), each having criteria for soil texture, soil depth, and ground water use for various land-use categories (eg, agricultural, residential, industrial). Table F criteria reflect the upper range of background concentrations for soil in Ontario. An exceedence of Table F indicates the likely presence of a contaminant source. Tables A through E criteria are effects-based and are set to protect against the potential for adverse effects to human health, ecological health, and the natural environment, whichever is the most sensitive. By protecting the most sensitive parameter the rest of the environment is protected by default. The Guideline criteria take into consideration the potential for adverse effects through direct contact, and through contaminant transfer from soil to indoor air, from ground water or surface water through release of volatile gases, from leaching of contaminants in soil to ground water, or from ground water discharge to surface water. However, the Guideline criteria may not ensure that corrosive, explosive, or unstable soil conditions will be eliminated.
If the decision is made that remedial action is needed, the criteria in Tables A to F of the Guideline can be used as clean-up targets. In some cases, because of economic or practical reasons, it may not be possible to clean up a site using the generic criteria in Tables A to F. The Guideline provides a process, called a site specific risk assessment, which is used to evaluate the soil contamination with respect to conditions that are unique to the contaminated site. In a site specific risk assessment the proponent examines all the potential pathways through which the contamination may impact the environment and must demonstrate that because of conditions unique to that site the environment and human health will not be adversely effected if contamination above the generic criteria in Table A to E is left in place. When contamination is present and a change in land-use is not planned, for example residential properties and public green spaces near a pollution source, the Guideline may be used in making decisions about the need for remediation. This is different from the previously described situation where a company that caused contamination on their own property decides to clean up the soil, usually at the insistence of the municipality who will not approve a zoning change unless remediation is conducted. Decisions on the need to undertake remedial action when the Guideline criteria are exceeded and where the land-use is not changing are made on a site by site basis using site specific risk assessment principals and are usually contingent on the contaminants having caused an adverse environmental effect or there is a demonstrated likelihood that the contamination may cause an adverse effect. Because of the long history of industrial operation and our practice of living close to our work place the soil in many communities in Ontario is contaminated above the effects-based criteria in the MOE Guidelines.
In practice, remediation of contaminated soil on privately-owned residential property and public green spaces has only been conducted in communities when the potential for adverse health effects has been demonstrated. The soil clean-up Guidelines were developed from published U.S. EPA and Ontario environmental data bases. Currently there are criteria for about 25 inorganic elements and about 90 organic compounds. Criteria were developed only if there were sufficient, defendable, effects-based data on the potential to cause an adverse effect. All of the criteria address human health and aquatic toxicity, but terrestrial ecological toxicity information was not available for all elements or compounds. The development of these clean-up Guidelines is a continuous program, and criteria for more elements and compounds will be developed as additional environmental data become available. Similarly, new information could result in future modifications to the existing Guidelines. For more information on the MOE’s soil clean-up Guidelines please refer to the Guideline for Use at Contaminated Sites in Ontario. Revised February 1997, Ontario Ministry of Environment and Energy, PIBs 3161E01, ISBN 0-7778-6114-3.
Report No. SDB-032-3511-2000 58
Appendix D
Methodology for Producing Surfer/ArcView Soil Contamination Maps
Software Utilized
Two software packages were used to generate the maps. The data analysis and creation of the concentration contours was done using Surfer Version 6.03 for Windows 95 by Golden Software Inc. The output from Surfer was imported into ArcView GIS Version 3.1 by Environmental Systems Research Institute, Inc., and combined with base maps, roads and bodies of water, to produce the final maps. The base map data was CanMap Street Files for Ontario, Version 2, by Desktop Mapping Technologies Inc.
Data Used
For the contour maps produced in this report, all sampling stations at which 0-5cm depth soil samples collected in 1998 (refer to 1998 MOE report) and 1999 were used, along with sampling stations selected from historical MOE surveys, to generate the contours. Two locations from the 1998 survey, stations 10 and 27 were excluded from the analysis because the analytical results from these stations were significantly lower than surrounding stations (the surface soil at these two sites had most likely been replaced at some time in the recent past).
Mapping Process
The process involved in creating the maps was to analyze the data and create the desired contours using the Surfer program. The individual contours were exported from Surfer as AutoCad DXF files. The polygon portion of the DXF files were imported into ArcView GIS and converted into ArcView shape files. Lake Erie and the Welland canal were subtracted from each of the contour polygons where they overlapped. The resulting polygons were combined with the street and hydrographic base maps, and the station locations were imported from the Phytotoxicology Information Management System (PIMS). Layouts were then created to include a legend, labels, scale and compass and printed for the report. Areas for the Table A and Table F contour polygons were calculated using built in ArcView procedures.
Surfer
For all data sets, a Krigging gridding method was used and the search option was set to use all data. For all contours, smoothing was set at high. All co-ordinates were in latitude and longitude.
Report No. SDB-032-3511-2000 59

Surfer Settings
Nickel Data (0 - 5 cm Results) a. Grid Line Geometry
Minimum Maximum Spacing # of Lines
X Axis (Longitude) -79.36o -78.9o .001o 461
Y Axis (Latitude) 42.85o 43.05o .001o 201
Matrix Smoothing - weighted method, matrix centre weight = 2, rows & columns on either side = 1, distance weighting power = 2
b. Nickel Contours: 43, 100, 200, 500, 1000, 2000, 3000, 400042, 200 (Table A & F)
Copper Data (0 - 5 cm Results) a. Grid Line Geometry
Minimum Maximum Spacing # of Lines
X Axis (Longitude) -79.36o -78.9o .001o 461
Y Axis (Latitude) 42.85o 43.05o .001o 201
Matrix Smoothing - weighted method, matrix centre weight = 2, rows & columns on either side = 1, distance weighting power = 2
b. Copper Contours: 85, 100, 150, 200, 250, 300, 350, 400, 45085, 300 (Table A & F)
Cobalt Data (0 - 5 cm Results) a. Grid Line Geometry
Minimum Maximum Spacing # of Lines
X Axis (Longitude) -79.36o -78.9o .001o 461
Y Axis (Latitude) 42.85o 43.05o .001o 201
Matrix Smoothing - weighted method, matrix centre weight = 2, rows & columns on either side = 1, distance weighting power = 2
b. Cobalt Contours: 21, 50, 10021, 50 (Table A & F)
Report No. SDB-032-3511-2000 60

Arc View
Base Map
A base map was created using CanMap Ontario Streetfile themes Hamilton-Niagara Roads, Ontario Major Roads, Ontario Highways, Hydrography, and Hamilton-Niagara Wetlands. To this was added all of the stations sampled in 1998 by importing the station co-ordinates and related information from the PIMS database. This base map was used as the underlying map for all other maps.
Importation and Conversion
Each of the DXF export files from Surfer were added to the base map view as DXF themes and were then converted to Arc View shape files. The DXF themes were then deleted.
Subtraction of Hydrographic Layer
The DXF export did not support polygons with holes in them but sent over the main polygon with the holes represented as separate, smaller polygons. This meant that when the DXF themes were converted to shape themes, the holes had to be created by subtracting the smaller polygons from the larger polygons. If the resultant polygon overlapped with ‘Lake Erie’ or the Welland Canal, these were subtracted from the polygon in a mid-step process. Smalllakes, ponds and marsh areas were not subtracted from the contour polygons.
Calculation of Area
The area of all of the polygons that made up the Table A and Table Fd polygpons for nickel, copper and colbalt were calculated using the ArcView script “View.CalculateAcreage’. The areas calculated were for the coloured areas in the legend (i.e. “Table F” area includes the area that exceeds the Table F soil criterion but not the Table A guideline).
Final Maps
A separate ArcView layout was produced for each of the maps and consisted of a base map, sampling stations, contour polygons, scale, compass, title, legend and symbol for the INCO refinery stack. Sampling stations were only labeled at locations of interest with reesect to the contour polygons. These layouts were used to print the final maps.
Report No. SDB-032-3511-2000 61

Appendix E List of MOE Phytotoxicology reports of investigations conducted in the vicinity of INCO, Port Colborne (excluding investigations on private property conducted at the owner’s request).
Ontario Ministry of the Environment, Phytotoxicology Section. Vegetation Surveillance Northeast of International Nickel Co. Refinery, Port Colborne, July 1972.
Ontario Ministry of the Environment, Phytotoxicology Section. Phytotoxicology Surveys Conducted in the Vicinity of the International Nickel Company, Port Colborne, Ontario, 1969 - 1974.
Ontario Ministry of the Environment, Air Resources Branch, Phytotoxicology Section. Phytotoxicology Surveys in the Vicinity of International Nickel Co., Port Colborne - 1975.
Ontario Ministry of the Environment, Air Resources Branch, Phytotoxicology Section. Phytotoxicology Surveys in the Vicinity of International Nickel Co., Port Colborne - 1976.
Ontario Ministry of the Environment, Air Resources Branch, Phytotoxicology Section. Phytotoxicology Surveys in the Vicinity of International Nickel Co., Port Colborne - 1977.
Ontario Ministry of the Environment, Air Resources Branch, Phytotoxicology Section. Nickel and Other Metals in Vegetation in the Vicinity of International Nickel Company (INCO), Port Colborne - 1978.
Ontario Ministry of the Environment, Air Resources Branch, Phytotoxicology Section. Phytotoxicology Surveys in the Vicinity of the INCO Refinery, Port Colborne, 1979-1980.
Rinne, R.J. 1983. Contamination of Vegetation by Nickel and Other Elements in the Vicinity of INCO Limited, Port Colborne - 1981. Ontario Ministry of the Environment, Air Resources Branch, Phytotoxicology Section. Report Number ARB-24-83-Phyto.
Rinne, R.J. 1983. Contamination of Vegetation by Nickel and Other Elements in the Vicinity of INCO, Port Colborne - 1982. Ontario Ministry of the Environment, Air Resources Branch, Phytotoxicology Section. Report Number ARB-195-83-Phyto.
Rinne, R.J. 1985. Contamination of Vegetation by Nickel and Other Elements in the Vicinity of INCO, Port Colborne - 1983, 1984. Ontario Ministry of the Environment, Air Resources Branch, Phytotoxicology Section. Report Number ARB-117-85-Phyto.
Rinne, R.J. 1989. Phytotoxicology Assessment Surveys in the Vicinity of INCO Ltd., Port Colborne - 1985, 1986. Ontario Ministry of the Environment, Air Resources Branch, Phytotoxicology Section. Report Number ARB-00188-Phyto.
McLaughlin, D., Bisessar, S. 1994. Phytotoxicology Survey Report: International Nickel Company Limited, Port Colborne - 1991. Ontario Ministry of the Environment, Standards Development Branch, Phytotoxicology Section. Report Number SDB-003-3512-92.
Kuja, A., Jones, R., McIlveen, W., McLaughlin, D. 1999. Phytotoxicology Soil Investigation: INCO -Port Colborne. Ontario Ministry of the Environment, Standards Development Branch, Phytotoxicology Section. Report Number SDB-031-3511-1999.
Report No. SDB-032-3511-2000 62

63
ð
%U
%U
%U
%U
%U%U
%U
%U
%U
%U
%U %U
%U%U%U%U%U
%U%U
%U
%U %U
%U
##
## ###
#
# ##
#
#
#
##
#
##
##
#
#
#
#
#
## #
#####
#
#
# # # ##
# ##
#
#
#
#
##
##
# # ## # # #
#
###
#
#
#
(X
(X
(X
(X(X
(X(X (X
(X (X (X(X
(X (X(X
(X
(X
(X (X
(X (X (X (X (X(X (X
(X
(X (X (X (X (X
(X(X
(X
(X
(X
(X (X (X (X(X
(X(X
(X(X(X
(X
(X
(X (X (X
(X
(X
(X
(X(X
(X
(X(X(X
(X
(X
&V&V
&V&V
&V&V&V&V
&V&V&V&V&V
&V&V
&V
&V
&V
&V
&V
&V
&V
&V
&V
&V&V
&V&V
&V
&V
&V
&V
&V
&V
&V &V
&V
&V
&V
&V
&V
&V &V
&V
&V
&V
&V
HIG
HWA
Y 14
0
GARRISON RD W
HIG
HWA
Y 14
0
ST
EV
EN
SV
ILLE
RD
PO
INT
AB
INO
RD
N
NETHERBY RD
DO
AN
'S R
IDG
E R
D
WE
ST
SID
E R
D
FORKES RD E
3 CONCESSION RD
2 CONCESSION RD
MAIN ST E
YA
GE
R R
DY
AG
ER
RD
MAIN ST E
QUEEN ELIZABETH WAY
H32
H31
H29
H30
H33
H1
H11
H2
H10H14
H24
H25
H8
H28
219 220 221
222 224
223
225226
228
227
196
214215216
213
195
217218
206204
212211
210209208
199
190
184
232185
186
230
193192191
200 201
194
231
205202
203
78
77
56
40
41
54
76
79 80
75 74
58
42
59
30
81 82
23
91 90
83
159
71
15 1620 44
4847
65
64 66 67
46
68
69
87
88
70
5239 55 53
72 19
84
89
86
45
49
6263
50
4314
85
H12
H13H10
73
170172
171N
EW
S
Map 1: Regional Sampling Locations
%U Soil Profile (0-5, 5-10, 10-15 cm), 1998Surface (0-5 cm), Historical Surveys&
#S Surface (0-5 cm), 1998#S Surface (0-5 cm), 1999
LAKE ERIE
Welland
Niagara Falls
0 2 4 6
Scale in Kilometers

%U
%U
%U
%U
%U
%U
%U
%U
%U
%U
%U %U%U
%U
##
#
# #
#
#
#
# #
#
#
#
#
#
#
# #
#
#
#
#
#
#
#
# #
#
#
#
#
(X
(X
(X
(X
(X
(X
(X (X
(X (X (X
(X
(X (X
(X
(X
(X (X
(X (X (X (X (X
(X (X
(X (X (X
(X
(X
(X
(X
(X
(X (X
(X (X
(X
(X
(X
(X
&V&V&V&V&V
&V&V
HIG
HW
AY14
0
SN
ID E
R R
D
LOR
RA
INE
RD
ELI
ZAB
ETH
ST
ELM
ST
W E
ST
SID
E R
D
MIN
OR
RD
AU
GU
ST
INE
RD
KILLALY ST W
BARRICK RD
MAIN ST E
170
171
172
173
174 175
176 177
178 179 180 181
182 183
184
187 188
189
190 191 192
197
198
199 200
202
203
205
206
207 208
209 210
232
3
4
11
12
14 17
33
37
43
505153
72
12
5
6 7
8
9
10
15 16
23
25
26
27
28
29 30
31 32
34
35
36
38
42
52
59 60
61
73
150
151
H38 H37 H36
#
229
#
H40
#
H39
#
H34 # H35#
24
Map 2: City Sampling Locations (Port Colborne)
LAKE ERIE
N
EW
S
%U Soil Profile (0-5, 5-10, 10-15 cm), 1998 Surface (0-5 cm), Historical Surveys&
#S Surface (0-5 cm), 1998 #S Surface (0-5 cm), 1999
64

65
(X
&
&
& &
& & & &
&
&
&
&
&
&
&&
&
&
&
&
&
&
&
& &
&
&
H48
H47
H28
H27
H26
H25
H24
H23
H20
H19
H18
H17
H16
H15
H8
H7 H6
H5
H3
219
EAST MAIN
THOROLD
FITCH
LINCOLN
KIN
G
406
& 5
8
WOODLAWN
ONTARIO
RIC
E
H46
H44H43
H42 H41
H21
H45
H22
N
EW
S
Surface (0-5 cm), Historical Surveys&
#S Surface (0-5 cm), 1999
Map 3: City Sampling Locations (Welland)
0 0.5 1 1.5 2
Scale in Kilometers

66
ð
%U
%U
%U
%U
%U%U
%U
%U
%U
%U %U
%U%U%U%U
%U%U
%U
%U %U
%U
##
## #
##
#
# ##
#
#
#
##
#
##
##
#
#
#
#
## #
#####
#
# # # ##
# ##
#
#
#
#
##
## # # #
#
###
#
#
#
(X
(X
(X
(X(X
(X(X (X
(X (X (X (X
(X (X
(X
(X
(X
(X (X
(X (X (X (X (X(X (X
(X
(X (X (X (X (X
(X(X
(X
(X
(X
(X (X (X (X(X
(X(X
(X(X(X
(X
(X
(X (X (X
(X
(X
(X
(X(X
(X
(X(X(X
(X
(X
&V&V
&V&V
&V&V&V&V
&V&V&V&V&V
&V&V
&V
&V
&V
&V
&V
&V
&V
&V
&V
&V&V
&V&V
&V
&V
&V
&V
&V
&V
&V &V
&V
&V
&V
&V
&V
&V &V
&V
&V
&V
&V
HIG
HWA
Y 14
0
GARRISON RD W
HIG
HWA
Y 14
0
ST
EV
EN
SV
ILLE
RD
PO
INT
AB
INO
RD
N
NETHERBY RD
DO
AN
'S R
IDG
E R
D
WE
ST
SID
E R
D
FORKES RD E
3 CONCESSION RD
2 CONCESSION RD
MAIN ST E
YA
GE
R R
DY
AG
ER
RD
MAIN ST E
QUEEN ELIZABETH WAY
N
EW
S 0 1 2 3 4 5
Scale in Kilometers
Map 4: Nickel in Surface (0-5 cm) Soil Port Colborne 1998 - 1999
%U Soil Profile (0-5, 5-10, 10-15 cm), 1998Surface (0-5 cm), Historical Surveys&
#S Surface (0-5 cm), 1998#S Surface (0-5 cm), 1999
43 to 100 ug/g Ni 1000 to 2000 ug/g Ni100 to 200 ug/g Ni 2000 to 3000 ug/g Ni200 to 500 ug/g Ni 3000 to 4000 ug/g Ni500 to 1000 ug/g Ni 4000 to 5000 ug/g Ni
LAKE ERIE
Welland
Niagara Falls
43 ug/g Ni (1998) 200 ug/g Ni (1998)

%U
%U
%U
%U
%U
%U
%U
%U
%U
%U
%U
$T
$T
$T
$T
$T
$T
$T
$T
$T
$T $T
$T
##
#
# #
#
#
#
#
#
#
#
#
#
#
#
#
#
#
#
#
#
#
#
#
(X
(X
(X
(X
(X
(X (X
(X
(X (X (X (X
(X
(X (X
(X (X
(X
(X
(X
&V&V
&V&V&V
&V&V S
NI D
ER
R D
LOR
RA
INE
RD
ELI
ZA
BE
TH S
T
ELM
ST
BARRICK RD
MAIN ST E
MIL
LER
RD
KILLALY ST E
Map 5: Copper in Surface (0-5 cm) Soil Port Colborne 1998 - 1999
%U Soil Profile (0-5, 5-10, 10-15 cm), 1998 Surface (0-5 cm), Historical Surveys&
#S Surface (0-5 cm), 1998 #S Surface (0-5 cm), 1999
85 to 100 ug/g Cu
100 to 150 ug/g Cu
150 to 200 ug/g Cu
200 to 250 ug/g Cu
250 to 300 ug/g Cu
300 to 350 ug/g Cu
350 to 400 ug/g Cu
400 to 450 ug/g Cu
LAKE ERIE
N
EW
S 0 0.5 1 1.5
Scale in Kilometers
67

%U
%U
%U
%U
%U
%U
%U
%U
%U
%U %U
##
#
# #
#
#
#
#
#
#
#
#
#
#
#
#
#
#
#
#
#
#
#
#
(X
(X
(X
(X
(X
(X (X
(X
(X (X (X (X
(X
(X (X
(X (X
(X
(X
(X
&V&V
&V&V&V
&V&V S
NI D
ER
R D
LOR
RA
INE
RD
ELI
ZA
BE
TH S
T
ELM
ST
BARRICK RD
MAIN ST E
MIL
LER
RD
KILLALY ST E
Map 6: Cobalt in Surface (0-5 cm) Soil Port Colborne 1998 - 1999
%U Soil Profile (0-5, 5-10, 10-15 cm), 1998 Surface (0-5 cm), Historical Surveys&
#S Surface (0-5 cm), 1998 #S Surface (0-5 cm), 1999
21 to 50 ug/g Co
50 to 100 ug/g Co
100 to 150 ug/g Co
LAKE ERIE
N
EW
S 0 0.5 1 1.5
Scale in Kilometers
68

69
%U
%U
%U
%U
%U
%U
%U
%U
%U
%U
%U
%U%U
%U
%U
%U
%U%U
%U
$T
$T
$T
$T
$T
$T
$T
$T
$T
$T
$T$T$T
$T$T
$T
$T $T
$T
$T
##
## #
#
#
#
##
#
#
#
#
#
#
#
##
#
#
#
#
#
#
#
###
##
##
#
#
#
#
#
#
# # # #
##
#
#
#
(X
(X
(X
(X
(X(X
(X (X
(X (X (X (X
(X(X
(X
(X
(X
(X (X
(X(X (X (X (X
(X (X
(X(X (X
(X (X
(X
(X
(X
(X
(X
(X(X
(X (X
(X
(X(X
(X(X
(X
(X
(X
(X
(X
(X
&V&V&V&V&V
&V&V
HIG
HW
AY
140
SN
IDE
R R
D
LO
RR
AIN
E R
D
ELI
ZA
BE
TH
ST
ELM
ST
WE
ST
SID
E R
D
MIN
OR
RD
AU
GU
ST
INE
RD
KILLALY ST W
BARRICK RD
LAKESHORE RD
MAIN ST E
Map 7: Nickel Table A and F Port Colborne 1998 - 1999
%U Soil Profile (0-5, 5-10, 10-15 cm), 1998Surface (0-5 cm), Historical Surveys&
#S Surface (0-5 cm), 1998#S Surface (0-5 cm), 1999
LAKE ERIE
N
EW
S 0 1 2 3
Scale in Kilometers
Table F (43 ug/g Ni), 316 sq. kilometersTable A (200 ug/g Ni), 28.6 sq. kilometers
1998 Nickel Table F Contour1998 Nickel Table A Contour

%U
%U
%U
%U
%U
%U
%U
%U
%U
%U
%U
%U
$T
$T
$T
$T
$T
$T
$T
$T
$T
$T $T
$T
$T
##
#
# #
#
#
#
#
#
#
#
#
#
#
#
#
#
#
#
#
#
#
#
#
(X
(X
(X
(X
(X
(X (X
(X
(X (X (X (X
(X
(X (X
(X (X
(X
(X
(X
&V&V
&V&V&V
&V&V S
NI D
ER
R D
LOR
RA
INE
RD
ELI
ZA
BE
TH S
T
ELM
ST
BARRICK RD
MAIN ST E
MIL
LER
RD
KILLALY ST E
0 0.5 1 1.5
Scale in Kilometers
N
EW
S LAKE ERIE
Map 8: Copper in Surface (0-5 cm) Soil Port Colborne 1998 - 1999
%U Soil Profile (0-5, 5-10, 10-15 cm), 1998 Surface (0-5 cm), Historical Surveys&
#S Surface (0-5 cm), 1998 #S Surface (0-5 cm), 1999
Table F (85 ug/g Cu), 7.7 sq. kilometers
Table A (300 ug/g Cu), 0.2 sq. kilometers
70

%U
%U
%U
%U
%U
%U
%U
%U
%U
%U %U
%U
##
#
# #
#
#
#
#
#
#
#
#
#
#
#
#
#
#
#
#
#
#
#
#
(X
(X
(X
(X
(X
(X (X
(X
(X (X (X (X
(X
(X (X
(X (X
(X
(X
(X
&V&V
&V&V&V
&V&V
S N
I DE
R R
D
LOR
RA
INE
RD
ELI
ZA
BE
TH S
T
ELM
ST
BARRICK RD
MAIN ST E
MIL
LER
RD
KILLALY ST E
0 0.5 1 1.5
Scale in Kilometers
N
EW
S LAKE ERIE
Map 9: Cobalt Table A and F Port Colborne 1998 - 1999
%U Soil Profile (0-5, 5-10, 10-15 cm), 1998 Surface (0-5 cm), Historical Surveys&
#S Surface (0-5 cm), 1998 #S Surface (0-5 cm), 1999
Table F (21 ug/g Co), 6.4 sq. kilometers
Table A (50 ug/g Co), 0.8 sq. kilometers
71