Embed Size (px)
Citation preview

Estuarine, Coastal and Shelf Science (1987) 24,813-832
Phytoplankton Productivity in Relation to Light Intensity: A Simple Equation
D. H. Petersod, M. J. Perryb, K. E. Bencala' and M. C. Talbotb U.S. Geological Survey, 345 Middlejield Road, Menlo Park, California 94025
U.S.A. and bSchool of Oceanography WB-10, University of Washington, Seattle, Washington 981 95 U.S.A.
Received 24 September 1983 and in revised form 17 March 1986
Keywords: photosynthesis; light intensity; models
A simple exponential equation is used to describe photosynthetic rate as a func- tion of light intensity for a variety of unicellular algae and higher plants where photosynthesis is proportional to (1 -e-8'). The parameter (= Zk-') is derived by a simultaneous curve-fitting method, where I is incident quantum-flux density. The exponential equation is tested against a wide range of data and is found to adequately describe P vs. I curves. The errors associated with photo- synthetic parameters are calculated. A simplified statistical model (Poisson) of photon capture provides a biophysical basis for the equation and for its ability to fit a range of light intensities. The exponential equation provides a non- subjective simultaneous curve fitting estimate for photosynthetic efficiency (a) which is less ambiguous than subjective methods: subjective methods assume that a linear region of the P vs. I curve is readily identifiable. Photosynthetic parameters j3 and a are used widely in aquatic studies to define photosynthesis at low quantum flux. These parameters are particularly important in estuarine environments where high suspended-material concentrations and high diffuse- light extinction coefficients are commonly encountered.
Introduction
Marine primary production is responsible for at least 30% of total global carbon fixation. As such, it occupies a key position in any assessment of the global carbon cycle or pertur- bations in that cycle. Photosynthesis consists of two basic reactions: a photochemical reaction whereby electromagnetic energy is converted to biochemical energy and a bio- chemical reaction whereby biochemical energy is utilized to synthesize reduced carbon compounds. Whereas the basic components of these reactions have been delineated, many of the specific reactions and aspects of the controlling mechanisms are as yet poorly known or understood. There is, however, wide ranging interest in developing mathematical models of photosynthesis in general (Farquhar & Caemmerer, 1983) and for marine and estuarine primary production in response to environmental variables in particular.
The three major environmental variables that control photosynthesis are light, tem- perature, and some function of nutrient availability. Perhaps the greatest attention has been given to light. For example, the rate of photosynthesis is a function of light over a
813
0272-7714/87/060813+ 20 $03.00/0 0 1987 Academic Press Inc. (London) Limited
814 D. H . Peterson et al.
certain range of low to intermediate light intensities, but is essentially independent of light intensity over a second range of intermediate to high light intensities (which support maximal rates of photosynthesis), and can be photoinhibited at high light intensities. A number of empirical mathematical formulations, ranging from simple equations to com- plex multiparameter equations have been used to describe photosynthesis as a function of light intensity.
These equations have found broad applications ranging from describing crop produc- tion (Monteith, 1979; Band et al., 1981) to estimating photosynthetic oxygen production or carbon assimilation by phytoplankton (Platt et al., 1977; Woods & Onken, 1982).
In this paper, photosynthesis vs. light intensity ( P vs. I> is described using a simple exponential equation of the form (1 - e-PI), where the parameter is empirically derived and Z is the incident quantum-flux density (light intensity). Various formulations of the equation have been used to describe the photosynthesis of trees (Webb et al., 1974), algae associated with coral reefs (Chalker, 1981), calcification of corals in relation to light intensity (Grans & Macintyre, 1976), marine phytoplankton (Platt et al., 1980), and estuarine phytoplankton where the photic depth is very shallow (Peterson et al., in press). More complex higher order equations, with more variables, may provide better fits to P vs. I data. However, this exponential equation appears to be a close fit-with so few parameters-to a wide variety of data.
This paper describes the equation to fit P vs. I curves with a minimum number of parameters. The equation is tested against laboratory and field data from a wide variety of species and conditions to determine if, and how well, it accommodates such a range. The errors associated with the equation functions are computed for the calibration data. A physical model, based on photon capture, is described, The photon-incidence model (Poisson) suggests that there is a biophysical basis for the equation and that one exponen- tial curve should adequately fit the whole range of light intensities (up to light-inhibition intensities). The use of a simple linear regression to determine the initial slope of the Pvs. Z curve, the photosynthetic efficiency (PSE) or a, may actually underestimate light capture efficiency at low photon flux. Understanding photosynthetic responses to low light intensities is crucial to understanding estuarine photosynthesis and carbon flux because water-column light attenuation by suspended organic and inorganic particles is severe in many estuaries (cf. Peterson & Festa, 1984).
Methods and results
Empirical exponential equation describing P vs. I curves The quantitative relation between gross rates of photosynthetic performance (oxygen production or carbon assimilation) and light intensity is described by the exponential equation:
PGI~Gmax = I - e-p' (1)
where PGmax is the maximum gross photosynthetic capacity, PG is the photosynthetic performance at Z, Z is the incident light intensity, and is a derived constant for the data set (see below). When respiration, R , is defined as negative carbon assimilation (i.e. PG = PN -R) , the relationship may also be expressed, perhaps more usefully, as:
Phytoplankton productivity 815
Light Intensity 0
A h 0
a .- Y
$a3 > % :K ‘Nrnax ‘Gmax 0 r n
c
(+)
0 V
(-) - Y
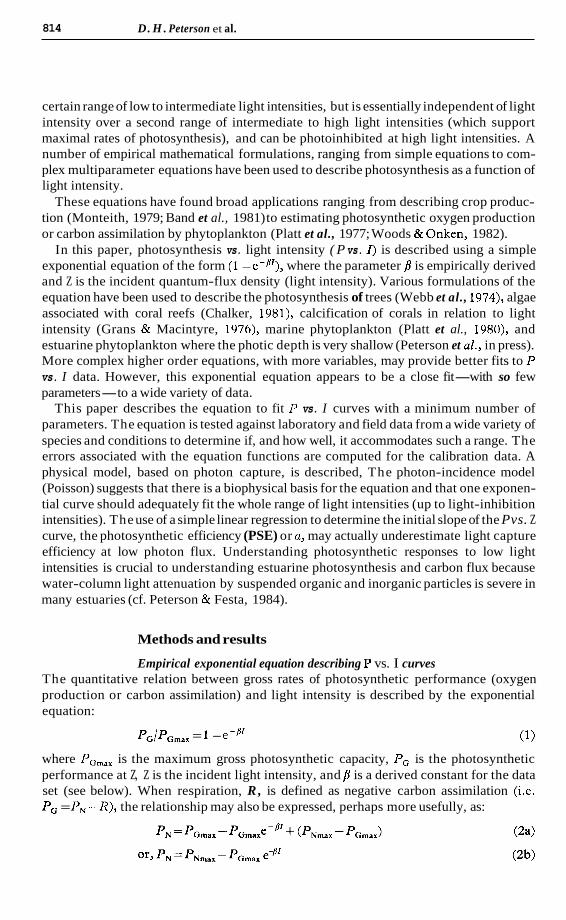
Figure 1 . Photosynthetic rate (in relative units) as a function of light intensity. Following equation (2), PNmar is the net photosynthesis and PG,,, is the gross photosynthesis.
where P, is now the observed or net productivity and an estimate of the respiration rate (or net loss of carbon) is incorporated as the difference in the derived constants PNmax- PGmax (Figure 1). The constants PNmax, PGmax, and /I, and their percentage relative standard errors were estimated using an exponential least squares method (see Appendix).
Using equation (2), the empirically observed values of net oxygen and carbon pro- ductivity were related to light intensity. Effects of light inhibition are not described by equations (1) and (2) and are not evaluated. In a few instances, lower productivity values were observed at higher light intensities than the intensity of maximum productivity, suggesting slight photoinhibition. These lower rates were set equal to the value of maximum productivity for this evaluation.
Relative standard error is the standard error divided by the value of the derived parameter and multiplied by 100 (the coefficient of variation, CV). Using the data of Irwin et al. (1979, the square of relative standard error (CV)2 estimates of the parameter p were found to have a near-linear relation to R2 (the ratio of the sum of the squares to total sum of the squares):
(3)
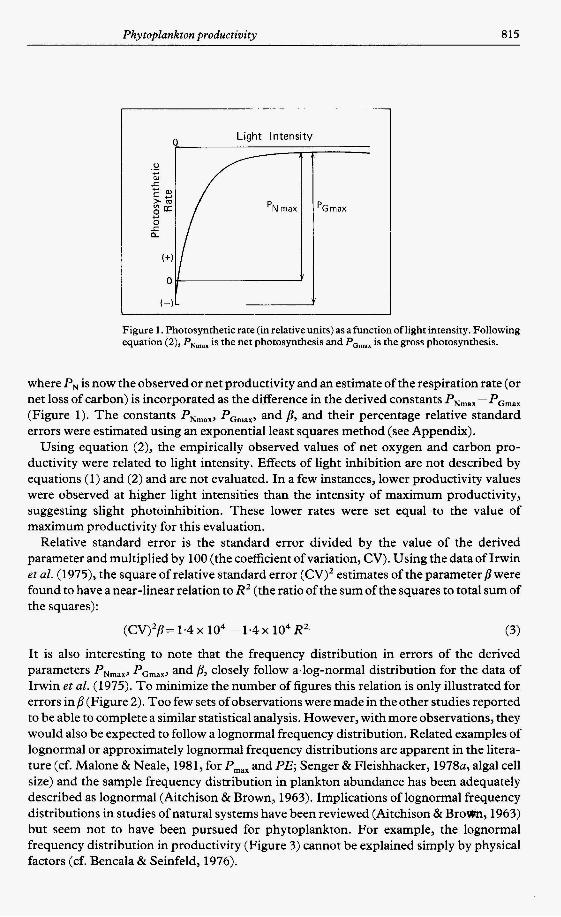
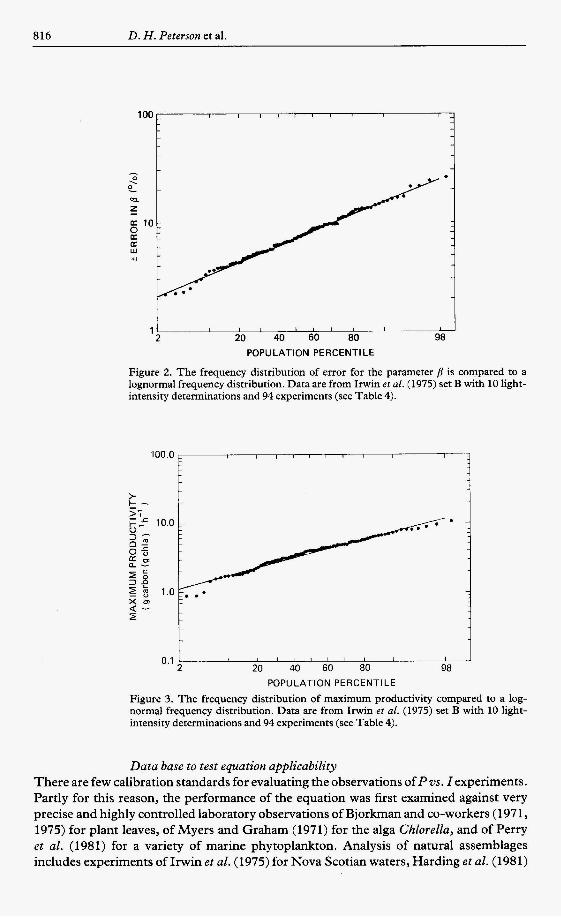
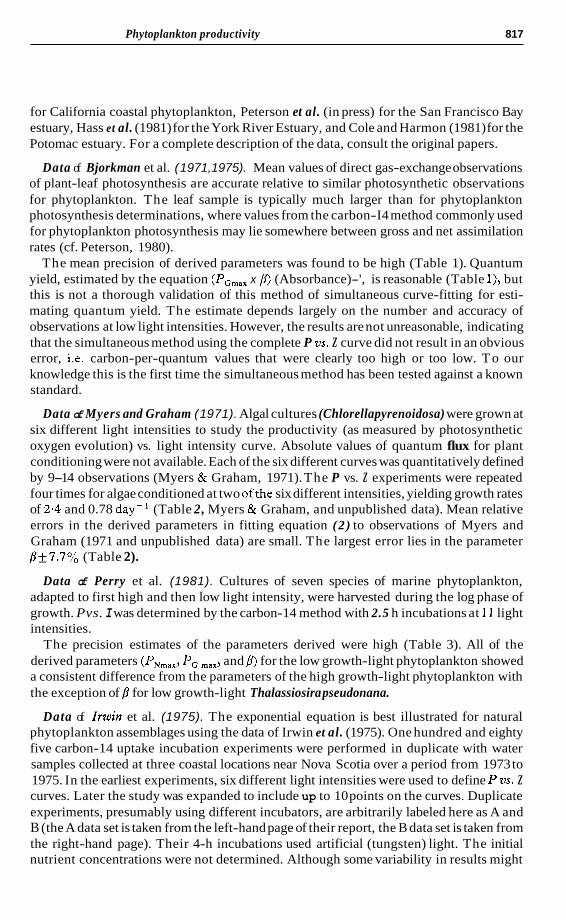
It is also interesting to note that the frequency distribution in errors of the derived parameters PNmax, PGmax, and B, closely follow a.log-normal distribution for the data of Irwin e t al. (1975). To minimize the number of figures this relation is only illustrated for errors i np (Figure 2). Too few sets of observations were made in the other studies reported to be able to complete a similar statistical analysis. However, with more observations, they would also be expected to follow a lognormal frequency distribution. Related examples of lognormal or approximately lognormal frequency distributions are apparent in the litera- ture (cf. Malone & Neale, 1981, for P,,, and PE; Senger & Fleishhacker, 1978a, algal cell size) and the sample frequency distribution in plankton abundance has been adequately described as lognormal (Aitchison & Brown, 1963). Implications of lognormal frequency distributions in studies of natural systems have been reviewed (Aitchison & Brom, 1963) but seem not to have been pursued for phytoplankton. For example, the lognormal frequency distribution in productivity (Figure 3) cannot be explained simply by physical factors (cf. Bencala & Seinfeld, 1976).
(cv)2p= 1.4 x 10⁴ - 1.4 x 10⁴ RZ
816 D. H . Peterson et al.
100.0 I I I I I I I I I -
> k -
-
- X m 1
> a -
I I I I I I I I I 1 - 0.1
loo 1
W +I
c
20 40 60 80 98 1
2 POPULATION PERCENTILE
Figure 2. The frequency distribution of error for the parameter /l is compared to a lognormal frequency distribution. Data are from Irwin et al. (1975) set B with 10 light- intensity determinations and 94 experiments (see Table 4).
Data base to test equation applicability There are few calibration standards for evaluating the observations of P vs. Z experiments. Partly for this reason, the performance of the equation was first examined against very precise and highly controlled laboratory observations of Bjorkman and co-workers (197 1 , 1975) for plant leaves, of Myers and Graham (1971) for the alga Chlorella, and of Perry et al. (1981) for a variety of marine phytoplankton. Analysis of natural assemblages includes experiments of Irwin et al. (1975) for Nova Scotian waters, Harding e t al. (1981)
Phytoplankton productivity 817
for California coastal phytoplankton, Peterson et al. (in press) for the San Francisco Bay estuary, Hass et al. (1981) for the York River Estuary, and Cole and Harmon (1981) for the Potomac estuary. For a complete description of the data, consult the original papers.
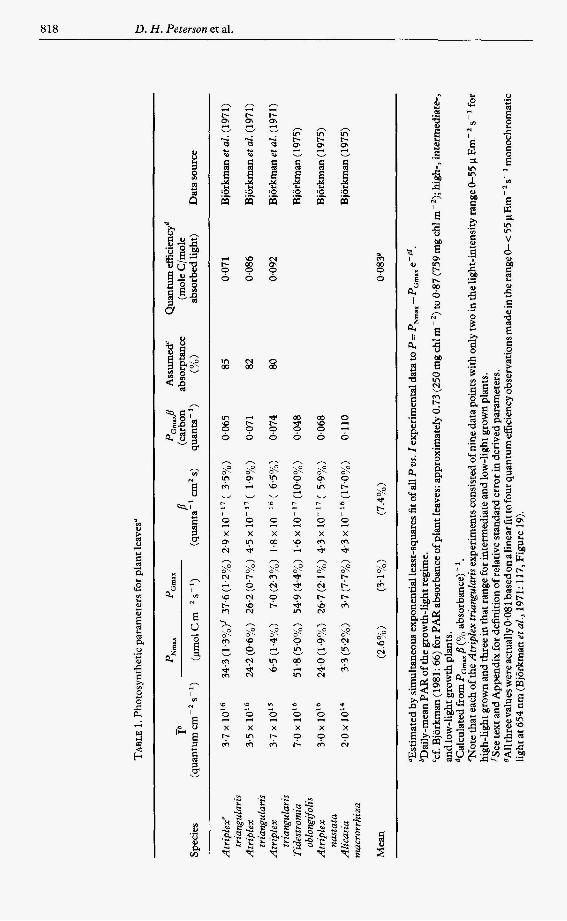
Data of Bjorkman et al. (1 971,1975). Mean values of direct gas-exchange observations of plant-leaf photosynthesis are accurate relative to similar photosynthetic observations for phytoplankton. The leaf sample is typically much larger than for phytoplankton photosynthesis determinations, where values from the carbon-I4 method commonly used for phytoplankton photosynthesis may lie somewhere between gross and net assimilation rates (cf. Peterson, 1980).
The mean precision of derived parameters was found to be high (Table 1). Quantum yield, estimated by the equation (PGmax x /3) (Absorbance)-', is reasonable (Table l), but this is not a thorough validation of this method of simultaneous curve-fitting for esti- mating quantum yield. The estimate depends largely on the number and accuracy of observations at low light intensities. However, the results are not unreasonable, indicating that the simultaneous method using the complete P vs. Z curve did not result in an obvious error, i.e. carbon-per-quantum values that were clearly too high or too low. T o our knowledge this is the first time the simultaneous method has been tested against a known standard.
Data of Myers and Graham (1 971). Algal cultures (Chlorellapyrenoidosa) were grown at six different light intensities to study the productivity (as measured by photosynthetic oxygen evolution) vs. light intensity curve. Absolute values of quantum flux for plant conditioning were not available. Each of the six different curves was quantitatively defined by 9-14 observations (Myers & Graham, 1971). The P vs. Z experiments were repeated four times for algae conditioned at two ofthe six different intensities, yielding growth rates of 2 4 and 0.78 day-' (Table 2, Myers & Graham, and unpublished data). Mean relative errors in the derived parameters in fitting equation (2 ) to observations of Myers and Graham (1971 and unpublished data) are small. The largest error lies in the parameter /3+7.7% (Table 2).
Data of Perry et al. (1981). Cultures of seven species of marine phytoplankton, adapted to first high and then low light intensity, were harvested during the log phase of growth. Pvs. I was determined by the carbon-14 method with 2.5 h incubations at 11 light intensities.
The precision estimates of the parameters derived were high (Table 3). All of the derived parameters (PNmax, P, and /3) for the low growth-light phytoplankton showed a consistent difference from the parameters of the high growth-light phytoplankton with the exception of p for low growth-light Thalassiosira pseudonana.
Data of Irwin et al. (1975). The exponential equation is best illustrated for natural phytoplankton assemblages using the data of Irwin et al. (1975). One hundred and eighty five carbon-14 uptake incubation experiments were performed in duplicate with water samples collected at three coastal locations near Nova Scotia over a period from 1973 to 1975. In the earliest experiments, six different light intensities were used to define P vs. Z curves. Later the study was expanded to include up to 10 points on the curves. Duplicate experiments, presumably using different incubators, are arbitrarily labeled here as A and B (the A data set is taken from the left-hand page of their report, the B data set is taken from the right-hand page). Their 4-h incubations used artificial (tungsten) light. The initial nutrient concentrations were not determined. Although some variability in results might
TA
BL
E
1. P
hoto
synt
hetic
par
amet
ers f
or p
lant
leav
es”
PN
mar
P
Gm
ar
PG
m,J
A
ssum
ed‘
Qua
ntum
eff
icie
ncyd
T
b
B (c
arbo
n ab
sorp
tanc
e (m
ole C
/mol
e ab
sorb
ed li
ght)
D
ata
sour
ce
Spec
ies
(qua
ntum
cm
-’s-
’)
(pm
ol c
m-2
s-1
) (q
uant
a-’
cmz s
) qu
anta
-’)
(yo)
Atr
iple
x‘
3.7
x 1O
I6
34.3
(1.3
%)’
37.6
(1.2
%)
2.9
x (
33
%)
0.06
5 85
0.
071
Bjo
rkm
an et
al.
(197
1)
tria
ngul
aris
A
trip
lex
3.5
x 1
0l6
24
.2 (0
.6%
) 26
.2 (0
.7%
) 4.
5 x
lo-’’
(
1.9%
) 0.
071
82
0.08
6 B
jork
man
et a
l. (1
971)
tra
angu
lara
s A
trip
lex
3.7
x 10
15
65
(1.4
%)
7.0
(2.3
%)
1.8
x (
63
%)
0.07
4 80
0.
092
Bjo
rkm
an et
al.
(197
1)
tria
ngul
aris
Ti
dest
rom
ia
7.0
x 1
0l6
51
.8 (5
.0%
) 54
.9 (4
.4%
) 1
.6~
lo
-’’
(10.
0%)
0.04
8 B
jork
man
(197
5)
oblo
ngifo
lis
Atr
iple
x 3.
0 x
10l6
24
.0 (
1.9%
) 26
.7 (
2.1%
) 4.
3 x
( 5.
9y0)
0.
068
Bjo
rkm
an (1
975)
na
stat
a A
bcas
ia
2.0
x 1
0i4
3.
3 (5
.2%
) 3.
7 (7
.7%
) 4.
3 x
(17.
0%)
0.11
0 B
jork
man
(197
5)
mac
rorr
haza
Mea
n (2
.6%
) (3
.1%
) (7
.4%
) 0.
083#
“Est
imat
ed by
sim
ulta
neou
s exp
onen
tial l
east
-squ
ares
fit o
f all
P ws
. Z ex
peri
men
tal d
ata t
o P
=P
Nm
ax-P
Gm
ax
e-B
r. bD
aily
-mea
n PA
R o
f the
gro
wth
-lig
ht re
gim
e.
‘cf.
Bjo
rkm
an (1
981:
66)
for P
AR
abs
orba
nce o
f pla
nt le
aves
: app
roxi
mat
ely 0
.73
(250
mg
chl m
-’)
to 0
.87
(759
mg
chl m
-2);
high
-, in
term
edia
te-,
and
low
-lig
ht g
row
th p
lant
s.
dCal
cula
ted f
rom
PG
max
B (yo
abso
rban
ce) - l
.
‘Not
e th
at e
ach
of th
e A
trip
lex
tria
ngul
aris
exp
erim
ents
cons
iste
d of n
ine
data
poi
nts w
ith o
nly
two
in th
e lig
ht-i
nten
sity
rang
e 0-5
5 p
Em
-2 s-
’ for
hi
gh-l
ight
gro
wn
and
thre
e in
that
rang
e fo
r int
erm
edia
te an
d lo
w-l
ight
gro
wn
plan
ts.
lSee
text
and
App
endi
x fo
r def
initi
on of
rela
tive s
tand
ard
erro
r in
deri
ved
para
met
ers.
B
Allt
hree
valu
es w
ere a
ctua
lly 0.
081
base
d on
a lin
ear f
it to
four
qua
ntum
effic
ienc
y obs
erva
tions
mad
e in t
he ra
nge&
< 55
pE
m-
s-
mon
ochr
omat
ic
light
at 6
54 n
m (B
jork
man
et a
l., 1
971:
117
, Fig
ure
19).
Phytoplankton productivity 819
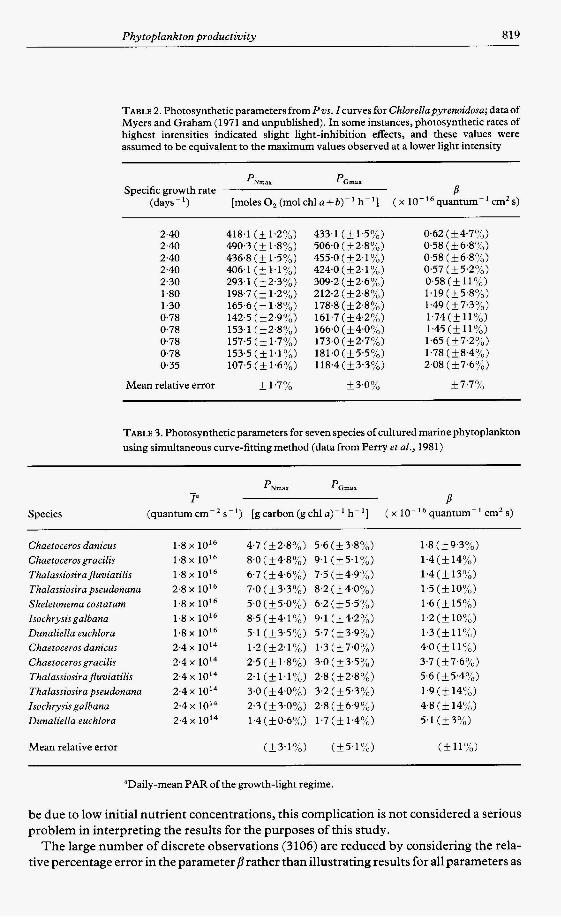
TABLE 2. Photosynthetic parameters from Pvs . I curves for Chlorellapyrenoidosa; data of Myers and Graham (1971 and unpublished). In some instances, photosynthetic rates of highest intensities indicated slight light-inhibition effects, and these values were assumed to be equivalent to the maximum values observed at a lower light intensity
PNrnar pGrnax
Specific growth rate a (days- I ) [moles 0, (mol chl a+b)-' h-'1 ( x quantum-' cmz s)
2.40 2.40 2.40 2.40 2.30 1.80 1.30 0.78 0.78 0.78 0.78 0.35
Mean relative error
418.1 ( f 1.2%) 490.3 (f 1.8%) 436.8(&1.5y0) 406.1 (&l . lyo) 293.1 (&2.3y0) 198.7 (& 1.2%) 165.6 (k 1.8%) 142.5 (f2.9%) 153.1 (f2.8Y0) 157.5 (f 1.7%) 153.5 ( & 1.1 yo) 107.5 ( & 1.6%)
+ 1.7%
433.1 (f 1.5%) 506.0 ( f 2.8%) 455.0 (f2.1%) 424.0 (+2.1%) 309.2 (& 2.6%) 212.2(*2.8%) 178.8 (+2.8%) 161.7 (f4.2y0) 166.0 (f4.0y0) 173.0 ( k2.7y0) 181.0 (&5.5y0) 118.4 (f3.3Y0)
+3.0y0
0.62 (+4.7yo) 0.58 (+6.8%) 0.58 (+6*8%) 0.57 (+5.2%) 0.58 ( f 11 Yo) 1.19(f5.8y0) 1.49 (k7.3y0) 1.74 (k 11 yo) 1.45 (& 11 yo) 1.65 (k 7.2%) 1.78 (+8.4%) 2.08 ( f 7.6%)
- +7.7y0
TABLE 3. Photosynthetic parameters for seven species of cultured marine phytoplankton using simultaneous curve-fitting method (data from Perry et al., 1981)
PNrnai PGW a -
In Species (quantum cm-' s- ') [g carbon (g chl a)-' h - '1 ( x quantum-' cm' s)
Chaetoceros danzcus Chaetoceros graczlzs Thalasszoszra puvzatzlts Thalasszoszra pseudonana Skeletonema costatum Isochrysasgalbana Dunalzella euchlora Chaetoceros danzcus Chaetocerosgraczlzs Thalassioszra fluvaatihs Thalasszoszra pseudonana Isochryszsgalbana Dunalaella euchlora
1.8 x 10l6 1.8 x 10l6 1.8 x 10l6 2.8 x 10l6 1.8 x 10l6 1.8 X 1OI6 1.8 x 1OI6 2.4 x 10¹⁴ 2.4 x 10¹⁴ 2 4 x 10¹⁴ 2.4 x 10¹⁴ 2.4 x 10¹⁴ 2.4 x 10¹⁴
1.8(&9.3%) 1.4 (k 14%) 1.4 (k 13%) 1.5 (If: 10%) 1.6 (If: 15%) 1.2 ( f 10%) 1.3 ( f 11 yo) 4.0 ( + 11 yo) 3.7 (If: 7.6%) 5.6 (f5.4%) 1.9 ( f 14%) 4.8 (If: 14%) 5.1 (k3%)
Mean relative error
"Daily-mean PAR of the growth-light regime
be due to low initial nutrient concentrations, this complication is not considered a serious problem in interpreting the results for the purposes of this study.
The large number of discrete observations (3106) are reduced by considering the rela- tive percentage error in the parameter j3 rather than illustrating results for all parameters as
820 D. H. Peterson et al.
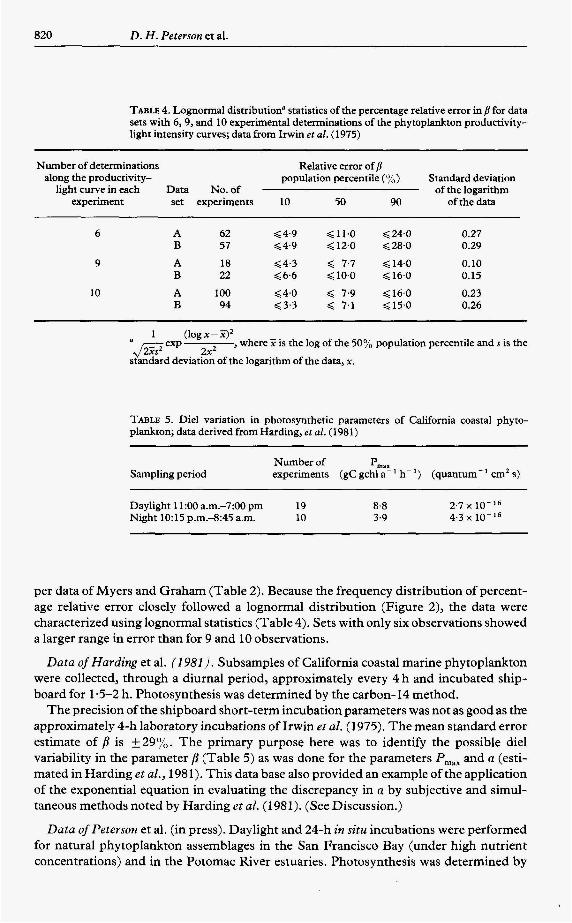
TABLE 4. Lognormal distribution” statistics of the percentage relative error in b for data sets with 6,9, and 10 experimental determinations of the phytoplankton produaivity- light intensity curves; data from Irwin er al. (1975)
Number of determinations along the productivity-
light curve in each Data No. of experiment set experiments
6 A 62 B 57
9 A 18 B 22
10 A 100 B 94
Relative error of /? population percentile (yo)
10 50 90
~ 4 . 9 G l l . 0 $24.0 g4.9 G12.0 G28.0
~ 4 . 3 < 7.7 $14.0 $6.6 G10.0 G16.0
G4.0 < 7.9 G16.0 $3.3 $ 7.1 G15.0
Standard deviation of the logarithm
of the data
0.27 0.29
0.10 0.15
0.23 0.26
1 (logx-Z)2 , where j2 is the log of the 50% population percentile and s is the
of the logarithm of the data, x .
TABLE 5. Die1 variation in photosynthetic parameters of California coastal phyto- plankton; data derived from Harding, et al. (1981)
Number of pmax Sampling period experiments (gC gchl a-’ h- ‘) (quantum-’ cm2 s)
Daylight 11:OO a.m.-7:00 pm 19 8.8 2.7 x Night 10:15 p.m.-8:45 a.m. 10 3.9 4.3 x 10- ‘6
per data of Myers and Graham (Table 2). Because the frequency distribution of percent- age relative error closely followed a lognormal distribution (Figure 2), the data were characterized using lognormal statistics (Table 4). Sets with only six observations showed a larger range in error than for 9 and 10 observations.
Data of Harding et al. (1 981). Subsamples of California coastal marine phytoplankton were collected, through a diurnal period, approximately every 4 h and incubated ship- board for 1.5-2 h. Photosynthesis was determined by the carbon-14 method.
The precision of the shipboard short-term incubation parameters was not as good as the approximately 4-h laboratory incubations of Irwin et al. (1 975). The mean standard error estimate of /l is f29%. The primary purpose here was to identify the possible die1 variability in the parameter /l (Table 5) as was done for the parameters P,,, and a (esti- mated in Harding et al., 1981). This data base also provided an example of the application of the exponential equation in evaluating the discrepancy in a by subjective and simul- taneous methods noted by Harding et al. (1981). (See Discussion.)
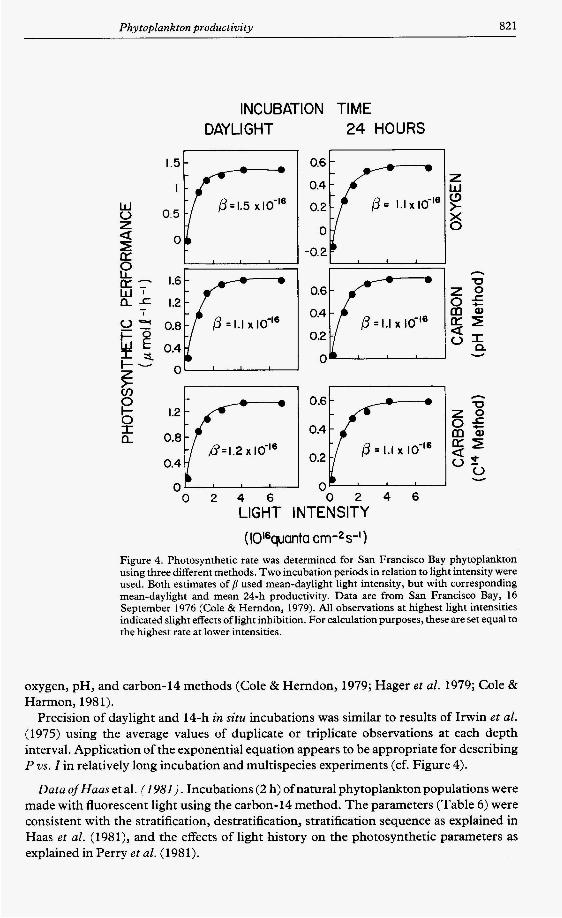
Data of Peterson et al. (in press). Daylight and 24-h in situ incubations were performed for natural phytoplankton assemblages in the San Francisco Bay (under high nutrient concentrations) and in the Potomac River estuaries. Photosynthesis was determined by
Phytoplankton productivity 821
INCUBATION TIME DAYLIGHT 24 HOURS
r 1 r I
I 1 I I I
0- -
0.8
0.4
0 0 v
0 2 4 6 0 2 4 6 LIGHT INTENSITY
(Wquanta c m - 2 s ' ) Figure 4. Photosynthetic rate was determined for San Francisco Bay phytoplankton using three different methods. Two incubation periods in relation to light intensity were used. Both estimates of B used mean-daylight light intensity, but with corresponding mean-daylight and mean 24-h productivity. Data are from San Francisco Bay, 16 September 1976 (Cole & Herndon, 1979). All observations at highest light intensities indicated slight effects of light inhibition. For calculation purposes, these are set equal to the highest rate at lower intensities.
oxygen, pH, and carbon-14 methods (Cole & Herndon, 1979; Hager et al. 1979; Cole & Harmon, 1981).
Precision of daylight and 14-h in situ incubations was similar to results of Irwin et al. (1975) using the average values of duplicate or triplicate observations at each depth interval. Application of the exponential equation appears to be appropriate for describing P vs. Z in relatively long incubation and multispecies experiments (cf. Figure 4).
Data ofHaas et al. (1 981). Incubations (2 h) of natural phytoplankton populations were made with fluorescent light using the carbon-14 method. The parameters (Table 6 ) were consistent with the stratification, destratification, stratification sequence as explained in Haas et al. (1981), and the effects of light history on the photosynthetic parameters as explained in Perry et al. (1981).
822 D. H. Peterson et al.
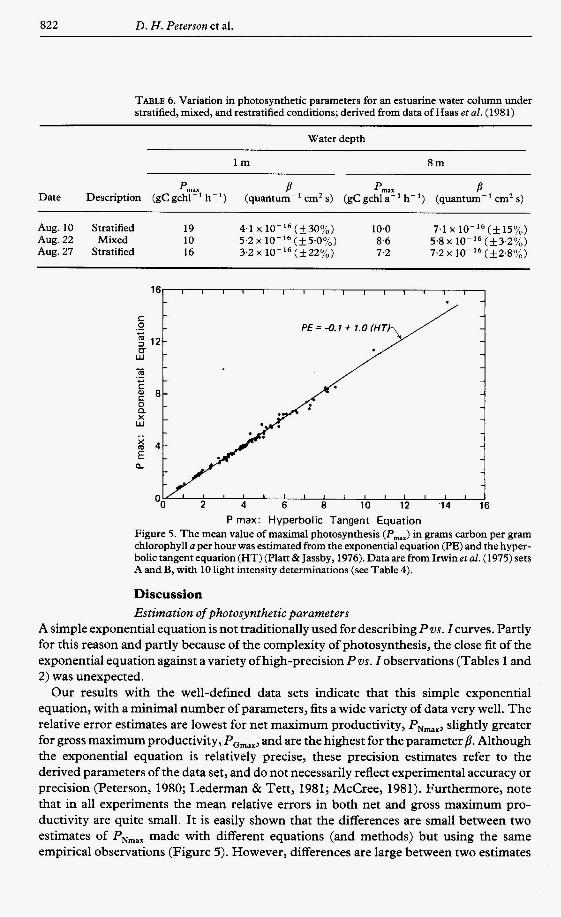
TABLE 6. Variation in photosynthetic parameters for an estuarine water column under stratified, mixed, and restratified conditions; derived from data of Haas et al. (1981)
Water depth
l m 8 m
p m a x B P m a r B Date Description (gC gchl-' h-') (quantum-' cm2 s) (gC gchl a-' h-') (quantum-' cm2 s)
Aug. 10 Stratified 19 4.1 x (+30%) 10.0 7.1 ~ 1 0 - ' ~ ( f 1 5 % ) Aug. 22 Mixed 10 5.2 x (&5.0%) 8.6 5.8 x (&3.2%) Aug. 27 Stratified 16 3.2 x (&22%) 7.2 7.2 x (&2.8%)
P rnax: Hyperbolic Tangent Equation Figure 5. The mean value of maximal photosynthesis (Pmax) in grams carbon per gram chlorophyll a per hour was estimated from the exponential equation (PE) and the hyper- bolic tangent equation (HT) (Platt & Jassby, 1976). Data are from Irwinet al. (1975) sets A and B, with 10 light intensity determinations (see Table 4).
Discussion Estimation of photosynthetic parameters
A simple exponential equation is not traditionally used for describing Pvs. Zcurves. Partly for this reason and partly because of the complexity of photosynthesis, the close fit of the exponential equation against a variety of high-precision P vs. Z observations (Tables 1 and 2) was unexpected.
Our results with the well-defined data sets indicate that this simple exponential equation, with a minimal number of parameters, fits a wide variety of data very well. The relative error estimates are lowest for net maximum productivity, PNmax, slightly greater for gross maximum productivity, PGmax, and are the highest for the parameter p. Although the exponential equation is relatively precise, these precision estimates refer to the derived parameters of the data set, and do not necessarily reflect experimental accuracy or precision (Peterson, 1980; Lederman & Tett, 1981; McCree, 1981). Furthermore, note that in all experiments the mean relative errors in both net and gross maximum pro- ductivity are quite small. It is easily shown that the differences are small between two estimates of PNmax made with different equations (and methods) but using the same empirical observations (Figure 5). However, differences are large between two estimates
Phytoplankton productivity 823
14 1 I I I I 1 I I I /
. .
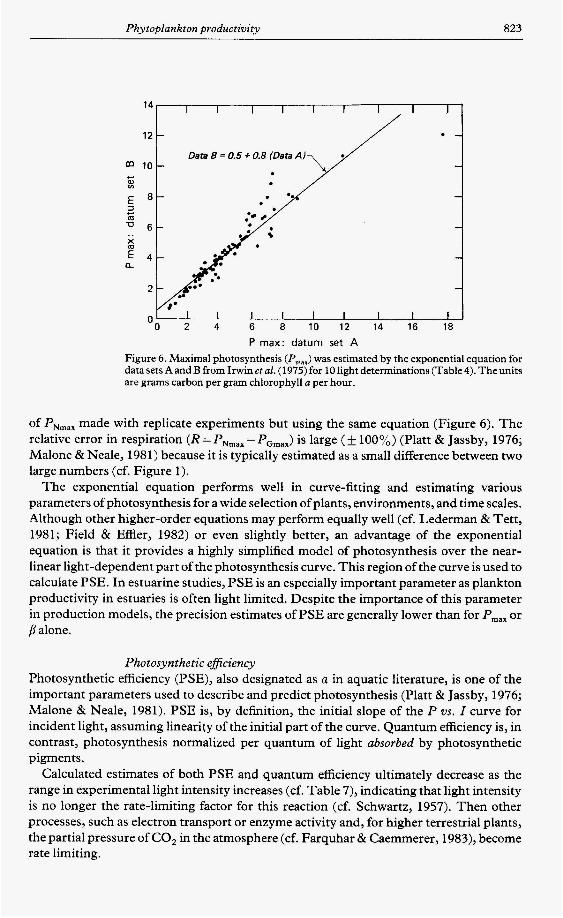
Data B = 0.5 + 0.8 (Data A) * 10
I I I I I I t I I 0 2 4 6 8 10 12 14 16 18
P max: datum set A
O r
Figure 6. Maximal photosynthesis (Pmax) was estimated by the exponential equation for datasets AandBfrom Irwinetal. (1975)for lOIightdeterminations(Table4).Theunits are grams carbon per gram chlorophyll a per hour.
of PNmax made with replicate experiments but using the same equation (Figure 6). The relative error in respiration (R = PNmax - PGmax) is large ( f 100%) (Platt & Jassby, 1976; Malone & Neale, 1981) because it is typically estimated as a small difference between two large numbers (cf. Figure 1).
The exponential equation performs well in curve-fitting and estimating various parameters of photosynthesis for a wide selection of plants, environments, and time scales. Although other higher-order equations may perform equally well (cf. Lederman & Tett, 1981; Field & Effler, 1982) or even slightly better, an advantage of the exponential equation is that it provides a highly simplified model of photosynthesis over the near- linear light-dependent part of the photosynthesis curve. This region of the curve is used to calculate PSE. In estuarine studies, PSE is an especially important parameter as plankton productivity in estuaries is often light limited. Despite the importance of this parameter in production models, the precision estimates of PSE are generally lower than for P,,, or
alone.
Photosynthetic eficiency Photosynthetic efficiency (PSE), also designated as a in aquatic literature, is one of the important parameters used to describe and predict photosynthesis (Platt & Jassby, 1976; Malone & Neale, 1981). PSE is, by definition, the initial slope of the P vs. Z curve for incident light, assuming linearity of the initial part of the curve. Quantum efficiency is, in contrast, photosynthesis normalized per quantum of light absorbed by photosynthetic pigments.
Calculated estimates of both PSE and quantum efficiency ultimately decrease as the range in experimental light intensity increases (cf. Table 7), indicating that light intensity is no longer the rate-limiting factor for this reaction (cf. Schwartz, 1957). Then other processes, such as electron transport or enzyme activity and, for higher terrestrial plants, the partial pressure of CO, in the atmosphere (cf. Farquhar & Caemmerer, 1983), become rate limiting.

824 D. H . Peterson et al.
TABLE 7. Comparison of the initial slope of Pvs. Z curves computed by a subjective linear method (PSE,) for different ranges of light incubation intensities and a comparison of their values with the simultaneous curve-fitting value (PSE,); data from Irwin e t al. (1955) and from Platt and Jassby (1976)
PSE, gC(gchla)- 'h- '
Experiment (pEm-'s-') n pEm-'s-' RZb PSE, (PSE,)-' ZK(ZL)-' IL"
BB-5M 230 14 100 12 50 10 25 8
SMB-1OM 280 15 130 13 62 11 34 9 19 7
CH-5M 164 14 76 12 42 10 23 8
0.024 0.050 0.065 0.072
0.018 0.026 0.033 0.028 0.035
0.043 0.072 0-067 0.070
0.800 0.980 0.995 0.995
0.95 0.98 0.99 0.95 0.92
0.90 0.98 0.98 0.97
0.25 0.52 0.67 0.74
0.47 0.70 0.98 0.76 0.95
0.60 1 .oo 0.93 0.97
0.24 0.56 1.10 2.20
0.54 1.20 2.40 4.40 7.90
0.61 1.30 2.40 4.30
"Light intensity corresponding to the upper limit or maximal photosynthetic rate for the assumed linear part of the curve. Note the decrease in PSE, with increasing I,. *Ratio of s u m of squares to total s u m of squares.
Generally, PSE and quantum efficiency are measured at light intensities below approxi- mately 55 1-1 E m-'s-' (cf. Bjorkman et al., 1971; Platt & Jassby, 1976; Welschmeyer & Lorenzen, 1981; Richardson et al., 1983). A difficulty in estimating PSE is the possible bias in choice of the linear or apparent linear range in light intensities. This uncertainty is minimized by simultaneously curve-fitting all observations during parameter estimation (Lederman & Tett, 1981). [Note that this procedure of simultaneous curve fitting is not followed for measuring quantum efficiency (Ehleringer & Bjorkman, 1977; Bjorkman et al., 197 1; Senger & Fleischhacker, 1978a) because these curve-fitting methods utilize observations at all light intensities.]
The discrepancies between PSE calculated by simultaneous curve-fitting and subjec- tive methods are recognized (Harding et al., 1981). A comparison of the differences in the two methods was made for some of the data used to test the equation (Table 7). Two major problems with the subjective method are (1) the decision of how far the linear portion of the curve extends, and (2) the increased error associated with restricting observation points to a small number. We attempt to illustrate these problems with the following statistical model of photon capture at low quantum flux densities.
The Poisson model The Poisson model assumes that the photosynthetic response of a natural assemblage of phytoplankton follows a Poisson probability function with respect to light intensity. This is described by the Poisson equation (Haight, 1967):
Phytoplankton productivity 825
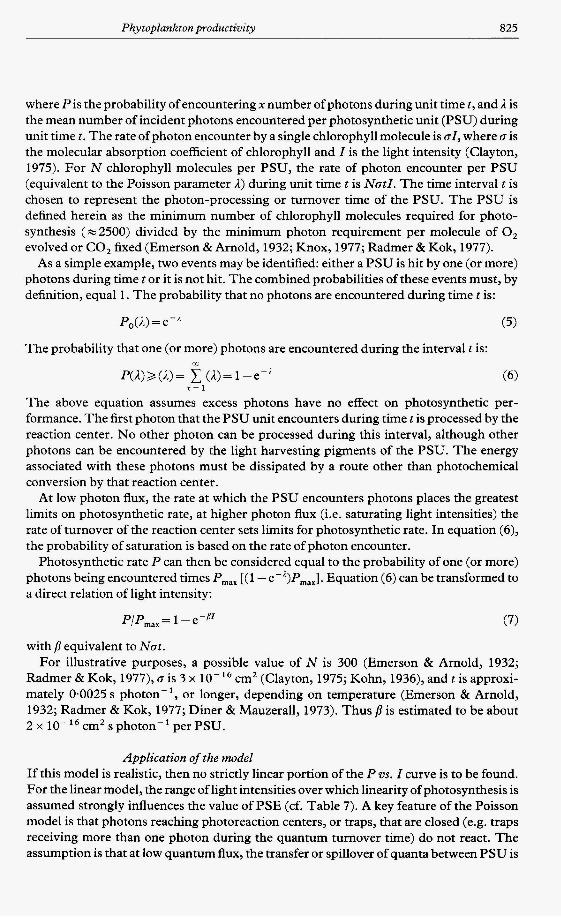
where P is the probability of encountering x number of photons during unit time t, and 1 is the mean number of incident photons encountered per photosynthetic unit (PSU) during unit time t. The rate of photon encounter by a single chlorophyll molecule is oZ, where o is the molecular absorption coefficient of chlorophyll and I is the light intensity (Clayton, 1975). For N chlorophyll molecules per PSU, the rate of photon encounter per PSU (equivalent to the Poisson parameter A) during unit time t is NotZ. The time interval t is chosen to represent the photon-processing or turnover time of the PSU. The PSU is defined herein as the minimum number of chlorophyll molecules required for photo- synthesis ( ~ 2 5 0 0 ) divided by the minimum photon requirement per molecule of 0, evolved or CO, fixed (Emerson &Arnold, 1932; Knox, 1977; Radmer & Kok, 1977).
As a simple example, two events may be identified: either a PSU is hit by one (or more) photons during time tor it is not hit. The combined probabilities of these events must, by definition, equal 1. The probability that no photons are encountered during time t is:
The probability that one (or more) photons are encountered during the interval t is: m v
P(A)>(A)= C (A)=l-e-’ (6) x = l
The above equation assumes excess photons have no effect on photosynthetic per- formance. The first photon that the PSU unit encounters during time t is processed by the reaction center. No other photon can be processed during this interval, although other photons can be encountered by the light harvesting pigments of the PSU. The energy associated with these photons must be dissipated by a route other than photochemical conversion by that reaction center.
At low photon flux, the rate at which the PSU encounters photons places the greatest limits on photosynthetic rate, at higher photon flux (i.e. saturating light intensities) the rate of turnover of the reaction center sets limits for photosynthetic rate. In equation (6), the probability of saturation is based on the rate of photon encounter.
Photosynthetic rate P can then be considered equal to the probability of one (or more) photons being encountered times P,,, [( 1 - e-i)Pmax]. Equation (6) can be transformed to a direct relation of light intensity:
(7) PIP,,, = 1 - e-Pr
with p equivalent to Not. For illustrative purposes, a possible value of N is 300 (Emerson & Arnold, 1932;
Radmer & Kok, 1977), o is 3 x cm’ (Clayton, 1975; Kohn, 1936), and t is approxi- mately 0.0025 s photon-’, or longer, depending on temperature (Emerson & Arnold, 1932; Radmer & Kok, 1977; Diner & Mauzerall, 1973). Thus /3 is estimated to be about 2 x cmz s photon-’ per PSU.
Application of the model If this model is realistic, then no strictly linear portion of the P vs. I curve is to be found. For the linear model, the range of light intensities over which linearity of photosynthesis is assumed strongly influences the value of PSE (cf. Table 7). A key feature of the Poisson model is that photons reaching photoreaction centers, or traps, that are closed (e.g. traps receiving more than one photon during the quantum turnover time) do not react. The assumption is that at low quantum flux, the transfer or spillover of quanta between PSU is
826 D. H. Peterson et al.
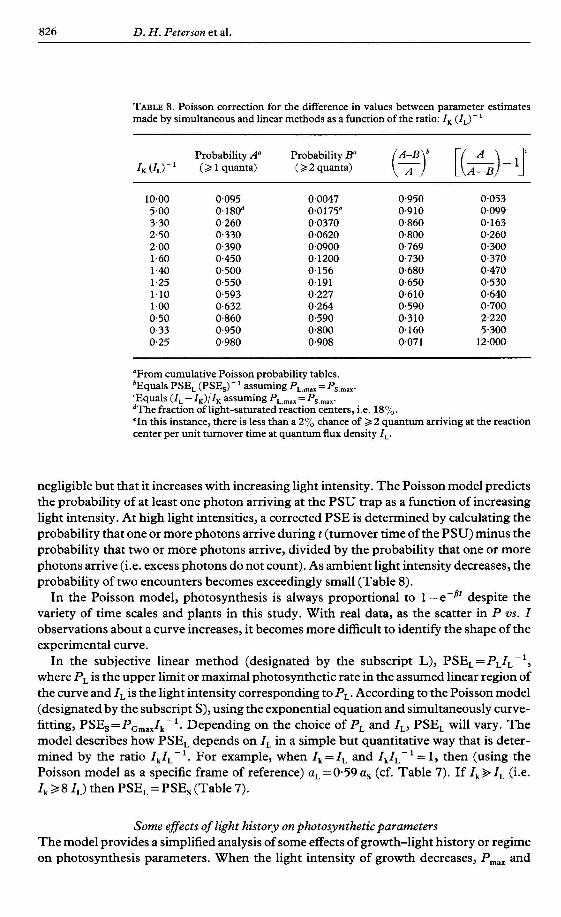
TABLE 8. Poisson correction for the difference in values between parameter estimates made by simultaneous and linear methods as a function of the ratio: I, (I,)-'
Probability A' Probability B" IK (I,) - ' ( 3 1 quanta) ( 3 2 quanta)
10.00 0.095 0.0047 0.950 0.053 5.00 0.180d 0.0175' 0.910 0.099 3.30 0.260 0.0370 0.860 0.163 2.50 0.330 0.0620 0.800 0.260 2.00 0.390 0.0900 0.769 0,300 1.60 0.450 0.1200 0.730 0.370 1.40 0.500 0.156 0.680 0.470 1.25 0.550 0.191 0.650 0.530 1.10 0.593 0.227 0.610 0.640 1 .OO 0.632 0.264 0.590 0.700 0.50 0.860 0.590 0.310 2.220 0.33 0.950 0,800 0.160 5.300 0.25 0.980 0.908 0.071 12.000
"From cumulative Poisson probability tables. bEquals PSE, (PSE,)-' assuming P, ,,, = P, ,,,. 'Equals (I, - I,)/I, assuming P, ,,, = P, ,,,. dThe fraction of light-saturated reaction centers, i.e. 18%. 'In this instance, there is less than a 2% chance of 2 2 quantum arriving at the reaction center per unit turnover time at quantum flux density I,.
negligible but that it increases with increasing light intensity. The Poisson model predicts the probability of at least one photon arriving at the PSU trap as a function of increasing light intensity. At high light intensities, a corrected PSE is determined by calculating the probability that one or more photons arrive during t (turnover time of the PSU) minus the probability that two or more photons arrive, divided by the probability that one or more photons arrive (i.e. excess photons do not count). As ambient light intensity decreases, the probability of two encounters becomes exceedingly small (Table 8).
In the Poisson model, photosynthesis is always proportional to 1 -e-8' despite the variety of time scales and plants in this study. With real data, as the scatter in P vs. I observations about a curve increases, it becomes more difficult to identify the shape of the experimental curve.
In the subjective linear method (designated by the subscript L), PSE,=P,I,-', where P, is the upper limit or maximal photosynthetic rate in the assumed linear region of the curve and I, is the light intensity corresponding to P,. According to the Poisson model (designated by the subscript S), using the exponential equation and simultaneously curve- fitting, PSE,=P,,a,Ik-'. Depending on the choice of P, and I,, PSE, will vary. The model describes how PSE, depends on I, in a simple but quantitative way that is deter- mined by the ratio IkIL-'. For example, when I, = I, and IkIL-' = 1, then (using the Poisson model as a specific frame of reference) aL=0.59 as (cf. Table 7). If I,% I, (i.e. I, > 8 1,) then PSE, = PSE, (Table 7).
Some effects of light history on photosynthetic parameters The model provides a simplified analysis of some effects of growth-light history or regime on photosynthesis parameters. When the light intensity of growth decreases, P,,, and
Phytoplankton productivity 827
- 1.7E-16 - N
-6 '5
1.3E-16 - s 5 -
9.OE-17
0.1 0.2 0.3 0.4 0.5 0.6 0.7
[mg C-'(mg chl hr) l
5.OE-17
MAXIMUM NET PRODUCTIVITY-'
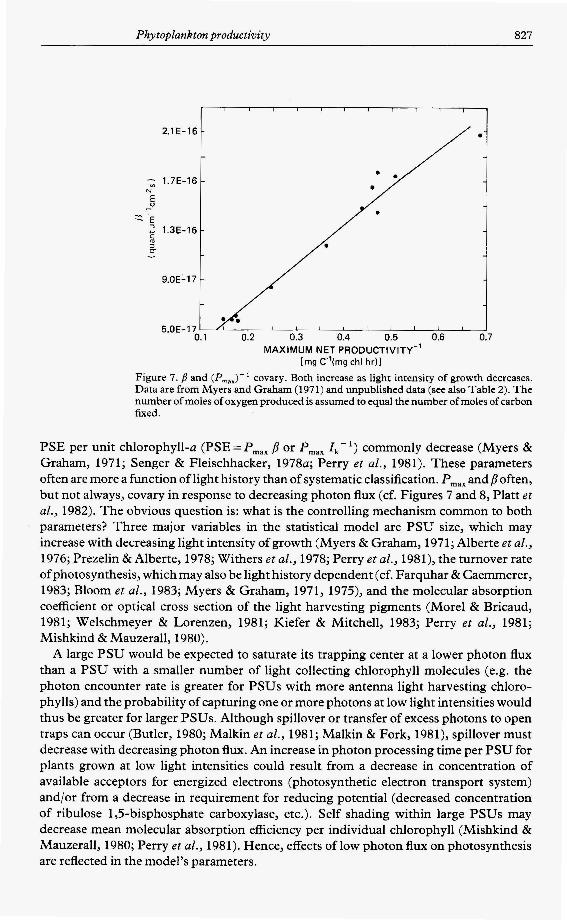
Figure 7. p and (P,,,J' covary. Both increase as light intensity of growth decreases. Data are from Myers and Graham (1971) and unpublished data (see also Table 2). The number of moles of oxygen produced is assumed to equal the number of moles of carbon fixed.
PSE per unit chlorophyll-a (PSE = P,,, p or P,,, Zk- ') commonly decrease (Myers & Graham, 1971; Senger & Fleischhacker, 1978~; Perry et al., 1981). These parameters often are more a function of light history than of systematic classification. P,,, andp often, but not always, covary in response to decreasing photon flux (cf. Figures 7 and 8, Platt et al., 1982). The obvious question is: what is the controlling mechanism common to both parameters? Three major variables in the statistical model are PSU size, which may increase with decreasing light intensity of growth (Myers & Graham, 1971; Alberte et al., 1976; Prezelin & Alberte, 1978; Withers et al., 1978; Perry et al., 1981), the turnover rate ofphotosynthesis, which may also be light history dependent (cf. Farquhar & Caemmerer, 1983; Bloom et al., 1983; Myers 8r Graham, 1971, 1975), and the molecular absorption coefficient or optical cross section of the light harvesting pigments (Morel & Bricaud, 1981; Welschmeyer & Lorenzen, 1981; Kiefer & Mitchell, 1983; Perry et al., 1981; Mishkind & Mauzerall, 1980).
A large PSU would be expected to saturate its trapping center at a lower photon flux than a PSU with a smaller number of light collecting chlorophyll molecules (e.g. the photon encounter rate is greater for PSUs with more antenna light harvesting chloro- phylls) and the probability of capturing one or more photons at low light intensities would thus be greater for larger PSUs. Although spillover or transfer of excess photons to open traps can occur (Butler, 1980; Malkin e t al., 1981; Malkin & Fork, 1981), spillover must decrease with decreasing photon flux. An increase in photon processing time per PSU for plants grown at low light intensities could result from a decrease in concentration of available acceptors for energized electrons (photosynthetic electron transport system) and/or from a decrease in requirement for reducing potential (decreased concentration of ribulose l+bisphosphate carboxylase, etc.). Self shading within large PSUs may decrease mean molecular absorption efficiency per individual chlorophyll (Mishkind & Mauzerall, 1980; Perry et al., 1981). Hence, effects of low photon flux on photosynthesis are reflected in the model's parameters.
828 D. H . Peterson et al.
500 c
N
0
E - 0
120 I I I
" x
SHADE-ADAPTED
I I I OO 2 4 6 8
Light Intensity ( 10'6 quanta c m 2 s - ' 1
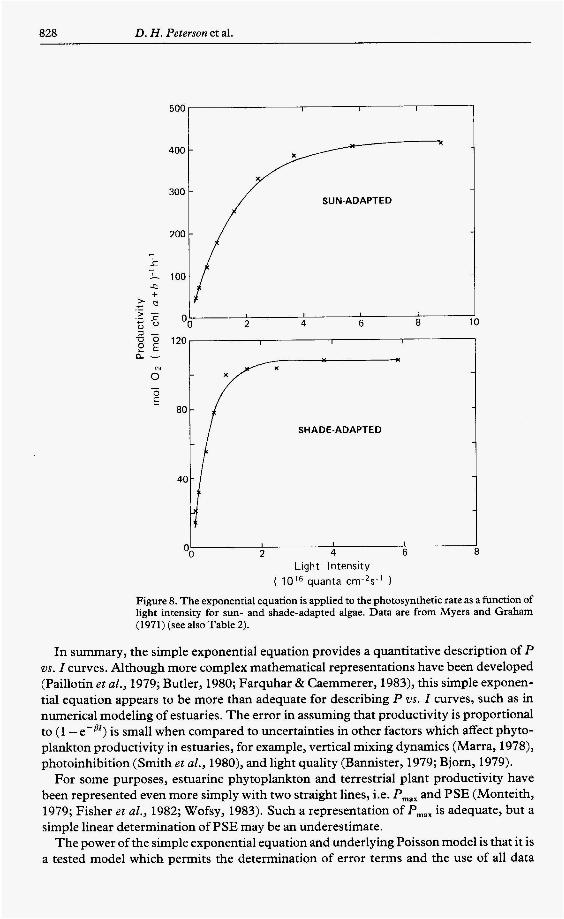
Figure 8. The exponential equation is applied to the photosynthetic rate as a function of light intensity for sun- and shade-adapted algae. Data are from Myers and Graham (1971) (see also Table 2).
In summary, the simple exponential equation provides a quantitative description of P vs. I curves. Although more complex mathematical representations have been developed (Paillotin et al., 1979; Butler, 1980; Farquhar & Caemmerer, 1983), this simple exponen- tial equation appears to be more than adequate for describing P vs. I curves, such as in numerical modeling of estuaries. The error in assuming that productivity is proportional to (1 -e-8r) is small when compared to uncertainties in other factors which affect phyto- plankton productivity in estuaries, for example, vertical mixing dynamics (Marra, 1978), photoinhibition (Smith et al., 1980), and light quality (Bannister, 1979; Bjorn, 1979).
For some purposes, estuarine phytoplankton and terrestrial plant productivity have been represented even more simply with two straight lines, i.e. P,,, and PSE (Monteith, 1979; Fisher et al., 1982; Wofsy, 1983). Such a representation of P,,, is adequate, but a simple linear determination of PSE may be an underestimate.
The power of the simple exponential equation and underlying Poisson model is that it is a tested model which permits the determination of error terms and the use of all data
Phytoplankton product iv i ty 829
points. The use of a non-subjective method to determine photosynthetic parameters will improve our ability to evaluate and compare phytoplankton photosynthetic performance in diverse light environments.
Acknowledgements
We thank J. Myers and J. R. Graham for providing published and unpublished data and for their helpful comments. We also thank: 0. Bjorkman, L. Haas, and L. Harding for helpful discussion and providing original data; R. Barber, R. Brune, J. Cloern, J. Coleman, J. Conomos, P. Doherty, D. English, R. Eppley, C. Felton, P. Jumars, H. Kerstner, D. McCulloch, F. Nichols, A. Ogata, T. Platt, J. Stockner, F. Trainer, R. Walters, and D. T. Winter for critical reviews; and D. A. Winters for efficiently handling mathematical jargon. This manuscript was also improved in formal review by the comments of T. Fisher. Financial support was provided by the Office of Naval Research, ONR contract #N00014-80-C-0252.
References Aitchison, J. & Brown, J. A. C. 1963 The Lognormal Distribution, with Special Reference To Its Uses In
Economics. Cambridge University Press, Cambridge. Alberte, R. S., McClure, P. R. & Thornber, J. P. 1976 Photosynthesis in trees: Organization of chlorophyll
and photosynthetic unit size in isolated gymnosperm chloroplasts. Plant Physiology 58,341-344. Band, L. E., Elfes, 0. B., Hayes, J. T., Mearus, L. O., O’Rourke, P. A,, Stevenson, B. J., Terjung, W. H. &
Todhunter, P. E. 1981 Application of a photosynthesis model to an agricultural region ofvaried climates: California. Agricultural Meteorology 24,201-21 7.
Bannister, T. T. 1979 Quantitative description of steady state, nutrient-saturated algae growth, including adaption. Limnology and Oceanography 24,7696.
Bencala, K. E. & Seinfeld, J. H. 1976 On frequency distributions of air pollutant concentrations. Atmosphere Environment 10,941-950.
Bjorkman, 0. 1975 Environmental and biological control of photosynthesis: inaugural address. In: Environmental and Biological Control of Photosynthesis (Morcelle, R., ed.) Dr. W. Junk, The Hague,
Bjorkman, 0. 1981 Responses to different quantum flux densities. In: Physiological Plant Ecology, I , Encyclopedia of Plant Physiology,New Series, Vol. 12A, (Lange, O., Nobel, P., Osmond, C. & Ziegler, H. eds). Springer, Berlin, Heidelberg, New York, pp. 57-107.
Bjorkman, O., Boardman, N. K., Anderson, J. M., Thome, S. W., Goodchild, D. J., Pyliotis, N. A. 1971 Effect of light intensity during growth of Atriplex patula on the capacity of photosynthetic reactions, chloroplast components, and structure. Carnegie Institute of Washington Year Book 71,115-135.
Bjom, L. 0. 1979 Photoreversibly photochromic pigments in organisms: Properties and role in biological light perception. Quarterly Reviews of Biophysics 12, 1-23.
Bloom, M. V., Milos, P. & Roy, H. 1983 Light-dependent assembly of ribulose 1,5-bisphosphate carboxylase. Proceedings of the National Academy of Science U S A 80,1013-1017.
Butler, W. L. 1980 Energy transfer between photosystem I1 units in a connected package model of the photochemical apparatus of photosynthesis. Proceedings of The National Academy of Science 77, 4697-4701.
pp. 1-16.
Carhahan, B., Luther, H. A. & Wilkes, J. 0. 1969 Applied Numerical Methods. John Wiley, New York. Chalker, B. E. 198 1 Simulating light-saturation curves for photosynthesis and calcification by reef-building
corals. Marine Biology 63,135-141. Clayton, R. K., 1975 Photosynthesis: How Light is Converted to Energy, Models in Biology N o . 13. Addison-
Wesley. Cole, B. E. & Harmon, D. D. 1981 Phytoplankton productivity, respiration, and nutrient uptake and
regeneration in the Potomac River, August 1977-August 1978 U. S. Geological Survey Open-File Report
Cole, B. E. & Herndon, R. E. 1979 Hydrographic properties and primary productivity of San Francisco Bay waters, March 197GJuly 1977. U. S. Geological Survey Open-File Report 79-983.
Dahlquist, G . & Bjorck, A. 1974 Numerical Methods, Prentice-Hall, Englewood Cliffs, NJ. Diner, B. & Mauzerall, D. 1973 The turnover times of photosynthesis and redox properties of the pool of
Draper, N. R. & Smith, H. 1966 Applied Regression Analyses. Wiley, New York.
81-700.
electron carriers between the photosystems. Biochimics et Biophysica Acta 305,353-363.
830 D. H . Peterson et al.
Ehleringer, J. R. & Bjorkman, 0. 1977 Quantum yields for CO, uptake in C, and C, plants dependence on
Emerson, R. &Arnold, W. 1932 The photochemical reaction in photosynthesis.Journa1 of General Physiology
Farquhar, G. D. & Caemmerer, S. von 1983 Modeling of photosynthetic response to environmental con- ditions. In: Physiological Plant Ecology I1 Encyclopedia of Plant Physiology New Series, Vol. 12B (Lange, 0. L., Nobel, P. S., Osmond, C. B. & Ziegler, H. eds). Springer-Verlag, New York, pp. 549-587.
Field, S. D. & Effler, S. W. 1982 Photosynthesis light mathematical formulations. Technical Notes Journal of the Environmental Engineering Division. Proceedings of the American Society of Civil Engineers 108,
Fisher, T. R., Carlson, P. R. &Barber, R. T. 1982 Carbon and nitrogen primary productivity in three North
Gelb, A. (ed.) 1974 Applied Optimal Estimation. The MIT Press, Cambridge, Mass. Grans, R. R. & Macintyre, I. G. 1976 Light control of growth form in colonial corals: computer simulation.
Science 193,895-897. Haas, L. W., Hastings, S. J. & Webb, K. L. 1981 Phytoplankton response to a stratification-mixing cycle in
the York River estuary during late summer. In: Estuaries and Nutrients (Neilson, B. J. & Cronin, L. E., eds). Humana Press, Inc., Clifton, NJ, pp. 619-636.
Hager, S. W., Cole, B. E. & Schemel, L. E. 1979 Phytoplankton productivity measurement in the San Francisco Bay Estuary: a comparison of four methods. U.S . Geological Survey Open-File Report 80-766.
Haight, F. A. 1967 Handbook of the Poisson Distribution. Wiley, New York. Hald, A. 1952 Statistical Theory with Engineering Applications. New York. Harding, L. W., Meeson, B. W., Prezelin, B. B. & Sweeney, B. M. 1981 Die1 periodicity of photosynthesis in
marine phytoplankton. Marine Biology 61,95-105. Irwin, B., Platt, T., Jassby, A. D. & Subba, R. D. U. 1975 The relationship between light intensity and
photosynthesis by phytoplankton. Results of experiments at three stations in the coastal waters of Nova Scotia. Fisheries and Marine Services Technical Report 595.
Jennrick, R. I. & Ralston, M. L. 1979 Fitting non-linear models to data. Annual Review in Biophysics and Bioengineering 8,195-238.
Kiefer, D. A. &Mitchell, B. G. 1983 A simple steady-state description of phytoplankton growth based upon absorption cross-section and quantum efficiency. Limnology and Oceanography 28,770-776.
Knox, R. S. 1977 Photosynthetic efficiency and exciton transfer and trapping. In: Primary Processes of Photosynthesis (Barber, J., ed.). Elsevier/North-Holland Biomedical Press, Utrecht, pp. 55-97.
Kohn, H. I. 1936Number of chlorophyll molecules actingas an absorbing unit in photosynthesis. Nature 137, 706.
Lederman, T. C. & Tett, P. 1981 Problems in modeling the photosynthesis-light relationship for phyto- plankton. Botanica Marina 24,125-1 34.
Malkin, S. & Fork, D. C. 1981 Photosynthetic units of sun and shade plants. Plant Physiology 67,580-583. Malkin, S . , Armond, P. A., Mooney, H. A. &Fork, D. C. 1981 Photosystem I1 photosynthetic unit sizes from
fluorescence induction in leaves. Plant Physiology 67,570-579. Malone, T. C. & Neale, P. J. 1981 Parameters of light-dependent photosynthesis for phytoplankton size
fractions in temperate estuarine and coastal environments. Marine Biology 61,289-297. Marra, J. 1978 Phytoplankton photosynthetic response to vertical movement in a mixed layer. Marine Biology
46,203-208. McCree, K. J. 1981 Photosynthetically active radiation. In: Physiological Plant Ecology. 1. Responses to the
Physical Environment Encyclopedia of Plant Physiology, New Series Vol. 12A (Lange, O., Nobel, P., Osmond, C. & Ziegler, H., eds). Springer-Verlag, New York, pp. 41-55.
Mishkind, M. & Mauzerall, D. 1980 Kinetic evidence for a common photosynthetic step in diverse seaweeds. Marine Biology 56,261-265.
Monteith, J. L. 1979 Does light limit crop production? In: Physiological Processes Limiting Plant Productivity (Johnson, C., ed.). Butterworth, pp. 23-37.
Morel, A. & Bricand, A. 1981 Theoretical results concerning light absorption in a discrete medium, and application to specific absorption of phytoplankton. Deep-Sea-Research 28A, 1375-1393.
Myers, J. & Graham, J. R. 1971 The photosynthetic unit in Chlorella measured by repetitive short flashes. Plant Physiology 48,282-286.
Myers, J. & Graham, J. R. 1975 Photosynthetic unit size during the synchronous life cycle of Scenedesmus Plant Physiology 55,686-688.
Paillotin, G., Swenberg, C. E., Breton, J. & Geacintov, N. E. 1979 Analysis of picosecond laser-induced fluorescence phenomena in photosynthetic membranes utilizing a master equation approach. Biophysical Journal 25,513-533.
Perry, M. J., Talbot, M. C. & Alberte, R. S. 1981 Photoadaption in marine phytoplankton, response of the photosynthetic unit. Marine Biology 62,91-101.
Peterson, B. J. 1980 Aquatic primary productivity and the 14C-C02 method: a history of the productivity problem. Annual Review in Ecological Systems 11,359-385.
temperature, CO, and 0, concentration. Plant Physiology 59,86-90.
16,191-205.
199-203.
Carolina estuaries. Estuarine, Coastal and Shelf Science 15,621-644.
Phytoplankton productivity 831
Peterson, D. H. & Festa, J. F. 1984 Numerical simulation of phytoplankton productivity in partially mixed estuaries. Estuarine Coastal and Shelf Science 19,563-589.
Peterson, D. H., Scheme], L. E., Alpine, A. E., Cole, B. E., Hager, S. W., Harmon, D. D., Hutchinson, A., Smith, R. E. & Wienke, S. M. (in press) Phytoplankton photosynthesis, nitrogen assimilation, and light intensity in a partially mixed estuary. Estuarine Coastal and Shelf Science.
Platt, T., Denman, K. L. & Jassby, A. D. 1977 Modeling the productivity of phytoplankton. In: The Sea, Vol. 6. Wiley, New York, pp. 807-856.
Platt, T. & Jassby, A. D. 1976 The relationship between photosynthesis and light for natural assemblages of coastal marine phytoplankton. Journal of Phycology 12,421430.
Platt, T., Gallegos, C. L. &Harrison, W. G. 1980 Photoinhibitionofphotosynthesis innatural assemblages of marine phytoplankton. Journal of Marine Research 34,687-700.
Platt, T., Harrison, W. G., Irwin, B., Horne, E. P. & Gallegos, C. L. 1982 Photosynthesis and photo- adaptation of marine phytoplankton in the Arctic. Deep-sea Research 29,1159-1 170.
Pollard, J. H. 1977 A Handbook of Numerical and Statistical Techniques. Cambridge University Press, Cambridge.
Prezelin, B. B. & Alberte, R. S. 1978 Photosynthetic characteristics and organization of chlorophyll in marine dinoflagellates. Proceedings of the National Academy of Sciences 75, 1801-1804.
Radmer, R. J. & Kok, B. 1977 Light conversion efficiency in photosynthesis. In: Encyclopedia of Plant Physiology, Vol. 5. Springer-Verlag, Berlin, pp. 125-135.
Richardson, K., Beardall, J. & Raven, J. A. 1983 Adaptation of unicellular algae to irradiance: an analysis of strategies. New PhytoIogist 93,157-191.
Schwartz, M. 1957 Quantum yield determinations of photosynthetic reactions. In: Methods in Enzymology (Colowick, S . P. & Kaplan, N. O., eds) Vol. 24, pp. 139-146.
Senger, H. & Fleishhacker, P. H. 1978a Adaptation of the photosynthetic apparatus of Scenedesmus obliquus to strong and weak light conditions I. Physiology Planatarum 43,35-42.
Senger, H. & Fleischhacker, P. H. 19786 Adaptation of the photosynthetic apparatus of Scenedesmus obliquus to strong and weak light conditions 11. Physiology Planatarum 43,43-51.
Smith, R. C., Baker, K. S., Holm-Hansen, 0. & Olson, R. 1980 Photoinhibition of photosynthesis in natural waters. Photochemistry and Photobiology 31,585-592.
Tektronix, Inc. 1977a One sample analysis. Tektronix R Plot 50 Statistics, Vol. I . Beaverton, Oregon, pp. 4-1 to 4-20.
Tektronix, Inc. 19776 Program five exponential least squares. Tektronix R Plot 50 Statistics Vol. 4 . Beaverton, Oregon, pp. 5-1 to 5-10.
Webb, W. L., Newton, M. & Starr, D. 1974 Carbon dioxide exchange of Alnus rebra. Oecologia 17,281-291. Welschmeyer, N. A. & Lorenzen, C. J. 1981 Chlorophyll-specific photosynthesis and quantum efficiency at
subsaturating light intensities. Journal of Phycology 17,283-293. Williams, R. B. 1966 Annual phytoplankton production in a system of shallow temperate estuaries. In:
Some Contemporary Studies in Marine Science (Barnes, H. ed.). George Allen and Unwin, London,
Williams, R. B. & Murdoch, M. B. 1966 Phytoplankton production and chlorophyll concentration in the Beaufort Channel, North Carolina. Limnology and Oceanography 11,73-82.
Withers, N. W., Alberte, R. S., Lewin, R. A., Thornber, J. P., Britton, G. & Goodwin, T. W. 1978 Photosynthetic unit size, carotenoids, and chlorophyll-protein composition of prochloron sp., a prokaryotic green algae. Proceedings of the National Academy of Sciences 75,2301-2305.
Wofsy, S. C. 1983 A simple model to predict extinction coefficients and phytoplankton bromass in eutrophic waters. Limnology and Oceanography 28,1144-1 155.
Woods, J. D. & Onken, R. 1982 Diurnal variation and primary production in the ocean-preliminary results of a Lagrangian ensemble model. Journal of Plankton Research 4,735-756.
pp. 689-716.
Appendix
Computation of exponential least-squares parameters Derived parameters for the P vs. Z curve [equation (2) in text] were computed using an exponential least- squares method (Tektronix, 19776). For a further discussion of efficient numerical methods for the compu- tations, as well as the assumptions in applied statistics theory, see Carhahan et al. (1969), Dahlquist and Bjorck (1974), Draper and Smith (1966), Gelb (1974), Hald (1952), and Pollard (1977).
The estimated parameter errors are given by Jennrick and Ralston (1979). Statistical experiments using synthetic data indicate the derived parameters and their error estimates are not highly sensitive to the number of determinations, N , when the data points are close to the curve [equation (2) in text]. Error estimates
832 D. H . Peterson et al.
a
/*- i !
*lo%
1
/ i
If i
re-
2 15% i' I r i
Liqht intensity
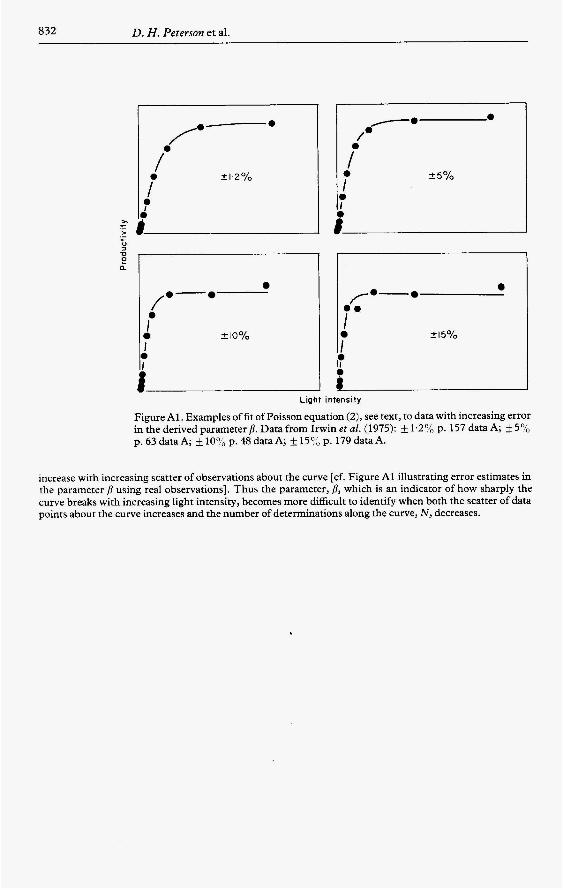
Figure A l . Examples of fit of Poisson equation (2), see text, to data with increasing error in the derived parameter p. Data from Irwin et al. (1975): k 1.2% p. 157 data A; +5'/, p. 63 data A; f 10% p. 48 data A; k l50/, p. 179 data A.
increase with increasing scatter of observations about the curve [cf. Figure A1 illustrating error estimates in the parameter p using real observations]. Thus the parameter, p, which is an indicator of how sharply the curve breaks with increasing light intensity, becomes more difficult to identify when both the scatter of data points about the curve increases and the number of determinations along the curve, N , decreases.