Embed Size (px)
Citation preview
Phytochemical investigations of members of the
Meliaceae, Euphorbiaceae and Amaryllidaceae families.
Natural Products Research Group
Department of Chemistry
Faculty of Engineering and Physical Sciences
University of Surrey
2016
(VOLUME 1)
Copyright© Areej Aldhaher 2016
By
Areej Hasan Saleem Aldhaher
SUBMITTED FOR THE DEGREE OF DOCTOR OF PHILOSOPHY
ii
Declaration
I declare that this report is my original work and has not been previously submitted for an award in
this or any other university for any degree as by my knowledge.
Signed........................................... Date...............................................
Areej Hasan Saleem Aldhaher
Natural Products Research Group, Department of Chemistry
Faculty of Engineering and Physical Sciences
University of Surrey
Guildford, Surrey, GU2 7XH
This report has been presented for examination with my approval as the University supervisor.
Signed............................................. Date..................................................
Professor D. A. Mulholland
Head of Department of Chemistry and Professor of Organic Chemistry
Natural Products Research Group, Department of Chemistry
Faculty of Engineering and Physical Sciences
University of Surrey, Guildford, Surrey, GU2 7XH

iii
Dedication
To Ali Ibn Abi Talib (a.s), who inspires me to always stay strong and to
have hope at all times.
To my lovely parents,
Aminah Hussain and Hasan Saleem
&
My wonderful sisters,
Awaras, Saja and Saba
For being beside me throughout my life.
To my country IRAQ
iv
Acknowledgement
Firstly, I am deeply grateful to the almighty God “Allah” for letting me through all the difficulties.
Then, I would like to express my thanks to many people who have helped me through my PhD study.
Foremost is Prof. Dulcie A. Mulholland, my supervisor who provided me with the opportunity to
work within the Natural Products Research Group, and encouraged me through the challenges of
research work. Thank you Prof. for your constructive advice, patience and kindness as you guided me
through the challenges of PhD study. I would also like to acknowledge the help I have received from
my co-supervisor Dr. Moses Langat whose expertise has been vital. Thank you for your concern and
help whenever needed. I am very glad that I have been able to work with you in a friendly
environment.
I also thank Dr. Sianne Schwikkard and Dr. Mark Carew for helping me in the bioassay experiment. I
also acknowledge the Austrian team for supplying the plant materials: they include Dr. Walter
Knirsch, Dr. Wolfgang Wetschnig and Dr. Martin Knirsch. I also want to express my thanks to Dr. D.
Driscoll (MS//HPLC), Q. Zhan (NMR), J. Peters (technical), Colin Sparrow (MS/Oxford), Maria (IR)
and Linda Bennett (secretary) for their assistance and help. My special appreciation and thanks to the
past and present members of the NPRG, Jaspreet, Linda, Alaa, Watcharee, Emily, Lorraine and
Hannah for their support, help and encouragement.
I would like to extend my special thanks to all my friends at Department of Chemistry Balqees,
Nawal, Katerina, Wafa, Sahar, Meqna, Noora, Maan and Hazim, and to all my friends in Ahlul Bayt
Society, Sakina, Nafiseh, Meher, Zahraa, Luma, Zianah, Zaleza, Eqbal, Faheema, Maysia, Farah,
Jenan, and Marziah who were all there through the tears and the laughter and who will always be my
lifelong friends. I also gratefully acknowledge the Iraq government/ The Higher Committee for
Education Development in Iraq (HCED) who gave me the opportunity and funds to study at the
University of Surrey.
Lastly, I thank my lovely family-my parents, Hasan and Aminah, my sisters, Awaras, Saja and Saba,
and my brothers-in-law, Moustafa, Nawar and Usama for their support and for giving me the courage
to take on the challenges of this doctorate. Thanks to you all who helped me in one way or another if
I have failed to mention you by name. I appreciate the special roles that each one of you played in my
life during my study.
v
Table of Contents
Declaration………………………………………………………………………………...ii
Dedication………………………………………………………………………………....iii
Acknowledgements……………………………………………………………………..…iv
List of Tables ……………………………………………………………………….…….xiii
List of Figures……………………………………………………………………………..xvi
List of Schemes…………………………………………………………………..………..xx
List of Pictures……………………………………………………………………………..xx
List of Acronyms…………………………………………………………………………..xxi
Abstract…………………………………………………………………………………….xxiii
Medicinal plants as a source of drugs ......................................................................... 1
The Process of drug discovery .................................................................................... 5
Objective of the study ................................................................................................. 6
Introduction to the Euphorbiaceae family ................................................................... 7
Introduction to the Croton genus ................................................................................ 7
The Croton genus ................................................................................................. 7
Ethnobotany and biological screening of the Croton genus ................................ 8
Chemical constituents of the Croton genus ....................................................... 10
The biosynthesis of terpenoids........................................................................... 19
2.2.4.1 Biosynthesis of sesquiterpenes ....................................................................... 20
2.2.4.2 Biosynthesis of diterpenes .............................................................................. 23
2.2.4.3 The biosynthesis of triterpenoids ................................................................... 25
The chemistry of Croton dichogamus Pax ................................................................ 28
C. dichogamus Pax............................................................................................. 28
vi
Ethnobotany and biological screening of C. dichogamus Pax species .............. 28
Chemical constituents of the C. dichogamus Pax species ................................. 29
Results and discussion ............................................................................................... 29
Structure elucidation of Compound CD.1: 4-patchoulene (cyperene)
(Appendices 1-11) ............................................................................................................ 31
Structure elucidation of Compound CD.2: 4-patchoulen-3-one (cyperotundone)
(Appendices 12-18) .......................................................................................................... 34
Structural elucidation of compound CD.3: cadin-1(6),2,4,7,9-penta-ene
(cadalene) (Appendices 19-27) ........................................................................................ 36
Structural elucidation of compound CD.4: 1(6),7,9-cadinatriene-4α,5β-diol
(trans-4,5-dihydroxycorocalane; 4α,5β-corocalanediol) (Appendices 28-36) ................ 39
Structural elucidation of compound CD.5: 1,3,5-cadinatriene-7R,10S-diol
(10-epi maninsigin D). (Appendices 37-46) . .................................................................. 43
Structural elucidation of compound CD.6: 15,16-epoxy-13(16), 14-ent-
clerodadien-3-one (trans-cascarillone) (Appendices 47-54) ........................................... 48
Structural elucidation of compound CD.7: 15,16-epoxy-4(18),13(16),14-ent-
clerodatrien-3-ol (agbaninol) (Appendices 55-63) .......................................................... 56
Structural elucidation of compound CD.8: 15,16-epoxy-3-keto-3(16),14-ent-
clerodadien-17, 12S-olide (crotonolide E.) (Appendices 64-72) ..................................... 60
Structural elucidation of compound CD.9: 15,16-epoxy-3,4-dihydroxy-
3(16),14-ent-clerodadien-17,12S-olide (furocrotinsulolide A) (Appendices 73-81) ....... 64
Structural elucidation of compound CD.10: 15,16-epoxy-5,13(16),14-ent-
halimatriene-3-ol. (Appendices 82-90) ............................................................................ 67
Structural elucidation of compound CD.11: 15,16-epoxy-3-hydroxy-5(10),
13(16), 14-ent-halimatriene-17, 12S-olide (Appendices 91-99) ..................................... 70
Structural elucidation of compound CD.12: crotohaumanoxide
(Appendices 100-106) ...................................................................................................... 73
Structural elucidation of compound CD.13: crotodichogamoin A
(Appendices 107-115) ...................................................................................................... 77
vii
Structural elucidation of compound CD.14: crotodichogamoin B
(Appendices 116-124) ...................................................................................................... 79
Structural elucidation of compound CD.15: acetyl aleuritolic acid
(Appendices 125-131) ...................................................................................................... 82
Conclusion ................................................................................................................. 85
Introduction to the Amaryllidacea family ................................................................. 87
Introduction to the Crinum genus ............................................................................. 87
The Crinum genus and ethnopharmacology ...................................................... 87
Chemical constituents of the Crinum genus ...................................................... 89
The biological activities of Amaryllidaceae alkaloids ....................................... 91
Amaryllidaceae alkaloid types in the Crinum genus ......................................... 94
3.2.4.1 Lycorine type alkaloids .................................................................................. 94
3.2.4.2 Homlycorine type alkaloids ........................................................................... 94
3.2.4.3 Crinine and haemanthamine type alkaloids ................................................... 95
The biosynthesis of Amaryllidaceae alkaloids .................................................. 98
The chemistry of Crinum species 6538 ................................................................... 102
C. firmifolium Baker and Ethnobotany ............................................................ 102
Chemical constituents of the Crinum firmifolium ............................................ 102
Results and discussion of Crinum sp. 6538 ..................................................... 104
3.3.3.1 Structure elucidation of Compound CF.1: lycorine (Appendices 132-141)
……………………………………………………………………………..106
3.3.3.2 Structure elucidation of Compound CF.2: 6,7,11b,11c-didehydrolycorinium
salt (Appendices 142-150) .......................................................................................... 109
3.3.3.3 Structure elucidation of Compound CF.3: hippadine (Appendices 151-157)
……………………………………………………………………………..112
viii
3.3.3.4 Structure elucidation of Compound CF.4: hippeastrine (Appendices 158-169)
……………………………………………………………………………..114
3.3.3.5 Structure elucidation of Compound CF.5: masonine (Appendices 170-179)
……………………………………………………………………………..118
3.3.3.6 Structure elucidation of Compound CF.6: crinine (Appendices 180-188) .. 121
3.3.3.7 Structure elucidation of Compound CF.7: the ammonium salt of crinine
(Appendices 189-199) ................................................................................................. 124
The chemistry of Crinum hardyi Lehmiller ............................................................ 127
Result and discussion of the phytochemical analysis of C. hardyi .................. 127
3.4.1.1 Structure elucidation of Compound CH.1: 6-hydroxycrinamine (Appendices
200-209)……………………………………………………………………………..128
3.4.1.2 Structure elucidation of Compound CH.2: crinine (Appendices 210-216) .. 131
3.4.1.3 Structure elucidation of Compound CH.3: the ammonium salt of crinine
(Appendices 217-220) ................................................................................................. 131
3.4.1.4 Structure elucidation of Compound CH.4: lycorine (Appendices 221-222) 132
3.4.1.5 Structure elucidation of Compound CH.5: 6,7,11b,11c-didehydrolycorinium
salt (Appendices 223-226) .......................................................................................... 132
The chemistry of Crinum species 5629 ................................................................... 134
Results and discussion of the phytochemical analysis of C. sp. 5629 ............. 134
3.5.1.1 Structure elucidation of Compound CS.1: 6-hydroxy crinamine (Appendices
227-235)…………………………………………………………………………….135
3.5.1.2 Structure elucidation of Compound CS.2: lycorine(Appendices 236-238) . 138
3.5.1.3 Structure elucidation of Compound CS.3: pseudolycorine (Appendices 239-
247) …………………………………………………………………………….138
Conclusion ............................................................................................................... 141
Introduction to Toona sinensis [Meliaceae family] ................................................ 144
Botanical aspects of T. sinensis ....................................................................... 144
ix
Ethnobotany and biological screening of Toona sinensis ................................ 144
Chemical constituents of Toona sinensis:........................................................ 146
Result and discussion of Toona sinensis ................................................................. 151
Structural elucidation of compound TS.1: 24-methylenecycloartan-3-yl acetate
(Appendices 248-257) .................................................................................................... 153
Structural elucidation of compound TS.2: 24-methylenecycloartan-3-one
(Appendices 258-267) .................................................................................................... 156
Structural elucidation of compound TS.3: 23,24,25-trihydroxytirucall-7-en-3-
one (piscidinol A) (Appendices 268-277)...................................................................... 159
Structural elucidation of compound TS.4: 24-methylenetirucalla-8-en-3-ol,
euphorbol (Appendices 278-287) ................................................................................. 163
Structural elucidation of compound TS.5: -amyrin acetate (Appendices 288-
297) ………………………………………………………………………………..166
Structural elucidation of compound TS.6: catechin (Appendices 298-305) .... 169
Structural elucidation of compound TS.7: epicatechin (Appendices 306-
313)……………………………………………………………………………………172
Structural elucidation of compound TS.8: sitosterol, stigmast-5-en-3-ol
(Appendices 314-318) .................................................................................................... 174
Structural elucidation of compound TS.9: sitostenone, stigmast-4-en-3-one
(Appendices 61-66) (Appendices 319-322) ................................................................... 176
Conclusion ............................................................................................................... 178
Cytotoxicity ............................................................................................................. 179
Measuring Cell Cytotoxicity ............................................................................ 180
Principle of neutral red assay ........................................................................... 180
Apoptosis mechanism ...................................................................................... 181
Apoptosis in cancer .......................................................................................... 182
Measuring Apoptosis: CellPlayerTM 96-well caspase-3/7 reagent................... 183
x
The cytotoxicity Results .......................................................................................... 183
Neutral red assay results .................................................................................. 183
Results of CellPlayerTM 96-well caspase-3/7 reagent ...................................... 186
The NCI anticancer drug discovery screen ............................................................. 187
Results of NCI60 human tumor cell line panel screening ....................................... 188
Conclusion:.............................................................................................................. 190
Characterisation techniques..................................................................................... 193
Nuclear Magnetic Resonance Spectroscopy (NMR) ....................................... 193
Fourier Transform Infrared Spectroscopy (FTIR) ........................................... 193
Mass Spectrometry (MS) ................................................................................. 193
Optical rotation measurement .......................................................................... 194
Electronic circular dichroism (ECD) ............................................................... 194
Plant collection, extraction and isolation of compounds......................................... 194
Plant Collection ................................................................................................ 194
Plant extraction ................................................................................................ 195
Dry packing of material ................................................................................... 196
Isolation and purification of compounds ......................................................... 196
Chemical analysis .................................................................................................... 198
Acetylation of hydroxylated compounds ......................................................... 198
Base treatment .................................................................................................. 198
Cytotoxicity assay ................................................................................................... 198
Neutral red assay .............................................................................................. 198
Measuring Apoptosis: CellPlayerTM 96-well caspase-3/7 reagent................... 199
Methodology of the NCI 60 cancer screening ................................................. 199
Summary of physical data ....................................................................................... 200
xi
Constituents of Croton dichogamus ................................................................. 200
7.5.1.1 Physical data for compound CD.1................................................................ 200
7.5.1.2 Physical data for compound CD.2................................................................ 200
7.5.1.3 Physical data for compound CD.3................................................................ 200
7.5.1.4 Physical data for compound CD.4................................................................ 201
7.5.1.5 Physical data for compound CD.5................................................................ 201
7.5.1.6 Physical data for compound CD.6................................................................ 202
7.5.1.7 Physical data for compound CD.7................................................................ 202
7.5.1.8 Physical data for compound CD.8................................................................ 202
7.5.1.9 Physical data for compound CD.9................................................................ 203
7.5.1.10 Physical data for compound CD.10 .......................................................... 203
7.5.1.11 Physical data for compound CD.11 .......................................................... 204
7.5.1.12 Physical data for compound CD.12 .......................................................... 204
7.5.1.13 Physical data for compound CD.13 .......................................................... 204
7.5.1.14 Physical data for compound CD.14 .......................................................... 205
7.5.1.15 Physical data for compound CD.15 .......................................................... 205
Constituents of Crinum sp. 6538 ..................................................................... 206
7.5.2.1 Physical data for compound CF.1 ................................................................ 206
7.5.2.2 Physical data for compound CF.2 ................................................................ 206
7.5.2.3 Physical data for compound CF.3 ................................................................ 207
7.5.2.4 Physical data for compound CF.4 ................................................................ 207
7.5.2.5 Physical data for compound CF.5 ................................................................ 207
7.5.2.6 Physical data for compound CF.6 ................................................................ 208
7.5.2.7 Physical data for compound CF.7 ................................................................ 208
Constituents of Crinum hardyi......................................................................... 209
7.5.3.1 Physical data for compound CH.1................................................................ 209
7.5.3.2 Physical data for compound CH.2................................................................ 209
xii
7.5.3.3 Physical data for compound CH.3................................................................ 209
7.5.3.4 Physical data for compound CH.4................................................................ 210
7.5.3.5 Physical data for compound CH.5................................................................ 210
Constituents of Crinum species 5629 .............................................................. 211
7.5.4.1 Physical data for compound CS.1 ................................................................ 211
7.5.4.2 Physical data for compound CS.2 ................................................................ 211
7.5.4.3 Physical data for compound CS.3 ................................................................ 212
Constituents of Toona sinensis ........................................................................ 212
7.5.5.1 Physical data for compound TS.1 ................................................................ 212
7.5.5.2 Physical data for compound TS.2 ................................................................ 212
7.5.5.3 Physical data for compound TS.3 ................................................................ 213
7.5.5.4 Physical data for compound TS.4 ................................................................ 213
7.5.5.5 Physical data for compound TS.5 ................................................................ 213
7.5.5.6 Physical data for compound TS.6 ................................................................ 214
7.5.5.7 Physical data for compound TS.7 ................................................................ 214
Flow charts of isolated compounds ......................................................................... 216
Reference……………………………………………………………………………..221
xiii
List of Tables
Table 1.1: Plant derived compounds that have been used as source of drugs2,6 ........................ 3
Table 2.1: Selected examples of ethno-medicinal applications of Croton species in different
areas and their pharmacological effects. .................................................................................... 9
Table 2.2: Examples of triterpenids compounds isolated from the Croton genus and their
biological activities. ................................................................................................................. 10
Table 2.3: Examples of acyclic diterpenoids isolated from the Croton genus and some of their
biological activities. ................................................................................................................. 11
Table 2.4: Examples of cyclic diterpenoids isolated from the Croton genus and some of their
biological activities. ................................................................................................................. 12
Table 2.5: Examples of sesquiterpenes isolated from the Croton genus and some of their
biological activities .................................................................................................................. 16
Table 2.6: Examples of flavonoids isolated from the Croton genus ........................................ 17
Table 2.7: Examples of alkaloids isolated from the Croton genus and some of their biological
activities ................................................................................................................................... 18
Table 2.8: NMR data for compound CD.1: 4-patchoulene (cyperene) against literature
reference values ....................................................................................................................... 33
Table 2.9: NMR data for compound CD2: 4-Patchoulen-3-one (cyperotundone) in CDCl3
compared against literature reference values ........................................................................... 35
Table 2.10: NMR data for compound CD.3: cadalene in CDCl3 compared against literature
reference values ....................................................................................................................... 38
Table 2.11: NMR data for compound CD.4: 1(6),7,9-cadinatriene-4α,5β-diol in CDCl3
compared against literature reference values for cis-4,5-dihydroxycorocalane (CD.4A) and
trans-4,5-dihydroxycorocalane (CD.4B) ................................................................................. 42
Table 2.12: NMR data for compound CD.5: 10-epi maninsigin D in CDCl3 and CD3OD
compared against maninsigin D literature reference values .................................................... 47
Table 2.13: NMR data for compound CD.6: trans-cascarillone in CDCl3 compared against
literature reference values ........................................................................................................ 55
Table 2.14: NMR data for compound CD.7: agbaninol in CDCl3 compared against literature
reference values of compound 3β,12(S)-dihydroxycleroda-4(18),13-dien-15,16-olide
(compound 1) and crotonolide F(compound 2) ....................................................................... 59
Table 2.15: NMR data for compound CD.8: crotonolide E in CDCl3 compared against
literature reference values. ....................................................................................................... 63
xiv
Table 2.16: NMR data for compound CD.9: furocrotinsulolide A in CDCl3 and CD3OD
compared against literature reference values ........................................................................... 66
Table 2.17: NMR data for compound CD.10: 15, 16-epoxy-5, 13(16), 14-ent-halimatriene-3-
ol in CDCl3. .............................................................................................................................. 69
Table 2.18: NMR data for compound CD.11: 15, 16-epoxy-3-hydroxy-5(10), 13(16), 14-ent-
halimatriene-17, 12S-olide in CDCl3. ...................................................................................... 72
Table 2.19: NMR data for compound CD.12: crotohaumanoxide in CDCl3 compared against
literature reference values for crotohaumanoxide and crotocascarin A ................................... 76
Table 2.20: NMR data for compound CD.13: crotodichogamoin A in CDCl3........................ 78
Table 2.21: NMR data for compound CD.14: crotodichogamoin B in CDCl3 ........................ 81
Table 2.22: NMR data for compound CD.15: acetyl aleuritolic acid in CDCl3 compared
against literature reference values ............................................................................................ 84
Table 3.1: Selected examples of ethno-medicinal applications of Crinum species in different
areas and their pharmacological effects ................................................................................... 89
Table 3.2: NMR data for compound CF.1: lycorine in CD3OD compared against literature
reference values ..................................................................................................................... 108
Table 3.3: NMR data for compound CF.2: 6,7,11b,11c-didehydrolycorinium salt in CD3OD
compared against 8-O-demethylvasconine reference values ................................................. 111
Table 3.4: NMR data for compound CF.3: hippadine in CDCl3 compared against literature
reference values ..................................................................................................................... 113
Table 3.5: NMR data for compound CF.4: hippeastrine in CD3OD and CDCl3 compared
against literature reference values .......................................................................................... 117
Table 3.6: NMR data for compound CF.5: masonine in CD3OD compared against literature
reference values in and CDCl3 ............................................................................................... 120
Table 3.7: NMR data for compound CF.6: crinine in CDCl3 compared against literature
reference values ..................................................................................................................... 123
Table 3.8: NMR data for compound CF.7: the ammonium salt of crinine in CDCl3 compared
against free base and literature reference values of crinine ................................................... 126
Table 3.9: NMR data for compound CH.1: 6-hydroxycrinamine in CD3OD compared against
literature reference values ...................................................................................................... 130
Table 3.10: NMR data for compound CH.5: 6,7,Hb,Hc-didehydrolycorinium salt in CD3OD
................................................................................................................................................ 133
xv
Table 3.11: NMR data for compound CS.1: diacetate 6-hydroxy crinamine in CDCl3
compared against literature reference values ......................................................................... 137
Table 3.12: NMR data for compound CS.3: pseudolycorine in CD3OD compared against
literature reference values ...................................................................................................... 140
Table 3.13: Distribution of isolated alkaloids between the three investigated Crinum species
................................................................................................................................................ 143
Table 4.1: NMR data for compound TS1: 24-methylenecycloartan-3β-yl acetate in CDCl3
compared against literature reference values ......................................................................... 155
Table 4.2: NMR data for compound TS.2: 24-methylenecycloartan-3-one in CDCl3 compared
against literature reference values .......................................................................................... 158
Table 4.3: NMR data for compound TS.3: 23,24,25-trihydroxytirucall-7-en-3-one in CDCl3
compared literature against reference values. ........................................................................ 162
Table 4.4: NMR data for compound TS.4: 24-methyltirucalla-8-en-3β-ol in CDCl3 compared
against literature reference values .......................................................................................... 165
Table 4.5: NMR data for compound TS.5: β-amyrin acetate in CDCl3 compared against
literature reference values ...................................................................................................... 168
Table 4.6: NMR data for acetylated derivative of compound TS.6:catechin penta-acetate in
CD3OD ................................................................................................................................... 171
Table 4.7: NMR data for compound TS.7: epicatechin penta-acetate in CD3OD ................. 173
Table 4.8: NMR data for compound TS.8: sitosterol in CDCl3 compared against literature
reference values ..................................................................................................................... 175
Table 4.9: NMR data for compound TS.9: sitostenone in CDCl3 compared against literature
reference values ..................................................................................................................... 177
Table 5.1: Structures of compounds screened for cytotoxicity.............................................. 185
Table 5.2: Structures of compounds submitted to NCI.......................................................... 189
Table 5.3: One dose mean values of isolated compounds submitted to the NCI................... 190
Table 7.1: The plant collections site and the weights of crude plant extracts ....................... 196
xvi
List of Figures
Figure 1.1: Structures of plant compounds used as drugs1,4 ...................................................... 2
Figure 1.2: Procedure of the Process of plant discovery ........................................................... 5
Figure 2.1: Structures of terpenes showe isoprene units56 ....................................................... 19
Figure 2.2: Type of terpenes.56 ................................................................................................ 20
Figure 2.3: Compounds isolated previously from the leaves of C. dichogamus ..................... 29
Figure 2.4: Compounds isolated from the roots extract of C. dichogamus ............................. 30
Figure 2.5: Structure of compound CD.1: 4-patchoulene (cyperene) ...................................... 31
Figure 2.6: Structure of compound CD.2: 4-patchoulen-3-one (cyperotundone) .................... 34
Figure 2.7: Structure of compound CD.3: cadin-1(6),2,4,7,9-penta-ene (cadalene) ............... 36
Figure 2.8: The HMBC correlations seen in compound CD.3: cadalene ................................ 37
Figure 2.9: Structure of compound CD.4: 1(6),7,9-cadinatriene-4α,5β-diol ........................... 39
Figure 2.10: The reported isomeres CD.4A and CD.4B .......................................................... 41
Figure 2.11: Structure of compound CD.5: 1,3,5-cadinatriene-7R,10S-diol (10-
epi maninsigin D) ..................................................................................................................... 43
Figure 2.12: The four possible absolute stereostructures of compound 1,3,5-cadinatriene-
7,10-diol (CD.5A-CD.5D) ....................................................................................................... 46
Figure 2.13: ROESY experiment of compound CD.5D reported by Shang et al. (2013) ....... 46
Figure 2.14: The ECD spectrum for calculated compound CD.5A and CD.5B overlaid with
the CD.5 experimental ............................................................................................................. 47
Figure 2.15: Structure of compound CD.6: 15, 16-epoxy-13(16), 14-ent-clerodadien-3-one
(trans-cascarillone) .................................................................................................................. 48
Figure 2.16: ROESY correlations of compound CD.6 ............................................................ 50
Figure 2.17: The structure of compounds CD.6A, CD.6B, CD.6C and CD.6D ...................... 53
Figure 2.18: The ECD spectrum for calculated structure CD.6A and CD.6B overlaid with the
CD.6 experimental curve. ........................................................................................................ 54
Figure 2.19: The ECD spectrum for calculated structres CD.6C and CD.6D overlaid with the
experimental CD.6 curve ......................................................................................................... 54
Figure 2.20: Structure of compound CD.7: agbaninol ............................................................. 56
Figure 2.21: Structure of compound 3β,12(S)-dihydroxycleroda-4(18),13-dien-15,16-olide
(compound 1) and crotonolide F(compound 2) which were used to compare with NMR data
of CD.7.93,94 .............................................................................................................................. 58
Figure 2.22: Structure of compound CD.8: crotonolide E ....................................................... 60
xvii
Figure 2.23: Structure of compound CD.9: furocrotinsulolide A ............................................ 64
Figure 2.24: Structure of compound CD.10: 15,16-epoxy-5, 13(16), 14-ent-halimatriene-3-ol
.................................................................................................................................................. 67
Figure 2.25: Structure of compound CD.11: 15, 16-epoxy-3-hydroxy-5(10), 13(16), 14-ent-
halimatriene-17, 12S-olide ....................................................................................................... 70
Figure 2.26: Structure of compound CD.12: crotohaumanoxide ............................................. 73
Figure 2.27: Structure of compound crotocascarin A.99 .......................................................... 75
Figure 2.28: Structure of compound CD.13: crotodichogamoin A ......................................... 77
Figure 2.29: Structure of compound CD.14: crotodichogamoin B .......................................... 79
Figure 2.30: Structure of compound CD.15: acetyl aleuritolic acid ........................................ 82
Figure 2.31: Compounds isolated from the roots extract of C. dichogamus ........................... 86
Figure 3.1: Amaryllidaceae alkaloids reported in another families ......................................... 90
Figure 3.2: Types of Amaryllidaceae alkaloids ....................................................................... 91
Figure 3.3: Structural of some Amaryllidaceae alkaloids ........................................................ 93
Figure 3.4: Lycorine and Homolycorine type alkaloids isolated from Crinum species142 ...... 95
Figure 3.5: Haemanthamine type alkaloids isolated from Crinum species ............................. 96
Figure 3.6: Crinine type alkaloids isolated from Crinum species ............................................ 97
Figure 3.7: Compounds isolated previously from C. firmifolium Var. hygrophilum111,156 .... 103
Figure 3.8: Compounds isolated from the hexane and ethanol extract of Crinum sp. 6538 .. 105
Figure 3.9: Structure of compound CF.1: lycorine ................................................................ 106
Figure 3.10: Structure of compound CF.2: 6,7,11b,11c-didehydrolycorinium salt ............... 109
Figure 3.11: Structure of compound 8-O-demethylvasconine ............................................... 110
Figure 3.12: Structure of compound CF.3: hippadine ........................................................... 112
Figure 3.13: Structure of compound CF.4: hippeastrine........................................................ 114
Figure 3.14: Structure of compound CF.5: masonine ............................................................ 118
Figure 3.15: Structure of compound CF.6: crinine ................................................................ 121
Figure 3.16: Structure of compound CF.7: the ammonium salt of crinine ............................ 124
Figure 3.17: 1H NMR spectrum for compound CF.7 in CDCl3 before and after addition of 4
M NaOH................................................................................................................................. 125
Figure 3.18: Compounds isolated from the ethanol extract of C. hardyi ....................... 127
Figure 3.19: Structure of compound CH.1: 6-hydroxycrinamine .......................................... 128
Figure 3.20: Structure of compound CH.2: crinine ............................................................... 131
Figure 3.21: Structure of compound CH.3: the ammonium salt of crinine ........................... 131
xviii
Figure 3.22: Structure of compound CH.4: lycorine ............................................................. 132
Figure 3.23: Structure of compound CH.5: 6,7,11b,11c-didehydrolycorinium salt .............. 132
Figure 3.24: Bulbs of Crinum sp. 5629.................................................................................. 134
Figure 3.25: Compounds isolated from the ethanol extract of Crinum sp. 5629 ................... 134
Figure 3.26: Structure of compound CS.1: 6-hydroxy crinamine ......................................... 135
Figure 3.27: Structure of compound CS.2: lycorine .............................................................. 138
Figure 3.28: Structure of compound CS.3: pseudolycorine ................................................... 138
Figure 3.29: Compounds isolated from Crinum sp. 6538 (CF.1-CF.7), Crinum hardyi (CH.1-
CH.5) and Crinum sp. 5629 (CS.1-CS.3) .............................................................................. 141
Figure 4.1: Triterpenoids isolated previously from T. sinensis ............................................. 148
Figure 4.2:Tetranortriterpenoids isolated previously from T. sinensis .................................. 149
Figure 4.3: Lignans and norlignans isolated previously from T. sinensis ............................. 149
Figure 4.4: Flavonoids and bioflavonoids isolated from T. sinensis ..................................... 150
Figure 4.5: Other compounds isolated from T. sinensis ........................................................ 150
Figure 4.6: Compounds isolated from the dicholoromethane and methanol extract of stem
bark of Toona sinensis. .......................................................................................................... 152
Figure 4.7: Structure of compound TS.1: 24-methylenecycloartan-3β-yl acetate ................. 153
Figure 4.8: Structure of compound TS.2: 24-methylenecycloartan-3-one ............................ 156
Figure 4.9: Structure of compound TS.3: 23,24,25-trihydroxytirucall-7-en-3-one .............. 159
Figure 4.10: Structure of compound TS.4: 24-methylenetirucalla-8-en-3β-ol ...................... 163
Figure 4.11: Structure of compound TS.5: β-amyrin acetate ................................................ 166
Figure 4.12: Structure of compound TS.6: catechin .............................................................. 169
Figure 4.13: Structure of compound TS.7: epicatechin ......................................................... 172
Figure 4.14: Structure of compound TS.8: sitosterol ............................................................. 174
Figure 4.15: Structure of compound TS.9: sitostenone ......................................................... 176
Figure 5.1: Example of correlation between lysosomal activity of Caco-2 cells and
absorbance of neutral red dye at 24 hours growth247 ............................................................. 181
Figure 5.2: structure of Compound PAC-1243 ........................................................................ 182
Figure 5.3: Percentage of cell death of actinomycyin at 7.96 µM and screened compounds at
100 µM using the neutral red cytotoxicity assay ................................................................... 186
Figure 5.4: Percentage of cell death of compound CD.5 and CF.5 at different concxentrations
by using neutral red cytotoxicity assay .................................................................................. 186
xix
Figure 5.5: Percentage of confluences of compound CD.5 compared with positive and
negative controls over 48 hours. ............................................................................................ 187
xx
List of Schemes
Scheme 2.1: Biosynthetic of geranyl diphosphate (GPP)56 ..................................................... 20
Scheme 2.2: Biosynthetic of different cofigurations of farnesyl diphosphate (FPP).56 ........... 21
Scheme 2.3: Biosynthetic of a selection of sesequiterpenoids.56,57 ......................................... 22
Scheme 2.4: Biosynthetic of geranylgeranyl diphosphate (GPP)56 ......................................... 23
Scheme 2.5: Possible biosynthetic pathway for crotofolene.56,58 ............................................ 24
Scheme 2.6: Biosynthetic pathway of clerodane and halimane diterpenes.59-62 ...................... 26
Scheme 2.7: Biosynthetic pathway of Triterpenoids56 ............................................................ 27
Scheme 3.1: Probable pathway to Amaryllidaceae alkaloids.107,120 ........................................ 99
Scheme 3.2: Probable pathway to lycorine and homolycorine alkaloids.120,149,151 ................ 100
Scheme 3.3: Probable pathway to crinine and haemanthamine Amaryllidaceae alkaloids.151,152
................................................................................................................................................ 101
Scheme 4.1: Biosynthesis pathway of the extra methyl side chain carbons in the
triterpenoids56 ......................................................................................................................... 157
Scheme 7.1:A flow chart of the compounds isolated from the dichloromethane extract of the
roots of Croton dichogamus................................................................................................... 216
Scheme 7.2: A flow chart of the compounds isolated from the ethanol extract of the bulbs of
Crinum sp. 1 6538 .................................................................................................................. 217
Scheme 7.3: A flow chart of the compounds isolated from the ethanol extract of the bulbs of
Crinum hardyi 6481 ............................................................................................................... 218
Scheme 7.4:A flow chart of the compounds isolated from the ethanol extract of the bulbs of
Crinum species 2 6529 ........................................................................................................... 219
Scheme 7.5: A flow chart of the compounds isolated from the bark of T.sinensis ............... 220
List of Pictures
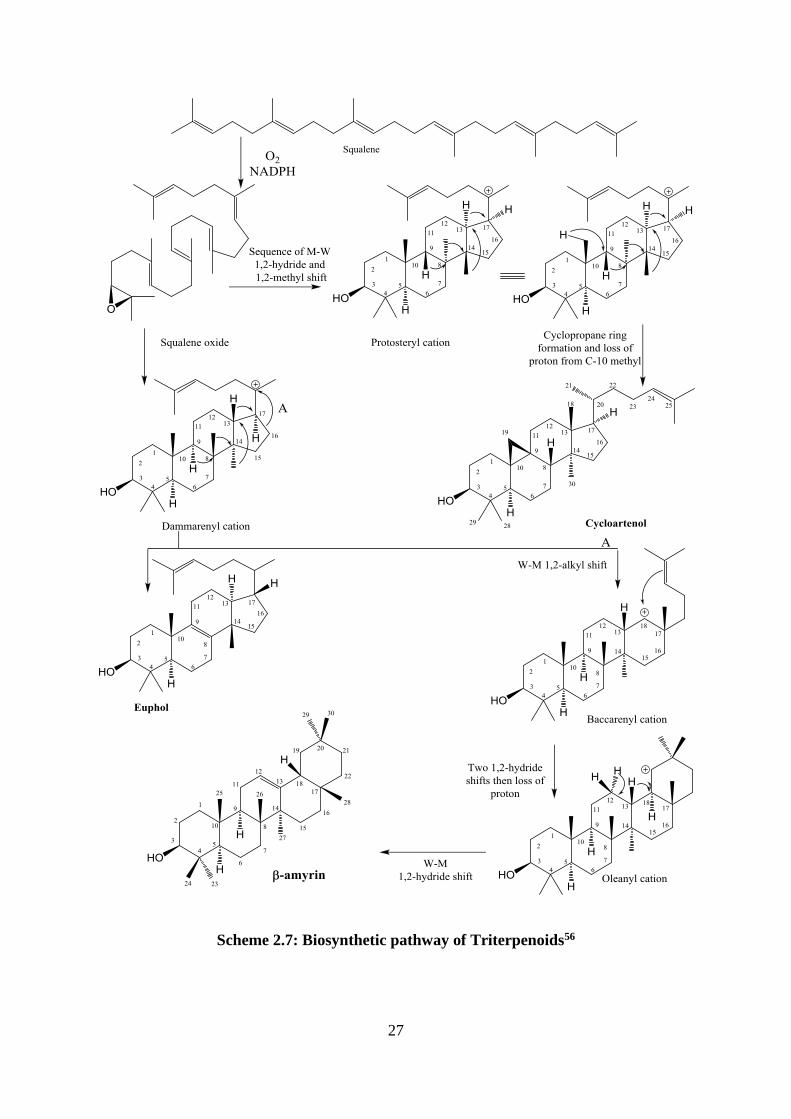
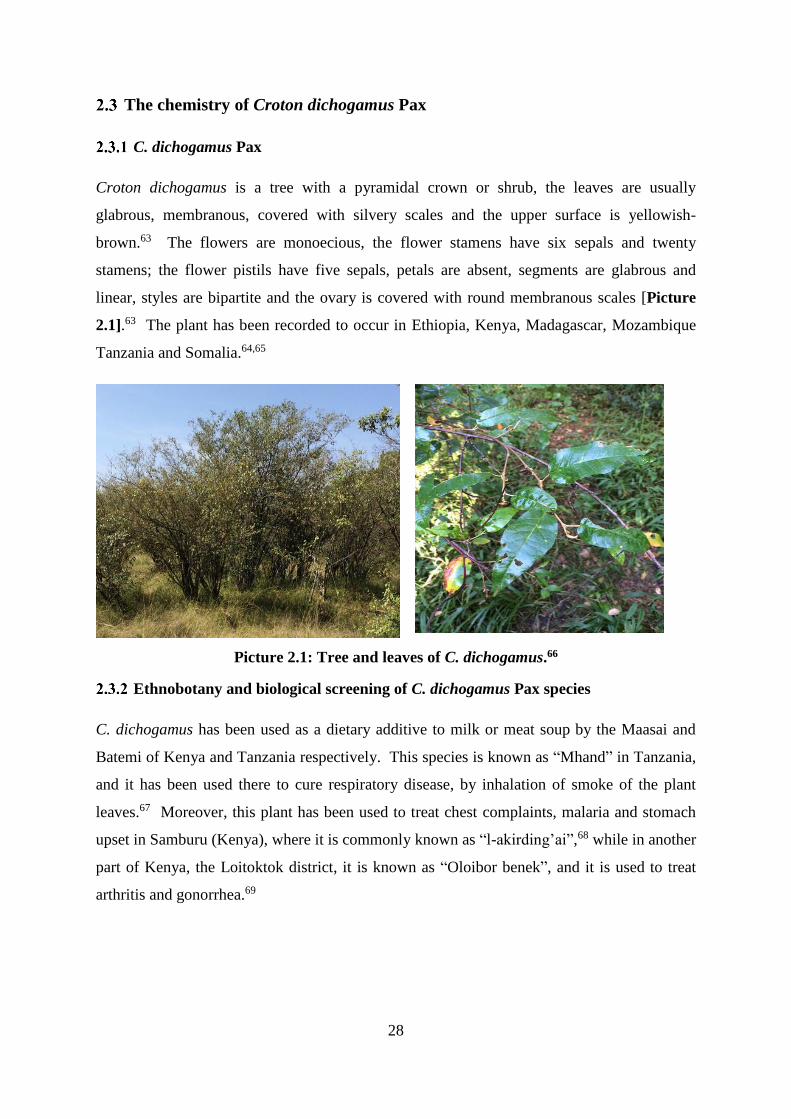
Picture 2.1: Tree and leaves of C.dichogamus.66 ..................................................................... 28
Picture 3.1: Flowers of the Amaryllidaceae genus112 .............................................................. 88
Picture 3.2: Flowers and leaves of Crinum firmifolium155 ..................................................... 102
Picture 3.3: Bulbs of Crinum sp. 6538 ................................................................................... 104
Picture 3.4: Bulbs of Crinum hardyi ...................................................................................... 127
xxi
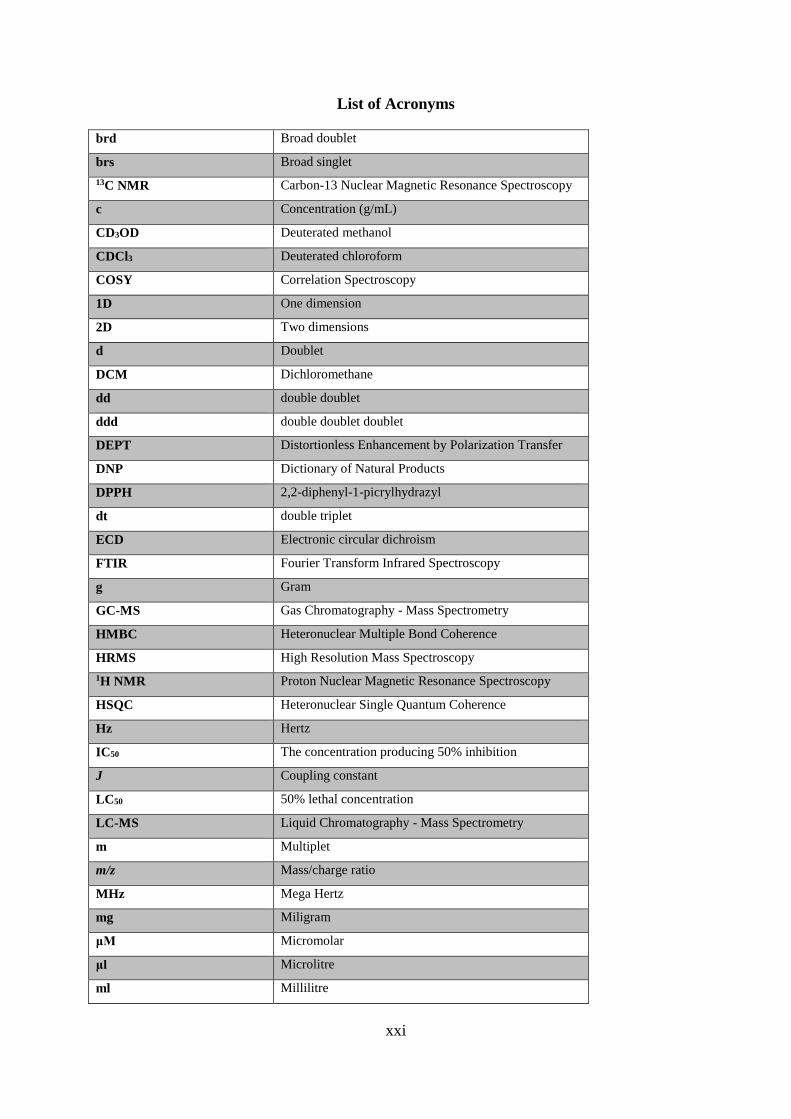
List of Acronyms
brd Broad doublet
brs Broad singlet
13C NMR Carbon-13 Nuclear Magnetic Resonance Spectroscopy
c Concentration (g/mL)
CD3OD Deuterated methanol
CDCl3 Deuterated chloroform
COSY Correlation Spectroscopy
1D One dimension
2D Two dimensions
d Doublet
DCM Dichloromethane
dd double doublet
ddd double doublet doublet
DEPT Distortionless Enhancement by Polarization Transfer
DNP Dictionary of Natural Products
DPPH 2,2-diphenyl-1-picrylhydrazyl
dt double triplet
ECD Electronic circular dichroism
FTIR Fourier Transform Infrared Spectroscopy
g Gram
GC-MS Gas Chromatography - Mass Spectrometry
HMBC Heteronuclear Multiple Bond Coherence
HRMS High Resolution Mass Spectroscopy
1H NMR Proton Nuclear Magnetic Resonance Spectroscopy
HSQC Heteronuclear Single Quantum Coherence
Hz Hertz
IC50 The concentration producing 50% inhibition
J Coupling constant
LC50 50% lethal concentration
LC-MS Liquid Chromatography - Mass Spectrometry
m Multiplet
m/z Mass/charge ratio
MHz Mega Hertz
mg Miligram
μM Micromolar
μl Microlitre
ml Millilitre
xxii
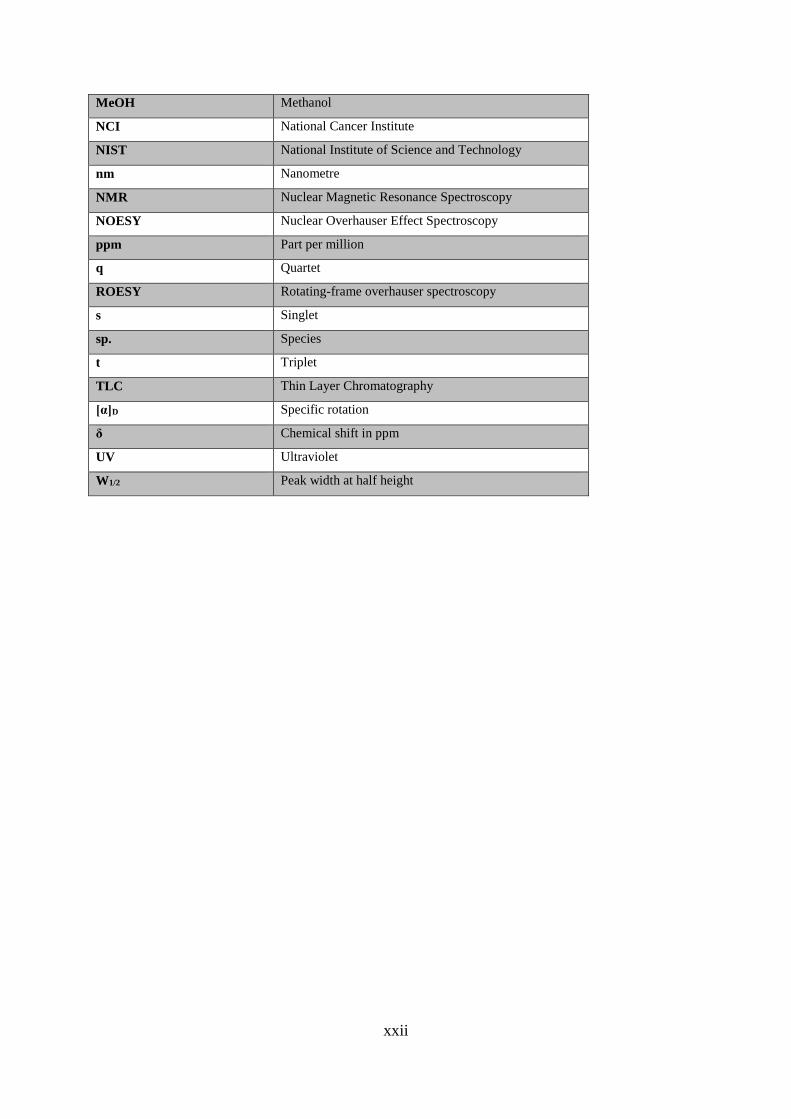
MeOH Methanol
NCI National Cancer Institute
NIST National Institute of Science and Technology
nm Nanometre
NMR Nuclear Magnetic Resonance Spectroscopy
NOESY Nuclear Overhauser Effect Spectroscopy
ppm Part per million
q Quartet
ROESY Rotating-frame overhauser spectroscopy
s Singlet
sp. Species
t Triplet
TLC Thin Layer Chromatography
[α]D Specific rotation
δ Chemical shift in ppm
UV Ultraviolet
W1/2 Peak width at half height
xxiii
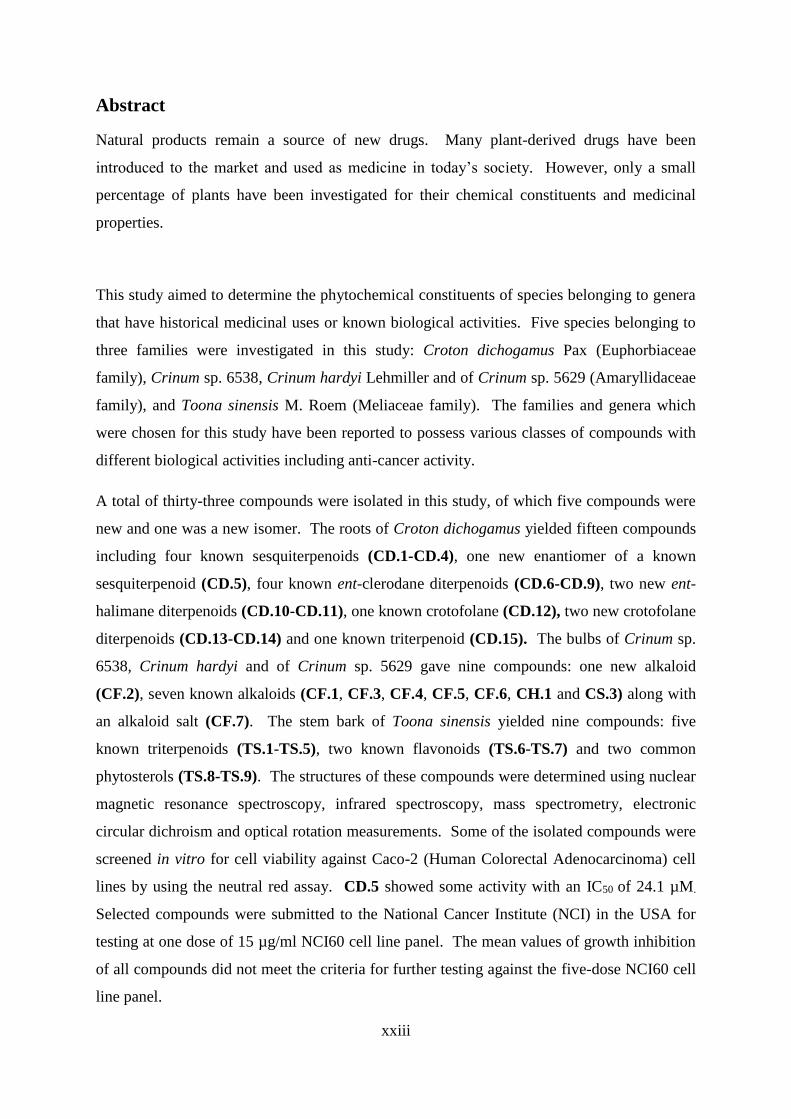
Abstract
Natural products remain a source of new drugs. Many plant-derived drugs have been
introduced to the market and used as medicine in today’s society. However, only a small
percentage of plants have been investigated for their chemical constituents and medicinal
properties.
This study aimed to determine the phytochemical constituents of species belonging to genera
that have historical medicinal uses or known biological activities. Five species belonging to
three families were investigated in this study: Croton dichogamus Pax (Euphorbiaceae
family), Crinum sp. 6538, Crinum hardyi Lehmiller and of Crinum sp. 5629 (Amaryllidaceae
family), and Toona sinensis M. Roem (Meliaceae family). The families and genera which
were chosen for this study have been reported to possess various classes of compounds with
different biological activities including anti-cancer activity.
A total of thirty-three compounds were isolated in this study, of which five compounds were
new and one was a new isomer. The roots of Croton dichogamus yielded fifteen compounds
including four known sesquiterpenoids (CD.1-CD.4), one new enantiomer of a known
sesquiterpenoid (CD.5), four known ent-clerodane diterpenoids (CD.6-CD.9), two new ent-
halimane diterpenoids (CD.10-CD.11), one known crotofolane (CD.12), two new crotofolane
diterpenoids (CD.13-CD.14) and one known triterpenoid (CD.15). The bulbs of Crinum sp.
6538, Crinum hardyi and of Crinum sp. 5629 gave nine compounds: one new alkaloid
(CF.2), seven known alkaloids (CF.1, CF.3, CF.4, CF.5, CF.6, CH.1 and CS.3) along with
an alkaloid salt (CF.7). The stem bark of Toona sinensis yielded nine compounds: five
known triterpenoids (TS.1-TS.5), two known flavonoids (TS.6-TS.7) and two common
phytosterols (TS.8-TS.9). The structures of these compounds were determined using nuclear
magnetic resonance spectroscopy, infrared spectroscopy, mass spectrometry, electronic
circular dichroism and optical rotation measurements. Some of the isolated compounds were
screened in vitro for cell viability against Caco-2 (Human Colorectal Adenocarcinoma) cell
lines by using the neutral red assay. CD.5 showed some activity with an IC50 of 24.1 µM.
Selected compounds were submitted to the National Cancer Institute (NCI) in the USA for
testing at one dose of 15 µg/ml NCI60 cell line panel. The mean values of growth inhibition
of all compounds did not meet the criteria for further testing against the five-dose NCI60 cell
line panel.
1
Chapter 1: General introduction
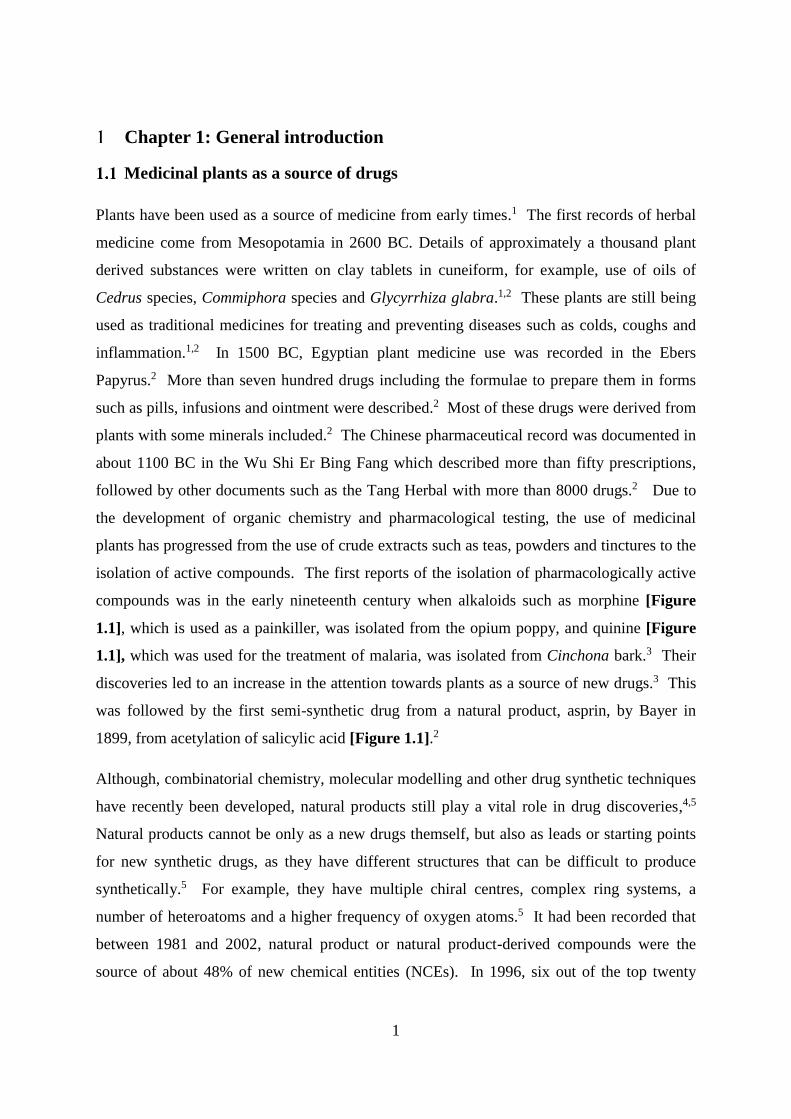
Medicinal plants as a source of drugs
Plants have been used as a source of medicine from early times.1 The first records of herbal
medicine come from Mesopotamia in 2600 BC. Details of approximately a thousand plant
derived substances were written on clay tablets in cuneiform, for example, use of oils of
Cedrus species, Commiphora species and Glycyrrhiza glabra.1,2 These plants are still being
used as traditional medicines for treating and preventing diseases such as colds, coughs and
inflammation.1,2 In 1500 BC, Egyptian plant medicine use was recorded in the Ebers
Papyrus.2 More than seven hundred drugs including the formulae to prepare them in forms
such as pills, infusions and ointment were described.2 Most of these drugs were derived from
plants with some minerals included.2 The Chinese pharmaceutical record was documented in
about 1100 BC in the Wu Shi Er Bing Fang which described more than fifty prescriptions,
followed by other documents such as the Tang Herbal with more than 8000 drugs.2 Due to
the development of organic chemistry and pharmacological testing, the use of medicinal
plants has progressed from the use of crude extracts such as teas, powders and tinctures to the
isolation of active compounds. The first reports of the isolation of pharmacologically active
compounds was in the early nineteenth century when alkaloids such as morphine [Figure
1.1], which is used as a painkiller, was isolated from the opium poppy, and quinine [Figure
1.1], which was used for the treatment of malaria, was isolated from Cinchona bark.3 Their
discoveries led to an increase in the attention towards plants as a source of new drugs.3 This
was followed by the first semi-synthetic drug from a natural product, asprin, by Bayer in
1899, from acetylation of salicylic acid [Figure 1.1].2
Although, combinatorial chemistry, molecular modelling and other drug synthetic techniques
have recently been developed, natural products still play a vital role in drug discoveries,4,5
Natural products cannot be only as a new drugs themself, but also as leads or starting points
for new synthetic drugs, as they have different structures that can be difficult to produce
synthetically.5 For example, they have multiple chiral centres, complex ring systems, a
number of heteroatoms and a higher frequency of oxygen atoms.5 It had been recorded that
between 1981 and 2002, natural product or natural product-derived compounds were the
source of about 48% of new chemical entities (NCEs). In 1996, six out of the top twenty
2
drugs were natural products and half of these were derived from natural product research,
which shows that natural products are a crucial source of new drugs and important in future
drug development.3 Between 2000-2005 23 new drugs from natural products sources were
marketed, and 84 of 150 prescription drugs were natural products or derivative drugs in the
United States.1 Some examples of medicinal plant-derived drugs that have been introduced
in the last decade to the market are Tiotropium bromide (trade name Spiriva®, 2004) [Figure
1.1], which is used for treatment of chronic obstructive pulmonary disease (COPA).1,4
Tiotropium is derived from atropine that comes from Atropa belladonna L. (Solanaceae).1,4
Apomorphine hydrochloride (trade name Apokyn®, 2004) [Figure 1.1], is used to treat
Parkinson’s disease and is a derivative of morphine isolated from the poppy Papaver
somniferum L (Papaveraceae).1,4 Nitisinone (trade name Orfadin®, 2002) [Figure 1.1], is
used to treat hereditary tyrosinaemia type 1 (HT-1) and is a derivative of leptospermone from
the bottlebrush Callistemon citrinus Stapf. (Myrtaceae).1,4 Galanthamine (trade name
Reminyl®, 2001) [Figure 1.1], is used to treat Alzheimer’s disease and is isolated from
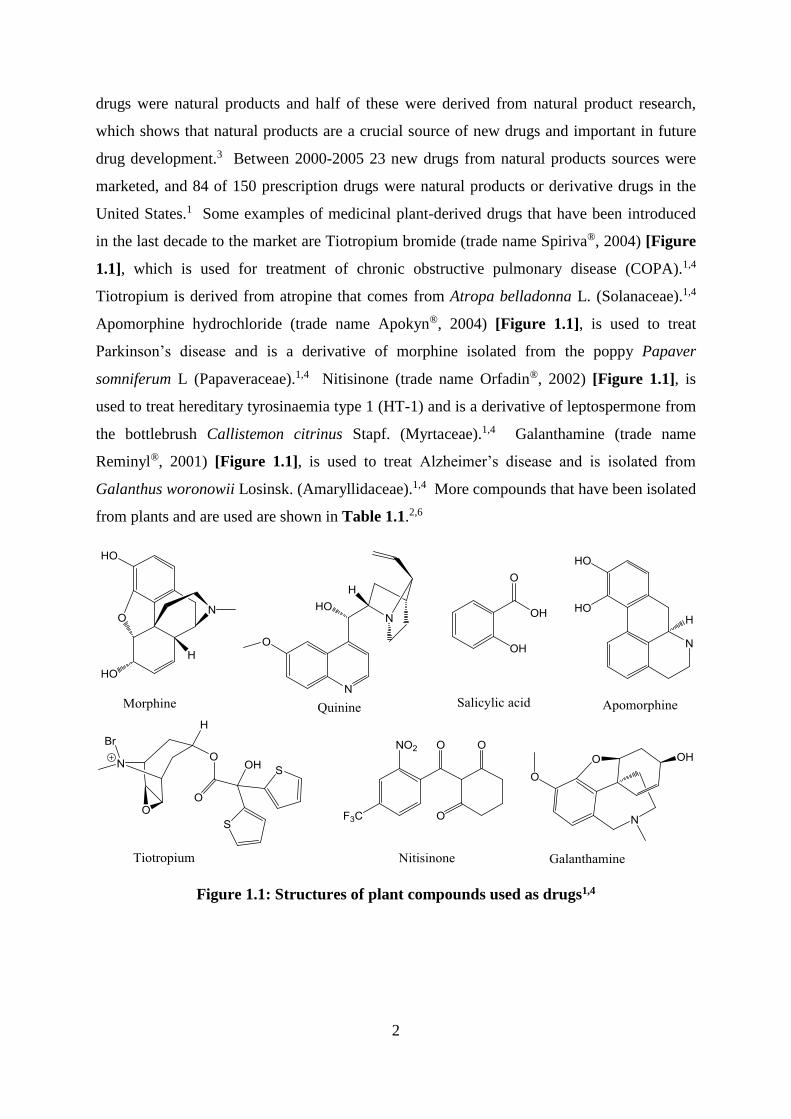
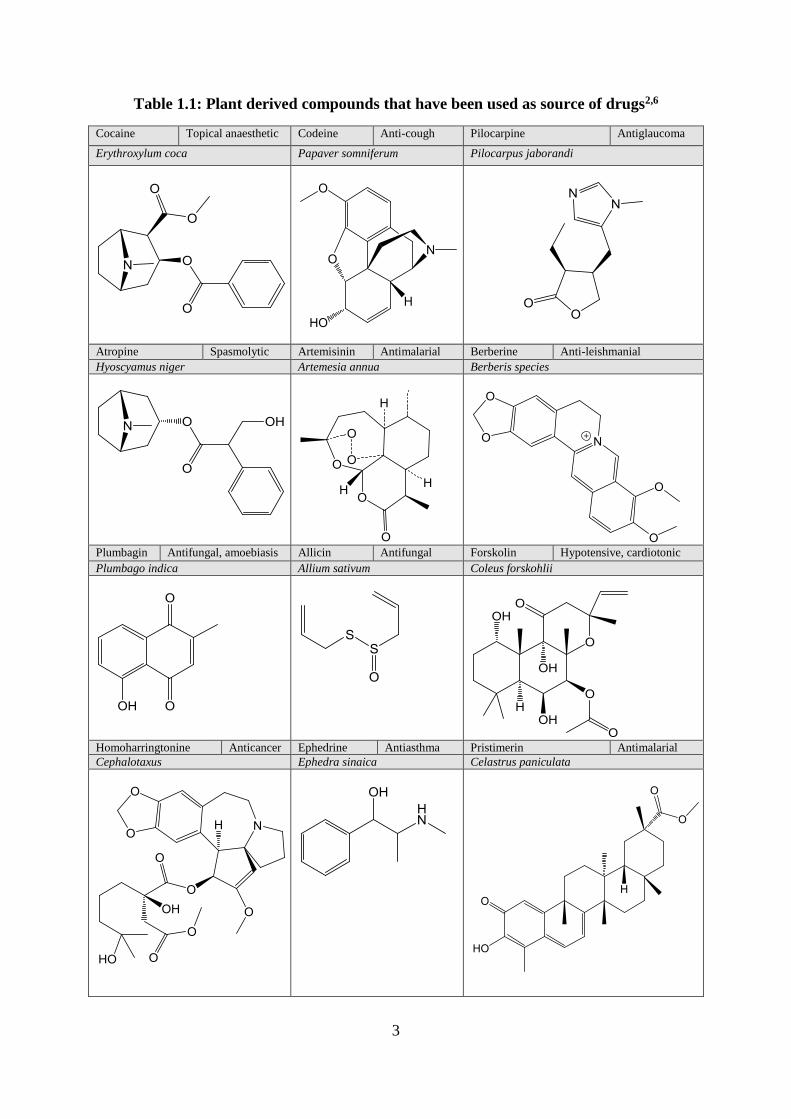
Galanthus woronowii Losinsk. (Amaryllidaceae).1,4 More compounds that have been isolated
from plants and are used are shown in Table 1.1.2,6
Figure 1.1: Structures of plant compounds used as drugs1,4
3
Table 1.1: Plant derived compounds that have been used as source of drugs2,6
Cocaine Topical anaesthetic Codeine Anti-cough Pilocarpine Antiglaucoma
Erythroxylum coca Papaver somniferum Pilocarpus jaborandi
Atropine Spasmolytic Artemisinin Antimalarial Berberine Anti-leishmanial
Hyoscyamus niger Artemesia annua Berberis species
Plumbagin Antifungal, amoebiasis Allicin Antifungal Forskolin Hypotensive, cardiotonic
Plumbago indica Allium sativum Coleus forskohlii
Homoharringtonine Anticancer Ephedrine Antiasthma Pristimerin Antimalarial
Cephalotaxus Ephedra sinaica Celastrus paniculata
4
Rescinnamine Tranquilizer Sophoradin Antiulcer
Rauvolfia serpentina Sophora subprostrata
Vinblastine Anticancer Camptothecine Anticancer
Catharanthus roseus Camptotheca acuminata
Taxol Breast and ovarian anticancer Quassin Antiamoebic agent
Taxus baccata Ailanthus landulosa
5
In the last 40 years, the popularity of using herbs and traditional medicine has increased in
both industrialized and developing countries.7 In 1985, the World Health Organization
estimated that over 75% of the world population relied on plants for health care.8 A survey in
2007, reported that complementary and alternative medicine (CAM) were used by
approximately 11% of children and 40% of adults.7 Another study in 2012 showed that CAM
was used more by people with a higher education level.7 This reliance on traditional
medicine could be due to the resistance of many pathogens to synthetic drugs, the side effects
of numerous types of treatments, and shortages or costs of other drugs.6
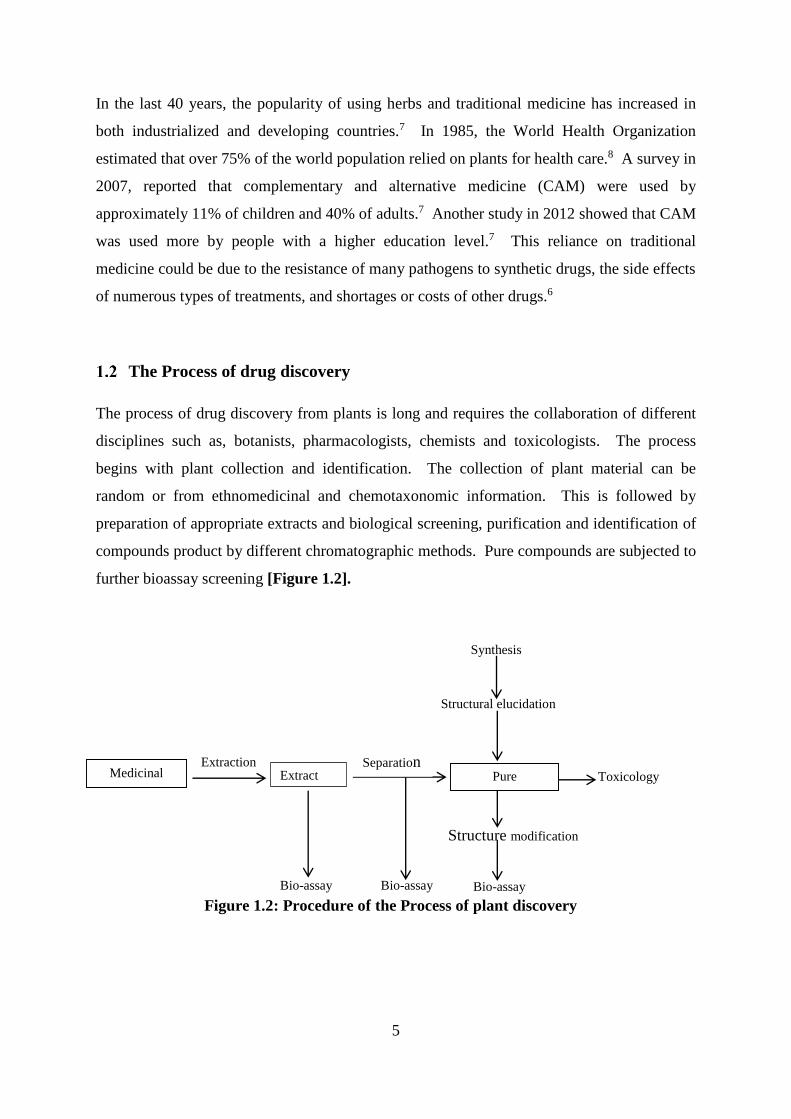
The Process of drug discovery
The process of drug discovery from plants is long and requires the collaboration of different
disciplines such as, botanists, pharmacologists, chemists and toxicologists. The process
begins with plant collection and identification. The collection of plant material can be
random or from ethnomedicinal and chemotaxonomic information. This is followed by
preparation of appropriate extracts and biological screening, purification and identification of
compounds product by different chromatographic methods. Pure compounds are subjected to
further bioassay screening [Figure 1.2].
Figure 1.2: Procedure of the Process of plant discovery
Extraction
Structural elucidation
Medicinal
plant Extract Pure
constituents
Toxicology
Separation
Bio-assay Bio-assay
Structure modification
Bio-assay
Synthesis
6
Objective of the study
The objectives of this study were:
To determine the chemical constituents of Croton dichogamus Pax
[Euphorbiaceae family]
To determine the chemical constituents of three Crinum species: Crinum
species 1 6538, Crinum hardyi Lehmiller and Crinum species 2 6529
[Amaryllidaceae family] and compare them to these of Crinum firmifolium
Var. hygrophilum H. Perr
To compare the chemical constituents Toona sinensis [Meliaceae family]
grown in the UK and in Asia.
To determine the biological activities of most compound isolated by
submitting to the National Cancer Institute (NCI), and to test some of the
compounds isolated for cytotoxicity against Caco-2 cancer cell lines.
7
Chapter Two: The phytochemistry of Croton dichogamus Pax
[Euphorbiaceae family]
Introduction to the Euphorbiaceae family
The Euphorbiaceae family is one of the largest and most complex Dicot families.9,10 The
Euphorbiaceae family displays a wide range of growth forms from trees and shrubs to herbs,
and it is widely distributed in the tropics with high occurrence in Africa including
Madagascar.9,10 Between 1975 and 1994 more than 300 genera of Euphorbiaceae were
classified into two groups depending on the number of ovules present, and five subfamilies:
the first group contains the Acalyphoideae, the Crotonoideae and the Euphorbioideae that are
uniovulate, and the second group contains the Phyllanthoideae and the Oldfieldioideae that
are biovulate.9,11 Later on the Angiosperm Phylogeny Group (APG ІІ, 2003) found that there
was no molecular evidence to keep the Euphorbiaceae as one family, and they divided it into
three families: the Euphorbiaceae that includes the uniovulate subfamilies, and the
Phyllanthaceae and Picrodendraceae that include the biovulate subfamilies, the
Phyllanthoideae and Oldfieldioideae respectively.12 However, in 2005, Wurdack et al.
proposed two new subfamilies in the Euphorbiaceae, the Cheilosoideae and Peroideae
according to molecular data obtained from investigations of the plastid regions of DNA.13
Introduction to the Croton genus
The Croton genus
Croton belongs to the Crotonoideae subfamily, which is categorized by having crotonoid
pollen with lactiferous taxa.13,14 The Crotonoideae subfamily has been divided into four
clades: Adenoclineae, Articulated Crotonoideae, Gelonieae and Inaperturate Crotonoideae,13
12 tribes and 73 genera.15 The Croton genus is placed into the Crotoneae tribe of the
Inaperturate Crotonoideae clade,13 and it is one of the largest genera of the Euphorbiaceae
family with more than 800 species occurring in the tropics and subtropics, the majority in
America.15,16 The main morphological characteristics of the Croton genus, which differ from
other genera, are that the petals and pistillate flowers can either be reduced or absent, the
filament in the staminate flowers are inflexed in the bud and the terminal flowers in the
thyrses are usually pistillate, while distal flowers in cymules are staminate.15,16
8
Ethnobotany and biological screening of the Croton genus
Various types of Croton plant parts and fractions have been used in folk medicine.17 In the
1600s, the wide use by Mexican tribes of Croton’s sap known as dragon’s blood which is a red
resin produced by scratching the stem or bark of plants, was reported for the first time.18
Dragon’s blood has been found from different sources such as Venezuelan dragon’s blood from
Croton gossypifolium Vahl and Mexican dragon’s blood from Croton lechleri Müll. Arg. and it
also can be produced from other plants like Zanzibar dragon’s blood from Dracaena cinnabari
Balf. f.and West Indian dragon’s blood from Pterocarpus draco L..19 The Croton’s sap has been
used as a household remedy to cure many diseases such as diarrhoea, stomach ulcers, pain and
swelling of insect bites and herpes infection.18,20 Several species of Croton are used in South
America, Asia and Africa in traditional medicine. Pharmacological and clinical studies of
plant extracts and compounds isolated from some of these species have been undertaken.
Examples of the ethno-medicinal applications and biological activities of different Croton
species are given in Table 2.1.
9
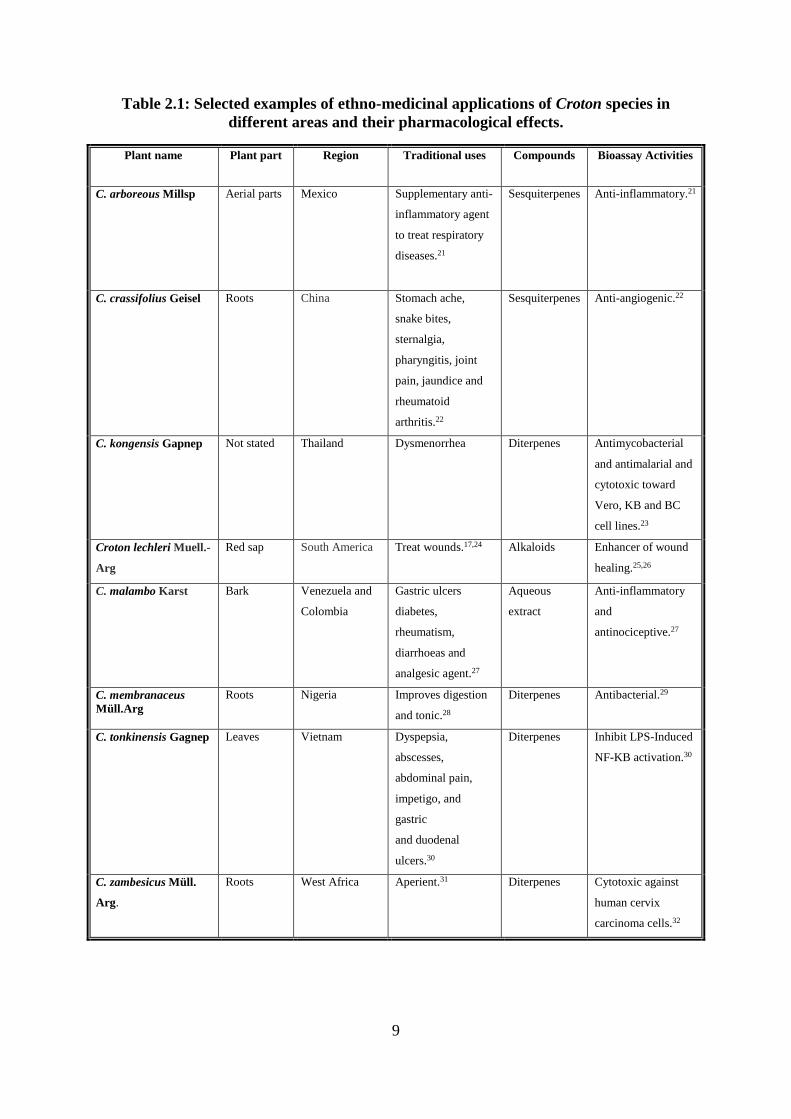
Table 2.1: Selected examples of ethno-medicinal applications of Croton species in
different areas and their pharmacological effects.
Plant name Plant part Region Traditional uses Compounds Bioassay Activities
C. arboreous Millsp Aerial parts Mexico Supplementary anti-
inflammatory agent
to treat respiratory
diseases.21
Sesquiterpenes Anti-inflammatory.21
C. crassifolius Geisel Roots China Stomach ache,
snake bites,
sternalgia,
pharyngitis, joint
pain, jaundice and
rheumatoid
arthritis.22
Sesquiterpenes Anti-angiogenic.22
C. kongensis Gapnep Not stated Thailand Dysmenorrhea Diterpenes Antimycobacterial
and antimalarial and
cytotoxic toward
Vero, KB and BC
cell lines.23
Croton lechleri Muell.-
Arg
Red sap South America Treat wounds.17,24 Alkaloids Enhancer of wound
healing.25,26
C. malambo Karst Bark Venezuela and
Colombia
Gastric ulcers
diabetes,
rheumatism,
diarrhoeas and
analgesic agent.27
Aqueous
extract
Anti-inflammatory
and
antinociceptive.27
C. membranaceus
Müll.Arg
Roots Nigeria Improves digestion
and tonic.28
Diterpenes Antibacterial.29
C. tonkinensis Gagnep Leaves Vietnam Dyspepsia,
abscesses,
abdominal pain,
impetigo, and
gastric
and duodenal
ulcers.30
Diterpenes Inhibit LPS-Induced
NF-KB activation.30
C. zambesicus Müll.
Arg.
Roots West Africa Aperient.31 Diterpenes Cytotoxic against
human cervix
carcinoma cells.32
10
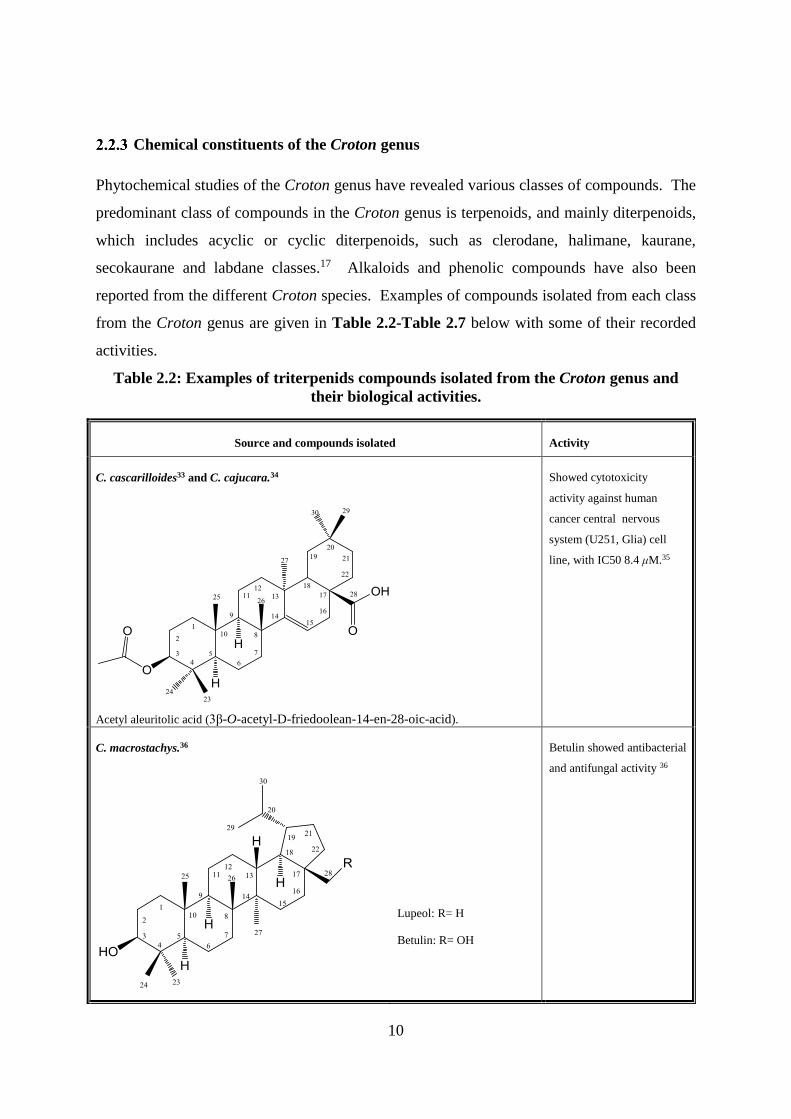
Chemical constituents of the Croton genus
Phytochemical studies of the Croton genus have revealed various classes of compounds. The
predominant class of compounds in the Croton genus is terpenoids, and mainly diterpenoids,
which includes acyclic or cyclic diterpenoids, such as clerodane, halimane, kaurane,
secokaurane and labdane classes.17 Alkaloids and phenolic compounds have also been
reported from the different Croton species. Examples of compounds isolated from each class
from the Croton genus are given in Table 2.2-Table 2.7 below with some of their recorded
activities.
Table 2.2: Examples of triterpenids compounds isolated from the Croton genus and
their biological activities.
Source and compounds isolated Activity
C. cascarilloides33 and C. cajucara.34
Acetyl aleuritolic acid (3β-O-acetyl-D-friedoolean-14-en-28-oic-acid).
Showed cytotoxicity
activity against human
cancer central nervous
system (U251, Glia) cell
line, with IC50 8.4 μM.35
C. macrostachys.36
Lupeol: R= H
Betulin: R= OH
Betulin showed antibacterial
and antifungal activity 36
11
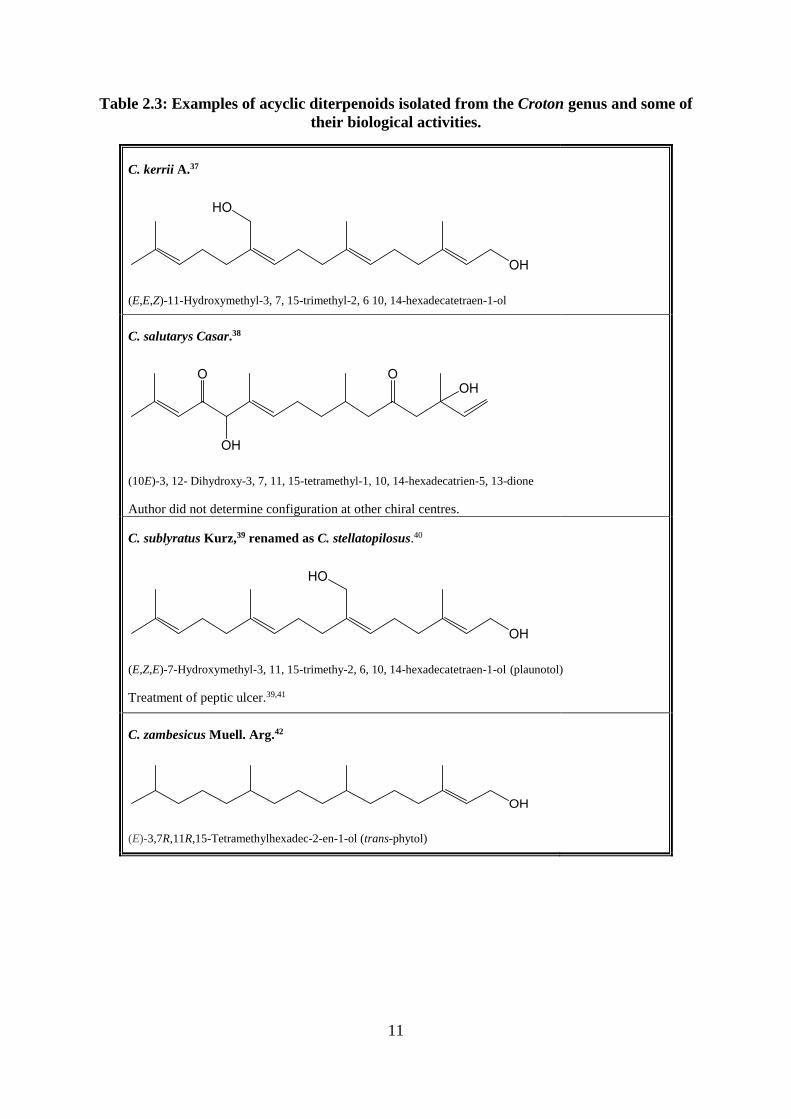
Table 2.3: Examples of acyclic diterpenoids isolated from the Croton genus and some of
their biological activities.
C. kerrii A.37
(E,E,Z)-11-Hydroxymethyl-3, 7, 15-trimethyl-2, 6 10, 14-hexadecatetraen-1-ol
C. salutarys Casar.38
(10E)-3, 12- Dihydroxy-3, 7, 11, 15-tetramethyl-1, 10, 14-hexadecatrien-5, 13-dione
Author did not determine configuration at other chiral centres.
C. sublyratus Kurz,39 renamed as C. stellatopilosus.40
(E,Z,E)-7-Hydroxymethyl-3, 11, 15-trimethy-2, 6, 10, 14-hexadecatetraen-1-ol (plaunotol)
Treatment of peptic ulcer.39,41
C. zambesicus Muell. Arg.42
(E)-3,7R,11R,15-Tetramethylhexadec-2-en-1-ol (trans-phytol)
12
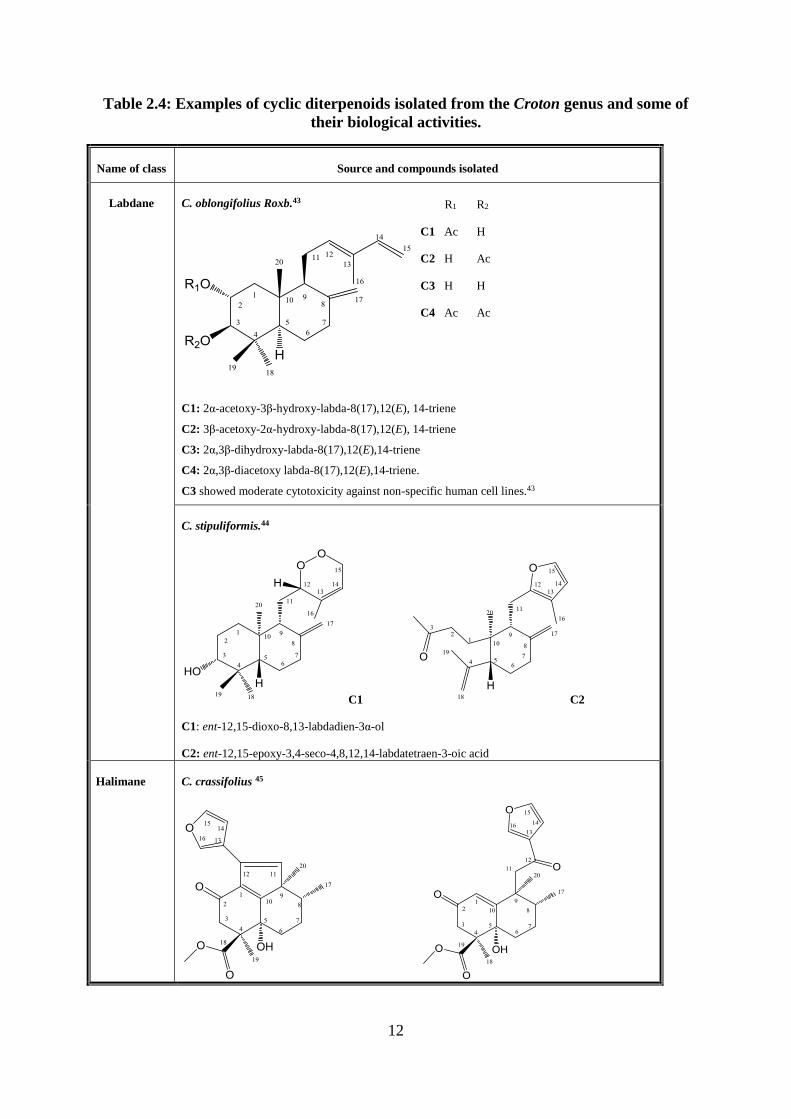
Table 2.4: Examples of cyclic diterpenoids isolated from the Croton genus and some of
their biological activities.
Name of class Source and compounds isolated
Labdane C. oblongifolius Roxb.43
C1: 2α-acetoxy-3β-hydroxy-labda-8(17),12(E), 14-triene
C2: 3β-acetoxy-2α-hydroxy-labda-8(17),12(E), 14-triene
C3: 2α,3β-dihydroxy-labda-8(17),12(E),14-triene
C4: 2α,3β-diacetoxy labda-8(17),12(E),14-triene.
C3 showed moderate cytotoxicity against non-specific human cell lines.43
R1 R2
C1 Ac H
C2 H Ac
C3 H H
C4 Ac Ac
C. stipuliformis.44
C1 C2
C1: ent-12,15-dioxo-8,13-labdadien-3α-ol
C2: ent-12,15-epoxy-3,4-seco-4,8,12,14-labdatetraen-3-oic acid
Halimane C. crassifolius 45
13
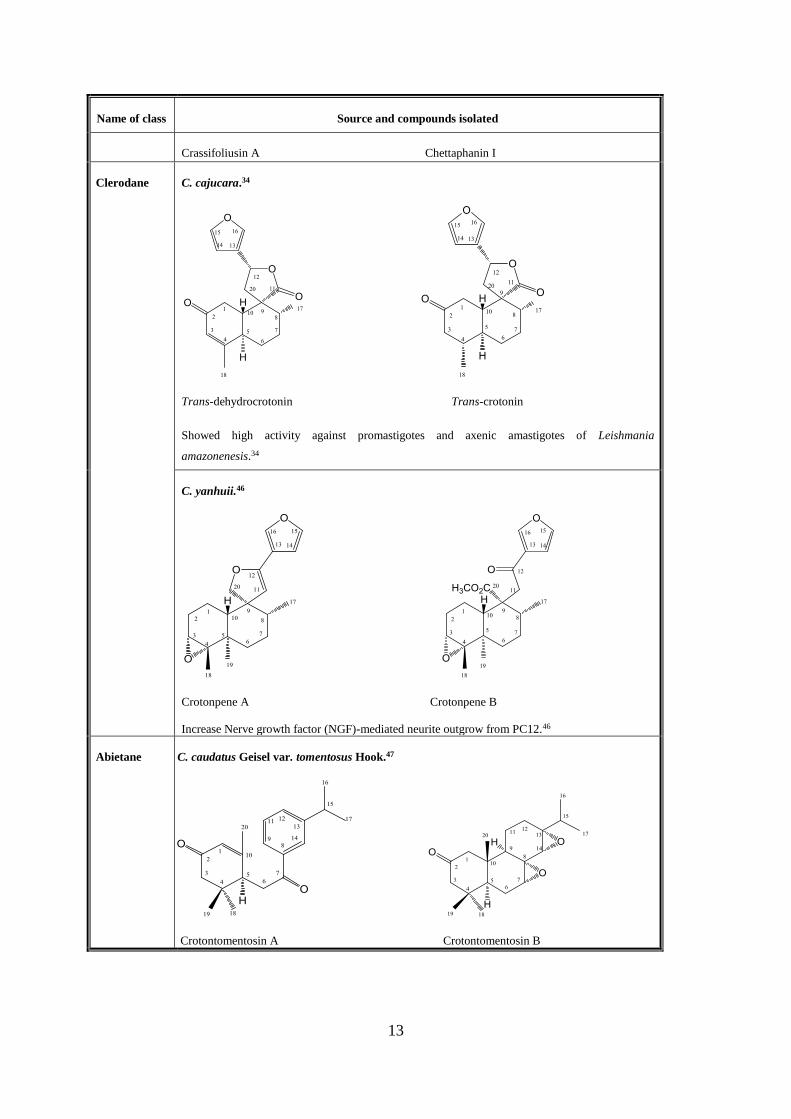
Name of class Source and compounds isolated
Crassifoliusin A Chettaphanin I
Clerodane
C. cajucara.34
Trans-dehydrocrotonin Trans-crotonin
Showed high activity against promastigotes and axenic amastigotes of Leishmania
amazonenesis.34
C. yanhuii.46
Crotonpene A Crotonpene B
Increase Nerve growth factor (NGF)-mediated neurite outgrow from PC12.46
Abietane C. caudatus Geisel var. tomentosus Hook.47
Crotontomentosin A Crotontomentosin B
14
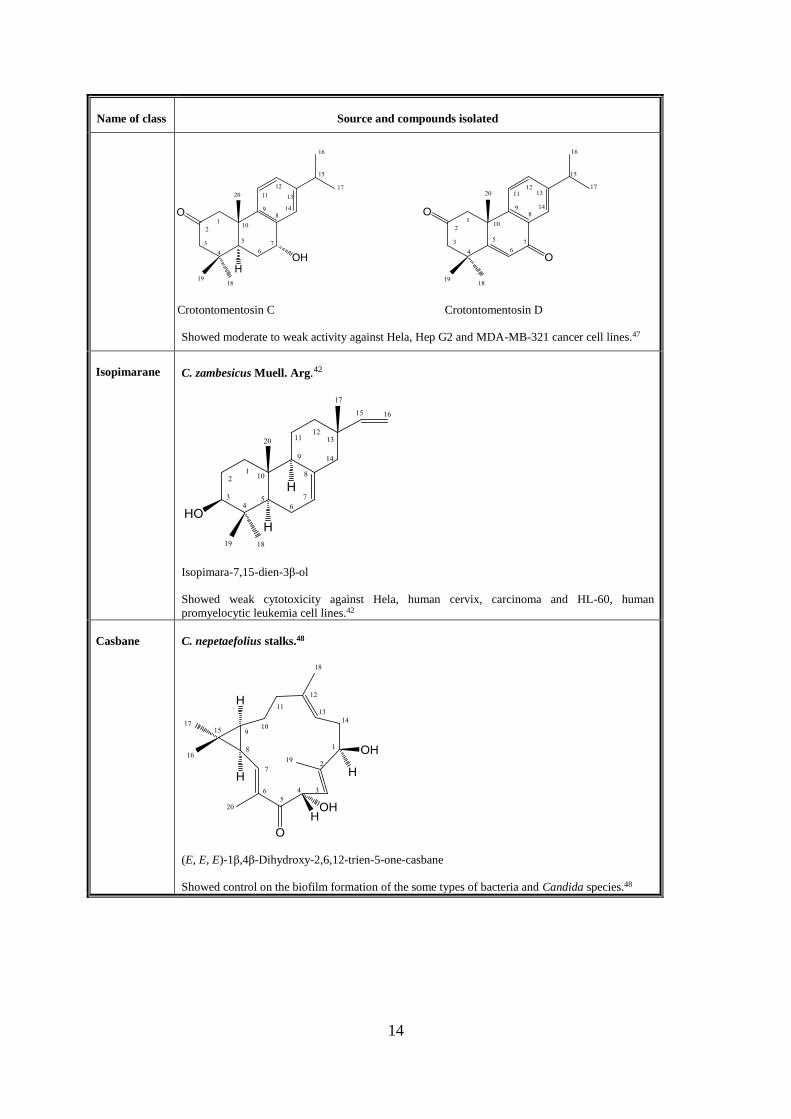
Name of class Source and compounds isolated
Crotontomentosin C Crotontomentosin D
Showed moderate to weak activity against Hela, Hep G2 and MDA-MB-321 cancer cell lines.47
Isopimarane C. zambesicus Muell. Arg.42
Isopimara-7,15-dien-3β-ol
Showed weak cytotoxicity against Hela, human cervix, carcinoma and HL-60, human
promyelocytic leukemia cell lines.42
Casbane C. nepetaefolius stalks.48
(E, E, E)-1β,4β-Dihydroxy-2,6,12-trien-5-one-casbane
Showed control on the biofilm formation of the some types of bacteria and Candida species.48
15
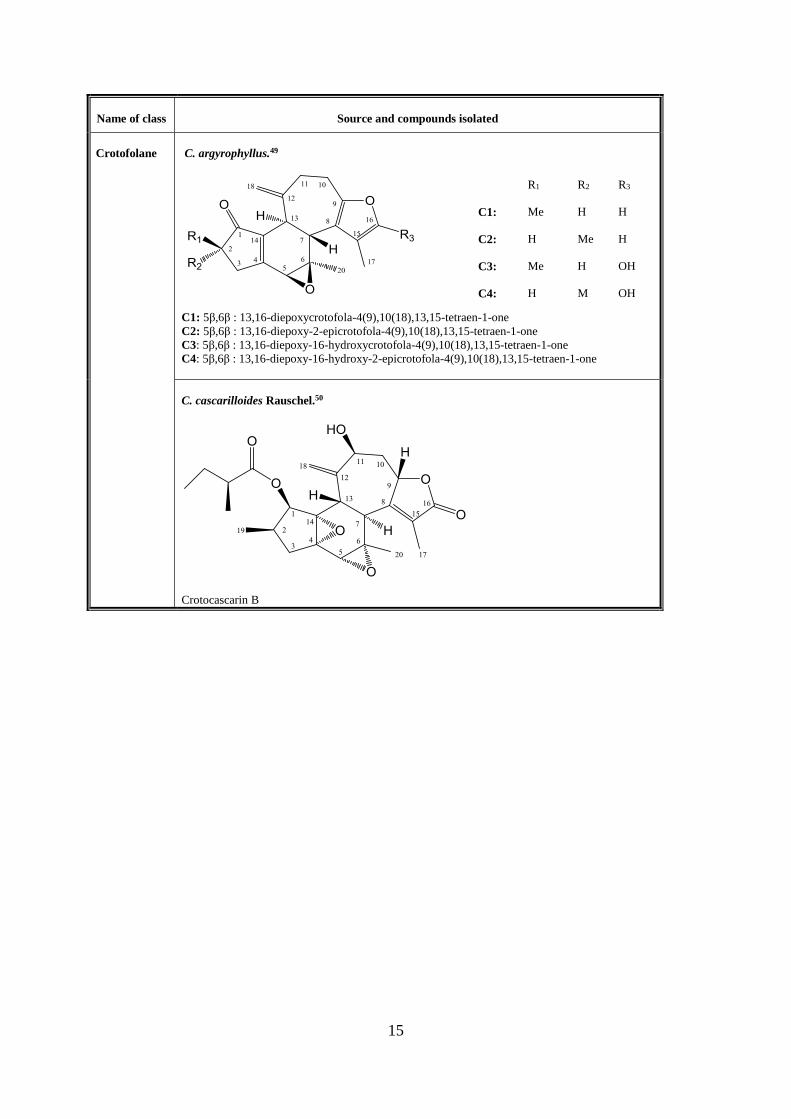
Name of class Source and compounds isolated
Crotofolane C. argyrophyllus.49
C1: 5β,6β : 13,16-diepoxycrotofola-4(9),10(18),13,15-tetraen-1-one
C2: 5β,6β : 13,16-diepoxy-2-epicrotofola-4(9),10(18),13,15-tetraen-1-one
C3: 5β,6β : 13,16-diepoxy-16-hydroxycrotofola-4(9),10(18),13,15-tetraen-1-one
C4: 5β,6β : 13,16-diepoxy-16-hydroxy-2-epicrotofola-4(9),10(18),13,15-tetraen-1-one
R1 R2 R3
C1: Me H H
C2: H Me H
C3: Me H OH
C4: H M OH
C. cascarilloides Rauschel.50
Crotocascarin B
16
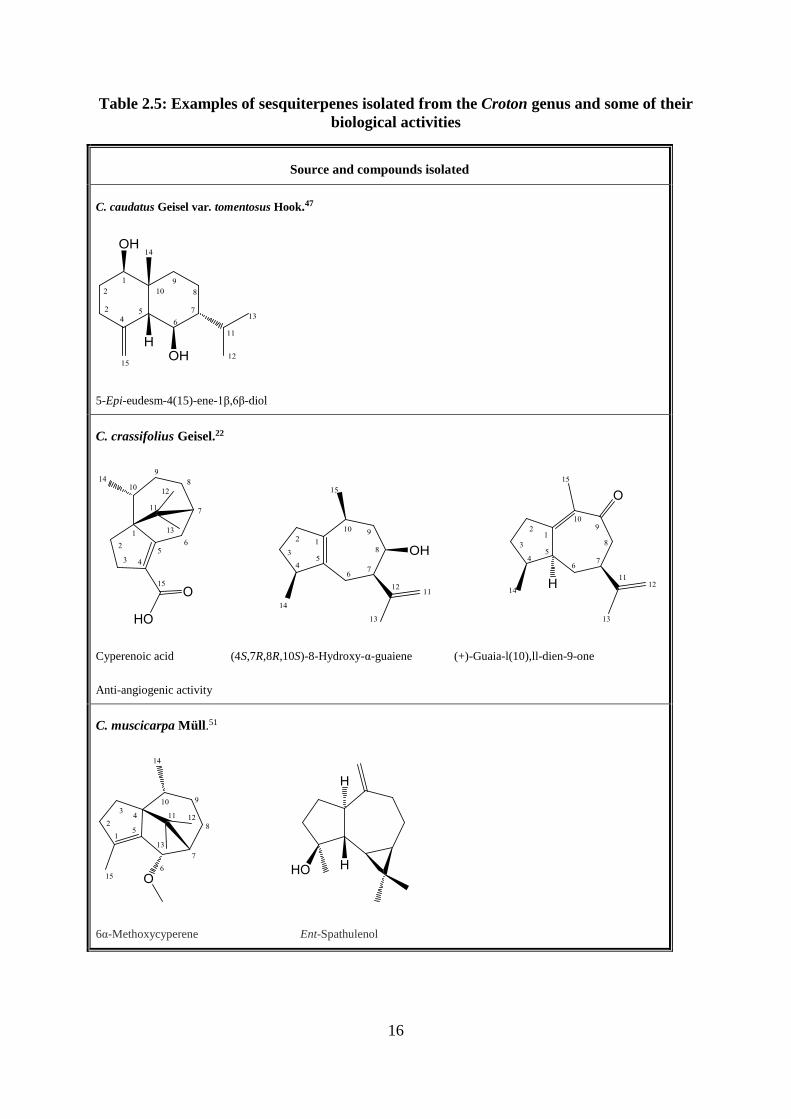
Table 2.5: Examples of sesquiterpenes isolated from the Croton genus and some of their
biological activities
Source and compounds isolated
C. caudatus Geisel var. tomentosus Hook.47
5-Epi-eudesm-4(15)-ene-1β,6β-diol
C. crassifolius Geisel.22
Cyperenoic acid (4S,7R,8R,10S)-8-Hydroxy-α-guaiene (+)-Guaia-l(10),ll-dien-9-one
Anti-angiogenic activity
C. muscicarpa Müll.51
6α-Methoxycyperene Ent-Spathulenol
17
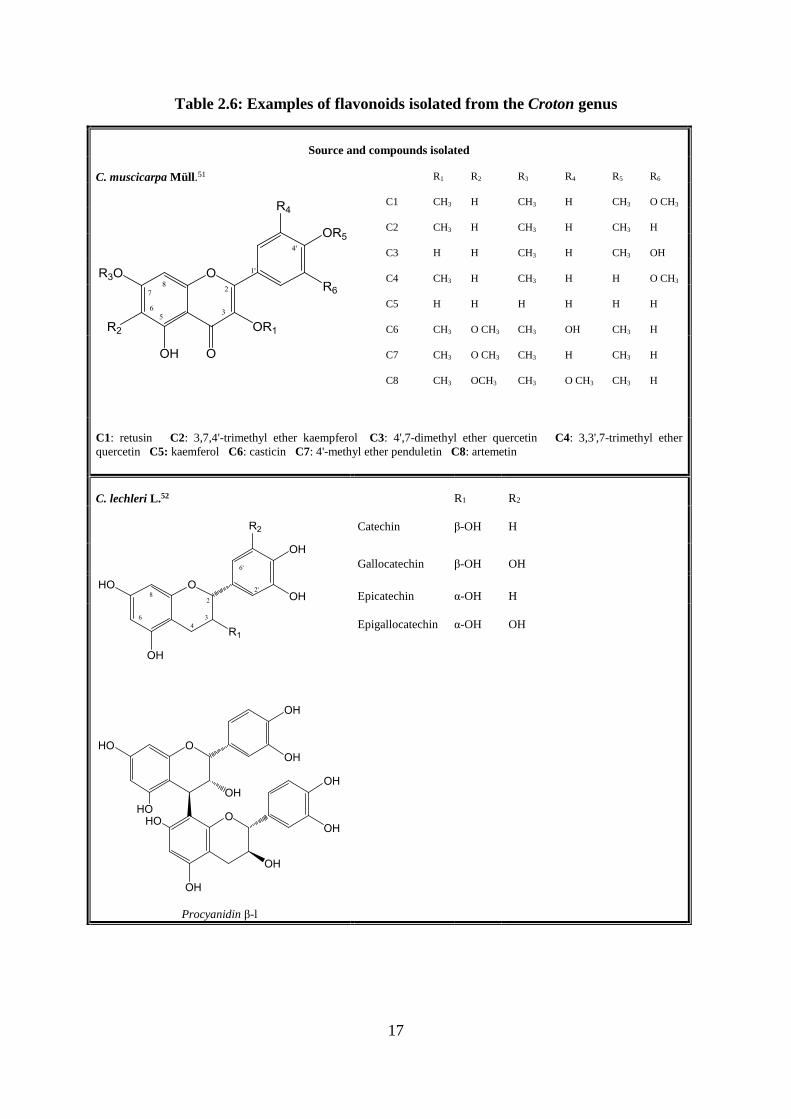
Table 2.6: Examples of flavonoids isolated from the Croton genus
Source and compounds isolated
C. muscicarpa Müll.51
R1 R2 R3 R4 R5 R6
C1 CH3 H CH3 H CH3 O CH3
C2 CH3 H CH3 H CH3 H
C3 H H CH3 H CH3 OH
C4 CH3 H CH3 H H O CH3
C5 H H H H H H
C6 CH3 O CH3 CH3 OH CH3 H
C7 CH3 O CH3 CH3 H CH3 H
C8 CH3 OCH3 CH3 O CH3 CH3 H
C1: retusin C2: 3,7,4'-trimethyl ether kaempferol C3: 4',7-dimethyl ether quercetin C4: 3,3',7-trimethyl ether
quercetin C5: kaemferol C6: casticin C7: 4'-methyl ether penduletin C8: artemetin
C. lechleri L.52
Procyanidin β-l
R1 R2
Catechin β-OH H
Gallocatechin β-OH OH
Epicatechin α-OH H
Epigallocatechin
α-OH
OH
18
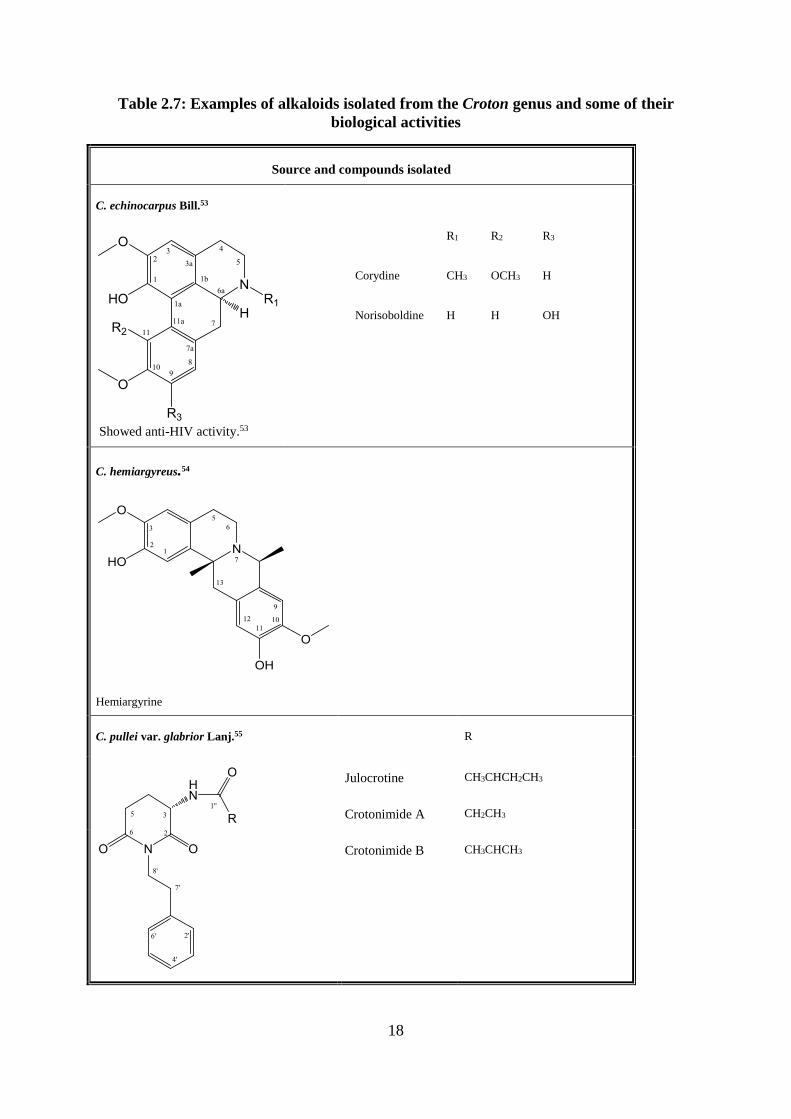
Table 2.7: Examples of alkaloids isolated from the Croton genus and some of their
biological activities
Source and compounds isolated
C. echinocarpus Bill.53
Showed anti-HIV activity.53
R1 R2 R3
Corydine CH3 OCH3 H
Norisoboldine H H OH
C. hemiargyreus.54
Hemiargyrine
C. pullei var. glabrior Lanj.55
R
Julocrotine CH3CHCH2CH3
Crotonimide A CH2CH3
Crotonimide B
CH3CHCH3
19
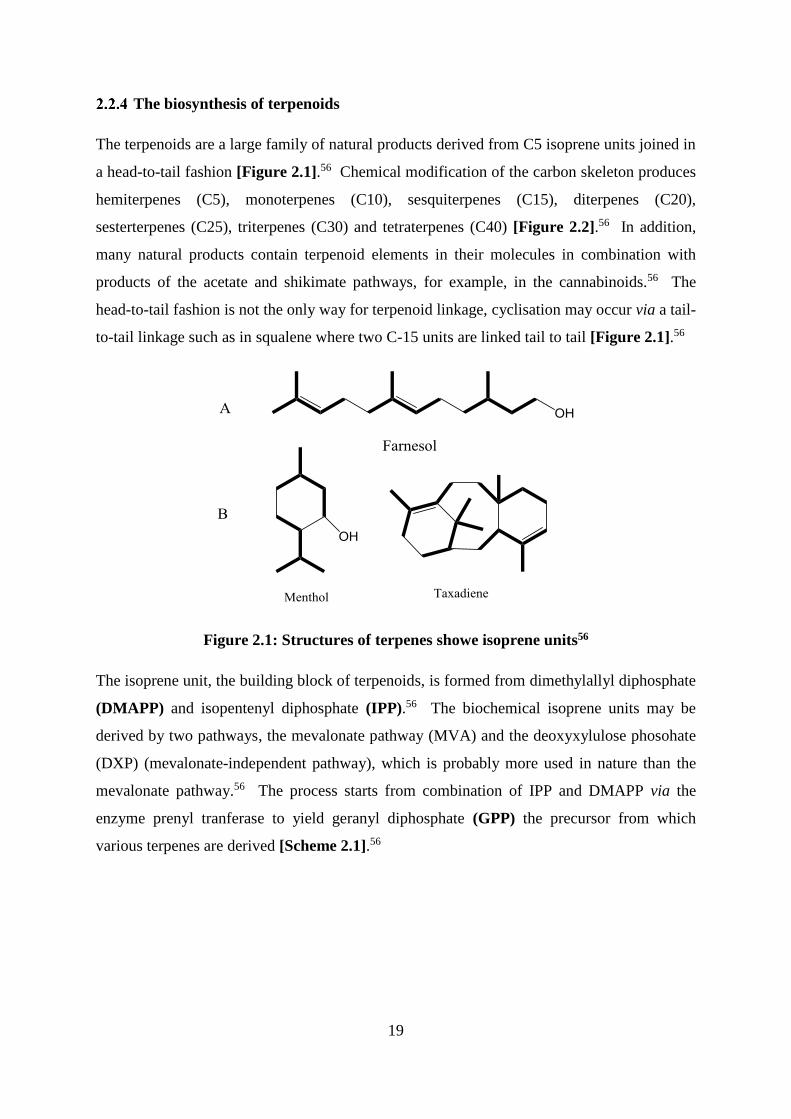
The biosynthesis of terpenoids
The terpenoids are a large family of natural products derived from C5 isoprene units joined in
a head-to-tail fashion [Figure 2.1].56 Chemical modification of the carbon skeleton produces
hemiterpenes (C5), monoterpenes (C10), sesquiterpenes (C15), diterpenes (C20),
sesterterpenes (C25), triterpenes (C30) and tetraterpenes (C40) [Figure 2.2].56 In addition,
many natural products contain terpenoid elements in their molecules in combination with
products of the acetate and shikimate pathways, for example, in the cannabinoids.56 The
head-to-tail fashion is not the only way for terpenoid linkage, cyclisation may occur via a tail-
to-tail linkage such as in squalene where two C-15 units are linked tail to tail [Figure 2.1].56
Figure 2.1: Structures of terpenes showe isoprene units56
The isoprene unit, the building block of terpenoids, is formed from dimethylallyl diphosphate
(DMAPP) and isopentenyl diphosphate (IPP).56 The biochemical isoprene units may be
derived by two pathways, the mevalonate pathway (MVA) and the deoxyxylulose phosohate
(DXP) (mevalonate-independent pathway), which is probably more used in nature than the
mevalonate pathway.56 The process starts from combination of IPP and DMAPP via the
enzyme prenyl tranferase to yield geranyl diphosphate (GPP) the precursor from which
various terpenes are derived [Scheme 2.1].56
20
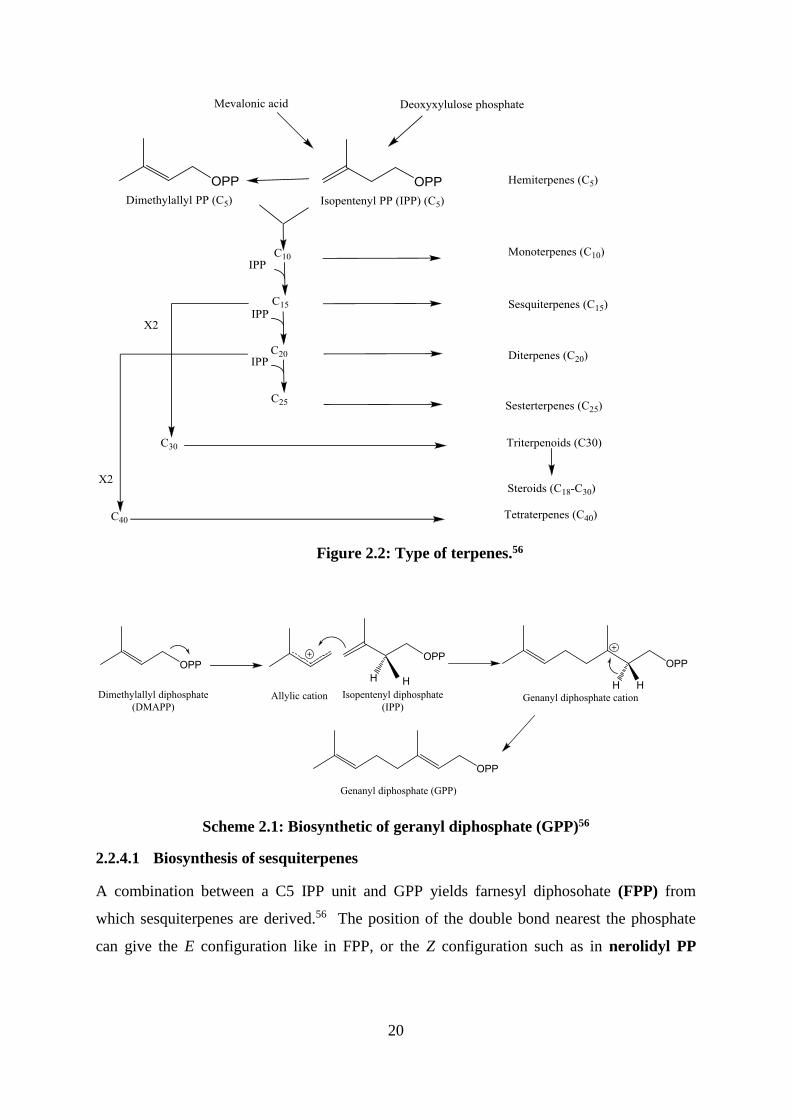
Figure 2.2: Type of terpenes.56
Scheme 2.1: Biosynthetic of geranyl diphosphate (GPP)56
2.2.4.1 Biosynthesis of sesquiterpenes
A combination between a C5 IPP unit and GPP yields farnesyl diphosohate (FPP) from
which sesquiterpenes are derived.56 The position of the double bond nearest the phosphate
can give the E configuration like in FPP, or the Z configuration such as in nerolidyl PP
21
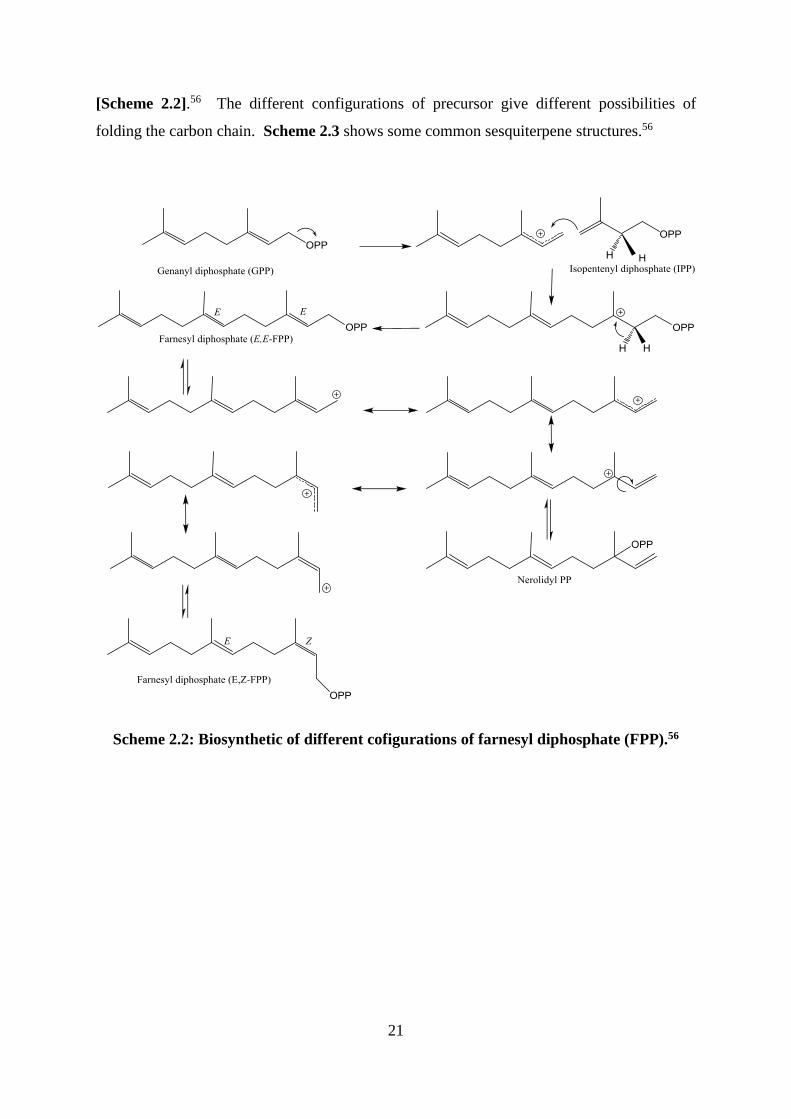
[Scheme 2.2].56 The different configurations of precursor give different possibilities of
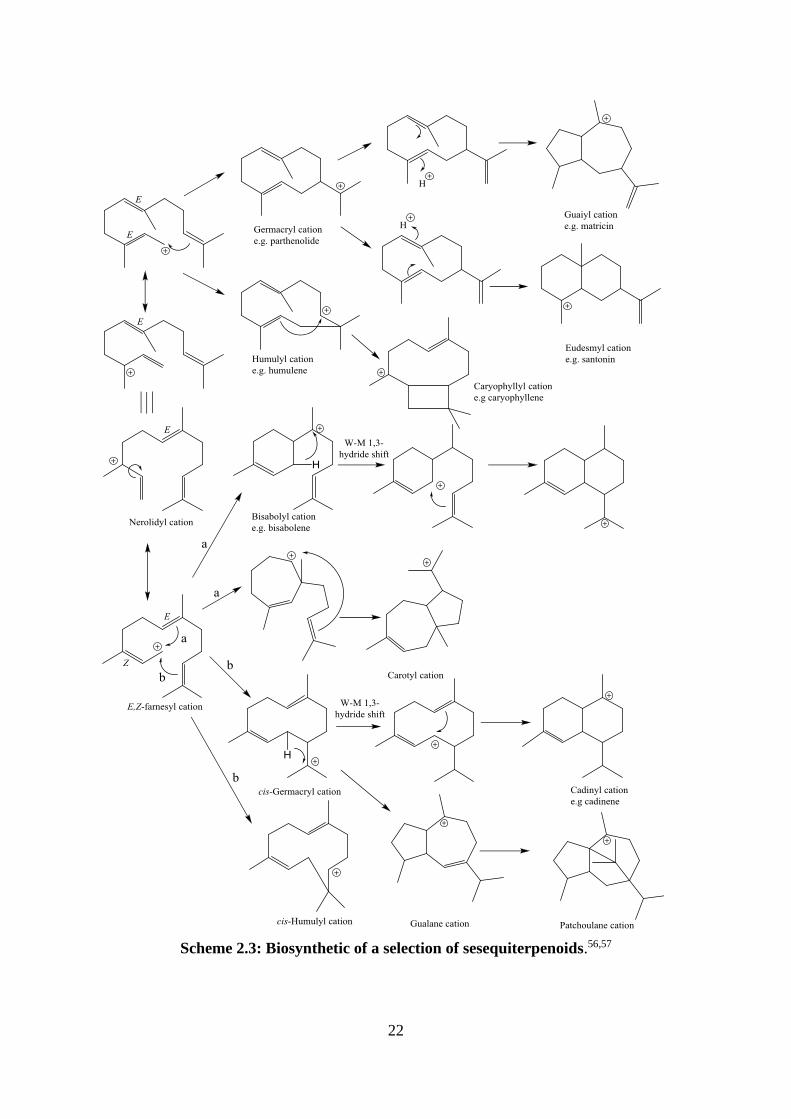
folding the carbon chain. Scheme 2.3 shows some common sesquiterpene structures.56
Scheme 2.2: Biosynthetic of different cofigurations of farnesyl diphosphate (FPP).56
22
Scheme 2.3: Biosynthetic of a selection of sesequiterpenoids.56,57
23
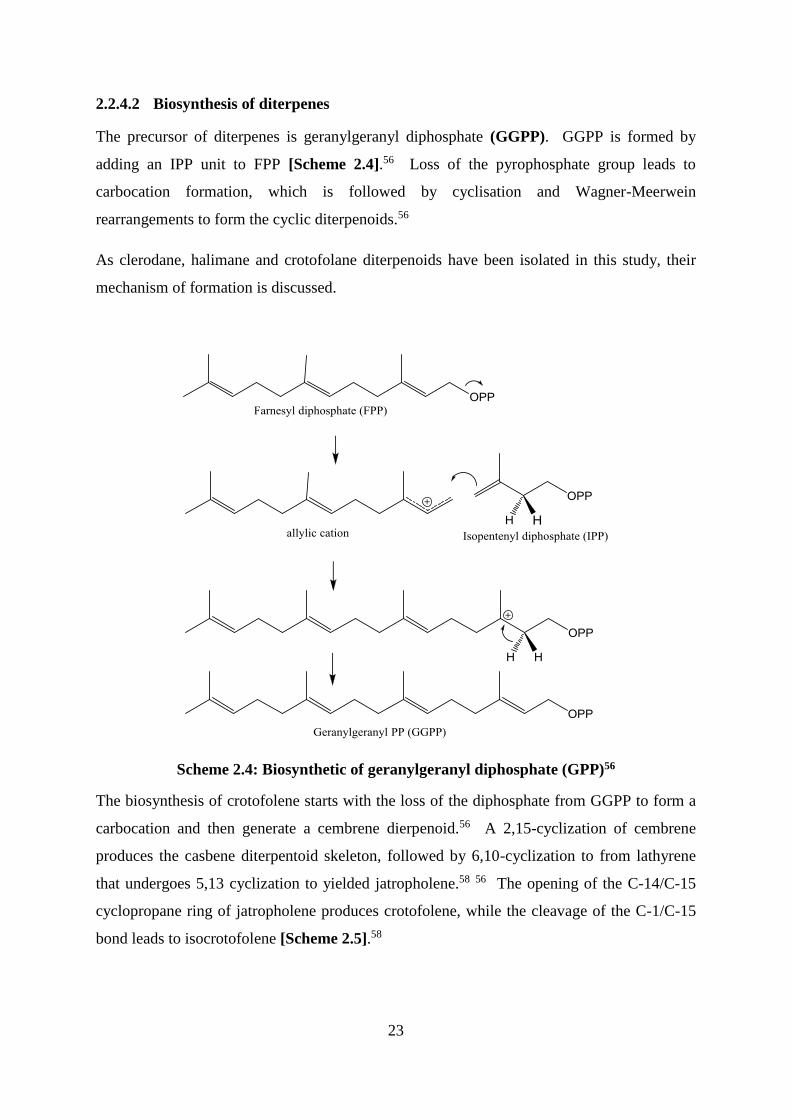
2.2.4.2 Biosynthesis of diterpenes
The precursor of diterpenes is geranylgeranyl diphosphate (GGPP). GGPP is formed by
adding an IPP unit to FPP [Scheme 2.4].56 Loss of the pyrophosphate group leads to
carbocation formation, which is followed by cyclisation and Wagner-Meerwein
rearrangements to form the cyclic diterpenoids.56
As clerodane, halimane and crotofolane diterpenoids have been isolated in this study, their
mechanism of formation is discussed.
Scheme 2.4: Biosynthetic of geranylgeranyl diphosphate (GPP)56
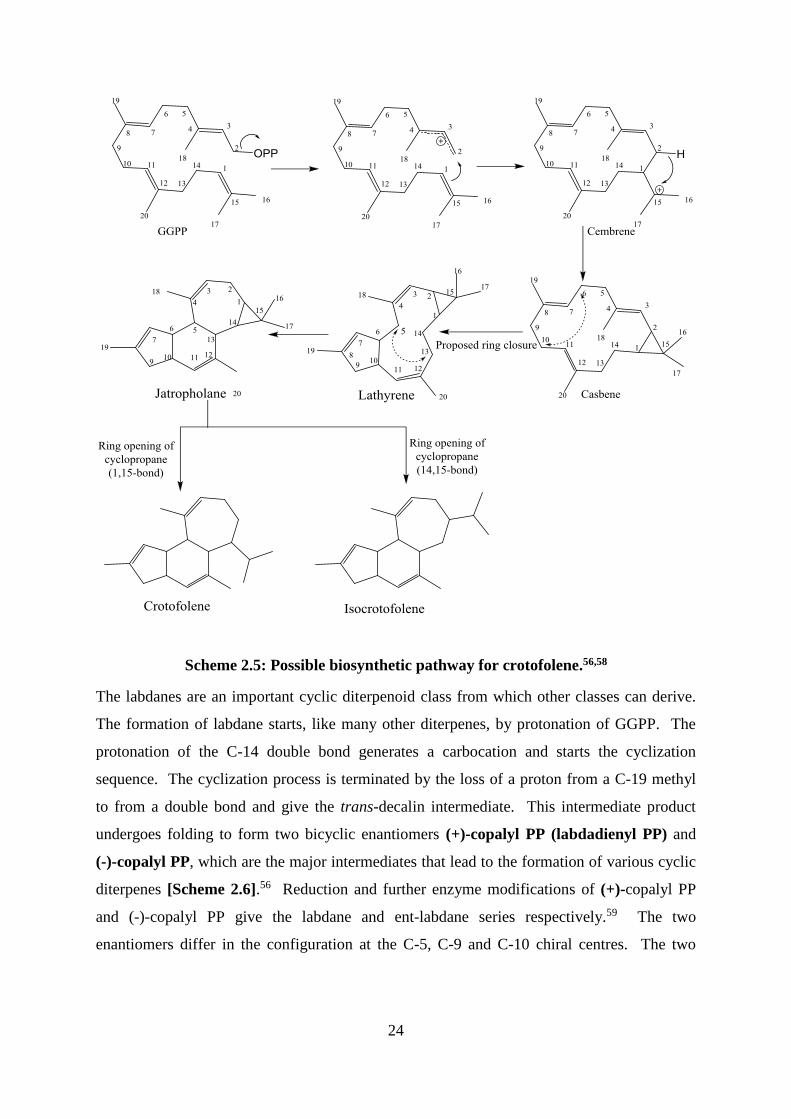
The biosynthesis of crotofolene starts with the loss of the diphosphate from GGPP to form a
carbocation and then generate a cembrene dierpenoid.56 A 2,15-cyclization of cembrene
produces the casbene diterpentoid skeleton, followed by 6,10-cyclization to from lathyrene
that undergoes 5,13 cyclization to yielded jatropholene.58 56 The opening of the C-14/C-15
cyclopropane ring of jatropholene produces crotofolene, while the cleavage of the C-1/C-15
bond leads to isocrotofolene [Scheme 2.5].58
24
Scheme 2.5: Possible biosynthetic pathway for crotofolene.56,58
The labdanes are an important cyclic diterpenoid class from which other classes can derive.
The formation of labdane starts, like many other diterpenes, by protonation of GGPP. The
protonation of the C-14 double bond generates a carbocation and starts the cyclization
sequence. The cyclization process is terminated by the loss of a proton from a C-19 methyl
to from a double bond and give the trans-decalin intermediate. This intermediate product
undergoes folding to form two bicyclic enantiomers (+)-copalyl PP (labdadienyl PP) and
(-)-copalyl PP, which are the major intermediates that lead to the formation of various cyclic
diterpenes [Scheme 2.6].56 Reduction and further enzyme modifications of (+)-copalyl PP
and (-)-copalyl PP give the labdane and ent-labdane series respectively.59 The two
enantiomers differ in the configuration at the C-5, C-9 and C-10 chiral centres. The two
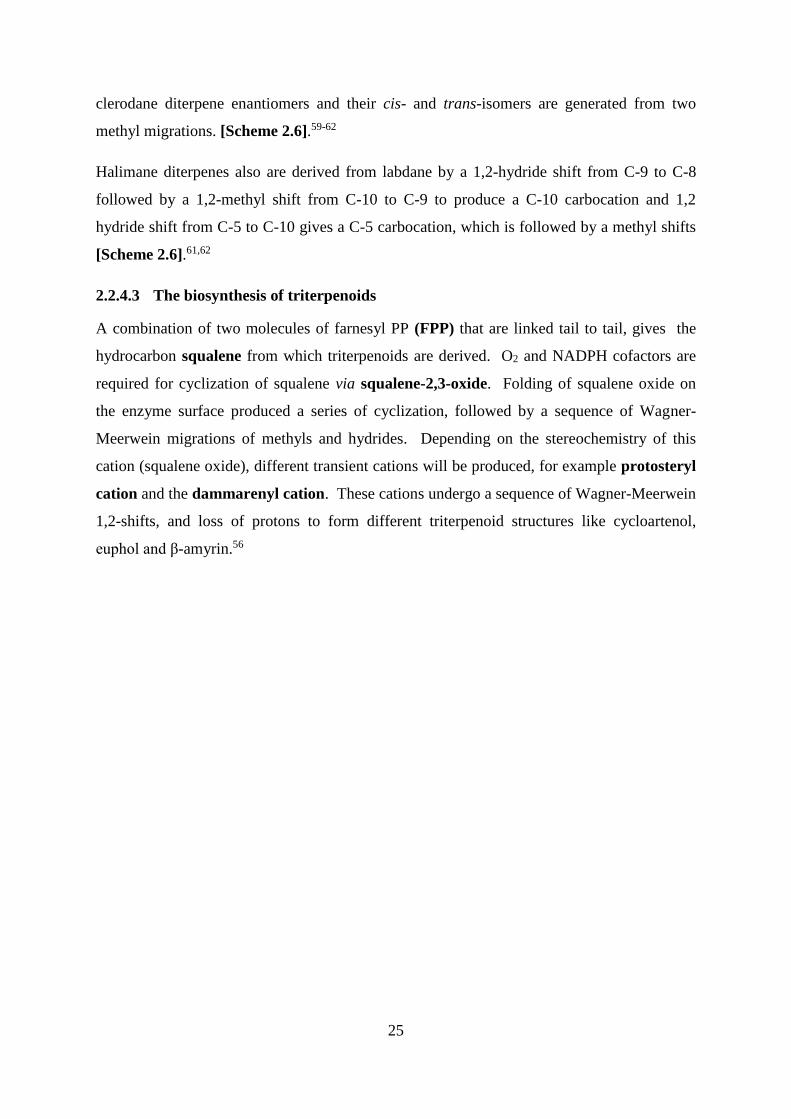
25
clerodane diterpene enantiomers and their cis- and trans-isomers are generated from two
methyl migrations. [Scheme 2.6].59-62
Halimane diterpenes also are derived from labdane by a 1,2-hydride shift from C-9 to C-8
followed by a 1,2-methyl shift from C-10 to C-9 to produce a C-10 carbocation and 1,2
hydride shift from C-5 to C-10 gives a C-5 carbocation, which is followed by a methyl shifts
[Scheme 2.6].61,62
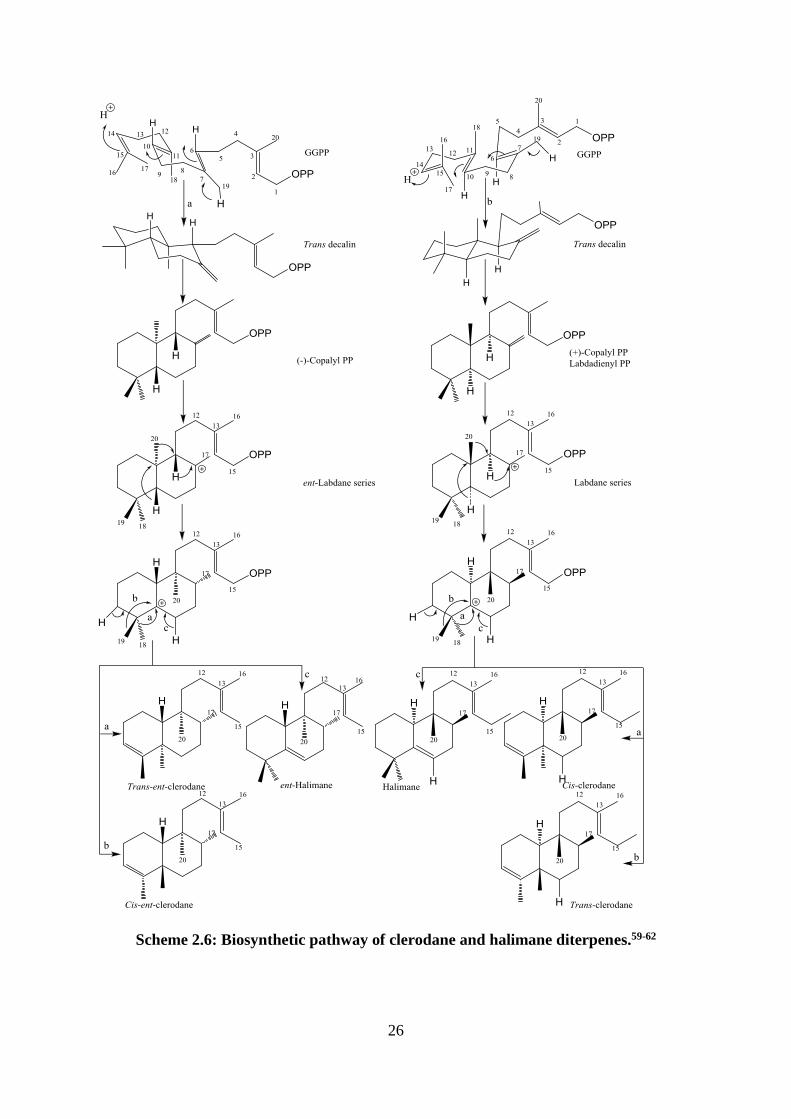
2.2.4.3 The biosynthesis of triterpenoids
A combination of two molecules of farnesyl PP (FPP) that are linked tail to tail, gives the
hydrocarbon squalene from which triterpenoids are derived. O2 and NADPH cofactors are
required for cyclization of squalene via squalene-2,3-oxide. Folding of squalene oxide on
the enzyme surface produced a series of cyclization, followed by a sequence of Wagner-
Meerwein migrations of methyls and hydrides. Depending on the stereochemistry of this
cation (squalene oxide), different transient cations will be produced, for example protosteryl
cation and the dammarenyl cation. These cations undergo a sequence of Wagner-Meerwein
1,2-shifts, and loss of protons to form different triterpenoid structures like cycloartenol,
euphol and β-amyrin.56
26
Scheme 2.6: Biosynthetic pathway of clerodane and halimane diterpenes.59-62
27
Scheme 2.7: Biosynthetic pathway of Triterpenoids56
28
The chemistry of Croton dichogamus Pax
C. dichogamus Pax
Croton dichogamus is a tree with a pyramidal crown or shrub, the leaves are usually
glabrous, membranous, covered with silvery scales and the upper surface is yellowish-
brown.63 The flowers are monoecious, the flower stamens have six sepals and twenty
stamens; the flower pistils have five sepals, petals are absent, segments are glabrous and
linear, styles are bipartite and the ovary is covered with round membranous scales [Picture
2.1].63 The plant has been recorded to occur in Ethiopia, Kenya, Madagascar, Mozambique
Tanzania and Somalia.64,65
Picture 2.1: Tree and leaves of C. dichogamus.66
Ethnobotany and biological screening of C. dichogamus Pax species
C. dichogamus has been used as a dietary additive to milk or meat soup by the Maasai and
Batemi of Kenya and Tanzania respectively. This species is known as “Mhand” in Tanzania,
and it has been used there to cure respiratory disease, by inhalation of smoke of the plant
leaves.67 Moreover, this plant has been used to treat chest complaints, malaria and stomach
upset in Samburu (Kenya), where it is commonly known as “l-akirding’ai”,68 while in another
part of Kenya, the Loitoktok district, it is known as “Oloibor benek”, and it is used to treat
arthritis and gonorrhea.69
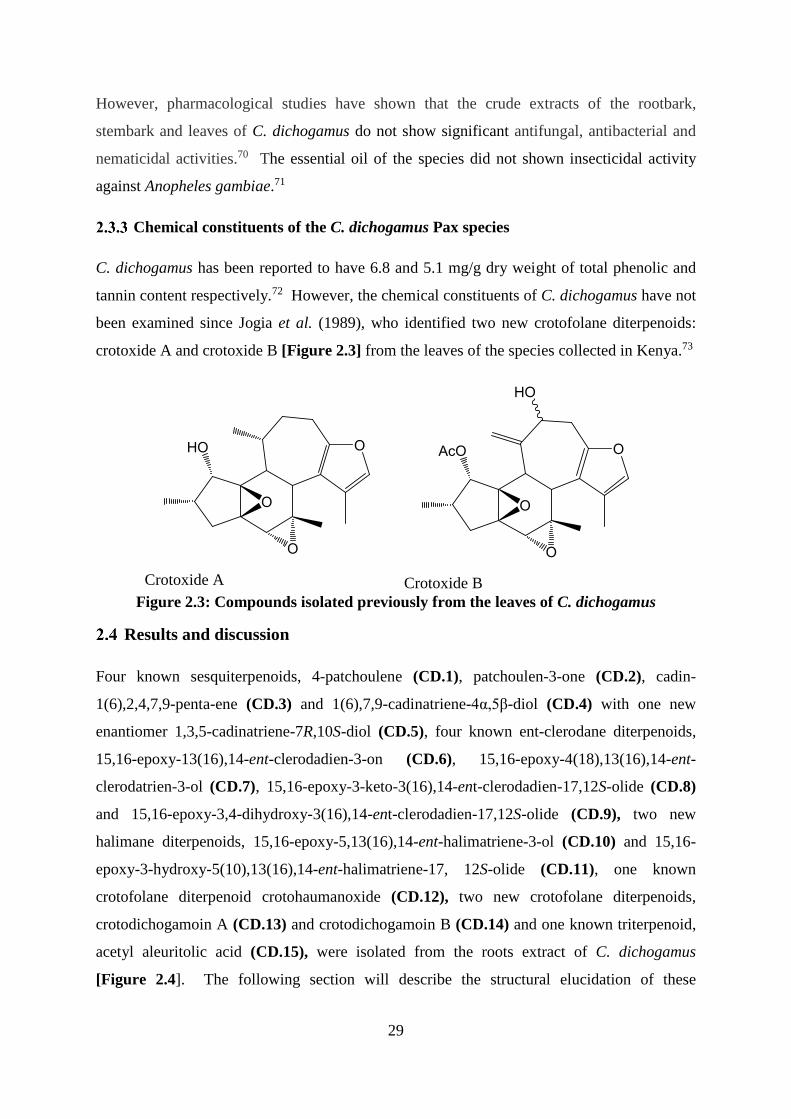
29
However, pharmacological studies have shown that the crude extracts of the rootbark,
stembark and leaves of C. dichogamus do not show significant antifungal, antibacterial and
nematicidal activities.70 The essential oil of the species did not shown insecticidal activity
against Anopheles gambiae.71
Chemical constituents of the C. dichogamus Pax species
C. dichogamus has been reported to have 6.8 and 5.1 mg/g dry weight of total phenolic and
tannin content respectively.72 However, the chemical constituents of C. dichogamus have not
been examined since Jogia et al. (1989), who identified two new crotofolane diterpenoids:
crotoxide A and crotoxide B [Figure 2.3] from the leaves of the species collected in Kenya.73
Crotoxide A
Crotoxide B
Figure 2.3: Compounds isolated previously from the leaves of C. dichogamus
Results and discussion
Four known sesquiterpenoids, 4-patchoulene (CD.1), patchoulen-3-one (CD.2), cadin-
1(6),2,4,7,9-penta-ene (CD.3) and 1(6),7,9-cadinatriene-4α,5β-diol (CD.4) with one new
enantiomer 1,3,5-cadinatriene-7R,10S-diol (CD.5), four known ent-clerodane diterpenoids,
15,16-epoxy-13(16),14-ent-clerodadien-3-on (CD.6), 15,16-epoxy-4(18),13(16),14-ent-
clerodatrien-3-ol (CD.7), 15,16-epoxy-3-keto-3(16),14-ent-clerodadien-17,12S-olide (CD.8)
and 15,16-epoxy-3,4-dihydroxy-3(16),14-ent-clerodadien-17,12S-olide (CD.9), two new
halimane diterpenoids, 15,16-epoxy-5,13(16),14-ent-halimatriene-3-ol (CD.10) and 15,16-
epoxy-3-hydroxy-5(10),13(16),14-ent-halimatriene-17, 12S-olide (CD.11), one known
crotofolane diterpenoid crotohaumanoxide (CD.12), two new crotofolane diterpenoids,
crotodichogamoin A (CD.13) and crotodichogamoin B (CD.14) and one known triterpenoid,
acetyl aleuritolic acid (CD.15), were isolated from the roots extract of C. dichogamus
[Figure 2.4]. The following section will describe the structural elucidation of these
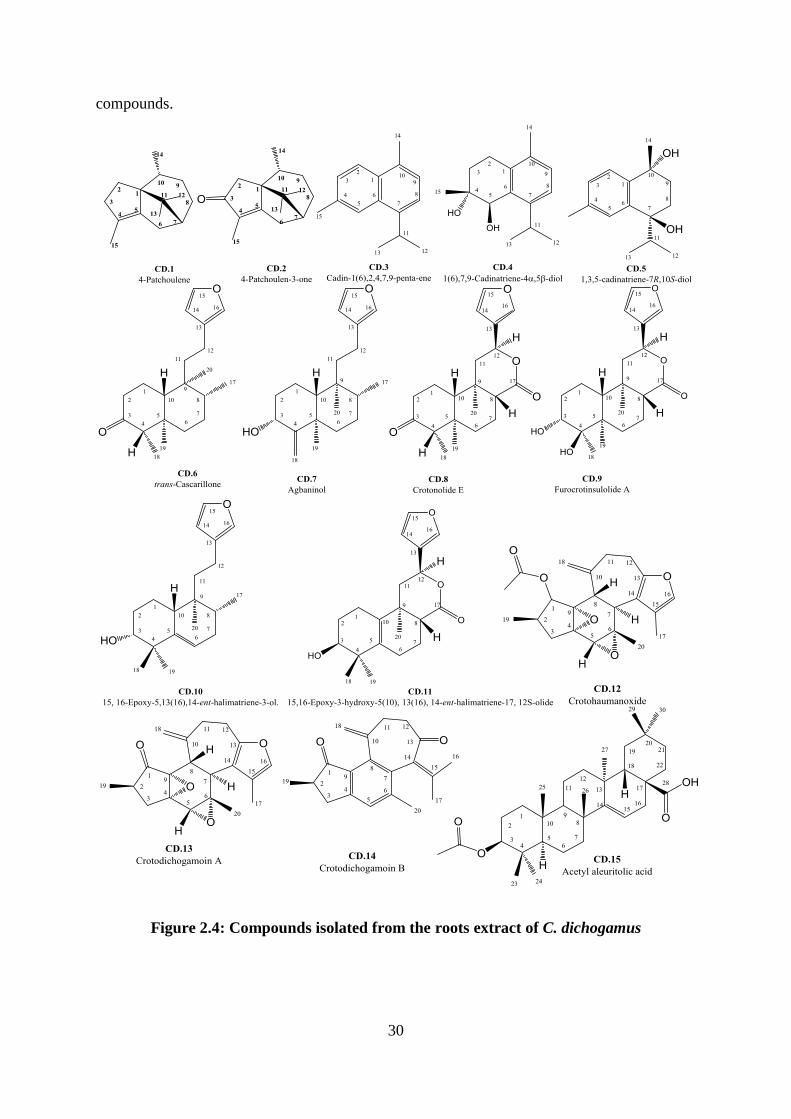
30
compounds.
Figure 2.4: Compounds isolated from the roots extract of C. dichogamus
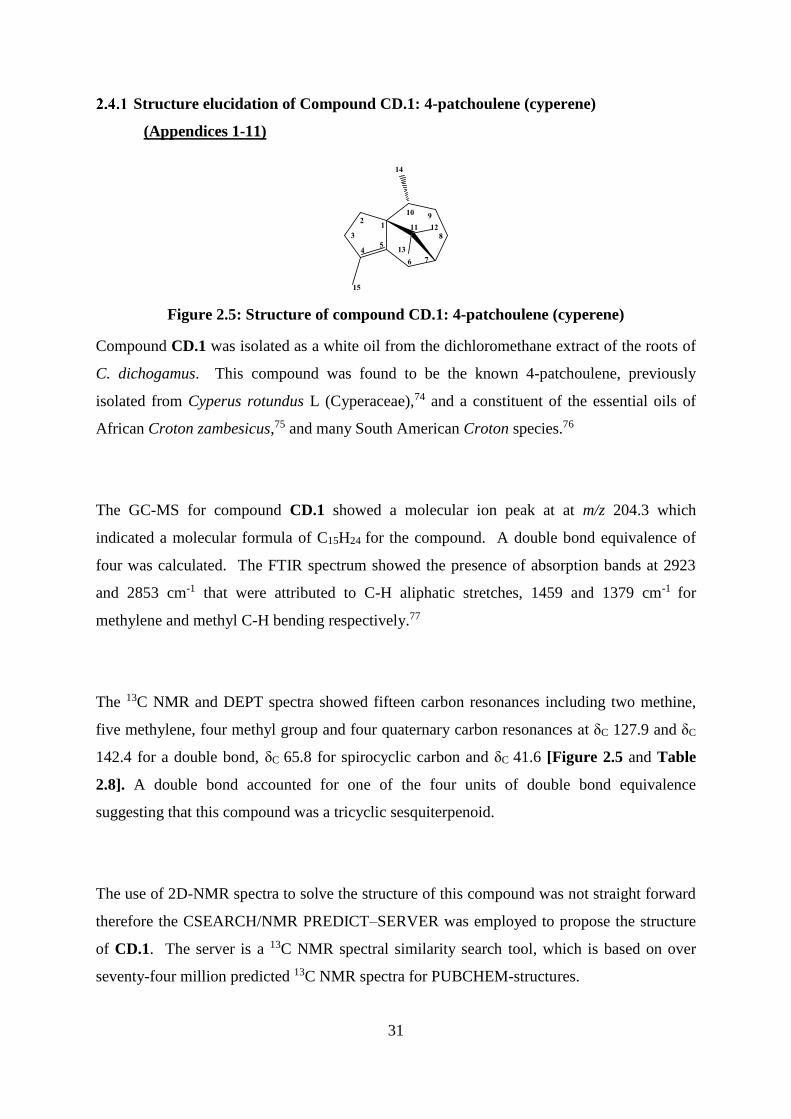
31
Structure elucidation of Compound CD.1: 4-patchoulene (cyperene)
(Appendices 1-11)
Figure 2.5: Structure of compound CD.1: 4-patchoulene (cyperene)
Compound CD.1 was isolated as a white oil from the dichloromethane extract of the roots of
C. dichogamus. This compound was found to be the known 4-patchoulene, previously
isolated from Cyperus rotundus L (Cyperaceae),74 and a constituent of the essential oils of
African Croton zambesicus,75 and many South American Croton species.76
The GC-MS for compound CD.1 showed a molecular ion peak at at m/z 204.3 which
indicated a molecular formula of C15H24 for the compound. A double bond equivalence of
four was calculated. The FTIR spectrum showed the presence of absorption bands at 2923
and 2853 cm-1 that were attributed to C-H aliphatic stretches, 1459 and 1379 cm-1 for
methylene and methyl C-H bending respectively.77
The 13C NMR and DEPT spectra showed fifteen carbon resonances including two methine,
five methylene, four methyl group and four quaternary carbon resonances at δC 127.9 and δC
142.4 for a double bond, δC 65.8 for spirocyclic carbon and δC 41.6 [Figure 2.5 and Table
2.8]. A double bond accounted for one of the four units of double bond equivalence
suggesting that this compound was a tricyclic sesquiterpenoid.
The use of 2D-NMR spectra to solve the structure of this compound was not straight forward
therefore the CSEARCH/NMR PREDICT–SERVER was employed to propose the structure
of CD.1. The server is a 13C NMR spectral similarity search tool, which is based on over
seventy-four million predicted 13C NMR spectra for PUBCHEM-structures.
32
The CSEARCH/NMR PREDICT–SERVER proposed that the 13C NMR spectroscopic data
for compound CD.1 were similar with those of the known 4-patchoulene.78 A comparison of
the reported 13C NMR data and those of CD.1 is shown in Table 2.8.
The spirocyclic carbon resonance at c 65.8 was assigned as C-1 as it showed correlations
with three methyl groups proton resonances at δH 0.76 (3H-12), δH 0.94 (3H-13) and δH 0.80
(3H-14, J = 6.2 Hz), one methine proton resonance at δH 1.94 (H-10), the 2H-2 (δH 1.62,
1.39) resonances, and one of the H-9 resonances at δH 1.41 (H-9β) and 2H-3 at δH 2.18, in the
HMBC spectrum. The two fully substituted olefinic carbon resonances δC 127.9 (C-4) and δC
142.4 (C-5) were assigned due to their correlations in the HMBC spectrum with the 2H-2 (δH
1.62, 1.39) resonances, one of the H-3 (δH 2.18) and 2H-6 (δH 2.18) resonances, H-7 (δH 1.85)
resonance, and the 3H-15 (δH 1.62) resonance. The doublet methyl group proton resonances
at δH 0.80 (3H-14) showed correlations in the HMBC spectrum with carbon resonances at δC
35.5 (C-10), δC 28.5 (C-9) and δC 65.8 (C-1). The two singlet methyl group proton
resonances at δH 0.94 (3H-13) and δH 0.76 (3H-12) displayed correlations in the HMBC
spectrum with each other’s carbon resonances, with two fully substituted carbon resonances
at δC 41.6 (C-11), δC 65.8 (C-1) and methine group carbon resonances at δC 48.9 (C-7). The
third singlet methyl group proton resonances at δH 1.62 (3H-15) was assigned as C-15 due to
its correlations with two fully substituted olefinic carbon resonances δC 127.9 (C-4) and δC
142.4 (C-5), and with the methylene carbon resonance at δC 42.5 (C-3), in the HMBC
spectrum.
The COSY spectrum showed coupling between The 3H-14 (δH 0.80) resonance and the H-10
(δH 1.94) resonance. The H-10 (δH 1.94) resonance showed coupling with the 2H-9 (δH 1.08,
1.41) resonances, which showed further coupling with the 2H-8 (δH 1.85, 1.27) resonances.
The H-7 (δH 1.85) resonance showed coupling in the COSY spectrum with proton resonances
at δH 1.27 (H-8β) and δH 2.18 (H-6α). The 2H-2 (δH 1.39 and 1.62) proton resonances were
seen to be coupled with 2H-3 (δH 2.62 and 2.18) resonances, in the COSY spectrum.
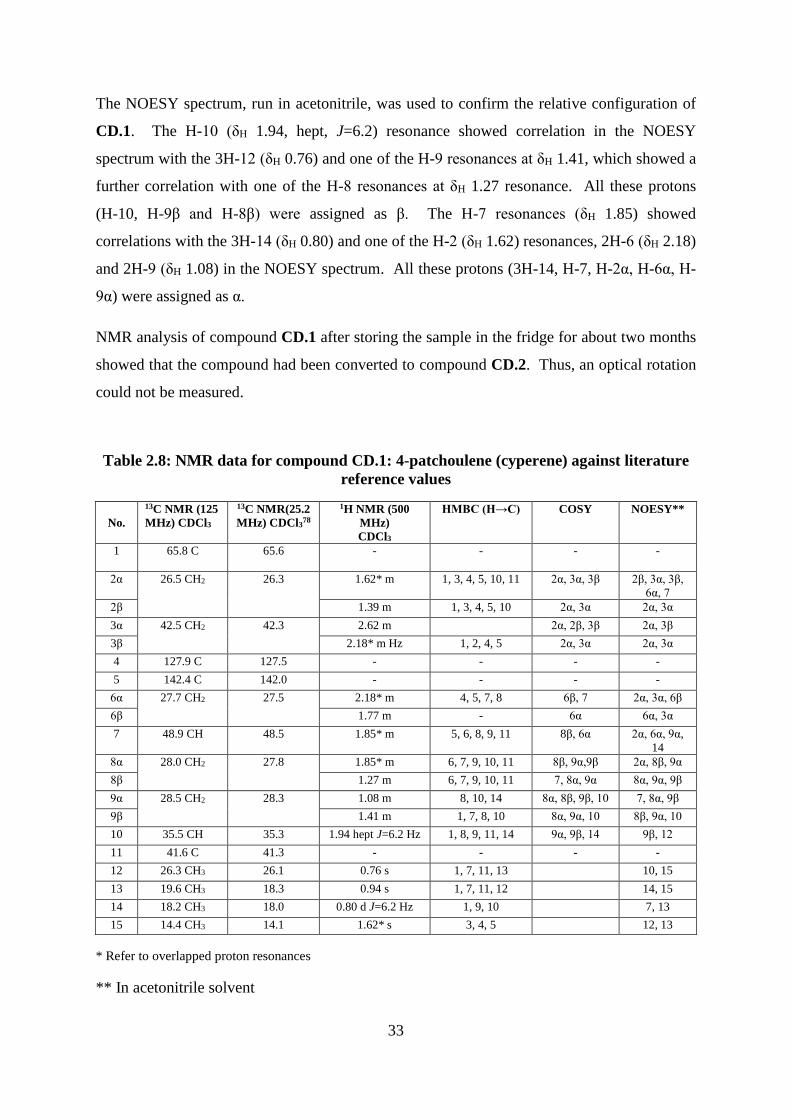
33
The NOESY spectrum, run in acetonitrile, was used to confirm the relative configuration of
CD.1. The H-10 (δH 1.94, hept, J=6.2) resonance showed correlation in the NOESY
spectrum with the 3H-12 (δH 0.76) and one of the H-9 resonances at δH 1.41, which showed a
further correlation with one of the H-8 resonances at δH 1.27 resonance. All these protons
(H-10, H-9β and H-8β) were assigned as β. The H-7 resonances (δH 1.85) showed
correlations with the 3H-14 (δH 0.80) and one of the H-2 (δH 1.62) resonances, 2H-6 (δH 2.18)
and 2H-9 (δH 1.08) in the NOESY spectrum. All these protons (3H-14, H-7, H-2α, H-6α, H-
9α) were assigned as α.
NMR analysis of compound CD.1 after storing the sample in the fridge for about two months
showed that the compound had been converted to compound CD.2. Thus, an optical rotation
could not be measured.
Table 2.8: NMR data for compound CD.1: 4-patchoulene (cyperene) against literature
reference values
No.
13C NMR (125
MHz) CDCl3
13C NMR(25.2
MHz) CDCl378
1H NMR (500
MHz)
CDCl3
HMBC (H→C) COSY NOESY**
1 65.8 C
65.6 - - - -
2α 26.5 CH2 26.3 1.62* m 1, 3, 4, 5, 10, 11 2α, 3α, 3β 2β, 3α, 3β,
6α, 7
2β 1.39 m 1, 3, 4, 5, 10 2α, 3α 2α, 3α
3α 42.5 CH2
42.3 2.62 m 2α, 2β, 3β 2α, 3β
3β 2.18* m Hz 1, 2, 4, 5 2α, 3α 2α, 3α
4 127.9 C 127.5 - - - -
5 142.4 C 142.0 - - - -
6α 27.7 CH2 27.5 2.18* m 4, 5, 7, 8 6β, 7 2α, 3α, 6β
6β 1.77 m - 6α 6α, 3α
7 48.9 CH 48.5 1.85* m 5, 6, 8, 9, 11 8β, 6α 2α, 6α, 9α,
14
8α 28.0 CH2 27.8 1.85* m 6, 7, 9, 10, 11 8β, 9α,9β 2α, 8β, 9α
8β 1.27 m 6, 7, 9, 10, 11 7, 8α, 9α 8α, 9α, 9β
9α 28.5 CH2
28.3 1.08 m 8, 10, 14 8α, 8β, 9β, 10 7, 8α, 9β
9β 1.41 m 1, 7, 8, 10 8α, 9α, 10 8β, 9α, 10
10 35.5 CH 35.3 1.94 hept J=6.2 Hz 1, 8, 9, 11, 14 9α, 9β, 14 9β, 12
11 41.6 C 41.3 - - - -
12 26.3 CH3 26.1 0.76 s 1, 7, 11, 13 10, 15
13 19.6 CH3 18.3 0.94 s 1, 7, 11, 12 14, 15
14 18.2 CH3 18.0 0.80 d J=6.2 Hz 1, 9, 10 7, 13
15 14.4 CH3 14.1 1.62* s 3, 4, 5 12, 13
* Refer to overlapped proton resonances
** In acetonitrile solvent
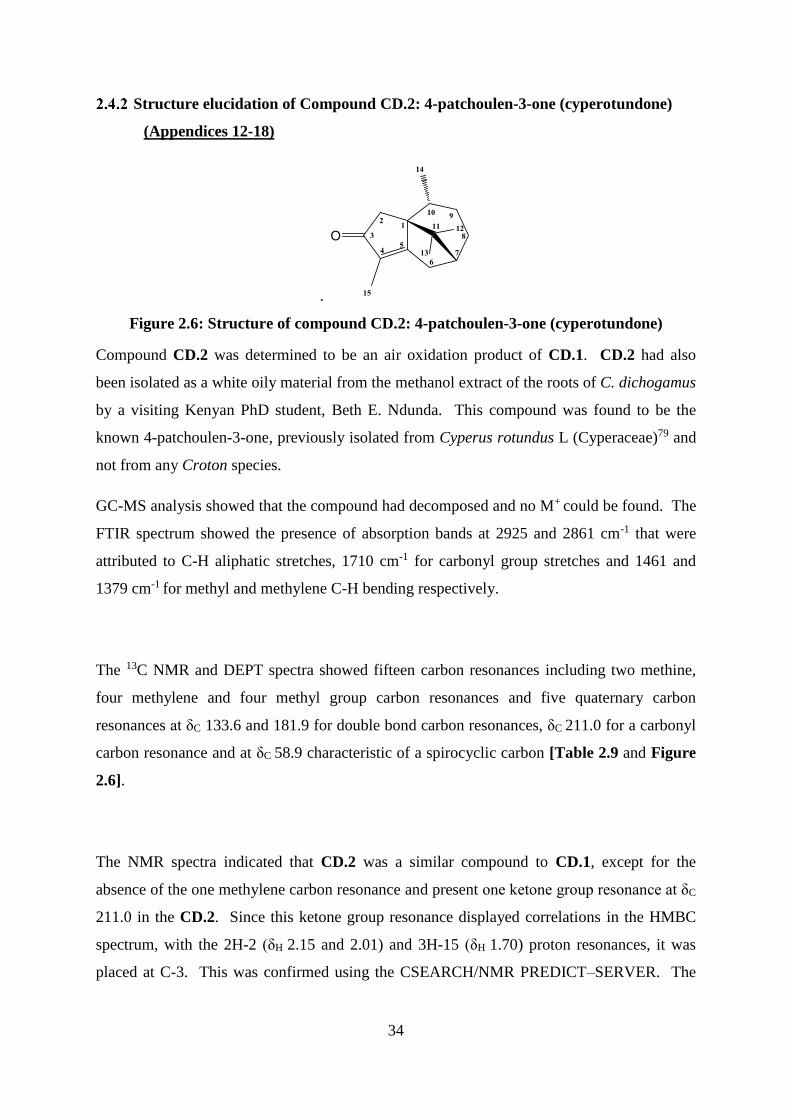
34
Structure elucidation of Compound CD.2: 4-patchoulen-3-one (cyperotundone)
(Appendices 12-18)
.
Figure 2.6: Structure of compound CD.2: 4-patchoulen-3-one (cyperotundone)
Compound CD.2 was determined to be an air oxidation product of CD.1. CD.2 had also
been isolated as a white oily material from the methanol extract of the roots of C. dichogamus
by a visiting Kenyan PhD student, Beth E. Ndunda. This compound was found to be the
known 4-patchoulen-3-one, previously isolated from Cyperus rotundus L (Cyperaceae)79 and
not from any Croton species.
GC-MS analysis showed that the compound had decomposed and no M+ could be found. The
FTIR spectrum showed the presence of absorption bands at 2925 and 2861 cm-1 that were
attributed to C-H aliphatic stretches, 1710 cm-1 for carbonyl group stretches and 1461 and
1379 cm-1 for methyl and methylene C-H bending respectively.
The 13C NMR and DEPT spectra showed fifteen carbon resonances including two methine,
four methylene and four methyl group carbon resonances and five quaternary carbon
resonances at δC 133.6 and 181.9 for double bond carbon resonances, δC 211.0 for a carbonyl
carbon resonance and at δC 58.9 characteristic of a spirocyclic carbon [Table 2.9 and Figure
2.6].
The NMR spectra indicated that CD.2 was a similar compound to CD.1, except for the
absence of the one methylene carbon resonance and present one ketone group resonance at δC
211.0 in the CD.2. Since this ketone group resonance displayed correlations in the HMBC
spectrum, with the 2H-2 (δH 2.15 and 2.01) and 3H-15 (δH 1.70) proton resonances, it was
placed at C-3. This was confirmed using the CSEARCH/NMR PREDICT–SERVER. The
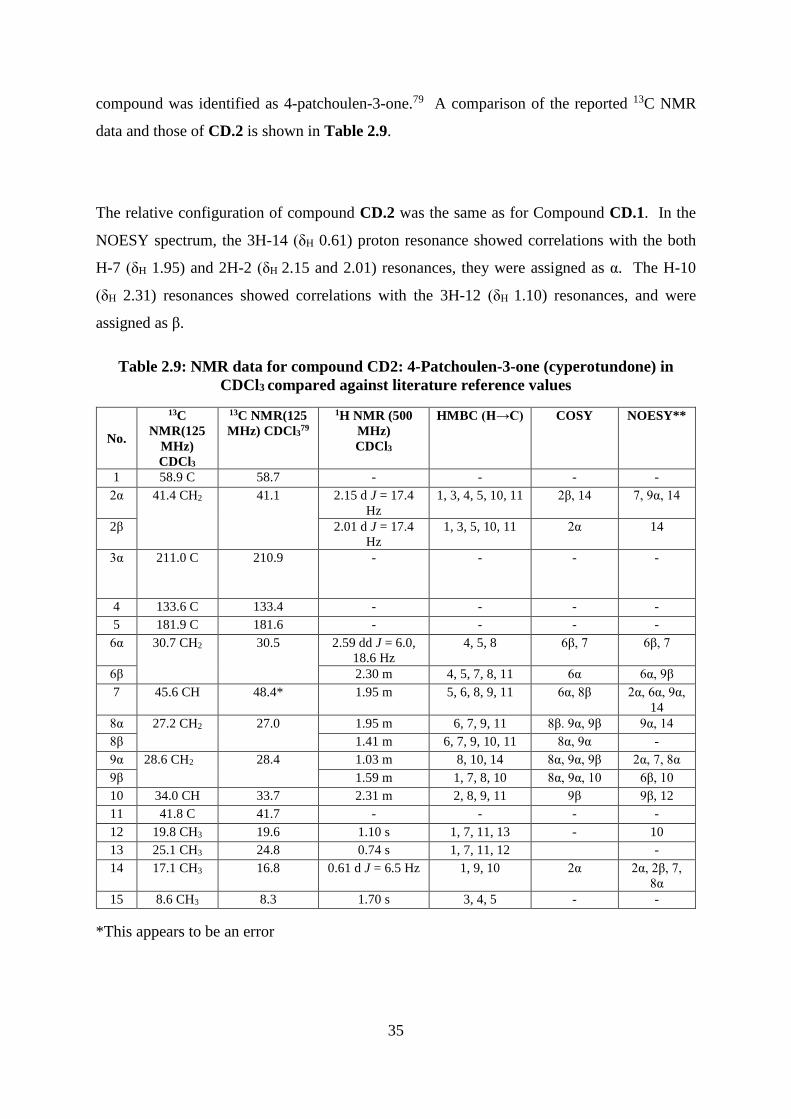
35
compound was identified as 4-patchoulen-3-one.79 A comparison of the reported 13C NMR
data and those of CD.2 is shown in Table 2.9.
The relative configuration of compound CD.2 was the same as for Compound CD.1. In the
NOESY spectrum, the 3H-14 (δH 0.61) proton resonance showed correlations with the both
H-7 (δH 1.95) and 2H-2 (δH 2.15 and 2.01) resonances, they were assigned as α. The H-10
(δH 2.31) resonances showed correlations with the 3H-12 (δH 1.10) resonances, and were
assigned as β.
Table 2.9: NMR data for compound CD2: 4-Patchoulen-3-one (cyperotundone) in
CDCl3 compared against literature reference values
No.
13C
NMR(125
MHz)
CDCl3
13C NMR(125
MHz) CDCl379
1H NMR (500
MHz)
CDCl3
HMBC (H→C) COSY NOESY**
1 58.9 C 58.7 - - - -
2α 41.4 CH2 41.1 2.15 d J = 17.4
Hz
1, 3, 4, 5, 10, 11 2β, 14 7, 9α, 14
2β 2.01 d J = 17.4
Hz
1, 3, 5, 10, 11 2α 14
3α 211.0 C 210.9 - - - -
4 133.6 C 133.4 - - - -
5 181.9 C 181.6 - - - -
6α 30.7 CH2 30.5 2.59 dd J = 6.0,
18.6 Hz
4, 5, 8 6β, 7 6β, 7
6β 2.30 m 4, 5, 7, 8, 11 6α 6α, 9β
7 45.6 CH 48.4* 1.95 m 5, 6, 8, 9, 11 6α, 8β 2α, 6α, 9α,
14
8α 27.2 CH2 27.0 1.95 m 6, 7, 9, 11 8β. 9α, 9β 9α, 14
8β 1.41 m 6, 7, 9, 10, 11 8α, 9α -
9α 28.6 CH2 28.4 1.03 m 8, 10, 14 8α, 9α, 9β 2α, 7, 8α
9β 1.59 m 1, 7, 8, 10 8α, 9α, 10 6β, 10
10 34.0 CH 33.7 2.31 m 2, 8, 9, 11 9β 9β, 12
11 41.8 C 41.7 - - - -
12 19.8 CH3 19.6 1.10 s 1, 7, 11, 13 - 10
13 25.1 CH3 24.8 0.74 s 1, 7, 11, 12 -
14 17.1 CH3 16.8 0.61 d J = 6.5 Hz 1, 9, 10 2α 2α, 2β, 7,
8α
15 8.6 CH3 8.3 1.70 s 3, 4, 5 - -
*This appears to be an error
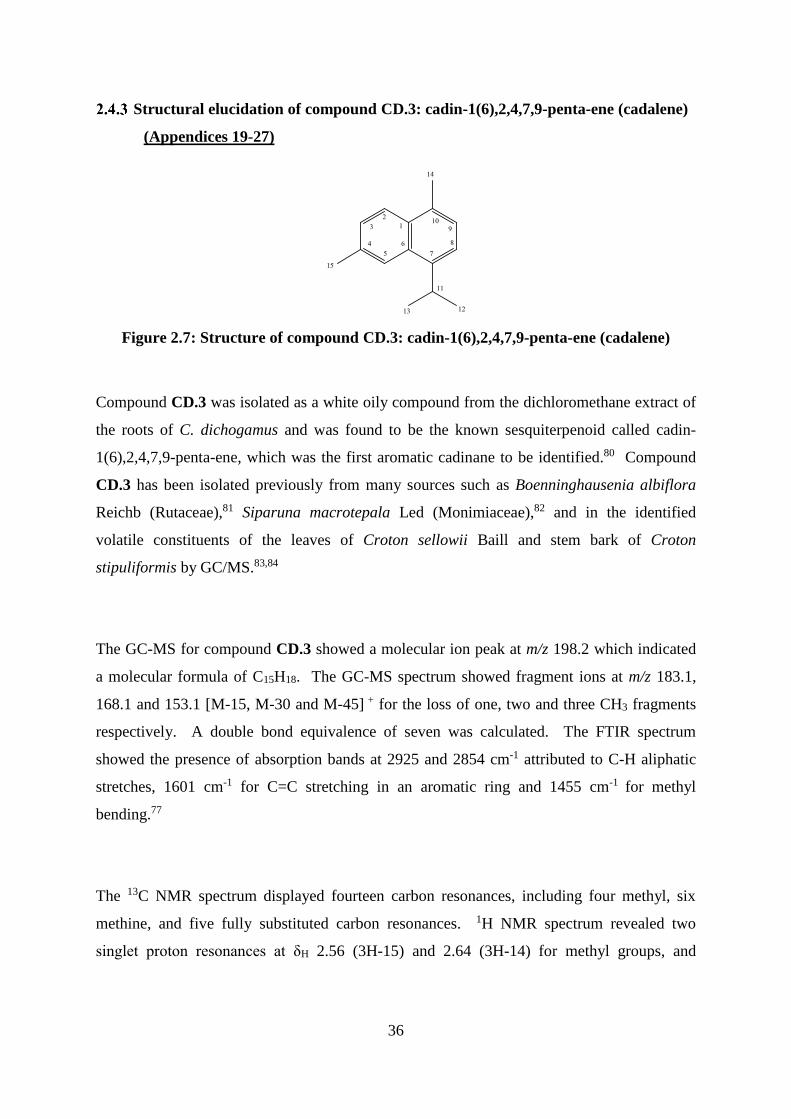
36
Structural elucidation of compound CD.3: cadin-1(6),2,4,7,9-penta-ene (cadalene)
(Appendices 19-27)
Figure 2.7: Structure of compound CD.3: cadin-1(6),2,4,7,9-penta-ene (cadalene)
Compound CD.3 was isolated as a white oily compound from the dichloromethane extract of
the roots of C. dichogamus and was found to be the known sesquiterpenoid called cadin-
1(6),2,4,7,9-penta-ene, which was the first aromatic cadinane to be identified.80 Compound
CD.3 has been isolated previously from many sources such as Boenninghausenia albiflora
Reichb (Rutaceae),81 Siparuna macrotepala Led (Monimiaceae),82 and in the identified
volatile constituents of the leaves of Croton sellowii Baill and stem bark of Croton
stipuliformis by GC/MS.83,84
The GC-MS for compound CD.3 showed a molecular ion peak at m/z 198.2 which indicated
a molecular formula of C15H18. The GC-MS spectrum showed fragment ions at m/z 183.1,
168.1 and 153.1 [M-15, M-30 and M-45] + for the loss of one, two and three CH3 fragments
respectively. A double bond equivalence of seven was calculated. The FTIR spectrum
showed the presence of absorption bands at 2925 and 2854 cm-1 attributed to C-H aliphatic
stretches, 1601 cm-1 for C=C stretching in an aromatic ring and 1455 cm-1 for methyl
bending.77
The 13C NMR spectrum displayed fourteen carbon resonances, including four methyl, six
methine, and five fully substituted carbon resonances. 1H NMR spectrum revealed two
singlet proton resonances at δH 2.56 (3H-15) and 2.64 (3H-14) for methyl groups, and
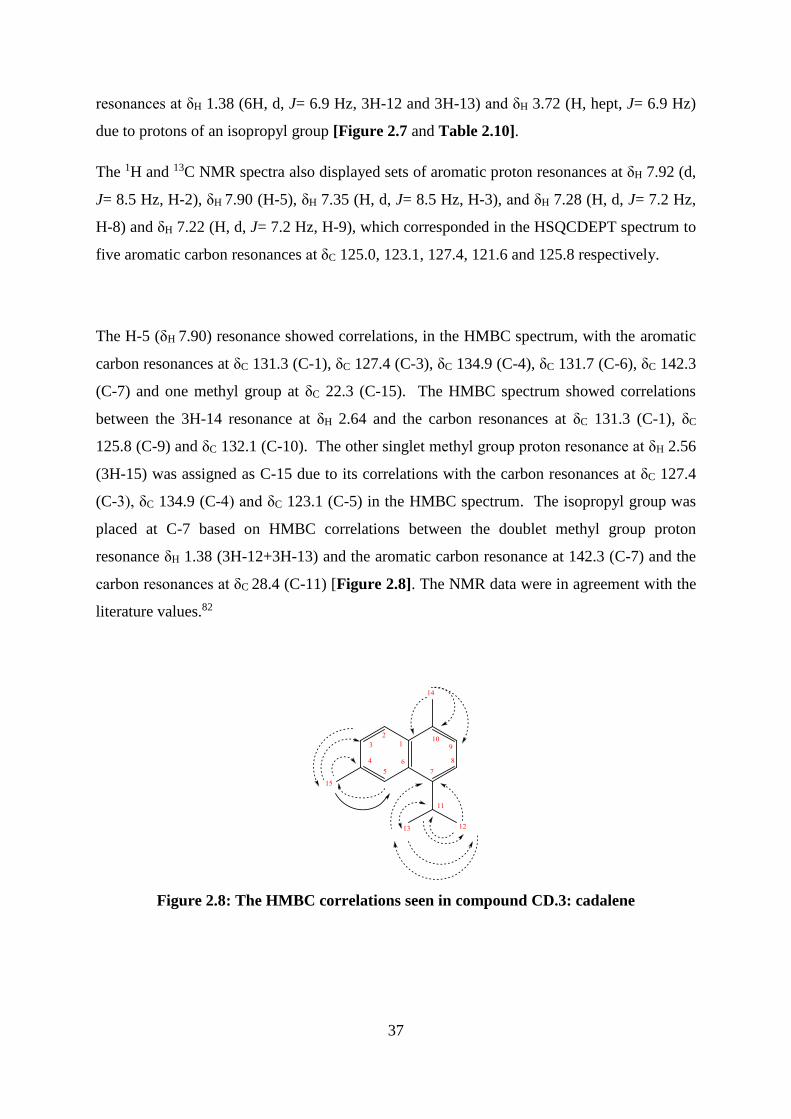
37
resonances at δH 1.38 (6H, d, J= 6.9 Hz, 3H-12 and 3H-13) and δH 3.72 (H, hept, J= 6.9 Hz)
due to protons of an isopropyl group [Figure 2.7 and Table 2.10].
The 1H and 13C NMR spectra also displayed sets of aromatic proton resonances at δH 7.92 (d,
J= 8.5 Hz, H-2), δH 7.90 (H-5), δH 7.35 (H, d, J= 8.5 Hz, H-3), and δH 7.28 (H, d, J= 7.2 Hz,
H-8) and δH 7.22 (H, d, J= 7.2 Hz, H-9), which corresponded in the HSQCDEPT spectrum to
five aromatic carbon resonances at δC 125.0, 123.1, 127.4, 121.6 and 125.8 respectively.
The H-5 (δH 7.90) resonance showed correlations, in the HMBC spectrum, with the aromatic
carbon resonances at δC 131.3 (C-1), δC 127.4 (C-3), δC 134.9 (C-4), δC 131.7 (C-6), δC 142.3
(C-7) and one methyl group at δC 22.3 (C-15). The HMBC spectrum showed correlations
between the 3H-14 resonance at δH 2.64 and the carbon resonances at δC 131.3 (C-1), δC
125.8 (C-9) and δC 132.1 (C-10). The other singlet methyl group proton resonance at δH 2.56
(3H-15) was assigned as C-15 due to its correlations with the carbon resonances at δC 127.4
(C-3), δC 134.9 (C-4) and δC 123.1 (C-5) in the HMBC spectrum. The isopropyl group was
placed at C-7 based on HMBC correlations between the doublet methyl group proton
resonance δH 1.38 (3H-12+3H-13) and the aromatic carbon resonance at 142.3 (C-7) and the
carbon resonances at δC 28.4 (C-11) [Figure 2.8]. The NMR data were in agreement with the
literature values.82
Figure 2.8: The HMBC correlations seen in compound CD.3: cadalene
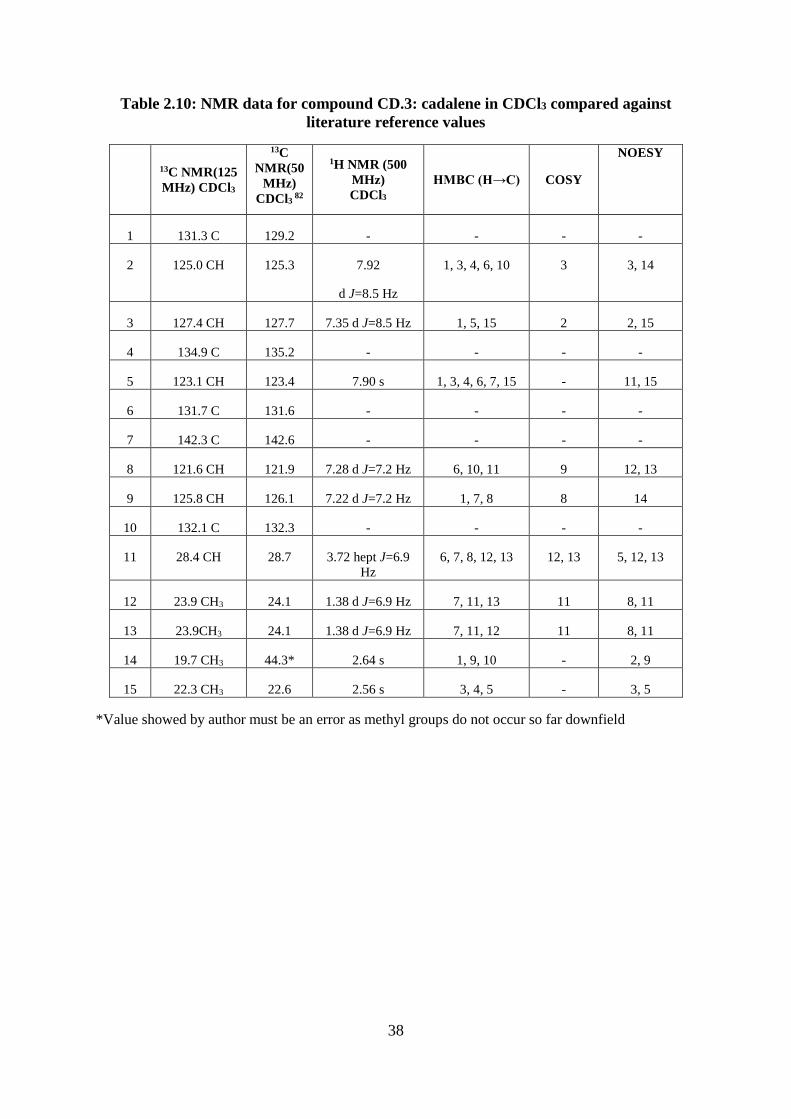
38
Table 2.10: NMR data for compound CD.3: cadalene in CDCl3 compared against
literature reference values
13C NMR(125
MHz) CDCl3
13C
NMR(50
MHz)
CDCl3 82
1H NMR (500
MHz)
CDCl3
HMBC (H→C) COSY
NOESY
1 131.3 C 129.2 - - - -
2 125.0 CH 125.3 7.92
d J=8.5 Hz
1, 3, 4, 6, 10 3 3, 14
3 127.4 CH 127.7 7.35 d J=8.5 Hz 1, 5, 15 2 2, 15
4 134.9 C 135.2 - - - -
5 123.1 CH 123.4 7.90 s 1, 3, 4, 6, 7, 15 - 11, 15
6 131.7 C 131.6 - - - -
7 142.3 C 142.6 - - - -
8 121.6 CH 121.9 7.28 d J=7.2 Hz 6, 10, 11 9 12, 13
9 125.8 CH 126.1 7.22 d J=7.2 Hz 1, 7, 8 8 14
10 132.1 C 132.3 - - - -
11 28.4 CH 28.7 3.72 hept J=6.9
Hz
6, 7, 8, 12, 13 12, 13 5, 12, 13
12 23.9 CH3 24.1 1.38 d J=6.9 Hz 7, 11, 13 11 8, 11
13 23.9CH3 24.1 1.38 d J=6.9 Hz 7, 11, 12 11 8, 11
14 19.7 CH3 44.3* 2.64 s 1, 9, 10 - 2, 9
15 22.3 CH3 22.6 2.56 s 3, 4, 5 - 3, 5
*Value showed by author must be an error as methyl groups do not occur so far downfield
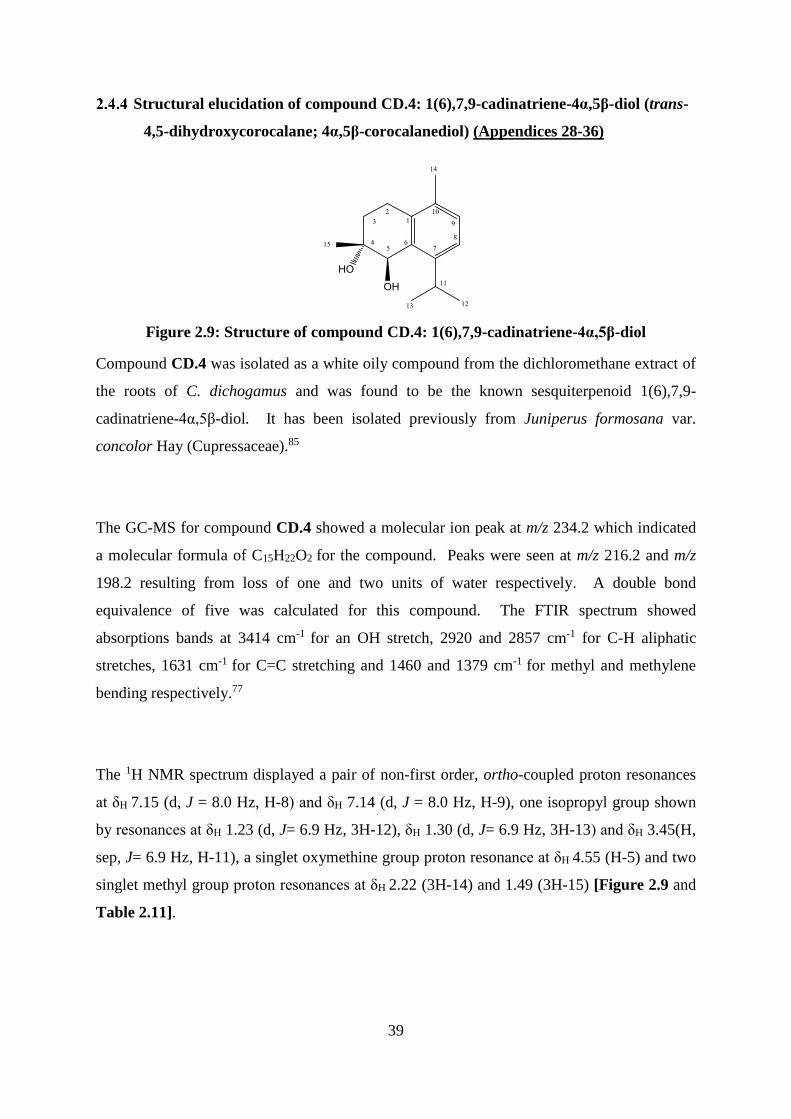
39
Structural elucidation of compound CD.4: 1(6),7,9-cadinatriene-4α,5β-diol (trans-
4,5-dihydroxycorocalane; 4α,5β-corocalanediol) (Appendices 28-36)
Figure 2.9: Structure of compound CD.4: 1(6),7,9-cadinatriene-4α,5β-diol
Compound CD.4 was isolated as a white oily compound from the dichloromethane extract of
the roots of C. dichogamus and was found to be the known sesquiterpenoid 1(6),7,9-
cadinatriene-4α,5β-diol. It has been isolated previously from Juniperus formosana var.
concolor Hay (Cupressaceae).85
The GC-MS for compound CD.4 showed a molecular ion peak at m/z 234.2 which indicated
a molecular formula of C15H22O2 for the compound. Peaks were seen at m/z 216.2 and m/z
198.2 resulting from loss of one and two units of water respectively. A double bond
equivalence of five was calculated for this compound. The FTIR spectrum showed
absorptions bands at 3414 cm-1 for an OH stretch, 2920 and 2857 cm-1 for C-H aliphatic
stretches, 1631 cm-1 for C=C stretching and 1460 and 1379 cm-1 for methyl and methylene
bending respectively.77
The 1H NMR spectrum displayed a pair of non-first order, ortho-coupled proton resonances
at δH 7.15 (d, J = 8.0 Hz, H-8) and δH 7.14 (d, J = 8.0 Hz, H-9), one isopropyl group shown
by resonances at δH 1.23 (d, J= 6.9 Hz, 3H-12), δH 1.30 (d, J= 6.9 Hz, 3H-13) and δH 3.45(H,
sep, J= 6.9 Hz, H-11), a singlet oxymethine group proton resonance at δH 4.55 (H-5) and two
singlet methyl group proton resonances at δH 2.22 (3H-14) and 1.49 (3H-15) [Figure 2.9 and
Table 2.11].
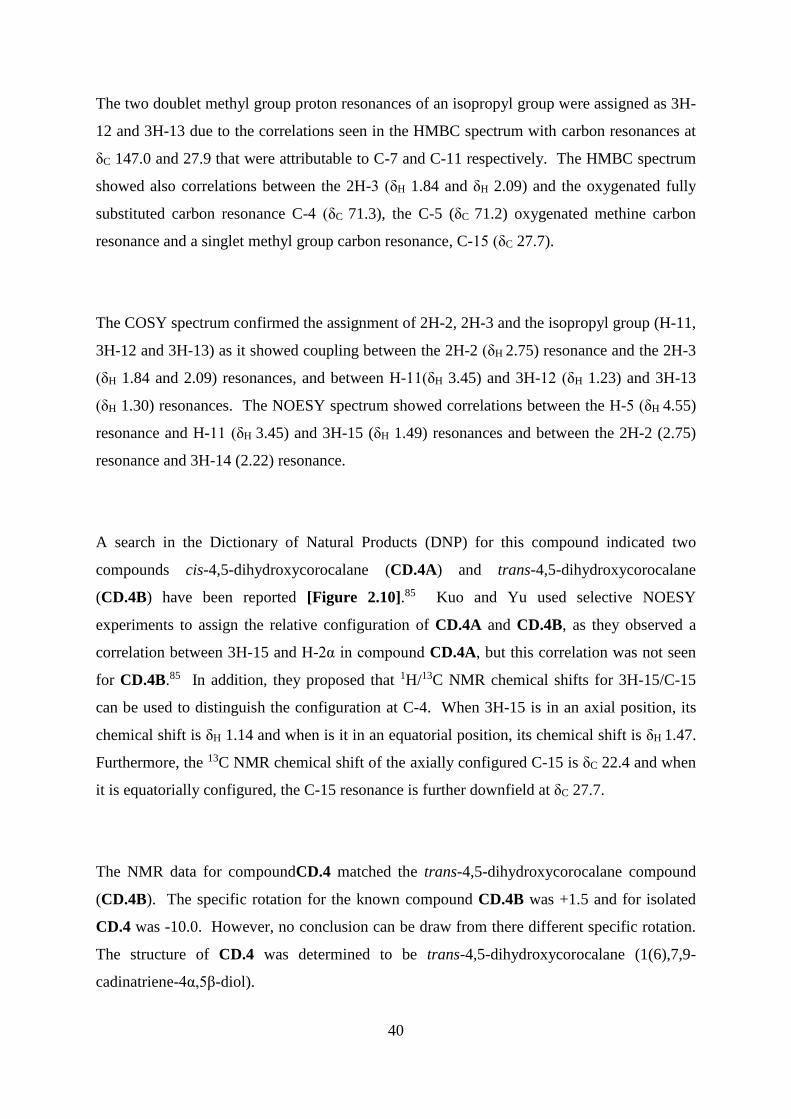
40
The two doublet methyl group proton resonances of an isopropyl group were assigned as 3H-
12 and 3H-13 due to the correlations seen in the HMBC spectrum with carbon resonances at
δC 147.0 and 27.9 that were attributable to C-7 and C-11 respectively. The HMBC spectrum
showed also correlations between the 2H-3 (δH 1.84 and δH 2.09) and the oxygenated fully
substituted carbon resonance C-4 (δC 71.3), the C-5 (δC 71.2) oxygenated methine carbon
resonance and a singlet methyl group carbon resonance, C-15 (δC 27.7).
The COSY spectrum confirmed the assignment of 2H-2, 2H-3 and the isopropyl group (H-11,
3H-12 and 3H-13) as it showed coupling between the 2H-2 (δH 2.75) resonance and the 2H-3
(δH 1.84 and 2.09) resonances, and between H-11(δH 3.45) and 3H-12 (δH 1.23) and 3H-13
(δH 1.30) resonances. The NOESY spectrum showed correlations between the H-5 (δH 4.55)
resonance and H-11 (δH 3.45) and 3H-15 (δH 1.49) resonances and between the 2H-2 (2.75)
resonance and 3H-14 (2.22) resonance.
A search in the Dictionary of Natural Products (DNP) for this compound indicated two
compounds cis-4,5-dihydroxycorocalane (CD.4A) and trans-4,5-dihydroxycorocalane
(CD.4B) have been reported [Figure 2.10].85 Kuo and Yu used selective NOESY
experiments to assign the relative configuration of CD.4A and CD.4B, as they observed a
correlation between 3H-15 and H-2α in compound CD.4A, but this correlation was not seen
for CD.4B.85 In addition, they proposed that 1H/13C NMR chemical shifts for 3H-15/C-15
can be used to distinguish the configuration at C-4. When 3H-15 is in an axial position, its
chemical shift is δH 1.14 and when is it in an equatorial position, its chemical shift is δH 1.47.
Furthermore, the 13C NMR chemical shift of the axially configured C-15 is δC 22.4 and when
it is equatorially configured, the C-15 resonance is further downfield at δC 27.7.
The NMR data for compoundCD.4 matched the trans-4,5-dihydroxycorocalane compound
(CD.4B). The specific rotation for the known compound CD.4B was +1.5 and for isolated
CD.4 was -10.0. However, no conclusion can be draw from there different specific rotation.
The structure of CD.4 was determined to be trans-4,5-dihydroxycorocalane (1(6),7,9-
cadinatriene-4α,5β-diol).
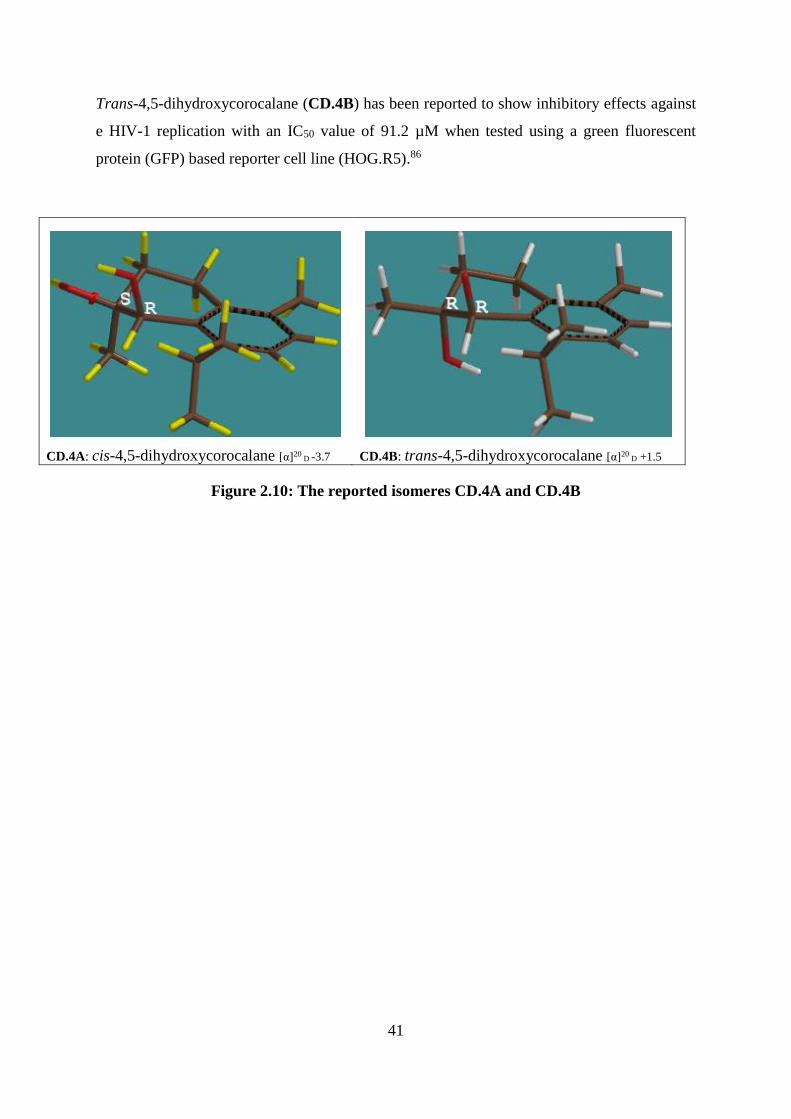
41
Trans-4,5-dihydroxycorocalane (CD.4B) has been reported to show inhibitory effects against
e HIV-1 replication with an IC50 value of 91.2 µM when tested using a green fluorescent
protein (GFP) based reporter cell line (HOG.R5).86
CD.4A: cis-4,5-dihydroxycorocalane [α]20 D -3.7 CD.4B: trans-4,5-dihydroxycorocalane [α]20
D +1.5
Figure 2.10: The reported isomeres CD.4A and CD.4B
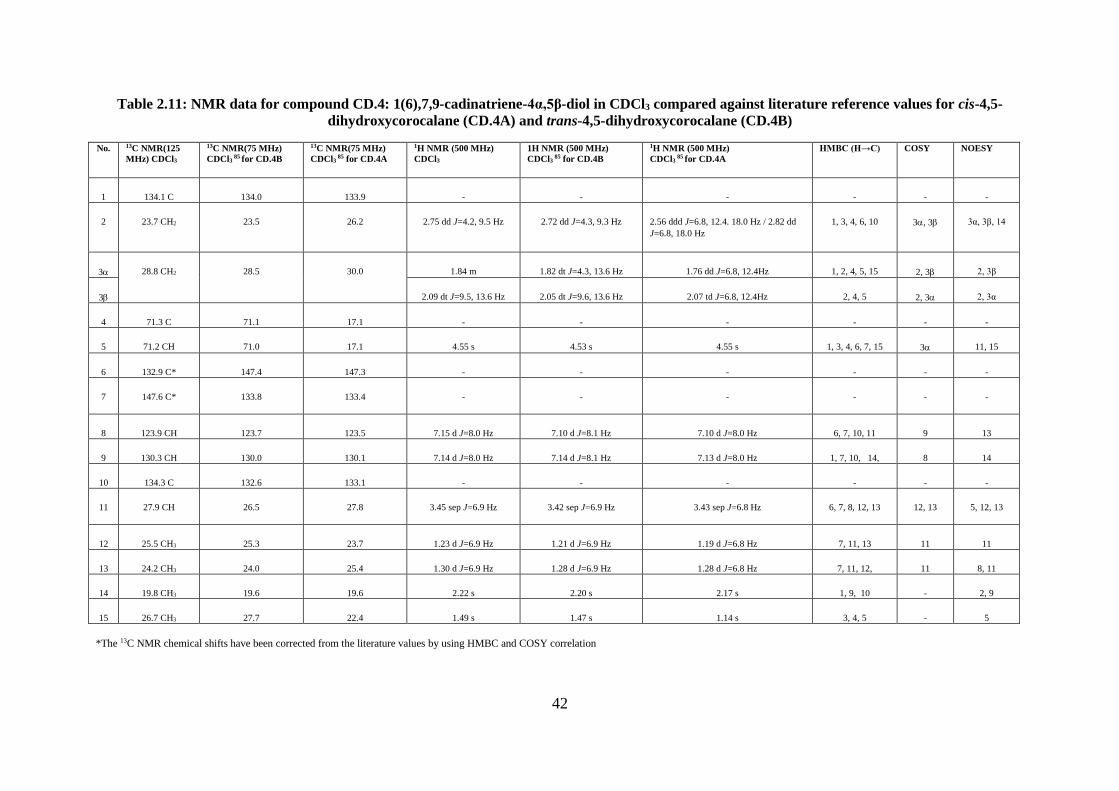
42
Table 2.11: NMR data for compound CD.4: 1(6),7,9-cadinatriene-4α,5β-diol in CDCl3 compared against literature reference values for cis-4,5-
dihydroxycorocalane (CD.4A) and trans-4,5-dihydroxycorocalane (CD.4B)
No. 13C NMR(125
MHz) CDCl3
13C NMR(75 MHz)
CDCl3 85
for CD.4B
13C NMR(75 MHz)
CDCl3 85 for CD.4A
1H NMR (500 MHz)
CDCl3
1H NMR (500 MHz)
CDCl3 85 for CD.4B
1H NMR (500 MHz)
CDCl3 85
for CD.4A
HMBC (H→C) COSY NOESY
1 134.1 C 134.0 133.9 - - - - - -
2 23.7 CH2 23.5 26.2 2.75 dd J=4.2, 9.5 Hz 2.72 dd J=4.3, 9.3 Hz 2.56 ddd J=6.8, 12.4. 18.0 Hz / 2.82 dd
J=6.8, 18.0 Hz
1, 3, 4, 6, 10 3, 3 3α, 3β, 14
3 28.8 CH2 28.5 30.0 1.84 m 1.82 dt J=4.3, 13.6 Hz 1.76 dd J=6.8, 12.4Hz 1, 2, 4, 5, 15 2, 3 2, 3β
3 2.09 dt J=9.5, 13.6 Hz 2.05 dt J=9.6, 13.6 Hz 2.07 td J=6.8, 12.4Hz 2, 4, 5 2, 3 2, 3α
4 71.3 C 71.1 17.1 - - - - - -
5 71.2 CH 71.0 17.1 4.55 s 4.53 s 4.55 s 1, 3, 4, 6, 7, 15 3 11, 15
6 132.9 C* 147.4 147.3 - - - - - -
7 147.6 C* 133.8 133.4 - - - - - -
8 123.9 CH 123.7 123.5 7.15 d J=8.0 Hz 7.10 d J=8.1 Hz 7.10 d J=8.0 Hz 6, 7, 10, 11 9 13
9 130.3 CH 130.0 130.1 7.14 d J=8.0 Hz 7.14 d J=8.1 Hz 7.13 d J=8.0 Hz 1, 7, 10, 14, 8 14
10 134.3 C 132.6 133.1 - - - - - -
11 27.9 CH 26.5 27.8 3.45 sep J=6.9 Hz 3.42 sep J=6.9 Hz 3.43 sep J=6.8 Hz 6, 7, 8, 12, 13 12, 13 5, 12, 13
12 25.5 CH3 25.3 23.7 1.23 d J=6.9 Hz 1.21 d J=6.9 Hz 1.19 d J=6.8 Hz 7, 11, 13 11 11
13 24.2 CH3 24.0 25.4 1.30 d J=6.9 Hz 1.28 d J=6.9 Hz 1.28 d J=6.8 Hz 7, 11, 12, 11 8, 11
14 19.8 CH3 19.6 19.6 2.22 s 2.20 s 2.17 s 1, 9, 10 - 2, 9
15 26.7 CH3 27.7 22.4 1.49 s 1.47 s 1.14 s 3, 4, 5 - 5
*The 13C NMR chemical shifts have been corrected from the literature values by using HMBC and COSY correlation
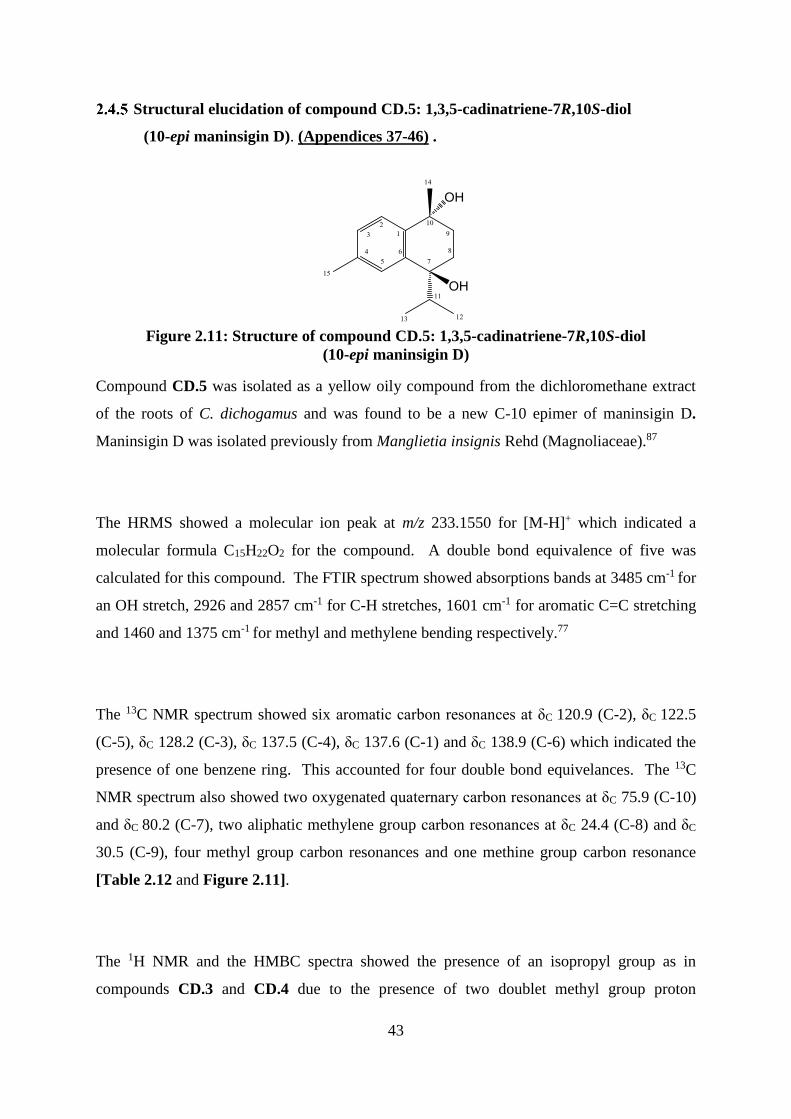
43
Structural elucidation of compound CD.5: 1,3,5-cadinatriene-7R,10S-diol
(10-epi maninsigin D). (Appendices 37-46) .
Figure 2.11: Structure of compound CD.5: 1,3,5-cadinatriene-7R,10S-diol
(10-epi maninsigin D)
Compound CD.5 was isolated as a yellow oily compound from the dichloromethane extract
of the roots of C. dichogamus and was found to be a new C-10 epimer of maninsigin D.
Maninsigin D was isolated previously from Manglietia insignis Rehd (Magnoliaceae).87
The HRMS showed a molecular ion peak at m/z 233.1550 for [M-H]+ which indicated a
molecular formula C15H22O2 for the compound. A double bond equivalence of five was
calculated for this compound. The FTIR spectrum showed absorptions bands at 3485 cm-1 for
an OH stretch, 2926 and 2857 cm-1 for C-H stretches, 1601 cm-1 for aromatic C=C stretching
and 1460 and 1375 cm-1 for methyl and methylene bending respectively.77
The 13C NMR spectrum showed six aromatic carbon resonances at δC 120.9 (C-2), δC 122.5
(C-5), δC 128.2 (C-3), δC 137.5 (C-4), δC 137.6 (C-1) and δC 138.9 (C-6) which indicated the
presence of one benzene ring. This accounted for four double bond equivelances. The 13C
NMR spectrum also showed two oxygenated quaternary carbon resonances at δC 75.9 (C-10)
and δC 80.2 (C-7), two aliphatic methylene group carbon resonances at δC 24.4 (C-8) and δC
30.5 (C-9), four methyl group carbon resonances and one methine group carbon resonance
[Table 2.12 and Figure 2.11].
The 1H NMR and the HMBC spectra showed the presence of an isopropyl group as in
compounds CD.3 and CD.4 due to the presence of two doublet methyl group proton
44
resonances at δH 1.15 (d, J= 6.9 Hz, 3H-12) and δH 1.21 (d, J = 6.9 Hz, 3H-13) and one
methine proton resonance at δH 2.60 (hept, J = 6.9 Hz, H-11). The methine proton resonance
at δH 2.60 (H-11) showed correlations in the HMBC spectrum with the oxygenated
quaternary carbon resonance at δC 80.2 (C-7), one aromatic carbon resonance at δC 138.9 (C-
6) and one methylene carbon resonance at δC 24.4 (C-8). The singlet methyl group proton
resonance at δH 1.64 (3H-14) displayed correlations with an oxygenated quaternary carbon
resonance at δC 75.9 (C-10), one aromatic carbon resonance at δC 137.6 (C-1) and a
methylene carbon resonance at δC 30.5 (C-9). Therefore, the methyl group was placed at C-
14.
The COSY spectrum confirmed the assignment of the ortho-coupled proton resonances at δH
7.21 (H, d, J= 8.0 Hz) and δH 7.18 (H, d, J= 8.0 Hz) as H-2 and H-3 respectively. Further
coupling between the two proton resonances at δH 2.36 and δH 1.49 for 2H-8 and the
methylene proton resonances at δH 1.59 and δH 2.26 for 2H-9 was also observed in the COSY
spectrum.
Based on the above 1D and 2D NMR spectroscopic data the structure of this compound was
proposed to be 1,3,5-cadinatriene-7,10-diol. Due to the presence of two chiral centres at C-7
and C-10, there are four possible absolute stereostructures [Figure 2.12]. A search in
Dictionary of Natural Products (DNP) for this compound indicated that 1,3,5-cadinatriene-
7β,10β-diol (CD.5D, maninsigin D), has been previously reported by Shang et al.87 In order
to confirm the structure of CD.5, a 13C NMR spectrum was run in CD3OD to compare with
the literature data of CD.5D (maninsigin D).87 Comparison of 13C NMR chemical shifts of
the reported compound CD.5D and the isolated one (CD.5) showed differences especially at
resonances δC 81.6 (C-7), δC 77.3 (C-10) and δC 19.5 (C-14) for CD.5, and δC 73.5, δC 70.1
and δC 28.8 respectively for CD.5D [Table 2.12]. Shang et al. used ROESY experiments to
assign the relative configuration of CD.5D, and they found that the 3H-14 and the isopropyl
groups were cis to each other. Correlations between the H-11 and 3H-14 resonances of
compound CD.5D in the ROESY experiment as reported by Shang et al. are given in Figure
2.13.
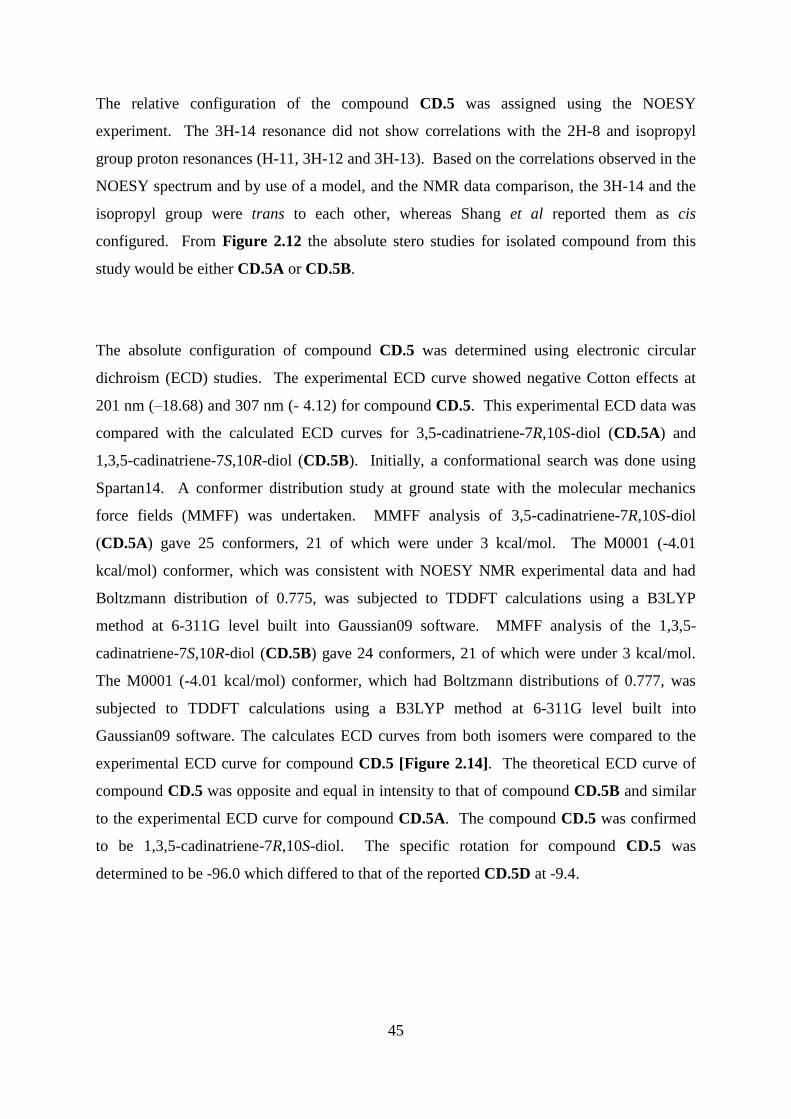
45
The relative configuration of the compound CD.5 was assigned using the NOESY
experiment. The 3H-14 resonance did not show correlations with the 2H-8 and isopropyl
group proton resonances (H-11, 3H-12 and 3H-13). Based on the correlations observed in the
NOESY spectrum and by use of a model, and the NMR data comparison, the 3H-14 and the
isopropyl group were trans to each other, whereas Shang et al reported them as cis
configured. From Figure 2.12 the absolute stero studies for isolated compound from this
study would be either CD.5A or CD.5B.
The absolute configuration of compound CD.5 was determined using electronic circular
dichroism (ECD) studies. The experimental ECD curve showed negative Cotton effects at
201 nm (–18.68) and 307 nm (- 4.12) for compound CD.5. This experimental ECD data was
compared with the calculated ECD curves for 3,5-cadinatriene-7R,10S-diol (CD.5A) and
1,3,5-cadinatriene-7S,10R-diol (CD.5B). Initially, a conformational search was done using
Spartan14. A conformer distribution study at ground state with the molecular mechanics
force fields (MMFF) was undertaken. MMFF analysis of 3,5-cadinatriene-7R,10S-diol
(CD.5A) gave 25 conformers, 21 of which were under 3 kcal/mol. The M0001 (-4.01
kcal/mol) conformer, which was consistent with NOESY NMR experimental data and had
Boltzmann distribution of 0.775, was subjected to TDDFT calculations using a B3LYP
method at 6-311G level built into Gaussian09 software. MMFF analysis of the 1,3,5-
cadinatriene-7S,10R-diol (CD.5B) gave 24 conformers, 21 of which were under 3 kcal/mol.
The M0001 (-4.01 kcal/mol) conformer, which had Boltzmann distributions of 0.777, was
subjected to TDDFT calculations using a B3LYP method at 6-311G level built into
Gaussian09 software. The calculates ECD curves from both isomers were compared to the
experimental ECD curve for compound CD.5 [Figure 2.14]. The theoretical ECD curve of
compound CD.5 was opposite and equal in intensity to that of compound CD.5B and similar
to the experimental ECD curve for compound CD.5A. The compound CD.5 was confirmed
to be 1,3,5-cadinatriene-7R,10S-diol. The specific rotation for compound CD.5 was
determined to be -96.0 which differed to that of the reported CD.5D at -9.4.
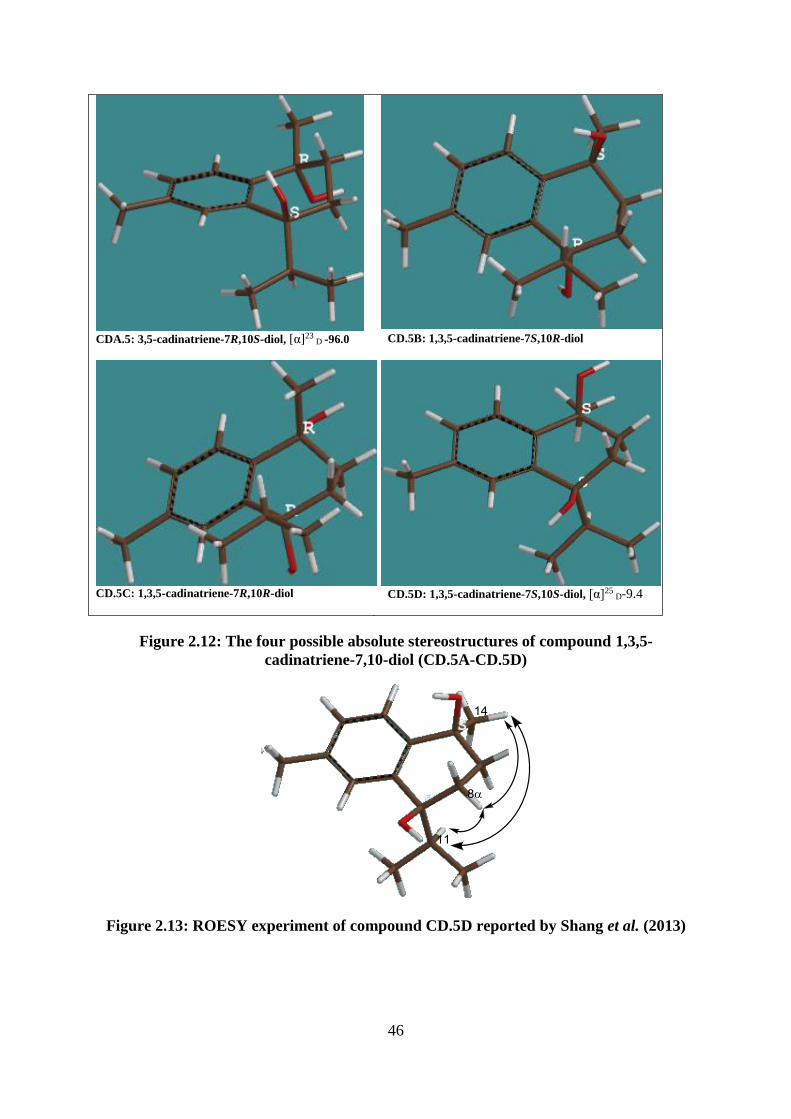
46
CDA.5: 3,5-cadinatriene-7R,10S-diol, [α]23
D -96.0
CD.5B: 1,3,5-cadinatriene-7S,10R-diol
CD.5C: 1,3,5-cadinatriene-7R,10R-diol CD.5D: 1,3,5-cadinatriene-7S,10S-diol, [α]25
D-9.4
Figure 2.12: The four possible absolute stereostructures of compound 1,3,5-
cadinatriene-7,10-diol (CD.5A-CD.5D)
Figure 2.13: ROESY experiment of compound CD.5D reported by Shang et al. (2013)
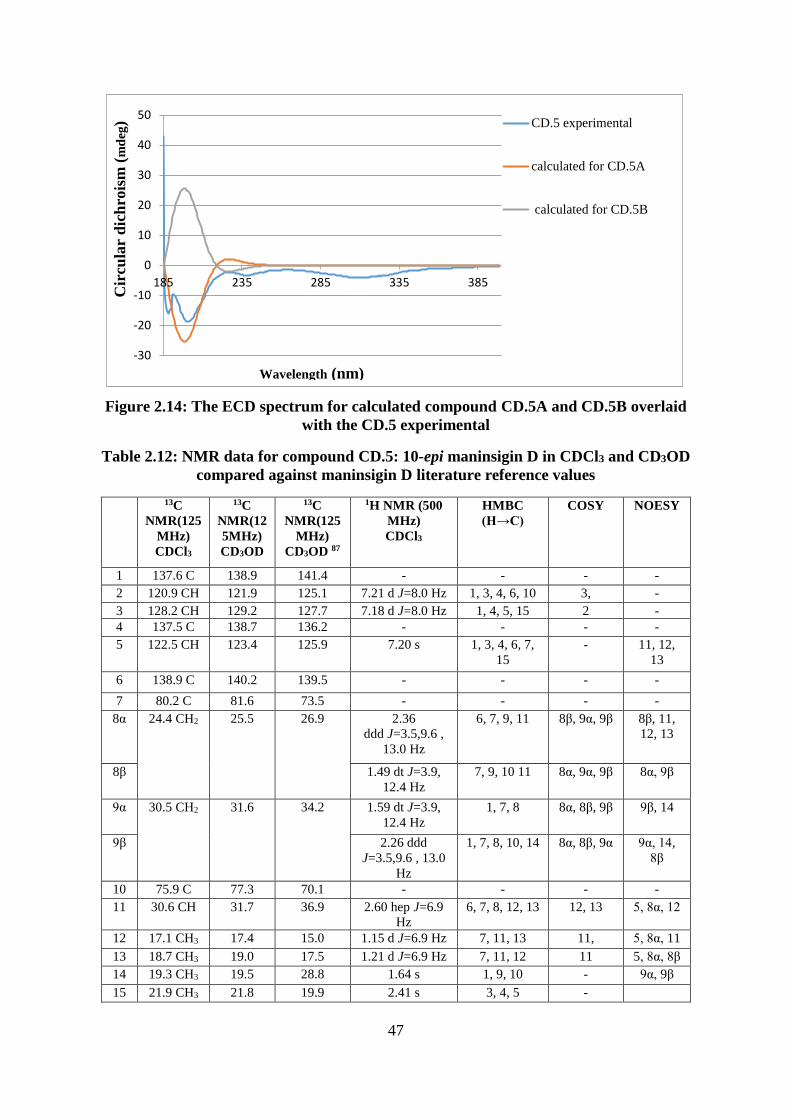
47
Figure 2.14: The ECD spectrum for calculated compound CD.5A and CD.5B overlaid
with the CD.5 experimental
Table 2.12: NMR data for compound CD.5: 10-epi maninsigin D in CDCl3 and CD3OD
compared against maninsigin D literature reference values
13C
NMR(125
MHz)
CDCl3
13C
NMR(12
5MHz)
CD3OD
13C
NMR(125
MHz)
CD3OD 87
1H NMR (500
MHz)
CDCl3
HMBC
(H→C)
COSY NOESY
1 137.6 C 138.9 141.4 - - - -
2 120.9 CH 121.9 125.1 7.21 d J=8.0 Hz 1, 3, 4, 6, 10 3, -
3 128.2 CH 129.2 127.7 7.18 d J=8.0 Hz 1, 4, 5, 15 2 -
4 137.5 C 138.7 136.2 - - - -
5 122.5 CH 123.4 125.9 7.20 s 1, 3, 4, 6, 7,
15
- 11, 12,
13
6 138.9 C 140.2 139.5 - - - -
7 80.2 C 81.6 73.5 - - - -
8α 24.4 CH2 25.5 26.9 2.36
ddd J=3.5,9.6 ,
13.0 Hz
6, 7, 9, 11 8β, 9α, 9β 8β, 11,
12, 13
8β 1.49 dt J=3.9,
12.4 Hz
7, 9, 10 11 8α, 9α, 9β 8α, 9β
9α 30.5 CH2 31.6 34.2 1.59 dt J=3.9,
12.4 Hz
1, 7, 8 8α, 8β, 9β 9β, 14
9β 2.26 ddd
J=3.5,9.6 , 13.0
Hz
1, 7, 8, 10, 14 8α, 8β, 9α 9α, 14,
8β
10 75.9 C 77.3 70.1 - - - -
11 30.6 CH 31.7 36.9 2.60 hep J=6.9
Hz
6, 7, 8, 12, 13 12, 13 5, 8α, 12
12 17.1 CH3 17.4 15.0 1.15 d J=6.9 Hz 7, 11, 13 11, 5, 8α, 11
13 18.7 CH3 19.0 17.5 1.21 d J=6.9 Hz 7, 11, 12 11 5, 8α, 8β
14 19.3 CH3 19.5 28.8 1.64 s 1, 9, 10 - 9α, 9β
15 21.9 CH3 21.8 19.9 2.41 s 3, 4, 5 -
-30
-20
-10
0
10
20
30
40
50
185 235 285 335 385
CD.5 experimental
calculated for CD.5A
calculated for CD.5B
Wavelength (nm)
Cir
cula
r d
ich
rois
m (
md
eg)
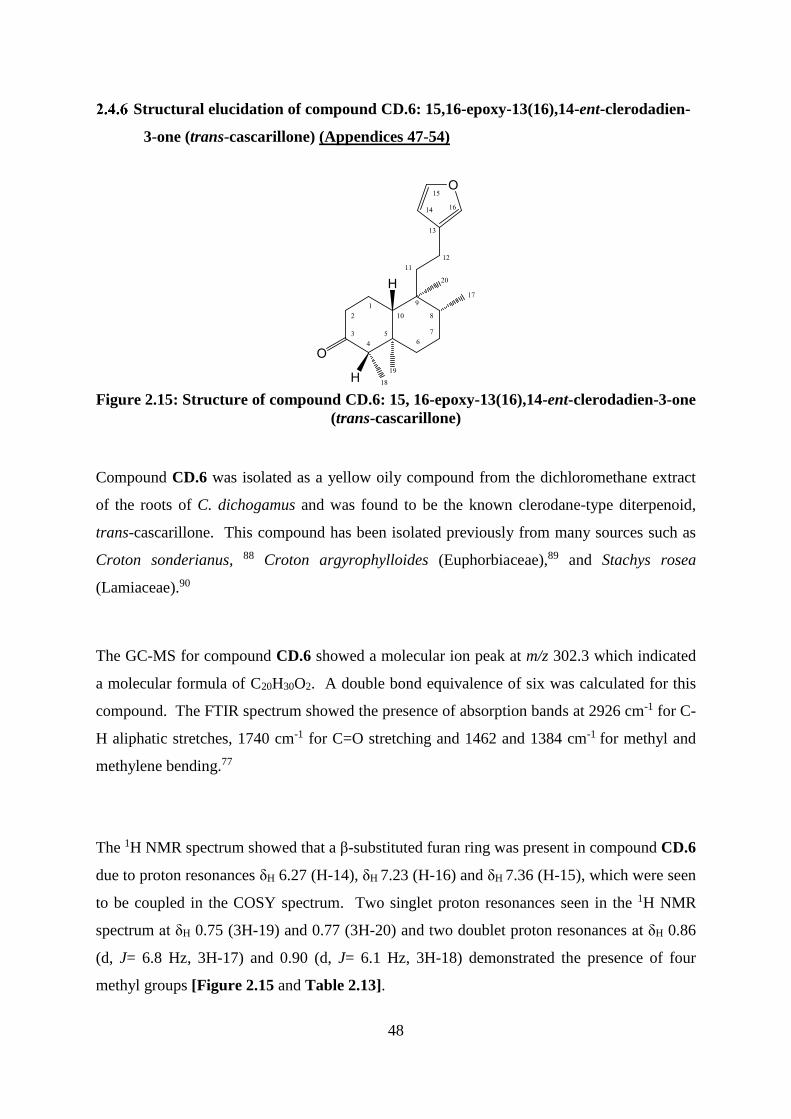
48
Structural elucidation of compound CD.6: 15,16-epoxy-13(16),14-ent-clerodadien-
3-one (trans-cascarillone) (Appendices 47-54)
Figure 2.15: Structure of compound CD.6: 15, 16-epoxy-13(16),14-ent-clerodadien-3-one
(trans-cascarillone)
Compound CD.6 was isolated as a yellow oily compound from the dichloromethane extract
of the roots of C. dichogamus and was found to be the known clerodane-type diterpenoid,
trans-cascarillone. This compound has been isolated previously from many sources such as
Croton sonderianus, 88 Croton argyrophylloides (Euphorbiaceae),89 and Stachys rosea
(Lamiaceae).90
The GC-MS for compound CD.6 showed a molecular ion peak at m/z 302.3 which indicated
a molecular formula of C20H30O2. A double bond equivalence of six was calculated for this
compound. The FTIR spectrum showed the presence of absorption bands at 2926 cm-1 for C-
H aliphatic stretches, 1740 cm-1 for C=O stretching and 1462 and 1384 cm-1 for methyl and
methylene bending.77
The 1H NMR spectrum showed that a β-substituted furan ring was present in compound CD.6
due to proton resonances δH 6.27 (H-14), δH 7.23 (H-16) and δH 7.36 (H-15), which were seen
to be coupled in the COSY spectrum. Two singlet proton resonances seen in the 1H NMR
spectrum at δH 0.75 (3H-19) and 0.77 (3H-20) and two doublet proton resonances at δH 0.86
(d, J= 6.8 Hz, 3H-17) and 0.90 (d, J= 6.1 Hz, 3H-18) demonstrated the presence of four
methyl groups [Figure 2.15 and Table 2.13].
49
The 13C NMR spectrum showed twenty carbon resonances, including four carbon resonances
at δC 111.2 (C-14), δC 125.6 (C-13), δC 138.7 (C-16) and δC 143.1 (C-15) for furan ring
carbons and one ketone group carbon resonance at δC 213.2 (C-3), which supported a
clerodane diterpenoid structure. The carbonyl group and furan ring accounted for four out of
six units of unsaturation, the remaining two units indicated two more rings.
The ketone group was placed at the C-3 position as it showed correlations with the H-1β (H
1.97), H-2 (H 2.29), H-2 (H 2.40), H-4 (δH 2.26) and 3H-18 (H 0.90, d, J= 6.1) proton
resonances in the HMBC spectrum. The two singlet methyl group proton resonances at δH
0.75 and δH 0.77 were assigned to 3H-19 and 3H-20 respectively due to their HMBC
correlations. The 3H-19 proton resonance showed correlations with the C-4 (C 58.2), C-5
(C 42.1), C-6 (C 39.5) and C-10 (C 49.1) carbon resonances, in the HMBC spectrum. In
addition, the 3H-20 proton resonance showed HMBC correlations with the C-8 (δC 36.8), C-9
(δC 39.5), C-10 (C 49.1) and C-11 (δC 38.7) carbon resonances.
The COSY spectrum displayed coupling between the doublet methyl group proton resonance
at δH 0.86 (d, J= 6.8, 3H-17) and the methine proton resonance at δH 1.63 (H-8). This
methine proton resonance showed a correlation in the HMBC spectrum with the C-9 (δC 39.5)
resonance. Moreover, the other doublet methyl group proton resonances at δH 0.90 (3H-18, d
J= 6.1) was seen to be coupled with the methine proton resonance at δH 2.26 for H-4, in the
COSY spectrum. The HMBC and COSY spectra confirmed the assignment of two methylene
group carbon resonances at δC 38.7 (C-11) and 18.5 (C-12).
The above NMR spectroscopic data suggested that compound CD.6 was a furanoclerodane
possessing a keto group at the C-3 position, two methyl groups attached to the C-5 and C-9
positions and two secondary methyl groups attached to the C-4 and C-8 positions. This
information was consistent with the structure of the known cascarillone, previously reported
from Croton sonderianus.88 and Croton eluteria. A comparison of the spectroscopic data for
compound CD.6 with that found in the literature for trans-cascarillone88 showed a difference
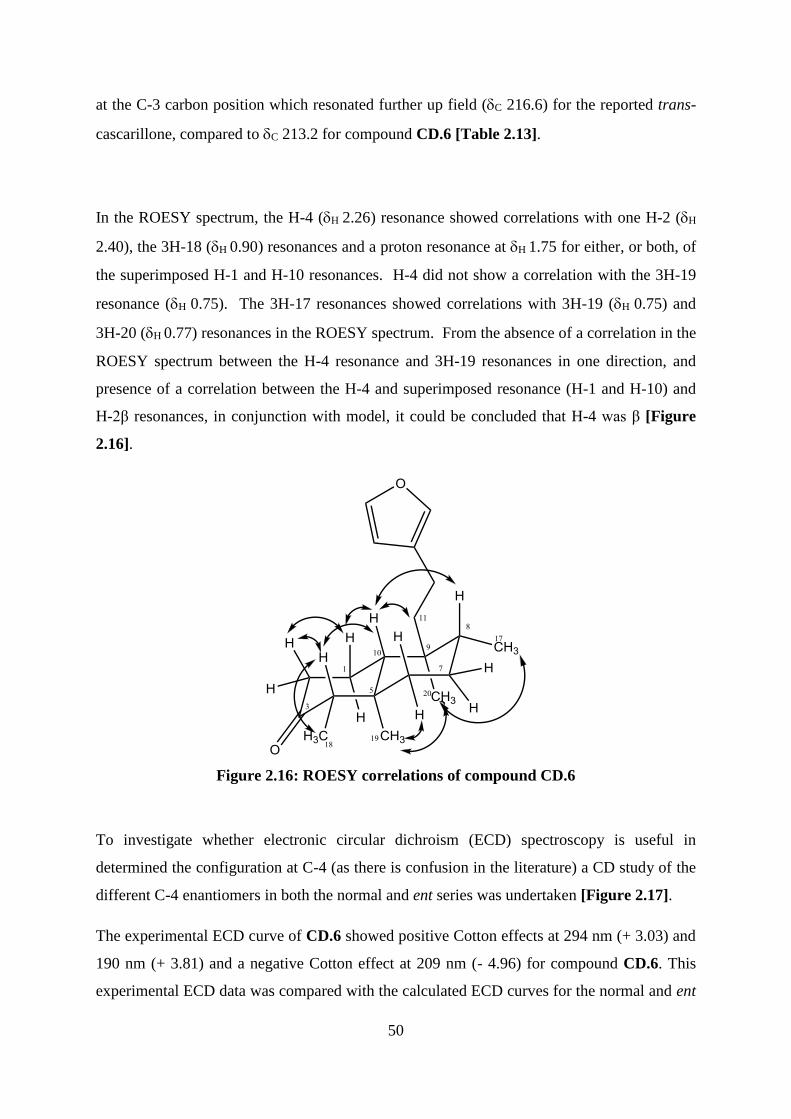
50
at the C-3 carbon position which resonated further up field (C 216.6) for the reported trans-
cascarillone, compared to C 213.2 for compound CD.6 [Table 2.13].
In the ROESY spectrum, the H-4 (H 2.26) resonance showed correlations with one H-2 (H
2.40), the 3H-18 (H 0.90) resonances and a proton resonance at H 1.75 for either, or both, of
the superimposed H-1 and H-10 resonances. H-4 did not show a correlation with the 3H-19
resonance (H 0.75). The 3H-17 resonances showed correlations with 3H-19 (H 0.75) and
3H-20 (H 0.77) resonances in the ROESY spectrum. From the absence of a correlation in the
ROESY spectrum between the H-4 resonance and 3H-19 resonances in one direction, and
presence of a correlation between the H-4 and superimposed resonance (H-1 and H-10) and
H-2β resonances, in conjunction with model, it could be concluded that H-4 was β [Figure
2.16].
Figure 2.16: ROESY correlations of compound CD.6
To investigate whether electronic circular dichroism (ECD) spectroscopy is useful in
determined the configuration at C-4 (as there is confusion in the literature) a CD study of the
different C-4 enantiomers in both the normal and ent series was undertaken [Figure 2.17].
The experimental ECD curve of CD.6 showed positive Cotton effects at 294 nm (+ 3.03) and
190 nm (+ 3.81) and a negative Cotton effect at 209 nm (- 4.96) for compound CD.6. This
experimental ECD data was compared with the calculated ECD curves for the normal and ent
51
enantiomers of the two possible arrangement at C-4 [CD.6A, CD.6B, CD.6C and CD.6D].
Conformational searches on each of the four structures were done using Spartan14. A
conformer distribution study at ground state with the molecular mechanics force fields
(MMFF) was undertaken.
MMFF analysis of structure CD.6A (ent enantiomer)- [4R, 5R, 8R, 9S, 10R]- 15, 16-epoxy-
13(16), 14-ent-clerodadien-3-one [Figure 2.17] gave 33 conformers, 11 of which were under
3 kcal/mol. The two conformers M0001 (-1.95 kcal/mol) and M0002 (-1.93 kcal/mol), which
were consistent with ROESY and NOESY NMR experimental data and had Boltzmann
distributions of 0.412 and 0.403 respectively, were subjected to TDDFT calculations using a
B3LYP method at 6-311G level built into Gaussian09 software. On the other hand, MMFF
analysis of structure CD.6B (normal enantiomer), [4S, 5S, 8S, 9R, 10S]- 15, 16-epoxy-13(16),
14-ent-clerodadien-3-one [Figure 2.17] gave 37 conformers, 11 of which were under 3
kcal/mol. The two conformers M0001 (-1.91 kcal/mol) and M0002 (-1.89 kcal/mol), which
had Boltzmann distributions of 0.412 and 0.403, were subjected to TDDFT calculations using
a B3LYP method at 6-311G level built into Gaussian09 software. The resulting ECD curves
were Boltzmann weighted and compared to the experimental ECD curve for compound CD.6
[Figure 2.18].
MMFF analysis of structure CD.6C (ent enantiomer)- [4S, 5R, 8R, 9S, 10R]- 15, 16-epoxy-
13(16), 14-ent-clerodadien-3-one [Figure 2.17] gave 27 conformers, 6 of which were under 3
kcal/mol. The two conformers M0001 (0.00 kcal/mol) and M0002 ( 0.01 kcal/mol), which
were consistent with ROESY NMR experimental data and had Boltzmann distributions of
0.426 and 0.415 respectively, were subjected to TDDFT calculations using a B3LYP method
at 6-311G level built into Gaussian09 software. On the other hand, MMFF analysis of
structure CD.6D (normal enantiomer), [4R, 5S, 8S, 9R, 10S]- 15, 16-epoxy-13(16), 14-ent-
clerodadien-3-one [Figure 2.17], gave 29 conformers, 6 of which were under 3 kcal/mol.
The two conformers M0001 (1.11 kcal/mol) and M0002 (1.12 kcal/mol), which had
Boltzmann distributions of 0.426 and 0.415, were subjected to TDDFT calculations using a
B3LYP method at 6-311G level built into Gaussian09 software. The resulting ECD curves
52
from both possible C-4 configuration were Boltzmann weighted and compared to the
experimental ECD curve for compound CD.6 [Figure 2.19].
The experimental ECD curve for compound CD.6 was only similar in certain regions to that
calculated for CD.6A, the structure shown to be correct using the NOESY experiment. The
region at 290 nm was comparable in the experimental and calculated spectra. The calculated
spectra of CD.6B, CD.6C and CD.6D did not match the experimental spectrum [Figure 2.18
and Figure 2.19]. The specific rotation for compound CD.6 was determined to be +66.1 the
reported trans-cascarillone is +35.7.88
Previous research showed that normal enantiomers of compound CD.6 had wide cytotoxicity
against the five human cancer cell lines, BT-474, KATO-3, CHAGO, SW-620 and HEP-G2
in tissue culture with LC50 values of 3.26, 6.78, 6.67, 4.44 and 6.37 µg/mL/cell line.91
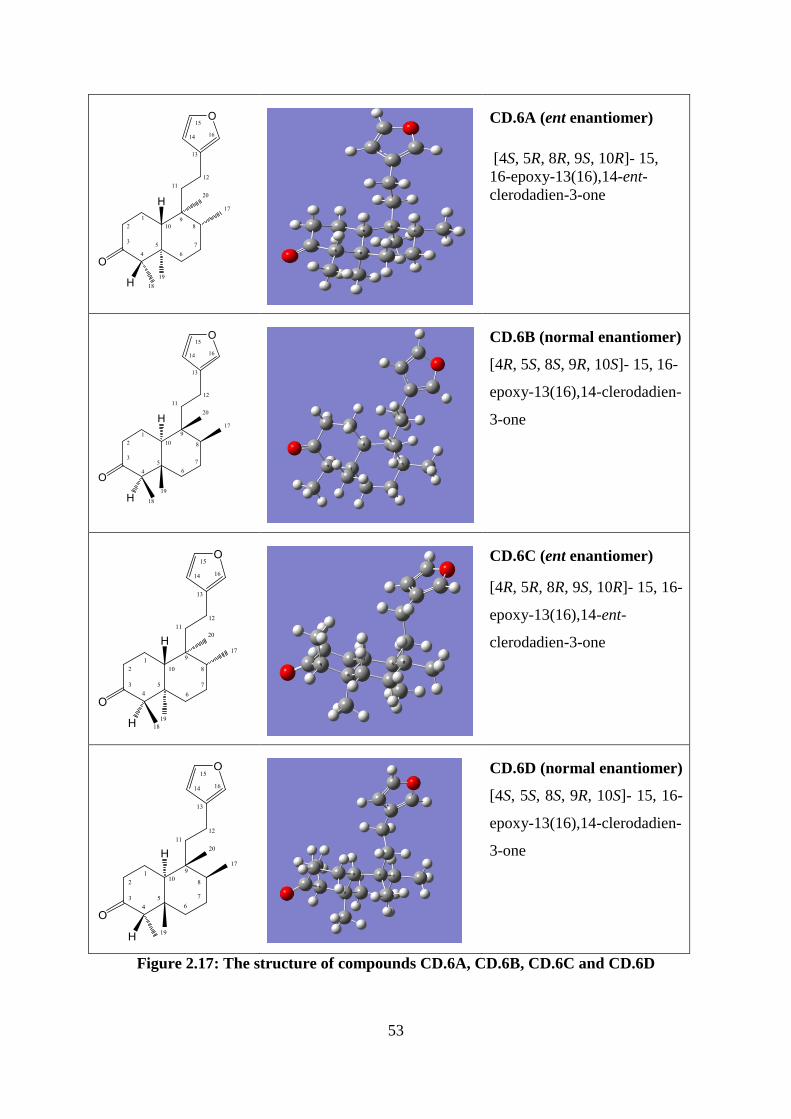
53
CD.6A (ent enantiomer)
[4S, 5R, 8R, 9S, 10R]- 15,
16-epoxy-13(16),14-ent-
clerodadien-3-one
CD.6B (normal enantiomer)
[4R, 5S, 8S, 9R, 10S]- 15, 16-
epoxy-13(16),14-clerodadien-
3-one
CD.6C (ent enantiomer)
[4R, 5R, 8R, 9S, 10R]- 15, 16-
epoxy-13(16),14-ent-
clerodadien-3-one
CD.6D (normal enantiomer)
[4S, 5S, 8S, 9R, 10S]- 15, 16-
epoxy-13(16),14-clerodadien-
3-one
Figure 2.17: The structure of compounds CD.6A, CD.6B, CD.6C and CD.6D
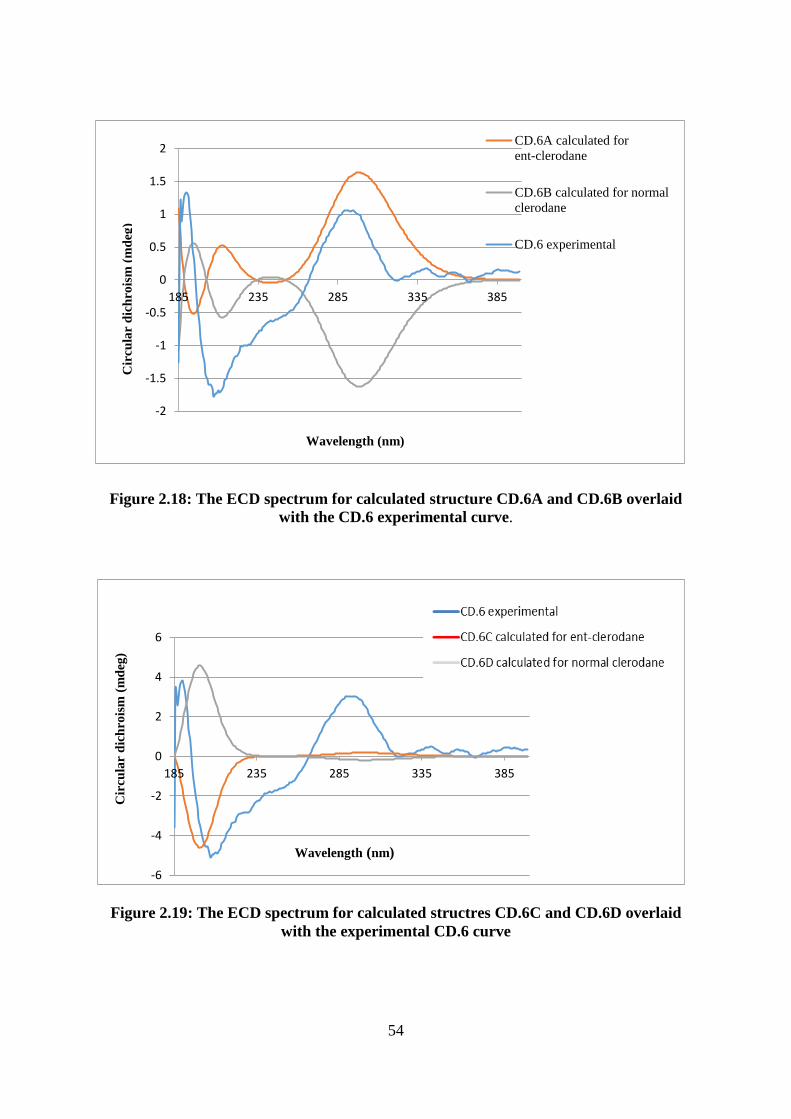
54
Figure 2.18: The ECD spectrum for calculated structure CD.6A and CD.6B overlaid
with the CD.6 experimental curve.
Figure 2.19: The ECD spectrum for calculated structres CD.6C and CD.6D overlaid
with the experimental CD.6 curve
-2
-1.5
-1
-0.5
0
0.5
1
1.5
2
185 235 285 335 385
CD.6A calculated for
ent-clerodane
CD.6B calculated for normal
clerodane
CD.6 experimental
Cir
cu
lar
dic
hro
ism
(m
deg
)
Wavelength (nm)
-6
-4
-2
0
2
4
6
185 235 285 335 385
Wavelength (nm)
Cir
cu
lar
dic
hro
ism
(m
deg
)
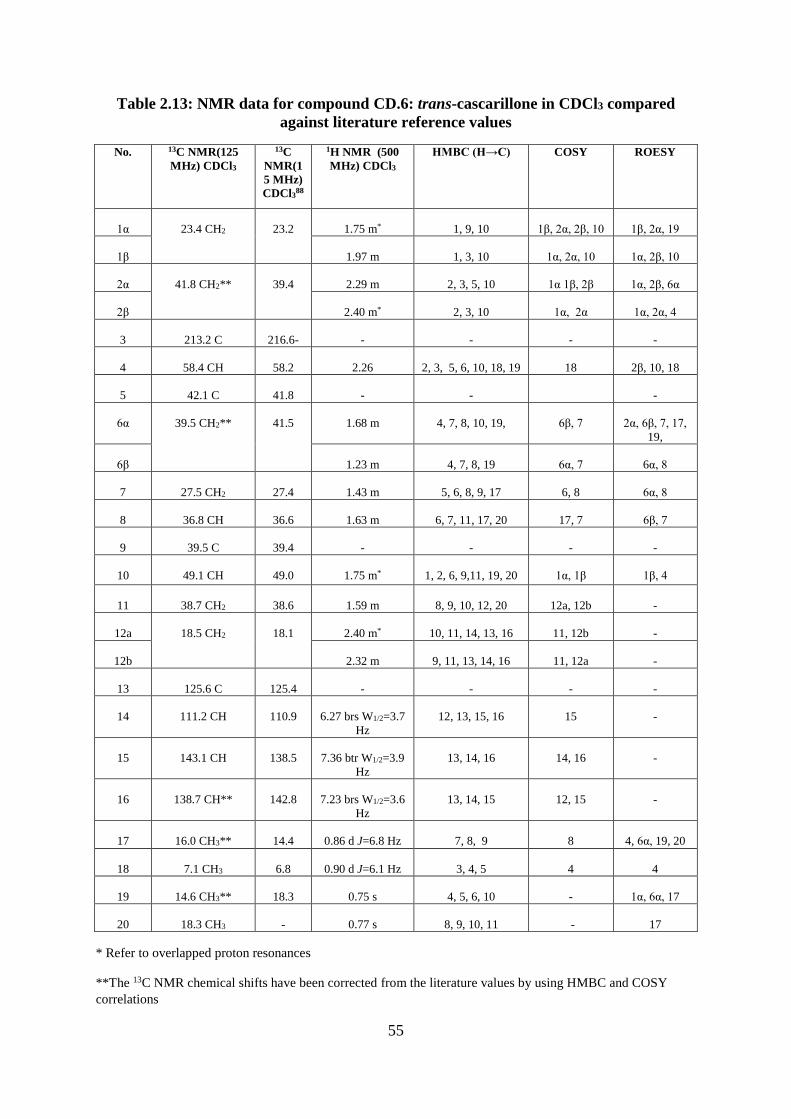
55
Table 2.13: NMR data for compound CD.6: trans-cascarillone in CDCl3 compared
against literature reference values
No. 13C NMR(125
MHz) CDCl3
13C
NMR(1
5 MHz)
CDCl388
1H NMR (500
MHz) CDCl3
HMBC (H→C) COSY ROESY
1α 23.4 CH2 23.2 1.75 m* 1, 9, 10 1β, 2α, 2β, 10 1β, 2α, 19
1β 1.97 m 1, 3, 10 1α, 2α, 10 1α, 2β, 10
2α 41.8 CH2** 39.4 2.29 m 2, 3, 5, 10 1α 1β, 2β 1α, 2β, 6α
2β 2.40 m* 2, 3, 10 1α, 2α 1α, 2α, 4
3 213.2 C 216.6- - - - -
4 58.4 CH 58.2 2.26 2, 3, 5, 6, 10, 18, 19 18 2β, 10, 18
5 42.1 C 41.8 - - -
6α 39.5 CH2** 41.5 1.68 m 4, 7, 8, 10, 19, 6β, 7 2α, 6β, 7, 17,
19,
6β 1.23 m 4, 7, 8, 19 6α, 7 6α, 8
7 27.5 CH2 27.4 1.43 m 5, 6, 8, 9, 17 6, 8 6α, 8
8 36.8 CH 36.6 1.63 m 6, 7, 11, 17, 20 17, 7 6β, 7
9 39.5 C 39.4 - - - -
10 49.1 CH 49.0 1.75 m* 1, 2, 6, 9,11, 19, 20 1α, 1β 1β, 4
11 38.7 CH2 38.6 1.59 m 8, 9, 10, 12, 20 12a, 12b -
12a 18.5 CH2 18.1 2.40 m* 10, 11, 14, 13, 16 11, 12b -
12b 2.32 m 9, 11, 13, 14, 16 11, 12a -
13 125.6 C 125.4 - - - -
14 111.2 CH 110.9 6.27 brs W1/2=3.7
Hz
12, 13, 15, 16 15 -
15 143.1 CH 138.5 7.36 btr W1/2=3.9
Hz
13, 14, 16 14, 16 -
16 138.7 CH** 142.8 7.23 brs W1/2=3.6
Hz
13, 14, 15 12, 15 -
17 16.0 CH3** 14.4 0.86 d J=6.8 Hz 7, 8, 9 8 4, 6α, 19, 20
18 7.1 CH3 6.8 0.90 d J=6.1 Hz 3, 4, 5 4 4
19 14.6 CH3** 18.3 0.75 s 4, 5, 6, 10 - 1α, 6α, 17
20 18.3 CH3 - 0.77 s 8, 9, 10, 11 - 17
* Refer to overlapped proton resonances
**The 13C NMR chemical shifts have been corrected from the literature values by using HMBC and COSY
correlations
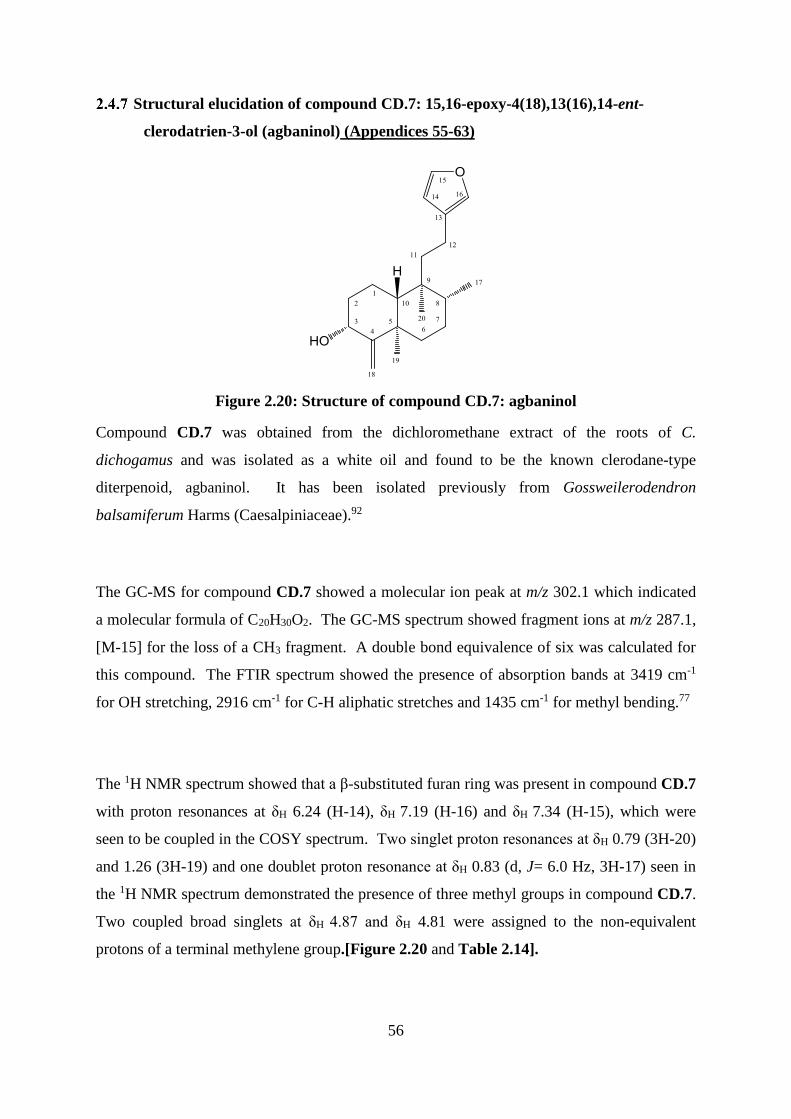
56
Structural elucidation of compound CD.7: 15,16-epoxy-4(18),13(16),14-ent-
clerodatrien-3-ol (agbaninol) (Appendices 55-63)
Figure 2.20: Structure of compound CD.7: agbaninol
Compound CD.7 was obtained from the dichloromethane extract of the roots of C.
dichogamus and was isolated as a white oil and found to be the known clerodane-type
diterpenoid, agbaninol. It has been isolated previously from Gossweilerodendron
balsamiferum Harms (Caesalpiniaceae).92
The GC-MS for compound CD.7 showed a molecular ion peak at m/z 302.1 which indicated
a molecular formula of C20H30O2. The GC-MS spectrum showed fragment ions at m/z 287.1,
[M-15] for the loss of a CH3 fragment. A double bond equivalence of six was calculated for
this compound. The FTIR spectrum showed the presence of absorption bands at 3419 cm-1
for OH stretching, 2916 cm-1 for C-H aliphatic stretches and 1435 cm-1 for methyl bending.77
The 1H NMR spectrum showed that a β-substituted furan ring was present in compound CD.7
with proton resonances at δH 6.24 (H-14), δH 7.19 (H-16) and δH 7.34 (H-15), which were
seen to be coupled in the COSY spectrum. Two singlet proton resonances at δH 0.79 (3H-20)
and 1.26 (3H-19) and one doublet proton resonance at δH 0.83 (d, J= 6.0 Hz, 3H-17) seen in
the 1H NMR spectrum demonstrated the presence of three methyl groups in compound CD.7.
Two coupled broad singlets at δH 4.87 and δH 4.81 were assigned to the non-equivalent
protons of a terminal methylene group.[Figure 2.20 and Table 2.14].
57
The 13C NMR spectrum showed twenty carbon resonances, including one oxygenated
methine carbon resonance at δC 74.9 (C-3), two olefinic carbon resonances one methylene
carbon resonance at δC 109.7 (C-18) and one quaternary carbon resonance at δC 161.0 (C-4),
and four carbon resonances at δC 111.2 (C-14), 125.9 (C-13), 138.6 (C-16) and 142.9 (C-15)
for the furan ring. A double bond and a furan ring accounted for four out of six units of
unsaturation, the remaining two units indicated two further rings.
The NMR data for CD.7 showed many similarities to the NMR data of CD.6 except for the
absence of a ketone group at C-3 and a methyl group at C-4 and the presence of a hydroxyl
group and an extra two olefinic carbon resonances. The additional olefinic methylene carbon
resonance at c 109.7, which corresponded to the proton resonances at δH 4.87 and 4.81 in the
HSQC spectrum, showed correlations in the HMBC spectrum with carbon resonances at C
74.9 (C-3), C 161.0 (C-4) and C 40.1 (C-5). Therefore, the olefinic methylene carbon was
assigned as C-18 and a hydroxy group was placed at C-3. Coupling was seen in the COSY
spectrum between the H-3 (δH 4.34) and the 2H-2 (δH 2.03 and δH 1.57) proton resonances.
The configuration of the hydroxy group at C-3 was assigned based on the observation of a
broad singlet pattern for H-3 with the 13C NMR shift at c 74.9 , which indicated a β-
equatorial orientation for H-3.93 The literature reports a doublet of doublet pattern J1,2= 11.6
and 5.7 Hz for α-axial orientation for H-3 with the 13C NMR shift of c 69.7 for compound
3β,12(S)-dihydroxycleroda-4(18),13-dien-15,16-olide (compound 1) [Figure 2.21 and Table
2.14].94 The ROESY spectrum displayed correlations between the proton resonance of the
3H-20 group (δH 0.79) and the proton resonances of 3H-17 (δH 0.83, d, J = 6.0 Hz) and 3H-19
(δH 1.26). Moreover, the 3H-19 and 3H-20 proton resonances showed correlations in the
ROESY spectrum with one of the H-1 (δH 1.83) and one of the H-2 (δH 2.03) proton
resonances respectively. However, the 3H-19 and 3H-20 proton resonances did not show
correlation with the H-3 resonance. This indicated that the 3H-17, 3H-19, 3H-20, H-1α and
H-2α were on the α face of the molecule, and opposite to H-3 and confirmed that CD.7
belonged to the ent-clerodane series.
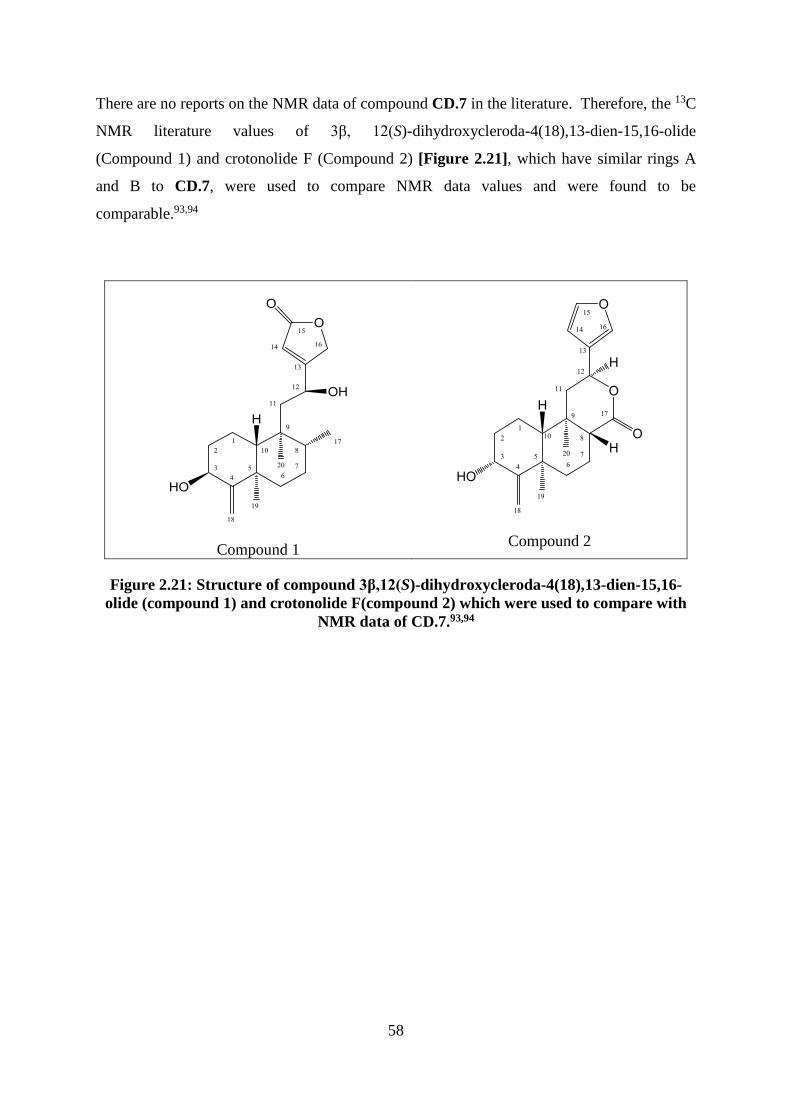
58
There are no reports on the NMR data of compound CD.7 in the literature. Therefore, the 13C
NMR literature values of 3β, 12(S)-dihydroxycleroda-4(18),13-dien-15,16-olide
(Compound 1) and crotonolide F (Compound 2) [Figure 2.21], which have similar rings A
and B to CD.7, were used to compare NMR data values and were found to be
comparable.93,94
Compound 1
Compound 2
Figure 2.21: Structure of compound 3β,12(S)-dihydroxycleroda-4(18),13-dien-15,16-
olide (compound 1) and crotonolide F(compound 2) which were used to compare with
NMR data of CD.7.93,94
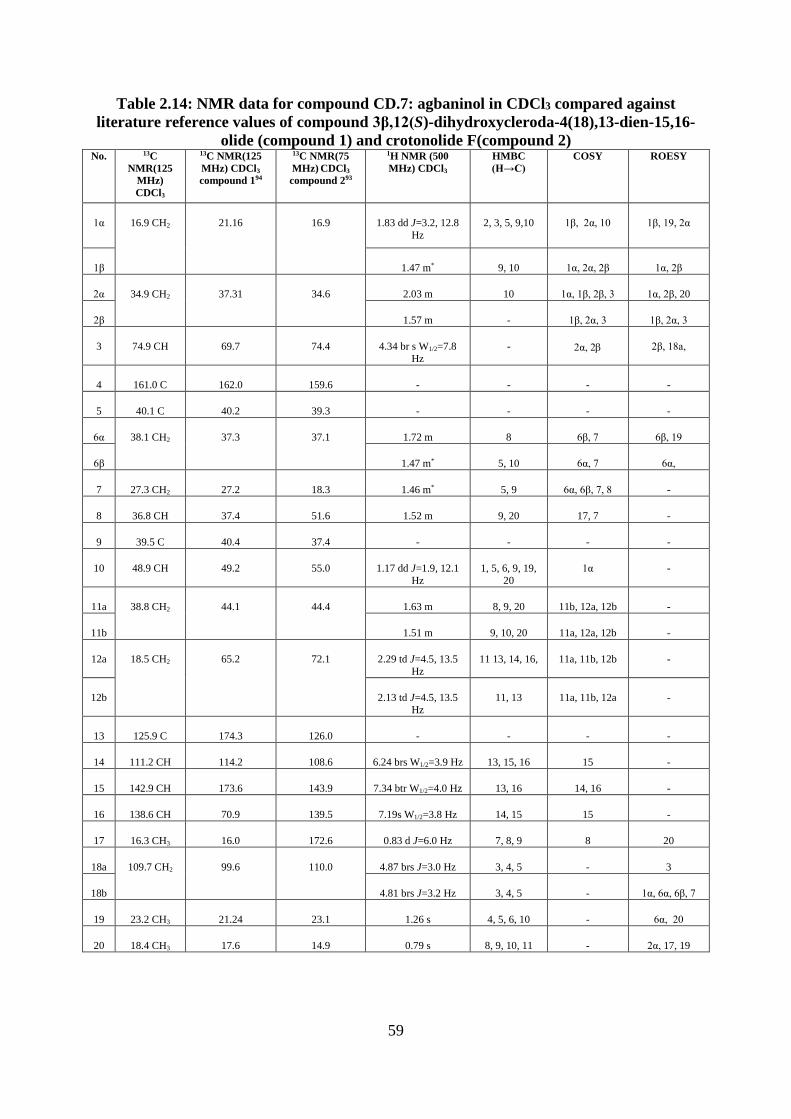
59
Table 2.14: NMR data for compound CD.7: agbaninol in CDCl3 compared against
literature reference values of compound 3β,12(S)-dihydroxycleroda-4(18),13-dien-15,16-
olide (compound 1) and crotonolide F(compound 2) No. 13C
NMR(125
MHz)
CDCl3
13C NMR(125
MHz) CDCl3
compound 194
13C NMR(75
MHz) CDCl3
compound 293
1H NMR (500
MHz) CDCl3
HMBC
(H→C)
COSY ROESY
1α 16.9 CH2 21.16 16.9 1.83 dd J=3.2, 12.8
Hz
2, 3, 5, 9,10 1β, 2α, 10 1β, 19, 2α
1β 1.47 m* 9, 10 1α, 2α, 2β 1α, 2β
2α 34.9 CH2 37.31 34.6 2.03 m 10 1α, 1β, 2β, 3 1α, 2β, 20
2β 1.57 m - 1β, 2α, 3 1β, 2α, 3
3 74.9 CH 69.7 74.4 4.34 br s W1/2=7.8
Hz
- 2α, 2 2β, 18a,
4 161.0 C 162.0 159.6 - - - -
5 40.1 C 40.2 39.3 - - - -
6α 38.1 CH2 37.3 37.1 1.72 m 8 6β, 7 6β, 19
6β 1.47 m* 5, 10 6α, 7 6α,
7 27.3 CH2 27.2 18.3 1.46 m* 5, 9 6α, 6β, 7, 8 -
8 36.8 CH 37.4 51.6 1.52 m 9, 20 17, 7 -
9 39.5 C 40.4 37.4 - - - -
10 48.9 CH 49.2 55.0 1.17 dd J=1.9, 12.1
Hz
1, 5, 6, 9, 19,
20
1α -
11a 38.8 CH2 44.1 44.4 1.63 m 8, 9, 20 11b, 12a, 12b -
11b 1.51 m 9, 10, 20 11a, 12a, 12b -
12a 18.5 CH2 65.2 72.1 2.29 td J=4.5, 13.5
Hz
11 13, 14, 16, 11a, 11b, 12b -
12b 2.13 td J=4.5, 13.5
Hz
11, 13 11a, 11b, 12a -
13 125.9 C 174.3 126.0 - - - -
14 111.2 CH 114.2 108.6 6.24 brs W1/2=3.9 Hz 13, 15, 16 15 -
15 142.9 CH 173.6 143.9 7.34 btr W1/2=4.0 Hz 13, 16 14, 16 -
16 138.6 CH 70.9 139.5 7.19s W1/2=3.8 Hz 14, 15 15 -
17 16.3 CH3 16.0 172.6 0.83 d J=6.0 Hz 7, 8, 9 8 20
18a 109.7 CH2 99.6 110.0 4.87 brs J=3.0 Hz 3, 4, 5 - 3
18b 4.81 brs J=3.2 Hz 3, 4, 5 - 1α, 6α, 6β, 7
19 23.2 CH3 21.24 23.1 1.26 s 4, 5, 6, 10 - 6α, 20
20 18.4 CH3 17.6 14.9 0.79 s 8, 9, 10, 11 - 2α, 17, 19
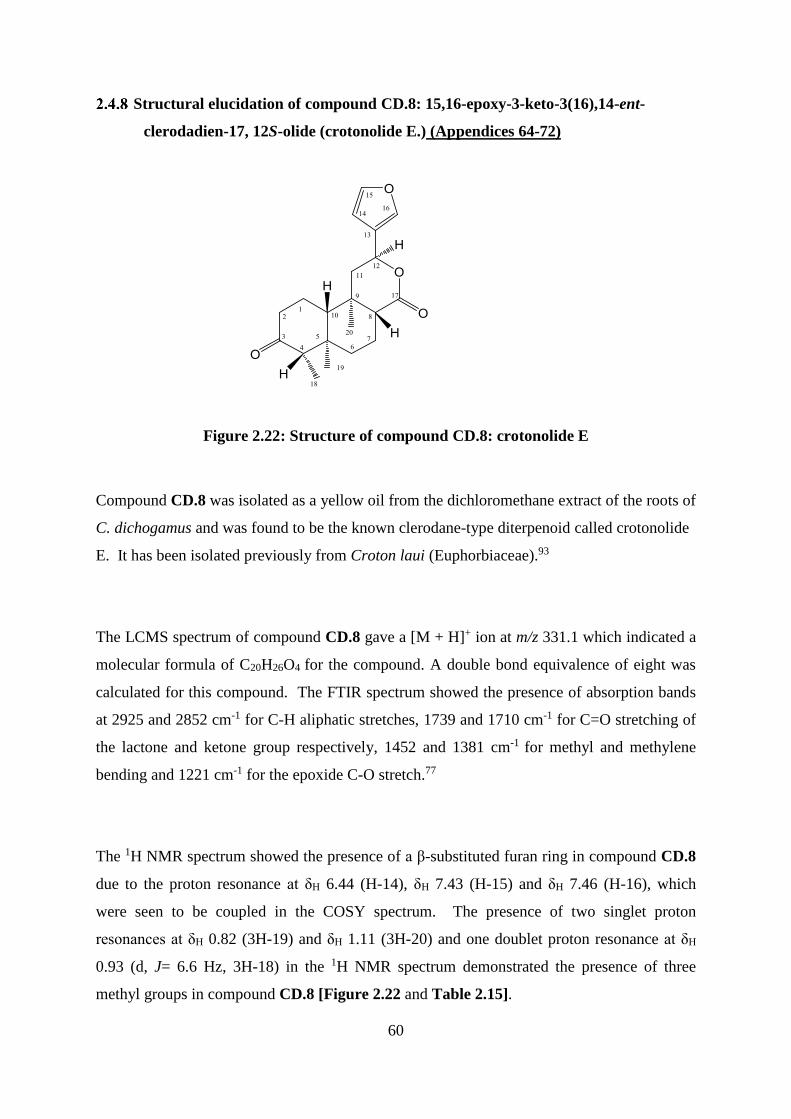
60
Structural elucidation of compound CD.8: 15,16-epoxy-3-keto-3(16),14-ent-
clerodadien-17, 12S-olide (crotonolide E.) (Appendices 64-72)
Figure 2.22: Structure of compound CD.8: crotonolide E
Compound CD.8 was isolated as a yellow oil from the dichloromethane extract of the roots of
C. dichogamus and was found to be the known clerodane-type diterpenoid called crotonolide
E. It has been isolated previously from Croton laui (Euphorbiaceae).93
The LCMS spectrum of compound CD.8 gave a [M + H]+ ion at m/z 331.1 which indicated a
molecular formula of C20H26O4 for the compound. A double bond equivalence of eight was
calculated for this compound. The FTIR spectrum showed the presence of absorption bands
at 2925 and 2852 cm-1 for C-H aliphatic stretches, 1739 and 1710 cm-1 for C=O stretching of
the lactone and ketone group respectively, 1452 and 1381 cm-1 for methyl and methylene
bending and 1221 cm-1 for the epoxide C-O stretch.77
The 1H NMR spectrum showed the presence of a β-substituted furan ring in compound CD.8
due to the proton resonance at δH 6.44 (H-14), δH 7.43 (H-15) and δH 7.46 (H-16), which
were seen to be coupled in the COSY spectrum. The presence of two singlet proton
resonances at δH 0.82 (3H-19) and δH 1.11 (3H-20) and one doublet proton resonance at δH
0.93 (d, J= 6.6 Hz, 3H-18) in the 1H NMR spectrum demonstrated the presence of three
methyl groups in compound CD.8 [Figure 2.22 and Table 2.15].
61
The 13C NMR spectrum displayed twenty carbon resonances, including four carbon
resonances at δC 108.7 (C-14), C 126.0 (C-13), C 139.6 (C-16) and C 144.1 (C-15) for the
furan ring, one ketone group carbon resonance at δC 211.4 and a lactone group carbon
resonance at δC 172.2 (C-17). The carbonyl groups and furan ring accounted for five out of
eight units of double bond equivalence, and the remaining three indicated the presence of
three additional rings.
The NMR data of CD.8 showed many similarities to the NMR data of CD.6. The 13C NMR
data of compound CD.8 showed the presence of one additional carbonyl group carbon
resonance at C 172.2 (C-17) and one oxygenated methine carbon resonances at C 72.0
(C-12). The oxymethine proton resonance at δH 5.50 (dd, J=5.5, 11.2), which corresponded
to the carbon resonance at δC 72.0 in the HSQC spectrum, was assigned as H-12 due to its
correlation with three furan ring carbon resonances at δC 126.0 (C-13), C 108.7 (C-14) and C
139.6 (C-16), one lactone carbon resonance at δC 172.2 (C-17) and one methylene carbon
resonance at δC 44.7 (C-11).
In the COSY spectrum, an AMX system with coupling between H-12 (δH 5.50, dd, J=5.5,
11.2 Hz) and the two H-11(δH 2.39 and 1.78) proton resonances confirmed the assignment of
H-12.
The NOESY experiment was used to determine the relative configuration for compound
CD.8. The proton resonances at H 2.25 for H-4 and H 2.22 for H-8 showed correlations in
the NOESY spectrum with the H-10 (H 1.65) resonance, indicating that they were on the
same face of the molecule. The NOESY spectrum also showed a correlation between the
3H-18 (H 0.93) methyl group proton resonance and the 3H-19 (H 0.82) methyl group proton
resonance, which, in turn, showed a correlation with the 3H-20 (H 1.11) methyl group proton
resonance. All these groups (3H-18, 3H-19 and H-20) were placed on the same face of the
molecule. The NOESY spectrum showed a correlation between the H-12 (H 5.50) and
3H-20 (H 1.11) resonances, confirming they are on the same side. The NMR data of
62
compound CD.8 was compared with the literature data and found to be the known
crotonolide E [Table 2.15].93
The absolute configuration of compound CD.8 was determined using electronic circular
dichroism (ECD) studies. The experimental ECD curve showed positive Cotton effects at
292 nm (+ 2.56) and 191 nm (+ 14.82) and a negative Cotton effect at 221 nm (- 11.59). The
trend of the curve was similar to the reported crotonolide E95 indicating that compound CD.8
belonged to the ent-clerodane series. The specific optical rotation for compound CD.8 was
found to be + 84.5, similar to the reported specific optical rotation value of + 95.93
Previous research showed that CD.8 did not show cytotoxic nor antibacterial activity against
the human premyelocytic leukemia HL-60 and murine leukemia P-388 cell lines with IC50 ≥
10µM, and against four Gram-positive bacteria Staphylococcus epidermidis ATCC 12228,
Staphylococcus aureus ATCC 25923, Bacillus subtilis CMCC 63501 and Micrococcus luteus
ATCC 9341 with MIC > 150 µM.93
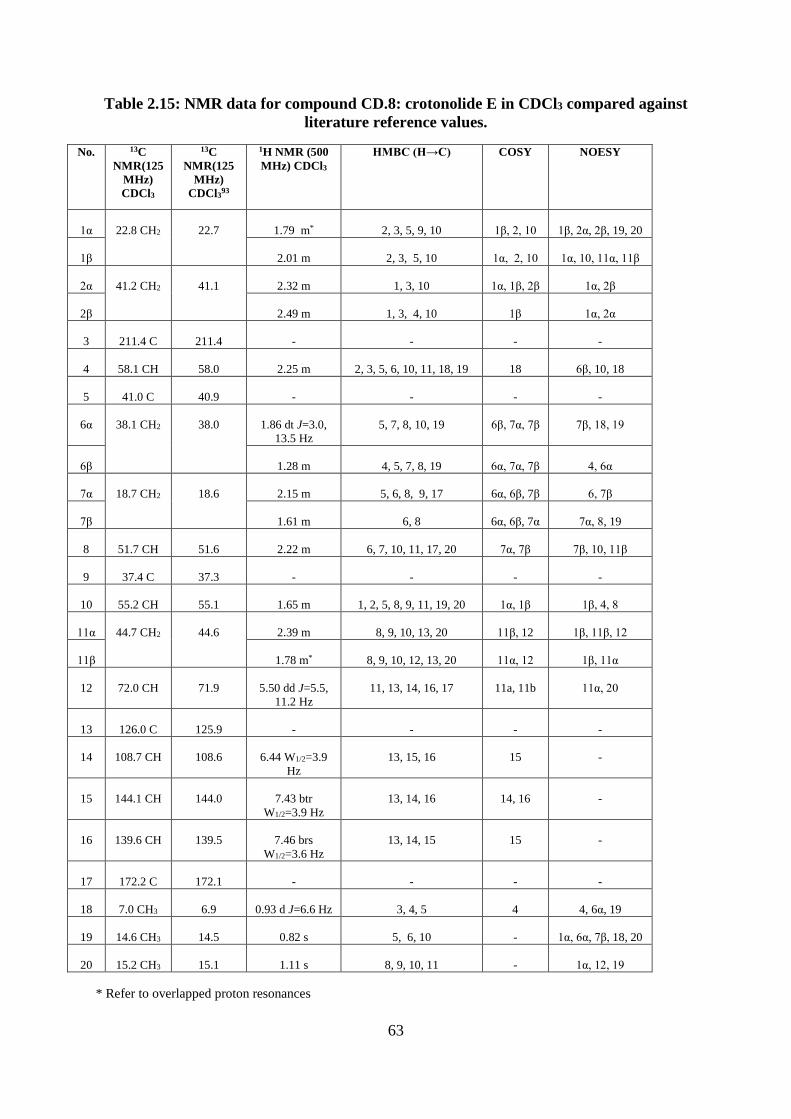
63
Table 2.15: NMR data for compound CD.8: crotonolide E in CDCl3 compared against
literature reference values.
No. 13C
NMR(125
MHz)
CDCl3
13C
NMR(125
MHz)
CDCl393
1H NMR (500
MHz) CDCl3
HMBC (H→C) COSY NOESY
1α 22.8 CH2
22.7 1.79 m* 2, 3, 5, 9, 10 1β, 2, 10 1β, 2α, 2β, 19, 20
1β 2.01 m 2, 3, 5, 10 1α, 2, 10 1α, 10, 11α, 11β
2α 41.2 CH2 41.1 2.32 m 1, 3, 10 1α, 1β, 2β 1α, 2β
2β 2.49 m 1, 3, 4, 10 1β 1α, 2α
3 211.4 C 211.4 - - - -
4 58.1 CH 58.0 2.25 m 2, 3, 5, 6, 10, 11, 18, 19 18 6β, 10, 18
5 41.0 C 40.9 - - - -
6α 38.1 CH2 38.0 1.86 dt J=3.0,
13.5 Hz
5, 7, 8, 10, 19 6β, 7α, 7β 7β, 18, 19
6β 1.28 m 4, 5, 7, 8, 19 6α, 7α, 7β 4, 6α
7α 18.7 CH2 18.6 2.15 m 5, 6, 8, 9, 17 6α, 6β, 7β 6, 7β
7β 1.61 m 6, 8 6α, 6β, 7α 7α, 8, 19
8 51.7 CH 51.6 2.22 m 6, 7, 10, 11, 17, 20 7α, 7β 7β, 10, 11β
9 37.4 C 37.3 - - - -
10 55.2 CH 55.1 1.65 m 1, 2, 5, 8, 9, 11, 19, 20 1α, 1β 1β, 4, 8
11α 44.7 CH2 44.6 2.39 m 8, 9, 10, 13, 20 11β, 12 1β, 11β, 12
11β 1.78 m* 8, 9, 10, 12, 13, 20 11α, 12 1β, 11α
12 72.0 CH 71.9 5.50 dd J=5.5,
11.2 Hz
11, 13, 14, 16, 17 11a, 11b 11α, 20
13 126.0 C 125.9 - - - -
14 108.7 CH 108.6 6.44 W1/2=3.9
Hz
13, 15, 16 15 -
15 144.1 CH 144.0 7.43 btr
W1/2=3.9 Hz
13, 14, 16 14, 16 -
16 139.6 CH 139.5 7.46 brs
W1/2=3.6 Hz
13, 14, 15 15 -
17 172.2 C 172.1 - - - -
18 7.0 CH3 6.9 0.93 d J=6.6 Hz 3, 4, 5 4 4, 6α, 19
19 14.6 CH3 14.5 0.82 s 5, 6, 10 - 1α, 6α, 7β, 18, 20
20 15.2 CH3 15.1 1.11 s 8, 9, 10, 11 - 1α, 12, 19
* Refer to overlapped proton resonances
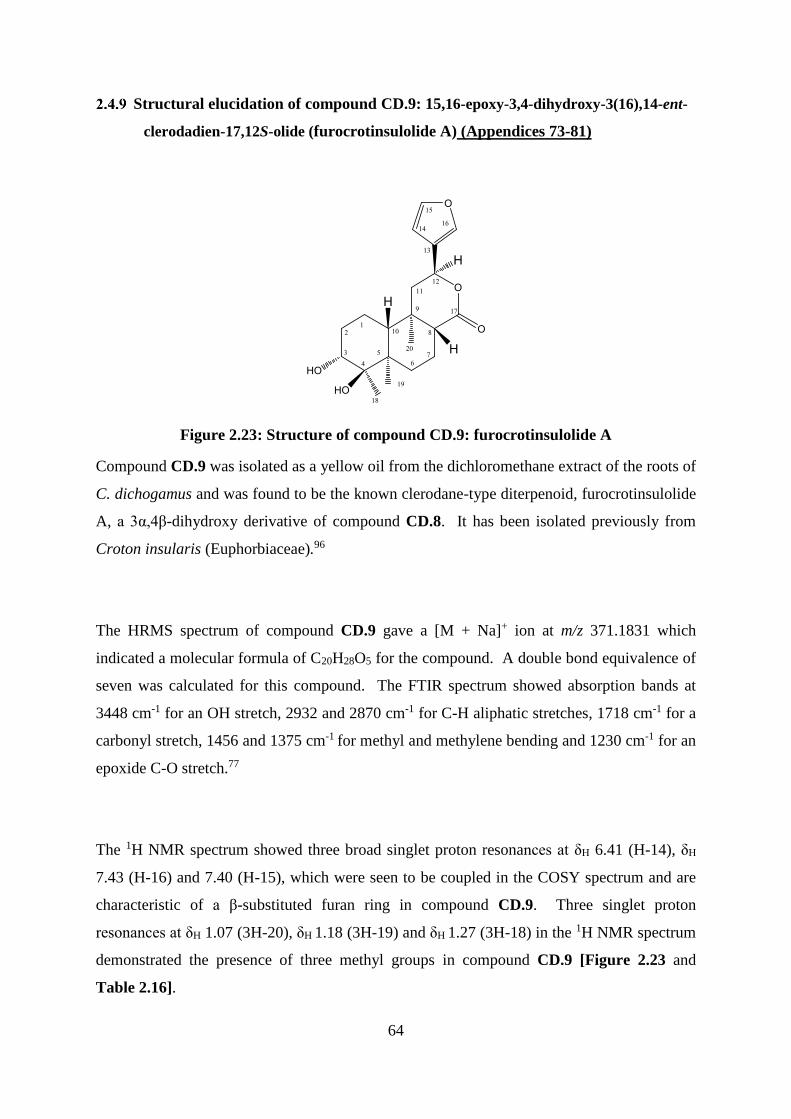
64
Structural elucidation of compound CD.9: 15,16-epoxy-3,4-dihydroxy-3(16),14-ent-
clerodadien-17,12S-olide (furocrotinsulolide A) (Appendices 73-81)
Figure 2.23: Structure of compound CD.9: furocrotinsulolide A
Compound CD.9 was isolated as a yellow oil from the dichloromethane extract of the roots of
C. dichogamus and was found to be the known clerodane-type diterpenoid, furocrotinsulolide
A, a 3α,4β-dihydroxy derivative of compound CD.8. It has been isolated previously from
Croton insularis (Euphorbiaceae).96
The HRMS spectrum of compound CD.9 gave a [M + Na]+ ion at m/z 371.1831 which
indicated a molecular formula of C20H28O5 for the compound. A double bond equivalence of
seven was calculated for this compound. The FTIR spectrum showed absorption bands at
3448 cm-1 for an OH stretch, 2932 and 2870 cm-1 for C-H aliphatic stretches, 1718 cm-1 for a
carbonyl stretch, 1456 and 1375 cm-1 for methyl and methylene bending and 1230 cm-1 for an
epoxide C-O stretch.77
The 1H NMR spectrum showed three broad singlet proton resonances at δH 6.41 (H-14), δH
7.43 (H-16) and 7.40 (H-15), which were seen to be coupled in the COSY spectrum and are
characteristic of a β-substituted furan ring in compound CD.9. Three singlet proton
resonances at δH 1.07 (3H-20), δH 1.18 (3H-19) and δH 1.27 (3H-18) in the 1H NMR spectrum
demonstrated the presence of three methyl groups in compound CD.9 [Figure 2.23 and
Table 2.16].
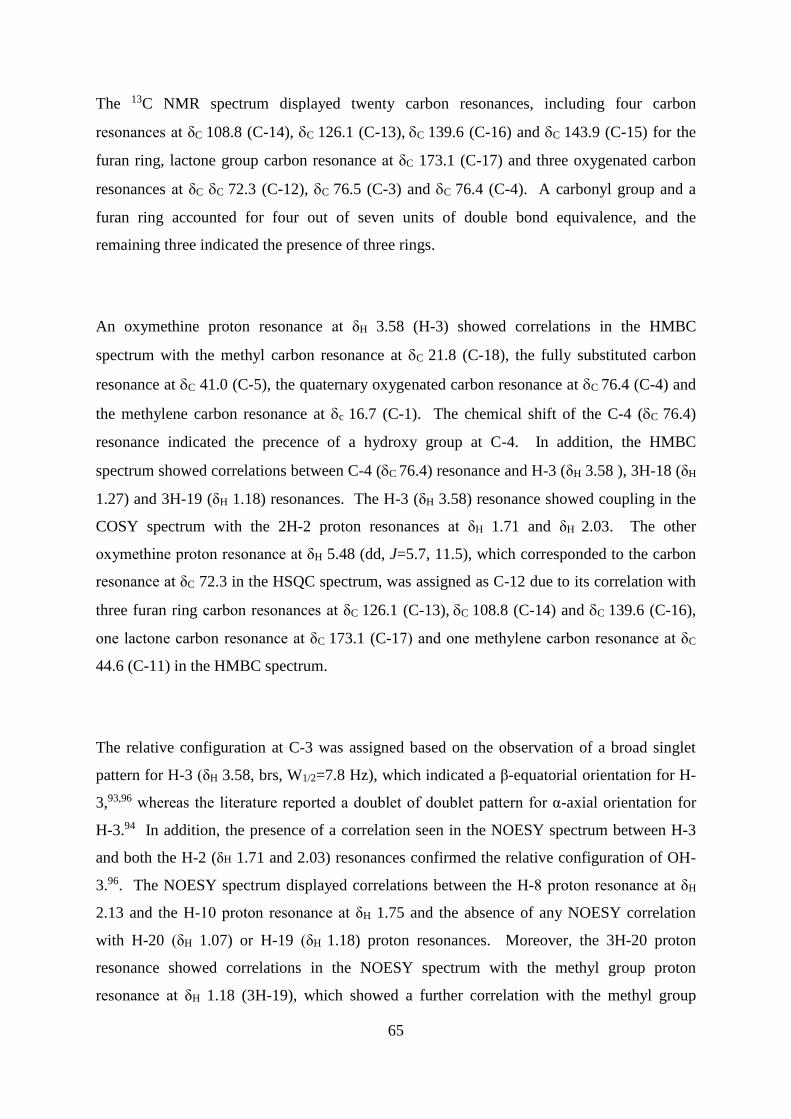
65
The 13C NMR spectrum displayed twenty carbon resonances, including four carbon
resonances at δC 108.8 (C-14), C 126.1 (C-13), C 139.6 (C-16) and C 143.9 (C-15) for the
furan ring, lactone group carbon resonance at δC 173.1 (C-17) and three oxygenated carbon
resonances at δC C 72.3 (C-12), C 76.5 (C-3) and C 76.4 (C-4). A carbonyl group and a
furan ring accounted for four out of seven units of double bond equivalence, and the
remaining three indicated the presence of three rings.
An oxymethine proton resonance at δH 3.58 (H-3) showed correlations in the HMBC
spectrum with the methyl carbon resonance at C 21.8 (C-18), the fully substituted carbon
resonance at C 41.0 (C-5), the quaternary oxygenated carbon resonance at C 76.4 (C-4) and
the methylene carbon resonance at c 16.7 (C-1). The chemical shift of the C-4 (C 76.4)
resonance indicated the precence of a hydroxy group at C-4. In addition, the HMBC
spectrum showed correlations between C-4 (C 76.4) resonance and H-3 (δH 3.58 ), 3H-18 (δH
1.27) and 3H-19 (δH 1.18) resonances. The H-3 (δH 3.58) resonance showed coupling in the
COSY spectrum with the 2H-2 proton resonances at δH 1.71 and δH 2.03. The other
oxymethine proton resonance at δH 5.48 (dd, J=5.7, 11.5), which corresponded to the carbon
resonance at δC 72.3 in the HSQC spectrum, was assigned as C-12 due to its correlation with
three furan ring carbon resonances at δC 126.1 (C-13), C 108.8 (C-14) and C 139.6 (C-16),
one lactone carbon resonance at δC 173.1 (C-17) and one methylene carbon resonance at δC
44.6 (C-11) in the HMBC spectrum.
The relative configuration at C-3 was assigned based on the observation of a broad singlet
pattern for H-3 (δH 3.58, brs, W1/2=7.8 Hz), which indicated a β-equatorial orientation for H-
3,93,96 whereas the literature reported a doublet of doublet pattern for α-axial orientation for
H-3.94 In addition, the presence of a correlation seen in the NOESY spectrum between H-3
and both the H-2 (δH 1.71 and 2.03) resonances confirmed the relative configuration of OH-
3.96. The NOESY spectrum displayed correlations between the H-8 proton resonance at δH
2.13 and the H-10 proton resonance at δH 1.75 and the absence of any NOESY correlation
with H-20 (δH 1.07) or H-19 (δH 1.18) proton resonances. Moreover, the 3H-20 proton
resonance showed correlations in the NOESY spectrum with the methyl group proton
resonance at δH 1.18 (3H-19), which showed a further correlation with the methyl group
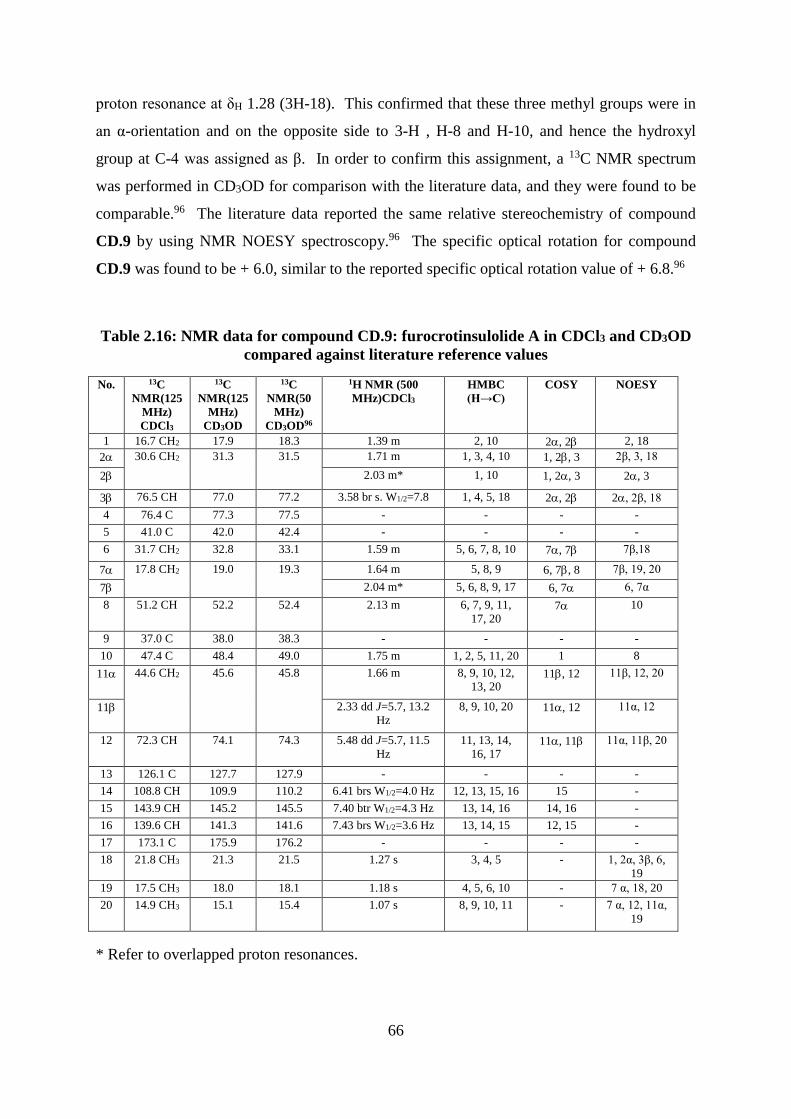
66
proton resonance at δH 1.28 (3H-18). This confirmed that these three methyl groups were in
an α-orientation and on the opposite side to 3-H , H-8 and H-10, and hence the hydroxyl
group at C-4 was assigned as β. In order to confirm this assignment, a 13C NMR spectrum
was performed in CD3OD for comparison with the literature data, and they were found to be
comparable.96 The literature data reported the same relative stereochemistry of compound
CD.9 by using NMR NOESY spectroscopy.96 The specific optical rotation for compound
CD.9 was found to be + 6.0, similar to the reported specific optical rotation value of + 6.8.96
Table 2.16: NMR data for compound CD.9: furocrotinsulolide A in CDCl3 and CD3OD
compared against literature reference values
No. 13C
NMR(125
MHz)
CDCl3
13C
NMR(125
MHz)
CD3OD
13C
NMR(50
MHz)
CD3OD96
1H NMR (500
MHz)CDCl3
HMBC
(H→C)
COSY NOESY
1 16.7 CH2 17.9 18.3 1.39 m 2, 10 2, 2 2, 18
2 30.6 CH2 31.3 31.5 1.71 m 1, 3, 4, 10 1, 2, 3 2β, 3, 18
2 2.03 m* 1, 10 1, 2, 3 2, 3
3 76.5 CH 77.0 77.2 3.58 br s. W1/2=7.8 1, 4, 5, 18 2, 2 2, 2β, 18
4 76.4 C 77.3 77.5 - - - -
5 41.0 C 42.0 42.4 - - - -
6 31.7 CH2 32.8 33.1 1.59 m 5, 6, 7, 8, 10 7, 7 7β,18
7 17.8 CH2 19.0 19.3 1.64 m 5, 8, 9 6, 7, 8 7β, 19, 20
7 2.04 m* 5, 6, 8, 9, 17 6, 7 6, 7α
8 51.2 CH 52.2 52.4 2.13 m 6, 7, 9, 11,
17, 20 7 10
9 37.0 C 38.0 38.3 - - - -
10 47.4 C 48.4 49.0 1.75 m 1, 2, 5, 11, 20 1 8
11 44.6 CH2 45.6 45.8 1.66 m 8, 9, 10, 12,
13, 20 11, 12 11β, 12, 20
11 2.33 dd J=5.7, 13.2
Hz
8, 9, 10, 20 11, 12 11α, 12
12 72.3 CH 74.1 74.3 5.48 dd J=5.7, 11.5
Hz
11, 13, 14,
16, 17 11, 11 11α, 11β, 20
13 126.1 C 127.7 127.9 - - - -
14 108.8 CH 109.9 110.2 6.41 brs W1/2=4.0 Hz 12, 13, 15, 16 15 -
15 143.9 CH 145.2 145.5 7.40 btr W1/2=4.3 Hz 13, 14, 16 14, 16 -
16 139.6 CH 141.3 141.6 7.43 brs W1/2=3.6 Hz 13, 14, 15 12, 15 -
17 173.1 C 175.9 176.2 - - - -
18 21.8 CH3 21.3 21.5 1.27 s 3, 4, 5 - 1, 2α, 3β, 6,
19
19 17.5 CH3 18.0 18.1 1.18 s 4, 5, 6, 10 - 7 α, 18, 20
20 14.9 CH3 15.1 15.4 1.07 s 8, 9, 10, 11 - 7 α, 12, 11α,
19
* Refer to overlapped proton resonances.
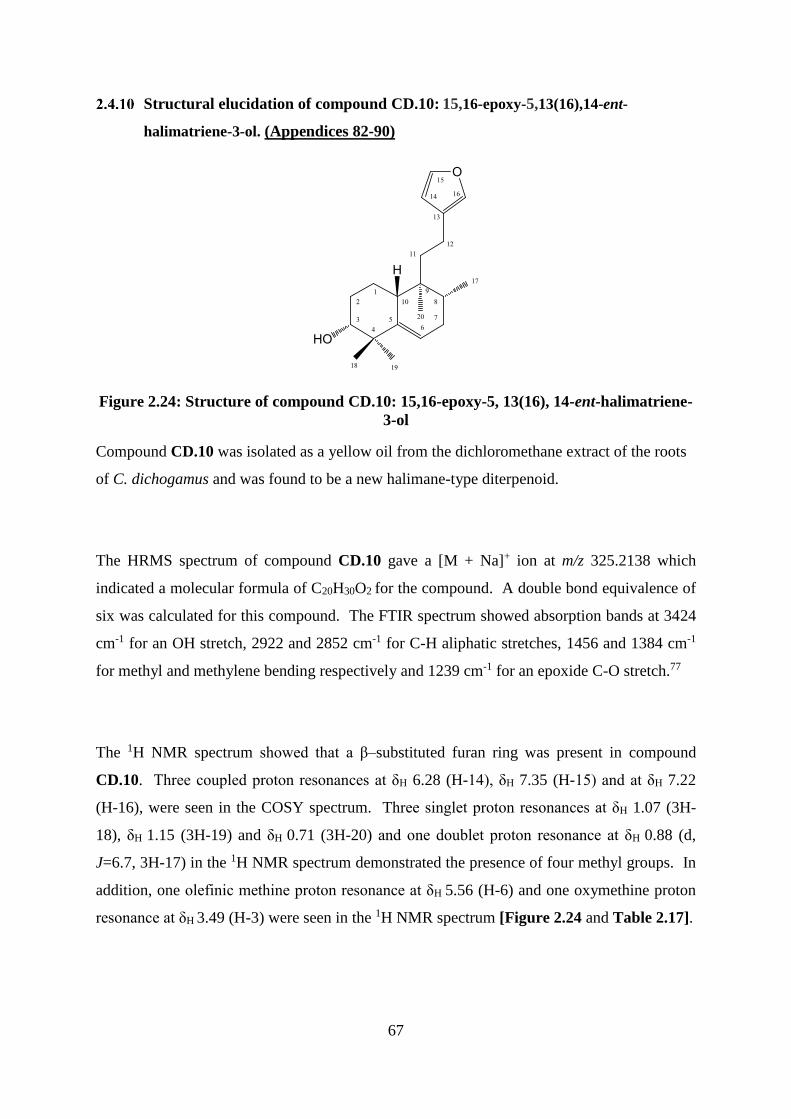
67
Structural elucidation of compound CD.10: 15,16-epoxy-5,13(16),14-ent-
halimatriene-3-ol. (Appendices 82-90)
Figure 2.24: Structure of compound CD.10: 15,16-epoxy-5, 13(16), 14-ent-halimatriene-
3-ol
Compound CD.10 was isolated as a yellow oil from the dichloromethane extract of the roots
of C. dichogamus and was found to be a new halimane-type diterpenoid.
The HRMS spectrum of compound CD.10 gave a [M + Na]+ ion at m/z 325.2138 which
indicated a molecular formula of C20H30O2 for the compound. A double bond equivalence of
six was calculated for this compound. The FTIR spectrum showed absorption bands at 3424
cm-1 for an OH stretch, 2922 and 2852 cm-1 for C-H aliphatic stretches, 1456 and 1384 cm-1
for methyl and methylene bending respectively and 1239 cm-1 for an epoxide C-O stretch.77
The 1H NMR spectrum showed that a β–substituted furan ring was present in compound
CD.10. Three coupled proton resonances at δH 6.28 (H-14), δH 7.35 (H-15) and at δH 7.22
(H-16), were seen in the COSY spectrum. Three singlet proton resonances at δH 1.07 (3H-
18), δH 1.15 (3H-19) and δH 0.71 (3H-20) and one doublet proton resonance at δH 0.88 (d,
J=6.7, 3H-17) in the 1H NMR spectrum demonstrated the presence of four methyl groups. In
addition, one olefinic methine proton resonance at δH 5.56 (H-6) and one oxymethine proton
resonance at δH 3.49 (H-3) were seen in the 1H NMR spectrum [Figure 2.24 and Table 2.17].
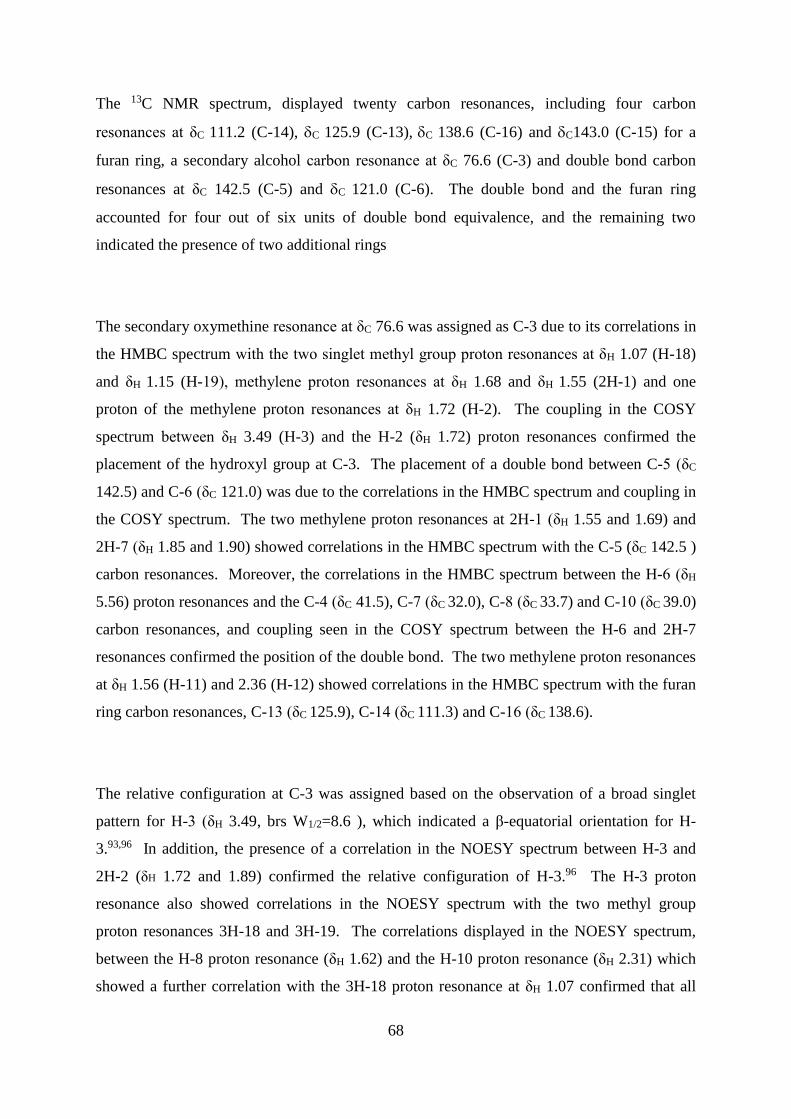
68
The 13C NMR spectrum, displayed twenty carbon resonances, including four carbon
resonances at δC 111.2 (C-14), C 125.9 (C-13), C 138.6 (C-16) and C143.0 (C-15) for a
furan ring, a secondary alcohol carbon resonance at δC 76.6 (C-3) and double bond carbon
resonances at δC 142.5 (C-5) and C 121.0 (C-6). The double bond and the furan ring
accounted for four out of six units of double bond equivalence, and the remaining two
indicated the presence of two additional rings
The secondary oxymethine resonance at δC 76.6 was assigned as C-3 due to its correlations in
the HMBC spectrum with the two singlet methyl group proton resonances at δH 1.07 (H-18)
and δH 1.15 (H-19), methylene proton resonances at δH 1.68 and δH 1.55 (2H-1) and one
proton of the methylene proton resonances at δH 1.72 (H-2). The coupling in the COSY
spectrum between δH 3.49 (H-3) and the H-2 (δH 1.72) proton resonances confirmed the
placement of the hydroxyl group at C-3. The placement of a double bond between C-5 (δC
142.5) and C-6 (δC 121.0) was due to the correlations in the HMBC spectrum and coupling in
the COSY spectrum. The two methylene proton resonances at 2H-1 (δH 1.55 and 1.69) and
2H-7 (δH 1.85 and 1.90) showed correlations in the HMBC spectrum with the C-5 (δC 142.5 )
carbon resonances. Moreover, the correlations in the HMBC spectrum between the H-6 (δH
5.56) proton resonances and the C-4 (δC 41.5), C-7 (δC 32.0), C-8 (δC 33.7) and C-10 (δC 39.0)
carbon resonances, and coupling seen in the COSY spectrum between the H-6 and 2H-7
resonances confirmed the position of the double bond. The two methylene proton resonances
at δH 1.56 (H-11) and 2.36 (H-12) showed correlations in the HMBC spectrum with the furan
ring carbon resonances, C-13 (δC 125.9), C-14 (δC 111.3) and C-16 (δC 138.6).
The relative configuration at C-3 was assigned based on the observation of a broad singlet
pattern for H-3 (δH 3.49, brs W1/2=8.6 ), which indicated a β-equatorial orientation for H-
3.93,96 In addition, the presence of a correlation in the NOESY spectrum between H-3 and
2H-2 (δH 1.72 and 1.89) confirmed the relative configuration of H-3.96 The H-3 proton
resonance also showed correlations in the NOESY spectrum with the two methyl group
proton resonances 3H-18 and 3H-19. The correlations displayed in the NOESY spectrum,
between the H-8 proton resonance (δH 1.62) and the H-10 proton resonance (δH 2.31) which
showed a further correlation with the 3H-18 proton resonance at δH 1.07 confirmed that all
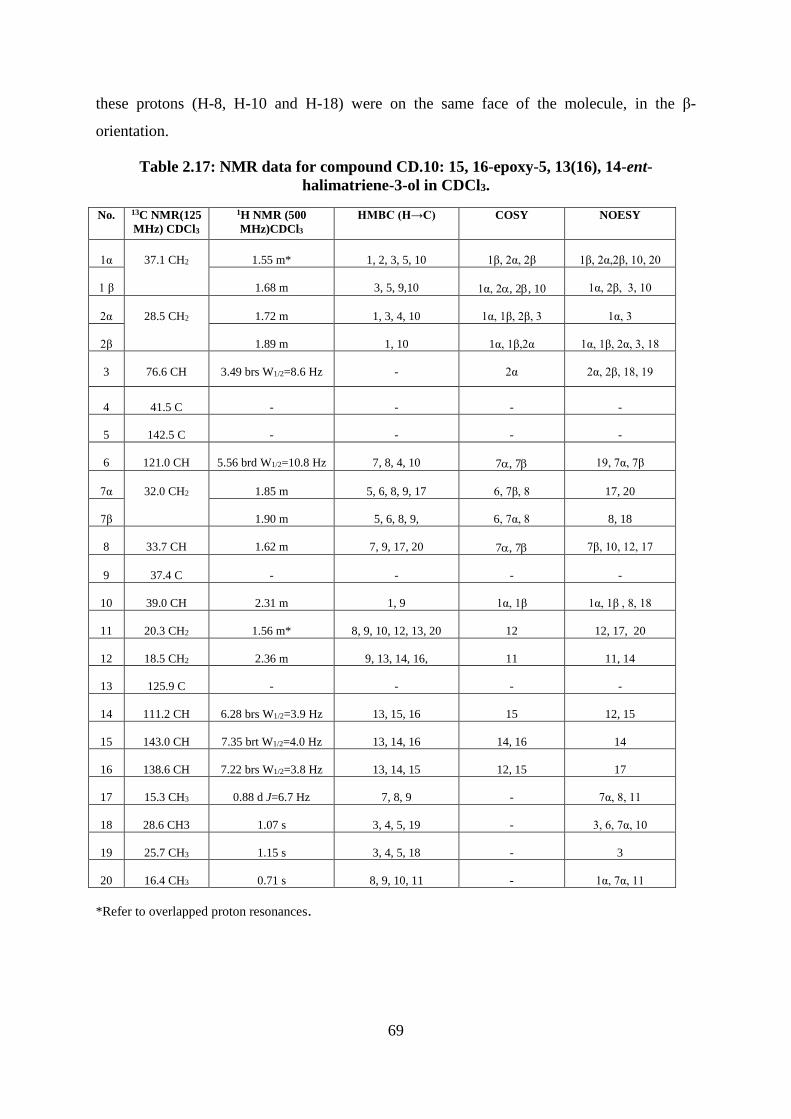
69
these protons (H-8, H-10 and H-18) were on the same face of the molecule, in the β-
orientation.
Table 2.17: NMR data for compound CD.10: 15, 16-epoxy-5, 13(16), 14-ent-
halimatriene-3-ol in CDCl3.
No. 13C NMR(125
MHz) CDCl3
1H NMR (500
MHz)CDCl3
HMBC (H→C) COSY NOESY
1α 37.1 CH2 1.55 m* 1, 2, 3, 5, 10 1β, 2α, 2β 1β, 2α,2β, 10, 20
1 β 1.68 m 3, 5, 9,10 1α, 2, 2, 10 1α, 2β, 3, 10
2α 28.5 CH2 1.72 m 1, 3, 4, 10 1α, 1β, 2β, 3 1α, 3
2β 1.89 m 1, 10 1α, 1β,2α 1α, 1β, 2α, 3, 18
3 76.6 CH 3.49 brs W1/2=8.6 Hz - 2α 2α, 2β, 18, 19
4 41.5 C - - - -
5 142.5 C - - - -
6 121.0 CH 5.56 brd W1/2=10.8 Hz 7, 8, 4, 10 7, 7 19, 7α, 7β
7α 32.0 CH2 1.85 m 5, 6, 8, 9, 17 6, 7β, 8 17, 20
7β 1.90 m 5, 6, 8, 9, 6, 7α, 8 8, 18
8 33.7 CH 1.62 m 7, 9, 17, 20 7, 7 7β, 10, 12, 17
9 37.4 C - - - -
10 39.0 CH 2.31 m 1, 9 1α, 1β 1α, 1β , 8, 18
11 20.3 CH2 1.56 m* 8, 9, 10, 12, 13, 20 12 12, 17, 20
12 18.5 CH2 2.36 m 9, 13, 14, 16, 11 11, 14
13 125.9 C - - - -
14 111.2 CH 6.28 brs W1/2=3.9 Hz 13, 15, 16 15 12, 15
15 143.0 CH 7.35 brt W1/2=4.0 Hz 13, 14, 16 14, 16 14
16 138.6 CH 7.22 brs W1/2=3.8 Hz 13, 14, 15 12, 15 17
17 15.3 CH3 0.88 d J=6.7 Hz 7, 8, 9 - 7α, 8, 11
18 28.6 CH3 1.07 s 3, 4, 5, 19 - 3, 6, 7α, 10
19 25.7 CH3 1.15 s 3, 4, 5, 18 - 3
20 16.4 CH3 0.71 s 8, 9, 10, 11 - 1α, 7α, 11
*Refer to overlapped proton resonances.
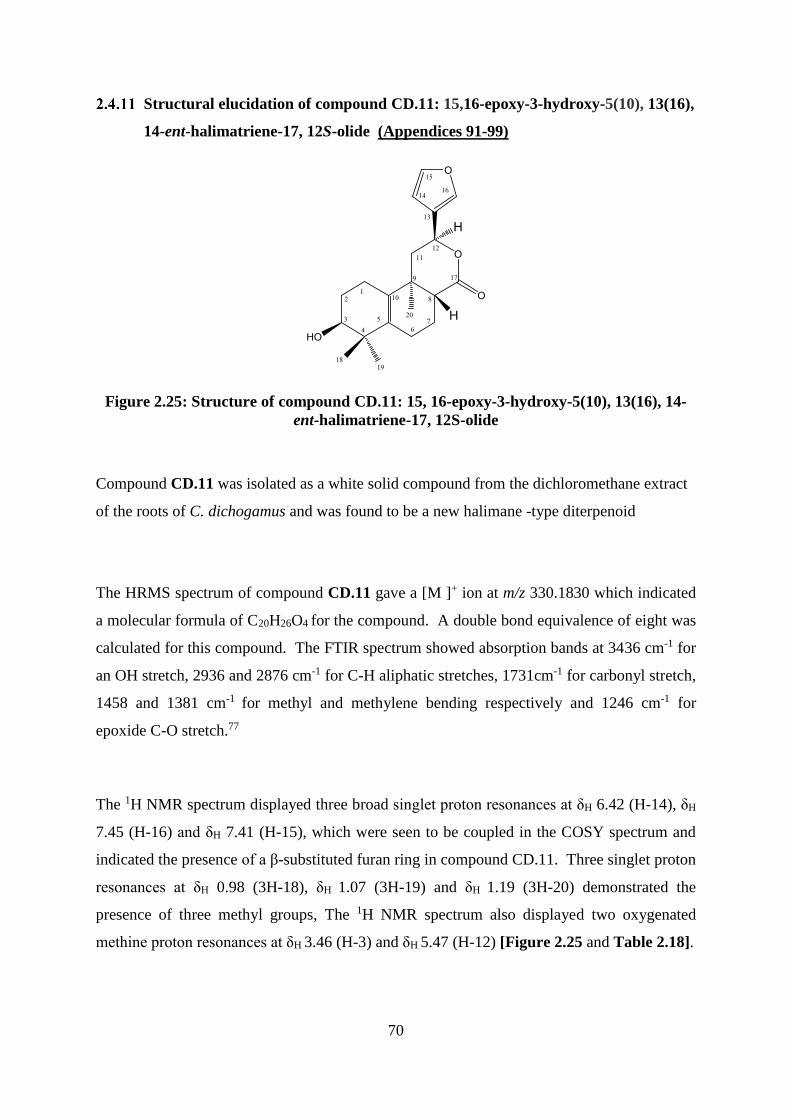
70
Structural elucidation of compound CD.11: 15,16-epoxy-3-hydroxy-5(10), 13(16),
14-ent-halimatriene-17, 12S-olide (Appendices 91-99)
Figure 2.25: Structure of compound CD.11: 15, 16-epoxy-3-hydroxy-5(10), 13(16), 14-
ent-halimatriene-17, 12S-olide
Compound CD.11 was isolated as a white solid compound from the dichloromethane extract
of the roots of C. dichogamus and was found to be a new halimane -type diterpenoid
The HRMS spectrum of compound CD.11 gave a [M ]+ ion at m/z 330.1830 which indicated
a molecular formula of C20H26O4 for the compound. A double bond equivalence of eight was
calculated for this compound. The FTIR spectrum showed absorption bands at 3436 cm-1 for
an OH stretch, 2936 and 2876 cm-1 for C-H aliphatic stretches, 1731cm-1 for carbonyl stretch,
1458 and 1381 cm-1 for methyl and methylene bending respectively and 1246 cm-1 for
epoxide C-O stretch.77
The 1H NMR spectrum displayed three broad singlet proton resonances at δH 6.42 (H-14), δH
7.45 (H-16) and δH 7.41 (H-15), which were seen to be coupled in the COSY spectrum and
indicated the presence of a β-substituted furan ring in compound CD.11. Three singlet proton
resonances at δH 0.98 (3H-18), δH 1.07 (3H-19) and δH 1.19 (3H-20) demonstrated the
presence of three methyl groups, The 1H NMR spectrum also displayed two oxygenated
methine proton resonances at δH 3.46 (H-3) and δH 5.47 (H-12) [Figure 2.25 and Table 2.18].
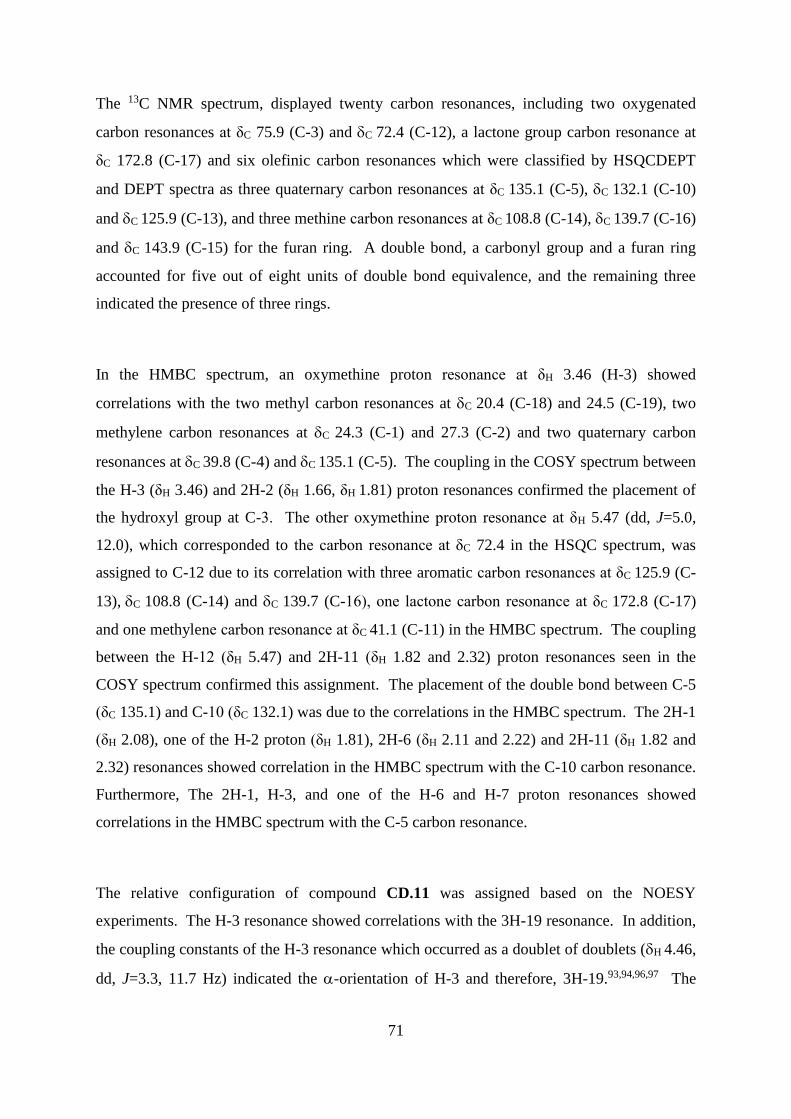
71
The 13C NMR spectrum, displayed twenty carbon resonances, including two oxygenated
carbon resonances at δC 75.9 (C-3) and C 72.4 (C-12), a lactone group carbon resonance at
δC 172.8 (C-17) and six olefinic carbon resonances which were classified by HSQCDEPT
and DEPT spectra as three quaternary carbon resonances at δC 135.1 (C-5), C 132.1 (C-10)
and C 125.9 (C-13), and three methine carbon resonances at δC 108.8 (C-14), C 139.7 (C-16)
and C 143.9 (C-15) for the furan ring. A double bond, a carbonyl group and a furan ring
accounted for five out of eight units of double bond equivalence, and the remaining three
indicated the presence of three rings.
In the HMBC spectrum, an oxymethine proton resonance at δH 3.46 (H-3) showed
correlations with the two methyl carbon resonances at C 20.4 (C-18) and 24.5 (C-19), two
methylene carbon resonances at C 24.3 (C-1) and 27.3 (C-2) and two quaternary carbon
resonances at C 39.8 (C-4) and C 135.1 (C-5). The coupling in the COSY spectrum between
the H-3 (δH 3.46) and 2H-2 (δH 1.66, δH 1.81) proton resonances confirmed the placement of
the hydroxyl group at C-3. The other oxymethine proton resonance at δH 5.47 (dd, J=5.0,
12.0), which corresponded to the carbon resonance at δC 72.4 in the HSQC spectrum, was
assigned to C-12 due to its correlation with three aromatic carbon resonances at δC 125.9 (C-
13), C 108.8 (C-14) and C 139.7 (C-16), one lactone carbon resonance at δC 172.8 (C-17)
and one methylene carbon resonance at δC 41.1 (C-11) in the HMBC spectrum. The coupling
between the H-12 (δH 5.47) and 2H-11 (δH 1.82 and 2.32) proton resonances seen in the
COSY spectrum confirmed this assignment. The placement of the double bond between C-5
(δC 135.1) and C-10 (δC 132.1) was due to the correlations in the HMBC spectrum. The 2H-1
(δH 2.08), one of the H-2 proton (δH 1.81), 2H-6 (δH 2.11 and 2.22) and 2H-11 (δH 1.82 and
2.32) resonances showed correlation in the HMBC spectrum with the C-10 carbon resonance.
Furthermore, The 2H-1, H-3, and one of the H-6 and H-7 proton resonances showed
correlations in the HMBC spectrum with the C-5 carbon resonance.
The relative configuration of compound CD.11 was assigned based on the NOESY
experiments. The H-3 resonance showed correlations with the 3H-19 resonance. In addition,
the coupling constants of the H-3 resonance which occurred as a doublet of doublets (H 4.46,
dd, J=3.3, 11.7 Hz) indicated the -orientation of H-3 and therefore, 3H-19.93,94,96,97 The
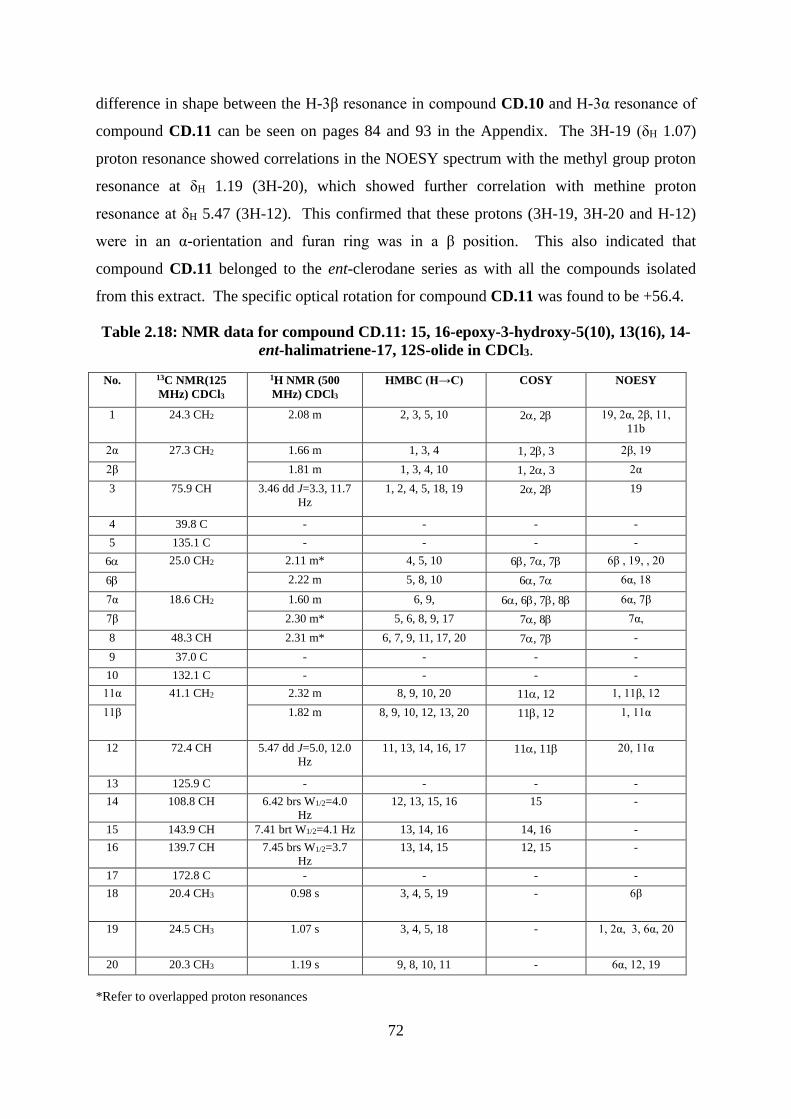
72
difference in shape between the H-3β resonance in compound CD.10 and H-3α resonance of
compound CD.11 can be seen on pages 84 and 93 in the Appendix. The 3H-19 (δH 1.07)
proton resonance showed correlations in the NOESY spectrum with the methyl group proton
resonance at δH 1.19 (3H-20), which showed further correlation with methine proton
resonance at δH 5.47 (3H-12). This confirmed that these protons (3H-19, 3H-20 and H-12)
were in an α-orientation and furan ring was in a β position. This also indicated that
compound CD.11 belonged to the ent-clerodane series as with all the compounds isolated
from this extract. The specific optical rotation for compound CD.11 was found to be +56.4.
Table 2.18: NMR data for compound CD.11: 15, 16-epoxy-3-hydroxy-5(10), 13(16), 14-
ent-halimatriene-17, 12S-olide in CDCl3.
No. 13C NMR(125
MHz) CDCl3
1H NMR (500
MHz) CDCl3
HMBC (H→C) COSY NOESY
1 24.3 CH2 2.08 m 2, 3, 5, 10 2, 2 19, 2α, 2β, 11,
11b
2α 27.3 CH2 1.66 m 1, 3, 4 1, 2, 3 2β, 19
2β 1.81 m 1, 3, 4, 10 1, 2, 3 2α
3 75.9 CH 3.46 dd J=3.3, 11.7
Hz
1, 2, 4, 5, 18, 19 2, 2 19
4 39.8 C - - - -
5 135.1 C - - - -
6 25.0 CH2 2.11 m* 4, 5, 10 6, 7, 7 6β , 19, , 20
6 2.22 m 5, 8, 10 6, 7 6α, 18
7α 18.6 CH2 1.60 m 6, 9, 6, 6, 7, 8 6α, 7β
7β 2.30 m* 5, 6, 8, 9, 17 7, 8 7α,
8 48.3 CH 2.31 m* 6, 7, 9, 11, 17, 20 7, 7 -
9 37.0 C - - - -
10 132.1 C - - - -
11α 41.1 CH2 2.32 m 8, 9, 10, 20 11, 12 1, 11β, 12
11β 1.82 m 8, 9, 10, 12, 13, 20 11, 12 1, 11α
12 72.4 CH 5.47 dd J=5.0, 12.0
Hz
11, 13, 14, 16, 17 11, 11 20, 11α
13 125.9 C - - - -
14 108.8 CH 6.42 brs W1/2=4.0
Hz
12, 13, 15, 16 15 -
15 143.9 CH 7.41 brt W1/2=4.1 Hz 13, 14, 16 14, 16 -
16 139.7 CH 7.45 brs W1/2=3.7
Hz
13, 14, 15 12, 15 -
17 172.8 C - - - -
18 20.4 CH3 0.98 s 3, 4, 5, 19 - 6β
19 24.5 CH3 1.07 s 3, 4, 5, 18 - 1, 2α, 3, 6α, 20
20 20.3 CH3 1.19 s 9, 8, 10, 11 - 6α, 12, 19
*Refer to overlapped proton resonances
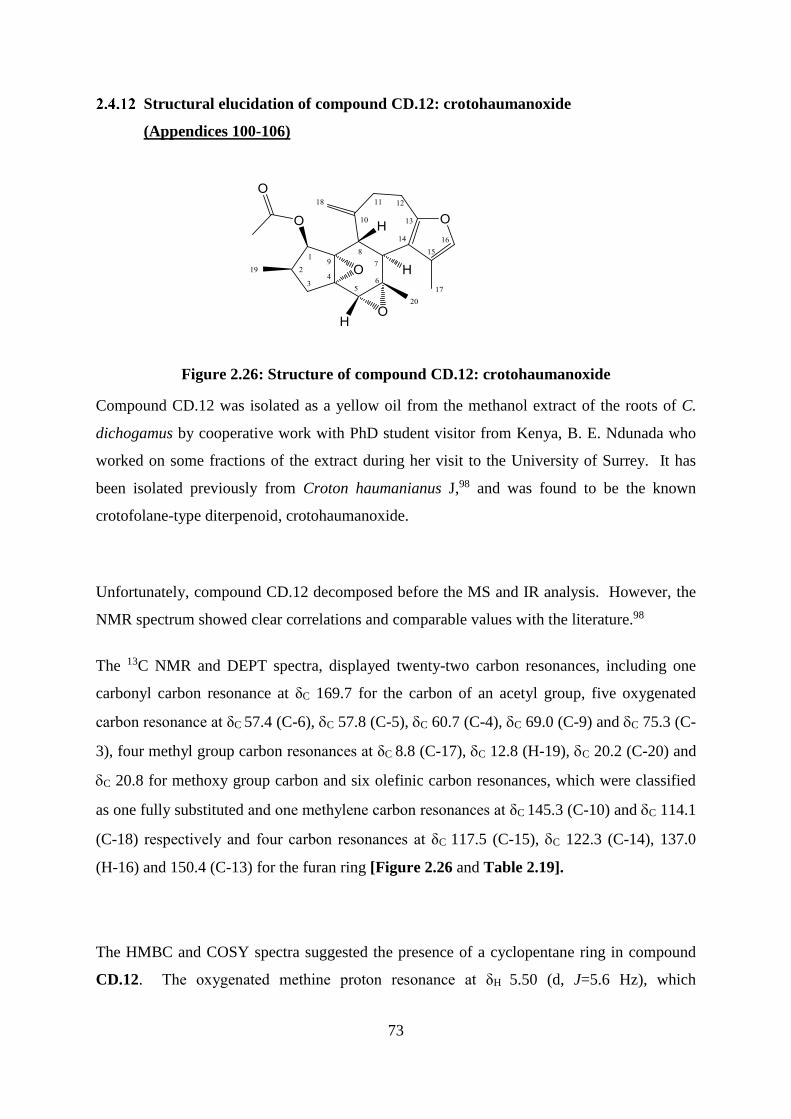
73
Structural elucidation of compound CD.12: crotohaumanoxide
(Appendices 100-106)
Figure 2.26: Structure of compound CD.12: crotohaumanoxide
Compound CD.12 was isolated as a yellow oil from the methanol extract of the roots of C.
dichogamus by cooperative work with PhD student visitor from Kenya, B. E. Ndunada who
worked on some fractions of the extract during her visit to the University of Surrey. It has
been isolated previously from Croton haumanianus J,98 and was found to be the known
crotofolane-type diterpenoid, crotohaumanoxide.
Unfortunately, compound CD.12 decomposed before the MS and IR analysis. However, the
NMR spectrum showed clear correlations and comparable values with the literature.98
The 13C NMR and DEPT spectra, displayed twenty-two carbon resonances, including one
carbonyl carbon resonance at δC 169.7 for the carbon of an acetyl group, five oxygenated
carbon resonance at δC 57.4 (C-6), C 57.8 (C-5), C 60.7 (C-4), C 69.0 (C-9) and C 75.3 (C-
3), four methyl group carbon resonances at δC 8.8 (C-17), C 12.8 (H-19), C 20.2 (C-20) and
C 20.8 for methoxy group carbon and six olefinic carbon resonances, which were classified
as one fully substituted and one methylene carbon resonances at δC 145.3 (C-10) and C 114.1
(C-18) respectively and four carbon resonances at δC 117.5 (C-15), C 122.3 (C-14), 137.0
(H-16) and 150.4 (C-13) for the furan ring [Figure 2.26 and Table 2.19].
The HMBC and COSY spectra suggested the presence of a cyclopentane ring in compound
CD.12. The oxygenated methine proton resonance at δH 5.50 (d, J=5.6 Hz), which
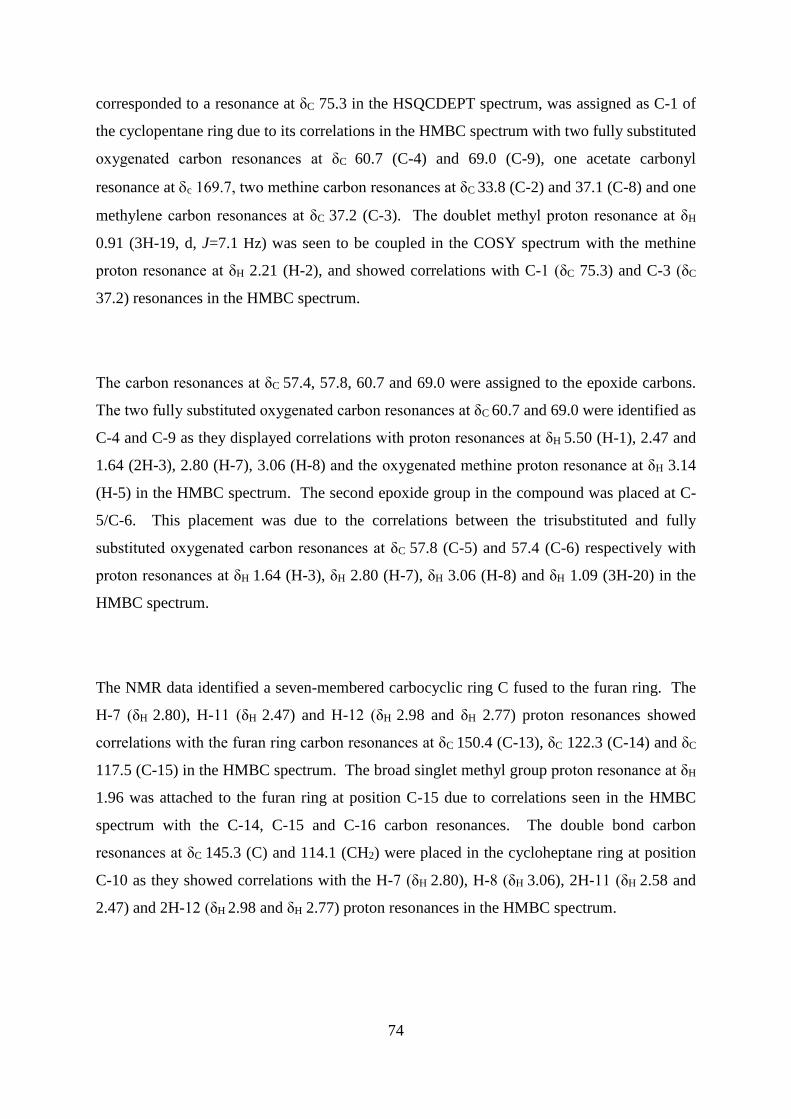
74
corresponded to a resonance at δC 75.3 in the HSQCDEPT spectrum, was assigned as C-1 of
the cyclopentane ring due to its correlations in the HMBC spectrum with two fully substituted
oxygenated carbon resonances at δC 60.7 (C-4) and 69.0 (C-9), one acetate carbonyl
resonance at c 169.7, two methine carbon resonances at δC 33.8 (C-2) and 37.1 (C-8) and one
methylene carbon resonances at δC 37.2 (C-3). The doublet methyl proton resonance at δH
0.91 (3H-19, d, J=7.1 Hz) was seen to be coupled in the COSY spectrum with the methine
proton resonance at δH 2.21 (H-2), and showed correlations with C-1 (δC 75.3) and C-3 (δC
37.2) resonances in the HMBC spectrum.
The carbon resonances at δC 57.4, 57.8, 60.7 and 69.0 were assigned to the epoxide carbons.
The two fully substituted oxygenated carbon resonances at δC 60.7 and 69.0 were identified as
C-4 and C-9 as they displayed correlations with proton resonances at δH 5.50 (H-1), 2.47 and
1.64 (2H-3), 2.80 (H-7), 3.06 (H-8) and the oxygenated methine proton resonance at δH 3.14
(H-5) in the HMBC spectrum. The second epoxide group in the compound was placed at C-
5/C-6. This placement was due to the correlations between the trisubstituted and fully
substituted oxygenated carbon resonances at δC 57.8 (C-5) and 57.4 (C-6) respectively with
proton resonances at δH 1.64 (H-3), δH 2.80 (H-7), δH 3.06 (H-8) and δH 1.09 (3H-20) in the
HMBC spectrum.
The NMR data identified a seven-membered carbocyclic ring C fused to the furan ring. The
H-7 (δH 2.80), H-11 (δH 2.47) and H-12 (δH 2.98 and δH 2.77) proton resonances showed
correlations with the furan ring carbon resonances at δC 150.4 (C-13), δC 122.3 (C-14) and δC
117.5 (C-15) in the HMBC spectrum. The broad singlet methyl group proton resonance at δH
1.96 was attached to the furan ring at position C-15 due to correlations seen in the HMBC
spectrum with the C-14, C-15 and C-16 carbon resonances. The double bond carbon
resonances at δC 145.3 (C) and 114.1 (CH2) were placed in the cycloheptane ring at position
C-10 as they showed correlations with the H-7 (δH 2.80), H-8 (δH 3.06), 2H-11 (δH 2.58 and
2.47) and 2H-12 (δH 2.98 and δH 2.77) proton resonances in the HMBC spectrum.
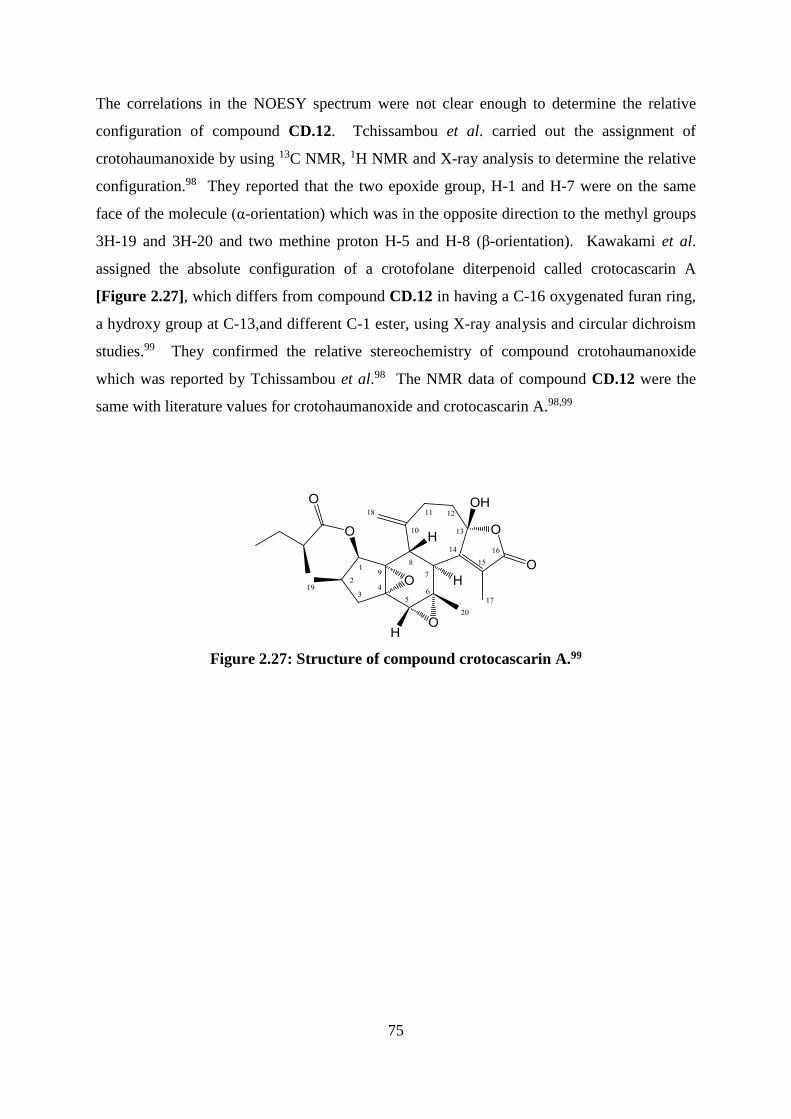
75
The correlations in the NOESY spectrum were not clear enough to determine the relative
configuration of compound CD.12. Tchissambou et al. carried out the assignment of
crotohaumanoxide by using 13C NMR, 1H NMR and X-ray analysis to determine the relative
configuration.98 They reported that the two epoxide group, H-1 and H-7 were on the same
face of the molecule (α-orientation) which was in the opposite direction to the methyl groups
3H-19 and 3H-20 and two methine proton H-5 and H-8 (β-orientation). Kawakami et al.
assigned the absolute configuration of a crotofolane diterpenoid called crotocascarin A
[Figure 2.27], which differs from compound CD.12 in having a C-16 oxygenated furan ring,
a hydroxy group at C-13,and different C-1 ester, using X-ray analysis and circular dichroism
studies.99 They confirmed the relative stereochemistry of compound crotohaumanoxide
which was reported by Tchissambou et al.98 The NMR data of compound CD.12 were the
same with literature values for crotohaumanoxide and crotocascarin A.98,99
Figure 2.27: Structure of compound crotocascarin A.99
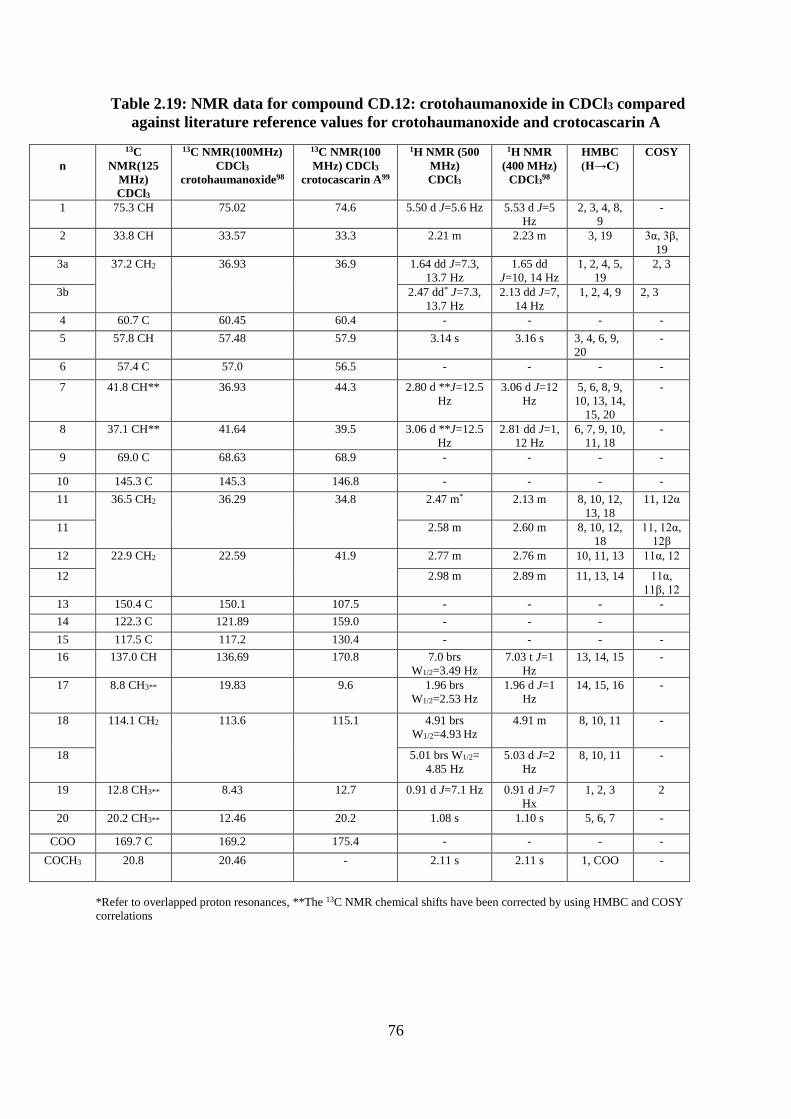
76
Table 2.19: NMR data for compound CD.12: crotohaumanoxide in CDCl3 compared
against literature reference values for crotohaumanoxide and crotocascarin A
n
13C
NMR(125
MHz)
CDCl3
13C NMR(100MHz)
CDCl3 crotohaumanoxide98
13C NMR(100
MHz) CDCl3
crotocascarin A99
1H NMR (500
MHz)
CDCl3
1H NMR
(400 MHz)
CDCl398
HMBC
(H→C)
COSY
1 75.3 CH 75.02 74.6 5.50 d J=5.6 Hz 5.53 d J=5
Hz
2, 3, 4, 8,
9
-
2 33.8 CH 33.57 33.3 2.21 m 2.23 m 3, 19 3α, 3β,
19
3a 37.2 CH2 36.93 36.9 1.64 dd J=7.3,
13.7 Hz
1.65 dd
J=10, 14 Hz
1, 2, 4, 5,
19
2, 3
3b 2.47 dd* J=7.3,
13.7 Hz
2.13 dd J=7,
14 Hz
1, 2, 4, 9 2, 3
4 60.7 C 60.45 60.4 - - - -
5 57.8 CH 57.48 57.9 3.14 s 3.16 s 3, 4, 6, 9,
20
-
6 57.4 C 57.0 56.5 - - - -
7 41.8 CH** 36.93 44.3 2.80 d **J=12.5
Hz
3.06 d J=12
Hz
5, 6, 8, 9,
10, 13, 14,
15, 20
-
8 37.1 CH** 41.64 39.5 3.06 d **J=12.5
Hz
2.81 dd J=1,
12 Hz
6, 7, 9, 10,
11, 18
-
9 69.0 C 68.63 68.9 - - - -
10 145.3 C 145.3 146.8 - - - -
11 36.5 CH2 36.29 34.8 2.47 m* 2.13 m 8, 10, 12,
13, 18
11, 12α
11 2.58 m 2.60 m 8, 10, 12,
18
11, 12α,
12β
12 22.9 CH2 22.59 41.9 2.77 m 2.76 m 10, 11, 13 11α, 12
12 2.98 m 2.89 m 11, 13, 14 11α,
11β, 12
13 150.4 C 150.1 107.5 - - - -
14 122.3 C 121.89 159.0 - - -
15 117.5 C 117.2 130.4 - - - -
16 137.0 CH 136.69 170.8 7.0 brs
W1/2=3.49 Hz
7.03 t J=1
Hz
13, 14, 15 -
17 8.8 CH3** 19.83 9.6 1.96 brs
W1/2=2.53 Hz
1.96 d J=1
Hz
14, 15, 16 -
18 114.1 CH2 113.6 115.1 4.91 brs
W1/2=4.93 Hz
4.91 m 8, 10, 11 -
18 5.01 brs W1/2=
4.85 Hz
5.03 d J=2
Hz
8, 10, 11 -
19 12.8 CH3** 8.43 12.7 0.91 d J=7.1 Hz 0.91 d J=7
Hx
1, 2, 3 2
20 20.2 CH3** 12.46 20.2 1.08 s 1.10 s 5, 6, 7 -
COO 169.7 C 169.2 175.4 - - - -
COCH3 20.8 20.46 - 2.11 s 2.11 s 1, COO -
*Refer to overlapped proton resonances, **The 13C NMR chemical shifts have been corrected by using HMBC and COSY
correlations
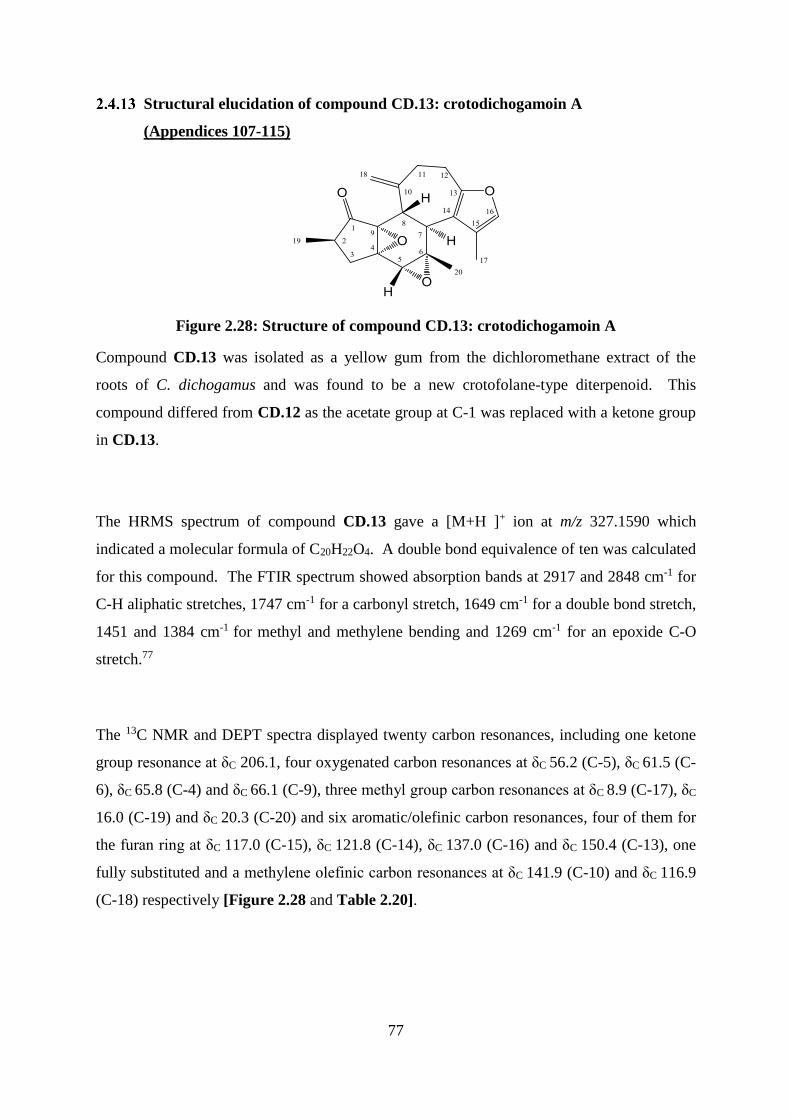
77
Structural elucidation of compound CD.13: crotodichogamoin A
(Appendices 107-115)
Figure 2.28: Structure of compound CD.13: crotodichogamoin A
Compound CD.13 was isolated as a yellow gum from the dichloromethane extract of the
roots of C. dichogamus and was found to be a new crotofolane-type diterpenoid. This
compound differed from CD.12 as the acetate group at C-1 was replaced with a ketone group
in CD.13.
The HRMS spectrum of compound CD.13 gave a [M+H ]+ ion at m/z 327.1590 which
indicated a molecular formula of C20H22O4. A double bond equivalence of ten was calculated
for this compound. The FTIR spectrum showed absorption bands at 2917 and 2848 cm-1 for
C-H aliphatic stretches, 1747 cm-1 for a carbonyl stretch, 1649 cm-1 for a double bond stretch,
1451 and 1384 cm-1 for methyl and methylene bending and 1269 cm-1 for an epoxide C-O
stretch.77
The 13C NMR and DEPT spectra displayed twenty carbon resonances, including one ketone
group resonance at δC 206.1, four oxygenated carbon resonances at δC 56.2 (C-5), δC 61.5 (C-
6), δC 65.8 (C-4) and δC 66.1 (C-9), three methyl group carbon resonances at δC 8.9 (C-17), δC
16.0 (C-19) and δC 20.3 (C-20) and six aromatic/olefinic carbon resonances, four of them for
the furan ring at δC 117.0 (C-15), δC 121.8 (C-14), δC 137.0 (C-16) and δC 150.4 (C-13), one
fully substituted and a methylene olefinic carbon resonances at δC 141.9 (C-10) and δC 116.9
(C-18) respectively [Figure 2.28 and Table 2.20].
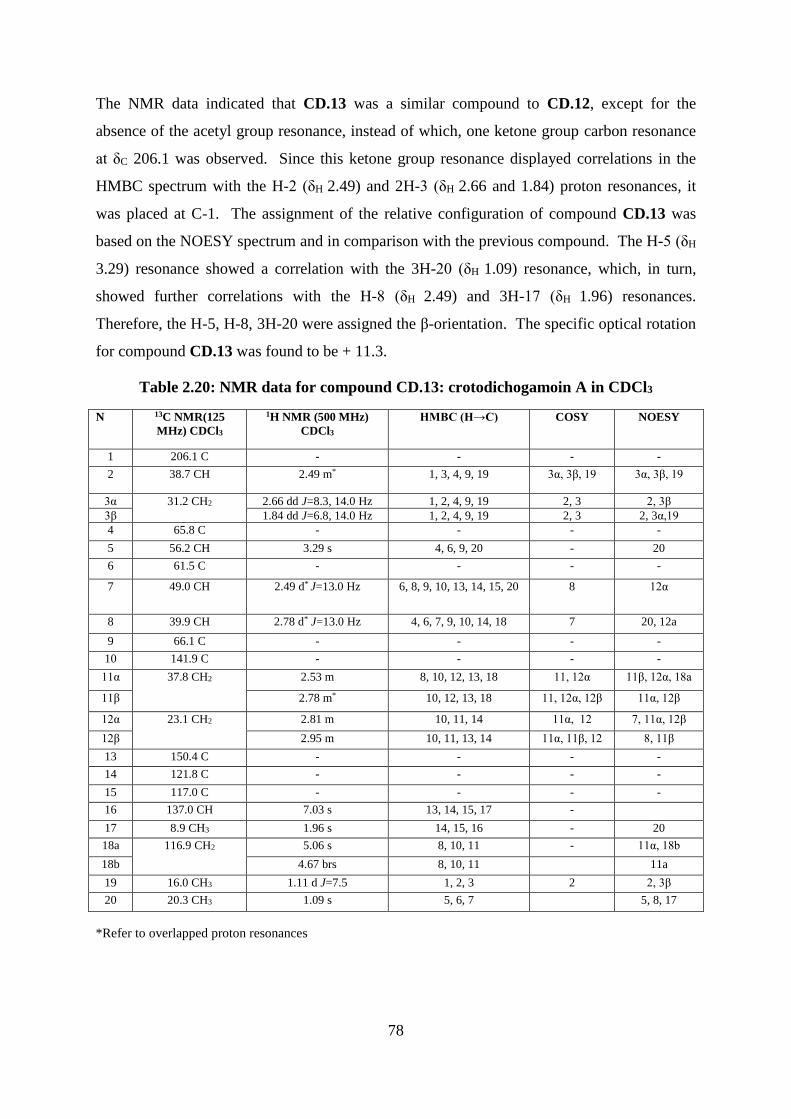
78
The NMR data indicated that CD.13 was a similar compound to CD.12, except for the
absence of the acetyl group resonance, instead of which, one ketone group carbon resonance
at δC 206.1 was observed. Since this ketone group resonance displayed correlations in the
HMBC spectrum with the H-2 (δH 2.49) and 2H-3 (δH 2.66 and 1.84) proton resonances, it
was placed at C-1. The assignment of the relative configuration of compound CD.13 was
based on the NOESY spectrum and in comparison with the previous compound. The H-5 (δH
3.29) resonance showed a correlation with the 3H-20 (δH 1.09) resonance, which, in turn,
showed further correlations with the H-8 (δH 2.49) and 3H-17 (δH 1.96) resonances.
Therefore, the H-5, H-8, 3H-20 were assigned the β-orientation. The specific optical rotation
for compound CD.13 was found to be + 11.3.
Table 2.20: NMR data for compound CD.13: crotodichogamoin A in CDCl3
N 13C NMR(125
MHz) CDCl3
1H NMR (500 MHz)
CDCl3
HMBC (H→C) COSY NOESY
1 206.1 C - - - -
2 38.7 CH 2.49 m* 1, 3, 4, 9, 19 3α, 3β, 19 3α, 3β, 19
3α 31.2 CH2 2.66 dd J=8.3, 14.0 Hz 1, 2, 4, 9, 19 2, 3 2, 3β
3β 1.84 dd J=6.8, 14.0 Hz 1, 2, 4, 9, 19 2, 3 2, 3α,19
4 65.8 C - - - -
5 56.2 CH 3.29 s 4, 6, 9, 20 - 20
6 61.5 C - - - -
7 49.0 CH 2.49 d* J=13.0 Hz 6, 8, 9, 10, 13, 14, 15, 20 8 12α
8 39.9 CH 2.78 d* J=13.0 Hz 4, 6, 7, 9, 10, 14, 18 7 20, 12a
9 66.1 C - - - -
10 141.9 C - - - -
11α 37.8 CH2 2.53 m 8, 10, 12, 13, 18 11, 12α 11β, 12α, 18a
11β 2.78 m* 10, 12, 13, 18 11, 12α, 12β 11α, 12β
12α 23.1 CH2 2.81 m 10, 11, 14 11α, 12 7, 11α, 12β
12β 2.95 m 10, 11, 13, 14 11α, 11β, 12 8, 11β
13 150.4 C - - - -
14 121.8 C - - - -
15 117.0 C - - - -
16 137.0 CH 7.03 s 13, 14, 15, 17 -
17 8.9 CH3 1.96 s 14, 15, 16 - 20
18a 116.9 CH2 5.06 s 8, 10, 11 - 11α, 18b
18b 4.67 brs 8, 10, 11 11a
19 16.0 CH3 1.11 d J=7.5 1, 2, 3 2 2, 3β
20 20.3 CH3 1.09 s 5, 6, 7 5, 8, 17
*Refer to overlapped proton resonances
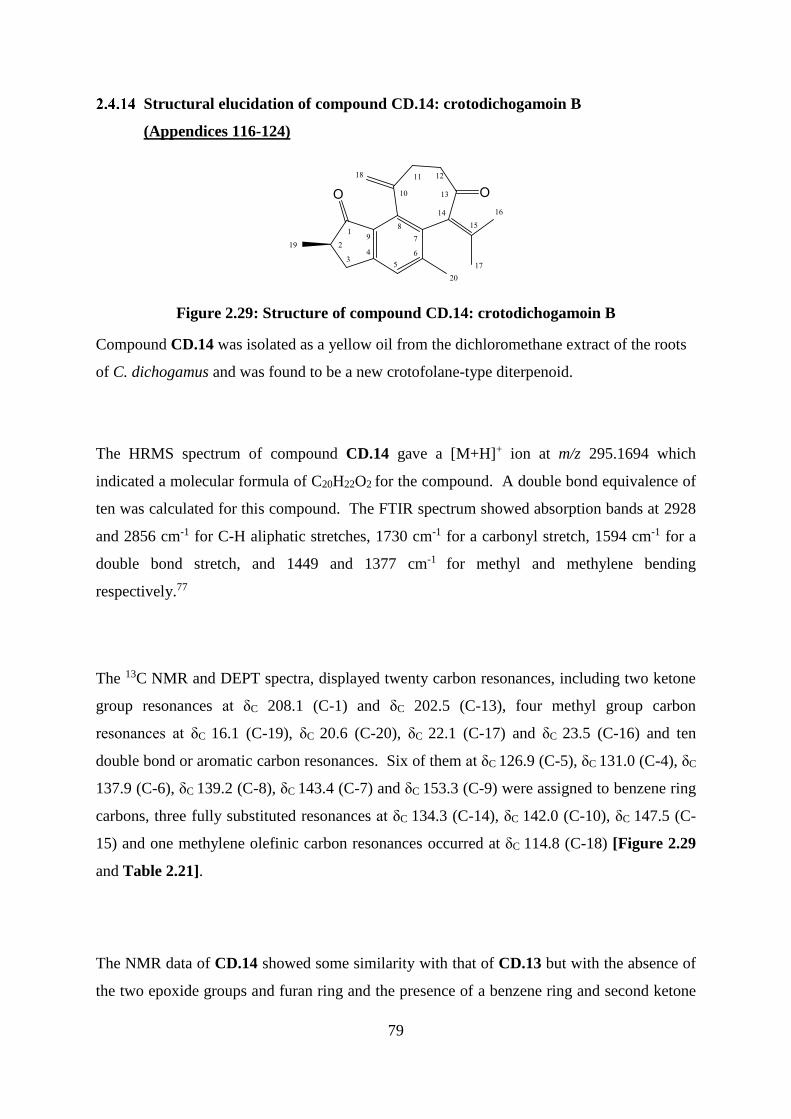
79
Structural elucidation of compound CD.14: crotodichogamoin B
(Appendices 116-124)
Figure 2.29: Structure of compound CD.14: crotodichogamoin B
Compound CD.14 was isolated as a yellow oil from the dichloromethane extract of the roots
of C. dichogamus and was found to be a new crotofolane-type diterpenoid.
The HRMS spectrum of compound CD.14 gave a [M+H]+ ion at m/z 295.1694 which
indicated a molecular formula of C20H22O2 for the compound. A double bond equivalence of
ten was calculated for this compound. The FTIR spectrum showed absorption bands at 2928
and 2856 cm-1 for C-H aliphatic stretches, 1730 cm-1 for a carbonyl stretch, 1594 cm-1 for a
double bond stretch, and 1449 and 1377 cm-1 for methyl and methylene bending
respectively.77
The 13C NMR and DEPT spectra, displayed twenty carbon resonances, including two ketone
group resonances at δC 208.1 (C-1) and δC 202.5 (C-13), four methyl group carbon
resonances at δC 16.1 (C-19), δC 20.6 (C-20), δC 22.1 (C-17) and δC 23.5 (C-16) and ten
double bond or aromatic carbon resonances. Six of them at δC 126.9 (C-5), δC 131.0 (C-4), δC
137.9 (C-6), δC 139.2 (C-8), δC 143.4 (C-7) and δC 153.3 (C-9) were assigned to benzene ring
carbons, three fully substituted resonances at δC 134.3 (C-14), δC 142.0 (C-10), δC 147.5 (C-
15) and one methylene olefinic carbon resonances occurred at δC 114.8 (C-18) [Figure 2.29
and Table 2.21].
The NMR data of CD.14 showed some similarity with that of CD.13 but with the absence of
the two epoxide groups and furan ring and the presence of a benzene ring and second ketone
80
group. The singlet proton resonance at δH 7.22, which corresponded to the carbon resonance
at δC 126.9 in the HSQCDEPT spectrum, displayed correlations in the HMBC spectrum with
four olefinic carbon resonances at δC 131.0 (C-4), δC 137.9 (C-6), δC 143.4 (C-7) and δC 153.3
(C-9), one methylene carbon resonances at δC 34.4 (C-3) in the cyclopentenone ring and one
methyl group carbon resonance at δC 20.6 (C-20). This resonance was assigned as H-5 and
confirmed the presence of the benzene ring. The ketone group carbon resonances at δC 202.5
was assigned to C-13 due to its correlations with methylene proton resonances at δH 2.82 and
δH 2.72 (2H-11) and δH 2.27 and δH 2.43 (2H-12) in the HMBC spectrum. Moreover, the
NMR spectrum revealed one isopropenyl group with two fully substituted olefinic carbon
resonances at δC 134.3 (C-14) and δC 147.5 (C-15) and two methyl group carbon resonances
at δC 23.5 (C-16) and δC 22.1 (C-17).
This molecule is the likely precursor of CD.12 and CD.13. Oxidation of the Δ5 and 4,9-
double bonds to epoxides, reduction of the Δ7 double bond, and formation of the furan ring
from the oxygen C-13 and C-16 would occur.
The relative configuration of the H-2/3H-19 in compound CD.14 was assumed to be the same
as in the previous compounds CD.12 and CD.13. The specific optical rotation for compound
CD.14 was found to be +111.1.
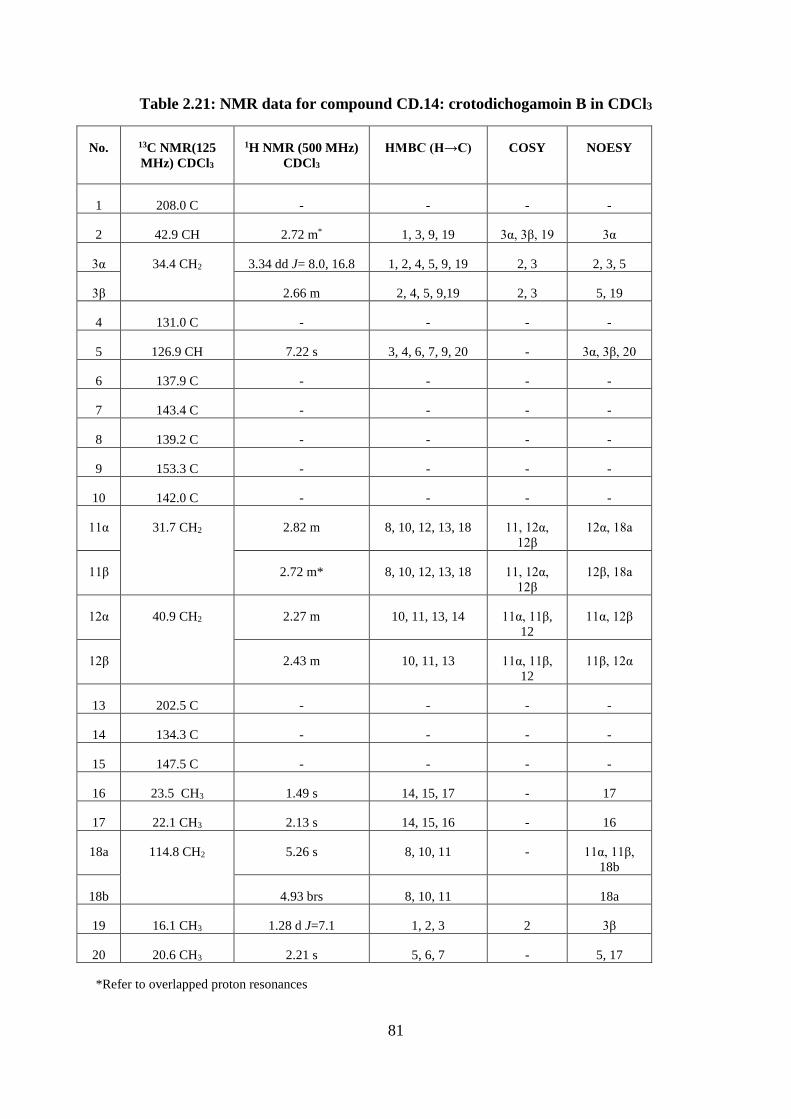
81
Table 2.21: NMR data for compound CD.14: crotodichogamoin B in CDCl3
No.
13C NMR(125
MHz) CDCl3
1H NMR (500 MHz)
CDCl3
HMBC (H→C) COSY NOESY
1 208.0 C - - - -
2 42.9 CH 2.72 m* 1, 3, 9, 19 3α, 3β, 19 3α
3α 34.4 CH2 3.34 dd J= 8.0, 16.8 1, 2, 4, 5, 9, 19 2, 3 2, 3, 5
3β 2.66 m 2, 4, 5, 9,19 2, 3 5, 19
4 131.0 C - - - -
5 126.9 CH 7.22 s 3, 4, 6, 7, 9, 20 - 3α, 3β, 20
6 137.9 C - - - -
7 143.4 C - - - -
8 139.2 C - - - -
9 153.3 C - - - -
10 142.0 C - - - -
11α 31.7 CH2 2.82 m 8, 10, 12, 13, 18 11, 12α,
12β
12α, 18a
11β 2.72 m* 8, 10, 12, 13, 18 11, 12α,
12β
12β, 18a
12α 40.9 CH2 2.27 m 10, 11, 13, 14 11α, 11β,
12
11α, 12β
12β 2.43 m 10, 11, 13 11α, 11β,
12
11β, 12α
13 202.5 C - - - -
14 134.3 C - - - -
15 147.5 C - - - -
16 23.5 CH3 1.49 s 14, 15, 17 - 17
17 22.1 CH3 2.13 s 14, 15, 16 - 16
18a 114.8 CH2 5.26 s 8, 10, 11 - 11α, 11β,
18b
18b 4.93 brs 8, 10, 11 18a
19 16.1 CH3 1.28 d J=7.1 1, 2, 3 2 3β
20 20.6 CH3 2.21 s 5, 6, 7 - 5, 17
*Refer to overlapped proton resonances
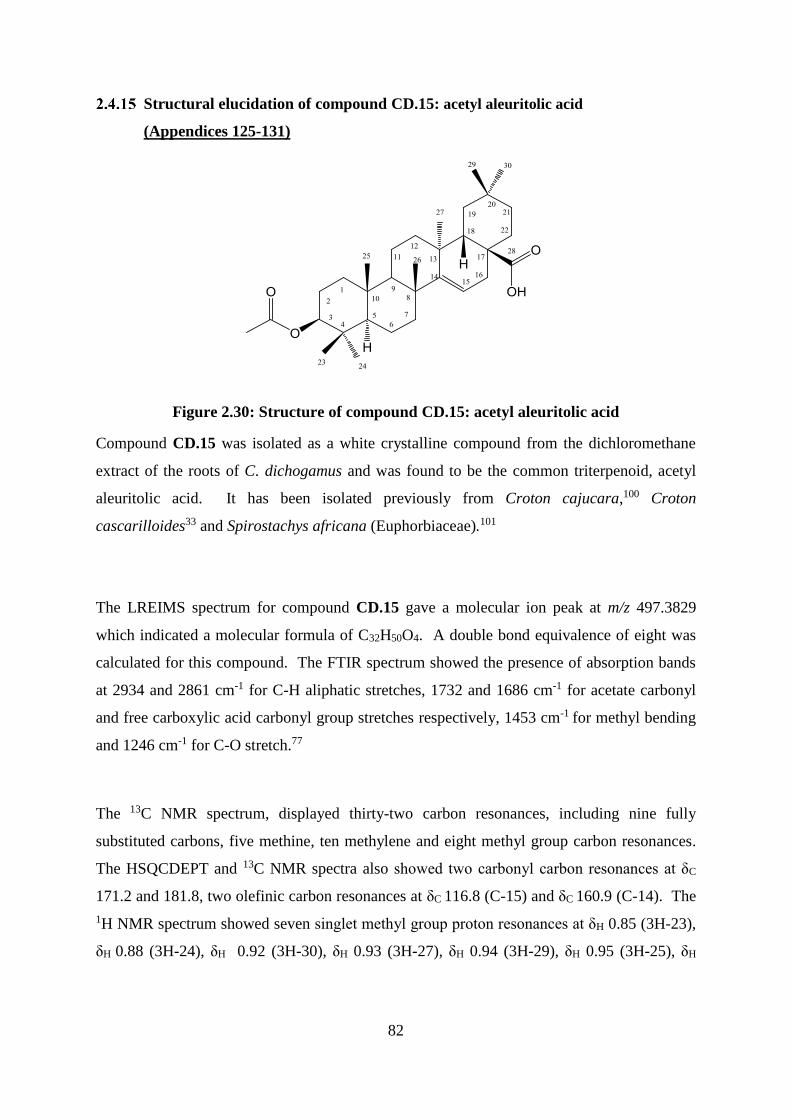
82
Structural elucidation of compound CD.15: acetyl aleuritolic acid
(Appendices 125-131)
Figure 2.30: Structure of compound CD.15: acetyl aleuritolic acid
Compound CD.15 was isolated as a white crystalline compound from the dichloromethane
extract of the roots of C. dichogamus and was found to be the common triterpenoid, acetyl
aleuritolic acid. It has been isolated previously from Croton cajucara,100 Croton
cascarilloides33 and Spirostachys africana (Euphorbiaceae).101
The LREIMS spectrum for compound CD.15 gave a molecular ion peak at m/z 497.3829
which indicated a molecular formula of C32H50O4. A double bond equivalence of eight was
calculated for this compound. The FTIR spectrum showed the presence of absorption bands
at 2934 and 2861 cm-1 for C-H aliphatic stretches, 1732 and 1686 cm-1 for acetate carbonyl
and free carboxylic acid carbonyl group stretches respectively, 1453 cm-1 for methyl bending
and 1246 cm-1 for C-O stretch.77
The 13C NMR spectrum, displayed thirty-two carbon resonances, including nine fully
substituted carbons, five methine, ten methylene and eight methyl group carbon resonances.
The HSQCDEPT and 13C NMR spectra also showed two carbonyl carbon resonances at δC
171.2 and 181.8, two olefinic carbon resonances at δC 116.8 (C-15) and δC 160.9 (C-14). The
1H NMR spectrum showed seven singlet methyl group proton resonances at δH 0.85 (3H-23),
δH 0.88 (3H-24), δH 0.92 (3H-30), δH 0.93 (3H-27), δH 0.94 (3H-29), δH 0.95 (3H-25), δH
83
0.96 (3H-26) and one acetyl methyl group proton resonances at δH 2.05. These data supported
a triterpenoid structure [Figure 2.30 and Table 2.22].
The oxygenated carbon resonance at δC 81.1 was assigned as C-3 due to its correlations with
two methyl singlet proton resonances at δH 0.85 (3H-23) and δH 0.88 (3H-24) in the HMBC
spectrum and coupling with the 2H-2 (δH 1.62) resonance in the COSY spectrum. The fully
substituted carbon resonance δC 160.9 was assigned to C-14 due to the correlations with the
two methyl singlet proton resonances at δH 0.96 (3H-26) and 0.93 (3H-27) in the HMBC
spectrum. Compound CD.15 showed the same 13C NMR chemical shifts to those of the
known acetyl aleuritolic acid which has been reported previously.33
Compound CD.15 has been reported to have antibacterial activity against Escherichia coli,
Salmonella typhi, Shigella dysentery, Staphylococcus aureus and Vibrio cholera with MIC
values of 50 µg/ml.101 Moreover, it showed cytotoxic activity against human cancer central
nervous system (U251, Glia) cell line, with IC50 8.4 μM.35 However, it did not show cytotoxic
activity against Vero cell lines (African green monkey) in vitro with IC50 > 400 µg/ml) and
against cultured human lung cancer cell line (A459) with ED50 >20.33
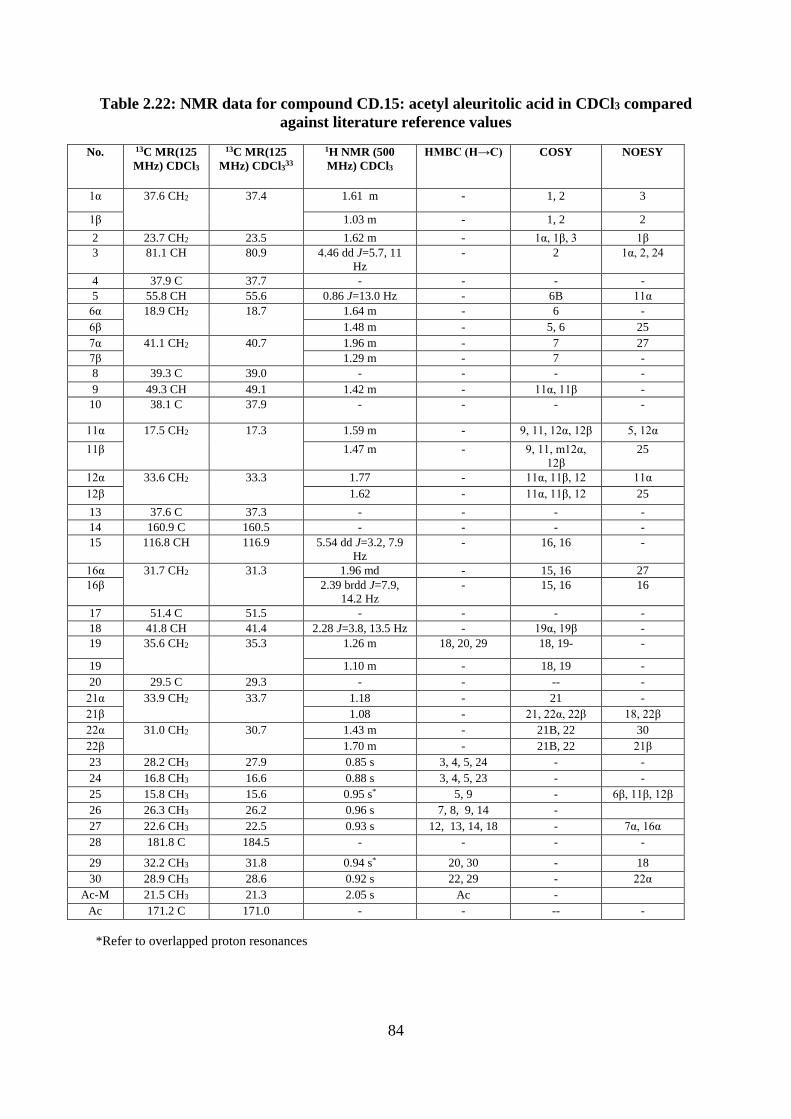
84
Table 2.22: NMR data for compound CD.15: acetyl aleuritolic acid in CDCl3 compared
against literature reference values
No. 13C MR(125
MHz) CDCl3
13C MR(125
MHz) CDCl333
1H NMR (500
MHz) CDCl3
HMBC (H→C) COSY NOESY
1α 37.6 CH2
37.4 1.61 m - 1, 2 3
1β 1.03 m - 1, 2 2
2 23.7 CH2 23.5 1.62 m - 1α, 1β, 3 1β
3 81.1 CH 80.9 4.46 dd J=5.7, 11
Hz
- 2 1α, 2, 24
4 37.9 C 37.7 - - - -
5 55.8 CH 55.6 0.86 J=13.0 Hz - 6B 11α
6α 18.9 CH2 18.7 1.64 m - 6 -
6β 1.48 m - 5, 6 25
7α 41.1 CH2 40.7 1.96 m - 7 27
7β 1.29 m - 7 -
8 39.3 C 39.0 - - - -
9 49.3 CH 49.1 1.42 m - 11α, 11β -
10 38.1 C 37.9 - - - -
11α 17.5 CH2 17.3 1.59 m - 9, 11, 12α, 12β 5, 12α
11β 1.47 m - 9, 11, m12α,
12β
25
12α 33.6 CH2 33.3 1.77 - 11α, 11β, 12 11α
12β 1.62 - 11α, 11β, 12 25
13 37.6 C 37.3 - - - -
14 160.9 C 160.5 - - - -
15 116.8 CH 116.9 5.54 dd J=3.2, 7.9
Hz
- 16, 16 -
16α 31.7 CH2 31.3 1.96 md - 15, 16 27
16β 2.39 brdd J=7.9,
14.2 Hz
- 15, 16 16
17 51.4 C 51.5 - - - -
18 41.8 CH 41.4 2.28 J=3.8, 13.5 Hz - 19α, 19β -
19 35.6 CH2 35.3 1.26 m 18, 20, 29 18, 19- -
19 1.10 m - 18, 19 -
20 29.5 C 29.3 - - -- -
21α 33.9 CH2 33.7 1.18 - 21 -
21β 1.08 - 21, 22α, 22β 18, 22β
22α 31.0 CH2 30.7 1.43 m - 21B, 22 30
22β 1.70 m - 21B, 22 21β
23 28.2 CH3 27.9 0.85 s 3, 4, 5, 24 - -
24 16.8 CH3 16.6 0.88 s 3, 4, 5, 23 - -
25 15.8 CH3 15.6 0.95 s* 5, 9 - 6β, 11β, 12β
26 26.3 CH3 26.2 0.96 s 7, 8, 9, 14 -
27 22.6 CH3 22.5 0.93 s 12, 13, 14, 18 - 7α, 16α
28 181.8 C 184.5 - - - -
29 32.2 CH3 31.8 0.94 s* 20, 30 - 18
30 28.9 CH3 28.6 0.92 s 22, 29 - 22α
Ac-M 21.5 CH3 21.3 2.05 s Ac -
Ac 171.2 C 171.0 - - -- -
*Refer to overlapped proton resonances
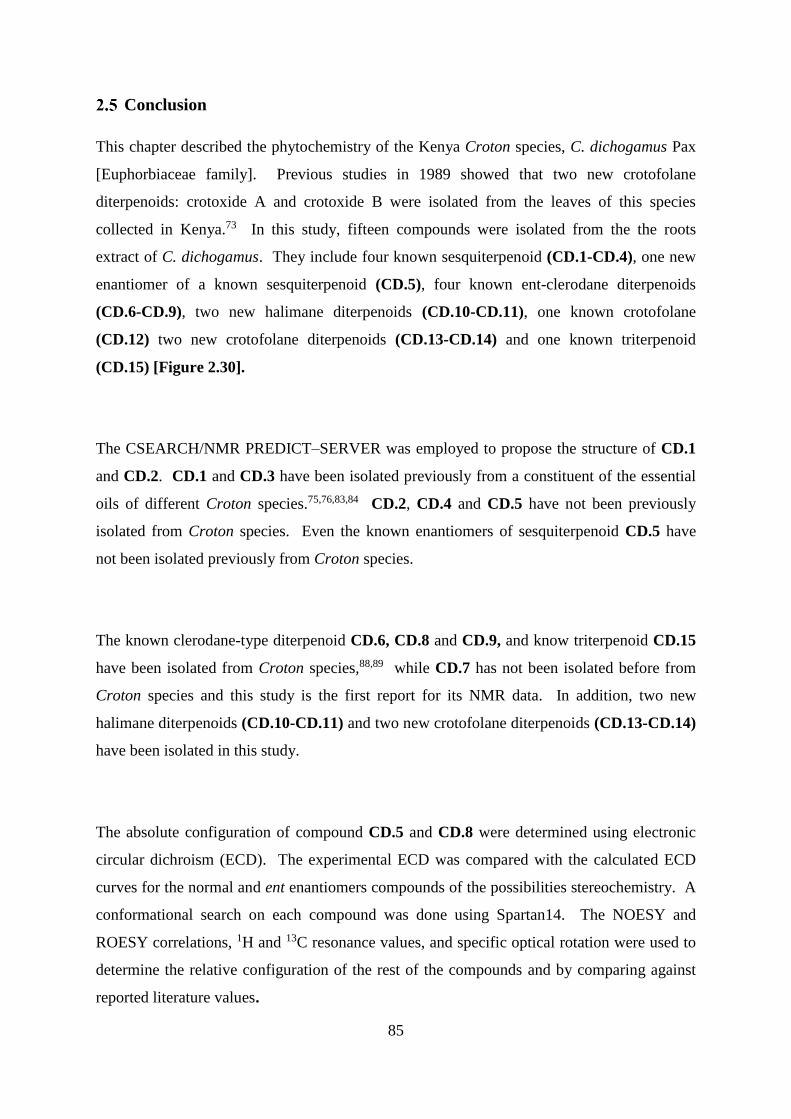
85
Conclusion
This chapter described the phytochemistry of the Kenya Croton species, C. dichogamus Pax
[Euphorbiaceae family]. Previous studies in 1989 showed that two new crotofolane
diterpenoids: crotoxide A and crotoxide B were isolated from the leaves of this species
collected in Kenya.73 In this study, fifteen compounds were isolated from the the roots
extract of C. dichogamus. They include four known sesquiterpenoid (CD.1-CD.4), one new
enantiomer of a known sesquiterpenoid (CD.5), four known ent-clerodane diterpenoids
(CD.6-CD.9), two new halimane diterpenoids (CD.10-CD.11), one known crotofolane
(CD.12) two new crotofolane diterpenoids (CD.13-CD.14) and one known triterpenoid
(CD.15) [Figure 2.30].
The CSEARCH/NMR PREDICT–SERVER was employed to propose the structure of CD.1
and CD.2. CD.1 and CD.3 have been isolated previously from a constituent of the essential
oils of different Croton species.75,76,83,84 CD.2, CD.4 and CD.5 have not been previously
isolated from Croton species. Even the known enantiomers of sesquiterpenoid CD.5 have
not been isolated previously from Croton species.
The known clerodane-type diterpenoid CD.6, CD.8 and CD.9, and know triterpenoid CD.15
have been isolated from Croton species,88,89 while CD.7 has not been isolated before from
Croton species and this study is the first report for its NMR data. In addition, two new
halimane diterpenoids (CD.10-CD.11) and two new crotofolane diterpenoids (CD.13-CD.14)
have been isolated in this study.
The absolute configuration of compound CD.5 and CD.8 were determined using electronic
circular dichroism (ECD). The experimental ECD was compared with the calculated ECD
curves for the normal and ent enantiomers compounds of the possibilities stereochemistry. A
conformational search on each compound was done using Spartan14. The NOESY and
ROESY correlations, 1H and 13C resonance values, and specific optical rotation were used to
determine the relative configuration of the rest of the compounds and by comparing against
reported literature values.
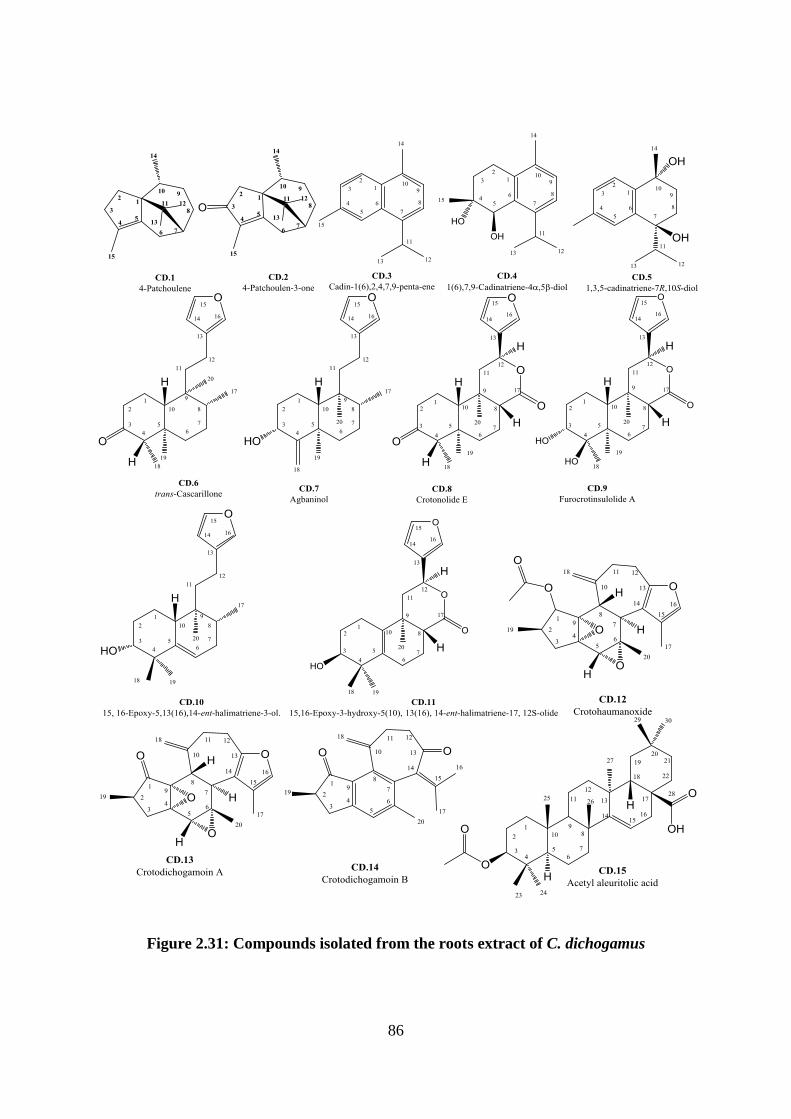
86
Figure 2.31: Compounds isolated from the roots extract of C. dichogamus
87
Chapter 3. The phytochemistry of three Crinum species: Crinum species
6538, Crinum hardyi Lehmiller and Crinum species 6529
[Amaryllidaceae family]
Introduction to the Amaryllidacea family
The Amaryllidaceae family are bulbous plants, mostly geophytic, terrestrial and perennial.
Leaves are persistent or annual, linear, sessile, and usually glabrous. Inflorescences are
scapose and pseudoumbellate. Flowers are perfect, mostly showy and large, sessile or
pedicellate, actinomorphic or zygomorphic, consisting of 3+3 segments and inner segment
usually shorter than the outer. Stamens are 3+3 and varying in length, ovaries are
tricarpellate and inferior. Mature fruits are a loculicidal capsule, seeds are globose or
subglobose, hard or flesh and winged.102,103 The Amaryllidaceae family is composed of 59
genera and 850 species that are classified into three subfamilies, the Agapanthoideae,
Allioideae and Amaryllidoideae.102,104 This family are widely distributed in the tropical and
subtropical regions with more diversity in South America and South Africa, also many genera
of this family such as Crinum have been cultivated for ornamental because of their beautiful
flowers.102,103
The Amaryllidaceae family is included in the top 20 of the most widely used plants in
ethnobotany.105,106 Since 1877, when the first alkaloid, lycorine, was isolated from
Amaryllidaceae lycoris, more than 500 different alkaloids, known as the Amaryllidaceae
alkaloids, have been isolated from this family and have been shown to exhibit various
pharmacological activities, such as antibacterial, antifungal, antimalarial, antitumor and
acetylcholinesterase inhibitory activity.105,106 One of the most important and largest genera of
the Amaryllidaceae family is Crinum [Picture 3.1].105,107
Introduction to the Crinum genus
The Crinum genus and ethnopharmacology
Crinum belongs to the Amaryllidoideae subfamily, Amaryllideae tribe and Crininae
subtribe.102 According to Kubitzki (1998) the Crininae subtribe is composed of four genera,
Ammocharis, Boophone, Crinum and Cybistetes.102 The Crinum genus consists of
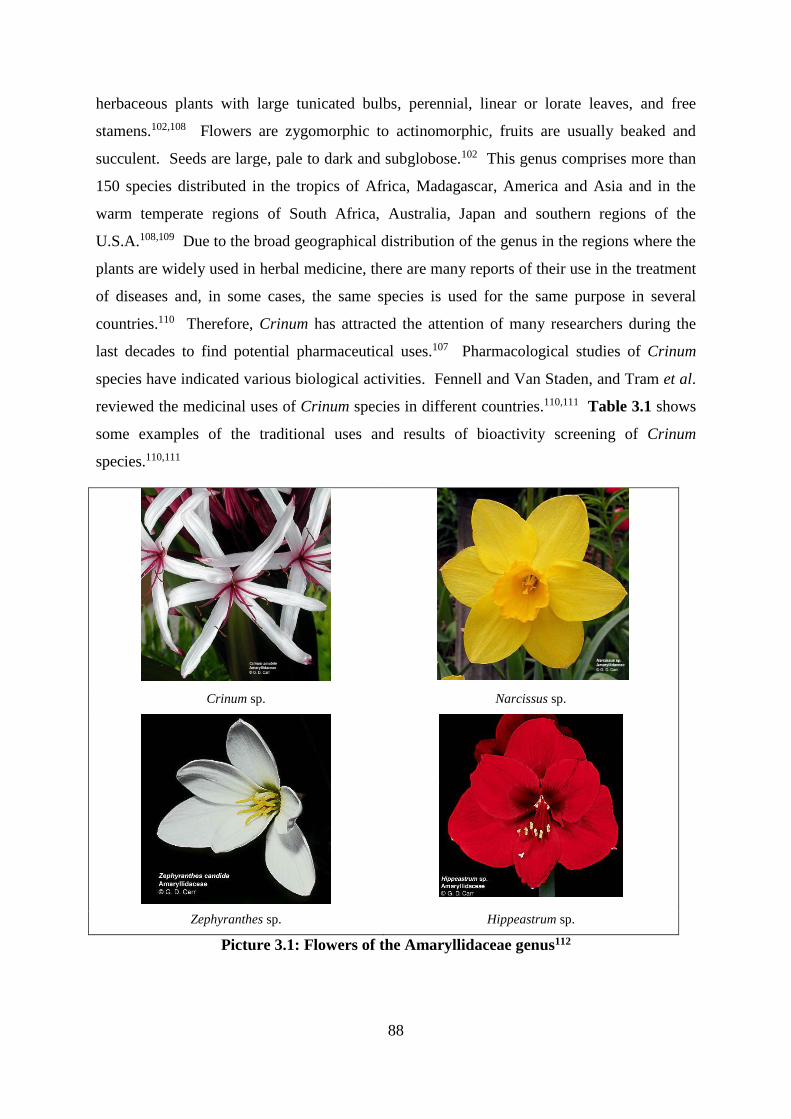
88
herbaceous plants with large tunicated bulbs, perennial, linear or lorate leaves, and free
stamens.102,108 Flowers are zygomorphic to actinomorphic, fruits are usually beaked and
succulent. Seeds are large, pale to dark and subglobose.102 This genus comprises more than
150 species distributed in the tropics of Africa, Madagascar, America and Asia and in the
warm temperate regions of South Africa, Australia, Japan and southern regions of the
U.S.A.108,109 Due to the broad geographical distribution of the genus in the regions where the
plants are widely used in herbal medicine, there are many reports of their use in the treatment
of diseases and, in some cases, the same species is used for the same purpose in several
countries.110 Therefore, Crinum has attracted the attention of many researchers during the
last decades to find potential pharmaceutical uses.107 Pharmacological studies of Crinum
species have indicated various biological activities. Fennell and Van Staden, and Tram et al.
reviewed the medicinal uses of Crinum species in different countries.110,111 Table 3.1 shows
some examples of the traditional uses and results of bioactivity screening of Crinum
species.110,111
Crinum sp. Narcissus sp.
Zephyranthes sp. Hippeastrum sp.
Picture 3.1: Flowers of the Amaryllidaceae genus112
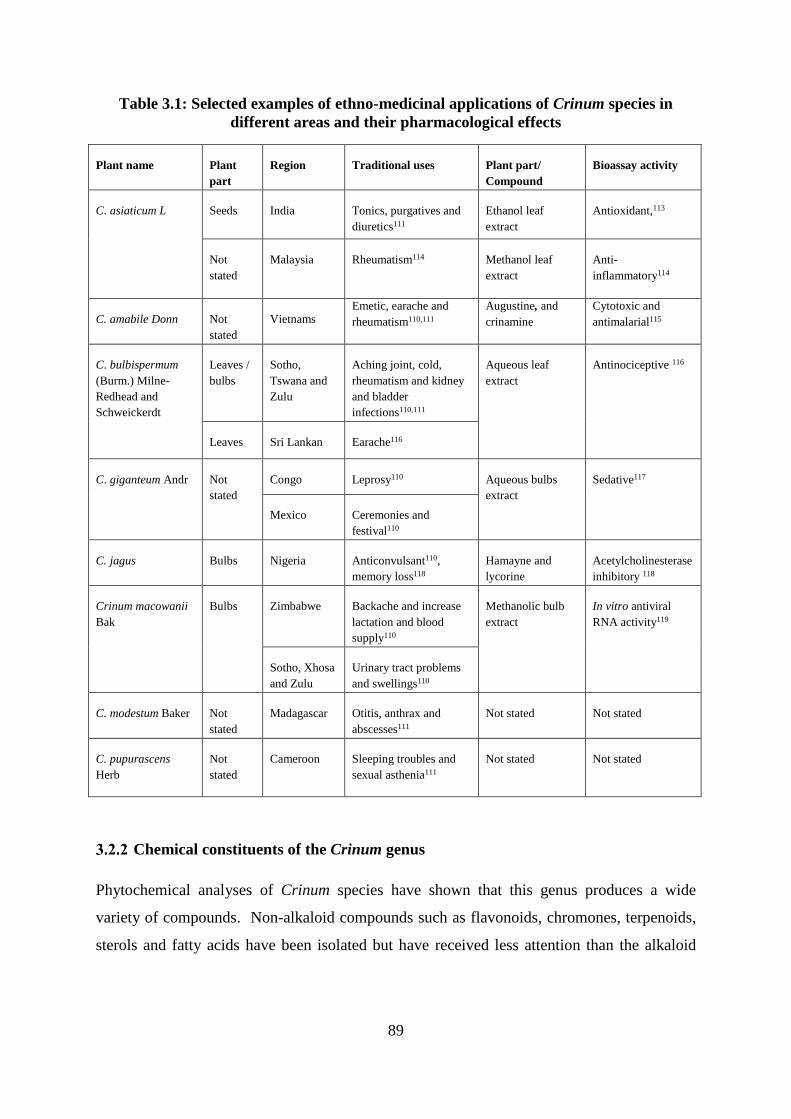
89
Table 3.1: Selected examples of ethno-medicinal applications of Crinum species in
different areas and their pharmacological effects
Plant name Plant
part
Region Traditional uses Plant part/
Compound
Bioassay activity
C. asiaticum L Seeds India Tonics, purgatives and
diuretics111
Ethanol leaf
extract
Antioxidant,113
Not
stated
Malaysia Rheumatism114 Methanol leaf
extract
Anti-
inflammatory114
C. amabile Donn Not
stated
Vietnams Emetic, earache and
rheumatism110,111
Augustine, and
crinamine
Cytotoxic and
antimalarial115
C. bulbispermum
(Burm.) Milne-
Redhead and
Schweickerdt
Leaves /
bulbs
Sotho,
Tswana and
Zulu
Aching joint, cold,
rheumatism and kidney
and bladder
infections110,111
Aqueous leaf
extract
Antinociceptive 116
Leaves Sri Lankan Earache116
C. giganteum Andr Not
stated
Congo Leprosy110 Aqueous bulbs
extract
Sedative117
Mexico Ceremonies and
festival110
C. jagus Bulbs Nigeria Anticonvulsant110,
memory loss118
Hamayne and
lycorine
Acetylcholinesterase
inhibitory 118
Crinum macowanii
Bak
Bulbs Zimbabwe Backache and increase
lactation and blood
supply110
Methanolic bulb
extract
In vitro antiviral
RNA activity119
Sotho, Xhosa
and Zulu
Urinary tract problems
and swellings110
C. modestum Baker Not
stated
Madagascar Otitis, anthrax and
abscesses111
Not stated Not stated
C. pupurascens
Herb
Not
stated
Cameroon Sleeping troubles and
sexual asthenia111
Not stated Not stated
Chemical constituents of the Crinum genus
Phytochemical analyses of Crinum species have shown that this genus produces a wide
variety of compounds. Non-alkaloid compounds such as flavonoids, chromones, terpenoids,
sterols and fatty acids have been isolated but have received less attention than the alkaloid
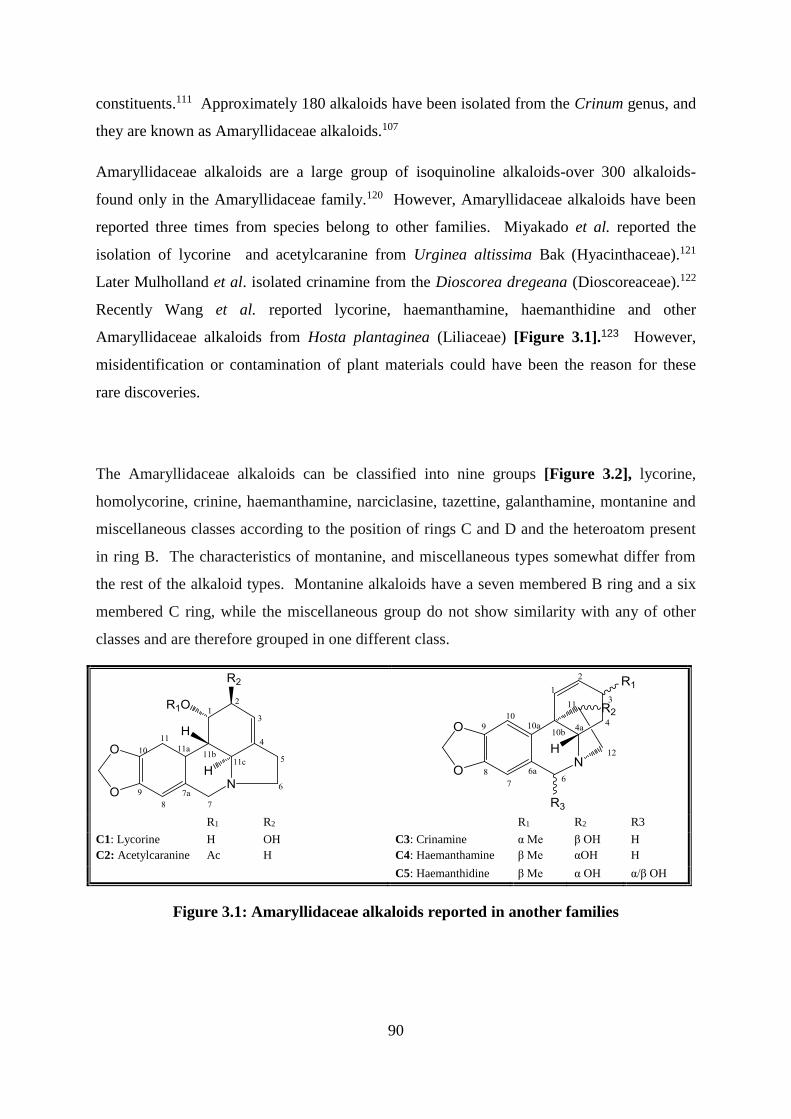
90
constituents.111 Approximately 180 alkaloids have been isolated from the Crinum genus, and
they are known as Amaryllidaceae alkaloids.107
Amaryllidaceae alkaloids are a large group of isoquinoline alkaloids-over 300 alkaloids-
found only in the Amaryllidaceae family.120 However, Amaryllidaceae alkaloids have been
reported three times from species belong to other families. Miyakado et al. reported the
isolation of lycorine and acetylcaranine from Urginea altissima Bak (Hyacinthaceae).121
Later Mulholland et al. isolated crinamine from the Dioscorea dregeana (Dioscoreaceae).122
Recently Wang et al. reported lycorine, haemanthamine, haemanthidine and other
Amaryllidaceae alkaloids from Hosta plantaginea (Liliaceae) [Figure 3.1].123 However,
misidentification or contamination of plant materials could have been the reason for these
rare discoveries.
The Amaryllidaceae alkaloids can be classified into nine groups [Figure 3.2], lycorine,
homolycorine, crinine, haemanthamine, narciclasine, tazettine, galanthamine, montanine and
miscellaneous classes according to the position of rings C and D and the heteroatom present
in ring B. The characteristics of montanine, and miscellaneous types somewhat differ from
the rest of the alkaloid types. Montanine alkaloids have a seven membered B ring and a six
membered C ring, while the miscellaneous group do not show similarity with any of other
classes and are therefore grouped in one different class.
R1 R2 R1 R2 R3
C1: Lycorine H OH C3: Crinamine α Me β OH H
C2: Acetylcaranine Ac H C4: Haemanthamine β Me αOH H
C5: Haemanthidine β Me α OH α/β OH
Figure 3.1: Amaryllidaceae alkaloids reported in another families
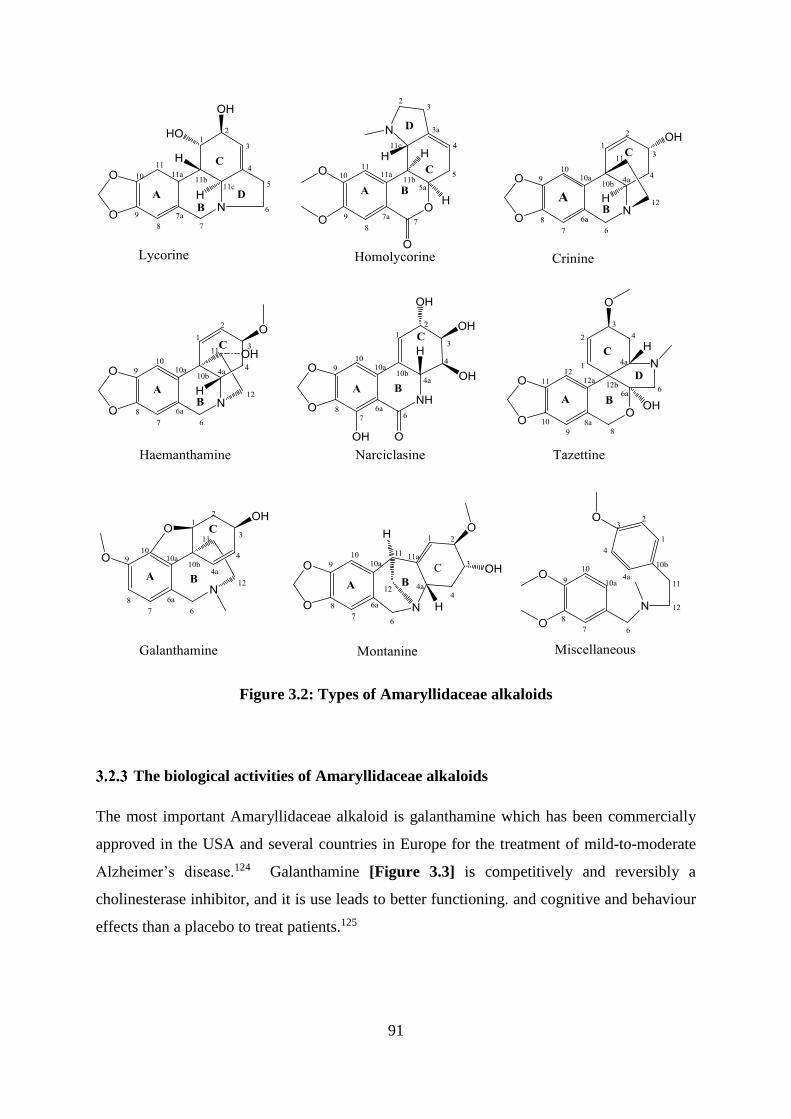
91
Figure 3.2: Types of Amaryllidaceae alkaloids
The biological activities of Amaryllidaceae alkaloids
The most important Amaryllidaceae alkaloid is galanthamine which has been commercially
approved in the USA and several countries in Europe for the treatment of mild-to-moderate
Alzheimer’s disease.124 Galanthamine [Figure 3.3] is competitively and reversibly a
cholinesterase inhibitor, and it is use leads to better functioning. and cognitive and behaviour
effects than a placebo to treat patients.125
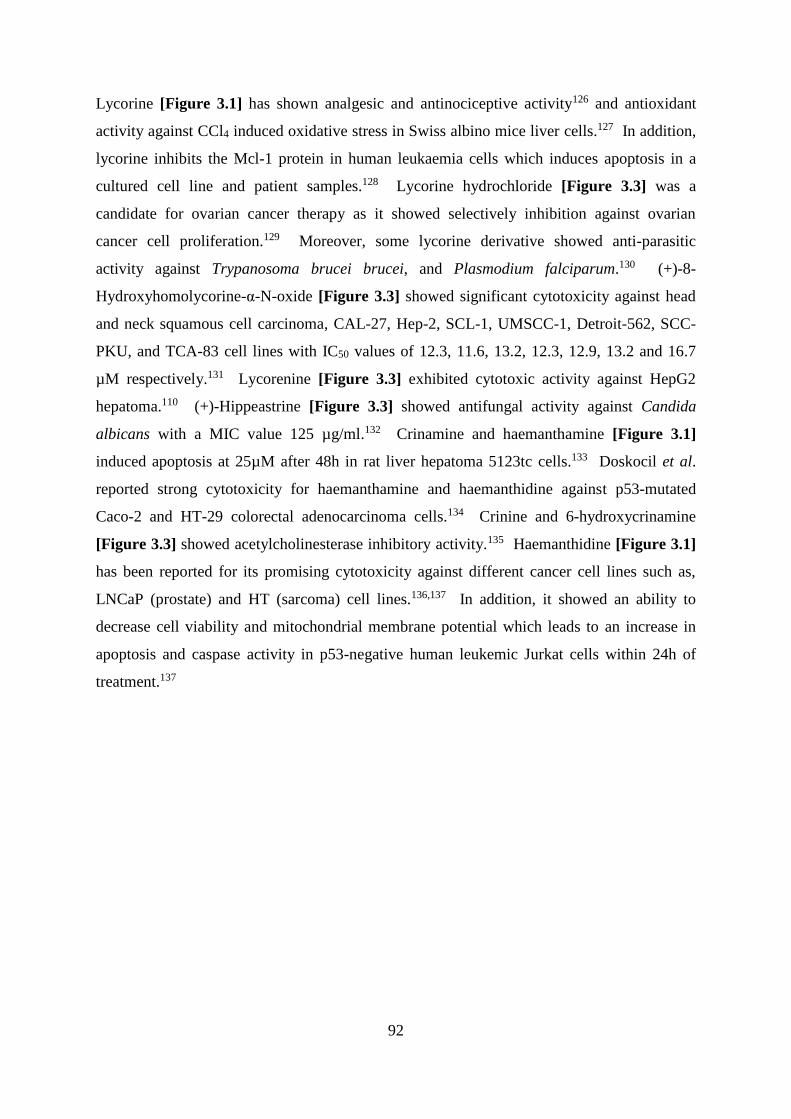
92
Lycorine [Figure 3.1] has shown analgesic and antinociceptive activity126 and antioxidant
activity against CCl4 induced oxidative stress in Swiss albino mice liver cells.127 In addition,
lycorine inhibits the Mcl-1 protein in human leukaemia cells which induces apoptosis in a
cultured cell line and patient samples.128 Lycorine hydrochloride [Figure 3.3] was a
candidate for ovarian cancer therapy as it showed selectively inhibition against ovarian
cancer cell proliferation.129 Moreover, some lycorine derivative showed anti-parasitic
activity against Trypanosoma brucei brucei, and Plasmodium falciparum.130 (+)-8-
Hydroxyhomolycorine-α-N-oxide [Figure 3.3] showed significant cytotoxicity against head
and neck squamous cell carcinoma, CAL-27, Hep-2, SCL-1, UMSCC-1, Detroit-562, SCC-
PKU, and TCA-83 cell lines with IC50 values of 12.3, 11.6, 13.2, 12.3, 12.9, 13.2 and 16.7
µM respectively.131 Lycorenine [Figure 3.3] exhibited cytotoxic activity against HepG2
hepatoma.110 (+)-Hippeastrine [Figure 3.3] showed antifungal activity against Candida
albicans with a MIC value 125 µg/ml.132 Crinamine and haemanthamine [Figure 3.1]
induced apoptosis at 25µM after 48h in rat liver hepatoma 5123tc cells.133 Doskocil et al.
reported strong cytotoxicity for haemanthamine and haemanthidine against p53-mutated
Caco-2 and HT-29 colorectal adenocarcinoma cells.134 Crinine and 6-hydroxycrinamine
[Figure 3.3] showed acetylcholinesterase inhibitory activity.135 Haemanthidine [Figure 3.1]
has been reported for its promising cytotoxicity against different cancer cell lines such as,
LNCaP (prostate) and HT (sarcoma) cell lines.136,137 In addition, it showed an ability to
decrease cell viability and mitochondrial membrane potential which leads to an increase in
apoptosis and caspase activity in p53-negative human leukemic Jurkat cells within 24h of
treatment.137
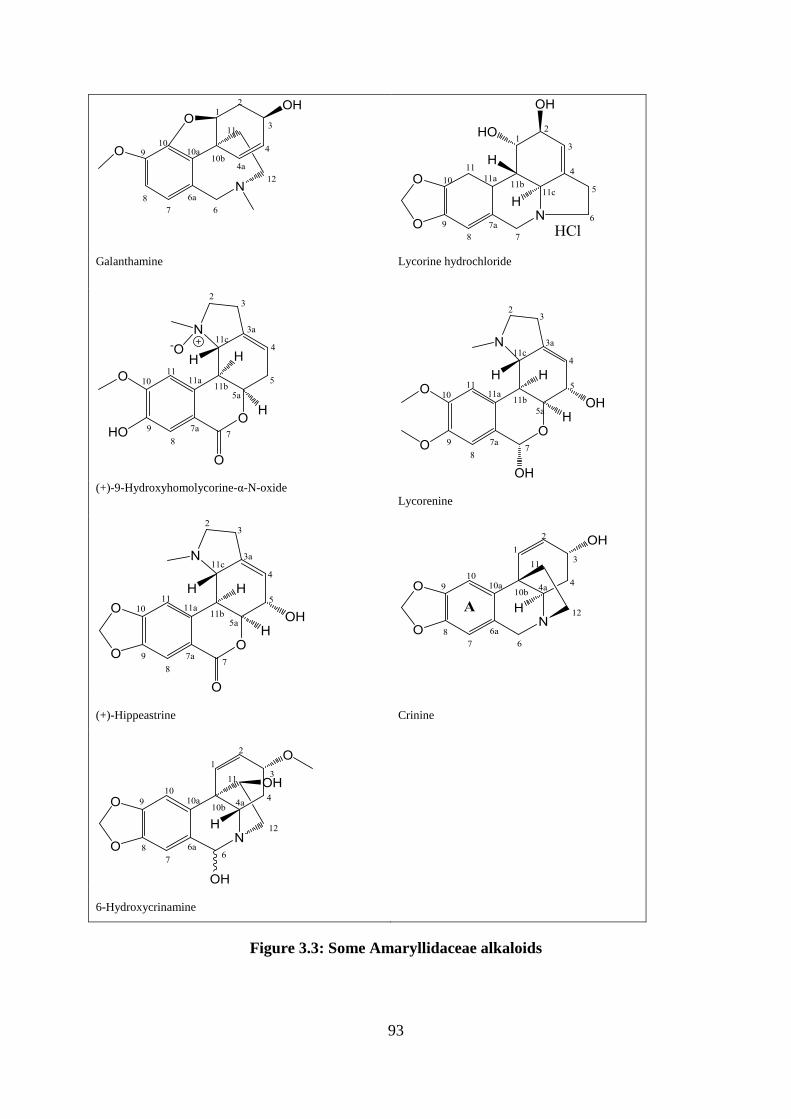
93
Galanthamine Lycorine hydrochloride
(+)-9-Hydroxyhomolycorine-α-N-oxide Lycorenine
(+)-Hippeastrine Crinine
6-Hydroxycrinamine
Figure 3.3: Some Amaryllidaceae alkaloids
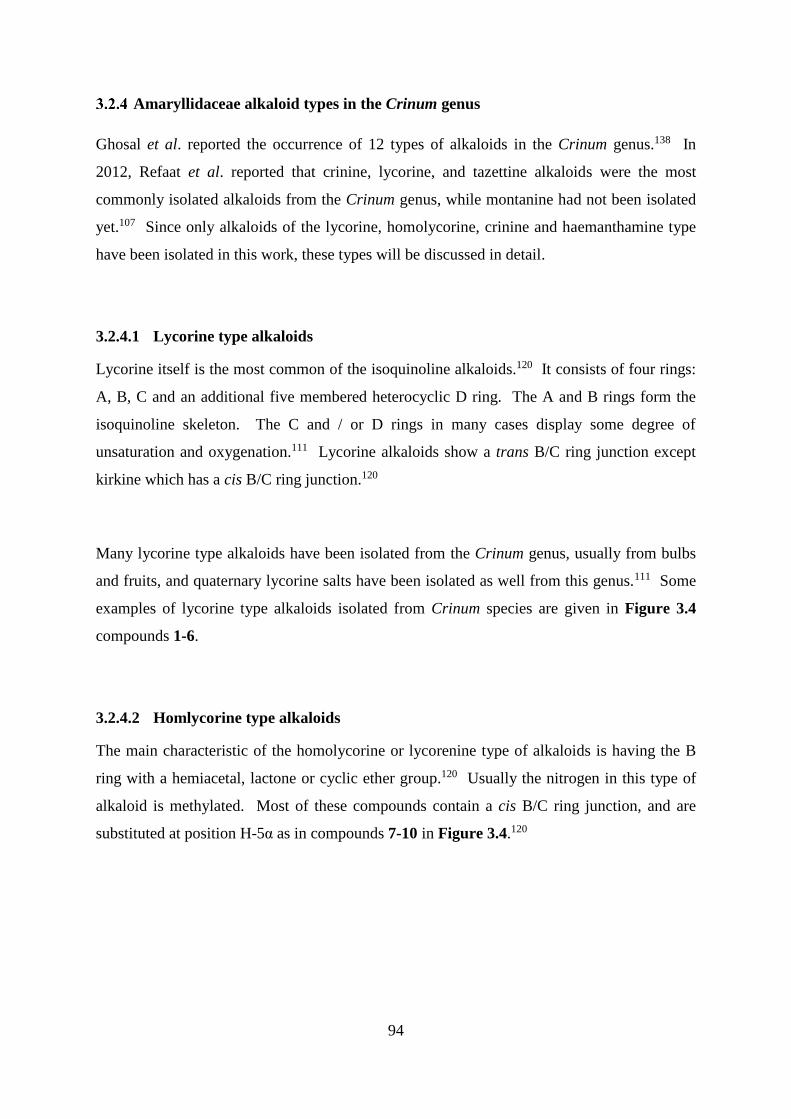
94
Amaryllidaceae alkaloid types in the Crinum genus
Ghosal et al. reported the occurrence of 12 types of alkaloids in the Crinum genus.138 In
2012, Refaat et al. reported that crinine, lycorine, and tazettine alkaloids were the most
commonly isolated alkaloids from the Crinum genus, while montanine had not been isolated
yet.107 Since only alkaloids of the lycorine, homolycorine, crinine and haemanthamine type
have been isolated in this work, these types will be discussed in detail.
3.2.4.1 Lycorine type alkaloids
Lycorine itself is the most common of the isoquinoline alkaloids.120 It consists of four rings:
A, B, C and an additional five membered heterocyclic D ring. The A and B rings form the
isoquinoline skeleton. The C and / or D rings in many cases display some degree of
unsaturation and oxygenation.111 Lycorine alkaloids show a trans B/C ring junction except
kirkine which has a cis B/C ring junction.120
Many lycorine type alkaloids have been isolated from the Crinum genus, usually from bulbs
and fruits, and quaternary lycorine salts have been isolated as well from this genus.111 Some
examples of lycorine type alkaloids isolated from Crinum species are given in Figure 3.4
compounds 1-6.
3.2.4.2 Homlycorine type alkaloids
The main characteristic of the homolycorine or lycorenine type of alkaloids is having the B
ring with a hemiacetal, lactone or cyclic ether group.120 Usually the nitrogen in this type of
alkaloid is methylated. Most of these compounds contain a cis B/C ring junction, and are
substituted at position H-5α as in compounds 7-10 in Figure 3.4.120
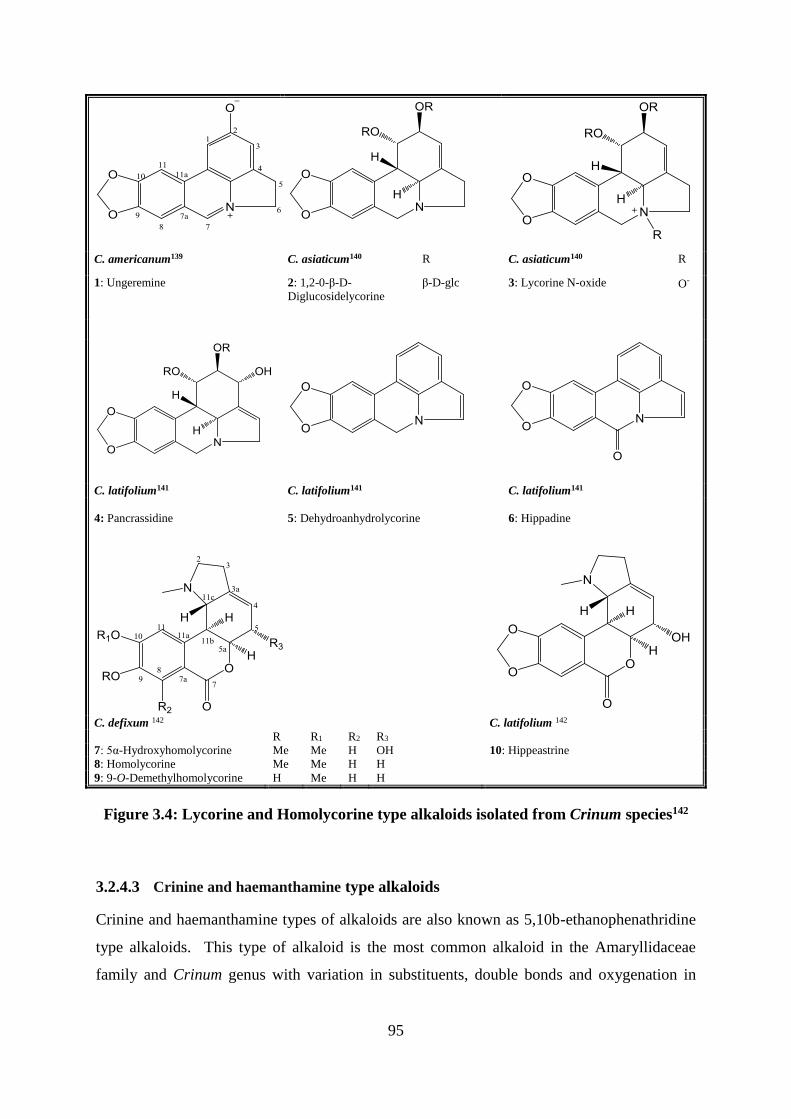
95
C. americanum139 C. asiaticum140 R C. asiaticum140 R
1: Ungeremine 2: 1,2-0-β-D-
Diglucosidelycorine
β-D-glc 3: Lycorine N-oxide O-
C. latifolium141 C. latifolium141 C. latifolium141
4: Pancrassidine 5: Dehydroanhydrolycorine 6: Hippadine
C. defixum 142 C. latifolium 142
R R1 R2 R3
7: 5α-Hydroxyhomolycorine Me Me H OH 10: Hippeastrine
8: Homolycorine Me Me H H
9: 9-O-Demethylhomolycorine H Me H H
Figure 3.4: Lycorine and Homolycorine type alkaloids isolated from Crinum species142
3.2.4.3 Crinine and haemanthamine type alkaloids
Crinine and haemanthamine types of alkaloids are also known as 5,10b-ethanophenathridine
type alkaloids. This type of alkaloid is the most common alkaloid in the Amaryllidaceae
family and Crinum genus with variation in substituents, double bonds and oxygenation in
96
ring C.111 The distinction between crinine and haemanthamine alkaloids lies in the
orientation of the 5,10b-ethano bridge. In the crinine class the bridge is in the β-position,
while in the haemanthamine alkaloids is in the α-orientation [Figure 3.5 and Figure 3.6].
The absolute configuration of 5,10b-ethano bridge may be determined by circular dichroism
spectroscopy.120
C. erubescens143
Crinamine
C. delagoense144
Delagoensine R1+R2= OCH2O
Delagoenine R1= R2= OMe
C. amabile145
Vittatine
Figure 3.5: Haemanthamine type alkaloids isolated from Crinum species
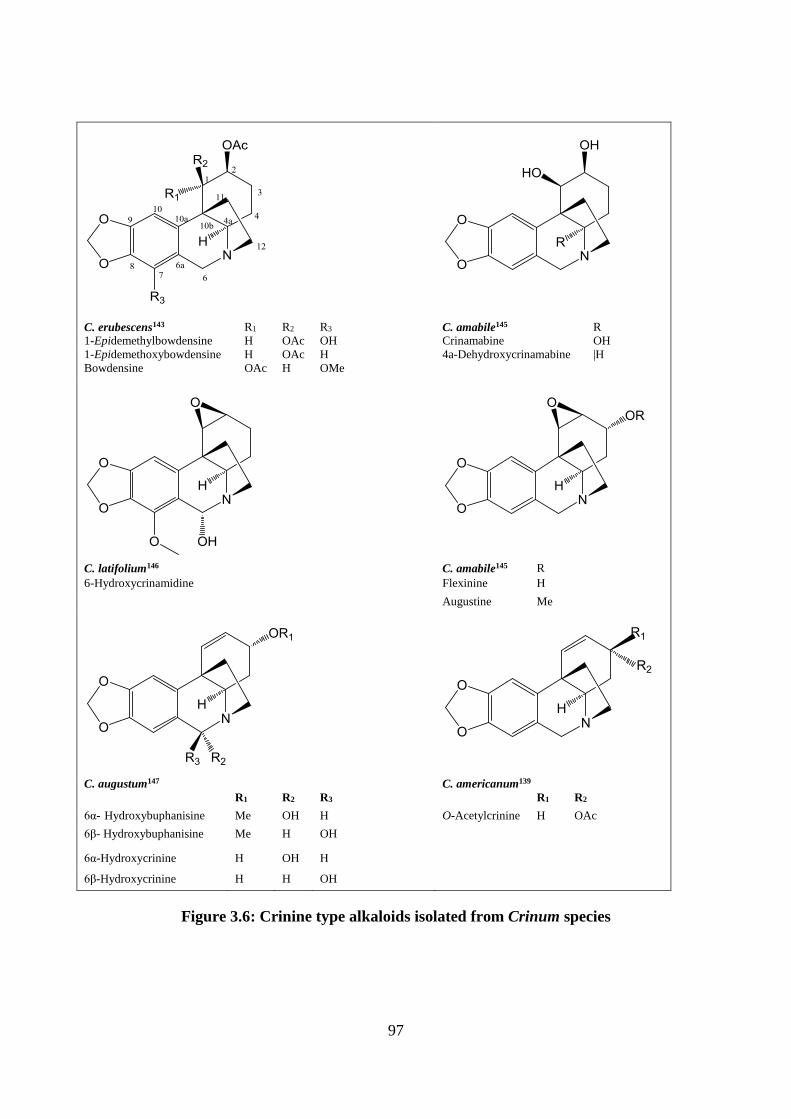
97
C. erubescens143 R1 R2 R3 C. amabile145 R
1-Epidemethylbowdensine H OAc OH Crinamabine OH
1-Epidemethoxybowdensine H OAc H 4a-Dehydroxycrinamabine |H
Bowdensine OAc H OMe
C. latifolium146 C. amabile145 R
6-Hydroxycrinamidine Flexinine H
Augustine Me
C. augustum147 C. americanum139 R1 R2 R3 R1 R2
6α- Hydroxybuphanisine Me OH H O-Acetylcrinine H OAc
6β- Hydroxybuphanisine Me H OH
6α-Hydroxycrinine H OH H 6β-Hydroxycrinine H H OH
Figure 3.6: Crinine type alkaloids isolated from Crinum species
98
The biosynthesis of Amaryllidaceae alkaloids
Amaryllidaceae alkaloids are biosynthetically derived from the amino acids L-phenylalanine
and L-tyrosine via norbelladine. Phenylalanine is a primary precursor of the C6-C1 unit from
which the aromatic A ring and benzylic carbon are derived, while tyrosine is the precursor of
the nitrogen atom and C6-C2 unit from which the aliphatic C ring and two carbon side chain
are derived.148
The biosynthesis of Amaryllidaceae alkaloids begins with the decarboxylation of tyrosine to
tyramine via a decarboxylase enzyme [Scheme 3.1]. Meanwhile, the phenylalanine ammonia
lyase (API) enzyme deaminates the phenylalanine in an antiperiplaner manner with loss of
the B-pro-S hydrogen to produce cinnamic acid. The hydroxylation and oxidation of
cinnamic acid give protocatechuic aldehyde. The condensation of tyramine and
protocatechuic aldehyde gives the norbelladine precursor. The phenolic oxidative coupling
of norbelladine or other biosynthetic precursors produces the different groups of alkaloids
and in most cases O-methylnorbelladine is the intermediate compound .107,120,149
The first step of lycorine and homolycorine biosynthesis starts from the precursor
norbelladine. Norbelladine is methylated to O-methylnorbelladine. Followed by o-p-
phenolic coupling with cyclisation and formation of a carbon-nitrogen bond to produce
norpluviine 120
During the lycorine biosynthesis [Scheme 3.2], the hydroxyl group and the adjacent methoxy
group on the norpluviine A ring combine to form a methylenedioxy group. Finally
hydroxylation at C-2 produces lycorine. In the homolycorine pathway the norpluviine
undergoes benzylic oxidation at position 7, then ring opening will produce an amino
aldehyde.150 Rotation about the C11a-C11b bond is then following by hemiacetal formation,
oxidation and methylation at the nitrogen atom to produce homolycorine.120
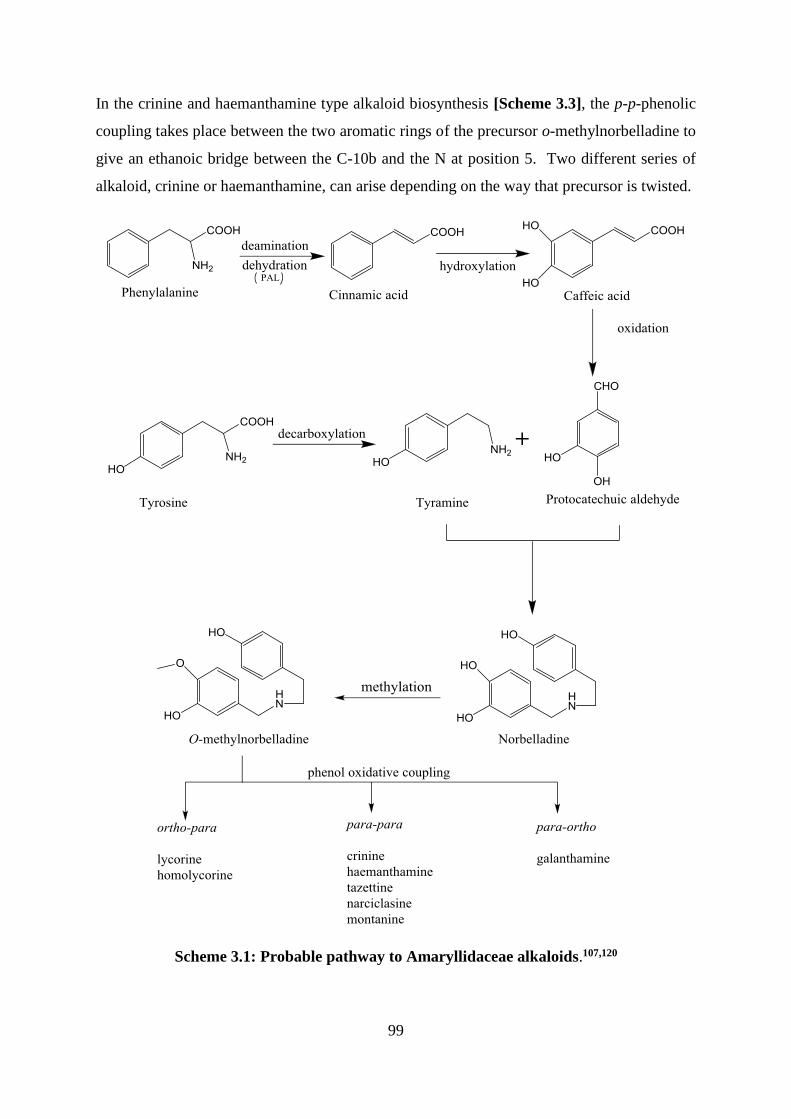
99
In the crinine and haemanthamine type alkaloid biosynthesis [Scheme 3.3], the p-p-phenolic
coupling takes place between the two aromatic rings of the precursor o-methylnorbelladine to
give an ethanoic bridge between the C-10b and the N at position 5. Two different series of
alkaloid, crinine or haemanthamine, can arise depending on the way that precursor is twisted.
Scheme 3.1: Probable pathway to Amaryllidaceae alkaloids.107,120
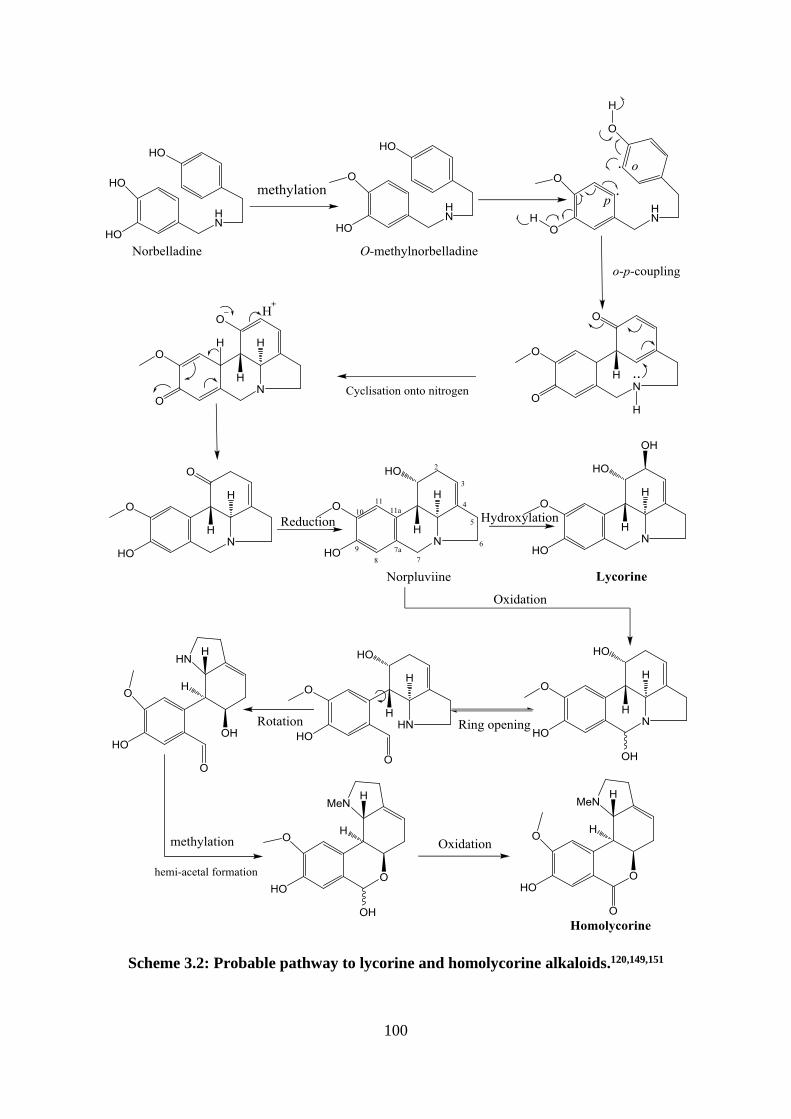
100
Scheme 3.2: Probable pathway to lycorine and homolycorine alkaloids.120,149,151
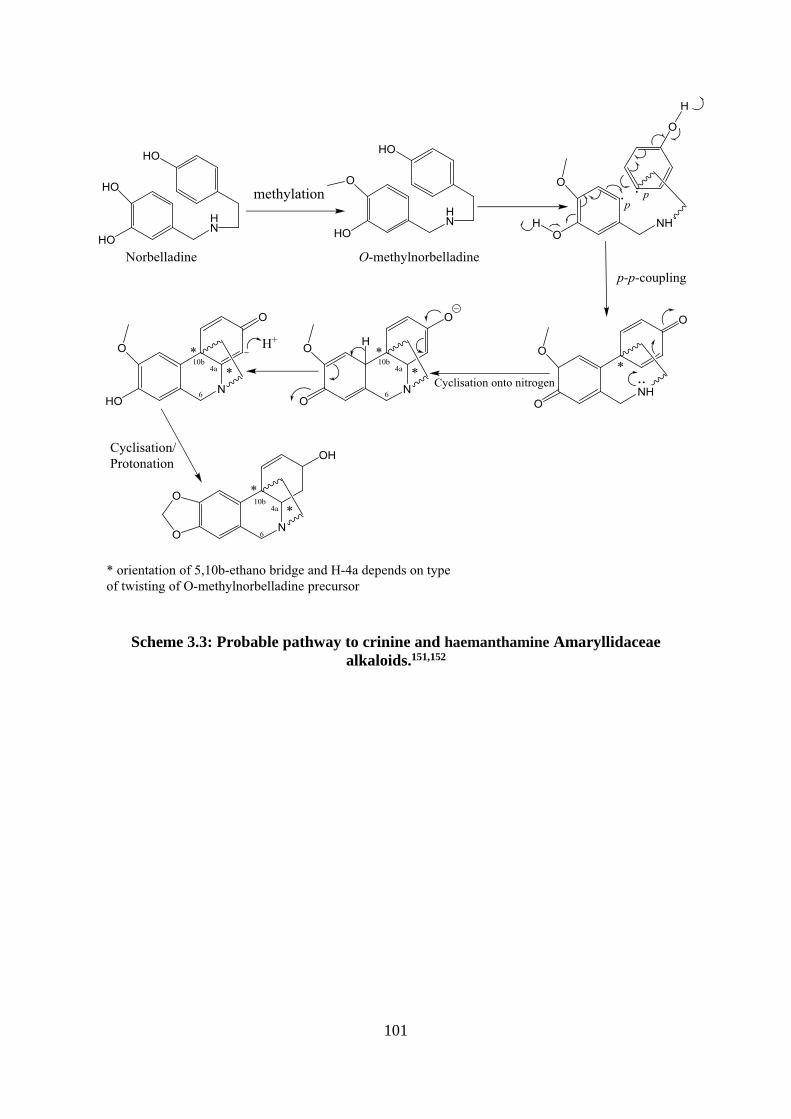
101
Scheme 3.3: Probable pathway to crinine and haemanthamine Amaryllidaceae
alkaloids.151,152
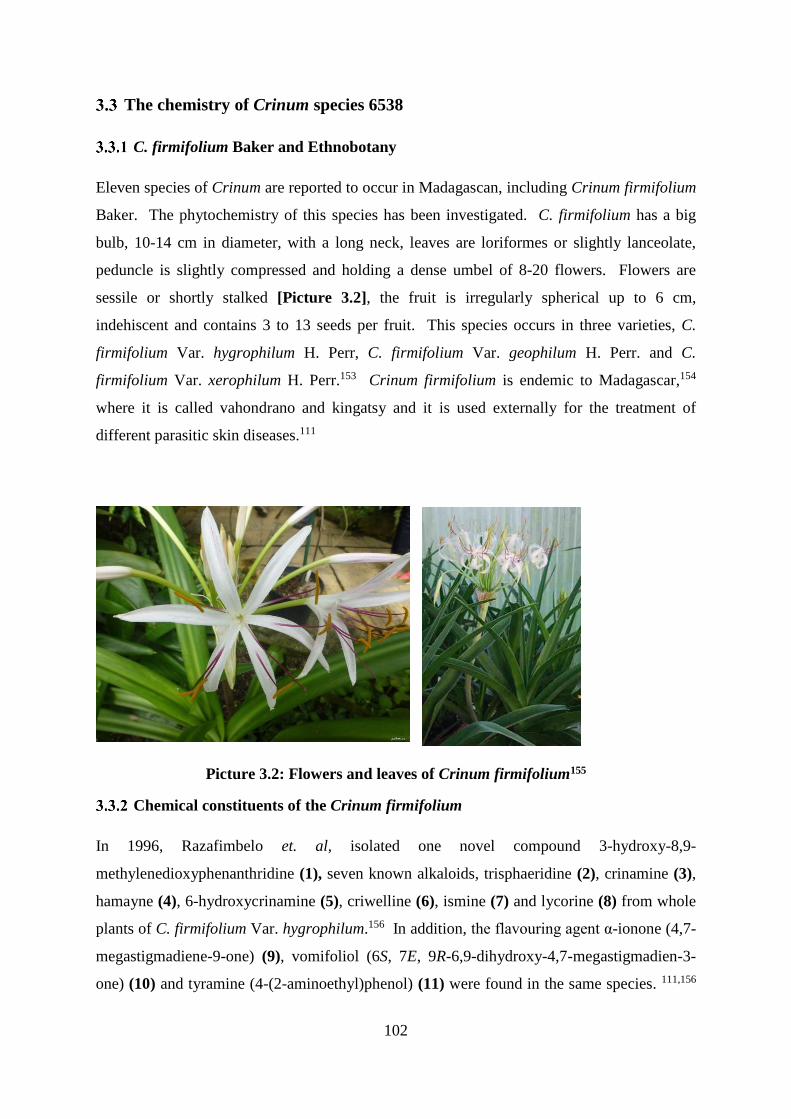
102
The chemistry of Crinum species 6538
C. firmifolium Baker and Ethnobotany
Eleven species of Crinum are reported to occur in Madagascan, including Crinum firmifolium
Baker. The phytochemistry of this species has been investigated. C. firmifolium has a big
bulb, 10-14 cm in diameter, with a long neck, leaves are loriformes or slightly lanceolate,
peduncle is slightly compressed and holding a dense umbel of 8-20 flowers. Flowers are
sessile or shortly stalked [Picture 3.2], the fruit is irregularly spherical up to 6 cm,
indehiscent and contains 3 to 13 seeds per fruit. This species occurs in three varieties, C.
firmifolium Var. hygrophilum H. Perr, C. firmifolium Var. geophilum H. Perr. and C.
firmifolium Var. xerophilum H. Perr.153 Crinum firmifolium is endemic to Madagascar,154
where it is called vahondrano and kingatsy and it is used externally for the treatment of
different parasitic skin diseases.111
Picture 3.2: Flowers and leaves of Crinum firmifolium155
Chemical constituents of the Crinum firmifolium
In 1996, Razafimbelo et. al, isolated one novel compound 3-hydroxy-8,9-
methylenedioxyphenanthridine (1), seven known alkaloids, trisphaeridine (2), crinamine (3),
hamayne (4), 6-hydroxycrinamine (5), criwelline (6), ismine (7) and lycorine (8) from whole
plants of C. firmifolium Var. hygrophilum.156 In addition, the flavouring agent α-ionone (4,7-
megastigmadiene-9-one) (9), vomifoliol (6S, 7E, 9R-6,9-dihydroxy-4,7-megastigmadien-3-
one) (10) and tyramine (4-(2-aminoethyl)phenol) (11) were found in the same species. 111,156
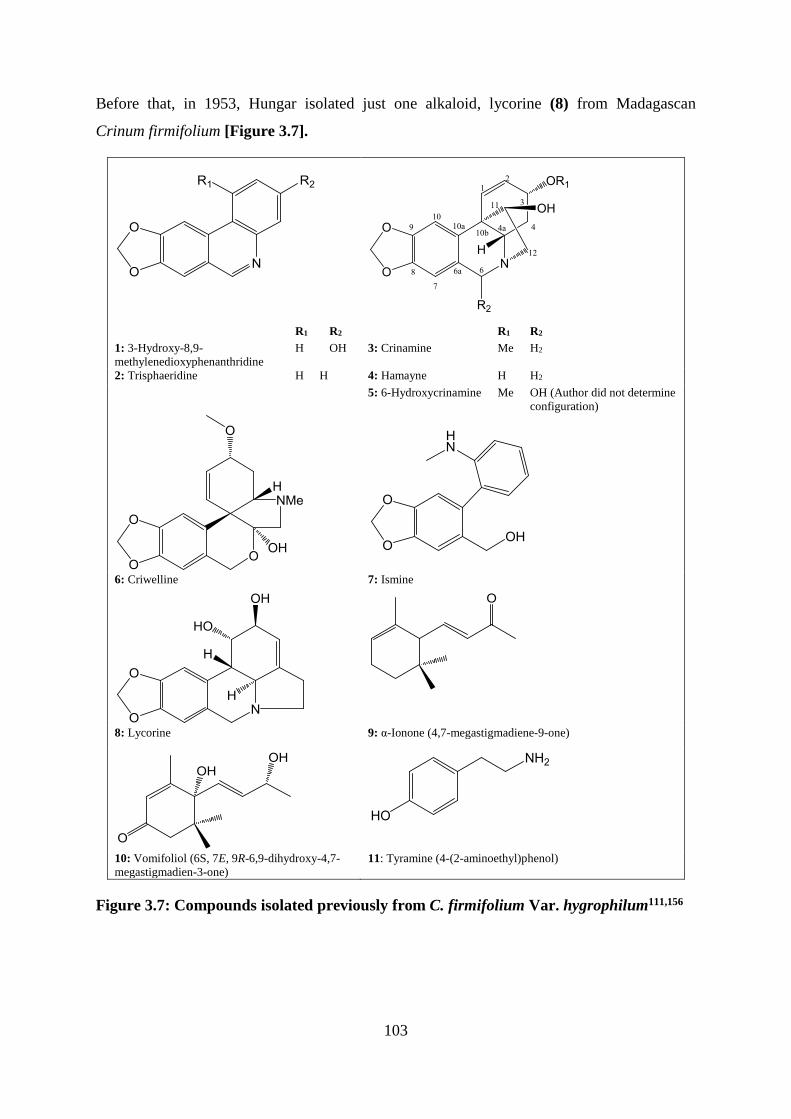
103
Before that, in 1953, Hungar isolated just one alkaloid, lycorine (8) from Madagascan
Crinum firmifolium [Figure 3.7].
R1 R2 R1 R2
1: 3-Hydroxy-8,9-
methylenedioxyphenanthridine
H OH 3: Crinamine Me H2
2: Trisphaeridine H H 4: Hamayne H H2
5: 6-Hydroxycrinamine Me OH (Author did not determine
configuration)
6: Criwelline 7: Ismine
8: Lycorine 9: α-Ionone (4,7-megastigmadiene-9-one)
10: Vomifoliol (6S, 7E, 9R-6,9-dihydroxy-4,7-
megastigmadien-3-one) 11: Tyramine (4-(2-aminoethyl)phenol)
Figure 3.7: Compounds isolated previously from C. firmifolium Var. hygrophilum111,156
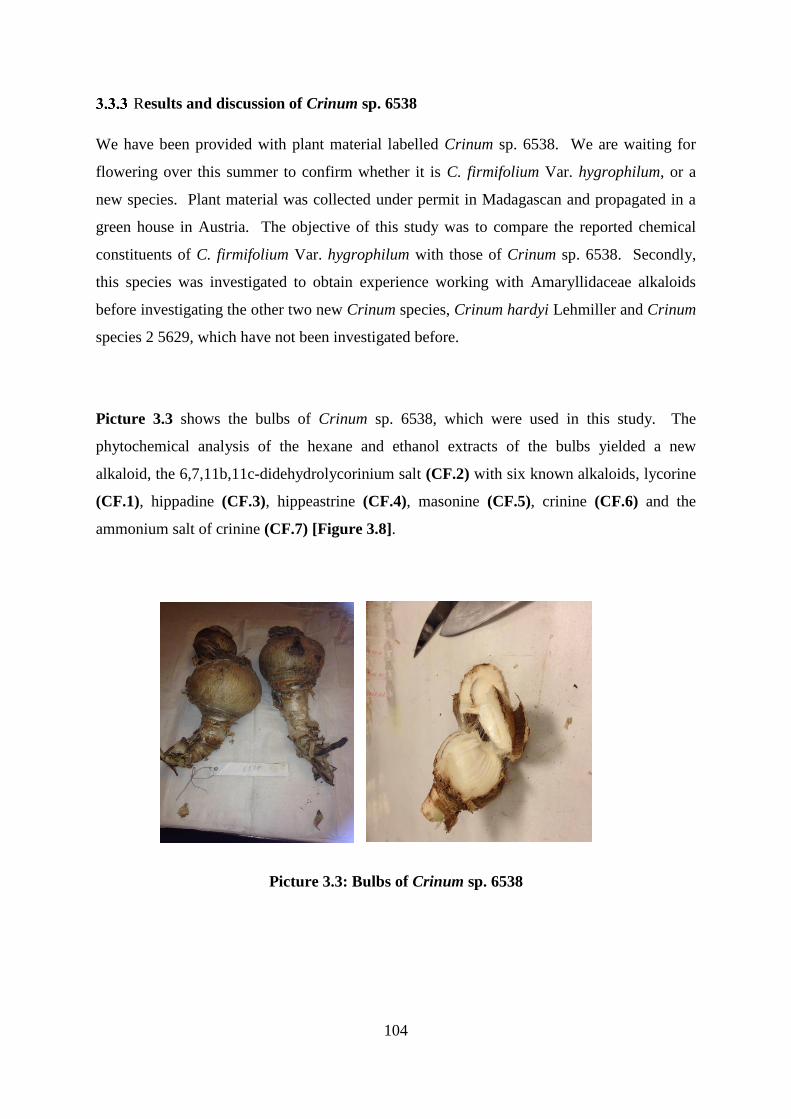
104
Results and discussion of Crinum sp. 6538
We have been provided with plant material labelled Crinum sp. 6538. We are waiting for
flowering over this summer to confirm whether it is C. firmifolium Var. hygrophilum, or a
new species. Plant material was collected under permit in Madagascan and propagated in a
green house in Austria. The objective of this study was to compare the reported chemical
constituents of C. firmifolium Var. hygrophilum with those of Crinum sp. 6538. Secondly,
this species was investigated to obtain experience working with Amaryllidaceae alkaloids
before investigating the other two new Crinum species, Crinum hardyi Lehmiller and Crinum
species 2 5629, which have not been investigated before.
Picture 3.3 shows the bulbs of Crinum sp. 6538, which were used in this study. The
phytochemical analysis of the hexane and ethanol extracts of the bulbs yielded a new
alkaloid, the 6,7,11b,11c-didehydrolycorinium salt (CF.2) with six known alkaloids, lycorine
(CF.1), hippadine (CF.3), hippeastrine (CF.4), masonine (CF.5), crinine (CF.6) and the
ammonium salt of crinine (CF.7) [Figure 3.8].
Picture 3.3: Bulbs of Crinum sp. 6538
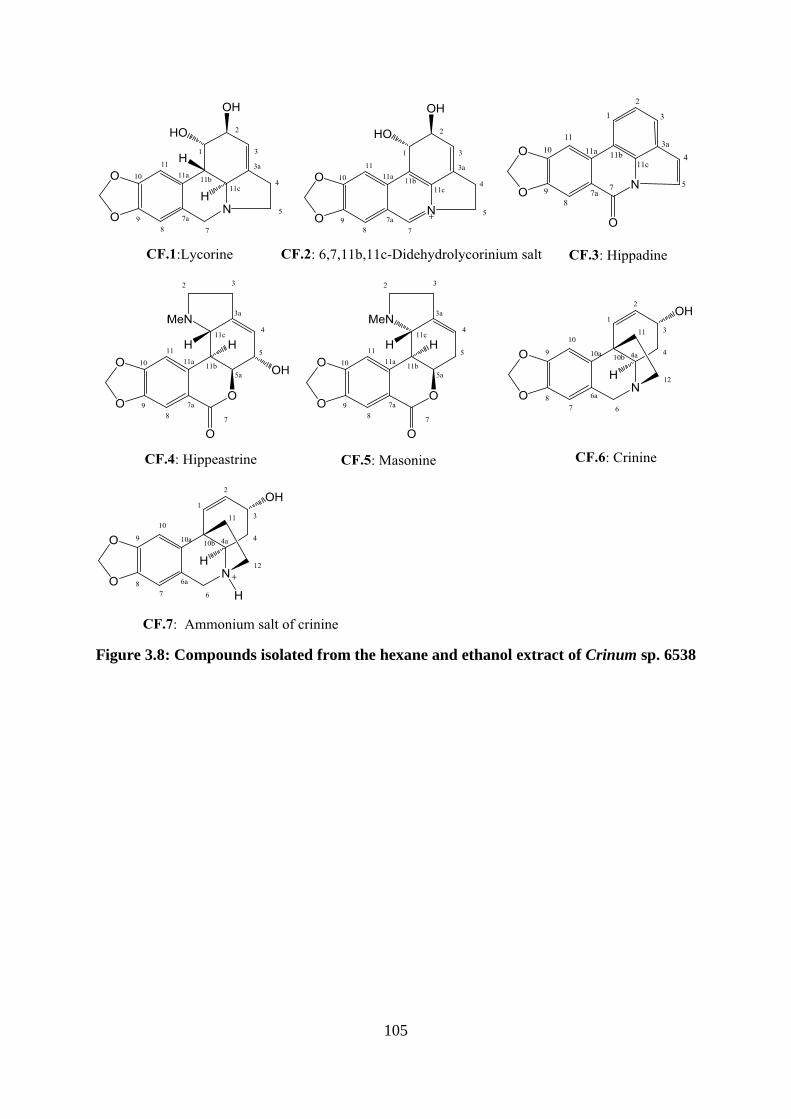
105
Figure 3.8: Compounds isolated from the hexane and ethanol extract of Crinum sp. 6538
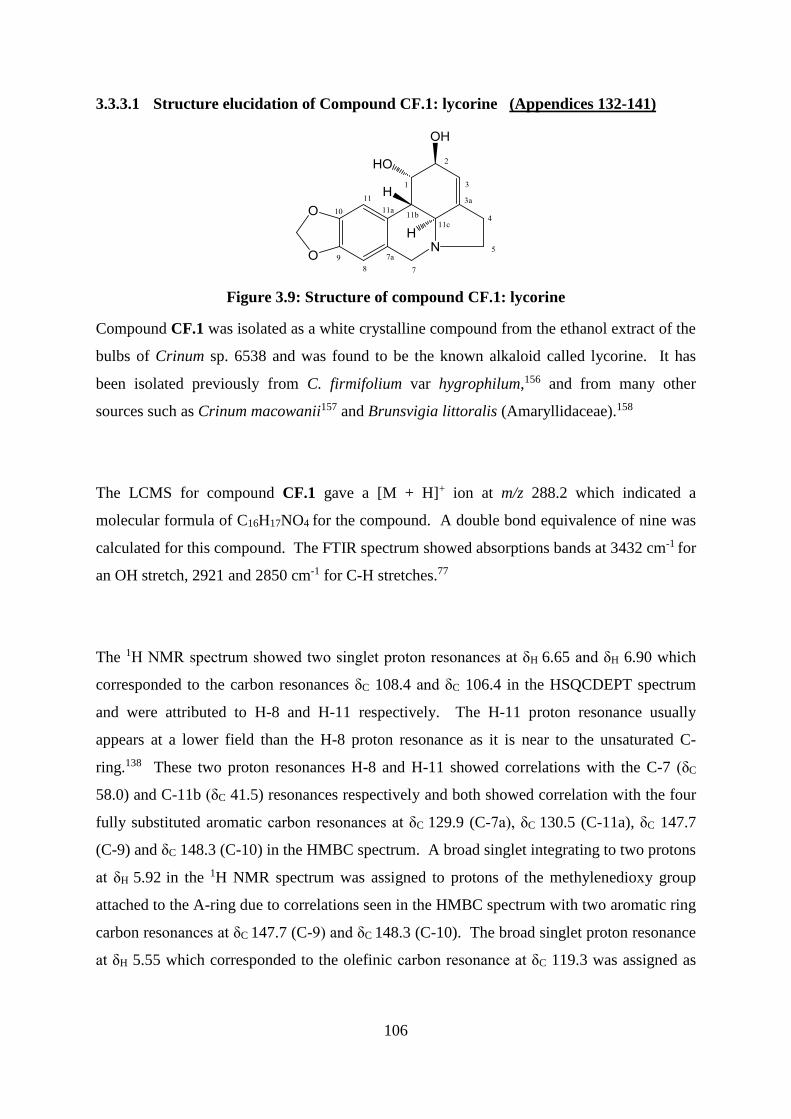
106
3.3.3.1 Structure elucidation of Compound CF.1: lycorine (Appendices 132-141)
Figure 3.9: Structure of compound CF.1: lycorine
Compound CF.1 was isolated as a white crystalline compound from the ethanol extract of the
bulbs of Crinum sp. 6538 and was found to be the known alkaloid called lycorine. It has
been isolated previously from C. firmifolium var hygrophilum,156 and from many other
sources such as Crinum macowanii157 and Brunsvigia littoralis (Amaryllidaceae).158
The LCMS for compound CF.1 gave a [M + H]+ ion at m/z 288.2 which indicated a
molecular formula of C16H17NO4 for the compound. A double bond equivalence of nine was
calculated for this compound. The FTIR spectrum showed absorptions bands at 3432 cm-1 for
an OH stretch, 2921 and 2850 cm-1 for C-H stretches.77
The 1H NMR spectrum showed two singlet proton resonances at δH 6.65 and δH 6.90 which
corresponded to the carbon resonances δC 108.4 and δC 106.4 in the HSQCDEPT spectrum
and were attributed to H-8 and H-11 respectively. The H-11 proton resonance usually
appears at a lower field than the H-8 proton resonance as it is near to the unsaturated C-
ring.138 These two proton resonances H-8 and H-11 showed correlations with the C-7 (δC
58.0) and C-11b (δC 41.5) resonances respectively and both showed correlation with the four
fully substituted aromatic carbon resonances at δC 129.9 (C-7a), δC 130.5 (C-11a), δC 147.7
(C-9) and δC 148.3 (C-10) in the HMBC spectrum. A broad singlet integrating to two protons
at δH 5.92 in the 1H NMR spectrum was assigned to protons of the methylenedioxy group
attached to the A-ring due to correlations seen in the HMBC spectrum with two aromatic ring
carbon resonances at δC 147.7 (C-9) and δC 148.3 (C-10). The broad singlet proton resonance
at δH 5.55 which corresponded to the olefinic carbon resonance at δC 119.3 was assigned as
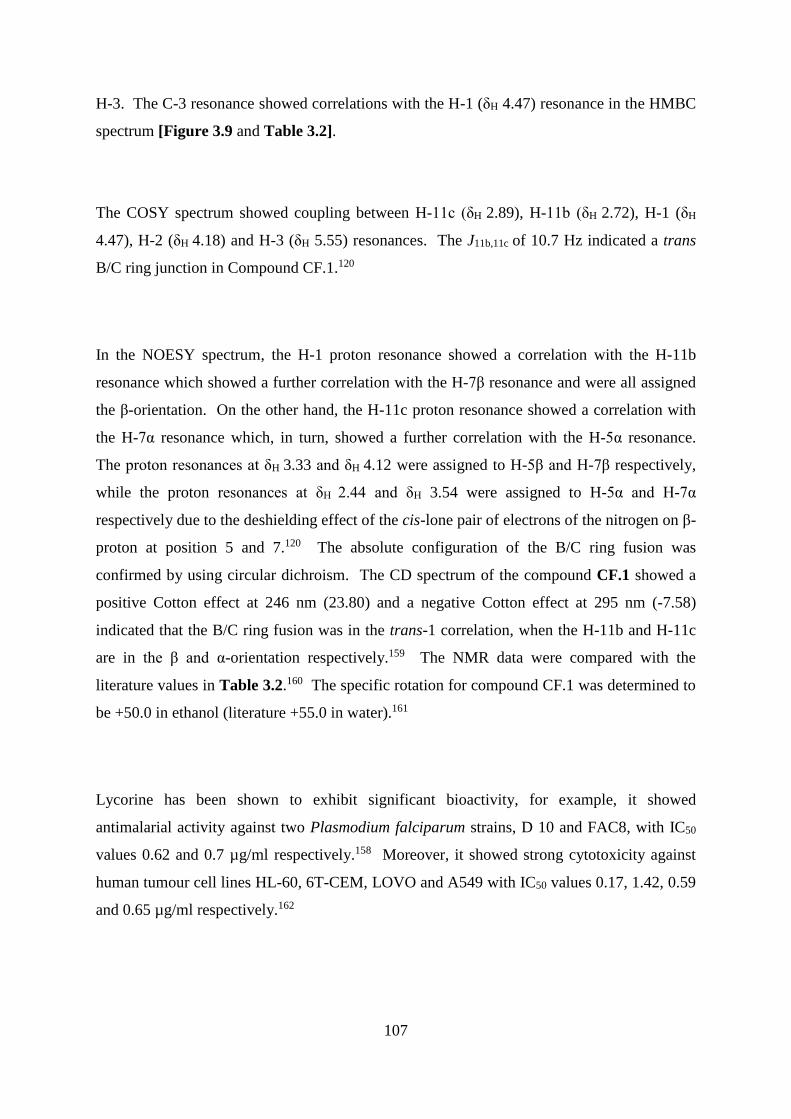
107
H-3. The C-3 resonance showed correlations with the H-1 (δH 4.47) resonance in the HMBC
spectrum [Figure 3.9 and Table 3.2].
The COSY spectrum showed coupling between H-11c (δH 2.89), H-11b (δH 2.72), H-1 (δH
4.47), H-2 (δH 4.18) and H-3 (δH 5.55) resonances. The J11b,11c of 10.7 Hz indicated a trans
B/C ring junction in Compound CF.1.120
In the NOESY spectrum, the H-1 proton resonance showed a correlation with the H-11b
resonance which showed a further correlation with the H-7β resonance and were all assigned
the β-orientation. On the other hand, the H-11c proton resonance showed a correlation with
the H-7α resonance which, in turn, showed a further correlation with the H-5α resonance.
The proton resonances at δH 3.33 and δH 4.12 were assigned to H-5β and H-7β respectively,
while the proton resonances at δH 2.44 and δH 3.54 were assigned to H-5α and H-7α
respectively due to the deshielding effect of the cis-lone pair of electrons of the nitrogen on β-
proton at position 5 and 7.120 The absolute configuration of the B/C ring fusion was
confirmed by using circular dichroism. The CD spectrum of the compound CF.1 showed a
positive Cotton effect at 246 nm (23.80) and a negative Cotton effect at 295 nm (-7.58)
indicated that the B/C ring fusion was in the trans-1 correlation, when the H-11b and H-11c
are in the β and α-orientation respectively.159 The NMR data were compared with the
literature values in Table 3.2.160 The specific rotation for compound CF.1 was determined to
be +50.0 in ethanol (literature +55.0 in water).161
Lycorine has been shown to exhibit significant bioactivity, for example, it showed
antimalarial activity against two Plasmodium falciparum strains, D 10 and FAC8, with IC50
values 0.62 and 0.7 µg/ml respectively.158 Moreover, it showed strong cytotoxicity against
human tumour cell lines HL-60, 6T-CEM, LOVO and A549 with IC50 values 0.17, 1.42, 0.59
and 0.65 µg/ml respectively.162
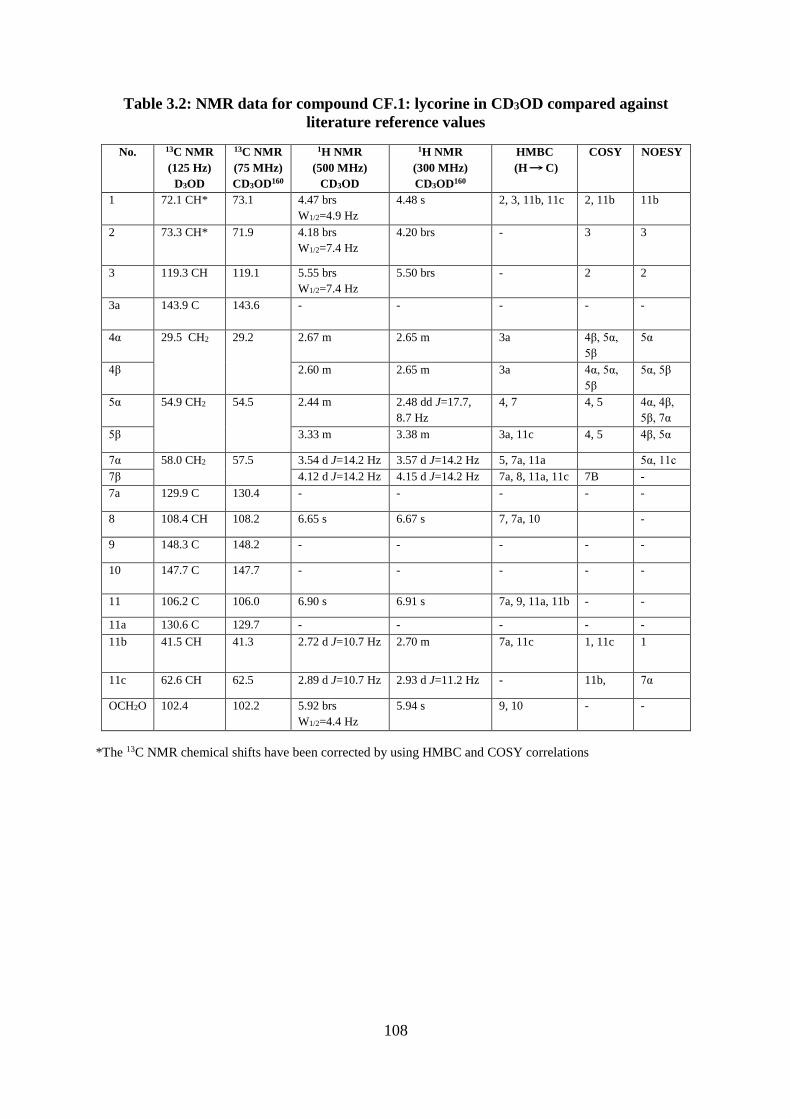
108
Table 3.2: NMR data for compound CF.1: lycorine in CD3OD compared against
literature reference values
No. 13C NMR
(125 Hz)
D3OD
13C NMR
(75 MHz)
CD3OD160
1H NMR
(500 MHz)
CD3OD
1H NMR
(300 MHz)
CD3OD160
HMBC
(H C)
COSY NOESY
1 72.1 CH* 73.1 4.47 brs
W1/2=4.9 Hz
4.48 s 2, 3, 11b, 11c 2, 11b 11b
2 73.3 CH* 71.9 4.18 brs
W1/2=7.4 Hz
4.20 brs - 3 3
3 119.3 CH 119.1 5.55 brs
W1/2=7.4 Hz
5.50 brs - 2 2
3a 143.9 C 143.6 - - - - -
4α 29.5 CH2 29.2 2.67 m 2.65 m 3a 4β, 5α,
5β
5α
4β 2.60 m 2.65 m 3a 4α, 5α,
5β
5α, 5β
5α 54.9 CH2 54.5 2.44 m 2.48 dd J=17.7,
8.7 Hz
4, 7 4, 5 4α, 4β,
5β, 7α
5β 3.33 m 3.38 m 3a, 11c 4, 5 4β, 5α
7α 58.0 CH2 57.5 3.54 d J=14.2 Hz 3.57 d J=14.2 Hz 5, 7a, 11a 5α, 11c
7β 4.12 d J=14.2 Hz 4.15 d J=14.2 Hz 7a, 8, 11a, 11c 7B -
7a 129.9 C 130.4 - - - - -
8 108.4 CH 108.2 6.65 s 6.67 s 7, 7a, 10 -
9 148.3 C 148.2 - - - - -
10 147.7 C 147.7 - - - - -
11 106.2 C 106.0 6.90 s 6.91 s 7a, 9, 11a, 11b - -
11a 130.6 C 129.7 - - - - -
11b 41.5 CH 41.3 2.72 d J=10.7 Hz 2.70 m 7a, 11c 1, 11c 1
11c 62.6 CH 62.5 2.89 d J=10.7 Hz 2.93 d J=11.2 Hz - 11b, 7α
OCH2O 102.4 102.2 5.92 brs
W1/2=4.4 Hz
5.94 s 9, 10 - -
*The 13C NMR chemical shifts have been corrected by using HMBC and COSY correlations
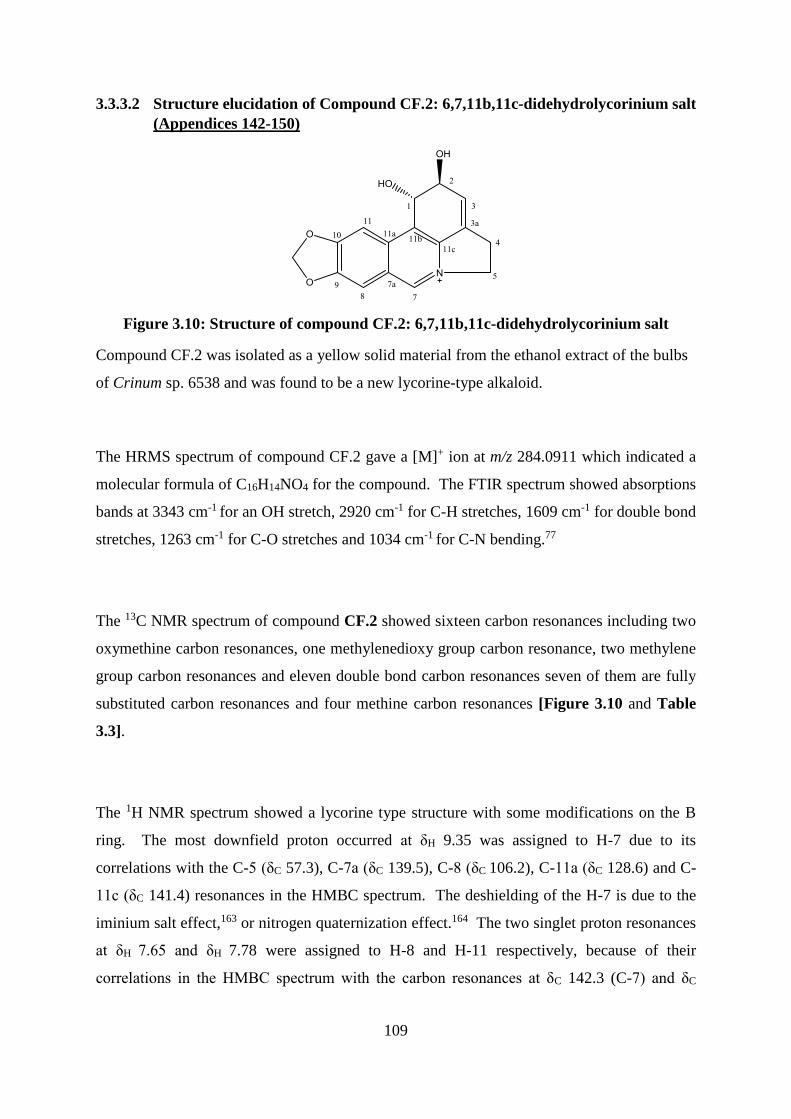
109
3.3.3.2 Structure elucidation of Compound CF.2: 6,7,11b,11c-didehydrolycorinium salt
(Appendices 142-150)
Figure 3.10: Structure of compound CF.2: 6,7,11b,11c-didehydrolycorinium salt
Compound CF.2 was isolated as a yellow solid material from the ethanol extract of the bulbs
of Crinum sp. 6538 and was found to be a new lycorine-type alkaloid.
The HRMS spectrum of compound CF.2 gave a [M]+ ion at m/z 284.0911 which indicated a
molecular formula of C16H14NO4 for the compound. The FTIR spectrum showed absorptions
bands at 3343 cm-1 for an OH stretch, 2920 cm-1 for C-H stretches, 1609 cm-1 for double bond
stretches, 1263 cm-1 for C-O stretches and 1034 cm-1 for C-N bending.77
The 13C NMR spectrum of compound CF.2 showed sixteen carbon resonances including two
oxymethine carbon resonances, one methylenedioxy group carbon resonance, two methylene
group carbon resonances and eleven double bond carbon resonances seven of them are fully
substituted carbon resonances and four methine carbon resonances [Figure 3.10 and Table
3.3].
The 1H NMR spectrum showed a lycorine type structure with some modifications on the B
ring. The most downfield proton occurred at δH 9.35 was assigned to H-7 due to its
correlations with the C-5 (δC 57.3), C-7a (δC 139.5), C-8 (δC 106.2), C-11a (δC 128.6) and C-
11c (δC 141.4) resonances in the HMBC spectrum. The deshielding of the H-7 is due to the
iminium salt effect,163 or nitrogen quaternization effect.164 The two singlet proton resonances
at δH 7.65 and δH 7.78 were assigned to H-8 and H-11 respectively, because of their
correlations in the HMBC spectrum with the carbon resonances at δC 142.3 (C-7) and δC
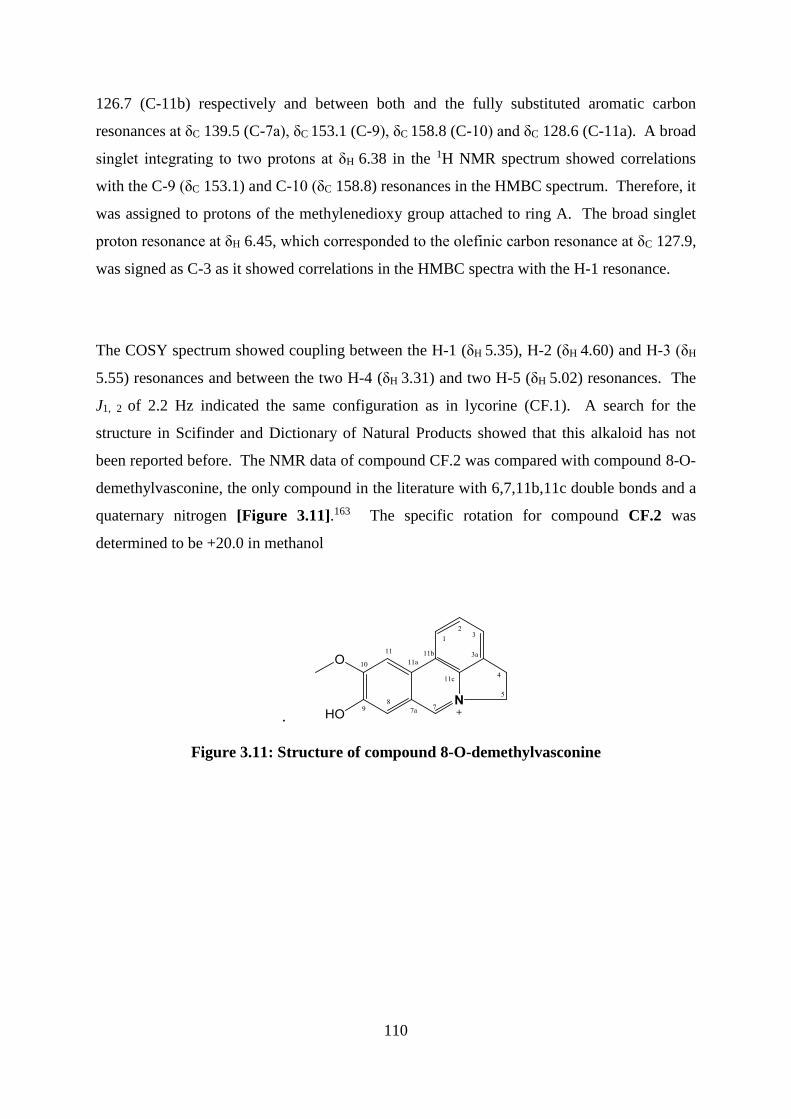
110
126.7 (C-11b) respectively and between both and the fully substituted aromatic carbon
resonances at δC 139.5 (C-7a), δC 153.1 (C-9), δC 158.8 (C-10) and δC 128.6 (C-11a). A broad
singlet integrating to two protons at δH 6.38 in the 1H NMR spectrum showed correlations
with the C-9 (δC 153.1) and C-10 (δC 158.8) resonances in the HMBC spectrum. Therefore, it
was assigned to protons of the methylenedioxy group attached to ring A. The broad singlet
proton resonance at δH 6.45, which corresponded to the olefinic carbon resonance at δC 127.9,
was signed as C-3 as it showed correlations in the HMBC spectra with the H-1 resonance.
The COSY spectrum showed coupling between the H-1 (δH 5.35), H-2 (δH 4.60) and H-3 (δH
5.55) resonances and between the two H-4 (δH 3.31) and two H-5 (δH 5.02) resonances. The
J1, 2 of 2.2 Hz indicated the same configuration as in lycorine (CF.1). A search for the
structure in Scifinder and Dictionary of Natural Products showed that this alkaloid has not
been reported before. The NMR data of compound CF.2 was compared with compound 8-O-
demethylvasconine, the only compound in the literature with 6,7,11b,11c double bonds and a
quaternary nitrogen [Figure 3.11].163 The specific rotation for compound CF.2 was
determined to be +20.0 in methanol
. 8- 8
Figure 3.11: Structure of compound 8-O-demethylvasconine
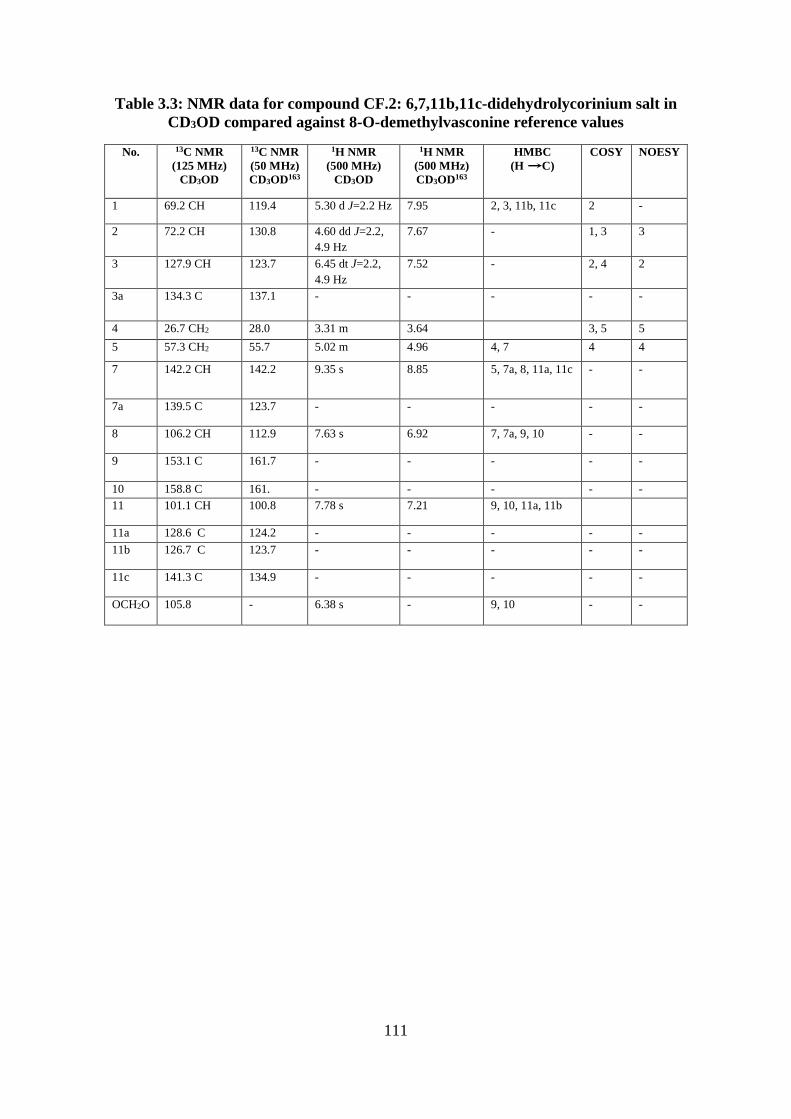
111
Table 3.3: NMR data for compound CF.2: 6,7,11b,11c-didehydrolycorinium salt in
CD3OD compared against 8-O-demethylvasconine reference values
No. 13C NMR
(125 MHz)
CD3OD
13C NMR
(50 MHz)
CD3OD163
1H NMR
(500 MHz)
CD3OD
1H NMR
(500 MHz)
CD3OD163
HMBC
(H C)
COSY NOESY
1 69.2 CH 119.4 5.30 d J=2.2 Hz 7.95 2, 3, 11b, 11c 2 -
2 72.2 CH 130.8 4.60 dd J=2.2,
4.9 Hz
7.67 - 1, 3 3
3 127.9 CH 123.7 6.45 dt J=2.2,
4.9 Hz
7.52 - 2, 4 2
3a 134.3 C 137.1 - - - - -
4 26.7 CH2 28.0 3.31 m 3.64 3, 5 5
5 57.3 CH2 55.7 5.02 m 4.96 4, 7 4 4
7 142.2 CH 142.2 9.35 s 8.85 5, 7a, 8, 11a, 11c - -
7a 139.5 C 123.7 - - - - -
8 106.2 CH 112.9 7.63 s 6.92 7, 7a, 9, 10 - -
9 153.1 C 161.7 - - - - -
10 158.8 C 161. - - - - -
11 101.1 CH 100.8 7.78 s 7.21 9, 10, 11a, 11b
11a 128.6 C 124.2 - - - - -
11b 126.7 C 123.7 - - - - -
11c 141.3 C 134.9 - - - - -
OCH2O 105.8 - 6.38 s - 9, 10 - -
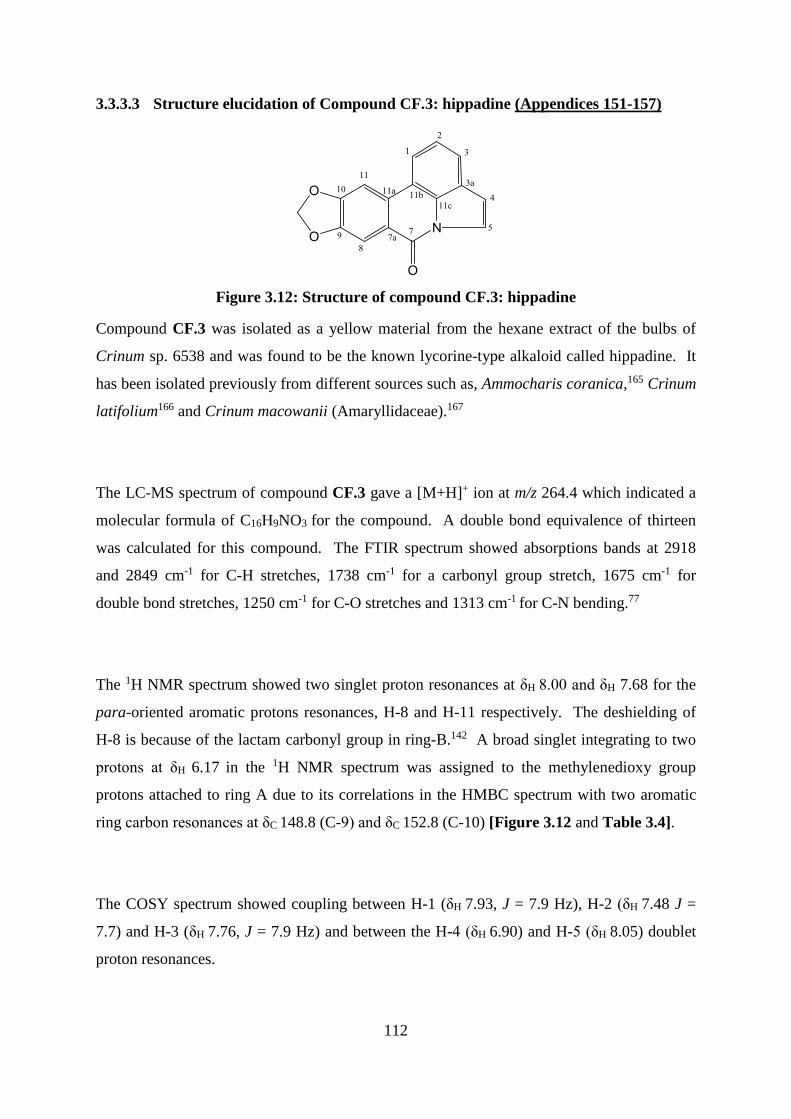
112
3.3.3.3 Structure elucidation of Compound CF.3: hippadine (Appendices 151-157)
Figure 3.12: Structure of compound CF.3: hippadine
Compound CF.3 was isolated as a yellow material from the hexane extract of the bulbs of
Crinum sp. 6538 and was found to be the known lycorine-type alkaloid called hippadine. It
has been isolated previously from different sources such as, Ammocharis coranica,165 Crinum
latifolium166 and Crinum macowanii (Amaryllidaceae).167
The LC-MS spectrum of compound CF.3 gave a [M+H]+ ion at m/z 264.4 which indicated a
molecular formula of C16H9NO3 for the compound. A double bond equivalence of thirteen
was calculated for this compound. The FTIR spectrum showed absorptions bands at 2918
and 2849 cm-1 for C-H stretches, 1738 cm-1 for a carbonyl group stretch, 1675 cm-1 for
double bond stretches, 1250 cm-1 for C-O stretches and 1313 cm-1 for C-N bending.77
The 1H NMR spectrum showed two singlet proton resonances at δH 8.00 and δH 7.68 for the
para-oriented aromatic protons resonances, H-8 and H-11 respectively. The deshielding of
H-8 is because of the lactam carbonyl group in ring-B.142 A broad singlet integrating to two
protons at δH 6.17 in the 1H NMR spectrum was assigned to the methylenedioxy group
protons attached to ring A due to its correlations in the HMBC spectrum with two aromatic
ring carbon resonances at δC 148.8 (C-9) and δC 152.8 (C-10) [Figure 3.12 and Table 3.4].
The COSY spectrum showed coupling between H-1 (δH 7.93, J = 7.9 Hz), H-2 (δH 7.48 J =
7.7) and H-3 (δH 7.76, J = 7.9 Hz) and between the H-4 (δH 6.90) and H-5 (δH 8.05) doublet
proton resonances.
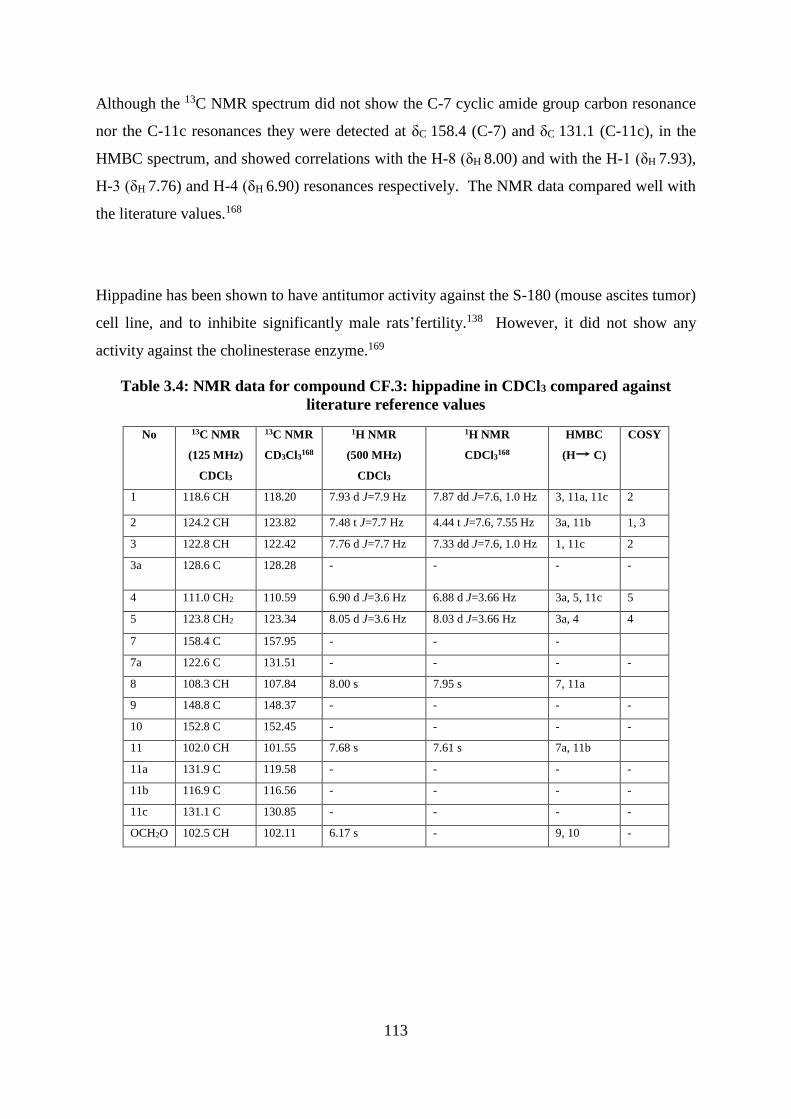
113
Although the 13C NMR spectrum did not show the C-7 cyclic amide group carbon resonance
nor the C-11c resonances they were detected at δC 158.4 (C-7) and δC 131.1 (C-11c), in the
HMBC spectrum, and showed correlations with the H-8 (δH 8.00) and with the H-1 (δH 7.93),
H-3 (δH 7.76) and H-4 (δH 6.90) resonances respectively. The NMR data compared well with
the literature values.168
Hippadine has been shown to have antitumor activity against the S-180 (mouse ascites tumor)
cell line, and to inhibite significantly male rats’fertility.138 However, it did not show any
activity against the cholinesterase enzyme.169
Table 3.4: NMR data for compound CF.3: hippadine in CDCl3 compared against
literature reference values
No 13C NMR
(125 MHz)
CDCl3
13C NMR
CD3Cl3168
1H NMR
(500 MHz)
CDCl3
1H NMR
CDCl3168
HMBC
(H C)
COSY
1 118.6 CH 118.20 7.93 d J=7.9 Hz 7.87 dd J=7.6, 1.0 Hz 3, 11a, 11c 2
2 124.2 CH 123.82 7.48 t J=7.7 Hz 4.44 t J=7.6, 7.55 Hz 3a, 11b 1, 3
3 122.8 CH 122.42 7.76 d J=7.7 Hz 7.33 dd J=7.6, 1.0 Hz 1, 11c 2
3a 128.6 C 128.28 - - - -
4 111.0 CH2 110.59 6.90 d J=3.6 Hz 6.88 d J=3.66 Hz 3a, 5, 11c 5
5 123.8 CH2 123.34 8.05 d J=3.6 Hz 8.03 d J=3.66 Hz 3a, 4 4
7 158.4 C 157.95 - - -
7a 122.6 C 131.51 - - - -
8 108.3 CH 107.84 8.00 s 7.95 s 7, 11a
9 148.8 C 148.37 - - - -
10 152.8 C 152.45 - - - -
11 102.0 CH 101.55 7.68 s 7.61 s 7a, 11b
11a 131.9 C 119.58 - - - -
11b 116.9 C 116.56 - - - -
11c 131.1 C 130.85 - - - -
OCH2O 102.5 CH 102.11 6.17 s - 9, 10 -
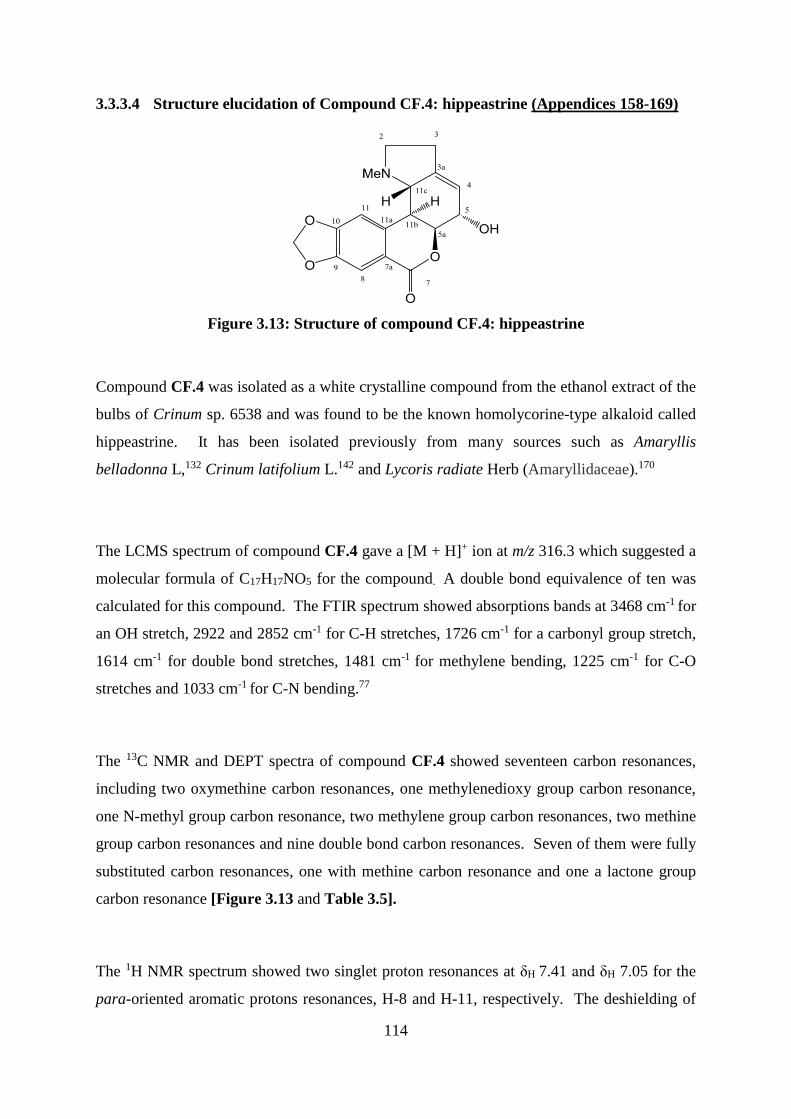
114
3.3.3.4 Structure elucidation of Compound CF.4: hippeastrine (Appendices 158-169)
Figure 3.13: Structure of compound CF.4: hippeastrine
Compound CF.4 was isolated as a white crystalline compound from the ethanol extract of the
bulbs of Crinum sp. 6538 and was found to be the known homolycorine-type alkaloid called
hippeastrine. It has been isolated previously from many sources such as Amaryllis
belladonna L,132 Crinum latifolium L.142 and Lycoris radiate Herb (Amaryllidaceae).170
The LCMS spectrum of compound CF.4 gave a [M + H]+ ion at m/z 316.3 which suggested a
molecular formula of C17H17NO5 for the compound. A double bond equivalence of ten was
calculated for this compound. The FTIR spectrum showed absorptions bands at 3468 cm-1 for
an OH stretch, 2922 and 2852 cm-1 for C-H stretches, 1726 cm-1 for a carbonyl group stretch,
1614 cm-1 for double bond stretches, 1481 cm-1 for methylene bending, 1225 cm-1 for C-O
stretches and 1033 cm-1 for C-N bending.77
The 13C NMR and DEPT spectra of compound CF.4 showed seventeen carbon resonances,
including two oxymethine carbon resonances, one methylenedioxy group carbon resonance,
one N-methyl group carbon resonance, two methylene group carbon resonances, two methine
group carbon resonances and nine double bond carbon resonances. Seven of them were fully
substituted carbon resonances, one with methine carbon resonance and one a lactone group
carbon resonance [Figure 3.13 and Table 3.5].
The 1H NMR spectrum showed two singlet proton resonances at δH 7.41 and δH 7.05 for the
para-oriented aromatic protons resonances, H-8 and H-11, respectively. The deshielding of
115
H-8 is because of the lactone carbonyl group in ring-B.142 A broad singlet integrating to two
protons at δH 6.12 in the 1H NMR spectrum was assigned to the methylenedioxy group proton
resonances attached to ring A, due to its correlations in the HMBC spectrum with aromatic
ring carbon resonances at δC 149.8 (C-9) and δC 154.0 (C-10).
The lactone group carbon resonance at δC 166.7 was assigned to C-7 as it showed correlation
in the HMBC spectrum with the H-8 (δH 7.41) proton resonance. The oxymethine proton
resonance at δH 4.58 (H-5a) showed correlations with the olefinic carbon resonance at δC
120.4 (C-4), oxymethine carbon resonance at δC 68.1 (C-5) and methine carbon resonance at
δC 68.3 (C-11c) in the HMBC spectrum. The double bond carbon resonances at δC 145.4 and
δC 120.4 were assigned as C-3a and C-4 respectively as they showed correlations with the H-
2 (δH 3.19) and H-5a (δH 4.58) proton resonances in the HMBC spectrum. The N-methyl
proton resonance showed HMBC correlations with the C-2 (δC 57.3) and C-11c (δC 68.5)
carbon resonances.
The COSY spectrum showed coupling between H-11c (δH 2.63), H-11b (δH 2.88), H-5a (δH
4.58), H-5 (δH 4.27) and H-4 (δH 6.68) resonances, and between the 2H-2 (δH 3.26 and δH
2.37) and 2H-3 (δH 2.60) resonances.
The large coupling constant between the H-11b and H-11c proton resonance (J=9.6 Hz)
confirmed a trans-diaxial relationship.120 Moreover, the small coupling constant between H-
11b and H-5a (J = 2.2 Hz) and a NOESY correlation seen between them, confirmed a cis B/C
ring junction in compound CF.4.120 The proton resonances at δH 3.19 and δH 2.33 were
assigned to H-2α and H-2β respectively due to the deshielding effect of the cis-lone pair of
electrons of the nitrogen on H-2α.120 Although the substituent at position 5 is usually in the
α-position,120 the NOESY spectrum did not show any correlation between the H-5 and H-11c
resonances. Therefore, compound CF.4 was acetylated. The 1H NMR spectrum of the
hippeastrine acetate showed a downfield shift of H-5 from to δH 4.39 to δH 5.44 in CDCl3 and
the appearance of the acetate methyl group proton resonance δH 2.06. However, no
correlation between H-5 and H-11c of the acetate was observed in the ROESY spectrum.
116
This absolute configuration of B/C ring had to be confirmed by using circular dichroism. The
CD spectrum of the compound CF.4 showed positive Cotton effects at 254 nm (26.51) and
302 nm (0.41) and negative Cotton effects at 232 nm (-120.74) and 275 (-98.54) indicated
that the B:C ring fusion was in the cis-3 configuration, when the H-5a and H-11b are in the α-
orientation.159,142 In order to confirm the CF.4 assignment the 1H NMR and 13C NMR
spectrum were rerun in CDCl3 to compare with literature data of hippeastrine and it was
found comparable.171 The specific rotation for acetylated compound CF.4 was determined to
be +140.0 in chloroform (the literature value is +142.0 in ethanol).171
Previous research showed that hippeastrine showed antifungal activity against Candida
albicans with a MIC value 25 µg/ml.132 However, it did not show any significant inhibition
of acetylcholinesterase (AChE) in vitro.172
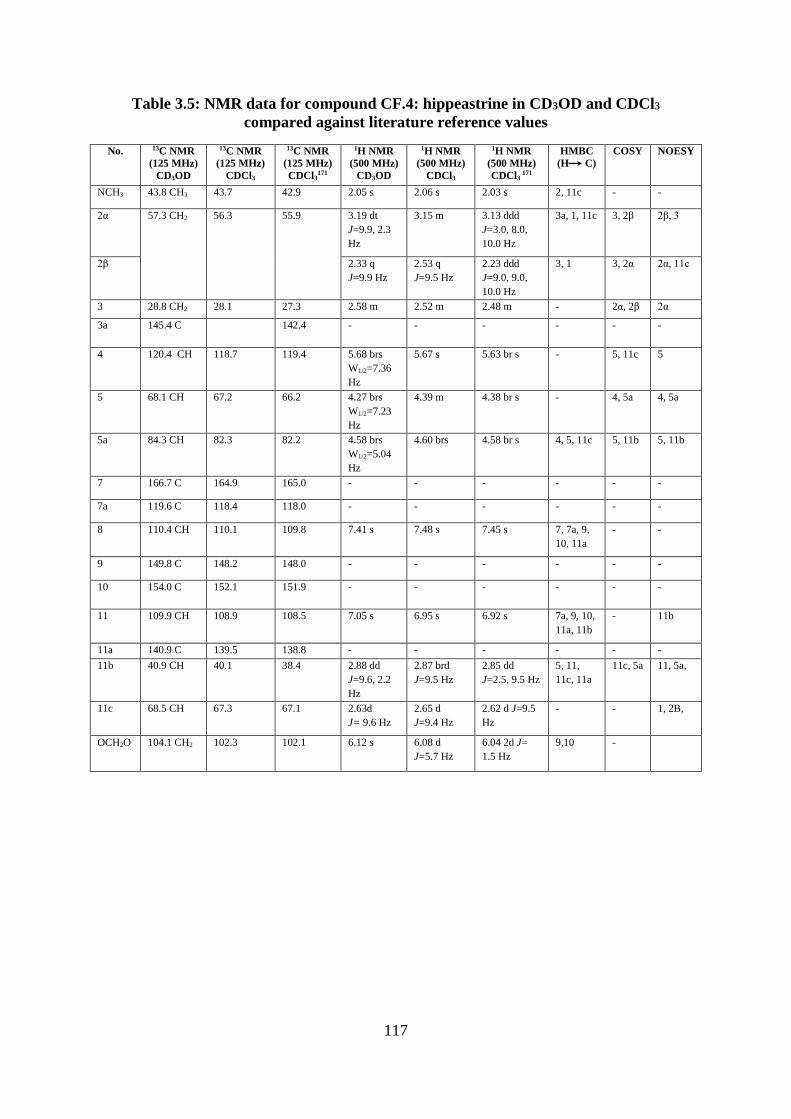
117
Table 3.5: NMR data for compound CF.4: hippeastrine in CD3OD and CDCl3
compared against literature reference values
No. 13C NMR
(125 MHz)
CD3OD
13C NMR
(125 MHz)
CDCl3
13C NMR
(125 MHz)
CDCl3171
1H NMR
(500 MHz)
CD3OD
1H NMR
(500 MHz)
CDCl3
1H NMR
(500 MHz)
CDCl3 171
HMBC
(H C)
COSY NOESY
NCH3 43.8 CH3 43.7 42.9 2.05 s 2.06 s 2.03 s 2, 11c - -
2α 57.3 CH2 56.3 55.9 3.19 dt
J=9.9, 2.3
Hz
3.15 m 3.13 ddd
J=3.0, 8.0,
10.0 Hz
3a, 1, 11c 3, 2β 2β, 3
2β 2.33 q
J=9.9 Hz
2.53 q
J=9.5 Hz
2.23 ddd
J=9.0, 9.0,
10.0 Hz
3, 1 3, 2α 2α, 11c
3 28.8 CH2 28.1 27.3 2.58 m 2.52 m 2.48 m - 2α, 2β 2α
3a 145.4 C 142.4 - - - - - -
4 120.4 CH 118.7 119.4 5.68 brs
W1/2=7.36
Hz
5.67 s 5.63 br s - 5, 11c 5
5 68.1 CH 67.2 66.2 4.27 brs
W1/2=7.23
Hz
4.39 m 4.38 br s - 4, 5a 4, 5a
5a 84.3 CH 82.3 82.2 4.58 brs
W1/2=5.04
Hz
4.60 brs 4.58 br s 4, 5, 11c 5, 11b 5, 11b
7 166.7 C 164.9 165.0 - - - - - -
7a 119.6 C 118.4 118.0 - - - - - -
8 110.4 CH 110.1 109.8 7.41 s 7.48 s 7.45 s 7, 7a, 9,
10, 11a
- -
9 149.8 C 148.2 148.0 - - - - - -
10 154.0 C 152.1 151.9 - - - - - -
11 109.9 CH 108.9 108.5 7.05 s 6.95 s 6.92 s 7a, 9, 10,
11a, 11b
- 11b
11a 140.9 C 139.5 138.8 - - - - - -
11b 40.9 CH 40.1 38.4 2.88 dd
J=9.6, 2.2
Hz
2.87 brd
J=9.5 Hz
2.85 dd
J=2.5, 9.5 Hz
5, 11,
11c, 11a
11c, 5a 11, 5a,
11c 68.5 CH 67.3 67.1 2.63d
J= 9.6 Hz
2.65 d
J=9.4 Hz
2.62 d J=9.5
Hz
- - 1, 2B,
OCH2O 104.1 CH2 102.3 102.1 6.12 s 6.08 d
J=5.7 Hz
6.04 2d J=
1.5 Hz
9,10 -
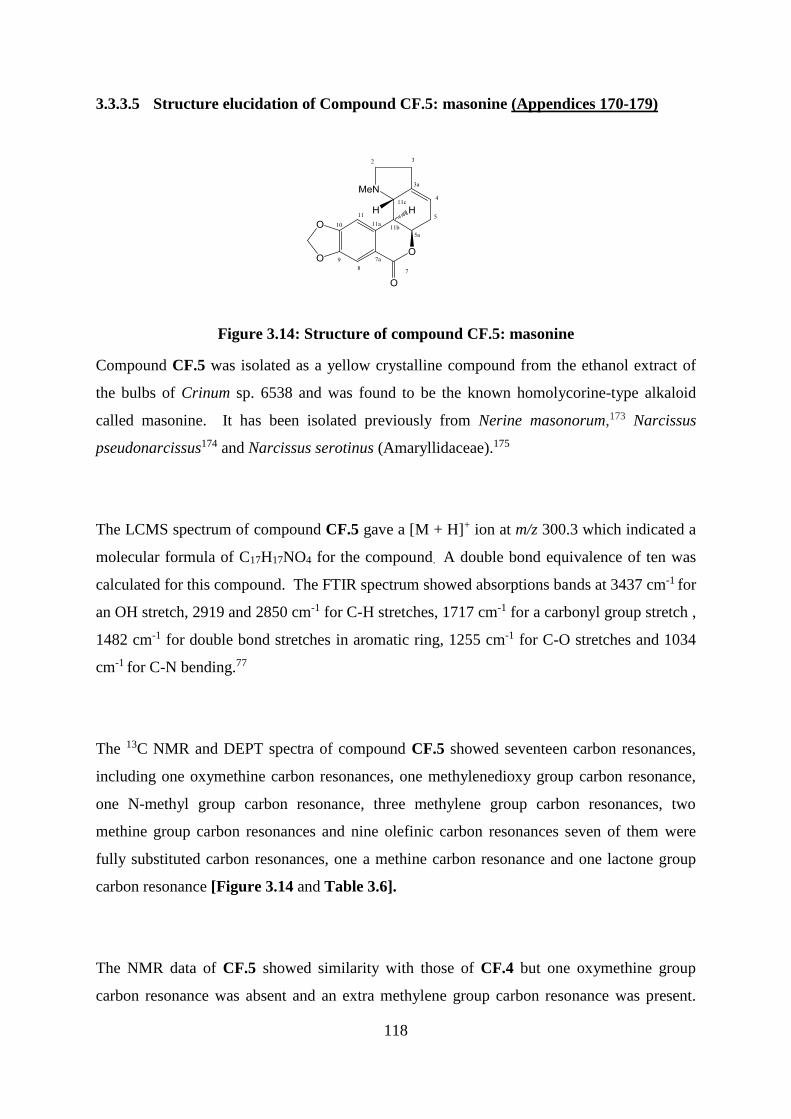
118
3.3.3.5 Structure elucidation of Compound CF.5: masonine (Appendices 170-179)
Figure 3.14: Structure of compound CF.5: masonine
Compound CF.5 was isolated as a yellow crystalline compound from the ethanol extract of
the bulbs of Crinum sp. 6538 and was found to be the known homolycorine-type alkaloid
called masonine. It has been isolated previously from Nerine masonorum,173 Narcissus
pseudonarcissus174 and Narcissus serotinus (Amaryllidaceae).175
The LCMS spectrum of compound CF.5 gave a [M + H]+ ion at m/z 300.3 which indicated a
molecular formula of C17H17NO4 for the compound. A double bond equivalence of ten was
calculated for this compound. The FTIR spectrum showed absorptions bands at 3437 cm-1 for
an OH stretch, 2919 and 2850 cm-1 for C-H stretches, 1717 cm-1 for a carbonyl group stretch ,
1482 cm-1 for double bond stretches in aromatic ring, 1255 cm-1 for C-O stretches and 1034
cm-1 for C-N bending.77
The 13C NMR and DEPT spectra of compound CF.5 showed seventeen carbon resonances,
including one oxymethine carbon resonances, one methylenedioxy group carbon resonance,
one N-methyl group carbon resonance, three methylene group carbon resonances, two
methine group carbon resonances and nine olefinic carbon resonances seven of them were
fully substituted carbon resonances, one a methine carbon resonance and one lactone group
carbon resonance [Figure 3.14 and Table 3.6].
The NMR data of CF.5 showed similarity with those of CF.4 but one oxymethine group
carbon resonance was absent and an extra methylene group carbon resonance was present.
119
The extra methylene carbon resonance at δC 32.2 was assigned as C-5 due to coupling seen in
the COSY spectrum between H-11c (δH 2.71), H-11b (δH 2.75), H-5a (δH 4.83), 2H-5 (δH 2.68
and 2.51) and the H-4 (δH 5.58) proton resonances.
In the NOESY spectrum, the correlation between the H-11b and H-5a resonance confirmed a
cis B/C ring junction in compound CF.5. The proton resonances at δH 3.17 and δH 2.32 were
assigned to H-2α and H-2β respectively due to the deshielding effect of the cis-lone pair of
electrons of the nitrogen on the H-2α.120 The 2H-5 resonances could be distinguished as the
H-5β (δH 2.51) showed a correlation in the NOESY spectrum with the H-11c (δH 2.71) proton
resonance. The absolute configuration of B/C ring fusion was confirmed using circular
dichroism. The CD spectrum of the compound CF.5 showed a positive Cotton effect at 255
nm (56.85) and 312 nm (11.85) and negative Cotton effect at 230 nm (-110.98) and 276 (-
62.06) indicating that the B/C ring fusion was cis-3 configuration, when the H-5a and H-11b
are in the α-orientation.159 The specific rotation for acetylated compound CF.5 was
determined to be +50.0 in methanol (literature is +55.6 in chloroform).174
Literature values for the NMR data were reported in CDCl3 but we found that CF.5 did not
dissolve completely in the solvent. However, values are still comparable [Table 3.6].174
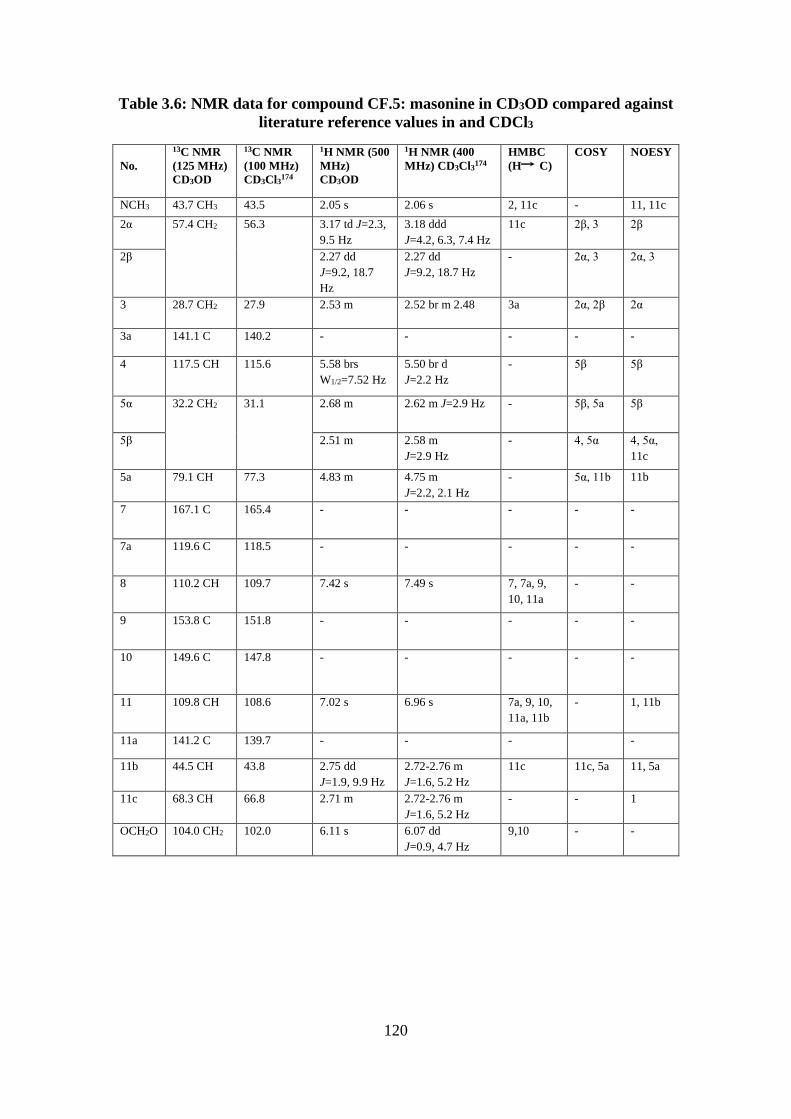
120
Table 3.6: NMR data for compound CF.5: masonine in CD3OD compared against
literature reference values in and CDCl3
No.
13C NMR
(125 MHz)
CD3OD
13C NMR
(100 MHz)
CD3Cl3174
1H NMR (500
MHz)
CD3OD
1H NMR (400
MHz) CD3Cl3174
HMBC
(H C)
COSY NOESY
NCH3 43.7 CH3 43.5 2.05 s 2.06 s 2, 11c - 11, 11c
2α 57.4 CH2 56.3 3.17 td J=2.3,
9.5 Hz
3.18 ddd
J=4.2, 6.3, 7.4 Hz
11c 2β, 3 2β
2β 2.27 dd
J=9.2, 18.7
Hz
2.27 dd
J=9.2, 18.7 Hz
- 2α, 3 2α, 3
3 28.7 CH2 27.9 2.53 m 2.52 br m 2.48 3a 2α, 2β 2α
3a 141.1 C 140.2 - - - - -
4 117.5 CH 115.6 5.58 brs
W1/2=7.52 Hz
5.50 br d
J=2.2 Hz
- 5β 5β
5α 32.2 CH2 31.1 2.68 m 2.62 m J=2.9 Hz
- 5β, 5a 5β
5β 2.51 m 2.58 m
J=2.9 Hz
- 4, 5α 4, 5α,
11c
5a 79.1 CH 77.3 4.83 m 4.75 m
J=2.2, 2.1 Hz
- 5α, 11b 11b
7 167.1 C 165.4 - - - - -
7a 119.6 C 118.5 - - - - -
8 110.2 CH 109.7 7.42 s 7.49 s 7, 7a, 9,
10, 11a
- -
9 153.8 C 151.8 - - - - -
10 149.6 C 147.8 - - - - -
11 109.8 CH 108.6 7.02 s 6.96 s 7a, 9, 10,
11a, 11b
- 1, 11b
11a 141.2 C 139.7 - - - -
11b 44.5 CH 43.8 2.75 dd
J=1.9, 9.9 Hz
2.72-2.76 m
J=1.6, 5.2 Hz
11c 11c, 5a 11, 5a
11c 68.3 CH 66.8 2.71 m 2.72-2.76 m
J=1.6, 5.2 Hz
- - 1
OCH2O 104.0 CH2 102.0 6.11 s 6.07 dd
J=0.9, 4.7 Hz
9,10 - -
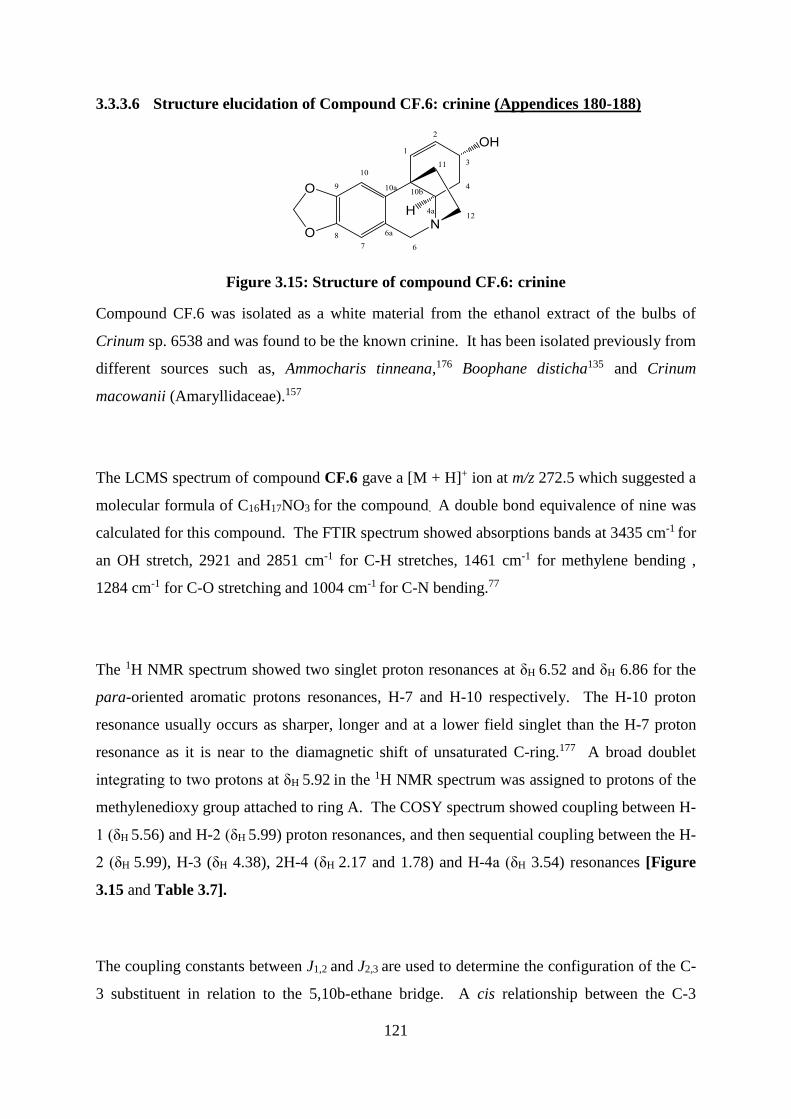
121
3.3.3.6 Structure elucidation of Compound CF.6: crinine (Appendices 180-188)
Figure 3.15: Structure of compound CF.6: crinine
Compound CF.6 was isolated as a white material from the ethanol extract of the bulbs of
Crinum sp. 6538 and was found to be the known crinine. It has been isolated previously from
different sources such as, Ammocharis tinneana,176 Boophane disticha135 and Crinum
macowanii (Amaryllidaceae).157
The LCMS spectrum of compound CF.6 gave a [M + H]+ ion at m/z 272.5 which suggested a
molecular formula of C16H17NO3 for the compound. A double bond equivalence of nine was
calculated for this compound. The FTIR spectrum showed absorptions bands at 3435 cm-1 for
an OH stretch, 2921 and 2851 cm-1 for C-H stretches, 1461 cm-1 for methylene bending ,
1284 cm-1 for C-O stretching and 1004 cm-1 for C-N bending.77
The 1H NMR spectrum showed two singlet proton resonances at δH 6.52 and δH 6.86 for the
para-oriented aromatic protons resonances, H-7 and H-10 respectively. The H-10 proton
resonance usually occurs as sharper, longer and at a lower field singlet than the H-7 proton
resonance as it is near to the diamagnetic shift of unsaturated C-ring.177 A broad doublet
integrating to two protons at δH 5.92 in the 1H NMR spectrum was assigned to protons of the
methylenedioxy group attached to ring A. The COSY spectrum showed coupling between H-
1 (δH 5.56) and H-2 (δH 5.99) proton resonances, and then sequential coupling between the H-
2 (δH 5.99), H-3 (δH 4.38), 2H-4 (δH 2.17 and 1.78) and H-4a (δH 3.54) resonances [Figure
3.15 and Table 3.7].
The coupling constants between J1,2 and J2,3 are used to determine the configuration of the C-
3 substituent in relation to the 5,10b-ethane bridge. A cis relationship between the C-3
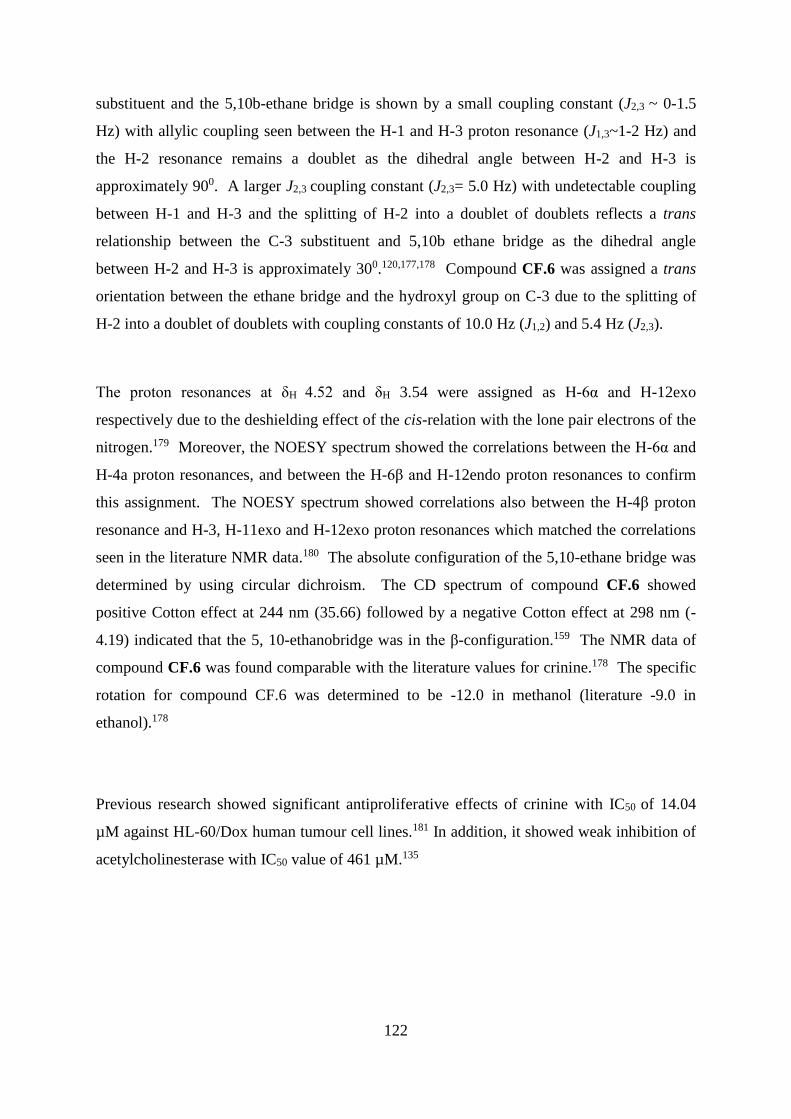
122
substituent and the 5,10b-ethane bridge is shown by a small coupling constant (J2,3 ~ 0-1.5
Hz) with allylic coupling seen between the H-1 and H-3 proton resonance (J1,3~1-2 Hz) and
the H-2 resonance remains a doublet as the dihedral angle between H-2 and H-3 is
approximately 900. A larger J2,3 coupling constant (J2,3= 5.0 Hz) with undetectable coupling
between H-1 and H-3 and the splitting of H-2 into a doublet of doublets reflects a trans
relationship between the C-3 substituent and 5,10b ethane bridge as the dihedral angle
between H-2 and H-3 is approximately 300.120,177,178 Compound CF.6 was assigned a trans
orientation between the ethane bridge and the hydroxyl group on C-3 due to the splitting of
H-2 into a doublet of doublets with coupling constants of 10.0 Hz (J1,2) and 5.4 Hz (J2,3).
The proton resonances at δH 4.52 and δH 3.54 were assigned as H-6α and H-12exo
respectively due to the deshielding effect of the cis-relation with the lone pair electrons of the
nitrogen.179 Moreover, the NOESY spectrum showed the correlations between the H-6α and
H-4a proton resonances, and between the H-6β and H-12endo proton resonances to confirm
this assignment. The NOESY spectrum showed correlations also between the H-4β proton
resonance and H-3, H-11exo and H-12exo proton resonances which matched the correlations
seen in the literature NMR data.180 The absolute configuration of the 5,10-ethane bridge was
determined by using circular dichroism. The CD spectrum of compound CF.6 showed
positive Cotton effect at 244 nm (35.66) followed by a negative Cotton effect at 298 nm (-
4.19) indicated that the 5, 10-ethanobridge was in the β-configuration.159 The NMR data of
compound CF.6 was found comparable with the literature values for crinine.178 The specific
rotation for compound CF.6 was determined to be -12.0 in methanol (literature -9.0 in
ethanol).178
Previous research showed significant antiproliferative effects of crinine with IC50 of 14.04
µM against HL-60/Dox human tumour cell lines.181 In addition, it showed weak inhibition of
acetylcholinesterase with IC50 value of 461 µM.135
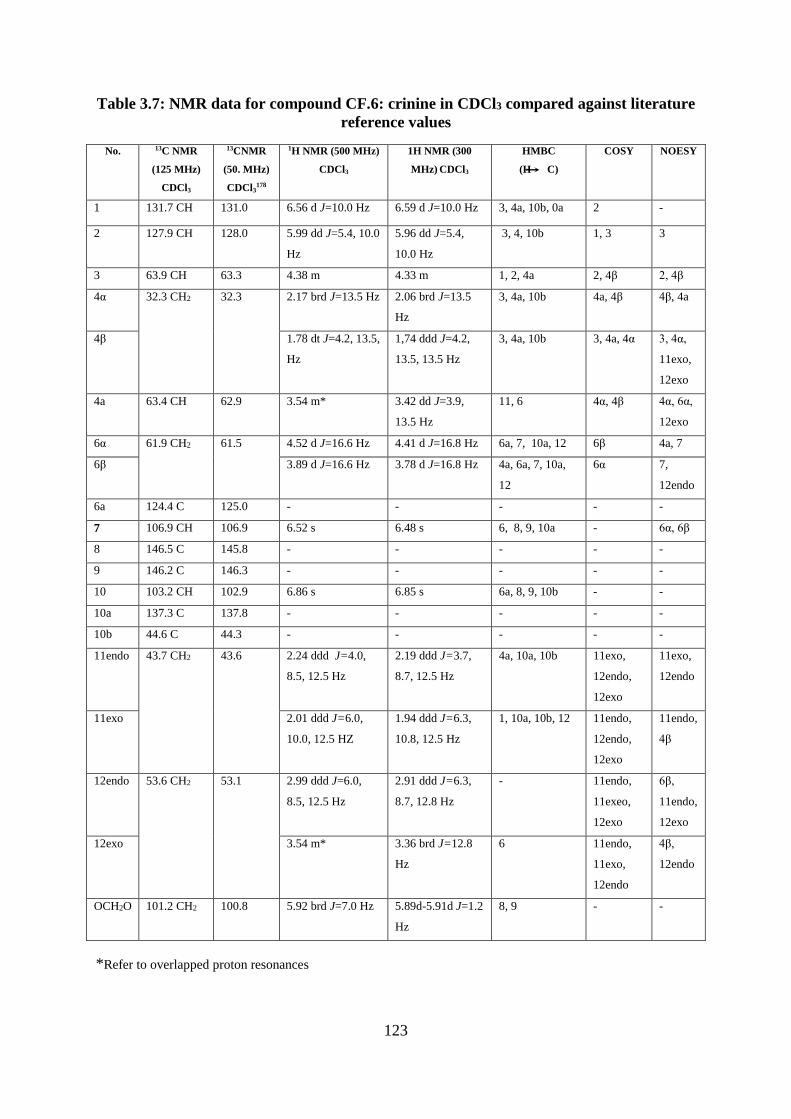
123
Table 3.7: NMR data for compound CF.6: crinine in CDCl3 compared against literature
reference values
No. 13C NMR
(125 MHz)
CDCl3
13CNMR
(50. MHz)
CDCl3178
1H NMR (500 MHz)
CDCl3
1H NMR (300
MHz) CDCl3
HMBC
(H C)
COSY NOESY
1 131.7 CH 131.0 6.56 d J=10.0 Hz 6.59 d J=10.0 Hz 3, 4a, 10b, 0a 2 -
2 127.9 CH 128.0 5.99 dd J=5.4, 10.0
Hz
5.96 dd J=5.4,
10.0 Hz
3, 4, 10b 1, 3 3
3 63.9 CH 63.3 4.38 m 4.33 m 1, 2, 4a 2, 4β 2, 4β
4α 32.3 CH2 32.3 2.17 brd J=13.5 Hz 2.06 brd J=13.5
Hz
3, 4a, 10b 4a, 4β 4β, 4a
4β 1.78 dt J=4.2, 13.5,
Hz
1,74 ddd J=4.2,
13.5, 13.5 Hz
3, 4a, 10b 3, 4a, 4α 3, 4α,
11exo,
12exo
4a 63.4 CH 62.9 3.54 m* 3.42 dd J=3.9,
13.5 Hz
11, 6 4α, 4β 4α, 6α,
12exo
6α 61.9 CH2 61.5 4.52 d J=16.6 Hz 4.41 d J=16.8 Hz 6a, 7, 10a, 12 6β 4a, 7
6β 3.89 d J=16.6 Hz 3.78 d J=16.8 Hz 4a, 6a, 7, 10a,
12
6α 7,
12endo
6a 124.4 C 125.0 - - - - -
7 106.9 CH 106.9 6.52 s 6.48 s 6, 8, 9, 10a - 6α, 6β
8 146.5 C 145.8 - - - - -
9 146.2 C 146.3 - - - - -
10 103.2 CH 102.9 6.86 s 6.85 s 6a, 8, 9, 10b - -
10a 137.3 C 137.8 - - - - -
10b 44.6 C 44.3 - - - - -
11endo 43.7 CH2 43.6 2.24 ddd J=4.0,
8.5, 12.5 Hz
2.19 ddd J=3.7,
8.7, 12.5 Hz
4a, 10a, 10b 11exo,
12endo,
12exo
11exo,
12endo
11exo 2.01 ddd J=6.0,
10.0, 12.5 HZ
1.94 ddd J=6.3,
10.8, 12.5 Hz
1, 10a, 10b, 12 11endo,
12endo,
12exo
11endo,
4β
12endo 53.6 CH2 53.1 2.99 ddd J=6.0,
8.5, 12.5 Hz
2.91 ddd J=6.3,
8.7, 12.8 Hz
- 11endo,
11exeo,
12exo
6β,
11endo,
12exo
12exo 3.54 m* 3.36 brd J=12.8
Hz
6 11endo,
11exo,
12endo
4β,
12endo
OCH2O 101.2 CH2 100.8 5.92 brd J=7.0 Hz 5.89d-5.91d J=1.2
Hz
8, 9 - -
*Refer to overlapped proton resonances
124
3.3.3.7 Structure elucidation of Compound CF.7: the ammonium salt of crinine
(Appendices 189-199)
Figure 3.16: Structure of compound CF.7: the ammonium salt of crinine
Compound CF.7 was isolated as a yellow powder from the ethanol extract of the bulbs of
Crinum sp. 6538 and was found to be the ammonium salt of crinine. Compound CF.7 has not
been reported previously, although the isolation of salt is determined by the extraction
procedure used.
The LCMS spectrum of compound CF.7 gave a [M]+ ion at m/z 272.3 which suggested a
molecular formula of C16H18NO3+ for the protonated alkaloid. The mass spectrum was
consistent with an alkaloid of the crinine type.178
The 1H NMR spectrum showed the two aromatic proton resonance at δH 6.55 and δH 6.87,
which were assigned to H-7 and H-10 respectively. A proton resonance at δH 5.96 was
assigned to proton of the methylenedioxy group attached to the A ring. The two olefinic
proton resonance at δH 6.45 and δH 6.06 were assigned to H-1 and H-2 respectively and
multiple proton resonance δH 4.45 was assigned to H-3. The remaining proton and carbon
resonances were assigned with reference to 2D NMR spectra. The NMR spectra correlations
indicated that compound CF.7 was crinine. However, a comparison with the 1H and 13C
NMR data of literature reference values,178 and compound CF.6, which was identified as
crinine, revealed a number of discrepancies. The H-4a (δH 3.91), 2H-6 (δH 4.75 and 4.10) and
2H-12 (δH 3.18 and 3.89) proton resonances were shifted downfield when compared with the
NMR data of crinine whose resonances for H-4a was δH 3.54, 2H-6 was δH 4.52 and 3.89 and
2H-12 was δH 2.99 and 3.54, most of the carbon resonances values were significantly
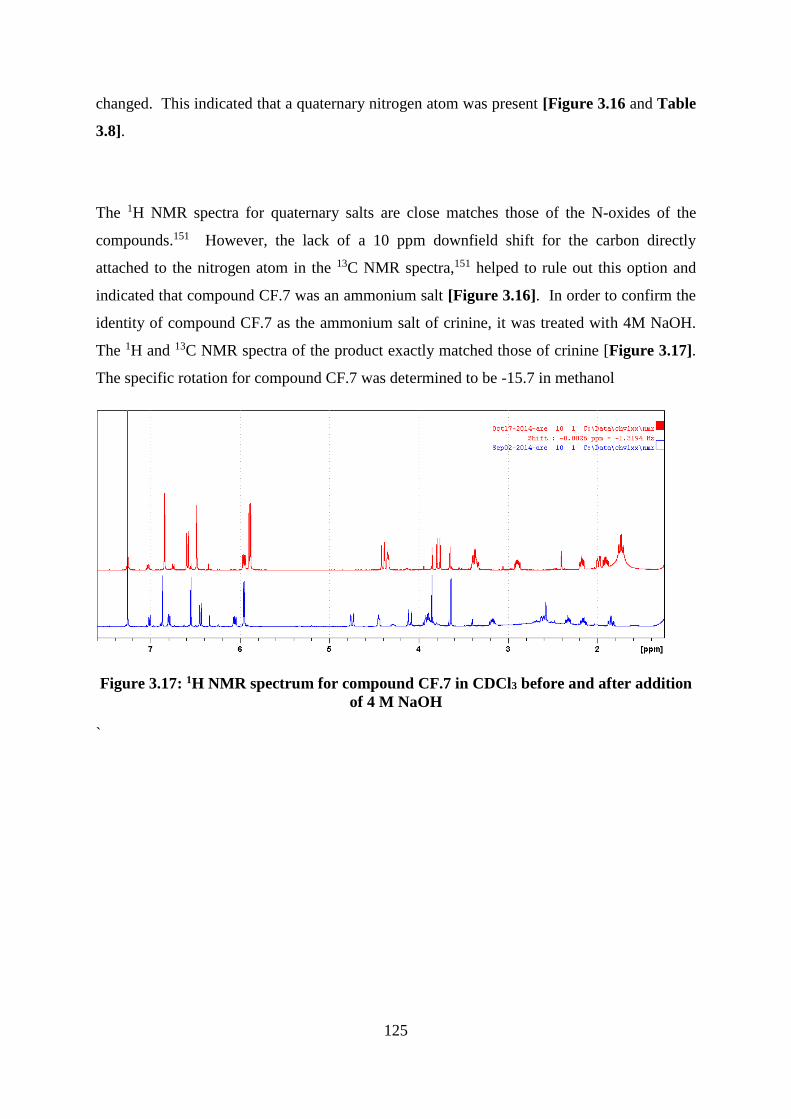
125
changed. This indicated that a quaternary nitrogen atom was present [Figure 3.16 and Table
3.8].
The 1H NMR spectra for quaternary salts are close matches those of the N-oxides of the
compounds.151 However, the lack of a 10 ppm downfield shift for the carbon directly
attached to the nitrogen atom in the 13C NMR spectra,151 helped to rule out this option and
indicated that compound CF.7 was an ammonium salt [Figure 3.16]. In order to confirm the
identity of compound CF.7 as the ammonium salt of crinine, it was treated with 4M NaOH.
The 1H and 13C NMR spectra of the product exactly matched those of crinine [Figure 3.17].
The specific rotation for compound CF.7 was determined to be -15.7 in methanol
Figure 3.17: 1H NMR spectrum for compound CF.7 in CDCl3 before and after addition
of 4 M NaOH
`
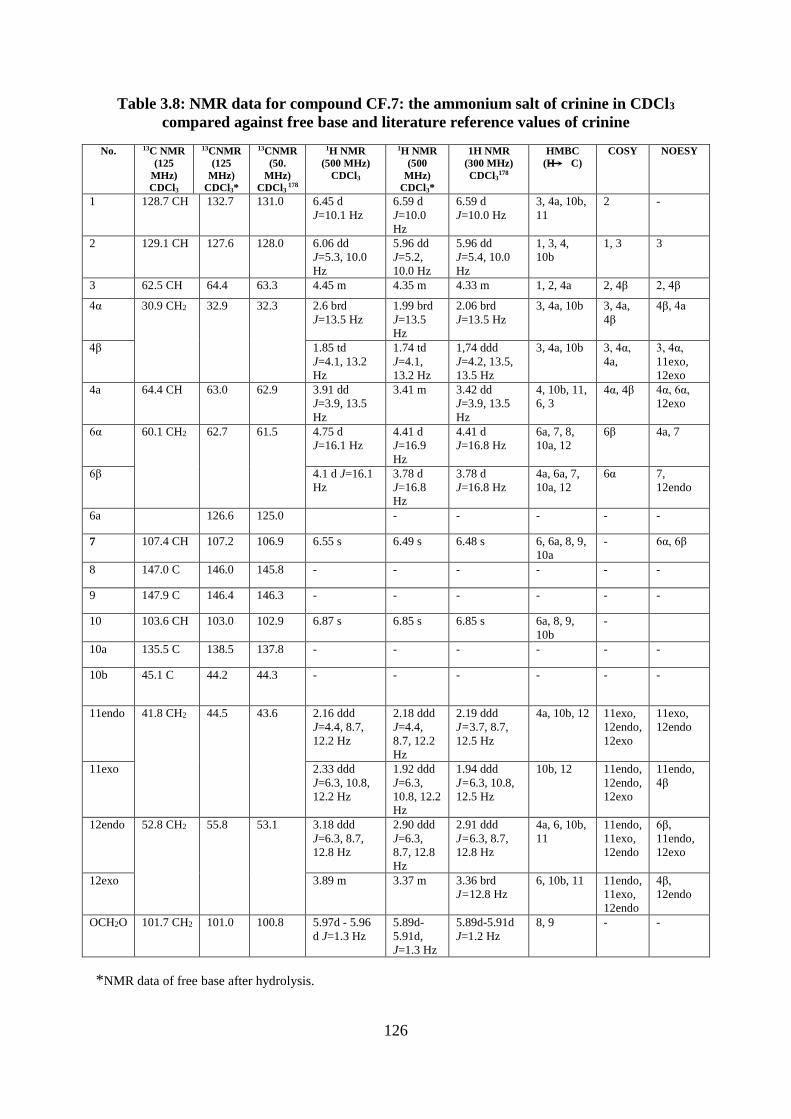
126
Table 3.8: NMR data for compound CF.7: the ammonium salt of crinine in CDCl3
compared against free base and literature reference values of crinine
No. 13C NMR
(125
MHz)
CDCl3
13CNMR
(125
MHz)
CDCl3*
13CNMR
(50.
MHz)
CDCl3 178
1H NMR
(500 MHz)
CDCl3
1H NMR
(500
MHz)
CDCl3*
1H NMR
(300 MHz)
CDCl3178
HMBC
(H C)
COSY NOESY
1 128.7 CH 132.7 131.0 6.45 d
J=10.1 Hz
6.59 d
J=10.0
Hz
6.59 d
J=10.0 Hz
3, 4a, 10b,
11
2 -
2 129.1 CH 127.6 128.0 6.06 dd
J=5.3, 10.0
Hz
5.96 dd
J=5.2,
10.0 Hz
5.96 dd
J=5.4, 10.0
Hz
1, 3, 4,
10b
1, 3 3
3 62.5 CH 64.4 63.3 4.45 m 4.35 m 4.33 m 1, 2, 4a 2, 4β 2, 4β
4α 30.9 CH2 32.9 32.3 2.6 brd
J=13.5 Hz
1.99 brd
J=13.5
Hz
2.06 brd
J=13.5 Hz
3, 4a, 10b 3, 4a,
4β
4β, 4a
4β 1.85 td
J=4.1, 13.2
Hz
1.74 td
J=4.1,
13.2 Hz
1,74 ddd
J=4.2, 13.5,
13.5 Hz
3, 4a, 10b 3, 4α,
4a,
3, 4α,
11exo,
12exo
4a 64.4 CH 63.0 62.9 3.91 dd
J=3.9, 13.5
Hz
3.41 m 3.42 dd
J=3.9, 13.5
Hz
4, 10b, 11,
6, 3
4α, 4β 4α, 6α,
12exo
6α 60.1 CH2 62.7 61.5 4.75 d
J=16.1 Hz
4.41 d
J=16.9
Hz
4.41 d
J=16.8 Hz
6a, 7, 8,
10a, 12
6β 4a, 7
6β 4.1 d J=16.1
Hz
3.78 d
J=16.8
Hz
3.78 d
J=16.8 Hz
4a, 6a, 7,
10a, 12
6α 7,
12endo
6a 126.6 125.0 - - - - -
7 107.4 CH 107.2 106.9 6.55 s 6.49 s 6.48 s 6, 6a, 8, 9,
10a
- 6α, 6β
8 147.0 C 146.0 145.8 - - - - - -
9 147.9 C 146.4 146.3 - - - - - -
10 103.6 CH 103.0 102.9 6.87 s 6.85 s 6.85 s 6a, 8, 9,
10b
-
10a 135.5 C 138.5 137.8 - - - - - -
10b 45.1 C 44.2 44.3 - - - - - -
11endo 41.8 CH2 44.5 43.6 2.16 ddd
J=4.4, 8.7,
12.2 Hz
2.18 ddd
J=4.4,
8.7, 12.2
Hz
2.19 ddd
J=3.7, 8.7,
12.5 Hz
4a, 10b, 12 11exo,
12endo,
12exo
11exo,
12endo
11exo 2.33 ddd
J=6.3, 10.8,
12.2 Hz
1.92 ddd
J=6.3,
10.8, 12.2
Hz
1.94 ddd
J=6.3, 10.8,
12.5 Hz
10b, 12 11endo,
12endo,
12exo
11endo,
4β
12endo 52.8 CH2 55.8 53.1 3.18 ddd
J=6.3, 8.7,
12.8 Hz
2.90 ddd
J=6.3,
8.7, 12.8
Hz
2.91 ddd
J=6.3, 8.7,
12.8 Hz
4a, 6, 10b,
11
11endo,
11exo,
12endo
6β,
11endo,
12exo
12exo 3.89 m 3.37 m 3.36 brd
J=12.8 Hz
6, 10b, 11 11endo,
11exo,
12endo
4β,
12endo
OCH2O 101.7 CH2 101.0 100.8 5.97d - 5.96
d J=1.3 Hz
5.89d-
5.91d,
J=1.3 Hz
5.89d-5.91d
J=1.2 Hz
8, 9 - -
*NMR data of free base after hydrolysis.
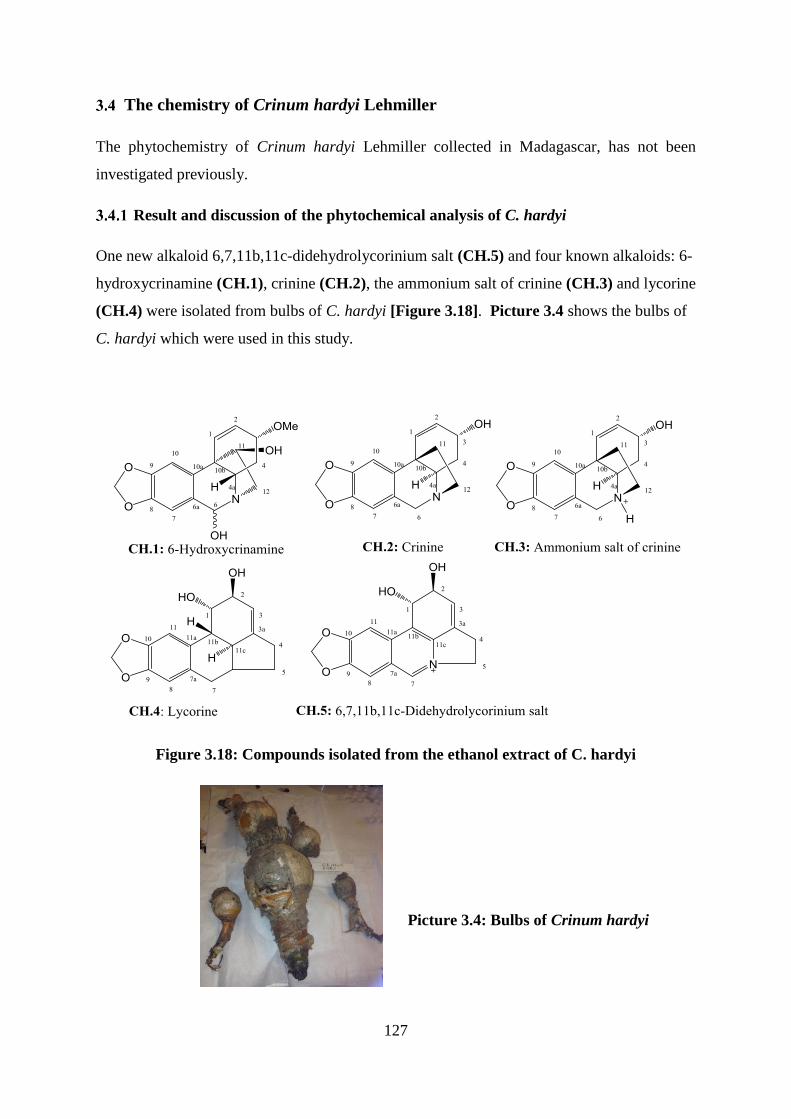
127
The chemistry of Crinum hardyi Lehmiller
The phytochemistry of Crinum hardyi Lehmiller collected in Madagascar, has not been
investigated previously.
Result and discussion of the phytochemical analysis of C. hardyi
One new alkaloid 6,7,11b,11c-didehydrolycorinium salt (CH.5) and four known alkaloids: 6-
hydroxycrinamine (CH.1), crinine (CH.2), the ammonium salt of crinine (CH.3) and lycorine
(CH.4) were isolated from bulbs of C. hardyi [Figure 3.18]. Picture 3.4 shows the bulbs of
C. hardyi which were used in this study.
Figure 3.18: Compounds isolated from the ethanol extract of C. hardyi
Picture 3.4: Bulbs of Crinum hardyi
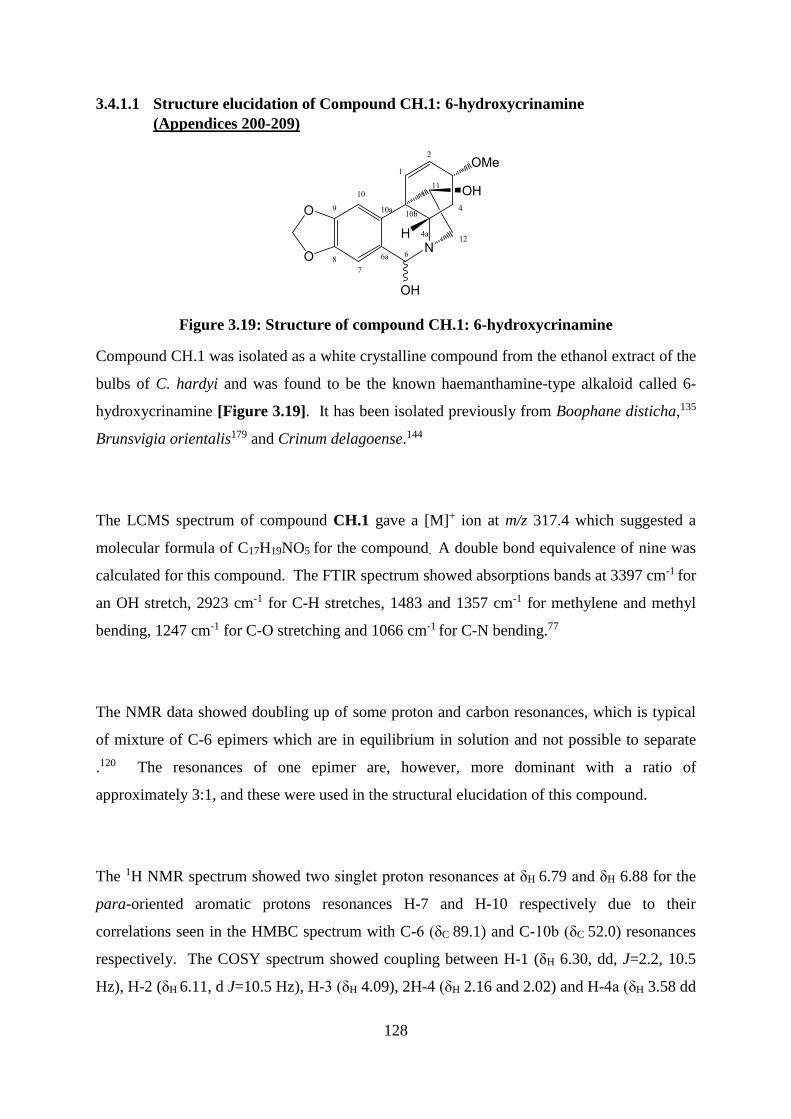
128
3.4.1.1 Structure elucidation of Compound CH.1: 6-hydroxycrinamine
(Appendices 200-209)
Figure 3.19: Structure of compound CH.1: 6-hydroxycrinamine
Compound CH.1 was isolated as a white crystalline compound from the ethanol extract of the
bulbs of C. hardyi and was found to be the known haemanthamine-type alkaloid called 6-
hydroxycrinamine [Figure 3.19]. It has been isolated previously from Boophane disticha,135
Brunsvigia orientalis179 and Crinum delagoense.144
The LCMS spectrum of compound CH.1 gave a [M]+ ion at m/z 317.4 which suggested a
molecular formula of C17H19NO5 for the compound. A double bond equivalence of nine was
calculated for this compound. The FTIR spectrum showed absorptions bands at 3397 cm-1 for
an OH stretch, 2923 cm-1 for C-H stretches, 1483 and 1357 cm-1 for methylene and methyl
bending, 1247 cm-1 for C-O stretching and 1066 cm-1 for C-N bending.77
The NMR data showed doubling up of some proton and carbon resonances, which is typical
of mixture of C-6 epimers which are in equilibrium in solution and not possible to separate
.120 The resonances of one epimer are, however, more dominant with a ratio of
approximately 3:1, and these were used in the structural elucidation of this compound.
The 1H NMR spectrum showed two singlet proton resonances at δH 6.79 and δH 6.88 for the
para-oriented aromatic protons resonances H-7 and H-10 respectively due to their
correlations seen in the HMBC spectrum with C-6 (δC 89.1) and C-10b (δC 52.0) resonances
respectively. The COSY spectrum showed coupling between H-1 (δH 6.30, dd, J=2.2, 10.5
Hz), H-2 (δH 6.11, d J=10.5 Hz), H-3 (δH 4.09), 2H-4 (δH 2.16 and 2.02) and H-4a (δH 3.58 dd
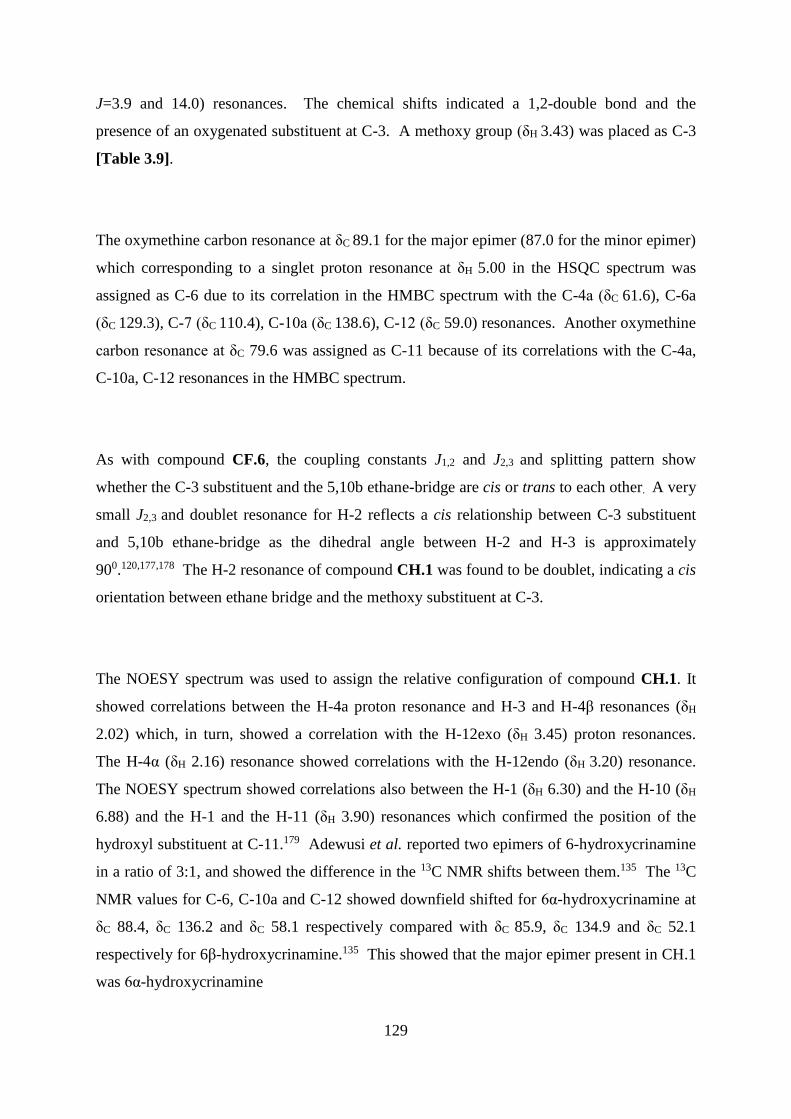
129
J=3.9 and 14.0) resonances. The chemical shifts indicated a 1,2-double bond and the
presence of an oxygenated substituent at C-3. A methoxy group (δH 3.43) was placed as C-3
[Table 3.9].
The oxymethine carbon resonance at δC 89.1 for the major epimer (87.0 for the minor epimer)
which corresponding to a singlet proton resonance at δH 5.00 in the HSQC spectrum was
assigned as C-6 due to its correlation in the HMBC spectrum with the C-4a (δC 61.6), C-6a
(δC 129.3), C-7 (δC 110.4), C-10a (δC 138.6), C-12 (δC 59.0) resonances. Another oxymethine
carbon resonance at δC 79.6 was assigned as C-11 because of its correlations with the C-4a,
C-10a, C-12 resonances in the HMBC spectrum.
As with compound CF.6, the coupling constants J1,2 and J2,3 and splitting pattern show
whether the C-3 substituent and the 5,10b ethane-bridge are cis or trans to each other. A very
small J2,3 and doublet resonance for H-2 reflects a cis relationship between C-3 substituent
and 5,10b ethane-bridge as the dihedral angle between H-2 and H-3 is approximately
900.120,177,178 The H-2 resonance of compound CH.1 was found to be doublet, indicating a cis
orientation between ethane bridge and the methoxy substituent at C-3.
The NOESY spectrum was used to assign the relative configuration of compound CH.1. It
showed correlations between the H-4a proton resonance and H-3 and H-4β resonances (δH
2.02) which, in turn, showed a correlation with the H-12exo (δH 3.45) proton resonances.
The H-4α (δH 2.16) resonance showed correlations with the H-12endo (δH 3.20) resonance.
The NOESY spectrum showed correlations also between the H-1 (δH 6.30) and the H-10 (δH
6.88) and the H-1 and the H-11 (δH 3.90) resonances which confirmed the position of the
hydroxyl substituent at C-11.179 Adewusi et al. reported two epimers of 6-hydroxycrinamine
in a ratio of 3:1, and showed the difference in the 13C NMR shifts between them.135 The 13C
NMR values for C-6, C-10a and C-12 showed downfield shifted for 6α-hydroxycrinamine at
δC 88.4, δC 136.2 and δC 58.1 respectively compared with δC 85.9, δC 134.9 and δC 52.1
respectively for 6β-hydroxycrinamine.135 This showed that the major epimer present in CH.1
was 6α-hydroxycrinamine
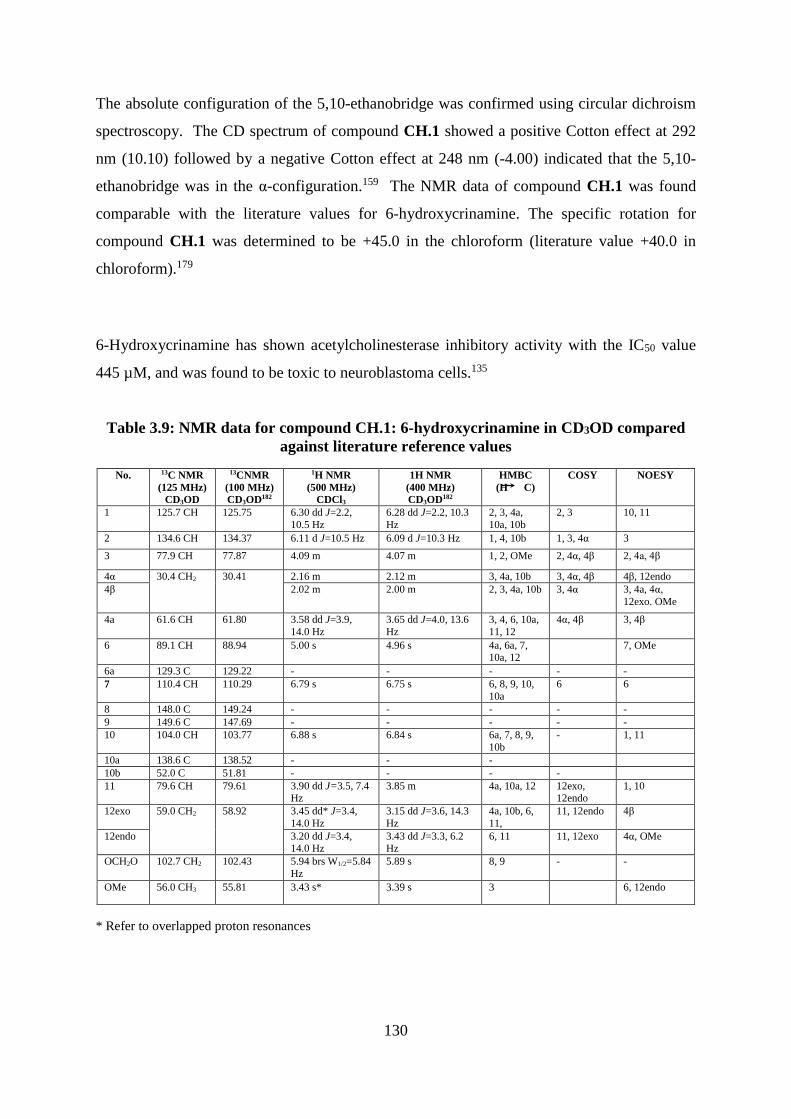
130
The absolute configuration of the 5,10-ethanobridge was confirmed using circular dichroism
spectroscopy. The CD spectrum of compound CH.1 showed a positive Cotton effect at 292
nm (10.10) followed by a negative Cotton effect at 248 nm (-4.00) indicated that the 5,10-
ethanobridge was in the α-configuration.159 The NMR data of compound CH.1 was found
comparable with the literature values for 6-hydroxycrinamine. The specific rotation for
compound CH.1 was determined to be +45.0 in the chloroform (literature value +40.0 in
chloroform).179
6-Hydroxycrinamine has shown acetylcholinesterase inhibitory activity with the IC50 value
445 µM, and was found to be toxic to neuroblastoma cells.135
Table 3.9: NMR data for compound CH.1: 6-hydroxycrinamine in CD3OD compared
against literature reference values
No. 13C NMR
(125 MHz)
CD3OD
13CNMR
(100 MHz)
CD3OD182
1H NMR
(500 MHz)
CDCl3
1H NMR
(400 MHz)
CD3OD182
HMBC
(H C)
COSY NOESY
1 125.7 CH 125.75 6.30 dd J=2.2,
10.5 Hz
6.28 dd J=2.2, 10.3
Hz
2, 3, 4a,
10a, 10b
2, 3 10, 11
2 134.6 CH 134.37 6.11 d J=10.5 Hz 6.09 d J=10.3 Hz 1, 4, 10b 1, 3, 4α 3
3 77.9 CH 77.87 4.09 m 4.07 m 1, 2, OMe 2, 4α, 4β 2, 4a, 4β
4α 30.4 CH2 30.41 2.16 m 2.12 m 3, 4a, 10b 3, 4α, 4β 4β, 12endo
4β 2.02 m 2.00 m 2, 3, 4a, 10b 3, 4α 3, 4a, 4α,
12exo. OMe
4a 61.6 CH 61.80 3.58 dd J=3.9,
14.0 Hz
3.65 dd J=4.0, 13.6
Hz
3, 4, 6, 10a,
11, 12
4α, 4β 3, 4β
6 89.1 CH 88.94 5.00 s 4.96 s 4a, 6a, 7, 10a, 12
7, OMe
6a 129.3 C 129.22 - - - - -
7 110.4 CH 110.29 6.79 s 6.75 s 6, 8, 9, 10,
10a
6 6
8 148.0 C 149.24 - - - - -
9 149.6 C 147.69 - - - - -
10 104.0 CH 103.77 6.88 s 6.84 s 6a, 7, 8, 9,
10b
- 1, 11
10a 138.6 C 138.52 - - -
10b 52.0 C 51.81 - - - -
11 79.6 CH 79.61 3.90 dd J=3.5, 7.4 Hz
3.85 m 4a, 10a, 12 12exo, 12endo
1, 10
12exo 59.0 CH2 58.92 3.45 dd* J=3.4,
14.0 Hz
3.15 dd J=3.6, 14.3
Hz
4a, 10b, 6,
11,
11, 12endo 4β
12endo 3.20 dd J=3.4, 14.0 Hz
3.43 dd J=3.3, 6.2 Hz
6, 11 11, 12exo 4α, OMe
OCH2O 102.7 CH2 102.43 5.94 brs W1/2=5.84
Hz
5.89 s 8, 9 - -
OMe 56.0 CH3 55.81 3.43 s* 3.39 s 3 6, 12endo
* Refer to overlapped proton resonances
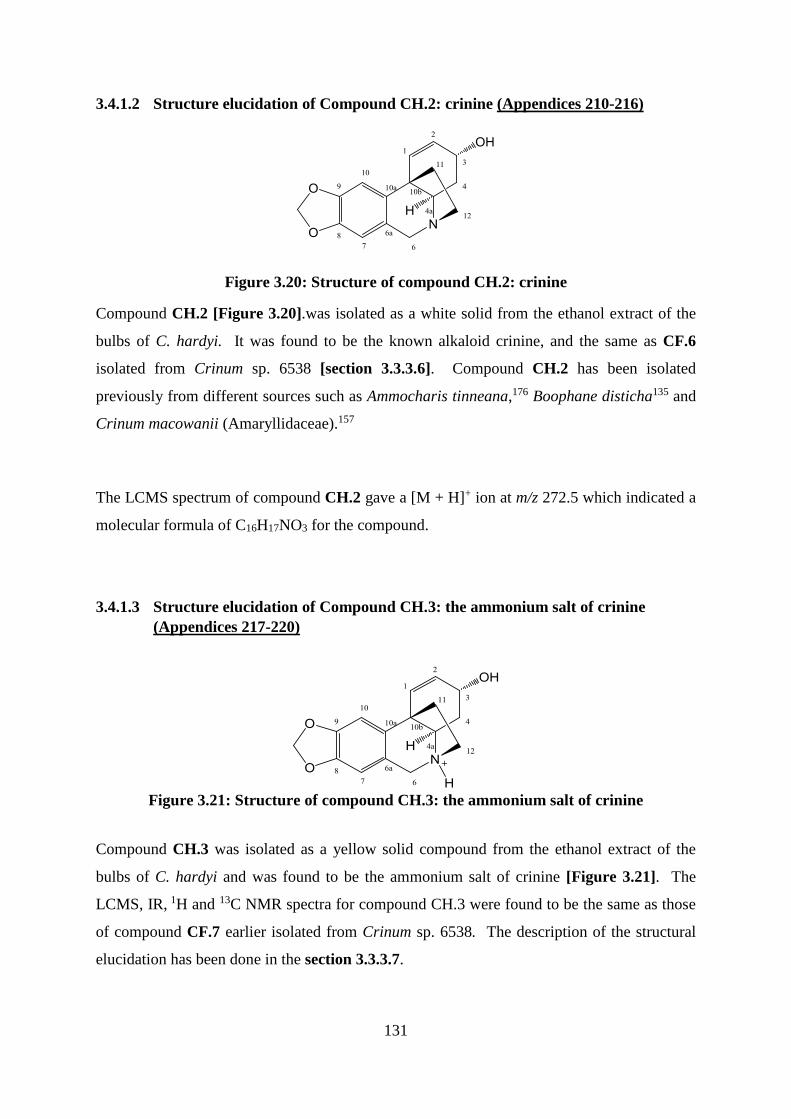
131
3.4.1.2 Structure elucidation of Compound CH.2: crinine (Appendices 210-216)
Figure 3.20: Structure of compound CH.2: crinine
Compound CH.2 [Figure 3.20].was isolated as a white solid from the ethanol extract of the
bulbs of C. hardyi. It was found to be the known alkaloid crinine, and the same as CF.6
isolated from Crinum sp. 6538 [section 3.3.3.6]. Compound CH.2 has been isolated
previously from different sources such as Ammocharis tinneana,176 Boophane disticha135 and
Crinum macowanii (Amaryllidaceae).157
The LCMS spectrum of compound CH.2 gave a [M + H]+ ion at m/z 272.5 which indicated a
molecular formula of C16H17NO3 for the compound.
3.4.1.3 Structure elucidation of Compound CH.3: the ammonium salt of crinine
(Appendices 217-220)
Figure 3.21: Structure of compound CH.3: the ammonium salt of crinine
Compound CH.3 was isolated as a yellow solid compound from the ethanol extract of the
bulbs of C. hardyi and was found to be the ammonium salt of crinine [Figure 3.21]. The
LCMS, IR, 1H and 13C NMR spectra for compound CH.3 were found to be the same as those
of compound CF.7 earlier isolated from Crinum sp. 6538. The description of the structural
elucidation has been done in the section 3.3.3.7.
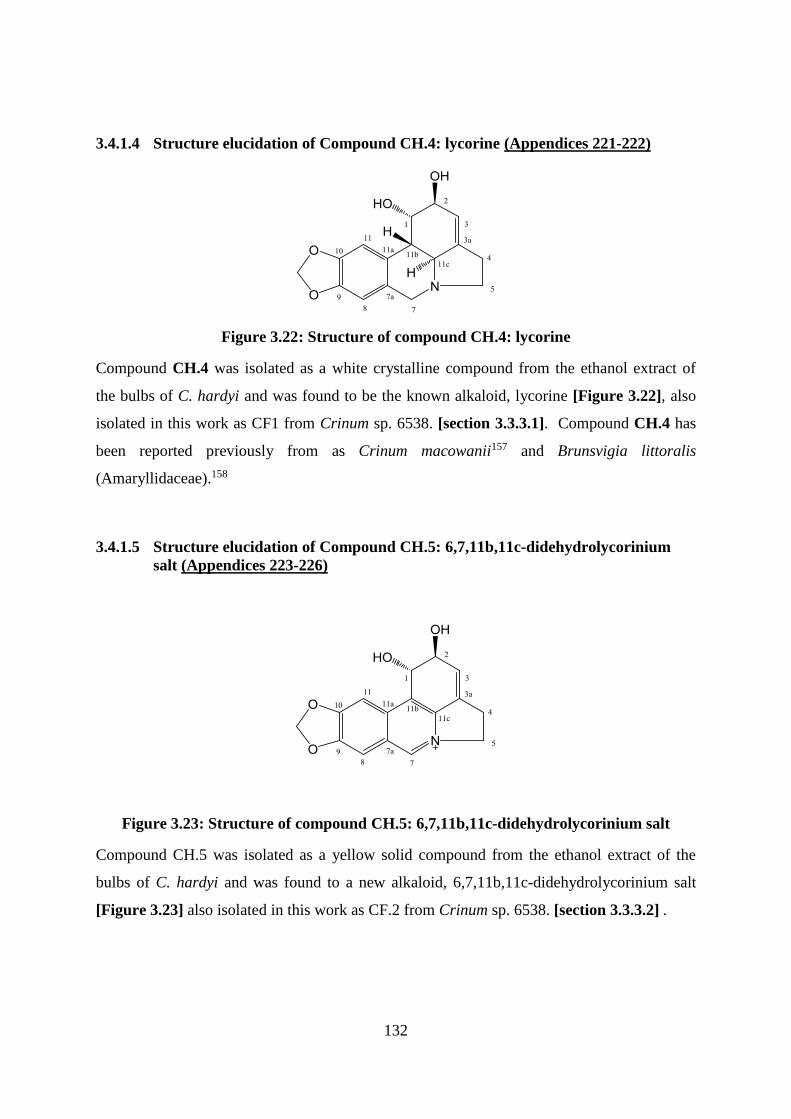
132
3.4.1.4 Structure elucidation of Compound CH.4: lycorine (Appendices 221-222)
Figure 3.22: Structure of compound CH.4: lycorine
Compound CH.4 was isolated as a white crystalline compound from the ethanol extract of
the bulbs of C. hardyi and was found to be the known alkaloid, lycorine [Figure 3.22], also
isolated in this work as CF1 from Crinum sp. 6538. [section 3.3.3.1]. Compound CH.4 has
been reported previously from as Crinum macowanii157 and Brunsvigia littoralis
(Amaryllidaceae).158
3.4.1.5 Structure elucidation of Compound CH.5: 6,7,11b,11c-didehydrolycorinium
salt (Appendices 223-226)
Figure 3.23: Structure of compound CH.5: 6,7,11b,11c-didehydrolycorinium salt
Compound CH.5 was isolated as a yellow solid compound from the ethanol extract of the
bulbs of C. hardyi and was found to a new alkaloid, 6,7,11b,11c-didehydrolycorinium salt
[Figure 3.23] also isolated in this work as CF.2 from Crinum sp. 6538. [section 3.3.3.2] .
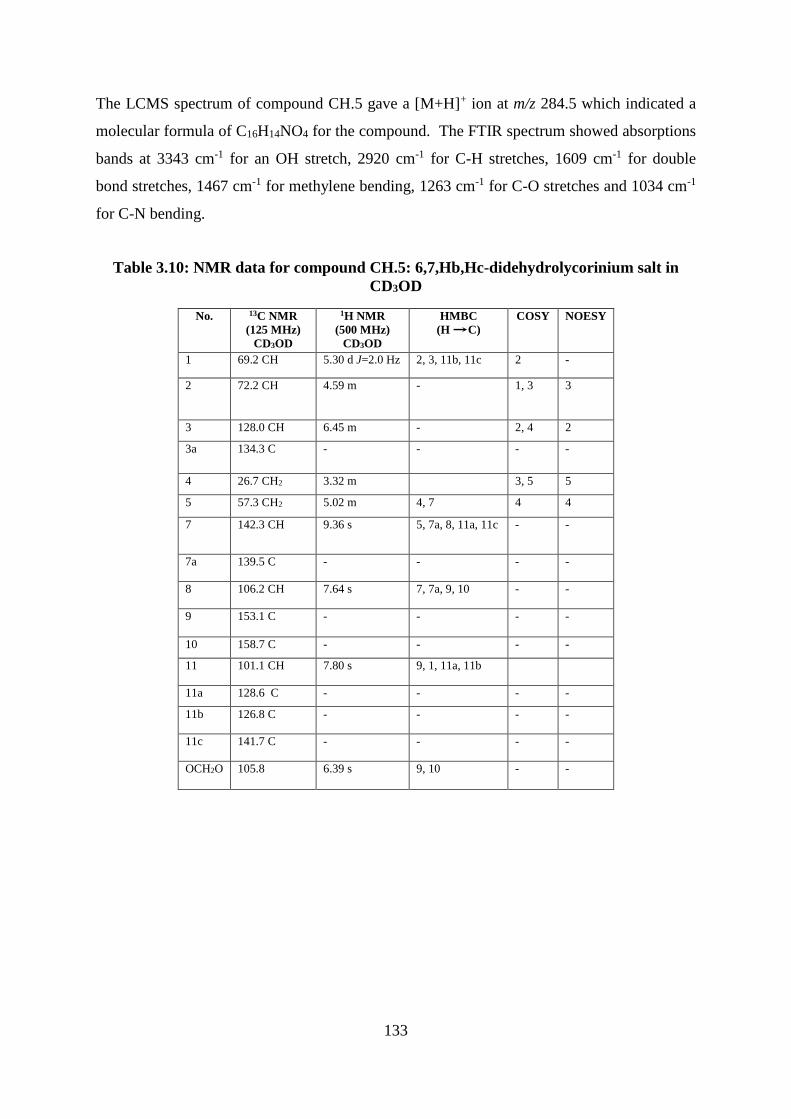
133
The LCMS spectrum of compound CH.5 gave a [M+H]+ ion at m/z 284.5 which indicated a
molecular formula of C16H14NO4 for the compound. The FTIR spectrum showed absorptions
bands at 3343 cm-1 for an OH stretch, 2920 cm-1 for C-H stretches, 1609 cm-1 for double
bond stretches, 1467 cm-1 for methylene bending, 1263 cm-1 for C-O stretches and 1034 cm-1
for C-N bending.
Table 3.10: NMR data for compound CH.5: 6,7,Hb,Hc-didehydrolycorinium salt in
CD3OD
No. 13C NMR
(125 MHz)
CD3OD
1H NMR
(500 MHz)
CD3OD
HMBC
(H C)
COSY NOESY
1 69.2 CH 5.30 d J=2.0 Hz 2, 3, 11b, 11c 2 -
2 72.2 CH 4.59 m - 1, 3 3
3 128.0 CH 6.45 m - 2, 4 2
3a 134.3 C - - - -
4 26.7 CH2 3.32 m 3, 5 5
5 57.3 CH2 5.02 m 4, 7 4 4
7 142.3 CH 9.36 s 5, 7a, 8, 11a, 11c - -
7a 139.5 C - - - -
8 106.2 CH 7.64 s 7, 7a, 9, 10 - -
9 153.1 C - - - -
10 158.7 C - - - -
11 101.1 CH 7.80 s 9, 1, 11a, 11b
11a 128.6 C - - - -
11b 126.8 C - - - -
11c 141.7 C - - - -
OCH2O 105.8 6.39 s 9, 10 - -
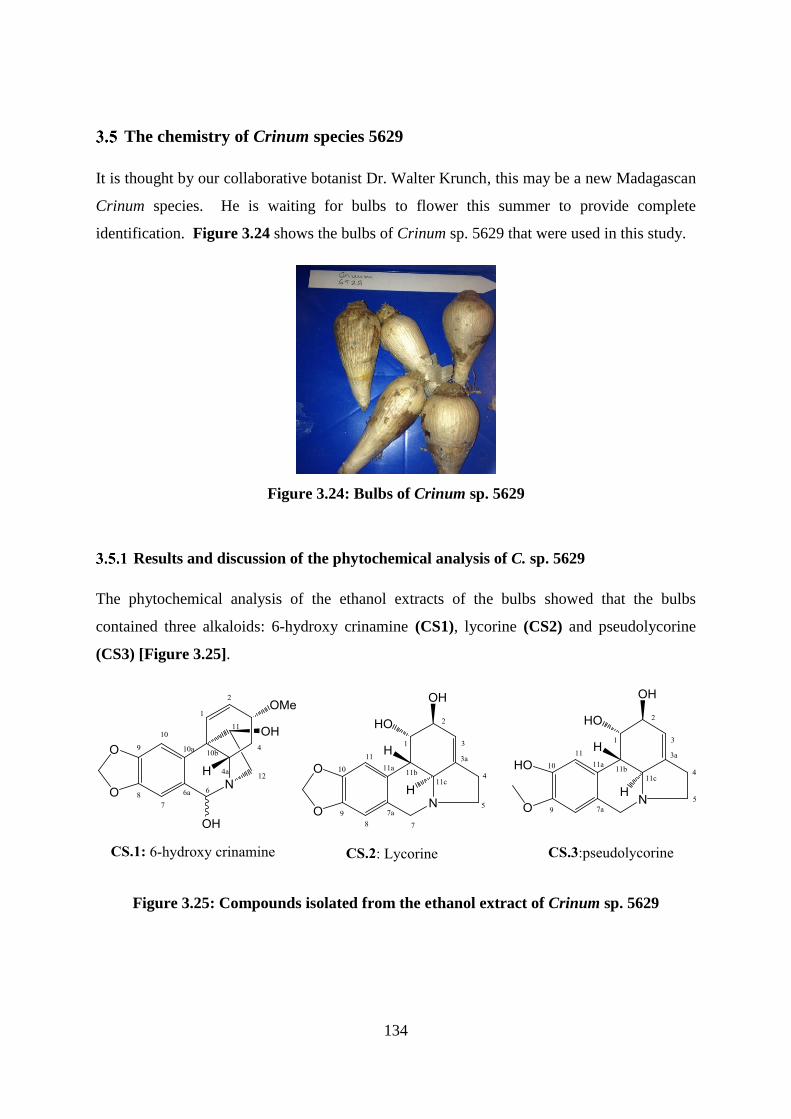
134
The chemistry of Crinum species 5629
It is thought by our collaborative botanist Dr. Walter Krunch, this may be a new Madagascan
Crinum species. He is waiting for bulbs to flower this summer to provide complete
identification. Figure 3.24 shows the bulbs of Crinum sp. 5629 that were used in this study.
Figure 3.24: Bulbs of Crinum sp. 5629
Results and discussion of the phytochemical analysis of C. sp. 5629
The phytochemical analysis of the ethanol extracts of the bulbs showed that the bulbs
contained three alkaloids: 6-hydroxy crinamine (CS1), lycorine (CS2) and pseudolycorine
(CS3) [Figure 3.25].
Figure 3.25: Compounds isolated from the ethanol extract of Crinum sp. 5629
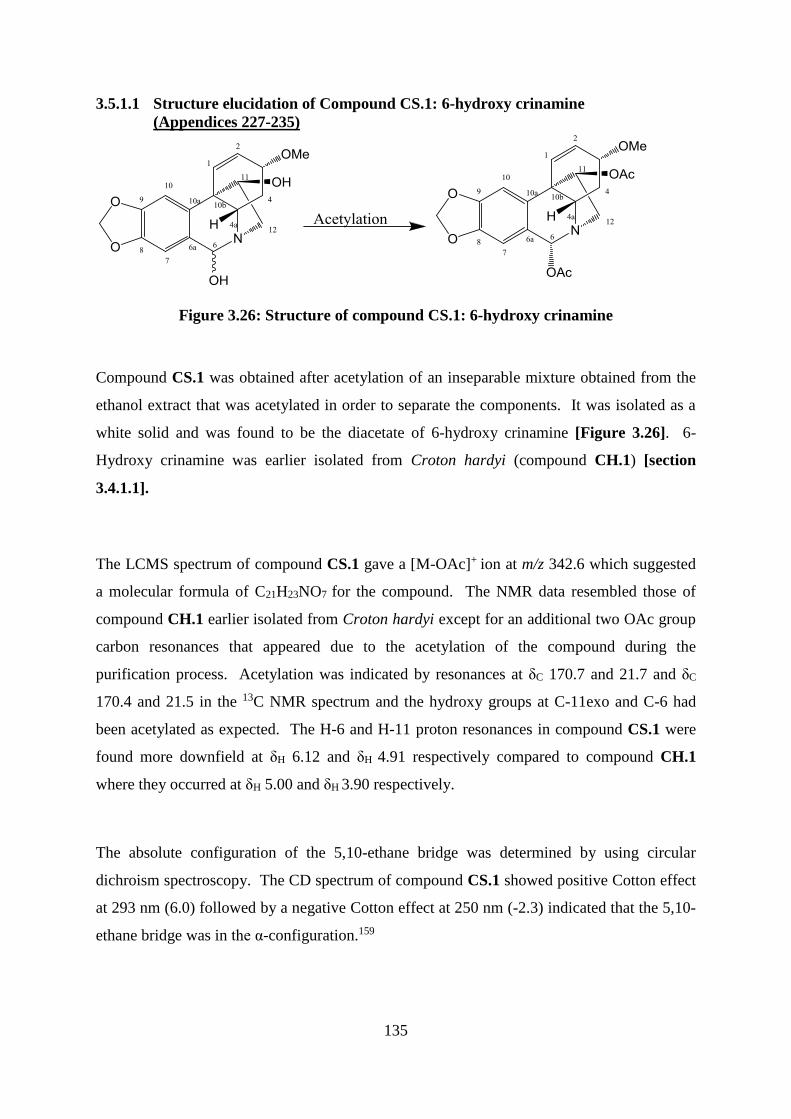
135
3.5.1.1 Structure elucidation of Compound CS.1: 6-hydroxy crinamine
(Appendices 227-235)
Figure 3.26: Structure of compound CS.1: 6-hydroxy crinamine
Compound CS.1 was obtained after acetylation of an inseparable mixture obtained from the
ethanol extract that was acetylated in order to separate the components. It was isolated as a
white solid and was found to be the diacetate of 6-hydroxy crinamine [Figure 3.26]. 6-
Hydroxy crinamine was earlier isolated from Croton hardyi (compound CH.1) [section
3.4.1.1].
The LCMS spectrum of compound CS.1 gave a [M-OAc]+ ion at m/z 342.6 which suggested
a molecular formula of C21H23NO7 for the compound. The NMR data resembled those of
compound CH.1 earlier isolated from Croton hardyi except for an additional two OAc group
carbon resonances that appeared due to the acetylation of the compound during the
purification process. Acetylation was indicated by resonances at δC 170.7 and 21.7 and δC
170.4 and 21.5 in the 13C NMR spectrum and the hydroxy groups at C-11exo and C-6 had
been acetylated as expected. The H-6 and H-11 proton resonances in compound CS.1 were
found more downfield at δH 6.12 and δH 4.91 respectively compared to compound CH.1
where they occurred at δH 5.00 and δH 3.90 respectively.
The absolute configuration of the 5,10-ethane bridge was determined by using circular
dichroism spectroscopy. The CD spectrum of compound CS.1 showed positive Cotton effect
at 293 nm (6.0) followed by a negative Cotton effect at 250 nm (-2.3) indicated that the 5,10-
ethane bridge was in the α-configuration.159
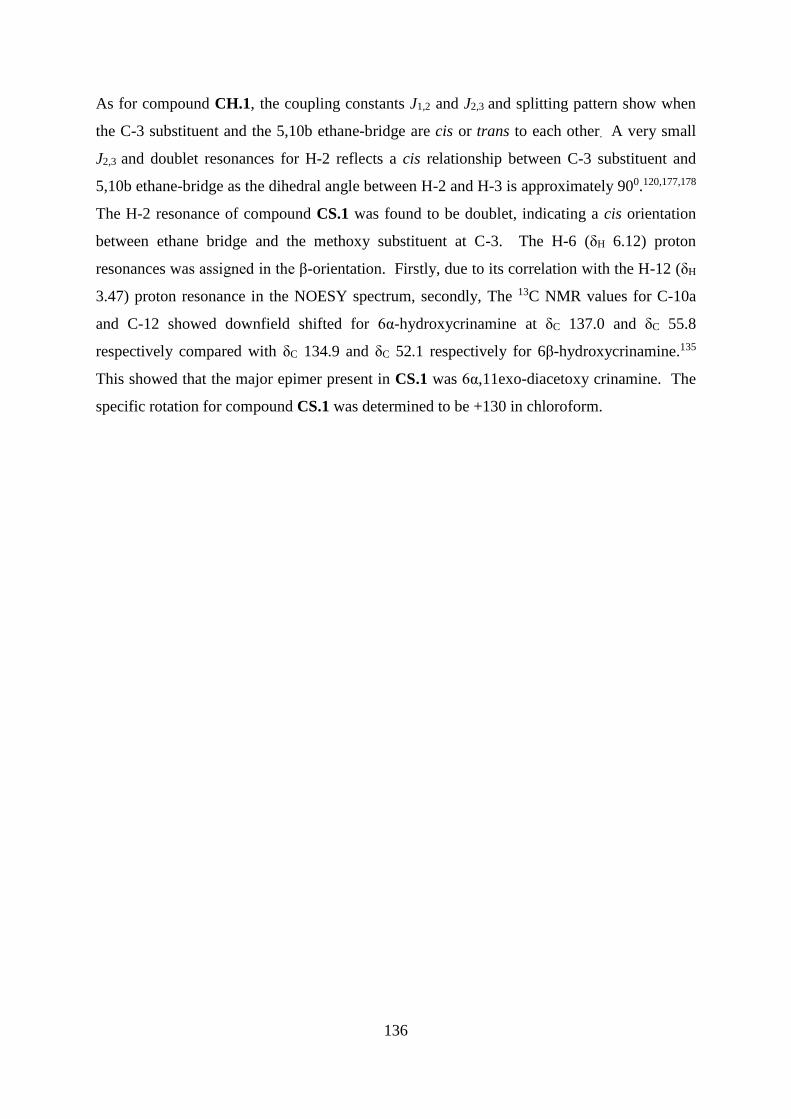
136
As for compound CH.1, the coupling constants J1,2 and J2,3 and splitting pattern show when
the C-3 substituent and the 5,10b ethane-bridge are cis or trans to each other. A very small
J2,3 and doublet resonances for H-2 reflects a cis relationship between C-3 substituent and
5,10b ethane-bridge as the dihedral angle between H-2 and H-3 is approximately 900.120,177,178
The H-2 resonance of compound CS.1 was found to be doublet, indicating a cis orientation
between ethane bridge and the methoxy substituent at C-3. The H-6 (δH 6.12) proton
resonances was assigned in the β-orientation. Firstly, due to its correlation with the H-12 (δH
3.47) proton resonance in the NOESY spectrum, secondly, The 13C NMR values for C-10a
and C-12 showed downfield shifted for 6α-hydroxycrinamine at δC 137.0 and δC 55.8
respectively compared with δC 134.9 and δC 52.1 respectively for 6β-hydroxycrinamine.135
This showed that the major epimer present in CS.1 was 6α,11exo-diacetoxy crinamine. The
specific rotation for compound CS.1 was determined to be +130 in chloroform.
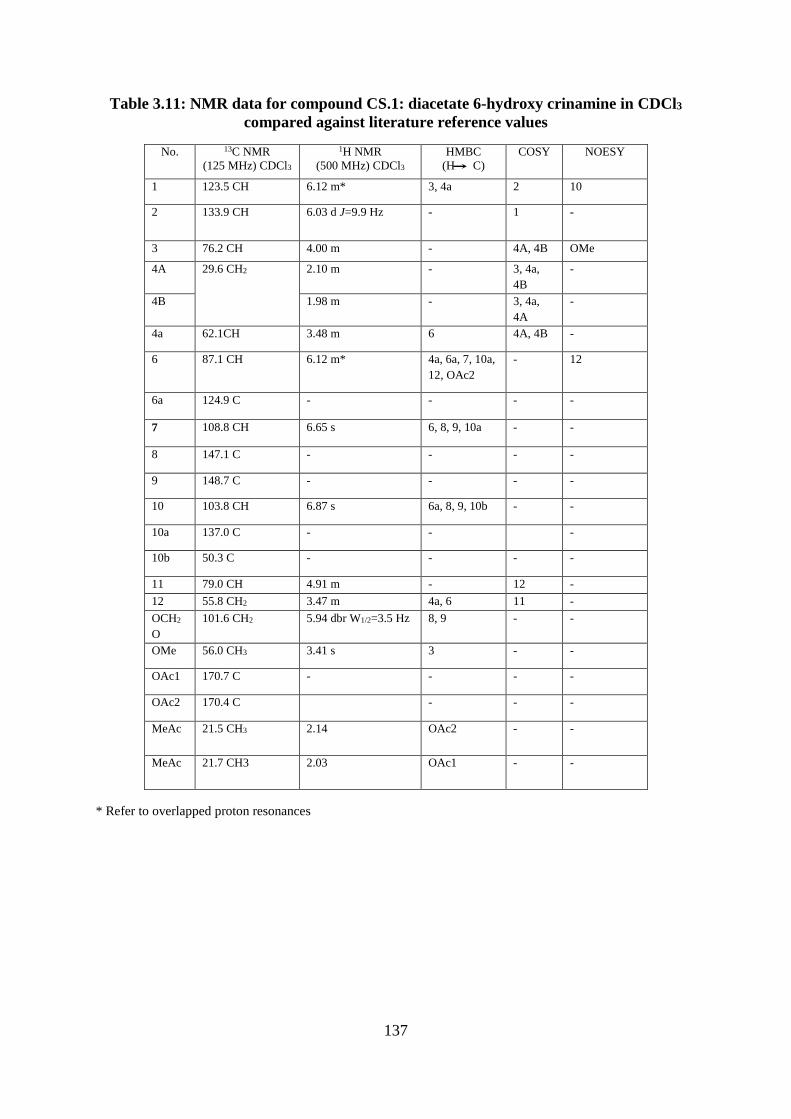
137
Table 3.11: NMR data for compound CS.1: diacetate 6-hydroxy crinamine in CDCl3
compared against literature reference values
No. 13C NMR
(125 MHz) CDCl3
1H NMR
(500 MHz) CDCl3
HMBC
(H C)
COSY NOESY
1 123.5 CH 6.12 m* 3, 4a 2 10
2 133.9 CH 6.03 d J=9.9 Hz - 1 -
3 76.2 CH 4.00 m - 4A, 4B OMe
4A 29.6 CH2 2.10 m - 3, 4a,
4B
-
4B 1.98 m - 3, 4a,
4A
-
4a 62.1CH 3.48 m 6 4A, 4B -
6 87.1 CH 6.12 m* 4a, 6a, 7, 10a,
12, OAc2
- 12
6a 124.9 C - - - -
7 108.8 CH 6.65 s 6, 8, 9, 10a - -
8 147.1 C - - - -
9 148.7 C - - - -
10 103.8 CH 6.87 s 6a, 8, 9, 10b - -
10a 137.0 C - - -
10b 50.3 C - - - -
11 79.0 CH 4.91 m - 12 -
12 55.8 CH2 3.47 m 4a, 6 11 -
OCH2
O
101.6 CH2 5.94 dbr W1/2=3.5 Hz 8, 9 - -
OMe 56.0 CH3 3.41 s 3 - -
OAc1 170.7 C - - - -
OAc2 170.4 C - - -
MeAc 21.5 CH3 2.14 OAc2 - -
MeAc 21.7 CH3 2.03 OAc1 - -
* Refer to overlapped proton resonances
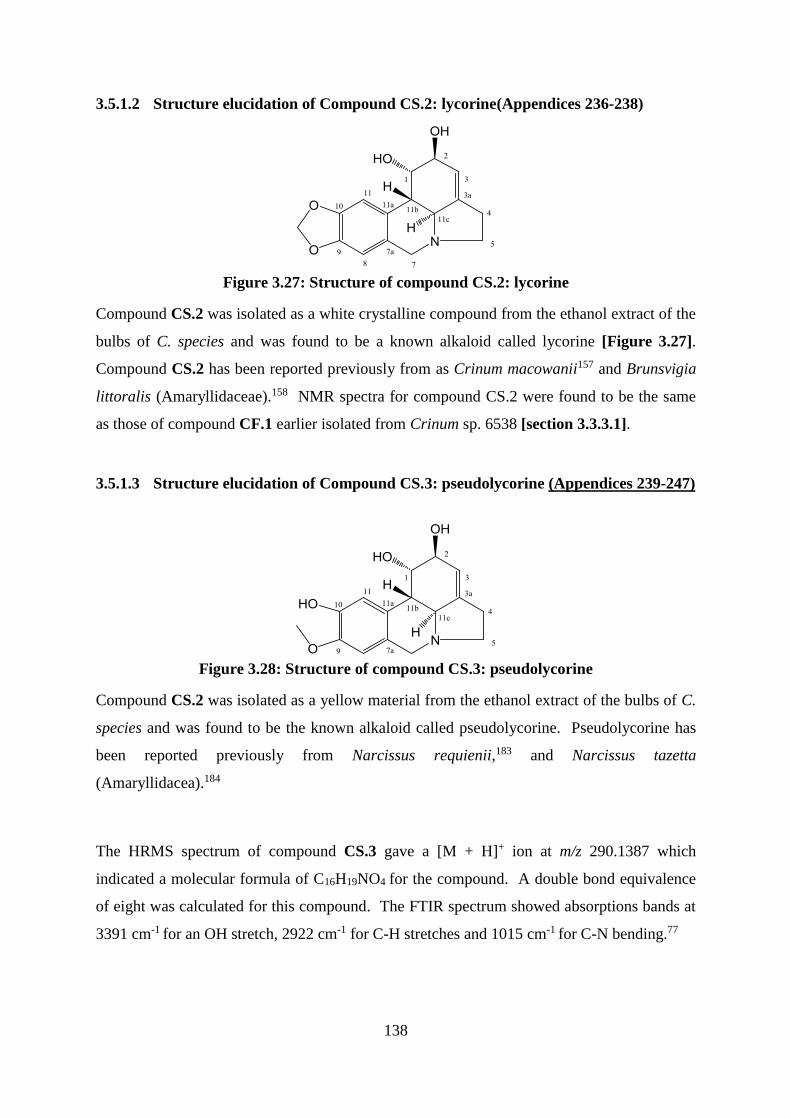
138
3.5.1.2 Structure elucidation of Compound CS.2: lycorine(Appendices 236-238)
Figure 3.27: Structure of compound CS.2: lycorine
Compound CS.2 was isolated as a white crystalline compound from the ethanol extract of the
bulbs of C. species and was found to be a known alkaloid called lycorine [Figure 3.27].
Compound CS.2 has been reported previously from as Crinum macowanii157 and Brunsvigia
littoralis (Amaryllidaceae).158 NMR spectra for compound CS.2 were found to be the same
as those of compound CF.1 earlier isolated from Crinum sp. 6538 [section 3.3.3.1].
3.5.1.3 Structure elucidation of Compound CS.3: pseudolycorine (Appendices 239-247)
Figure 3.28: Structure of compound CS.3: pseudolycorine
Compound CS.2 was isolated as a yellow material from the ethanol extract of the bulbs of C.
species and was found to be the known alkaloid called pseudolycorine. Pseudolycorine has
been reported previously from Narcissus requienii,183 and Narcissus tazetta
(Amaryllidacea).184
The HRMS spectrum of compound CS.3 gave a [M + H]+ ion at m/z 290.1387 which
indicated a molecular formula of C16H19NO4 for the compound. A double bond equivalence
of eight was calculated for this compound. The FTIR spectrum showed absorptions bands at
3391 cm-1 for an OH stretch, 2922 cm-1 for C-H stretches and 1015 cm-1 for C-N bending.77
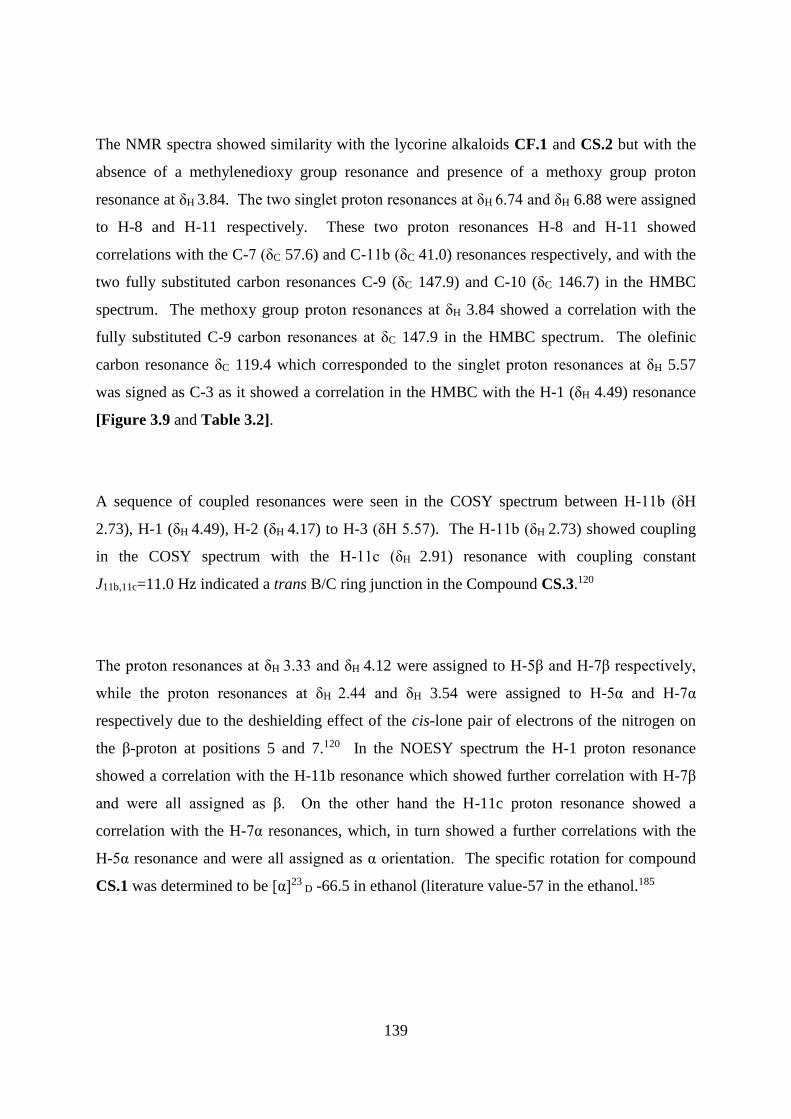
139
The NMR spectra showed similarity with the lycorine alkaloids CF.1 and CS.2 but with the
absence of a methylenedioxy group resonance and presence of a methoxy group proton
resonance at δH 3.84. The two singlet proton resonances at δH 6.74 and δH 6.88 were assigned
to H-8 and H-11 respectively. These two proton resonances H-8 and H-11 showed
correlations with the C-7 (δC 57.6) and C-11b (δC 41.0) resonances respectively, and with the
two fully substituted carbon resonances C-9 (δC 147.9) and C-10 (δC 146.7) in the HMBC
spectrum. The methoxy group proton resonances at δH 3.84 showed a correlation with the
fully substituted C-9 carbon resonances at δC 147.9 in the HMBC spectrum. The olefinic
carbon resonance δC 119.4 which corresponded to the singlet proton resonances at δH 5.57
was signed as C-3 as it showed a correlation in the HMBC with the H-1 (δH 4.49) resonance
[Figure 3.9 and Table 3.2].
A sequence of coupled resonances were seen in the COSY spectrum between H-11b (δH
2.73), H-1 (δH 4.49), H-2 (δH 4.17) to H-3 (δH 5.57). The H-11b (δH 2.73) showed coupling
in the COSY spectrum with the H-11c (δH 2.91) resonance with coupling constant
J11b,11c=11.0 Hz indicated a trans B/C ring junction in the Compound CS.3.120
The proton resonances at δH 3.33 and δH 4.12 were assigned to H-5β and H-7β respectively,
while the proton resonances at δH 2.44 and δH 3.54 were assigned to H-5α and H-7α
respectively due to the deshielding effect of the cis-lone pair of electrons of the nitrogen on
the β-proton at positions 5 and 7.120 In the NOESY spectrum the H-1 proton resonance
showed a correlation with the H-11b resonance which showed further correlation with H-7β
and were all assigned as β. On the other hand the H-11c proton resonance showed a
correlation with the H-7α resonances, which, in turn showed a further correlations with the
H-5α resonance and were all assigned as α orientation. The specific rotation for compound
CS.1 was determined to be [α]23 D -66.5 in ethanol (literature value-57 in the ethanol.185
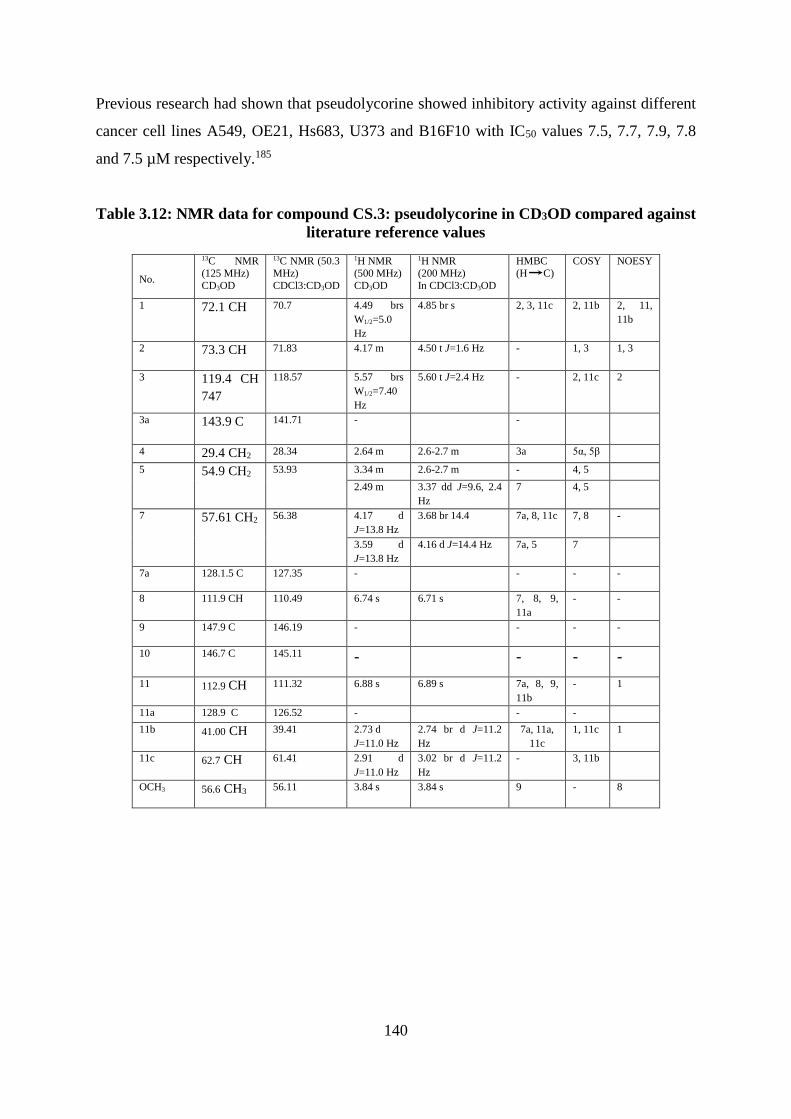
140
Previous research had shown that pseudolycorine showed inhibitory activity against different
cancer cell lines A549, OE21, Hs683, U373 and B16F10 with IC50 values 7.5, 7.7, 7.9, 7.8
and 7.5 µM respectively.185
Table 3.12: NMR data for compound CS.3: pseudolycorine in CD3OD compared against
literature reference values
No.
13C NMR
(125 MHz)
CD3OD
13C NMR (50.3
MHz)
CDCl3:CD3OD
1H NMR
(500 MHz)
CD3OD
1H NMR
(200 MHz)
In CDCl3:CD3OD
HMBC
(H C)
COSY NOESY
1 72.1 CH 70.7 4.49 brs
W1/2=5.0
Hz
4.85 br s 2, 3, 11c 2, 11b 2, 11,
11b
2 73.3 CH 71.83 4.17 m 4.50 t J=1.6 Hz - 1, 3 1, 3
3 119.4 CH
747
118.57 5.57 brs
W1/2=7.40
Hz
5.60 t J=2.4 Hz - 2, 11c 2
3a 143.9 C 141.71 - -
4 29.4 CH2 28.34 2.64 m 2.6-2.7 m 3a 5α, 5β
5 54.9 CH2 53.93 3.34 m 2.6-2.7 m - 4, 5
2.49 m 3.37 dd J=9.6, 2.4
Hz
7 4, 5
7 57.61 CH2 56.38 4.17 d
J=13.8 Hz
3.68 br 14.4 7a, 8, 11c 7, 8 -
3.59 d
J=13.8 Hz
4.16 d J=14.4 Hz 7a, 5 7
7a 128.1.5 C 127.35 - - - -
8 111.9 CH 110.49 6.74 s 6.71 s 7, 8, 9,
11a
- -
9 147.9 C 146.19 - - - -
10 146.7 C 145.11 - - - -
11 112.9 CH 111.32 6.88 s 6.89 s 7a, 8, 9,
11b
- 1
11a 128.9 C 126.52 - - -
11b 41.00 CH 39.41 2.73 d
J=11.0 Hz
2.74 br d J=11.2
Hz
7a, 11a,
11c
1, 11c 1
11c 62.7 CH 61.41 2.91 d
J=11.0 Hz
3.02 br d J=11.2
Hz
- 3, 11b
OCH3 56.6 CH3 56.11 3.84 s 3.84 s 9 - 8
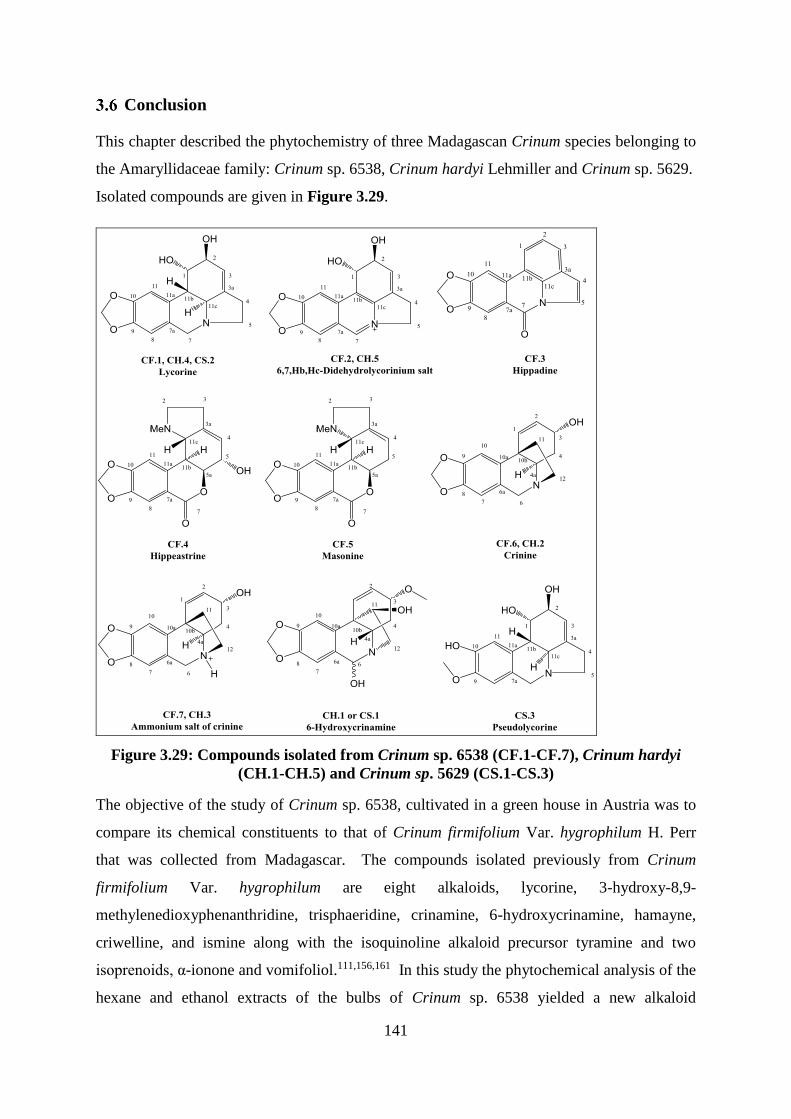
141
Conclusion
This chapter described the phytochemistry of three Madagascan Crinum species belonging to
the Amaryllidaceae family: Crinum sp. 6538, Crinum hardyi Lehmiller and Crinum sp. 5629.
Isolated compounds are given in Figure 3.29.
Figure 3.29: Compounds isolated from Crinum sp. 6538 (CF.1-CF.7), Crinum hardyi
(CH.1-CH.5) and Crinum sp. 5629 (CS.1-CS.3)
The objective of the study of Crinum sp. 6538, cultivated in a green house in Austria was to
compare its chemical constituents to that of Crinum firmifolium Var. hygrophilum H. Perr
that was collected from Madagascar. The compounds isolated previously from Crinum
firmifolium Var. hygrophilum are eight alkaloids, lycorine, 3-hydroxy-8,9-
methylenedioxyphenanthridine, trisphaeridine, crinamine, 6-hydroxycrinamine, hamayne,
criwelline, and ismine along with the isoquinoline alkaloid precursor tyramine and two
isoprenoids, α-ionone and vomifoliol.111,156,161 In this study the phytochemical analysis of the
hexane and ethanol extracts of the bulbs of Crinum sp. 6538 yielded a new alkaloid
142
6,7,Hb,Hc-didehydrolycorinium salt (CF.2) with six known alkaloids, lyocrine (CF.1),
hippadine (CF.3), hippeastrine (CF.4), masonine (CF.5), crinine (CF.6) and the ammonium
salt of crinine (CF.7) [Figure 3.8]. Lyocrine (CF.1), hippadine (CF.3), hippeastrine (CF.4)
and crinine (CF.6) have been isolated from other Crinum species,142,157,166,167 while masonine
(CF.5) has been isolated from Nerine masonorum,173 and different Narcissus species.174,175
Therefore, the report of masonine is the first report from a Crinum species. Compound
(CF.7) the ammonium salt of crinine, has not been reported before. The hexane extract of the
bulbs of Crinum sp. 6538 gave a mixture of cycloartane triterpenoids. These cycloartanes
could not be fully purified, so they have not been discussed in this thesis. Cycloartanes have
been reported from the Amaryllidaceae previously.165
The chemical constituents of the ethanol extract of the bulbs of Crinum hardyi Lehmiller
have not been investigated before. In this study the ethanol extracts of the bulbs of C. hardyi
yielded the new 6,7,Hb,Hc-didehydrolycorinium salt (CH.5) and four known alkaloids: 6-
hydroxycrinamine (CH.1), crinine (CH.2), the ammonium salt of crinine (CH.3) and lycorine
(CH.4). The four isolated alkaloids have been reported from Crinum sp. 6538 but not 6-
hydroxycrinamine (CH.1). 6-Hydroxycrinamine (CH.1) has been isolated from the Crinum
genus and other Amaryllidaceae genera as a mixture of C-6 epimers which are in equilibrium
in solution and not possible to separate.120 However, the resonances of one epimer are more
dominant with a ratio of 3:1, and these were used in the structural elucidation of this
compound. It was found that the major epimer was 6α-hydroxy, which agreed with the report
of Adewusi et al. who isolated mixture of the two epimers in same ratio with 6α-
hydroxycrinamine as the predominant one.135 The occurrence of α and β 5,10-ethanobridge
compounds (CH.1 and CH.2 respectively) in the same species has been reported from
Boophane disticha135 and Brunsvigia orientalis (Amaryllidaceae family).179
The chemical constituents of the ethanol extract of the bulbs Crinum sp. 5629 yielded just
three compounds, 6-hydroxy crinamine (CS.1), lycorine (CS.2) and pseudolycorine (CS.3).
6-Hydroxy crinamine (CS.1) was isolated after acetylation of an inseparable mixture. The
acetylation of this compound showed that the major epimer present in CS.1 was 6α, 11exo-
diacetylcrinamine. Pseudolycorine CS.3 has been reported to occur in Crinum species,118,138
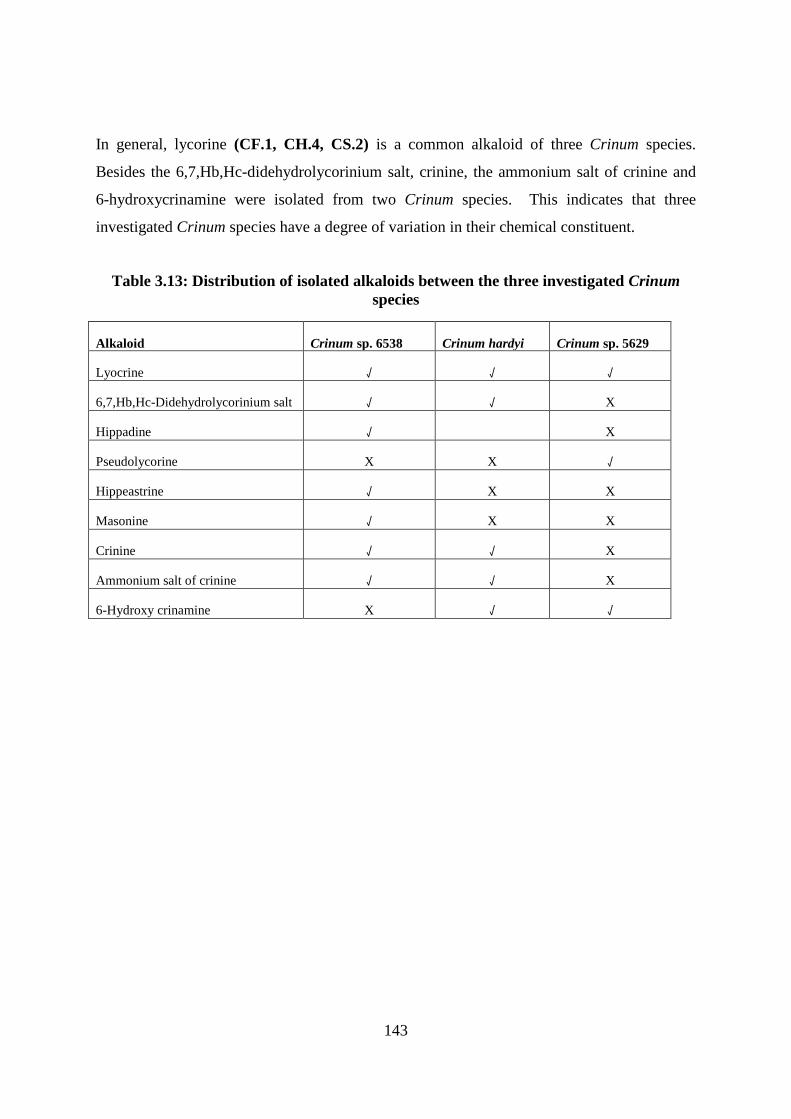
143
In general, lycorine (CF.1, CH.4, CS.2) is a common alkaloid of three Crinum species.
Besides the 6,7,Hb,Hc-didehydrolycorinium salt, crinine, the ammonium salt of crinine and
6-hydroxycrinamine were isolated from two Crinum species. This indicates that three
investigated Crinum species have a degree of variation in their chemical constituent.
Table 3.13: Distribution of isolated alkaloids between the three investigated Crinum
species
Alkaloid Crinum sp. 6538 Crinum hardyi Crinum sp. 5629
Lyocrine √ √ √
6,7,Hb,Hc-Didehydrolycorinium salt √ √ X
Hippadine √ X
Pseudolycorine X X √
Hippeastrine √ X X
Masonine √ X X
Crinine √ √ X
Ammonium salt of crinine √ √ X
6-Hydroxy crinamine X √ √
144
Chapter 4: The Phytochemistry of Toona sinensis [Meliaceae family]
Introduction to Toona sinensis [Meliaceae family]
Botanical aspects of T. sinensis
Toona sinensis M. Roem belongs to the Meliaceae family.186 The Meliaceae family
constitutes trees or shrubs that are widely distributed in the tropics and subtropics, with rare
representation in the temperate zones.186 A molecular phylogenetic study of the Meliaceae
family using DNA sequence data of plastid and nuclear genes proposed splitting the
Meliaceae family, which includes 50 genera and approximately 575 species, into two
subfamilies, the Melioideae and Swietenioideae.186,187 T. sinensis is placed into the Cedrelea
tribe of the Swietenioideae subfamily.188 This tribe is split into two genera, Cedrela and
Toona.188 The Toona genus was originally classified as part of the Cedrela genus by
Endlicher (1840), then it was separated into two genera by Roemer in 1846, due to some
differences in morphological features.189,190 Toona sinensis was originally classified as
Cedrela sinensis by Jussieu (1830).189
Plants of the Toona M. Roem genus are deciduous or semi-evergreen trees growing up to 50
m high, whose flowers are usually unisexual, with a 5-1 locular ovary and a woody
septifragal capsule fruit, which opens from the apex.186 The Toona genus is distributed from
Pakistan to China and Australia, and it is composed of 4 or 5 species.186 T. sinensis is the
only species which can be planted in the temperate zones, its seeds are winged at one end, its
male stamens are alternate, and its leaflets are serrate to serrulate,189 while in other species
the seeds are winged at two ends, their male stamens arise from androgynophore and their
leaflets are entire.186 T. sinensis M. Roem (syn. Cedrela sinensis A. Juss), commonly known
as the Chinese mahogany, Chinese toon and red toon, is widely distributed in eastern and
south-eastern Asia from India, Nepal, China, Burma, Thailand, Malaysia and Java to
Europe.189,190 It is cultivated in different parks and gardens including the garden of the Royal
Horticultural Society garden at Wisley in Surrey, England.189
Ethnobotany and biological screening of Toona sinensis
Different parts of T. sinensis are used in traditional Chinese medicine. The stem bark is used
as an astringent and depurative, the fruits are used to treat eye infections, the leaves are used
145
to treat dysentery, heliosis, vomiting, enteritis and itching and the roots are used as a
corrective for amenorrhea.189,191,192
Pharmacological and clinical studies of plant extracts and compounds isolated from T.
sinensis have been undertaken previously. It was reported that the DPPH scavenging
activities of the water extracts from T. sinensis bark, roots and leaf were more than 80% at a
concentration of 0.625 mg/ml, which was comparable to 0.1 mg/ml vitamin C, and mice fed
with any of these three extracts showed less amyloid -protein accumulation in the brain
tissue than the control group, which could improve working memory.193 The
supplementation of food with an aqueous extract of T. sinensis showed a decrease of the
reactive oxygen species (ROS) and restored the function and motility of sperm in rats under
oxidative stress.194 It was also reported that the leaf extract of T. sinensis improved the
enzyme activities of catalase, peroxidase and copper/zinc superoxide dismutase in the liver of
rats under oxidative stress induced by H2O2.195 It was found that the flavonoids, gallic acid,
methyl gallate, trigallic acid and gallotannins like quercetin-3-O--D-glucopyranoside were
the main cause of antioxidant activity of T. sinensis.192
It was observed that rutin extracted from T. sinensis acted as an immunostimulant for the
white shrimp Litopenaeus vannamei against the pathogen Vibrio alginolyticus at doses of 20
and 50 µg/ml by increasing phenoloxidase activity.196 The anti-inflammatory effects of the T.
sinensis compound, gallic acid, was exhibited by inhibition of LPS-induced inflammation in
nuclear factor–kB transgenic mice.197 Furthermore, betulonic acid and 3-oxours-12-en-28-
oic acid, which were isolated from T. sinensis, showed antitumor activities by induction of
cancer cell apoptosis with ratios of 27.3% and 24.5% at 20 µM after 72 h of treatment. Both
of these two compounds showed antiproliferative activities against PC3 with the IC50 values
26.5 and 21.9 µM respectively, and against MGC-803 with the IC50 values of 17.7 and 13.6
µM.198 The seed essential oil of Cedrela sinensis has been reported to show moderate anti-
bacterial activity against Staphylococcus aureus ATCC 25925, Bacillus subtilis ATCC 9372,
Pseudomonas aeruginosa ATCC 25916, Escherichia coli ATCC 25922 with the MIC values
between 192 to 390 µg/ml.199
146
Chemical constituents of Toona sinensis:
The main phytochemical characteristic of the Meliceae family is the presence of tetracyclic
triterpenes including distinctive nortriterpenoids (limonoids). The limonoids have been
shown to have insecticidal properties.186
Previous phytochemical investigations on T. sinensis have reported the presence of
triterpenoid compounds (1-40) [Figure 4.1], tetranortriterpenoids (41-46) [Figure 4.2],
lignans and norlignans (47-50) [Figure 4.3], flavonoids and biflavonoids (51-59) [Figure
4.4] and other compounds (60-65) [Figure 4.5].191,200-204
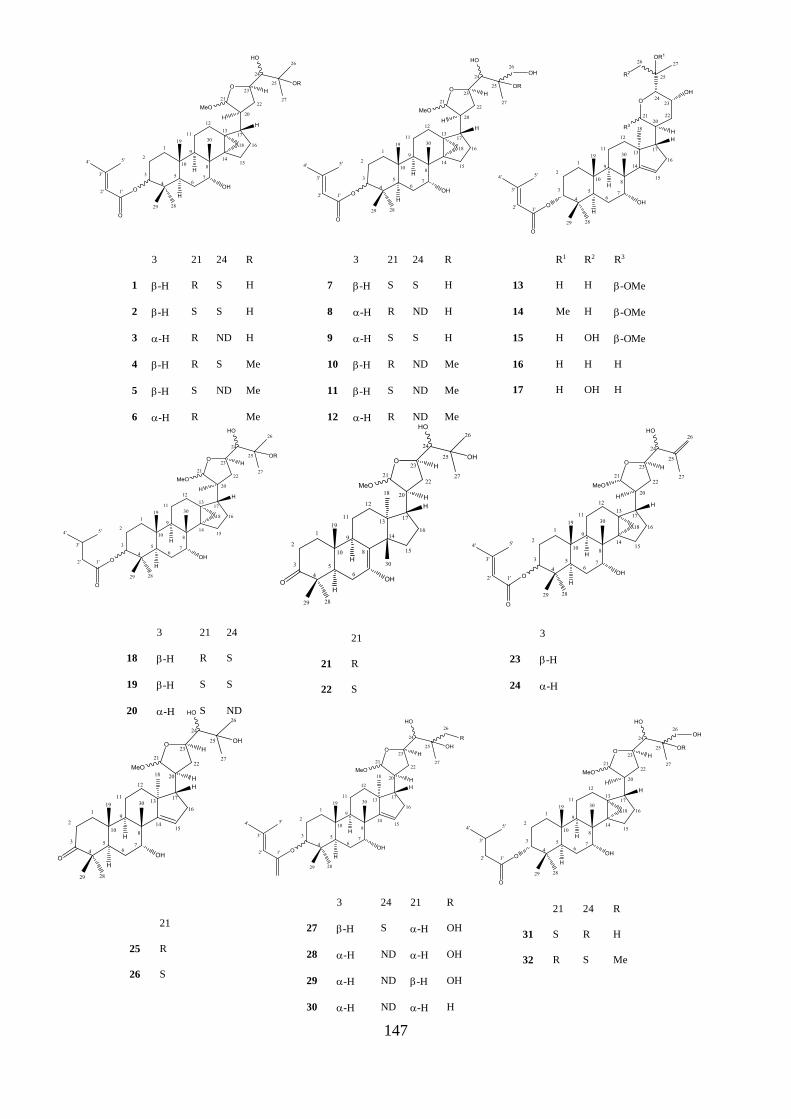
147
21
21 R
22 S
3 21 24
18 -H R S
19 -H S S
20 -H S ND
3
23 -H
24 -H
21 24 R
31 S R H
32 R S Me
3 21 24 R
1 -H R S H
2 -H S S H
3 -H R ND H
4 -H R S Me
5 -H S ND Me
6 -H R Me
3 21 24 R
7 -H S S H
8 -H R ND H
9 -H S S H
10 -H R ND Me
11 -H S ND Me
12 -H R ND Me
R1 R2 R3
13 H H -OMe
14 Me H -OMe
15 H OH -OMe
16 H H H
17 H OH H
21
25 R
26 S
3 24 21 R
27 -H S -H OH
28 -H ND -H OH
29 -H ND -H OH
30 -H ND -H H
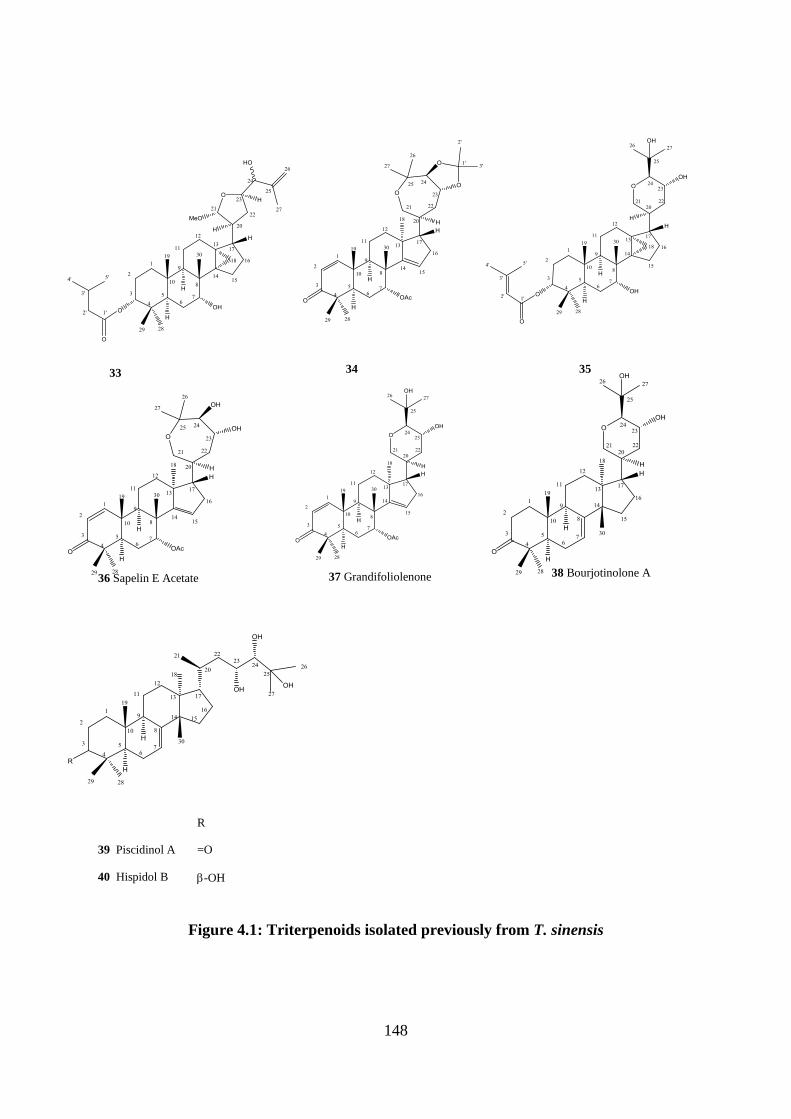
148
Figure 4.1: Triterpenoids isolated previously from T. sinensis
36 Sapelin E Acetate 37 Grandifoliolenone 38 Bourjotinolone A
R
39 Piscidinol A =O
40 Hispidol B -OH
33 34 35
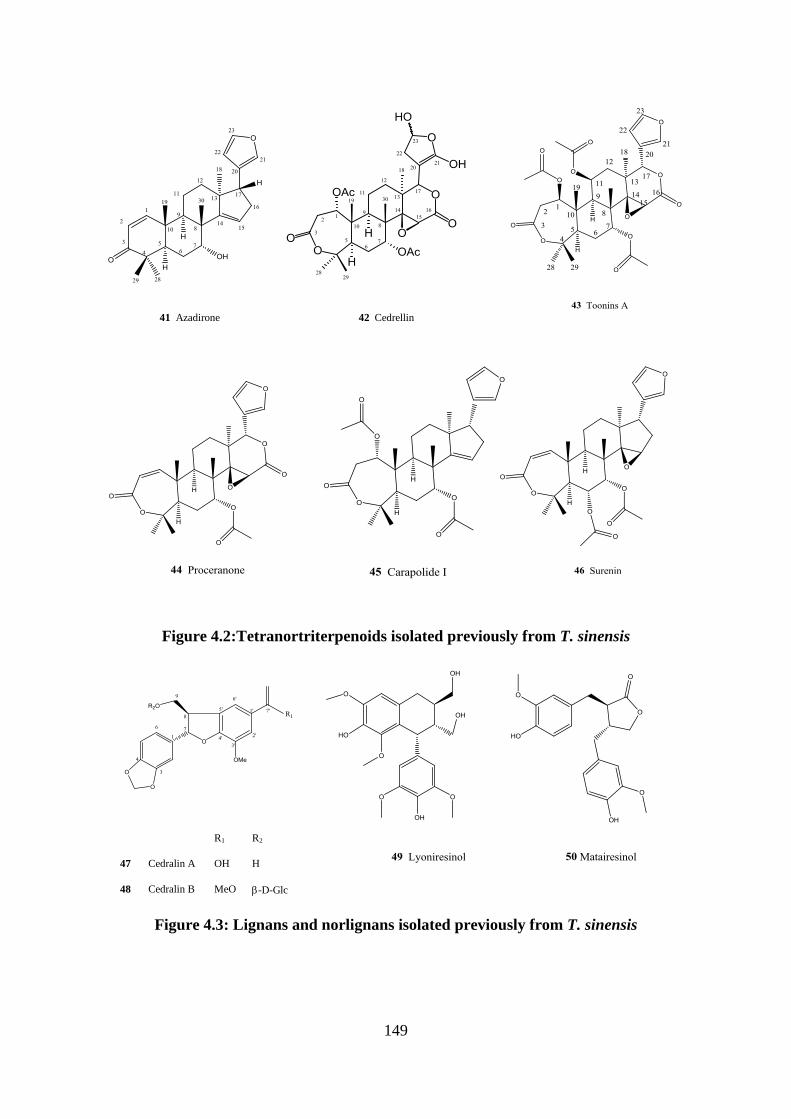
149
Figure 4.2:Tetranortriterpenoids isolated previously from T. sinensis
Figure 4.3: Lignans and norlignans isolated previously from T. sinensis
41 Azadirone 42 Cedrellin
R1 R2
47 Cedralin A OH H
48 Cedralin B MeO -D-Glc
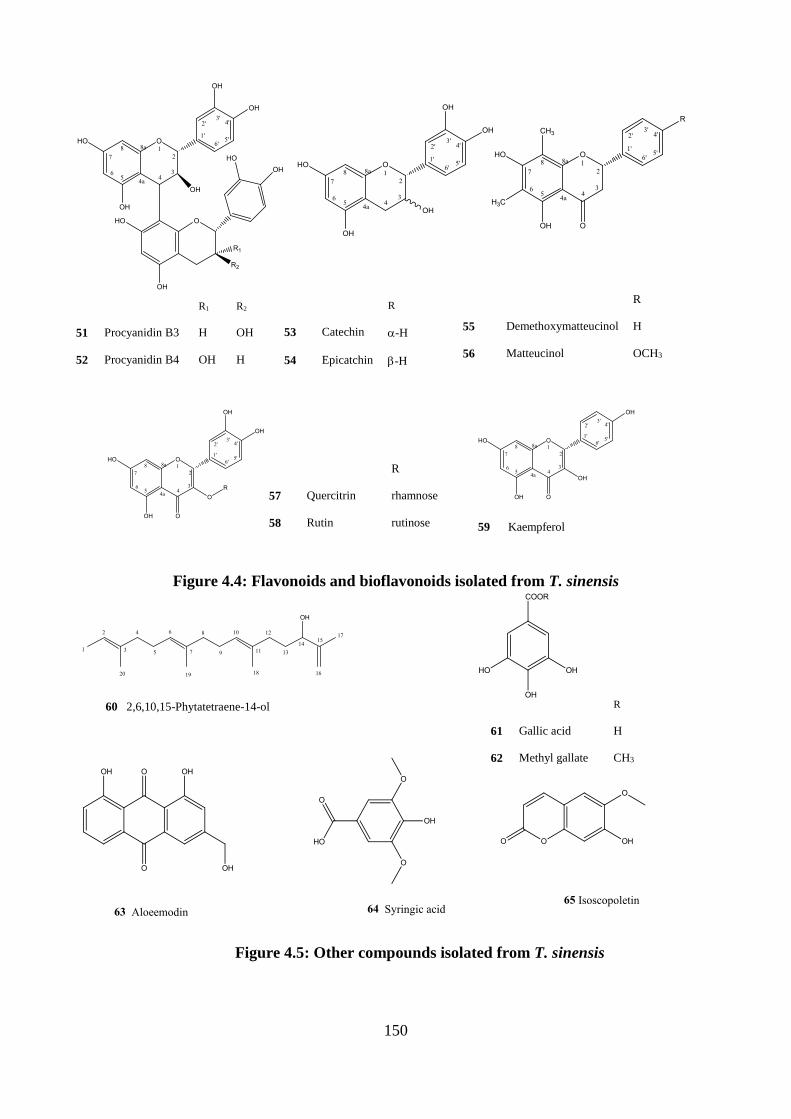
150
Figure 4.4: Flavonoids and bioflavonoids isolated from T. sinensis
Figure 4.5: Other compounds isolated from T. sinensis
R
57 Quercitrin rhamnose
58 Rutin rutinose
R
55 Demethoxymatteucinol H
56 Matteucinol OCH3
R1 R2
51 Procyanidin B3 H OH
52 Procyanidin B4 OH H
R
53 Catechin -H
54 Epicatchin -H
60 2,6,10,15-Phytatetraene-14-ol R
61 Gallic acid H
62 Methyl gallate CH3
59 Kaempferol
151
Result and discussion of Toona sinensis
The phyotochemistry of the Toona sinensis collected from Asia has been reported. The
objective of this study was to compare the chemical constituents of Toona sinensis, naturally
grown in Asia to this grown on the University of Surrey campus, Guildford, UK. The
investigation of this species was to provide me with training in phytochemical techniques.
The chemical constituents isolated included five triterpenoids, 24-methylencycloartan-3-yl
acetate (TS.1), 24-methylencycloartan-3-one (TS.2), 23,24,25-trihydroxytirucall-7-en-3-one
(TS.3), 24-methyltirucalla-8-en-3-ol (TS.4), -amyrin acetate (TS.5), and two flavonoids,
trans-catechin (TS.6) and cis-epicatechin (TS.7) along with two common phytosterols,
sitosterol (TS.8) and sitostenone (TS.9).
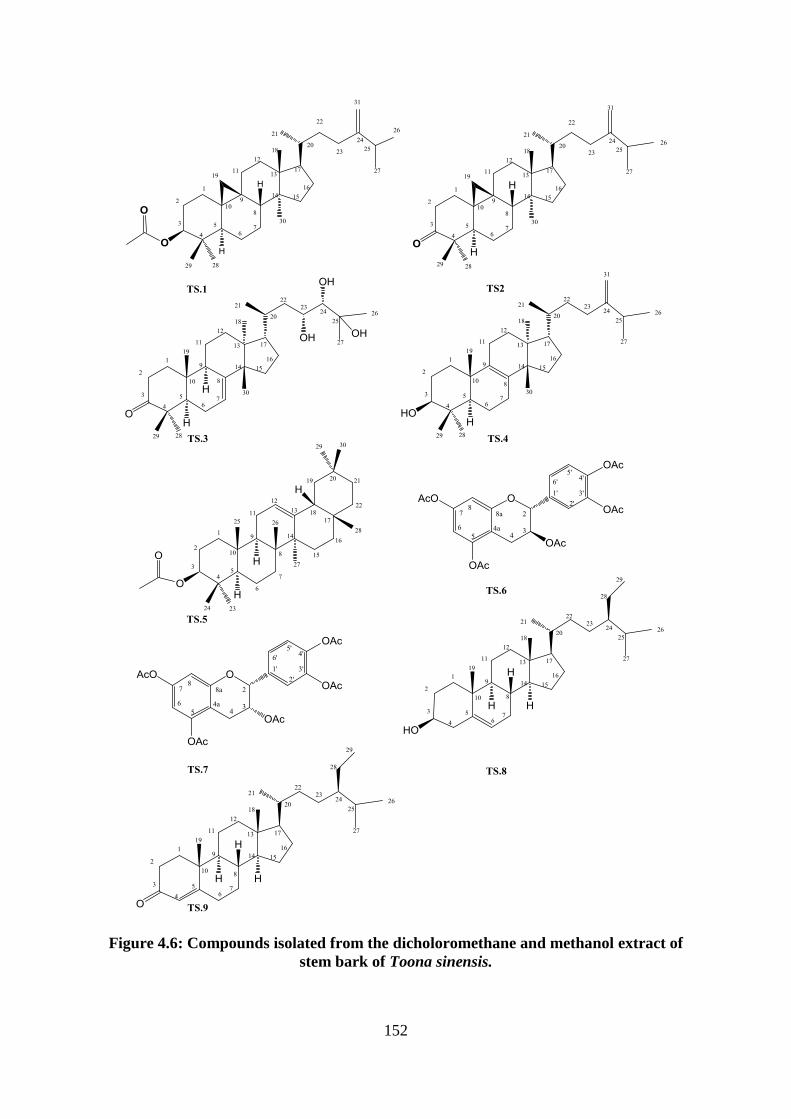
152
Figure 4.6: Compounds isolated from the dicholoromethane and methanol extract of
stem bark of Toona sinensis.
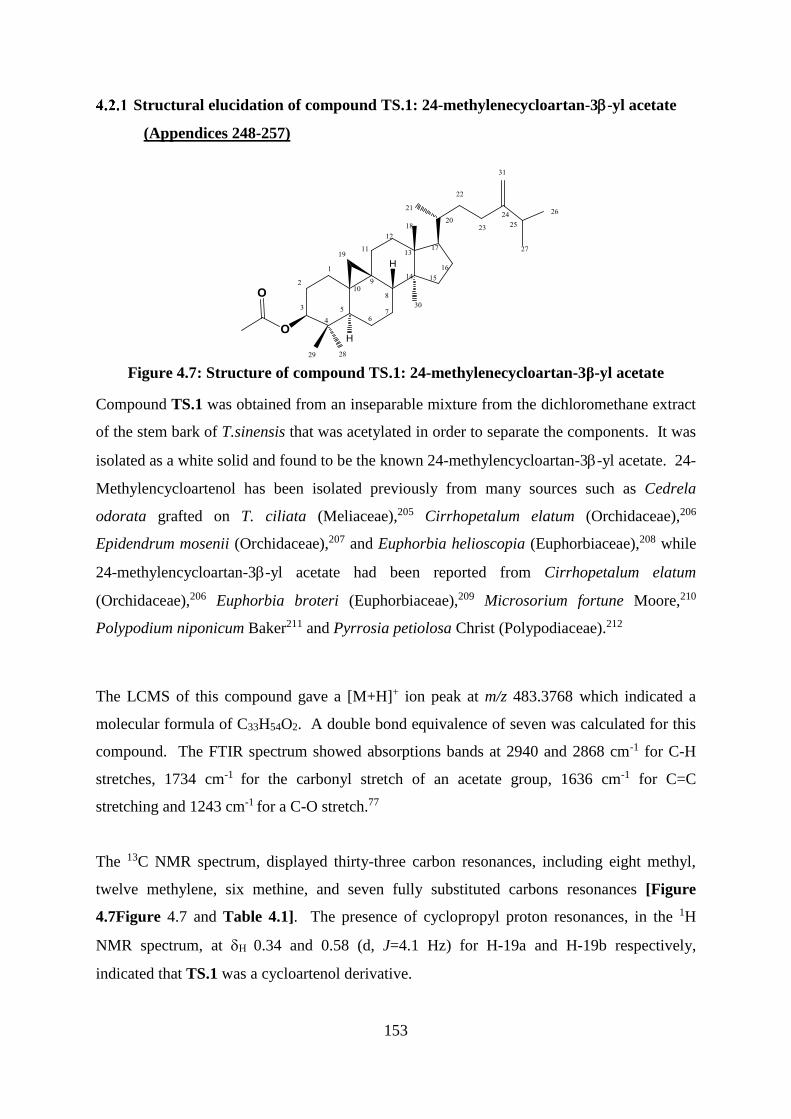
153
Structural elucidation of compound TS.1: 24-methylenecycloartan-3-yl acetate
(Appendices 248-257)
Figure 4.7: Structure of compound TS.1: 24-methylenecycloartan-3β-yl acetate
Compound TS.1 was obtained from an inseparable mixture from the dichloromethane extract
of the stem bark of T.sinensis that was acetylated in order to separate the components. It was
isolated as a white solid and found to be the known 24-methylencycloartan-3-yl acetate. 24-
Methylencycloartenol has been isolated previously from many sources such as Cedrela
odorata grafted on T. ciliata (Meliaceae),205 Cirrhopetalum elatum (Orchidaceae),206
Epidendrum mosenii (Orchidaceae),207 and Euphorbia helioscopia (Euphorbiaceae),208 while
24-methylencycloartan-3-yl acetate had been reported from Cirrhopetalum elatum
(Orchidaceae),206 Euphorbia broteri (Euphorbiaceae),209 Microsorium fortune Moore,210
Polypodium niponicum Baker211 and Pyrrosia petiolosa Christ (Polypodiaceae).212
The LCMS of this compound gave a [M+H]+ ion peak at m/z 483.3768 which indicated a
molecular formula of C33H54O2. A double bond equivalence of seven was calculated for this
compound. The FTIR spectrum showed absorptions bands at 2940 and 2868 cm-1 for C-H
stretches, 1734 cm-1 for the carbonyl stretch of an acetate group, 1636 cm-1 for C=C
stretching and 1243 cm-1 for a C-O stretch.77
The 13C NMR spectrum, displayed thirty-three carbon resonances, including eight methyl,
twelve methylene, six methine, and seven fully substituted carbons resonances [Figure
4.7Figure 4.7 and Table 4.1]. The presence of cyclopropyl proton resonances, in the 1H
NMR spectrum, at H 0.34 and 0.58 (d, J=4.1 Hz) for H-19a and H-19b respectively,
indicated that TS.1 was a cycloartenol derivative.
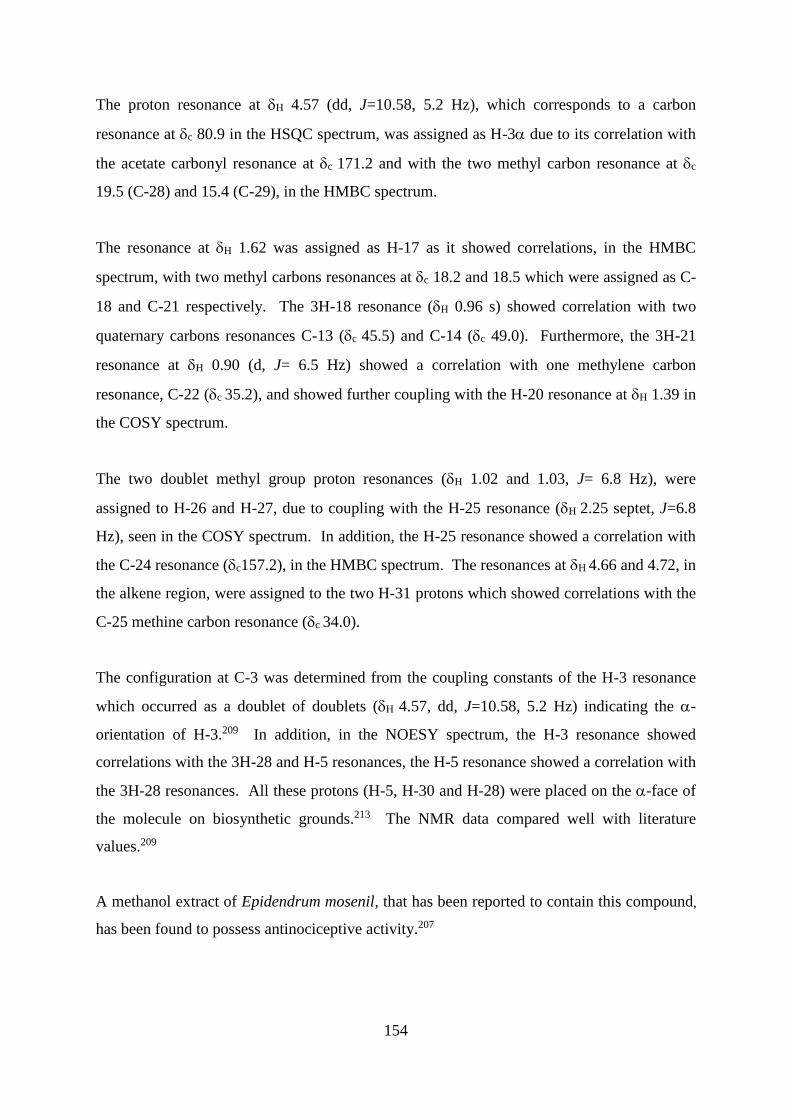
154
The proton resonance at H 4.57 (dd, J=10.58, 5.2 Hz), which corresponds to a carbon
resonance at c 80.9 in the HSQC spectrum, was assigned as H-3 due to its correlation with
the acetate carbonyl resonance at c 171.2 and with the two methyl carbon resonance at c
19.5 (C-28) and 15.4 (C-29), in the HMBC spectrum.
The resonance at H 1.62 was assigned as H-17 as it showed correlations, in the HMBC
spectrum, with two methyl carbons resonances at c 18.2 and 18.5 which were assigned as C-
18 and C-21 respectively. The 3H-18 resonance (H 0.96 s) showed correlation with two
quaternary carbons resonances C-13 (c 45.5) and C-14 (c 49.0). Furthermore, the 3H-21
resonance at H 0.90 (d, J= 6.5 Hz) showed a correlation with one methylene carbon
resonance, C-22 (c 35.2), and showed further coupling with the H-20 resonance at H 1.39 in
the COSY spectrum.
The two doublet methyl group proton resonances (H 1.02 and 1.03, J= 6.8 Hz), were
assigned to H-26 and H-27, due to coupling with the H-25 resonance (H 2.25 septet, J=6.8
Hz), seen in the COSY spectrum. In addition, the H-25 resonance showed a correlation with
the C-24 resonance (c157.2), in the HMBC spectrum. The resonances at H 4.66 and 4.72, in
the alkene region, were assigned to the two H-31 protons which showed correlations with the
C-25 methine carbon resonance (c 34.0).
The configuration at C-3 was determined from the coupling constants of the H-3 resonance
which occurred as a doublet of doublets (H 4.57, dd, J=10.58, 5.2 Hz) indicating the -
orientation of H-3.209 In addition, in the NOESY spectrum, the H-3 resonance showed
correlations with the 3H-28 and H-5 resonances, the H-5 resonance showed a correlation with
the 3H-28 resonances. All these protons (H-5, H-30 and H-28) were placed on the -face of
the molecule on biosynthetic grounds.213 The NMR data compared well with literature
values.209
A methanol extract of Epidendrum mosenil, that has been reported to contain this compound,
has been found to possess antinociceptive activity.207
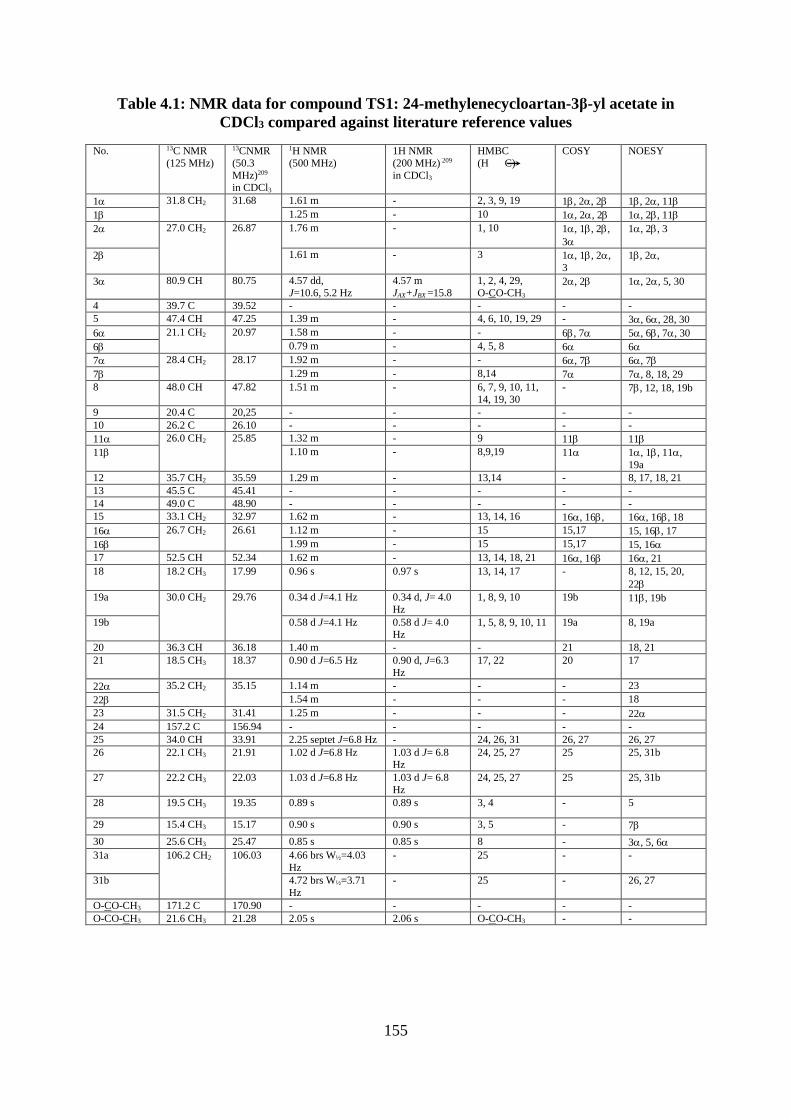
155
Table 4.1: NMR data for compound TS1: 24-methylenecycloartan-3β-yl acetate in
CDCl3 compared against literature reference values
No. 13C NMR
(125 MHz)
13CNMR
(50.3
MHz)209 in CDCl3
1H NMR
(500 MHz)
1H NMR
(200 MHz) 209
in CDCl3
HMBC
(H C)
COSY NOESY
1 31.8 CH2 31.68 1.61 m - 2, 3, 9, 19 1, 2, 2 1, 2, 11
1 1.25 m - 10 1, 2, 2 1, 2, 11
2 27.0 CH2 26.87 1.76 m - 1, 10 1, 1, 2,
3
1, 2, 3
2 1.61 m - 3 1, 1, 2,
3
1, 2,
3 80.9 CH 80.75 4.57 dd,
J=10.6, 5.2 Hz
4.57 m
JAX+JBX =15.8
1, 2, 4, 29,
O-CO-CH3 2, 2 1, 2, 5, 30
4 39.7 C 39.52 - - - - -
5 47.4 CH 47.25 1.39 m - 4, 6, 10, 19, 29 - 3, 6, 28, 30
6 21.1 CH2 20.97 1.58 m - - 6, 7 5, 6, 7, 30
6 0.79 m - 4, 5, 8 6 6
7 28.4 CH2 28.17 1.92 m - - 6, 7 6, 7
7 1.29 m - 8,14 7 7, 8, 18, 29
8 48.0 CH 47.82 1.51 m - 6, 7, 9, 10, 11,
14, 19, 30
- 7, 12, 18, 19b
9 20.4 C 20,25 - - - - -
10 26.2 C 26.10 - - - - -
11 26.0 CH2 25.85 1.32 m - 9 11 11
11 1.10 m - 8,9,19 11 1, 1, 11,
19a
12 35.7 CH2 35.59 1.29 m - 13,14 - 8, 17, 18, 21
13 45.5 C 45.41 - - - - -
14 49.0 C 48.90 - - - - -
15 33.1 CH2 32.97 1.62 m - 13, 14, 16 16, 16, 16, 16, 18
16 26.7 CH2 26.61 1.12 m - 15 15,17 15, 16, 17
16 1.99 m - 15 15,17 15, 16
17 52.5 CH 52.34 1.62 m - 13, 14, 18, 21 16, 16 16, 21
18 18.2 CH3 17.99 0.96 s 0.97 s 13, 14, 17 - 8, 12, 15, 20,
22
19a 30.0 CH2 29.76 0.34 d J=4.1 Hz 0.34 d, J= 4.0
Hz
1, 8, 9, 10 19b 11, 19b
19b 0.58 d J=4.1 Hz 0.58 d J= 4.0 Hz
1, 5, 8, 9, 10, 11 19a 8, 19a
20 36.3 CH 36.18 1.40 m - - 21 18, 21
21 18.5 CH3 18.37 0.90 d J=6.5 Hz 0.90 d, J=6.3
Hz
17, 22 20 17
22 35.2 CH2 35.15 1.14 m - - - 23
22 1.54 m - - - 18
23 31.5 CH2 31.41 1.25 m - - - 22
24 157.2 C 156.94 - - - - -
25 34.0 CH 33.91 2.25 septet J=6.8 Hz - 24, 26, 31 26, 27 26, 27
26 22.1 CH3 21.91 1.02 d J=6.8 Hz 1.03 d J= 6.8 Hz
24, 25, 27 25 25, 31b
27 22.2 CH3 22.03 1.03 d J=6.8 Hz 1.03 d J= 6.8
Hz
24, 25, 27 25 25, 31b
28 19.5 CH3 19.35 0.89 s 0.89 s 3, 4 - 5
29 15.4 CH3 15.17 0.90 s 0.90 s 3, 5 - 7
30 25.6 CH3 25.47 0.85 s 0.85 s 8 - 3, 5, 6
31a 106.2 CH2 106.03 4.66 brs W½=4.03
Hz
- 25 - -
31b 4.72 brs W½=3.71
Hz
- 25 - 26, 27
O-CO-CH3 171.2 C 170.90 - - - - -
O-CO-CH3 21.6 CH3 21.28 2.05 s 2.06 s O-CO-CH3 - -
156
Structural elucidation of compound TS.2: 24-methylenecycloartan-3-one
(Appendices 258-267)
Figure 4.8: Structure of compound TS.2: 24-methylenecycloartan-3-one
Compound TS.2 was isolated as a white oily material from the dichloromethane extract of the
stem bark of T. sinensis and was found to be 24-methylenecycloartan-3-one. It has been
isolated previously from many species for example, Cedrela odorata grafted on T. ciliata
(Meliaceae),205 Euphorbia helioscopia (Euphorbiaceae),208 Krameria tomentosa A. St Hill
(Krameriaceae),214 Larix kaempferi (Pinaceae),215 and Microsorium fortune Moore
(Polypodiaceae).210
The LCMS of this compound gave a [M+H]+ ion peak at m/z 439.3615 which indicated a
molecular formula of C31H50O for the compound. A double bond equivalence of seven was
calculated for this compound. The FTIR spectrum showed absorptions bands at 2919 and
2849 cm-1 for C-H stretches and 1708 cm-1 for the carbonyl stretch of a ketone group.77
Compound TS2 was similar to compound TS1 except that a ketone group was present at C-3
instead of the acetate group present in compound TS1. The H-3 resonance present in the 1H
NMR spectrum of compound TS1 at H 4.57 was missing in compound TS2, but the 13C
NMR spectrum for TS2 showed a resonance at c 216.9 for ketone group at C-3. The two H-
2 resonances appeared more downfield at H 2.72 and 2.30 in compound TS2 than in
compound TS1 (H 1.76 and 1.61). A comparison of the spectroscopic data for compound
TS2 with that found in the literature208,214,215 confirmed that compound TS2 was 24-
methylencycloartan-3-one [Figure 4.8 and Table 4.2].
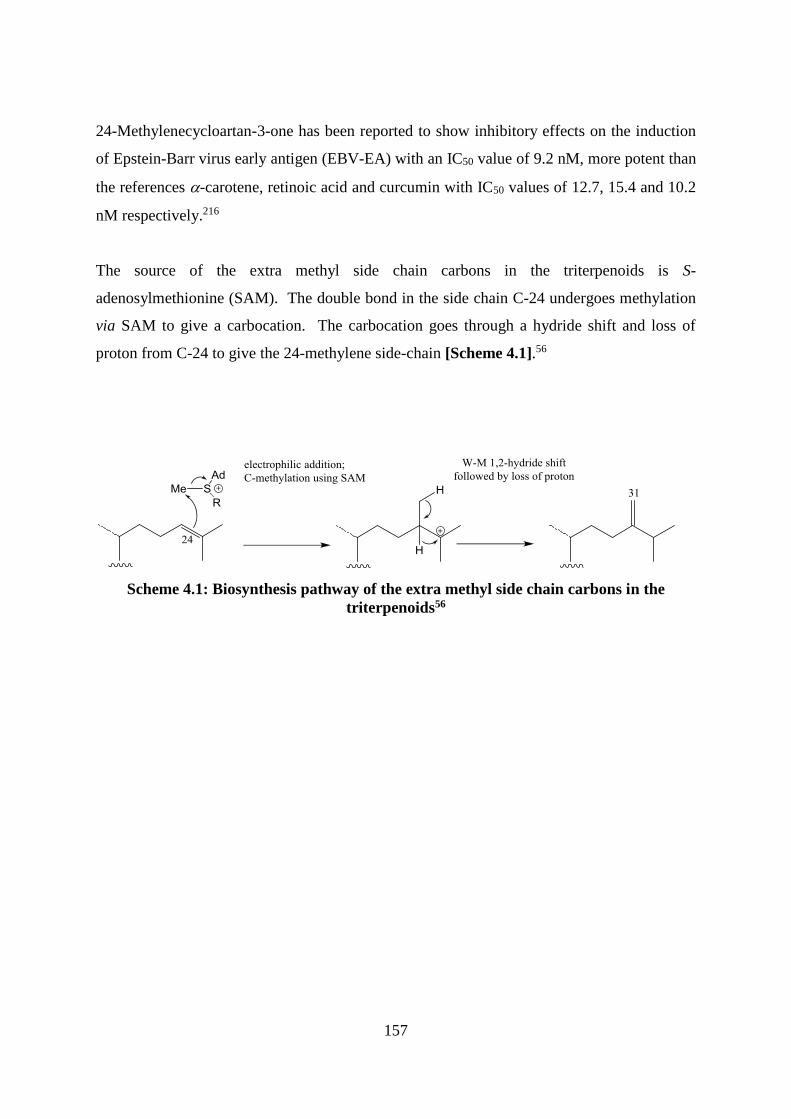
157
24-Methylenecycloartan-3-one has been reported to show inhibitory effects on the induction
of Epstein-Barr virus early antigen (EBV-EA) with an IC50 value of 9.2 nM, more potent than
the references -carotene, retinoic acid and curcumin with IC50 values of 12.7, 15.4 and 10.2
nM respectively.216
The source of the extra methyl side chain carbons in the triterpenoids is S-
adenosylmethionine (SAM). The double bond in the side chain C-24 undergoes methylation
via SAM to give a carbocation. The carbocation goes through a hydride shift and loss of
proton from C-24 to give the 24-methylene side-chain [Scheme 4.1].56
Scheme 4.1: Biosynthesis pathway of the extra methyl side chain carbons in the
triterpenoids56
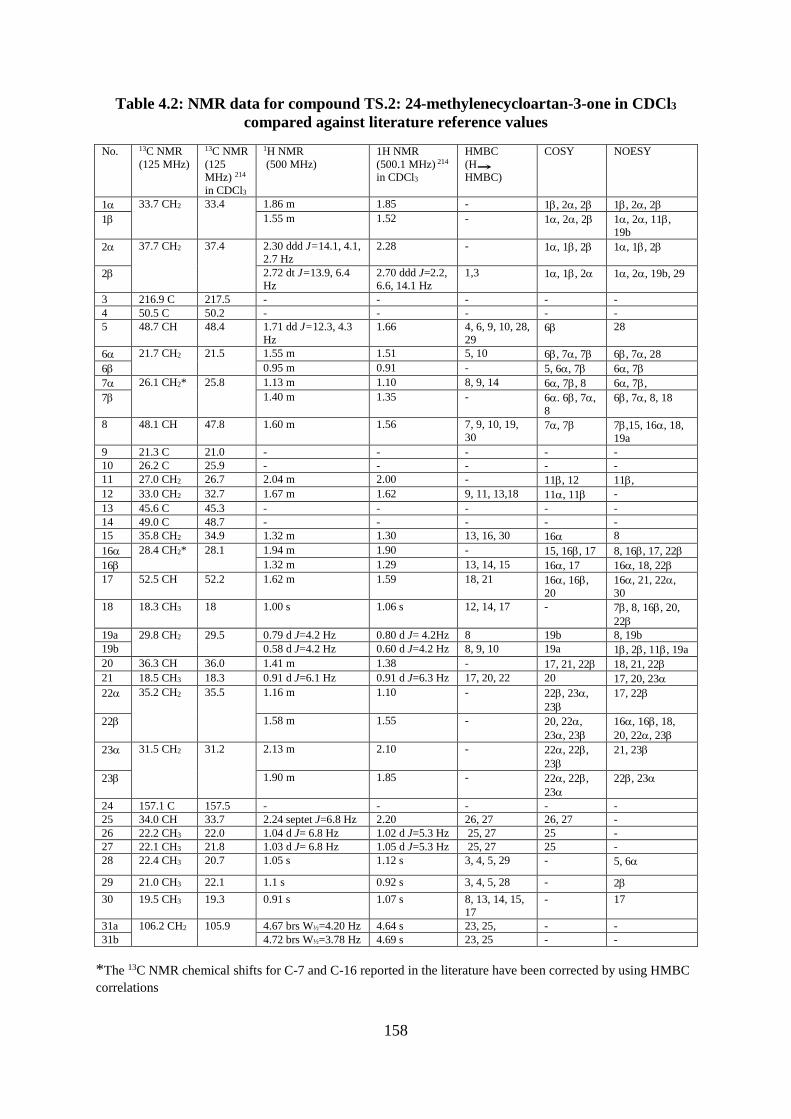
158
Table 4.2: NMR data for compound TS.2: 24-methylenecycloartan-3-one in CDCl3
compared against literature reference values
No. 13C NMR
(125 MHz)
13C NMR
(125
MHz) 214
in CDCl3
1H NMR
(500 MHz)
1H NMR
(500.1 MHz) 214
in CDCl3
HMBC
(H
HMBC)
COSY NOESY
1 33.7 CH2 33.4 1.86 m 1.85 - 1, 2, 2 1, 2, 2
1 1.55 m 1.52 - 1, 2, 2 1, 2, 11,
19b
2 37.7 CH2 37.4 2.30 ddd J=14.1, 4.1,
2.7 Hz
2.28 - 1, 1, 2 1, 1, 2
2 2.72 dt J=13.9, 6.4
Hz
2.70 ddd J=2.2,
6.6, 14.1 Hz
1,3 1, 1, 2 1, 2, 19b, 29
3 216.9 C 217.5 - - - - -
4 50.5 C 50.2 - - - - -
5 48.7 CH 48.4 1.71 dd J=12.3, 4.3
Hz
1.66 4, 6, 9, 10, 28,
29 6 28
6 21.7 CH2 21.5 1.55 m 1.51 5, 10 6, 7, 7 6, 7, 28
6 0.95 m 0.91 - 5, 6, 7 6, 7
7 26.1 CH2* 25.8 1.13 m 1.10 8, 9, 14 6, 7, 8 6, 7,
7 1.40 m 1.35 - 6. 6, 7,
8
6, 7, 8, 18
8 48.1 CH 47.8 1.60 m 1.56 7, 9, 10, 19,
30 7, 7 7,15, 16, 18,
19a
9 21.3 C 21.0 - - - - -
10 26.2 C 25.9 - - - - -
11 27.0 CH2 26.7 2.04 m 2.00 - 11, 12 11,
12 33.0 CH2 32.7 1.67 m 1.62 9, 11, 13,18 11, 11 -
13 45.6 C 45.3 - - - - -
14 49.0 C 48.7 - - - - -
15 35.8 CH2 34.9 1.32 m 1.30 13, 16, 30 16 8
16 28.4 CH2* 28.1 1.94 m 1.90 - 15, 16, 17 8, 16, 17, 22
16 1.32 m 1.29 13, 14, 15 16, 17 16, 18, 22
17 52.5 CH 52.2 1.62 m 1.59 18, 21 16, 16,
20
16, 21, 22,
30
18 18.3 CH3 18 1.00 s 1.06 s 12, 14, 17 - 7, 8, 16, 20,
22
19a 29.8 CH2 29.5 0.79 d J=4.2 Hz 0.80 d J= 4.2Hz 8 19b 8, 19b
19b 0.58 d J=4.2 Hz 0.60 d J=4.2 Hz 8, 9, 10 19a 1, 2, 11, 19a
20 36.3 CH 36.0 1.41 m 1.38 - 17, 21, 22 18, 21, 22
21 18.5 CH3 18.3 0.91 d J=6.1 Hz 0.91 d J=6.3 Hz 17, 20, 22 20 17, 20, 23
22 35.2 CH2 35.5 1.16 m 1.10 - 22, 23,
23
17, 22
22 1.58 m 1.55 - 20, 22,
23, 23
16, 16, 18,
20, 22, 23
23 31.5 CH2 31.2 2.13 m 2.10 - 22, 22,
23
21, 23
23 1.90 m 1.85 - 22, 22,
23
22, 23
24 157.1 C 157.5 - - - - -
25 34.0 CH 33.7 2.24 septet J=6.8 Hz 2.20 26, 27 26, 27 -
26 22.2 CH3 22.0 1.04 d J= 6.8 Hz 1.02 d J=5.3 Hz 25, 27 25 -
27 22.1 CH3 21.8 1.03 d J= 6.8 Hz 1.05 d J=5.3 Hz 25, 27 25 -
28 22.4 CH3 20.7 1.05 s 1.12 s 3, 4, 5, 29 - 5, 6
29 21.0 CH3 22.1 1.1 s 0.92 s 3, 4, 5, 28 - 2
30 19.5 CH3 19.3 0.91 s 1.07 s 8, 13, 14, 15,
17
- 17
31a 106.2 CH2 105.9 4.67 brs W½=4.20 Hz 4.64 s 23, 25, - -
31b 4.72 brs W½=3.78 Hz 4.69 s 23, 25 - -
*The 13C NMR chemical shifts for C-7 and C-16 reported in the literature have been corrected by using HMBC
correlations
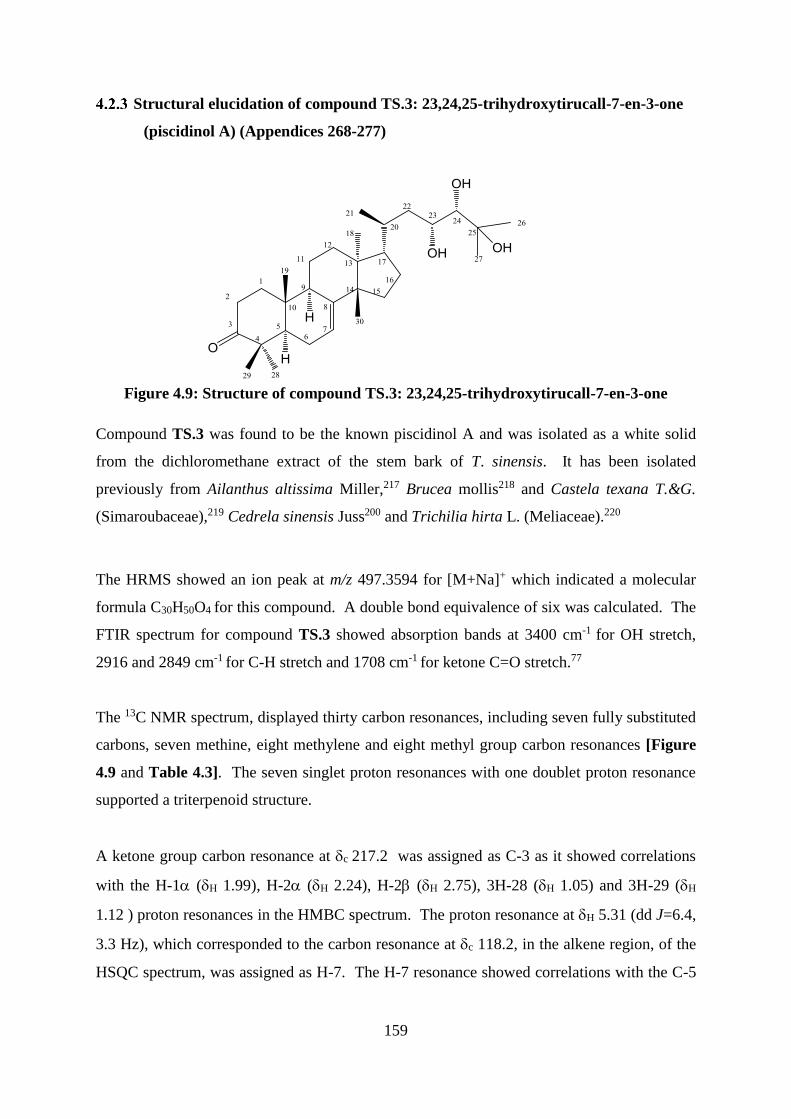
159
Structural elucidation of compound TS.3: 23,24,25-trihydroxytirucall-7-en-3-one
(piscidinol A) (Appendices 268-277)
Figure 4.9: Structure of compound TS.3: 23,24,25-trihydroxytirucall-7-en-3-one
Compound TS.3 was found to be the known piscidinol A and was isolated as a white solid
from the dichloromethane extract of the stem bark of T. sinensis. It has been isolated
previously from Ailanthus altissima Miller,217 Brucea mollis218 and Castela texana T.&G.
(Simaroubaceae),219 Cedrela sinensis Juss200 and Trichilia hirta L. (Meliaceae).220
The HRMS showed an ion peak at m/z 497.3594 for [M+Na]+ which indicated a molecular
formula C30H50O4 for this compound. A double bond equivalence of six was calculated. The
FTIR spectrum for compound TS.3 showed absorption bands at 3400 cm-1 for OH stretch,
2916 and 2849 cm-1 for C-H stretch and 1708 cm-1 for ketone C=O stretch.77
The 13C NMR spectrum, displayed thirty carbon resonances, including seven fully substituted
carbons, seven methine, eight methylene and eight methyl group carbon resonances [Figure
4.9 and Table 4.3]. The seven singlet proton resonances with one doublet proton resonance
supported a triterpenoid structure.
A ketone group carbon resonance at c 217.2 was assigned as C-3 as it showed correlations
with the H-1 (H 1.99), H-2 (H 2.24), H-2 (H 2.75), 3H-28 (H 1.05) and 3H-29 (H
1.12 ) proton resonances in the HMBC spectrum. The proton resonance at H 5.31 (dd J=6.4,
3.3 Hz), which corresponded to the carbon resonance at c 118.2, in the alkene region, of the
HSQC spectrum, was assigned as H-7. The H-7 resonance showed correlations with the C-5
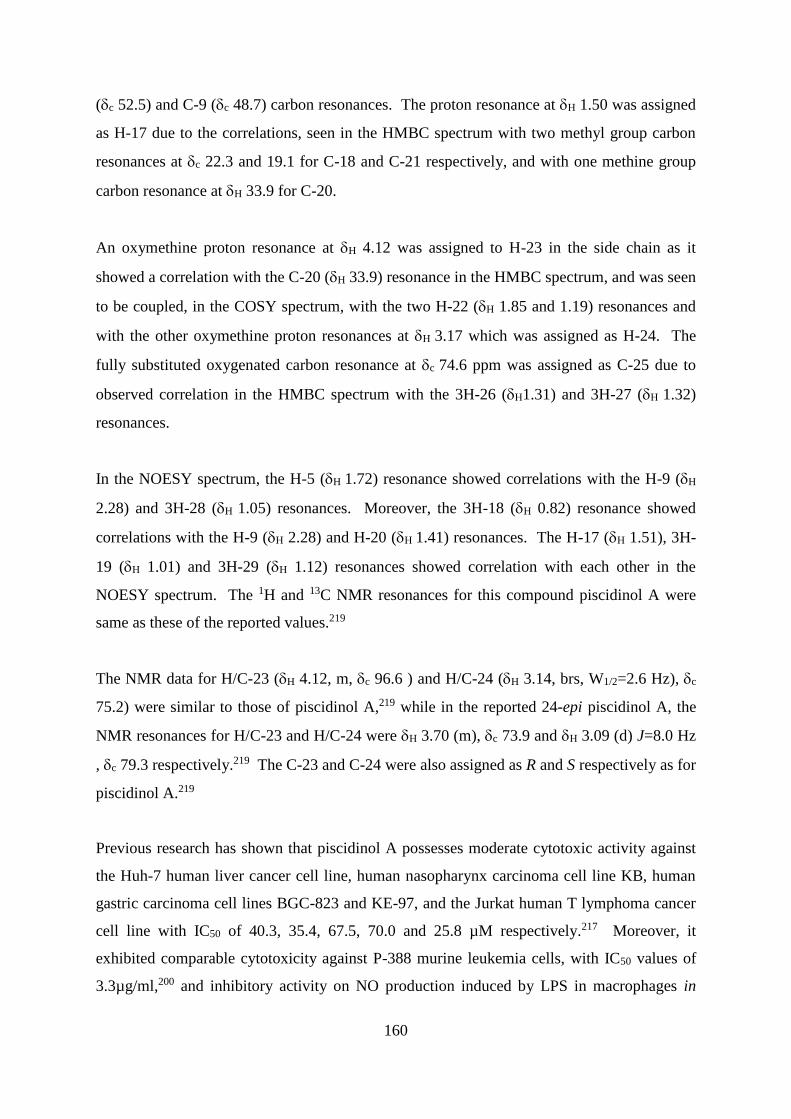
160
(c 52.5) and C-9 (c 48.7) carbon resonances. The proton resonance at H 1.50 was assigned
as H-17 due to the correlations, seen in the HMBC spectrum with two methyl group carbon
resonances at c 22.3 and 19.1 for C-18 and C-21 respectively, and with one methine group
carbon resonance at H 33.9 for C-20.
An oxymethine proton resonance at H 4.12 was assigned to H-23 in the side chain as it
showed a correlation with the C-20 (H 33.9) resonance in the HMBC spectrum, and was seen
to be coupled, in the COSY spectrum, with the two H-22 (H 1.85 and 1.19) resonances and
with the other oxymethine proton resonances at H 3.17 which was assigned as H-24. The
fully substituted oxygenated carbon resonance at c 74.6 ppm was assigned as C-25 due to
observed correlation in the HMBC spectrum with the 3H-26 (H1.31) and 3H-27 (H 1.32)
resonances.
In the NOESY spectrum, the H-5 (H 1.72) resonance showed correlations with the H-9 (H
2.28) and 3H-28 (H 1.05) resonances. Moreover, the 3H-18 (H 0.82) resonance showed
correlations with the H-9 (H 2.28) and H-20 (H 1.41) resonances. The H-17 (H 1.51), 3H-
19 (H 1.01) and 3H-29 (H 1.12) resonances showed correlation with each other in the
NOESY spectrum. The 1H and 13C NMR resonances for this compound piscidinol A were
same as these of the reported values.219
The NMR data for H/C-23 (H 4.12, m, c 96.6 ) and H/C-24 (H 3.14, brs, W1/2=2.6 Hz), c
75.2) were similar to those of piscidinol A,219 while in the reported 24-epi piscidinol A, the
NMR resonances for H/C-23 and H/C-24 were H 3.70 (m), c 73.9 and H 3.09 (d) J=8.0 Hz
, c 79.3 respectively.219 The C-23 and C-24 were also assigned as R and S respectively as for
piscidinol A.219
Previous research has shown that piscidinol A possesses moderate cytotoxic activity against
the Huh-7 human liver cancer cell line, human nasopharynx carcinoma cell line KB, human
gastric carcinoma cell lines BGC-823 and KE-97, and the Jurkat human T lymphoma cancer
cell line with IC50 of 40.3, 35.4, 67.5, 70.0 and 25.8 µM respectively.217 Moreover, it
exhibited comparable cytotoxicity against P-388 murine leukemia cells, with IC50 values of
3.3µg/ml,200 and inhibitory activity on NO production induced by LPS in macrophages in
161
vitro at a concentration of 10 µM, with inhibitory ratios of 68.2 ± 4.5%.218 However, it was
reported that piscidinol A was inactive against the human ovarian carcinoma SKOV-3,
human breast carcinoma SK-Br-3, human chronic myelogenous leukemia K562, oral human
epidermoid carcinoma KB cancer cell lines, and for antiprotozoal activity against Crithidia
fasciculate (ATCC 11745) and Giardia intestinalis (ATCC 30888) at concentrations below
20 µg /ml.219
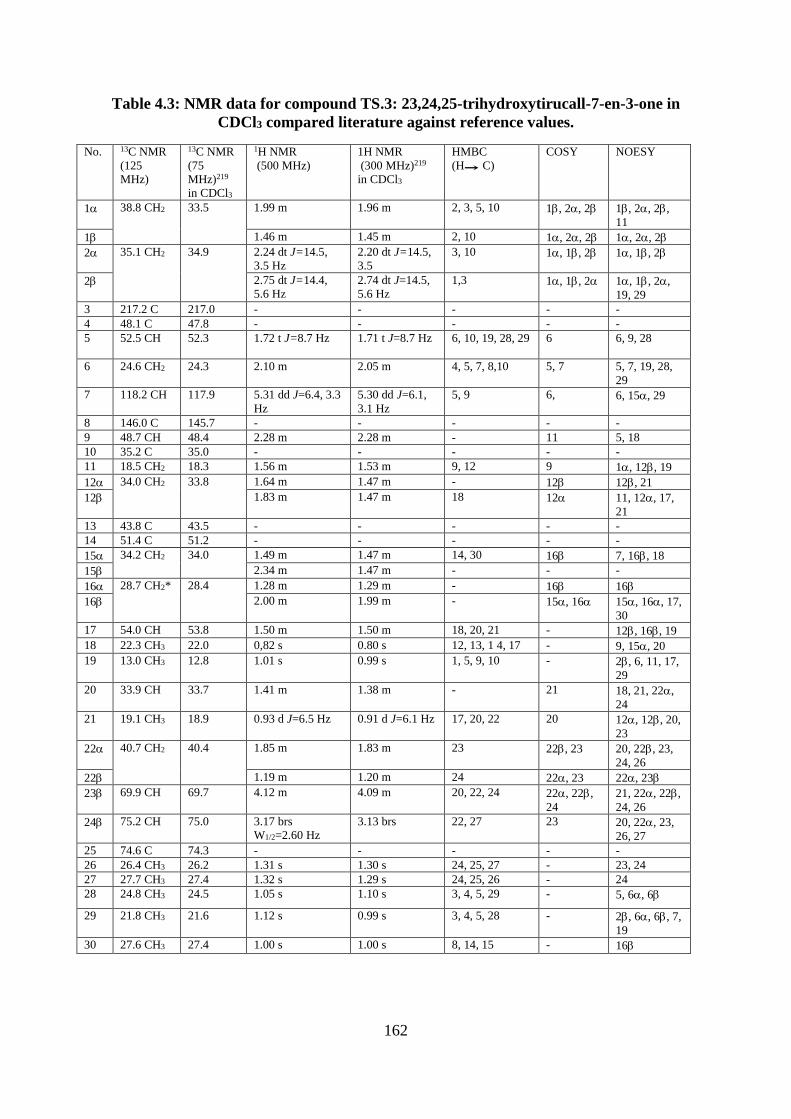
162
Table 4.3: NMR data for compound TS.3: 23,24,25-trihydroxytirucall-7-en-3-one in
CDCl3 compared literature against reference values.
No. 13C NMR
(125
MHz)
13C NMR
(75
MHz)219
in CDCl3
1H NMR
(500 MHz)
1H NMR
(300 MHz)219
in CDCl3
HMBC
(H C)
COSY NOESY
1 38.8 CH2 33.5 1.99 m 1.96 m 2, 3, 5, 10 1, 2, 2 1, 2, 2,
11
1 1.46 m 1.45 m 2, 10 1, 2, 2 1, 2, 2
2 35.1 CH2 34.9 2.24 dt J=14.5,
3.5 Hz
2.20 dt J=14.5,
3.5
3, 10 1, 1, 2 1, 1, 2
2 2.75 dt J=14.4,
5.6 Hz
2.74 dt J=14.5,
5.6 Hz
1,3 1, 1, 2 1, 1, 2,
19, 29
3 217.2 C 217.0 - - - - -
4 48.1 C 47.8 - - - - -
5 52.5 CH 52.3 1.72 t J=8.7 Hz 1.71 t J=8.7 Hz 6, 10, 19, 28, 29 6 6, 9, 28
6 24.6 CH2 24.3 2.10 m 2.05 m 4, 5, 7, 8,10 5, 7 5, 7, 19, 28,
29
7 118.2 CH 117.9 5.31 dd J=6.4, 3.3
Hz
5.30 dd J=6.1,
3.1 Hz
5, 9 6, 6, 15, 29
8 146.0 C 145.7 - - - - -
9 48.7 CH 48.4 2.28 m 2.28 m - 11 5, 18
10 35.2 C 35.0 - - - - -
11 18.5 CH2 18.3 1.56 m 1.53 m 9, 12 9 1, 12, 19
12 34.0 CH2 33.8 1.64 m 1.47 m - 12 12, 21
12 1.83 m 1.47 m 18 12 11, 12, 17,
21
13 43.8 C 43.5 - - - - -
14 51.4 C 51.2 - - - - -
15 34.2 CH2 34.0 1.49 m 1.47 m 14, 30 16 7, 16, 18
15 2.34 m 1.47 m - - -
16 28.7 CH2* 28.4 1.28 m 1.29 m - 16 16
16 2.00 m 1.99 m - 15, 16 15, 16, 17,
30
17 54.0 CH 53.8 1.50 m 1.50 m 18, 20, 21 - 12, 16, 19
18 22.3 CH3 22.0 0,82 s 0.80 s 12, 13, 1 4, 17 - 9, 15, 20
19 13.0 CH3 12.8 1.01 s 0.99 s 1, 5, 9, 10 - 2, 6, 11, 17,
29
20 33.9 CH 33.7 1.41 m 1.38 m - 21 18, 21, 22,
24
21 19.1 CH3 18.9 0.93 d J=6.5 Hz 0.91 d J=6.1 Hz 17, 20, 22 20 12, 12, 20,
23
22 40.7 CH2 40.4 1.85 m 1.83 m 23 22, 23 20, 22, 23,
24, 26
22 1.19 m 1.20 m 24 22, 23 22, 23
23 69.9 CH 69.7 4.12 m 4.09 m 20, 22, 24 22, 22,
24
21, 22, 22,
24, 26
24 75.2 CH 75.0 3.17 brs
W1/2=2.60 Hz
3.13 brs 22, 27 23 20, 22, 23,
26, 27
25 74.6 C 74.3 - - - - -
26 26.4 CH3 26.2 1.31 s 1.30 s 24, 25, 27 - 23, 24
27 27.7 CH3 27.4 1.32 s 1.29 s 24, 25, 26 - 24
28 24.8 CH3 24.5 1.05 s 1.10 s 3, 4, 5, 29 - 5, 6, 6
29 21.8 CH3 21.6 1.12 s 0.99 s 3, 4, 5, 28 - 2, 6, 6, 7,
19
30 27.6 CH3 27.4 1.00 s 1.00 s 8, 14, 15 - 16
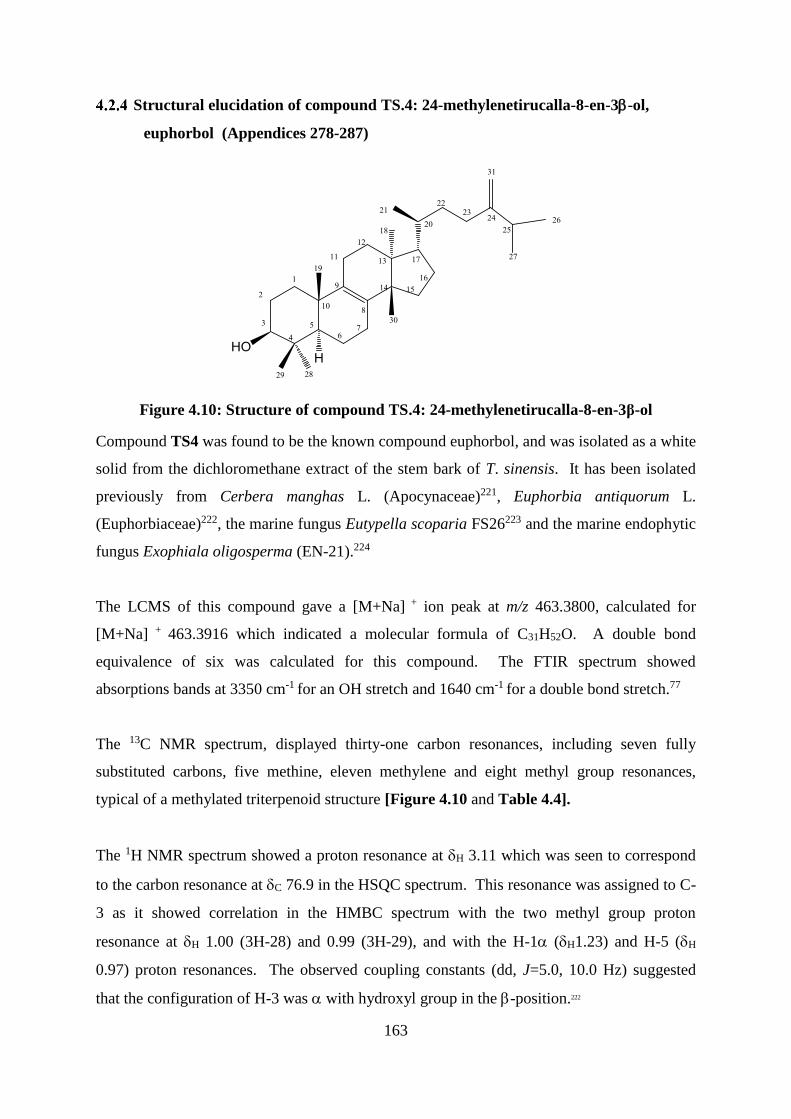
163
Structural elucidation of compound TS.4: 24-methylenetirucalla-8-en-3-ol,
euphorbol (Appendices 278-287)
Figure 4.10: Structure of compound TS.4: 24-methylenetirucalla-8-en-3β-ol
Compound TS4 was found to be the known compound euphorbol, and was isolated as a white
solid from the dichloromethane extract of the stem bark of T. sinensis. It has been isolated
previously from Cerbera manghas L. (Apocynaceae)221, Euphorbia antiquorum L.
(Euphorbiaceae)222, the marine fungus Eutypella scoparia FS26223 and the marine endophytic
fungus Exophiala oligosperma (EN-21).224
The LCMS of this compound gave a [M+Na] + ion peak at m/z 463.3800, calculated for
[M+Na] + 463.3916 which indicated a molecular formula of C31H52O. A double bond
equivalence of six was calculated for this compound. The FTIR spectrum showed
absorptions bands at 3350 cm-1 for an OH stretch and 1640 cm-1 for a double bond stretch.77
The 13C NMR spectrum, displayed thirty-one carbon resonances, including seven fully
substituted carbons, five methine, eleven methylene and eight methyl group resonances,
typical of a methylated triterpenoid structure [Figure 4.10 and Table 4.4].
The 1H NMR spectrum showed a proton resonance at H 3.11 which was seen to correspond
to the carbon resonance at C 76.9 in the HSQC spectrum. This resonance was assigned to C-
3 as it showed correlation in the HMBC spectrum with the two methyl group proton
resonance at H 1.00 (3H-28) and 0.99 (3H-29), and with the H-1 (H1.23) and H-5 (H
0.97) proton resonances. The observed coupling constants (dd, J=5.0, 10.0 Hz) suggested
that the configuration of H-3 was with hydroxyl group in the -position.222
164
The two fully substituted carbon resonances at c 134.9 and 133.8 ppm were assigned as C-8
and C-9 respectively due to their correlation with the H-5 (H 0.97), 2H-7 (H 2.04) and 2H-
11 (H 2.06) resonances in the HMBC spectrum. The other alkene carbon resonances at
c157.2 and 106.2 were assigned as C-24 and C-31 respectively because of their correlations
with the two H-23 (H 2.12, 1.89), H-25 (H 2.22), 3H-26 (H 1.02, d J=6.8) and 3H-27 (H
1.03, d J=6.8) proton resonances.
In the NOESY spectrum, the H-3 resonance showed correlations with the 3H-28 and H-5
resonances, and the H-5 resonance showed a further correlation with the 3H-18 (H 0.71)
resonance. All these protons (H-5, H-18 and H-28) were placed in the -orientation on
biosynthetic grounds.213 The H-17 resonance (H 1.50) showed correlations with the 3H-30
(H 0.89), which are in the -orientation on biosynthetic grounds.213
The 1H NMR and 13C NMR chemical shifts [Table 4.4] for compound TS.4 were similar to
those of the known euphorbol 222 except for the C-3, C-5, C-7 and C-19 chemical shifts which
were at c 76.9, 47.3, 25.8 and 18.4 ppm respectively for compound TS4 and at c 79.0, 51.0,
27.7 and 20.2 ppm for the reported compound. A further search in the literature showed that
euphorbol had chemical shifts at 76.5 and 18.3 ppm for C-3 and C-19 respectively.221
However, the 1D and 2D-NMR spectrum confirmed that compound TS4 is 24-
methyltirucalla-8,24-dien-3-ol (euphorbol).
Previous research showed that euphorbol had 100% inhibitory effect on the Epstein-Barr
virus early antigen (EBV-EA ) activation induced by the tumour promoter TPA at 1000 mol
ratio/TPA, while -carotene showed 8.6% inhibitory effect at the same concentration.222
Furthermore, it showed 93.6 and 90.3% inhibition rates against the MCF-7 and SF-268
tumour cell lines respectively at 100 µM and weak cytotoxicity against NCI-H460 cell line at
the same concentration.223
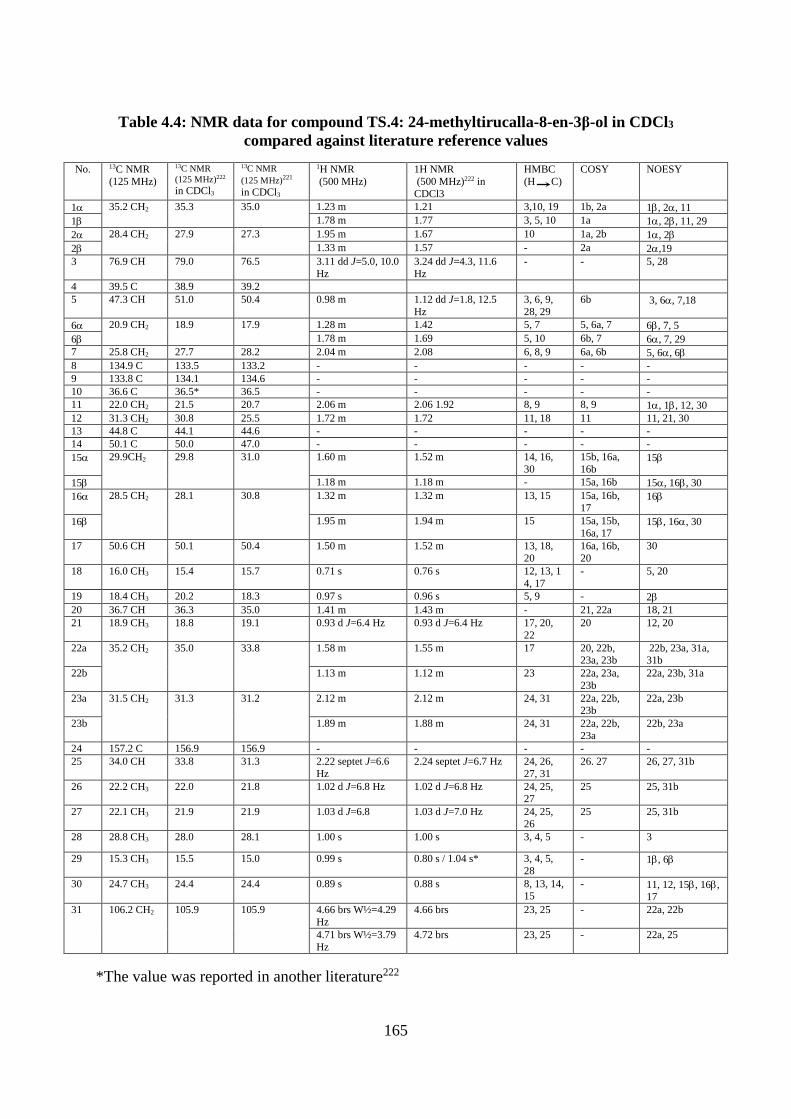
165
Table 4.4: NMR data for compound TS.4: 24-methyltirucalla-8-en-3β-ol in CDCl3
compared against literature reference values
No. 13C NMR
(125 MHz)
13C NMR
(125 MHz)222
in CDCl3
13C NMR
(125 MHz)221
in CDCl3
1H NMR
(500 MHz)
1H NMR
(500 MHz)222 in
CDCl3
HMBC
(H C)
COSY NOESY
1 35.2 CH2 35.3 35.0 1.23 m 1.21 3,10, 19 1b, 2a 1, 2, 11
1 1.78 m 1.77 3, 5, 10 1a 1, 2, 11, 29
2 28.4 CH2 27.9 27.3 1.95 m 1.67 10 1a, 2b 1, 2
2 1.33 m 1.57 - 2a 2,19
3 76.9 CH 79.0 76.5 3.11 dd J=5.0, 10.0
Hz
3.24 dd J=4.3, 11.6
Hz
- - 5, 28
4 39.5 C 38.9 39.2
5 47.3 CH 51.0 50.4 0.98 m 1.12 dd J=1.8, 12.5
Hz
3, 6, 9,
28, 29
6b 3, 6, 7,18
6 20.9 CH2 18.9 17.9 1.28 m 1.42 5, 7 5, 6a, 7 6, 7, 5
6 1.78 m 1.69 5, 10 6b, 7 6, 7, 29
7 25.8 CH2 27.7 28.2 2.04 m 2.08 6, 8, 9 6a, 6b 5, 6, 6
8 134.9 C 133.5 133.2 - - - - -
9 133.8 C 134.1 134.6 - - - - -
10 36.6 C 36.5* 36.5 - - - - -
11 22.0 CH2 21.5 20.7 2.06 m 2.06 1.92 8, 9 8, 9 1, 1, 12, 30
12 31.3 CH2 30.8 25.5 1.72 m 1.72 11, 18 11 11, 21, 30
13 44.8 C 44.1 44.6 - - - - -
14 50.1 C 50.0 47.0 - - - - -
15 29.9CH2 29.8 31.0 1.60 m 1.52 m 14, 16,
30
15b, 16a,
16b 15
15 1.18 m 1.18 m - 15a, 16b 15, 16, 30
16 28.5 CH2 28.1 30.8 1.32 m 1.32 m 13, 15 15a, 16b,
17 16
16 1.95 m 1.94 m 15 15a, 15b,
16a, 17 15, 16, 30
17 50.6 CH 50.1 50.4 1.50 m 1.52 m 13, 18,
20
16a, 16b,
20
30
18 16.0 CH3 15.4 15.7 0.71 s 0.76 s 12, 13, 1
4, 17
- 5, 20
19 18.4 CH3 20.2 18.3 0.97 s 0.96 s 5, 9 - 2
20 36.7 CH 36.3 35.0 1.41 m 1.43 m - 21, 22a 18, 21
21 18.9 CH3 18.8 19.1 0.93 d J=6.4 Hz 0.93 d J=6.4 Hz 17, 20,
22
20 12, 20
22a 35.2 CH2 35.0 33.8 1.58 m 1.55 m 17 20, 22b, 23a, 23b
22b, 23a, 31a, 31b
22b 1.13 m 1.12 m 23 22a, 23a,
23b
22a, 23b, 31a
23a 31.5 CH2 31.3 31.2 2.12 m 2.12 m 24, 31 22a, 22b, 23b
22a, 23b
23b 1.89 m 1.88 m 24, 31 22a, 22b,
23a
22b, 23a
24 157.2 C 156.9 156.9 - - - - -
25 34.0 CH 33.8 31.3 2.22 septet J=6.6
Hz
2.24 septet J=6.7 Hz 24, 26,
27, 31
26. 27 26, 27, 31b
26 22.2 CH3 22.0 21.8 1.02 d J=6.8 Hz 1.02 d J=6.8 Hz 24, 25, 27
25 25, 31b
27 22.1 CH3 21.9 21.9 1.03 d J=6.8 1.03 d J=7.0 Hz 24, 25,
26
25 25, 31b
28 28.8 CH3 28.0 28.1 1.00 s 1.00 s 3, 4, 5 - 3
29 15.3 CH3 15.5 15.0 0.99 s 0.80 s / 1.04 s* 3, 4, 5,
28
- 1, 6
30 24.7 CH3 24.4 24.4 0.89 s 0.88 s 8, 13, 14, 15
- 11, 12, 15, 16, 17
31 106.2 CH2 105.9 105.9 4.66 brs W½=4.29
Hz
4.66 brs 23, 25 - 22a, 22b
4.71 brs W½=3.79
Hz
4.72 brs 23, 25 - 22a, 25
*The value was reported in another literature222
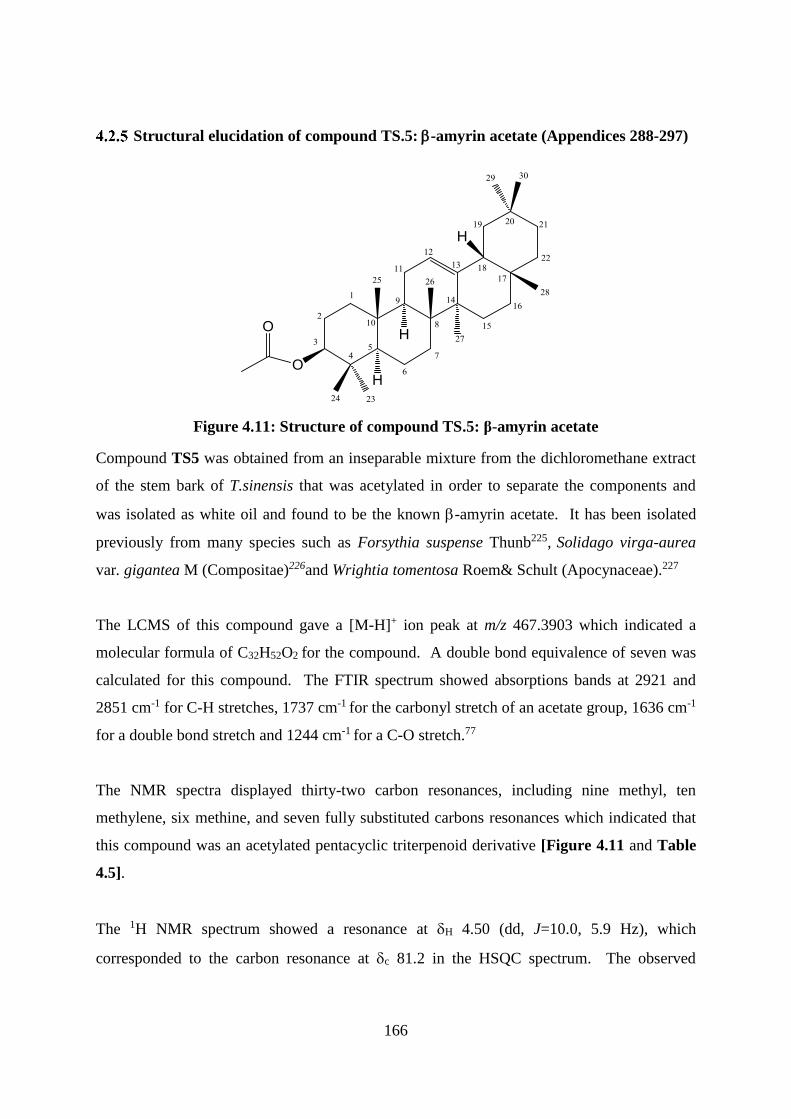
166
Structural elucidation of compound TS.5: -amyrin acetate (Appendices 288-297)
Figure 4.11: Structure of compound TS.5: β-amyrin acetate
Compound TS5 was obtained from an inseparable mixture from the dichloromethane extract
of the stem bark of T.sinensis that was acetylated in order to separate the components and
was isolated as white oil and found to be the known -amyrin acetate. It has been isolated
previously from many species such as Forsythia suspense Thunb225, Solidago virga-aurea
var. gigantea M (Compositae)226and Wrightia tomentosa Roem& Schult (Apocynaceae).227
The LCMS of this compound gave a [M-H]+ ion peak at m/z 467.3903 which indicated a
molecular formula of C32H52O2 for the compound. A double bond equivalence of seven was
calculated for this compound. The FTIR spectrum showed absorptions bands at 2921 and
2851 cm-1 for C-H stretches, 1737 cm-1 for the carbonyl stretch of an acetate group, 1636 cm-1
for a double bond stretch and 1244 cm-1 for a C-O stretch.77
The NMR spectra displayed thirty-two carbon resonances, including nine methyl, ten
methylene, six methine, and seven fully substituted carbons resonances which indicated that
this compound was an acetylated pentacyclic triterpenoid derivative [Figure 4.11 and Table
4.5].
The 1H NMR spectrum showed a resonance at H 4.50 (dd, J=10.0, 5.9 Hz), which
corresponded to the carbon resonance at c 81.2 in the HSQC spectrum. The observed
167
coupling constants suggested that the configuration of H-3 was with the acetate group in
the -position.218, 225,226
This proton resonance showed correlations with the two methyl group carbon resonances 3H-
23 (H 0.87, s) and 3H-24 (H 0.86, s), in the HMBC spectrum. The olefinic proton
resonance, H-12 (H5.18, t, J=3.7), showed correlations with the C-9 (c 47.8) and C-18 (c
47.5) carbon resonances in the HMBC spectrum, and it showed further coupling with the H-
11 (H 1.87) resonance in the COSY spectrum. The correlation between the proton resonance
at H 1.13 (3H-27) and c145.5 (C-13) in the HMBC spectrum confirmed this placement for
the alkene group.
In the NOESY spectrum, the H-3 resonance at H 4.50 showed correlations with the H-5 (H
0.84) and H-9 (H 1.58) resonances. The H-9 resonance showed also correlations with the H-
5 (H 0.84) and 3H-27 (H 1.13) resonances. All these protons (H-5, H-9, 3H-27) are in the -
orientation according to the biosynthesis, while the H-18 (H 1.96), 3H-25 (H0.98) and 3H-
26 (H 1.00) resonances, which showed correlations with each other in the NOESY spectrum,
are in the - orientation.213 The NMR data compared well with literature values.225, 226, 228
Previous research showed that -amyrin acetate reduced the plasma level of low density
lipoprotein cholesterol (LDL-C) by 36%, total cholesterol (TC) by 37%, triglycerides (TG)
by 35% and increased the high density lipoprotein cholesterol/total cholesterol (HDL-C/TC)
ratio by 49% at a 10 mg/kg dose.227
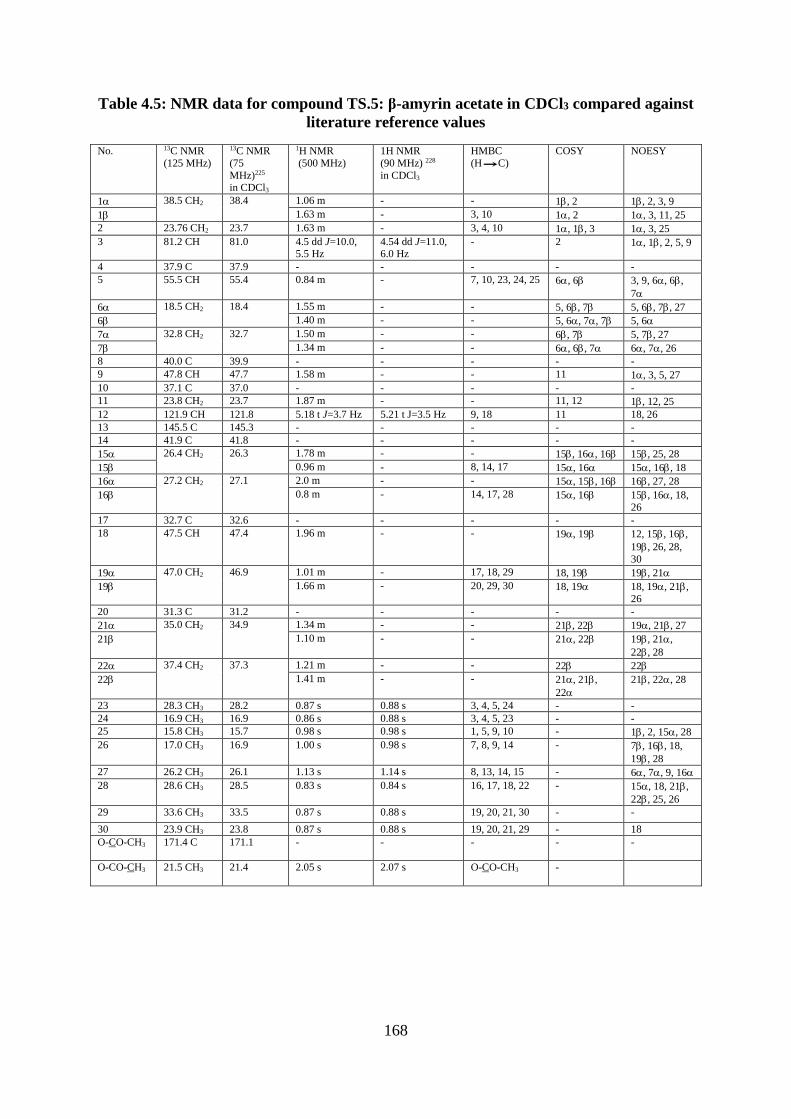
168
Table 4.5: NMR data for compound TS.5: β-amyrin acetate in CDCl3 compared against
literature reference values
No. 13C NMR
(125 MHz)
13C NMR
(75
MHz)225 in CDCl3
1H NMR
(500 MHz)
1H NMR
(90 MHz) 228
in CDCl3
HMBC
(H C)
COSY NOESY
1 38.5 CH2 38.4 1.06 m - - 1, 2 1, 2, 3, 9
1 1.63 m - 3, 10 1, 2 1, 3, 11, 25
2 23.76 CH2 23.7 1.63 m - 3, 4, 10 1, 1, 3 1, 3, 25
3 81.2 CH 81.0 4.5 dd J=10.0, 5.5 Hz
4.54 dd J=11.0, 6.0 Hz
- 2 1, 1, 2, 5, 9
4 37.9 C 37.9 - - - - -
5 55.5 CH 55.4 0.84 m - 7, 10, 23, 24, 25 6, 6 3, 9, 6, 6,
7
6 18.5 CH2 18.4 1.55 m - - 5, 6, 7 5, 6, 7, 27
6 1.40 m - - 5, 6, 7, 7 5, 6
7 32.8 CH2 32.7 1.50 m - - 6, 7 5, 7, 27
7 1.34 m - - 6, 6, 7 6, 7, 26
8 40.0 C 39.9 - - - - -
9 47.8 CH 47.7 1.58 m - - 11 1, 3, 5, 27
10 37.1 C 37.0 - - - - -
11 23.8 CH2 23.7 1.87 m - - 11, 12 1, 12, 25
12 121.9 CH 121.8 5.18 t J=3.7 Hz 5.21 t J=3.5 Hz 9, 18 11 18, 26
13 145.5 C 145.3 - - - - -
14 41.9 C 41.8 - - - - -
15 26.4 CH2 26.3 1.78 m - - 15, 16, 16 15, 25, 28
15 0.96 m - 8, 14, 17 15, 16 15, 16, 18
16 27.2 CH2 27.1 2.0 m - - 15, 15, 16 16, 27, 28
16 0.8 m - 14, 17, 28 15, 16 15, 16, 18,
26
17 32.7 C 32.6 - - - - -
18 47.5 CH 47.4 1.96 m - - 19, 19 12, 15, 16,
19, 26, 28,
30
19 47.0 CH2 46.9 1.01 m - 17, 18, 29 18, 19 19, 21
19 1.66 m - 20, 29, 30 18, 19 18, 19, 21, 26
20 31.3 C 31.2 - - - - -
21 35.0 CH2 34.9 1.34 m - - 21, 22 19, 21, 27
21 1.10 m - - 21, 22 19, 21,
22, 28
22 37.4 CH2 37.3 1.21 m - - 22 22
22 1.41 m - - 21, 21,
22
21, 22, 28
23 28.3 CH3 28.2 0.87 s 0.88 s 3, 4, 5, 24 - -
24 16.9 CH3 16.9 0.86 s 0.88 s 3, 4, 5, 23 - -
25 15.8 CH3 15.7 0.98 s 0.98 s 1, 5, 9, 10 - 1, 2, 15, 28
26 17.0 CH3 16.9 1.00 s 0.98 s 7, 8, 9, 14 - 7, 16, 18,
19, 28
27 26.2 CH3 26.1 1.13 s 1.14 s 8, 13, 14, 15 - 6, 7, 9, 16
28 28.6 CH3 28.5 0.83 s 0.84 s 16, 17, 18, 22 - 15, 18, 21,
22, 25, 26
29 33.6 CH3 33.5 0.87 s 0.88 s 19, 20, 21, 30 - -
30 23.9 CH3 23.8 0.87 s 0.88 s 19, 20, 21, 29 - 18
O-CO-CH3
171.4 C 171.1 - - - - -
O-CO-CH3 21.5 CH3 21.4 2.05 s 2.07 s O-CO-CH3
-
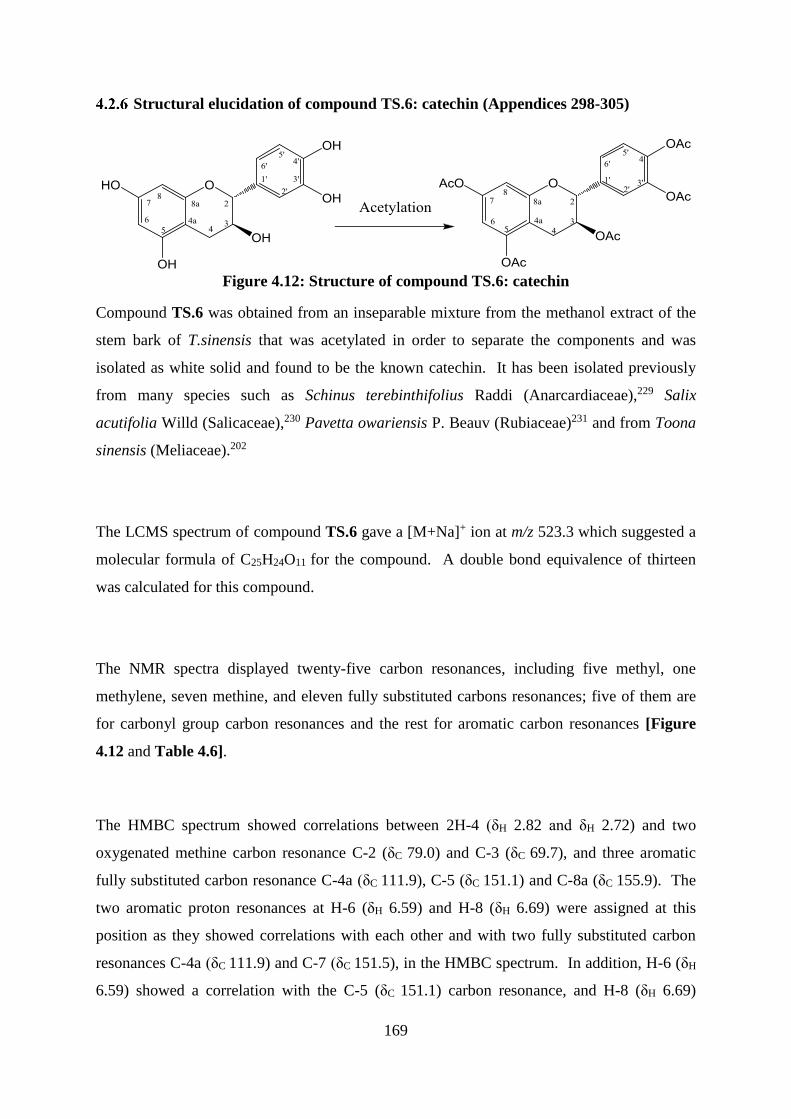
169
Structural elucidation of compound TS.6: catechin (Appendices 298-305)
Figure 4.12: Structure of compound TS.6: catechin
Compound TS.6 was obtained from an inseparable mixture from the methanol extract of the
stem bark of T.sinensis that was acetylated in order to separate the components and was
isolated as white solid and found to be the known catechin. It has been isolated previously
from many species such as Schinus terebinthifolius Raddi (Anarcardiaceae),229 Salix
acutifolia Willd (Salicaceae),230 Pavetta owariensis P. Beauv (Rubiaceae)231 and from Toona
sinensis (Meliaceae).202
The LCMS spectrum of compound TS.6 gave a [M+Na]+ ion at m/z 523.3 which suggested a
molecular formula of C25H24O11 for the compound. A double bond equivalence of thirteen
was calculated for this compound.
The NMR spectra displayed twenty-five carbon resonances, including five methyl, one
methylene, seven methine, and eleven fully substituted carbons resonances; five of them are
for carbonyl group carbon resonances and the rest for aromatic carbon resonances [Figure
4.12 and Table 4.6].
The HMBC spectrum showed correlations between 2H-4 (δH 2.82 and δH 2.72) and two
oxygenated methine carbon resonance C-2 (δC 79.0) and C-3 (δC 69.7), and three aromatic
fully substituted carbon resonance C-4a (δC 111.9), C-5 (δC 151.1) and C-8a (δC 155.9). The
two aromatic proton resonances at H-6 (δH 6.59) and H-8 (δH 6.69) were assigned at this
position as they showed correlations with each other and with two fully substituted carbon
resonances C-4a (δC 111.9) and C-7 (δC 151.5), in the HMBC spectrum. In addition, H-6 (δH
6.59) showed a correlation with the C-5 (δC 151.1) carbon resonance, and H-8 (δH 6.69)
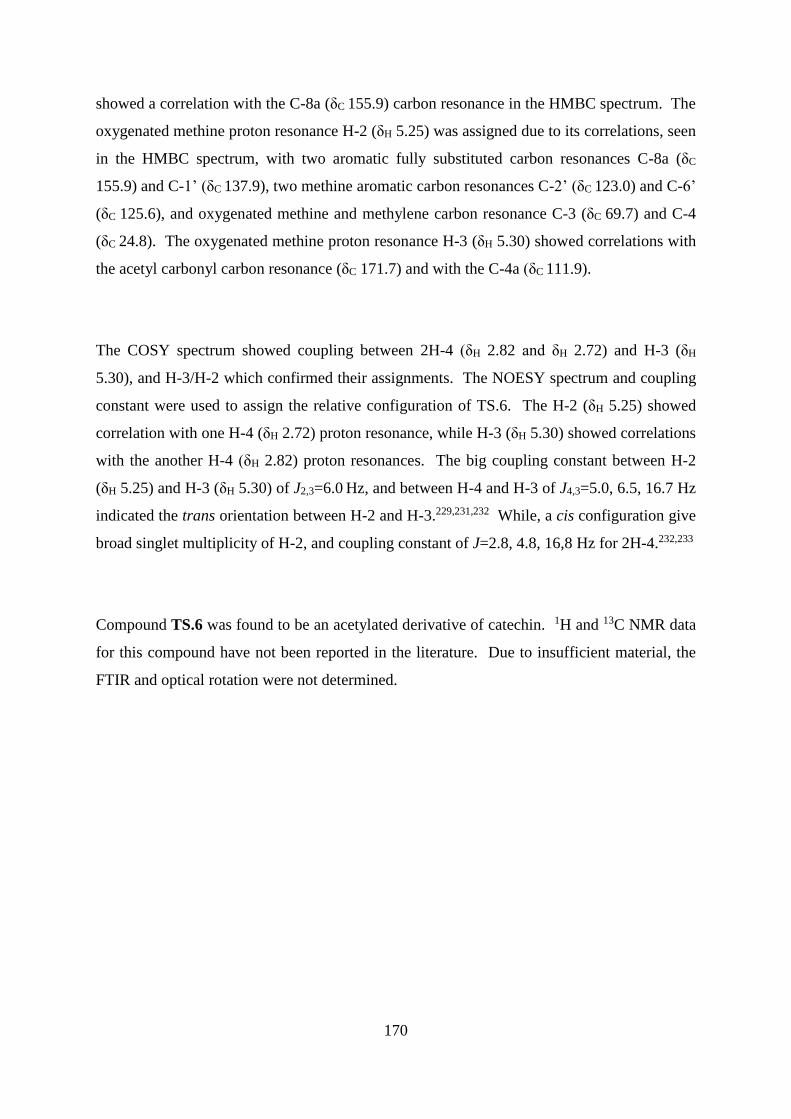
170
showed a correlation with the C-8a (δC 155.9) carbon resonance in the HMBC spectrum. The
oxygenated methine proton resonance H-2 (δH 5.25) was assigned due to its correlations, seen
in the HMBC spectrum, with two aromatic fully substituted carbon resonances C-8a (δC
155.9) and C-1’ (δC 137.9), two methine aromatic carbon resonances C-2’ (δC 123.0) and C-6’
(δC 125.6), and oxygenated methine and methylene carbon resonance C-3 (δC 69.7) and C-4
(δC 24.8). The oxygenated methine proton resonance H-3 (δH 5.30) showed correlations with
the acetyl carbonyl carbon resonance (δC 171.7) and with the C-4a (δC 111.9).
The COSY spectrum showed coupling between 2H-4 (δH 2.82 and δH 2.72) and H-3 (δH
5.30), and H-3/H-2 which confirmed their assignments. The NOESY spectrum and coupling
constant were used to assign the relative configuration of TS.6. The H-2 (δH 5.25) showed
correlation with one H-4 (δH 2.72) proton resonance, while H-3 (δH 5.30) showed correlations
with the another H-4 (δH 2.82) proton resonances. The big coupling constant between H-2
(δH 5.25) and H-3 (δH 5.30) of J2,3=6.0 Hz, and between H-4 and H-3 of J4,3=5.0, 6.5, 16.7 Hz
indicated the trans orientation between H-2 and H-3.229,231,232 While, a cis configuration give
broad singlet multiplicity of H-2, and coupling constant of J=2.8, 4.8, 16,8 Hz for 2H-4.232,233
Compound TS.6 was found to be an acetylated derivative of catechin. 1H and 13C NMR data
for this compound have not been reported in the literature. Due to insufficient material, the
FTIR and optical rotation were not determined.
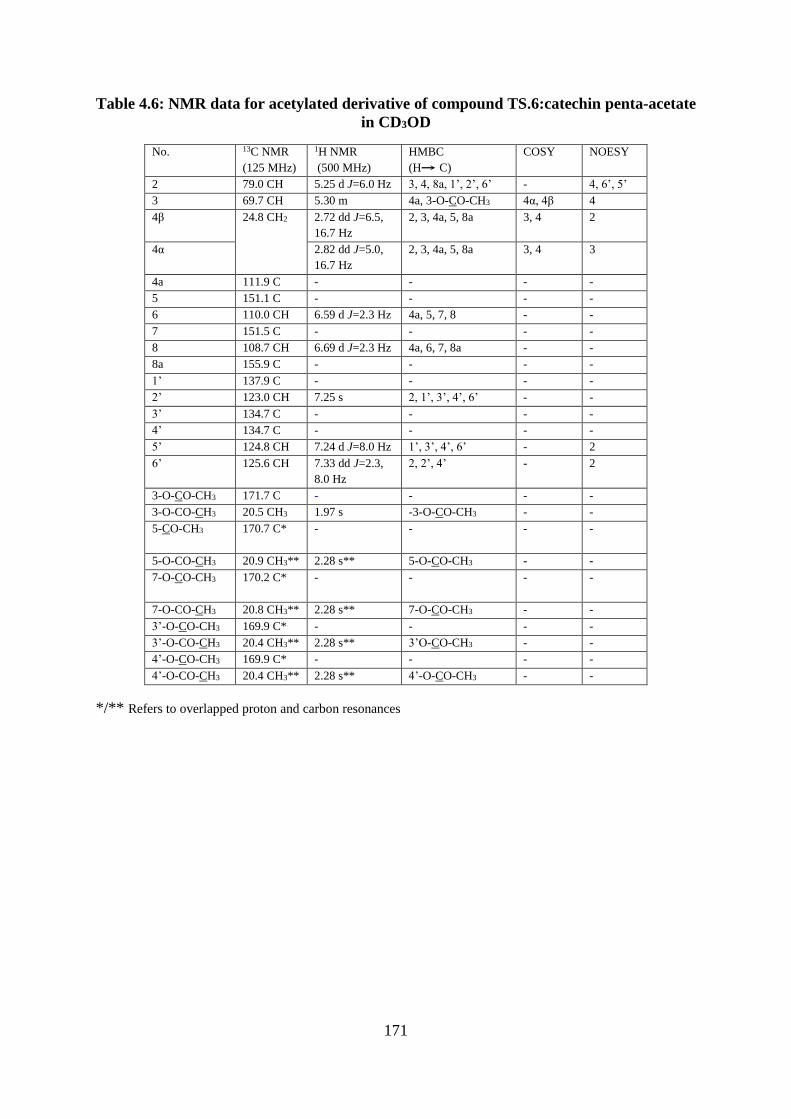
171
Table 4.6: NMR data for acetylated derivative of compound TS.6:catechin penta-acetate
in CD3OD
No. 13C NMR
(125 MHz)
1H NMR
(500 MHz)
HMBC
(H C)
COSY NOESY
2 79.0 CH 5.25 d J=6.0 Hz 3, 4, 8a, 1’, 2’, 6’ - 4, 6’, 5’
3 69.7 CH 5.30 m 4a, 3-O-CO-CH3 4α, 4β 4
4β 24.8 CH2 2.72 dd J=6.5,
16.7 Hz
2, 3, 4a, 5, 8a 3, 4 2
4α 2.82 dd J=5.0,
16.7 Hz
2, 3, 4a, 5, 8a 3, 4 3
4a 111.9 C - - - -
5 151.1 C - - - -
6 110.0 CH 6.59 d J=2.3 Hz 4a, 5, 7, 8 - -
7 151.5 C - - - -
8 108.7 CH 6.69 d J=2.3 Hz 4a, 6, 7, 8a - -
8a 155.9 C - - - -
1’ 137.9 C - - - -
2’ 123.0 CH 7.25 s 2, 1’, 3’, 4’, 6’ - -
3’ 134.7 C - - - -
4’ 134.7 C - - - -
5’ 124.8 CH 7.24 d J=8.0 Hz 1’, 3’, 4’, 6’ - 2
6’ 125.6 CH 7.33 dd J=2.3,
8.0 Hz
2, 2’, 4’ - 2
3-O-CO-CH3 171.7 C - - - -
3-O-CO-CH3 20.5 CH3 1.97 s -3-O-CO-CH3 - -
5-CO-CH3 170.7 C*
- - - -
5-O-CO-CH3 20.9 CH3** 2.28 s** 5-O-CO-CH3 - -
7-O-CO-CH3
170.2 C* - - - -
7-O-CO-CH3 20.8 CH3** 2.28 s** 7-O-CO-CH3 - -
3’-O-CO-CH3 169.9 C* - - - -
3’-O-CO-CH3 20.4 CH3** 2.28 s** 3’O-CO-CH3 - -
4’-O-CO-CH3 169.9 C* - - - -
4’-O-CO-CH3 20.4 CH3** 2.28 s** 4’-O-CO-CH3 - -
*/** Refers to overlapped proton and carbon resonances
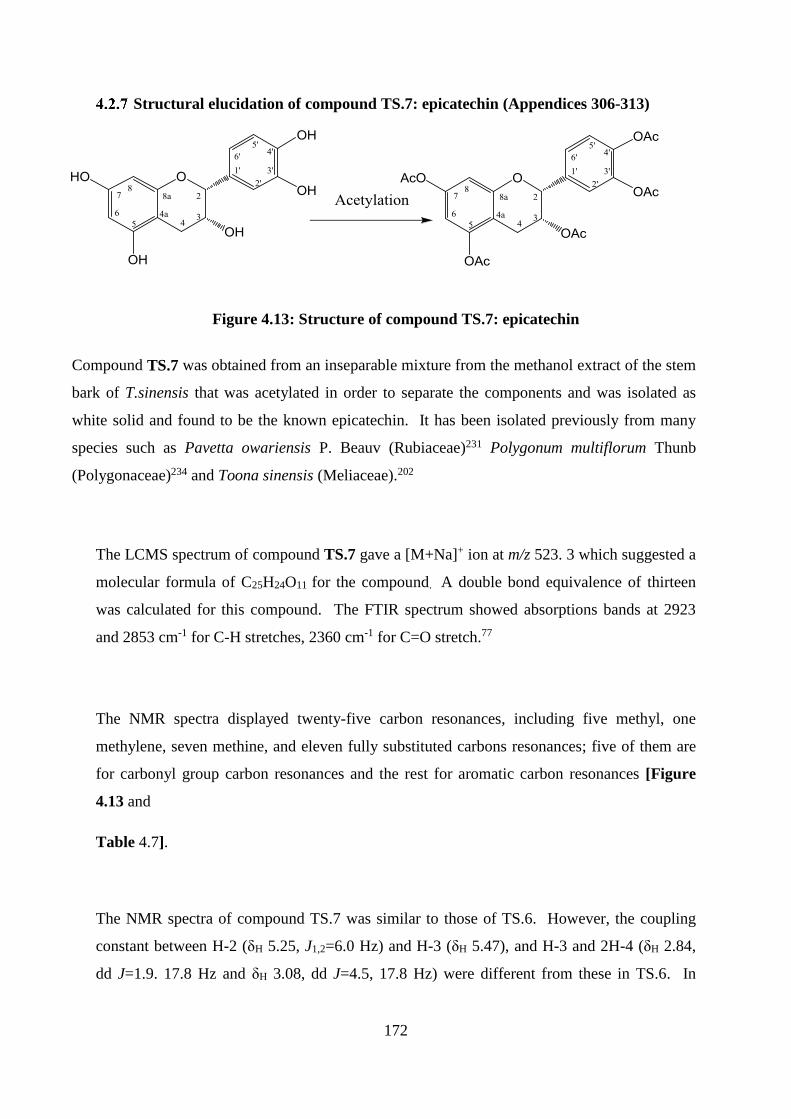
172
Structural elucidation of compound TS.7: epicatechin (Appendices 306-313)
Figure 4.13: Structure of compound TS.7: epicatechin
Compound TS.7 was obtained from an inseparable mixture from the methanol extract of the stem
bark of T.sinensis that was acetylated in order to separate the components and was isolated as
white solid and found to be the known epicatechin. It has been isolated previously from many
species such as Pavetta owariensis P. Beauv (Rubiaceae)231 Polygonum multiflorum Thunb
(Polygonaceae)234 and Toona sinensis (Meliaceae).202
The LCMS spectrum of compound TS.7 gave a [M+Na]+ ion at m/z 523. 3 which suggested a
molecular formula of C25H24O11 for the compound. A double bond equivalence of thirteen
was calculated for this compound. The FTIR spectrum showed absorptions bands at 2923
and 2853 cm-1 for C-H stretches, 2360 cm-1 for C=O stretch.77
The NMR spectra displayed twenty-five carbon resonances, including five methyl, one
methylene, seven methine, and eleven fully substituted carbons resonances; five of them are
for carbonyl group carbon resonances and the rest for aromatic carbon resonances [Figure
4.13 and
Table 4.7].
The NMR spectra of compound TS.7 was similar to those of TS.6. However, the coupling
constant between H-2 (δH 5.25, J1,2=6.0 Hz) and H-3 (δH 5.47), and H-3 and 2H-4 (δH 2.84,
dd J=1.9. 17.8 Hz and δH 3.08, dd J=4.5, 17.8 Hz) were different from these in TS.6. In
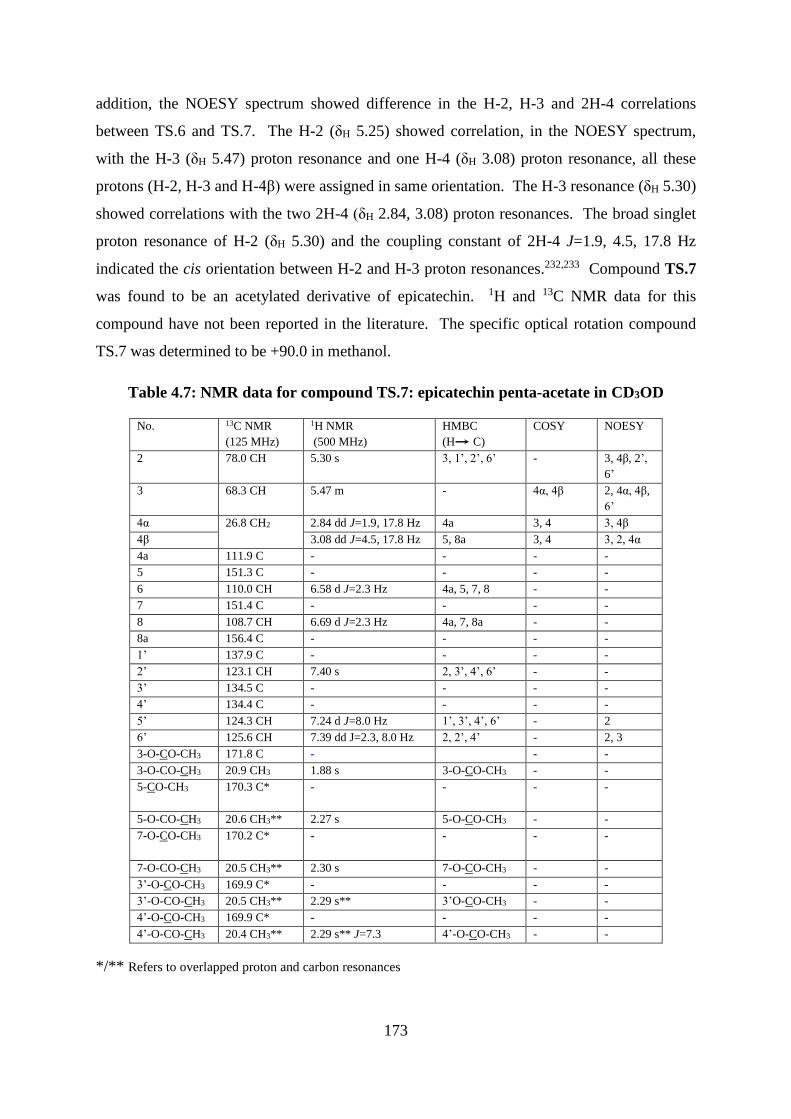
173
addition, the NOESY spectrum showed difference in the H-2, H-3 and 2H-4 correlations
between TS.6 and TS.7. The H-2 (δH 5.25) showed correlation, in the NOESY spectrum,
with the H-3 (δH 5.47) proton resonance and one H-4 (δH 3.08) proton resonance, all these
protons (H-2, H-3 and H-4β) were assigned in same orientation. The H-3 resonance (δH 5.30)
showed correlations with the two 2H-4 (δH 2.84, 3.08) proton resonances. The broad singlet
proton resonance of H-2 (δH 5.30) and the coupling constant of 2H-4 J=1.9, 4.5, 17.8 Hz
indicated the cis orientation between H-2 and H-3 proton resonances.232,233 Compound TS.7
was found to be an acetylated derivative of epicatechin. 1H and 13C NMR data for this
compound have not been reported in the literature. The specific optical rotation compound
TS.7 was determined to be +90.0 in methanol.
Table 4.7: NMR data for compound TS.7: epicatechin penta-acetate in CD3OD
No. 13C NMR
(125 MHz)
1H NMR
(500 MHz)
HMBC
(H C)
COSY NOESY
2 78.0 CH 5.30 s 3, 1’, 2’, 6’ - 3, 4β, 2’,
6’
3 68.3 CH 5.47 m - 4α, 4β 2, 4α, 4β,
6’
4α 26.8 CH2 2.84 dd J=1.9, 17.8 Hz 4a 3, 4 3, 4β
4β 3.08 dd J=4.5, 17.8 Hz 5, 8a 3, 4 3, 2, 4α
4a 111.9 C - - - -
5 151.3 C - - - -
6 110.0 CH 6.58 d J=2.3 Hz 4a, 5, 7, 8 - -
7 151.4 C - - - -
8 108.7 CH 6.69 d J=2.3 Hz 4a, 7, 8a - -
8a 156.4 C - - - -
1’ 137.9 C - - - -
2’ 123.1 CH 7.40 s 2, 3’, 4’, 6’ - -
3’ 134.5 C - - - -
4’ 134.4 C - - - -
5’ 124.3 CH 7.24 d J=8.0 Hz 1’, 3’, 4’, 6’ - 2
6’ 125.6 CH 7.39 dd J=2.3, 8.0 Hz 2, 2’, 4’ - 2, 3
3-O-CO-CH3 171.8 C - - -
3-O-CO-CH3 20.9 CH3 1.88 s 3-O-CO-CH3 - -
5-CO-CH3 170.3 C*
- - - -
5-O-CO-CH3 20.6 CH3** 2.27 s 5-O-CO-CH3 - -
7-O-CO-CH3
170.2 C* - - - -
7-O-CO-CH3 20.5 CH3** 2.30 s 7-O-CO-CH3 - -
3’-O-CO-CH3 169.9 C* - - - -
3’-O-CO-CH3 20.5 CH3** 2.29 s** 3’O-CO-CH3 - -
4’-O-CO-CH3 169.9 C* - - - -
4’-O-CO-CH3 20.4 CH3** 2.29 s** J=7.3 4’-O-CO-CH3 - -
*/** Refers to overlapped proton and carbon resonances
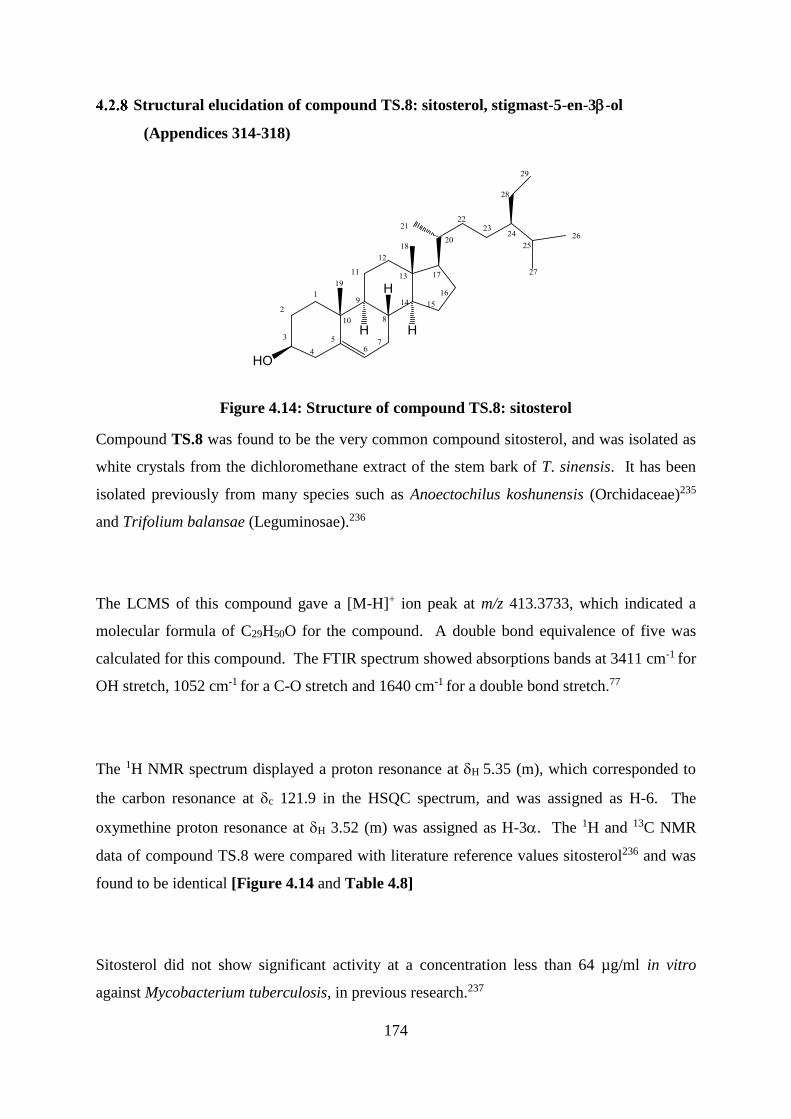
174
Structural elucidation of compound TS.8: sitosterol, stigmast-5-en-3-ol
(Appendices 314-318)
Figure 4.14: Structure of compound TS.8: sitosterol
Compound TS.8 was found to be the very common compound sitosterol, and was isolated as
white crystals from the dichloromethane extract of the stem bark of T. sinensis. It has been
isolated previously from many species such as Anoectochilus koshunensis (Orchidaceae)235
and Trifolium balansae (Leguminosae).236
The LCMS of this compound gave a [M-H]+ ion peak at m/z 413.3733, which indicated a
molecular formula of C29H50O for the compound. A double bond equivalence of five was
calculated for this compound. The FTIR spectrum showed absorptions bands at 3411 cm-1 for
OH stretch, 1052 cm-1 for a C-O stretch and 1640 cm-1 for a double bond stretch.77
The 1H NMR spectrum displayed a proton resonance at H 5.35 (m), which corresponded to
the carbon resonance at c 121.9 in the HSQC spectrum, and was assigned as H-6. The
oxymethine proton resonance at H 3.52 (m) was assigned as H-3. The 1H and 13C NMR
data of compound TS.8 were compared with literature reference values sitosterol236 and was
found to be identical [Figure 4.14 and Table 4.8]
Sitosterol did not show significant activity at a concentration less than 64 µg/ml in vitro
against Mycobacterium tuberculosis, in previous research.237
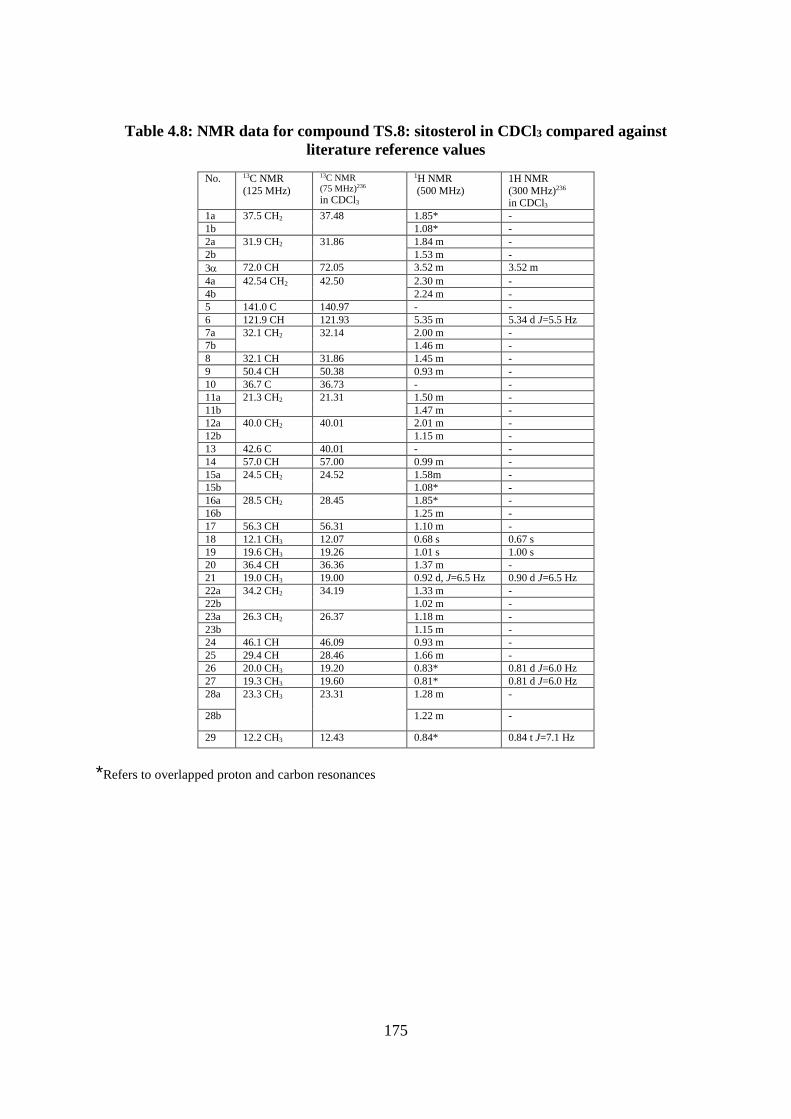
175
Table 4.8: NMR data for compound TS.8: sitosterol in CDCl3 compared against
literature reference values
No. 13C NMR
(125 MHz)
13C NMR
(75 MHz)236
in CDCl3
1H NMR
(500 MHz)
1H NMR
(300 MHz)236 in CDCl3
1a 37.5 CH2 37.48 1.85* -
1b 1.08* -
2a 31.9 CH2 31.86 1.84 m -
2b 1.53 m -
3 72.0 CH 72.05 3.52 m 3.52 m
4a 42.54 CH2 42.50 2.30 m -
4b 2.24 m -
5 141.0 C 140.97 - -
6 121.9 CH 121.93 5.35 m 5.34 d J=5.5 Hz
7a 32.1 CH2 32.14 2.00 m -
7b 1.46 m -
8 32.1 CH 31.86 1.45 m -
9 50.4 CH 50.38 0.93 m -
10 36.7 C 36.73 - -
11a 21.3 CH2 21.31 1.50 m -
11b 1.47 m -
12a 40.0 CH2 40.01 2.01 m -
12b 1.15 m -
13 42.6 C 40.01 - -
14 57.0 CH 57.00 0.99 m -
15a 24.5 CH2 24.52 1.58m -
15b 1.08* -
16a 28.5 CH2 28.45 1.85* -
16b 1.25 m -
17 56.3 CH 56.31 1.10 m -
18 12.1 CH3 12.07 0.68 s 0.67 s
19 19.6 CH3 19.26 1.01 s 1.00 s
20 36.4 CH 36.36 1.37 m -
21 19.0 CH3 19.00 0.92 d, J=6.5 Hz 0.90 d J=6.5 Hz
22a 34.2 CH2 34.19 1.33 m -
22b 1.02 m -
23a 26.3 CH2 26.37 1.18 m -
23b 1.15 m -
24 46.1 CH 46.09 0.93 m -
25 29.4 CH 28.46 1.66 m -
26 20.0 CH3 19.20 0.83* 0.81 d J=6.0 Hz
27 19.3 CH3 19.60 0.81* 0.81 d J=6.0 Hz
28a 23.3 CH3 23.31 1.28 m -
28b 1.22 m -
29 12.2 CH3 12.43 0.84* 0.84 t J=7.1 Hz
*Refers to overlapped proton and carbon resonances
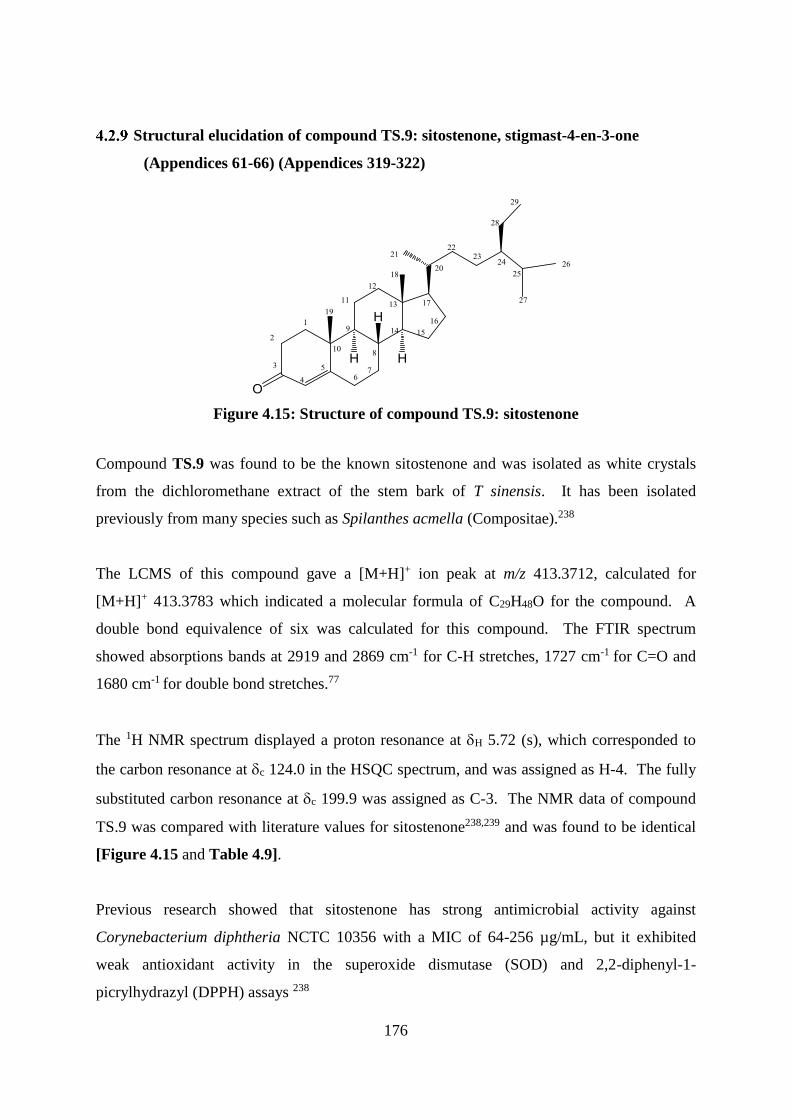
176
Structural elucidation of compound TS.9: sitostenone, stigmast-4-en-3-one
(Appendices 61-66) (Appendices 319-322)
Figure 4.15: Structure of compound TS.9: sitostenone
Compound TS.9 was found to be the known sitostenone and was isolated as white crystals
from the dichloromethane extract of the stem bark of T sinensis. It has been isolated
previously from many species such as Spilanthes acmella (Compositae).238
The LCMS of this compound gave a [M+H]+ ion peak at m/z 413.3712, calculated for
[M+H]+ 413.3783 which indicated a molecular formula of C29H48O for the compound. A
double bond equivalence of six was calculated for this compound. The FTIR spectrum
showed absorptions bands at 2919 and 2869 cm-1 for C-H stretches, 1727 cm-1 for C=O and
1680 cm-1 for double bond stretches.77
The 1H NMR spectrum displayed a proton resonance at H 5.72 (s), which corresponded to
the carbon resonance at c 124.0 in the HSQC spectrum, and was assigned as H-4. The fully
substituted carbon resonance at c 199.9 was assigned as C-3. The NMR data of compound
TS.9 was compared with literature values for sitostenone238,239 and was found to be identical
[Figure 4.15 and Table 4.9].
Previous research showed that sitostenone has strong antimicrobial activity against
Corynebacterium diphtheria NCTC 10356 with a MIC of 64-256 µg/mL, but it exhibited
weak antioxidant activity in the superoxide dismutase (SOD) and 2,2-diphenyl-1-
picrylhydrazyl (DPPH) assays 238
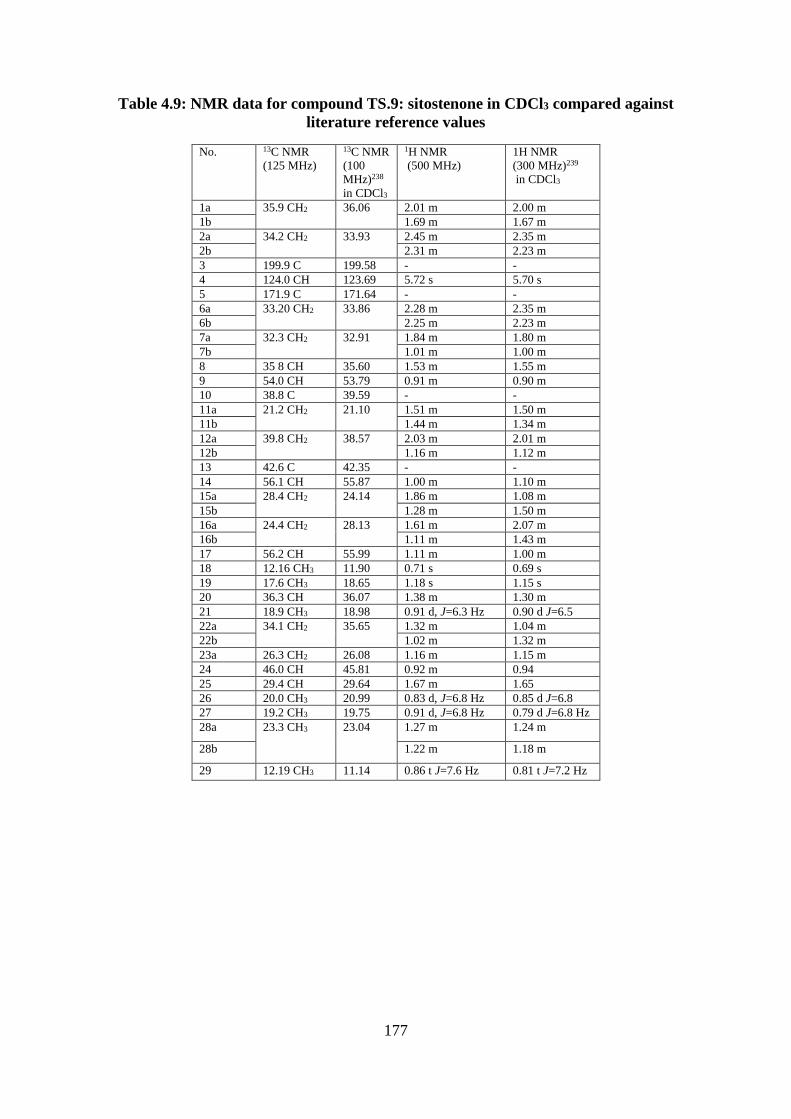
177
Table 4.9: NMR data for compound TS.9: sitostenone in CDCl3 compared against
literature reference values
No. 13C NMR
(125 MHz)
13C NMR
(100
MHz)238
in CDCl3
1H NMR
(500 MHz)
1H NMR
(300 MHz)239
in CDCl3
1a 35.9 CH2 36.06 2.01 m 2.00 m
1b 1.69 m 1.67 m
2a 34.2 CH2 33.93 2.45 m 2.35 m
2b 2.31 m 2.23 m
3 199.9 C 199.58 - -
4 124.0 CH 123.69 5.72 s 5.70 s
5 171.9 C 171.64 - -
6a 33.20 CH2 33.86 2.28 m 2.35 m
6b 2.25 m 2.23 m
7a 32.3 CH2 32.91
1.84 m 1.80 m
7b 1.01 m 1.00 m
8 35 8 CH 35.60 1.53 m 1.55 m
9 54.0 CH 53.79 0.91 m 0.90 m
10 38.8 C 39.59 - -
11a 21.2 CH2 21.10 1.51 m 1.50 m
11b 1.44 m 1.34 m
12a 39.8 CH2 38.57 2.03 m 2.01 m
12b 1.16 m 1.12 m
13 42.6 C 42.35 - -
14 56.1 CH 55.87 1.00 m 1.10 m
15a 28.4 CH2 24.14 1.86 m 1.08 m
15b 1.28 m 1.50 m
16a 24.4 CH2 28.13 1.61 m 2.07 m
16b 1.11 m 1.43 m
17 56.2 CH 55.99 1.11 m 1.00 m
18 12.16 CH3 11.90 0.71 s 0.69 s
19 17.6 CH3 18.65 1.18 s 1.15 s
20 36.3 CH 36.07 1.38 m 1.30 m
21 18.9 CH3 18.98 0.91 d, J=6.3 Hz 0.90 d J=6.5
22a 34.1 CH2 35.65 1.32 m 1.04 m
22b 1.02 m 1.32 m
23a 26.3 CH2 26.08 1.16 m 1.15 m
24 46.0 CH 45.81 0.92 m 0.94
25 29.4 CH 29.64 1.67 m 1.65
26 20.0 CH3 20.99 0.83 d, J=6.8 Hz 0.85 d J=6.8
27 19.2 CH3 19.75 0.91 d, J=6.8 Hz 0.79 d J=6.8 Hz
28a 23.3 CH3 23.04 1.27 m 1.24 m
28b 1.22 m 1.18 m
29 12.19 CH3 11.14 0.86 t J=7.6 Hz 0.81 t J=7.2 Hz
178
Conclusion
Toona sinensis Roem is widely used in traditional medicine, therefore, it has been extensively
studied by many chemist and pharmacologists. However, the stem bark of T. sinensis has
been investigated phytochemically only once.200 The objective of this study was to compare
the chemical constituents of Toona sinensis, naturally grown in Asia to this grown on the
University of Surrey campus, Guildford, UK. 24-Methylencycloartan-3-yl acetate (TS.1),
24-methylencycloartan-3-one (TS.2), piscidinol A (TS.3), 24-methyltirucalla-8-en-3-ol
(TS.4), -amyrin acetate (TS.5), catechin (TS.6), epicatechin (TS.7), sitosterol (TS.8) and
sitostenone (TS.9) were isolated from the stem bark of the T. sinensis in this study. Toona
genus has been reported to have different types of triterpenoids and TS.1, TS.2 and TS.3
were reported previously from this genus. However, the report of TS.4 and TS.5 in this study
is the first, while TS.6 and TS.7 were reported previously from this species. In general,
Toona sinensis grown in the UK yielded compounds (TS.4 and TS.5) have not been isolated
before from Asia species.
179
Chapter five: Biological activities of isolated compounds
From the 250,000-500,000 species of higher plants, only a small percentage have been
investigated and their phytochemical and medicinal properties described.240 Therefore, there
is a need to continue research on the safety and efficiency of medicinal plants.241 The
chemodiversity of natural product compounds has given many anticancer drugs or their
derivatives [Section 1.1and Table 1.1 ] indicating the important role of natural products in
the development of anticancer drugs.
In this study, the anti-cancer screening of some compounds isolated in this study was
performed in two ways, neutral red assay for the estimation of cell cytotoxicity and by
submitting selected isolated compounds to the Development Therapeutics Program (DTP) of
the National Cancer Institute (NCI).
Cytotoxicity
Cytotoxicity refers to the ability of a chemical compound or a mediator cell (such as T-cell)
to destroy living cells.242,243 Cells exposed to a cytotoxic compound can respond in two
possible cytocidal mechanisms, firstly the lytic mechanism, in which the cytotoxic compound
secretes lytic molecules into the intercellular space to from pores in the target cell membrane,
causing breaking down of the cell, secondly the apoptotic mechanism (programmed cell
death), in which the cytotoxic compound activates caspases, which, in turn, cleave
intracellular substrates, for example, DNAse leading to cell lysis quickly and neatly.242 This
process cleans the tissues from harmful and unwanted cells. Most anti-cancer drugs depend
on the activation of apoptotic pathways.242,243 Therefore, it will be discussed in this chapter.
In the absence of adequate toxicological data of most existing chemicals, in vitro cytotoxicity
data, which needs a short time and relatively low cost to perform, can be a vital tool for
ranking compounds according to their potential toxicity that might pose a health risk to
humans, and it can be very useful during the development of a new pharmaceutical
product.244 Therefore, in vitro cytotoxicity tests against a panel of cancer cell lines is the
most common method of anticancer drug discovery.244
180
Measuring Cell Cytotoxicity
There are many different ways to measure in vitro cytotoxicity, firstly by observing
morphological alterations in the cell by using microscopy techniques, another index of
toxicity is cell proliferation which can measure, by assay, total cell number, DNA content,
protein content or enzyme activity in the population.244 Another indicator of in vitro
cytotoxicity is cell viability, which is based on ATP level, O2 consumption, nucleotide uptake
activity, enzyme activity, such as lactate dehydrogenase activity, and cell membrane
permeability that uses vital dyes such as neutral red that is taken up by the live cell, while
trypan blue is excluded by viable cells.242,244 Many of these methods involve fluorescence,
colorimetric and luminescence detection.242 As the neutral red assay was used in this study to
assay the cytotoxicity of isolated compounds, it will be discussed in the next section
Principle of neutral red assay
The neutral red assay is one of the most used methods to determine cell viability.245 It is
based on the binding of neutral red to the lysosomes of live cells.246 Neutral red is a weak
cationic dye that penetrates cell membranes by non-ionic passive diffusion as the net charge
of neutral red is about zero.245,247 The pH of lysosomes in the viable cell is lower than the
cytoplasm due to the production of ATP. This leads neutral red dye to bind with anionic
groups of the lysosomal matrix and maintains the neutral red dye charge, so it can retain
inside lysosomes.245 When the cell dies, cell surface changes and the pH gradient reduces, so
the dye cannot be taken up or retained. Therefore, the capacity of taking up the dye can be
used to distinguish between dead, damaged and viable cells.245 An acidified ethanol solution
can be used to extract the dye from viable cells, which can be measured by spectrometry at
540 nm.245,247 The amount of dye taken up is proportional to the number of live cells [Figure
5.1].245,247
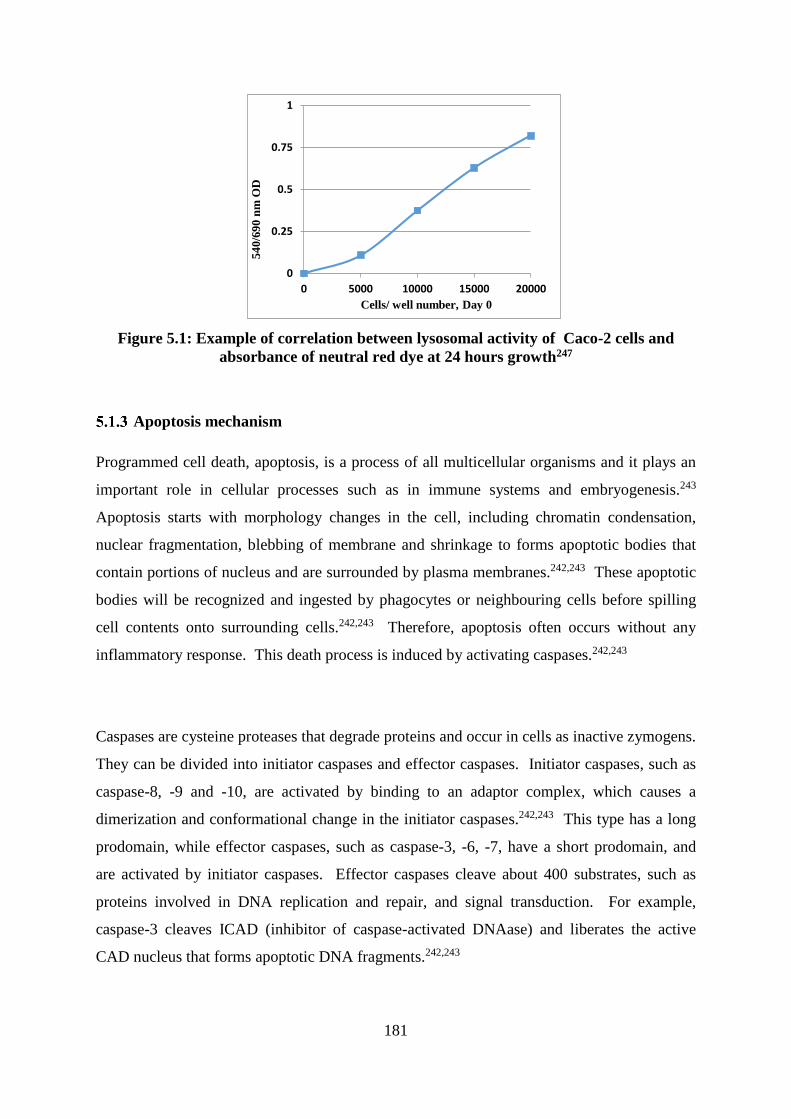
181
Figure 5.1: Example of correlation between lysosomal activity of Caco-2 cells and
absorbance of neutral red dye at 24 hours growth247
Apoptosis mechanism
Programmed cell death, apoptosis, is a process of all multicellular organisms and it plays an
important role in cellular processes such as in immune systems and embryogenesis.243
Apoptosis starts with morphology changes in the cell, including chromatin condensation,
nuclear fragmentation, blebbing of membrane and shrinkage to forms apoptotic bodies that
contain portions of nucleus and are surrounded by plasma membranes.242,243 These apoptotic
bodies will be recognized and ingested by phagocytes or neighbouring cells before spilling
cell contents onto surrounding cells.242,243 Therefore, apoptosis often occurs without any
inflammatory response. This death process is induced by activating caspases.242,243
Caspases are cysteine proteases that degrade proteins and occur in cells as inactive zymogens.
They can be divided into initiator caspases and effector caspases. Initiator caspases, such as
caspase-8, -9 and -10, are activated by binding to an adaptor complex, which causes a
dimerization and conformational change in the initiator caspases.242,243 This type has a long
prodomain, while effector caspases, such as caspase-3, -6, -7, have a short prodomain, and
are activated by initiator caspases. Effector caspases cleave about 400 substrates, such as
proteins involved in DNA replication and repair, and signal transduction. For example,
caspase-3 cleaves ICAD (inhibitor of caspase-activated DNAase) and liberates the active
CAD nucleus that forms apoptotic DNA fragments.242,243
0
0.25
0.5
0.75
1
0 5000 10000 15000 20000
Cells/ well number, Day 0
54
0/6
90
nm
OD
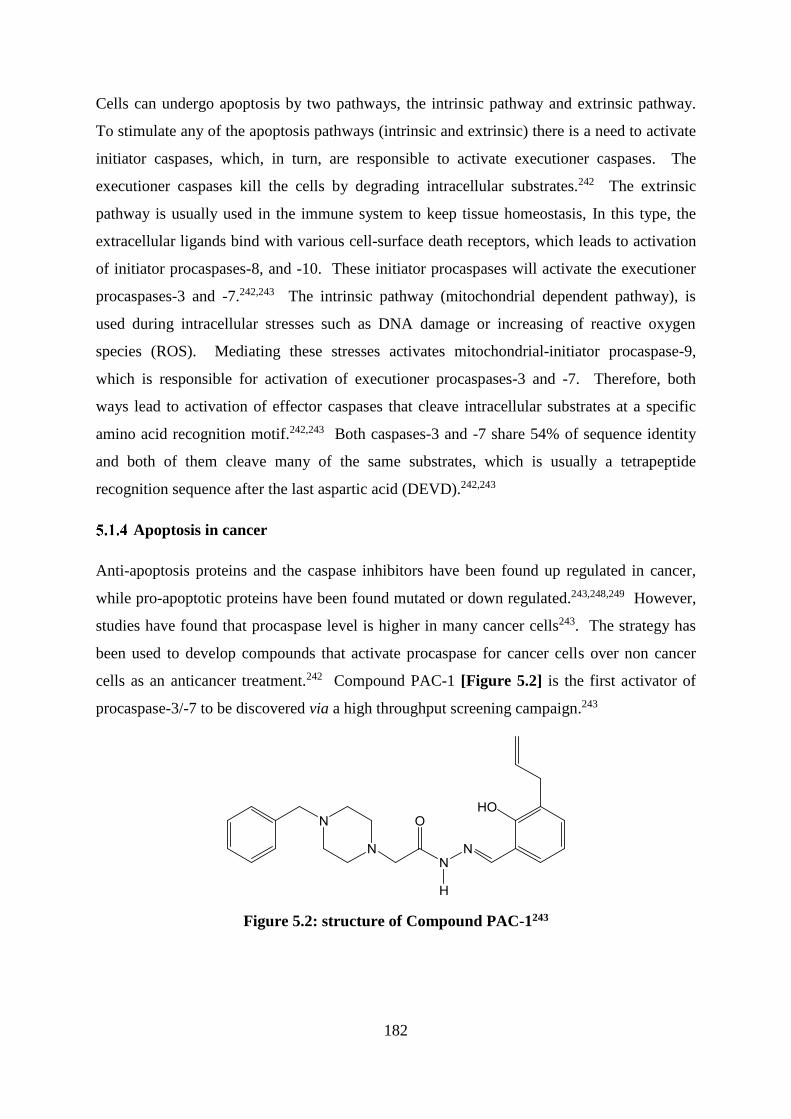
182
Cells can undergo apoptosis by two pathways, the intrinsic pathway and extrinsic pathway.
To stimulate any of the apoptosis pathways (intrinsic and extrinsic) there is a need to activate
initiator caspases, which, in turn, are responsible to activate executioner caspases. The
executioner caspases kill the cells by degrading intracellular substrates.242 The extrinsic
pathway is usually used in the immune system to keep tissue homeostasis, In this type, the
extracellular ligands bind with various cell-surface death receptors, which leads to activation
of initiator procaspases-8, and -10. These initiator procaspases will activate the executioner
procaspases-3 and -7.242,243 The intrinsic pathway (mitochondrial dependent pathway), is
used during intracellular stresses such as DNA damage or increasing of reactive oxygen
species (ROS). Mediating these stresses activates mitochondrial-initiator procaspase-9,
which is responsible for activation of executioner procaspases-3 and -7. Therefore, both
ways lead to activation of effector caspases that cleave intracellular substrates at a specific
amino acid recognition motif.242,243 Both caspases-3 and -7 share 54% of sequence identity
and both of them cleave many of the same substrates, which is usually a tetrapeptide
recognition sequence after the last aspartic acid (DEVD).242,243
Apoptosis in cancer
Anti-apoptosis proteins and the caspase inhibitors have been found up regulated in cancer,
while pro-apoptotic proteins have been found mutated or down regulated.243,248,249 However,
studies have found that procaspase level is higher in many cancer cells243. The strategy has
been used to develop compounds that activate procaspase for cancer cells over non cancer
cells as an anticancer treatment.242 Compound PAC-1 [Figure 5.2] is the first activator of
procaspase-3/-7 to be discovered via a high throughput screening campaign.243
Figure 5.2: structure of Compound PAC-1243
183
Measuring Apoptosis: CellPlayerTM 96-well caspase-3/7 reagent
The commonly used method to detect apoptosis is by determination of caspase activation, as
the caspases have a crucial role in apoptotic cell death.242 This method relies on measuring
the quantity of caspase activation by detecting the cleaved caspase substrate.242
One of these methods that was used in this study is kinetic measurement apoptosis using the
CellPlayerTM 96-well caspase-3/7 reagent. This reagent is the caspase-3/-7 recognition motif
peptide (DEVD) conjugated to a DNA intercalating dye, which is non-fluorescent until
released from the peptide and bonded to DNA. When this reagent is added to tissue culture,
it crosses the cell membrane and is cleaved by activated caspase-3/7. This leads to release of
the DNA dye and green fluorescent staining after bonding to nuclear DNA. The fluorescence
emission of the dye can be observed using a standard “FITC" filter set. This method can be
monitored morphologically using live cell imaging and quantified using the IncuCyte FLR
object counting algorithm.248 The high definition phase contrast images give qualitative
information of cell death (caspase activity) by detecting the morphological characteristic
changes during apoptosis.249,250 While the Incucyte FLR counts cell growth based on area
(confluence) metrics by isolating fluorescent signal from background, then divide the signal
into singular objects, and count objects on area for each time point.249,250
The cytotoxicity Results
Neutral red assay results
The isolated compound from Croton dichogamus (Euphorbiaceae) and Crinum species 1
6538 (Amaryllidaceae) that were screened in vitro for cell viability against Caco-2 (Human
Colorectal Adenocarcinoma) cell lines by using neutral red assay are given in Table 5.1.
All the samples were tested at 100 µM to estimate their cytotoxicity and compared with
actinomycyin at a concentration of 7.96 µM (10µg/ml) as a positive control as described in
Materials and Methods, and promising ones were subjected to further testing to estimate their
IC50’s. All the compounds tested showed lower potency than actinomycyin, except
compounds 10-epi maninsigin D (CD.5) and masonine (CF.5) that displayed 32.6% and
184
45.7% cell death [Figure 5.3]. CD.5 and CF.5 were tested at five concentrations 1, 3, 10, 30,
100 µM to estimate their IC50. CF.5 did not show inhibition activity at any concentration
under 100 µM, while CD.5 showed promising activity with an IC50 24.1 µM [Figure 5.4].
All screened compounds have not been tested for cytotoxicity except the epimer of CD.5, the
normal enantiomer of CD.6 and CD.8. Maninsigin D (epimer of CD.5) has been tested
against HL-60, A-549, SW-480, SMMC-7721 and MCF-7 human cell lines by the MTT
method with cis-platin as a positive control and it showed IC50 values > 40 µM. The normal
enantiomer series of CD.6 showed cytotoxicity against BT-474, KATO-3, CHAGO, SW-620
and HEP-G2 human cancer cell lines with LC50 values of 3.26, 6.78, 6.67, 4.44 and 6.37
µg/mL.91 This difference of cytotoxicity of reported and screened compounds can be
attributed to the differences of stereochemistry and cancer cell line. CD.8 did not show
cytotoxic against human premyelocytic leukemia HL-60 and murine leukemia P-388 cell
lines with an IC50 ≥ 10µM in previous research and in this study.93
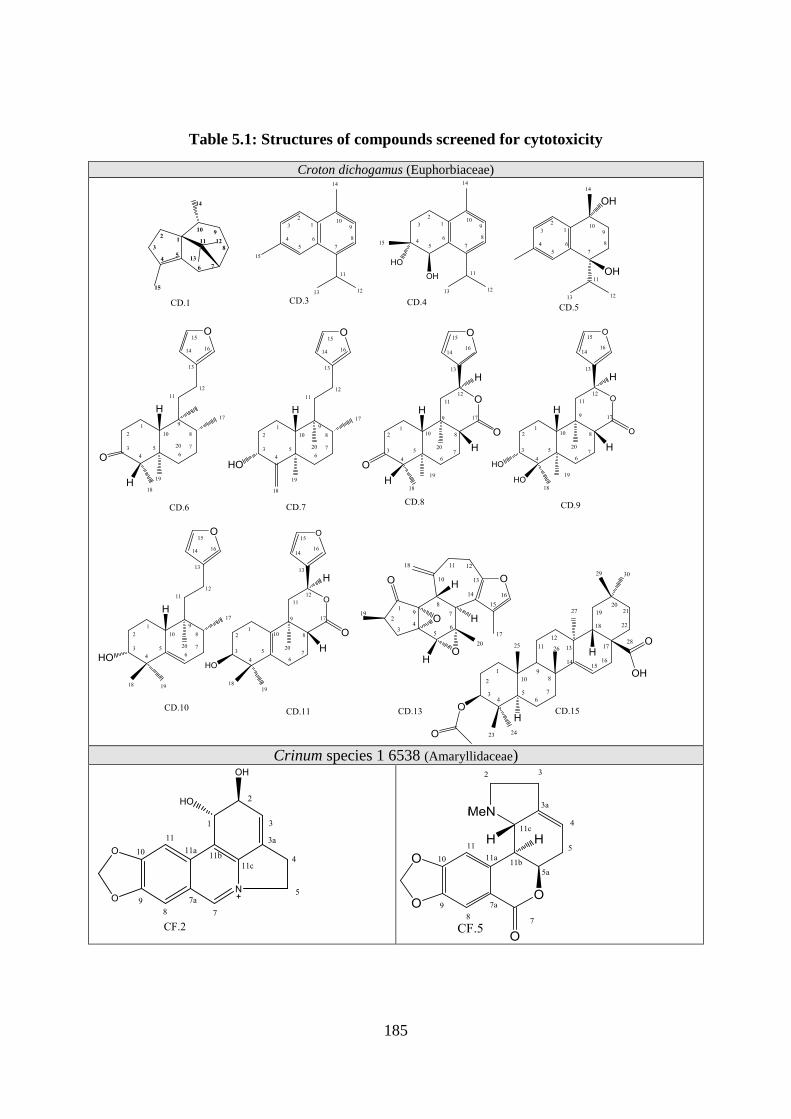
185
Table 5.1: Structures of compounds screened for cytotoxicity
Croton dichogamus (Euphorbiaceae)
Crinum species 1 6538 (Amaryllidaceae)
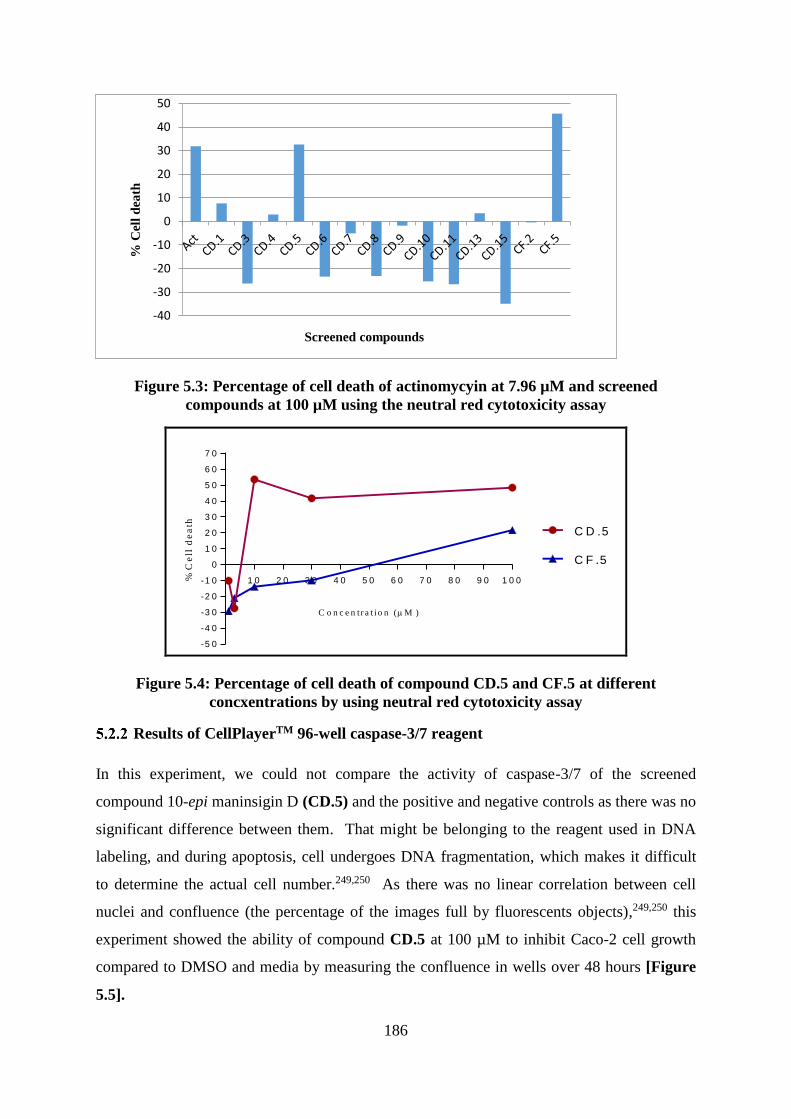
186
Figure 5.3: Percentage of cell death of actinomycyin at 7.96 µM and screened
compounds at 100 µM using the neutral red cytotoxicity assay
1 0 2 0 3 0 4 0 5 0 6 0 7 0 8 0 9 0 1 0 0
-5 0
-4 0
-3 0
-2 0
-1 0
0
1 0
2 0
3 0
4 0
5 0
6 0
7 0
C o n c e n t r a t i o n (M )
%C
ell
de
ath
C D .5
C F .5
Figure 5.4: Percentage of cell death of compound CD.5 and CF.5 at different
concxentrations by using neutral red cytotoxicity assay
Results of CellPlayerTM 96-well caspase-3/7 reagent
In this experiment, we could not compare the activity of caspase-3/7 of the screened
compound 10-epi maninsigin D (CD.5) and the positive and negative controls as there was no
significant difference between them. That might be belonging to the reagent used in DNA
labeling, and during apoptosis, cell undergoes DNA fragmentation, which makes it difficult
to determine the actual cell number.249,250 As there was no linear correlation between cell
nuclei and confluence (the percentage of the images full by fluorescents objects),249,250 this
experiment showed the ability of compound CD.5 at 100 µM to inhibit Caco-2 cell growth
compared to DMSO and media by measuring the confluence in wells over 48 hours [Figure
5.5].
-40
-30
-20
-10
0
10
20
30
40
50
% C
ell
dea
th
Screened compounds
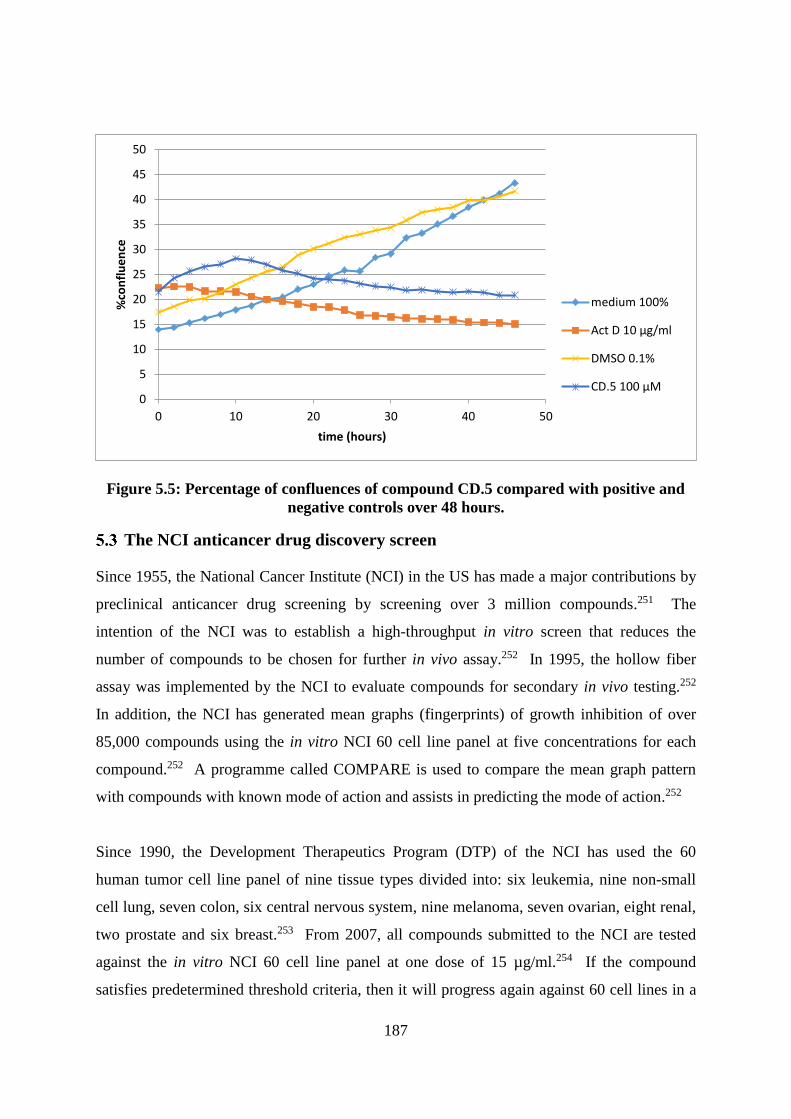
187
Figure 5.5: Percentage of confluences of compound CD.5 compared with positive and
negative controls over 48 hours.
The NCI anticancer drug discovery screen
Since 1955, the National Cancer Institute (NCI) in the US has made a major contributions by
preclinical anticancer drug screening by screening over 3 million compounds.251 The
intention of the NCI was to establish a high-throughput in vitro screen that reduces the
number of compounds to be chosen for further in vivo assay.252 In 1995, the hollow fiber
assay was implemented by the NCI to evaluate compounds for secondary in vivo testing.252
In addition, the NCI has generated mean graphs (fingerprints) of growth inhibition of over
85,000 compounds using the in vitro NCI 60 cell line panel at five concentrations for each
compound.252 A programme called COMPARE is used to compare the mean graph pattern
with compounds with known mode of action and assists in predicting the mode of action.252
Since 1990, the Development Therapeutics Program (DTP) of the NCI has used the 60
human tumor cell line panel of nine tissue types divided into: six leukemia, nine non-small
cell lung, seven colon, six central nervous system, nine melanoma, seven ovarian, eight renal,
two prostate and six breast.253 From 2007, all compounds submitted to the NCI are tested
against the in vitro NCI 60 cell line panel at one dose of 15 µg/ml.254 If the compound
satisfies predetermined threshold criteria, then it will progress again against 60 cell lines in a
0
5
10
15
20
25
30
35
40
45
50
0 10 20 30 40 50
%co
nfl
ue
nce
time (hours)
medium 100%
Act D 10 µg/ml
DMSO 0.1%
CD.5 100 µM
188
five dose assay with maximum concentration of 150 µg/ml. The NCI data is reported as a
percentage growth of a treated cell relative to the no drug control and to the time zero number
of cells. That helps to detect growth inhibition values (between 0 and 100) and lethality
values (less than 0). For example a value of 0 means no growth, a value of 100 would mean
no growth inhibition, a value of 30 means 70% growth inhibition. A value of -30 would
mean 30% lethality and a value of -100 means all treated cells are dead. The bar projection
to the left indicates that the average cell line in the panel is more sensitive than individual cell
line. The bar projection to the right means that an individual cell line is more sensitive than
the average cell line.
Results of NCI60 human tumor cell line panel screening
The selected isolated compound from Croton dichogamus (Euphorbiaceae) and Toona
sinensis (Meliaceae) that were submitted to the NCI60 screen, are given in Table 5.2 All the
compounds submitted were tested using one dose of 15 µg/ml NCI60 cell line panel. The
mean values of growth inhibition of all compounds did not meet the criteria for further testing
against the five-dose NCI60 cell line panel [Table 5.3]. However, compounds 10-epi
maninsigin D (CD.5), trans-cascarillone (CD.6) and agbaninol (CD.7) showed some activity
against one cancer cell line, prostate cancer (PC-3), with growth inhibition percentages of
31.78%, 31.92% and 41.54% respectively. Full results are provided in pages 324-336 of
Appendix.
Previous research showed that piscidinol A (TS.3) possesses moderate to comparable
cytotoxic activity against different cell lines.217,200 However, it was also reported that TS.3
was inactive against the human ovarian carcinoma SKOV-3, human breast carcinoma SK-Br-
3, human chronic myelogenous leukemia K562 and oral human epidermoid carcinoma KB
cancer cell lines under concentration below 20 µg /ml,219 which is in agreement with the
NCI60 results in this study. Previous research showed that euphorbol (TS.4) had 93.6 and
90.3% inhibition rates against the MCF-7 and SF-268 tumour cell lines respectively and weak
cytotoxicity against the NCI-H460 cell line at a higher concentration (100 µM) than tested by
NCI60.223
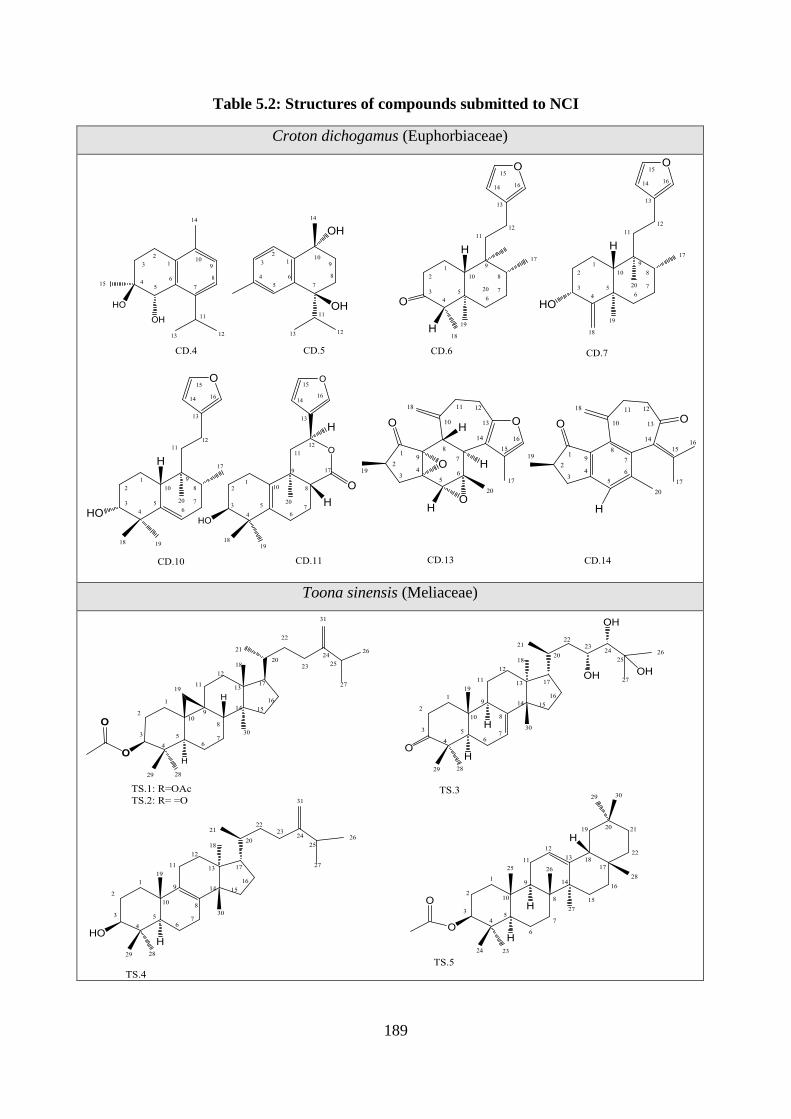
189
Table 5.2: Structures of compounds submitted to NCI
Croton dichogamus (Euphorbiaceae)
Toona sinensis (Meliaceae)
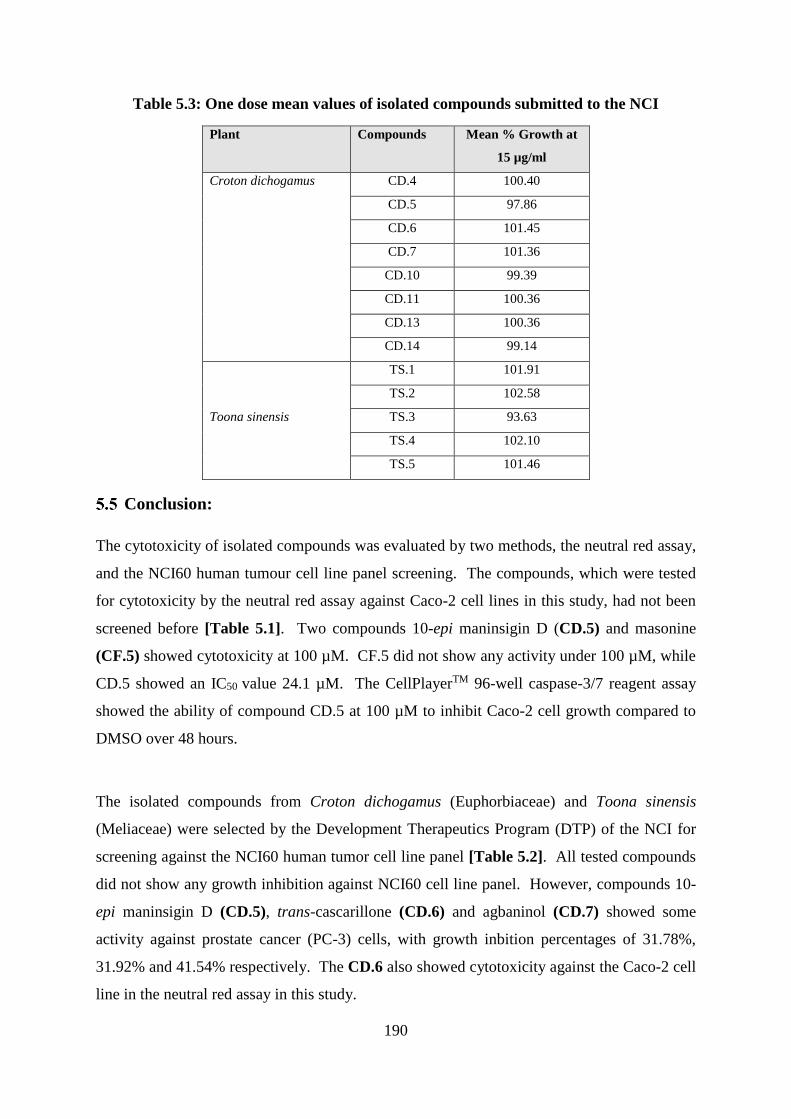
190
Table 5.3: One dose mean values of isolated compounds submitted to the NCI
Plant Compounds Mean % Growth at
15 µg/ml
Croton dichogamus CD.4 100.40
CD.5 97.86
CD.6 101.45
CD.7 101.36
CD.10 99.39
CD.11 100.36
CD.13 100.36
CD.14 99.14
Toona sinensis
TS.1 101.91
TS.2 102.58
TS.3 93.63
TS.4 102.10
TS.5 101.46
Conclusion:
The cytotoxicity of isolated compounds was evaluated by two methods, the neutral red assay,
and the NCI60 human tumour cell line panel screening. The compounds, which were tested
for cytotoxicity by the neutral red assay against Caco-2 cell lines in this study, had not been
screened before [Table 5.1]. Two compounds 10-epi maninsigin D (CD.5) and masonine
(CF.5) showed cytotoxicity at 100 µM. CF.5 did not show any activity under 100 µM, while
CD.5 showed an IC50 value 24.1 µM. The CellPlayerTM 96-well caspase-3/7 reagent assay
showed the ability of compound CD.5 at 100 µM to inhibit Caco-2 cell growth compared to
DMSO over 48 hours.
The isolated compounds from Croton dichogamus (Euphorbiaceae) and Toona sinensis
(Meliaceae) were selected by the Development Therapeutics Program (DTP) of the NCI for
screening against the NCI60 human tumor cell line panel [Table 5.2]. All tested compounds
did not show any growth inhibition against NCI60 cell line panel. However, compounds 10-
epi maninsigin D (CD.5), trans-cascarillone (CD.6) and agbaninol (CD.7) showed some
activity against prostate cancer (PC-3) cells, with growth inbition percentages of 31.78%,
31.92% and 41.54% respectively. The CD.6 also showed cytotoxicity against the Caco-2 cell
line in the neutral red assay in this study.
191
Chapter six: General conclusion
The phytochemistry of five species, Croton dichogamus Pax (Euphorbiaceae family), Crinum
sp. 6538, Crinum hardyi Lehmiller and Crinum sp. 5629 (Amaryllidaceae family), and Toona
sinensis M. Roem (Meliaceae family) were investigated in this study. The genera and
families investigated have been reported to possess different phytochemical compounds some
of which have been developed as medicines, such as galanthamine.
The roots of Croton dichogamus yielded fifteen compounds including four known
sesquiterpenoids (CD.1-CD.4), one new enantiomer of a known sesquiterpenoid (CD.5), four
known ent-clerodane diterpenoids (CD.6-CD.9), two new ent-halimane diterpenoids (CD.10-
CD.11), one known crotofolane (CD.12) two new crotofolane diterpenoids (CD.13-CD.14)
and one known triterpenoid (CD.15). All these compounds have not been isolated previously
from this species. However, CD.1, CD.3, CD.6, CD.8, CD.9 and CD.15 have been isolated
previously from the Croton genus. In a previous study, two new crotofolanes were isolated
from the Croton dichogamus.73 In the present study another two new crotofolane and two
new halimane diterpenoids were isolated from this species. This shows that this species is
rich with new secondary metabolites.
The bulbs of Crinum sp. 6538, Crinum hardyi and of Crinum sp. 5629 gave nine compounds:
one new alkaloid (CF.2), seven known alkaloids (CF.1, CF.3, CF.4, CF.5, CF.6, CH.1 and
CS.3) along with the alkaloid salt (CF.7). CF.5 has not been isolated before from this genus.
The distribution of alkaloids in the three Crinum species showed some variation in their
chemical constituents.
The stem bark of Toona sinensis that is growning on the University of Surrey campus,
Guildford, UK, yielded nine compounds: five known triterpenoids (TS.1-TS.5), two known
flavonoids (TS.6-TS.7) and two common phytosterols (TS.8-TS.9). Although many
compounds have been isolated previously from this species, this study found two compounds
TS.4 and TS.5 that have not been isolated before from this species.
192
The anti-cancer screening of some isolated compounds in this study was performed in two
ways, using the neutral red assay for the estimation of cell cytotoxicity against Caco-2
(Human Colorectal Adenocarcinoma) cell lines, and by submitting selected isolated
compounds to the Development Therapeutics Program (DTP) of the National Cancer Institute
(NCI). CD.5 only showed weak activity with an IC50 24.1 µM against Caco-2 cell lines. In
addition, the mean values of growth inhibition of all compounds tested against one dose
NCI60 cell line panel did not meet the criteria for further testing against the five-dose NCI60
cell line panel. However, a literature review showed a degree of anticancer activity for some
of the isolated compounds.
.
193
Chapter seven: Materials and Methods
Characterisation techniques
Spectroscopic techniques including NMR, FTIR, MS and measurement of optical rotations,
were used to identify the chemical constituents of Croton dichogamus (Euphorbiaceae
family), Crinum species 1 6538, Crinum hardyi Lehmiller, Crinum species 2 6529
(Amaryllidaceae family) and Toona sinensis [Meliaceae family].
Nuclear Magnetic Resonance Spectroscopy (NMR)
NMR experiments were performed on a 500 MHz Bruker AVANCE NMR spectrometer at
the Department of Chemistry, Faculty of Engineering and Physical Science (FEPS),
University of Surrey, UK. The spectra were recorded in deuterated chloroform (CDCl3) and
deuterated methanol (CD3OD). The deuterated chloroform was referenced according to the
central line at δ 7.26 in the 1H NMR spectrum and at δ 77.23 in the 13C NMR spectrum. The
deuterated methanol was referenced according to the central line at δ 4.87 in the 1H NMR
spectrum and at δ 49.15 in the 13C NMR spectrum.
Fourier Transform Infrared Spectroscopy (FTIR)
Infrared spectra were recorded using a Perkin-Elmer (2000 FTIR) spectrophotometre at the
Department of Chemistry, FEPS, University of Surrey, UK. The samples were dissolved in
chloroform or methanol depending on the solubility of compounds, and analysed by adding
two drops onto a KBr plate.
Mass Spectrometry (MS)
High-resolution electrospray ionisation mass spectra (HRMS) were recorded at Oxford
University on a Bruker MicroToF Mass Spectrometer, using an Agilent 1100 HPLC to
introduce samples. Low resolution electron impact mass spectra (LCMS) were recorded at
the Division of Biosciences, Faculty of Health and Medical Sciences, University of Surrey on
a QTOF Premier–Water Corp and at the Department of Chemistry, FEPS, University of
194
Surrey on a Micromass Quattro Ultima-Waters 2695. GC-MS analysis was carried out at the
Department of Chemistry, FEPS, University of Surrey, UK, by using an Agilent
Technologies 7890A GC system coupled to an Agilent Technologies 5975C inert XL EI / CI
MSD with triple Axis Detector, using a HP-5MS 5% phenyl methyl silox column (30 m X
250µm X 0.25 µm). The oven temperature was set at 50 ºC for 3 min then raised to 10
ºC/min to 250 ºC for 2 min, the temperature was then held at 250 ºC for the remaining 20
min. Helium was used as the carrier gas at a flow rate of 1 ml/min. 2 µl of sample was
injected in the split ratio 50:1 at 250 ºC. 0.1g of each sample was dissolved in 1ml DCM or
methanol depending on solubility. Data was run through the NIST library database as an
additional tool to confirm identity of the compounds.
Optical rotation measurement
Optical rotation were measured at room temperturs in either chloroform or methanol using a
JASCO-P-1020 polarimeter at the Department of Chemistry, FEPS, University of Surrey,
UK.
Electronic circular dichroism (ECD)
The ECD spectra were measured on a Chirsascan CD spectrometer at the Department of
Chemistry, FEPS, University of Surrey, UK. It were measured using 1 mm cell with
acetonitrile as a solvent.
Plant collection, extraction and isolation of compounds
Plant Collection
Plant material of Croton dichogamus Pax was collected and identified by Mr. Patrick Mutiso
of the University Herbarium, School Biological Studies, University of Nairobi, Kenya. A
voucher specimem BN 2010/13 was deposited at School Biological Studies, University of
Nairobi.
195
Crinum species 1 6538, Crinum hardyi Lehmiller, Crinum species 2 6529 were obtained from
a green house collection at the University Graz, Geaz, Austria from Wolfgang Wetschnig
from an earlier collection from Madagascar. A voucher specimems SKA 6538 for Crinum
species 1 6538, SKA 6481 for Crinum hardyi and SKA 6529 for Crinum species 2 6529 will
be deposited in the herbarium in Graz (GZU), after flowering [phytosanitary certificate: N°
1036/13/11-IV/RL/MAG, authorisation to collect:N°-/5/13/MEF/SEG/DGF/DCB.SAP/SCB].
Plant material of Toona sinensis M. Roem was collected from a specimen growing on the
University of Surrey campus, Guildford, UK.
Plant extraction
The roots of Croton dichogamus were air dried, ground and extracted successively using
hexane, dichoromethane and methanol by cold percolation at room temperature for 48h. The
extracts were filtered and the solvent was evaporated
The bulbs of Crinum sp. 1 6538, Crinum hardyi, Crinum sp. 2 6529 were chopped into small
pieces. Then, chopped bulbs were extracted successively using hexane and ethanol by
shaking at room temperature for 48h. The extracts were filtered and the solvent was
evaporated
The stem bark of Toona sinensis was air dried ground and extracted successively using
dichloromethane and methanol in a Soxhlet apparatus. The extracts were filtered and the
solvent was evaporated.
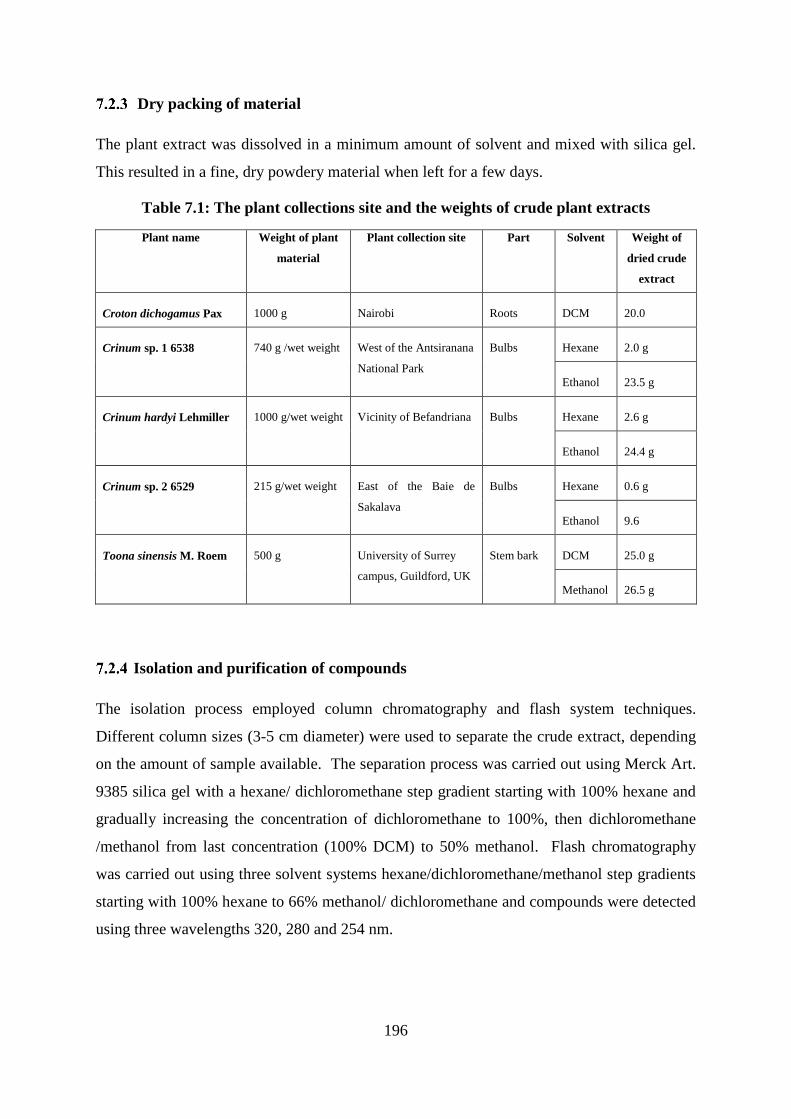
196
Dry packing of material
The plant extract was dissolved in a minimum amount of solvent and mixed with silica gel.
This resulted in a fine, dry powdery material when left for a few days.
Table 7.1: The plant collections site and the weights of crude plant extracts
Plant name Weight of plant
material
Plant collection site Part Solvent
Weight of
dried crude
extract
Croton dichogamus Pax 1000 g Nairobi Roots DCM 20.0
Crinum sp. 1 6538 740 g /wet weight West of the Antsiranana
National Park
Bulbs Hexane 2.0 g
Ethanol 23.5 g
Crinum hardyi Lehmiller 1000 g/wet weight Vicinity of Befandriana Bulbs Hexane 2.6 g
Ethanol 24.4 g
Crinum sp. 2 6529 215 g/wet weight East of the Baie de
Sakalava
Bulbs Hexane 0.6 g
Ethanol 9.6
Toona sinensis M. Roem 500 g University of Surrey
campus, Guildford, UK
Stem bark DCM 25.0 g
Methanol 26.5 g
Isolation and purification of compounds
The isolation process employed column chromatography and flash system techniques.
Different column sizes (3-5 cm diameter) were used to separate the crude extract, depending
on the amount of sample available. The separation process was carried out using Merck Art.
9385 silica gel with a hexane/ dichloromethane step gradient starting with 100% hexane and
gradually increasing the concentration of dichloromethane to 100%, then dichloromethane
/methanol from last concentration (100% DCM) to 50% methanol. Flash chromatography
was carried out using three solvent systems hexane/dichloromethane/methanol step gradients
starting with 100% hexane to 66% methanol/ dichloromethane and compounds were detected
using three wavelengths 320, 280 and 254 nm.
197
Subsequent purifications employed column, preparative thin layer and high-speed counter
current chromatographic techniques. Column chromatography was carried out using a 1 cm
diameter column, which was packed with silica gel (Merck Art. 9385) in DCM or Sephadex
(LH 20) in methanol/DCM. Preparative thin layer chromatography (PTLC) was also
employed for further purification; the samples were lined 1 cm from the bottom of the TLC
plate. The plates were then placed in chromatographic tanks and left to develop in the
selected solvent system. The developed plates were viewed under UV light and marked. The
marked portion of the TLC plates were then scraped off the plate and dissolved in a similar
solvent to that in which the plate was run. The solvent was then filtered and dried. High-
speed counter current chromatography (HSCCC) was also used in subsequent purifications,
using a 95% dichloromethane/ ethyl acetate solvent mixture.
Throughout all these stages thin layer chromatography (0.2 mm silica gel, aluminium-backed
plates, Merck Art. 5554) was used to monitor the fractions that had the same retention value
on TLC, and to choose the best solvent system to be used in the chromatography. The
compounds on TLC were first detected using a UV-lamp at 254 and 365 nm, then they were
also developed using anisaldehyde spray reagent (1% p-anisaldehyde: 2% sulphuric acid: 97
% cold methanol) with subsequent heating. For further details of isolation and purification
compounds are given in the section 7.6 [Scheme 7.1- Scheme 7.5].
198
Chemical analysis
Acetylation of hydroxylated compounds
Pyridine (1 ml) and acetic anhydride (1 ml) were added to the sample in a round bottomed
flask. The reaction was left to stand for 24 hours. MeOH (5 ml) was added to the sample to
remove the excess acetic anhydride. Toluene (4 x 10 ml) was added successively and
evaporated en vacuo to remove the pyridine. Finally, methanol (5 x 10 ml) was added to
remove the toluene. The sample was spotted on a T.L.C. plate to check the reaction had gone
to completion or not.
Base treatment
The ammonium salts that isolated from Crinum species, were treated with base to yield the
free bases alkaloids. The compound was dissolved in methanol then few drops of 4M NaOH
was added. The sample was left at room temperature till all the solvent was evaporated.
Cytotoxicity assay
Neutral red assay
Approximately 5x10⁴ Caco-2 cells/ml were seeded into 96-well plates and incubated at
adequate conditions (CO2, temperature and humidified atmosphere) for 48h. After
incubation, the growth of cells was checked by microscope. 100 mM of every compound
was prepared as a stock solution by dissolving the material in sterile DMSO, then five
concentrations were prepared for every compound, 1, 3, 10, 30, 100 µM, by dilution of the
stock solution in medium (Minium Essential Media Eagel M2279). The culture medium
from the plates was removed by pipette, and 200 µl of each prepared concentration was
added in three replicates to the wells. In addition, 200 µl of medium without chemicals and
200 µl of medium with equivalent amounts of solvent that were used to prepare stock
solution (1µl DMSO/ml medium) were added in three replicates to the wells plate as negative
control. Actinomycin D was used as a positive control in this experiment at a concentration
of 10 µg/ml medium, and was added in three replicates to the well. The plates were
incubated at appropriate conditions for 48h. Meanwhile, 40 µg/ml of neutral red working
199
solution was prepared and incubated overnight under the same conditions as the plates.
Later, the plates were examined under microscope, and the neutral red solution was
centrifuged for 10 min. 100 µl of neutral red medium was added to each well of the plates
after removing all medium from the wells. Then the plates were incubated at appropriate
culture conditions for 2h, and then checked under the microscope. The neutral red medium
was removed and the cells were washed with 150 µl PBS (Phosphate Buffer Saline) per well.
Then the PBS was removed and 150 µl of neutral red distain solution was added per well.
The plates were shacken on a microtiter plate shaker for about 10 min. Finally the OD of the
neutral red extract was measured by a microtiter plate reader spectrofluorimeter at 540 nm.
The experiment was repeated three different times. The percentage of cell death for each
concentration of the tested compounds was calculated with the formula 100-[(Abs540 treated
sample/ Abs540 untreated sample) x 100]. The IC50 (the concentration producing 50%
inhibition of Neutral Red uptake) was calculated for promising compounds by using the
Graphepad software programme.
Measuring Apoptosis: CellPlayerTM 96-well caspase-3/7 reagent
Caspase-3/7 reagent was prepared to a final concentration of 5 µM in the desired medium
formulation. The 96-well plates of culture cells were prepared by the Neutral red assay
method, followed by the same steps of preparing and adding the positive and negative
control, and 100 µM of tested compound. Before incubating the plates, 1 µl of caspase-3/7
reagent was added to each well of the plates. Then, the plates were incubated within a
microplate tray into the IncuCyte FLR
Methodology of the NCI 60 cancer screening
The NCI used the method on following website for cancer screening
https://dtp.cancer.gov/branches/btb/ivclsp.html
200
Summary of physical data
Constituents of Croton dichogamus
7.5.1.1 Physical data for compound CD.1
Name: 4-patchoulene (cyperene)
Yield: 5.2 mg (0.026%)
Physical descsription: white oil
Mass spectrum: [M]+ m/z 204.3 [C15H24], calculated for [C15H24] 204.1878
Infrared spectrum: 2923 and 2853 cm-1 (C-H stretches)
1H, 13C NMR and 2D NMR data presented in Table 2.8
7.5.1.2 Physical data for compound CD.2
Name: 4-patchoulen-3-one (cyperotundone)
Yield: 1.7 mg (0.009%)
Physical description: white oil
Mass spectrum: due to decompose the compound the mass could be found, calculated m/z
value for [C15H22O] 218.1671
Infrared spectrum: 2925 and 2861 cm-1 (C-H stretches) and 1710 cm-1 (C=O stretch)
1H, 13C NMR and 2D NMR data presented in Table 2.9
7.5.1.3 Physical data for compound CD.3
Name: cadin-1(6),2,4,7,9-penta-ene (cadalene)
Yield: 7.1 mg (0.036%)
Physical description: white oil
Mass spectrum: [M]+ m/z 198.2 [C15H18], calculated for [C15H18] value 198.1409
Infrared spectrum: 2925 and 2854 cm-1 (C-H stretches) and 1601 cm-1 (C=C stretch)
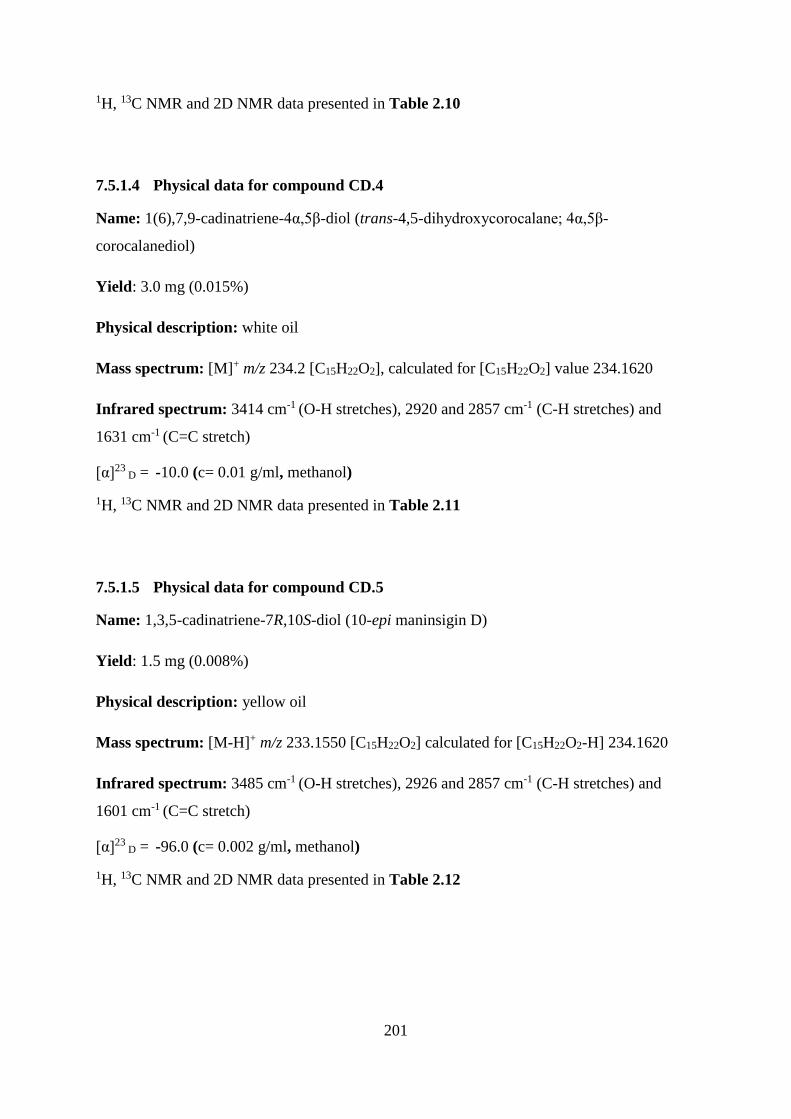
201
1H, 13C NMR and 2D NMR data presented in Table 2.10
7.5.1.4 Physical data for compound CD.4
Name: 1(6),7,9-cadinatriene-4α,5β-diol (trans-4,5-dihydroxycorocalane; 4α,5β-
corocalanediol)
Yield: 3.0 mg (0.015%)
Physical description: white oil
Mass spectrum: [M]+ m/z 234.2 [C15H22O2], calculated for [C15H22O2] value 234.1620
Infrared spectrum: 3414 cm-1 (O-H stretches), 2920 and 2857 cm-1 (C-H stretches) and
1631 cm-1 (C=C stretch)
[α]23 D = -10.0 (c= 0.01 g/ml, methanol)
1H, 13C NMR and 2D NMR data presented in Table 2.11
7.5.1.5 Physical data for compound CD.5
Name: 1,3,5-cadinatriene-7R,10S-diol (10-epi maninsigin D)
Yield: 1.5 mg (0.008%)
Physical description: yellow oil
Mass spectrum: [M-H]+ m/z 233.1550 [C15H22O2] calculated for [C15H22O2-H] 234.1620
Infrared spectrum: 3485 cm-1 (O-H stretches), 2926 and 2857 cm-1 (C-H stretches) and
1601 cm-1 (C=C stretch)
[α]23 D = -96.0 (c= 0.002 g/ml, methanol)
1H, 13C NMR and 2D NMR data presented in Table 2.12
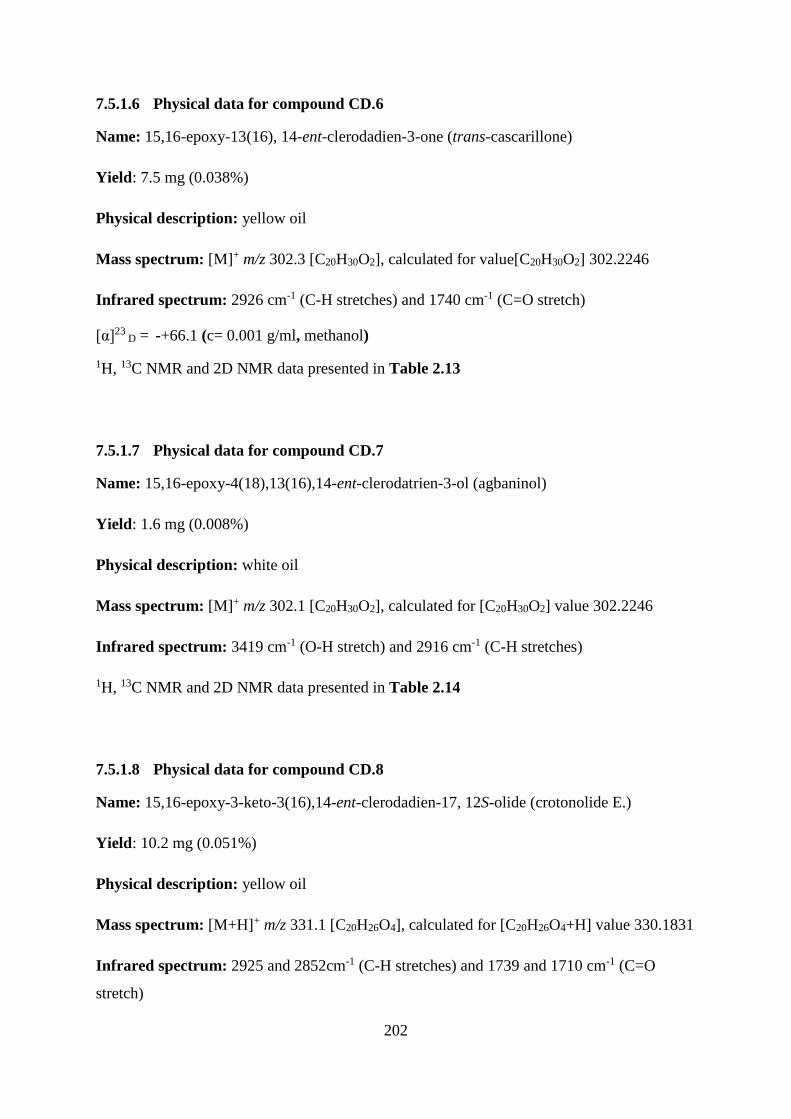
202
7.5.1.6 Physical data for compound CD.6
Name: 15,16-epoxy-13(16), 14-ent-clerodadien-3-one (trans-cascarillone)
Yield: 7.5 mg (0.038%)
Physical description: yellow oil
Mass spectrum: [M]+ m/z 302.3 [C20H30O2], calculated for value[C20H30O2] 302.2246
Infrared spectrum: 2926 cm-1 (C-H stretches) and 1740 cm-1 (C=O stretch)
[α]23 D = -+66.1 (c= 0.001 g/ml, methanol)
1H, 13C NMR and 2D NMR data presented in Table 2.13
7.5.1.7 Physical data for compound CD.7
Name: 15,16-epoxy-4(18),13(16),14-ent-clerodatrien-3-ol (agbaninol)
Yield: 1.6 mg (0.008%)
Physical description: white oil
Mass spectrum: [M]+ m/z 302.1 [C20H30O2], calculated for [C20H30O2] value 302.2246
Infrared spectrum: 3419 cm-1 (O-H stretch) and 2916 cm-1 (C-H stretches)
1H, 13C NMR and 2D NMR data presented in Table 2.14
7.5.1.8 Physical data for compound CD.8
Name: 15,16-epoxy-3-keto-3(16),14-ent-clerodadien-17, 12S-olide (crotonolide E.)
Yield: 10.2 mg (0.051%)
Physical description: yellow oil
Mass spectrum: [M+H]+ m/z 331.1 [C20H26O4], calculated for [C20H26O4+H] value 330.1831
Infrared spectrum: 2925 and 2852cm-1 (C-H stretches) and 1739 and 1710 cm-1 (C=O
stretch)
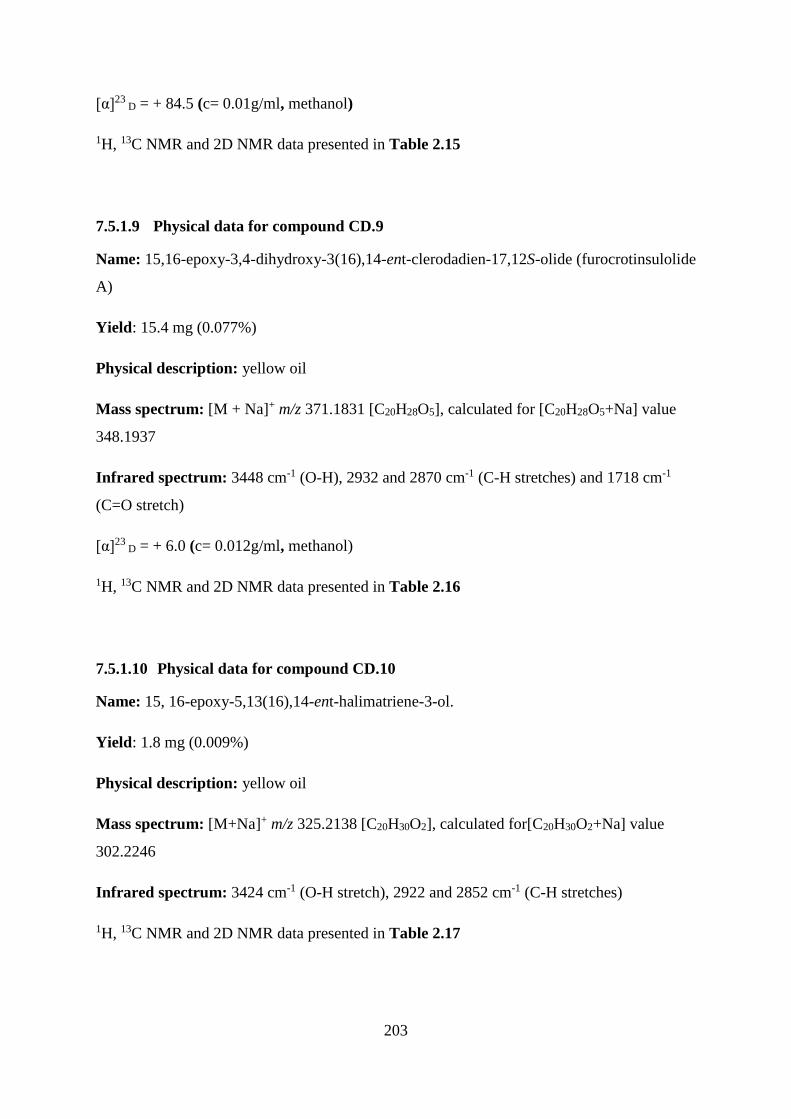
203
[α]23 D = + 84.5 (c= 0.01g/ml, methanol)
1H, 13C NMR and 2D NMR data presented in Table 2.15
7.5.1.9 Physical data for compound CD.9
Name: 15,16-epoxy-3,4-dihydroxy-3(16),14-ent-clerodadien-17,12S-olide (furocrotinsulolide
A)
Yield: 15.4 mg (0.077%)
Physical description: yellow oil
Mass spectrum: [M + Na]+ m/z 371.1831 [C20H28O5], calculated for [C20H28O5+Na] value
348.1937
Infrared spectrum: 3448 cm-1 (O-H), 2932 and 2870 cm-1 (C-H stretches) and 1718 cm-1
(C=O stretch)
[α]23 D = + 6.0 (c= 0.012g/ml, methanol)
1H, 13C NMR and 2D NMR data presented in Table 2.16
7.5.1.10 Physical data for compound CD.10
Name: 15, 16-epoxy-5,13(16),14-ent-halimatriene-3-ol.
Yield: 1.8 mg (0.009%)
Physical description: yellow oil
Mass spectrum: [M+Na]+ m/z 325.2138 [C20H30O2], calculated for[C20H30O2+Na] value
302.2246
Infrared spectrum: 3424 cm-1 (O-H stretch), 2922 and 2852 cm-1 (C-H stretches)
1H, 13C NMR and 2D NMR data presented in Table 2.17
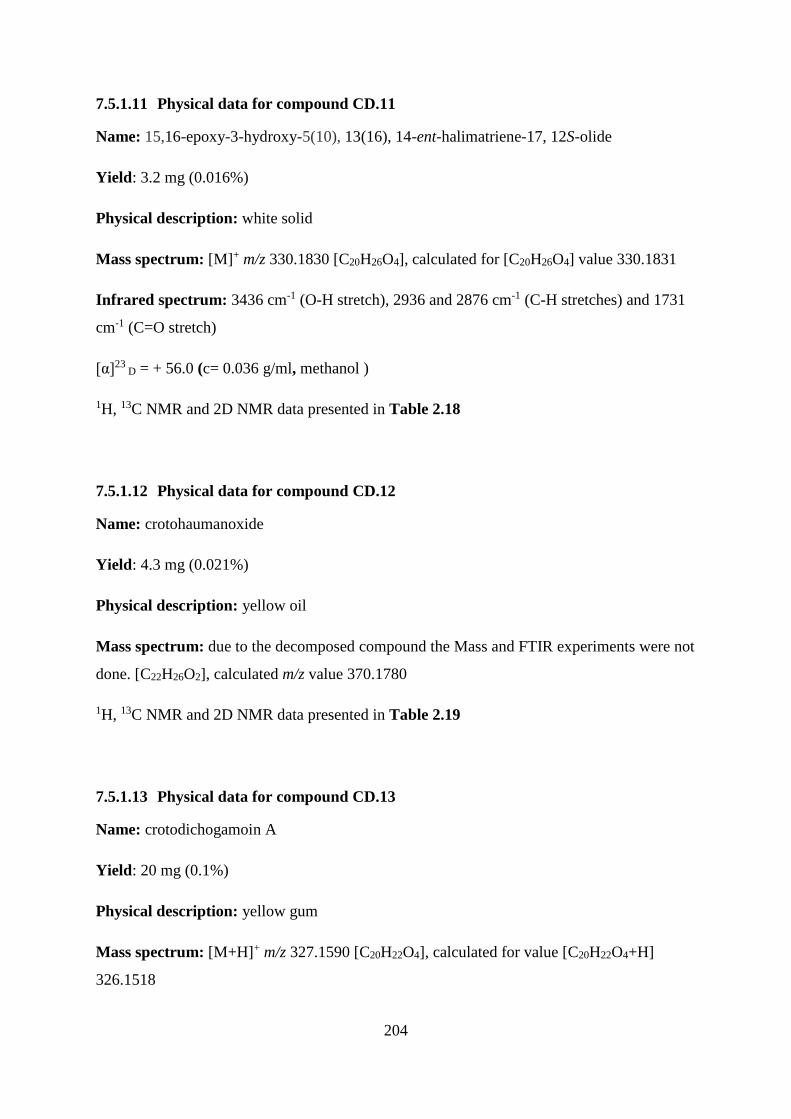
204
7.5.1.11 Physical data for compound CD.11
Name: 15,16-epoxy-3-hydroxy-5(10), 13(16), 14-ent-halimatriene-17, 12S-olide
Yield: 3.2 mg (0.016%)
Physical description: white solid
Mass spectrum: [M]+ m/z 330.1830 [C20H26O4], calculated for [C20H26O4] value 330.1831
Infrared spectrum: 3436 cm-1 (O-H stretch), 2936 and 2876 cm-1 (C-H stretches) and 1731
cm-1 (C=O stretch)
[α]23 D = + 56.0 (c= 0.036 g/ml, methanol )
1H, 13C NMR and 2D NMR data presented in Table 2.18
7.5.1.12 Physical data for compound CD.12
Name: crotohaumanoxide
Yield: 4.3 mg (0.021%)
Physical description: yellow oil
Mass spectrum: due to the decomposed compound the Mass and FTIR experiments were not
done. [C22H26O2], calculated m/z value 370.1780
1H, 13C NMR and 2D NMR data presented in Table 2.19
7.5.1.13 Physical data for compound CD.13
Name: crotodichogamoin A
Yield: 20 mg (0.1%)
Physical description: yellow gum
Mass spectrum: [M+H]+ m/z 327.1590 [C20H22O4], calculated for value [C20H22O4+H]
326.1518
205
Infrared spectrum: 2917 and 2848 cm-1 (C-H stretches) 1747 (C=O stretch) and 1649 cm-1
(C=C stretch)
[α]23 D = + 11.3 (c= 0.023g/ml, chloroform)
1H, 13C NMR and 2D NMR data presented in Table 2.20
7.5.1.14 Physical data for compound CD.14
Name: crotodichogamoin B
Yield: 2.9 mg (0.015%)
Physical description: yellow oil
Mass spectrum: [M+H]+ m/z 295.16945 [C20H22O2], calculated for [C20H22O2+H] value
294.1620
Infrared spectrum: 2928 and 2856 cm-1 (C-H stretches), 1730 cm-1 (C=O stretch) and 1594
cm-1 (C=C stretch)
[α]23 D = + 111.1 (c= 0.0013 g/ml, chloroform)
1H, 13C NMR and 2D NMR data presented in Table 2.21
7.5.1.15 Physical data for compound CD.15
Name: acetyl aleuritolic acid
Yield: 3.3 mg (0.017%)
Physical description: white crystal
Mass spectrum: [M-H]+ m/z 497.3829 [C32H50O4], calculated for [C32H50O4+H]value
498.3709
Infrared spectrum: 2934 and 2861 cm-1 (C-H stretches), 1732 and 1686 cm-1 (C=O stretch)
[α]23 D = 16.2 (c= 0.01g/ml, chloroform)
206
1H, 13C NMR and 2D NMR data presented in Table 2.22
Constituents of Crinum sp. 6538
7.5.2.1 Physical data for compound CF.1
Name: lycorine
Yield: 15.4 mg (0.062%)
Physical description: white crystalline
Mass spectrum: [M+H]+ m/z 288.2 [C16H17NO4], calculated for [C16H17NO4+H] value
287.1158
Infrared spectrum: 3432 cm-1 (O-H stretch), 2921 and 2850 cm-1 (C-H stretches),
[α]23 D = + 50.0 (c= 0.02g/ml, ethanol)
1H, 13C NMR and 2D NMR data presented in Table 3.2
7.5.2.2 Physical data for compound CF.2
Name: 6,7,11b,11c-didehydrolycorinium salt
Yield: 2.7 mg (0.011%)
Physical description: yellow solid
Mass spectrum: [M]+ m/z 284.0911 [C16H14NO4], calculated for [C16H14NO4] value
284.0917
Infrared spectrum: 3343 cm-1 (O-H stretch), 2920 cm-1 (C-H stretches) and 1609 cm-1 (C=C
stretch)
[α]23 D = +20.0 (c= 0.01 g/ml, methanol)
1H, 13C NMR and 2D NMR data presented in Table 3.3
207
7.5.2.3 Physical data for compound CF.3
Name: hippadine
Yield: 3.4 mg (0.014%)
Physical description: yellow solid
Mass spectrum: [M+H]+ m/z 264.4 [C16H9NO3], calculated for [C16H9NO3+H] value
263.0582
Infrared spectrum: 2918 and 2849 cm-1 (C-H stretches), 1738 cm-1 (C=O stretch) and 1675
cm-1 (C=C stretch)
1H, 13C NMR and 2D NMR data presented in Table 3.4
7.5.2.4 Physical data for compound CF.4
Name: hippeastrine.
Yield: 6.3 mg (0.027%)
Physical description: white crystalline
Mass spectrum: [M+H]+ m/z 316.3 [C17H17NO5], calculated for [C17H17NO5+H] value
315.1107
Infrared spectrum: 3468 cm-1 (O-H stretch), 2922 and 2852 cm-1 (C-H stretches), 1726 cm-1
(C=O stretch) and 1614 cm-1 (C=C stretch)
[α]23 D = +140.0 (c= 0.002g/ml, chloroform)
1H, 13C NMR and 2D NMR data presented in Table 3.5
7.5.2.5 Physical data for compound CF.5
Name: masonine
Yield: 1.2 mg (0.006%)
208
Physical description: yellow crystalline
Mass spectrum: [M+H]+ m/z 300.3 [C17H17NO4], calculated for [C17H17NO4+H] value
299.1158
Infrared spectrum: 3437 cm-1 (O-H stretch), 2919 and 2850 cm-1 (C-H stretches) and 1717
cm-1 (C=O stretch)
[α]23 D = +50.0 (c=0.0005 g/ml, methanol)
1H, 13C NMR and 2D NMR data presented in Table 3.6
7.5.2.6 Physical data for compound CF.6
Name: crinine
Yield: 6.7 mg (0.029%)
Physical description: white solid
Mass spectrum: [M+H]+ m/z 272.5 [C16H17NO3], calculated for [C16H17NO3+H] value
271.1208
Infrared spectrum: 3435 cm-1 (O-H stretch) and 2921 and 2851 cm-1 (C-H stretches)
[α]23 D = -12.0 (c= 0.0005g/ml, methanol)
1H, 13C NMR and 2D NMR data presented in Table 3.7
7.5.2.7 Physical data for compound CF.7
Name: the ammonium salt of crinine
Yield: 4.6 mg (0.019%)
Physical description: yellow powder
Mass spectrum: [M]+ m/z 272.3 [C16H18NO3+], calculated for [C16H18NO3
+] value 272.1281
[α]23 D = -15.7 (c= 0.0004g/ml, methanol)
209
1H, 13C NMR and 2D NMR data presented in Table 3.8
Constituents of Crinum hardyi
7.5.3.1 Physical data for compound CH.1
Name: 6-hydroxycrinamine
Yield: 3.8 mg (0.016%)
Physical description: white crystalline
Mass spectrum: [M]+ m/z 317.4 [C17H19NO5], calculated for [C17H19NO5] value 317.3410
Infrared spectrum: 3397 cm-1 (O-H) and 2923 cm-1 (C-H stretches)
[α]23 D = +45.0 (c= 0.005g/ml, chloroform+methanol)
1H, 13C NMR and 2D NMR data presented in Table 3.9
7.5.3.2 Physical data for compound CH.2
Name: Crinine
Yield: 1.9 mg (0.008%)
Physical description: white solid
Mass spectrum: [M+H]+ m/z 272.5 [C16H17NO3], calculated for [C16H17NO3+H] value
271.1208
[α]23 D = -12.0 (c= 0.0005g/ml, methanol)
1H, 13C NMR and 2D NMR data presented Table 3.7
7.5.3.3 Physical data for compound CH.3
Name: the ammonium salt of crinine
210
Yield: 2.1 mg (0.009%)
Physical description: yellow solid
.Mass spectrum: [M]+ m/z 272.3 [C16H18NO3+], calculated for [C16H18NO3
+] value 272.1281
[α]23 D = -15.7 (c= 0.0004g/ml, methanol)
1H, 13C NMR and 2D NMR data presented in Table 3.8
7.5.3.4 Physical data for compound CH.4
Name: lycorine
Yield: 1.8 mg (0.007%)
Physical description: white crystalline
Mass spectrum: [M+H]+ m/z 288.2 [C16H17NO4], calculated for [C16H17NO4+H] value
287.1158
Infrared spectrum: 3432 cm-1 (O-H stretch), 2921 and 2850 cm-1 (C-H stretches),
[α]23 D = + 50.0 (c= 0.02g/ml, ethanol)
1H, 13C NMR and 2D NMR data presented in Table 3.2
7.5.3.5 Physical data for compound CH.5
Name: 6,7,11b,11c-didehydrolycorinium salt
Yield: 3.6 mg (0.015%)
Physical description: yellow solid
Mass spectrum: [M]+ m/z 284.5 [C16H14NO4] calculated for [C16H14NO4] value 284.0917
Infrared spectrum: 3343 cm-1 (O-H stretch), 2920 cm-1 and 2850 cm-1 (C-H stretches) and
1609 cm-1 (C=C)
211
[α]23 D =+20.0 (c= 0.01 g/ml, methanol)
1H, 13C NMR and 2D NMR data presented Table 3.10
Constituents of Crinum species 5629
7.5.4.1 Physical data for compound CS.1
Name: 6α,11exo-diacetoxy crinamine
Yield: 3.1 mg (0.322%)
Physical description: white solid
Mass spectrum: [M-OAc]+ m/z 342.6 [C21H23NO7], calculated for [C21H23NO7-OAc]value
401.1475
[α]23 D +130 (c=0,.01g/ml, chloroform)
1H, 13C NMR and 2D NMR data presented Table 3.11.
7.5.4.2 Physical data for compound CS.2
Name: lycorine
Yield: 1.1 mg (0.011%)
Physical description: white crystalline
Mass spectrum: [M+H]+ m/z 288.2 [C16H17NO4], calculated for[C16H17NO4+H] value
287.1158
Infrared spectrum: 3432 cm-1 (O-H stretch), 2921 and 2850 cm-1 (C-H stretches),
[α]23 D = + 50.0 (c= 0.02g/ml, ethanol)
1H, 13C NMR and 2D NMR data presented in Table 3.2
212
7.5.4.3 Physical data for compound CS.3
Name: pseudolycorine
Yield: 4.7 mg (0.048%)
Physical description: yellow solid
Mass spectrum: [M+H]+ m/z 290.1387 [C16H19NO4], calculated for [C16H19NO4+H]value
289.1314
Infrared spectrum: 3391 cm-1 (O-H stretch), 2922 and 2850 cm-1 (C-H stretches),
[α]23 D -66.5 (c= 0.001 g/ml, ethanol)
1H, 13C NMR and 2D NMR data presented Table 3.12
Constituents of Toona sinensis
7.5.5.1 Physical data for compound TS.1
Name: 24-Methylencycloartan-3-yl acetate
Yield: 6.6 mg (0.246%)
Mass spectrum: [M+H]+ m/z 483.3768 [C33H55O2] calculated for [C33H55O2+H] value
482.4124
Infrared spectrum: 2940 and 2868 cm-1 (C-H stretches), 1734 cm-1 (C=O stretch) and 1636
cm-1 (C=C stretch)
1H, 13C NMR and 2D NMR data presented in Table 4.1
7.5.5.2 Physical data for compound TS.2
Name: 24-Methylencycloartan-3-one
Yield: 1.8 mg (0.007%)
Mass spectrum: [M+H]+ m/z 439.3615 [C31H51O], calculated for [C31H51O+H] value
438.3862
Infrared spectrum: 2919 and 2849 cm-1 (C-H stretches) and 1708 cm-1 (C=O stretch)
1H, 13C NMR and 2D NMR data presented in Table 4.2
213
7.5.5.3 Physical data for compound TS.3
Name: 23,24,25-Trihydroxytirucall-7-en-3-one (piscidinol A)
Yield: 4.3 mg (0.017%)
Mass spectrum: [M+Na]+ m/z 497.3594 [C30H50O4Na], calculated for [C30H50O4Na+Na]
value 474.3709
Infrared spectrum: 3400 cm-1 (OH stretch), 2916 and 2849 cm-1 (C-H stretch) and 1708 cm-
1 (C=O stretch)
1H, 13C NMR and 2D NMR data presented in Table 4.3
7.5.5.4 Physical data for compound TS.4
Name: 24-Methyltirucalla-8,24-dien-3-ol, Euphorbol
Yield: 4.5 mg (0.02%)
Mass spectrum: [M+Na]+ m/z 463.3800 [C31H52ONa], calculated for [C31H52Ona+Na] value
440.4018
Infrared spectrum: 3350 cm-1 (OH stretch) and 1640 cm-1 (C=C stretch)
1H, 13C NMR and 2D NMR data presented in Table 4.4
7.5.5.5 Physical data for compound TS.5
Name: -Amyrin acetate
Yield: 1.7 mg (0.007%)
Mass spectrum: [M-H]+ ion m/z 467.3837 [C32H51O2], calculated for [C32H51O2-H] value
468.3967
Infrared spectrum: 2921 and 2851 cm-1 (C-H stretches), 1737 cm-1 (C=O) and 1636 cm-1
(C=C)
1H, 13C NMR and 2D NMR data presented in Table 4.5
214
7.5.5.6 Physical data for compound TS.6
Name: catechin
Yield: 1.4 mg (0.005%)
Physical description: white solid
Mass spectrum: [M+Na]+ m/z 523.3 [C25H24O11Na], calculated for [C25H24O11Na+Na] value
500.1319
1H, 13C NMR and 2D NMR data presented Table 4.6
7.5.5.7 Physical data for compound TS.7
Name: epicatechin
Yield: 1.7 mg (0.006%)
Physical description: white solid
Mass spectrum: [M+Na]+ m/z 523.3 [C25H24O11Na], calculated for [C25H24O11Na+Na] value
500.1319
Infrared spectrum: 2923 and 2853 cm-1 (C-H stretches), 2360 cm-1 (C=O)
1H, 13C NMR and 2D NMR data presented Table 4.7
Physical data for compound TS.8
Name: sitosterol
Yield: 2.8 mg (0.011%)
Mass spectrum: [M-H]+ m/z 413.3733 [C29H29O], calculated for [C29H29O-H] value
414.3862
Infrared spectrum: 3411 cm-1 (OH stretch), 2919 cm-1, (C-O stretch) and 1640 cm-1 (C=C
stretch).
1H, 13C NMR and 2D NMR data presented in Table 4.8
215
Physical data for compound TS.9
Name: Sitostenone
Yield: 5.9 mg (0.024%)
Mass spectrum: [M+H] + m/z 413.3712 [C29H49O], calculated for [C29H49O+H] value
412.3705
Infrared spectrum: 2919 and 2869 cm-1 (C-H stretches), 1727 cm-1 (C=O) and 1680 cm-1
(C=C stretches).
1H, 13C NMR and 2D NMR data presented in Table 4.9
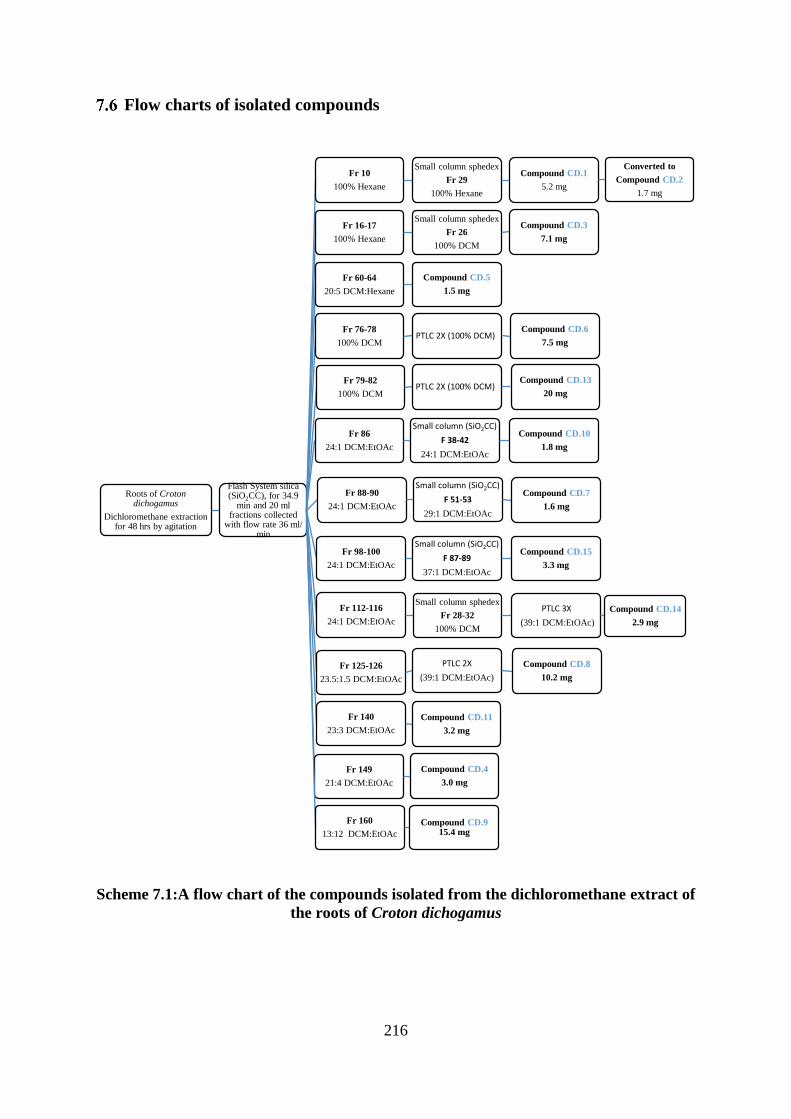
216
Flow charts of isolated compounds
Scheme 7.1:A flow chart of the compounds isolated from the dichloromethane extract of
the roots of Croton dichogamus
Roots of Croton dichogamus
Dichloromethane extraction for 48 hrs by agitation
Flash System silica (SiO2CC), for 34.9
min and 20 ml fractions collected
with flow rate 36 ml/ min
Fr 10
100% Hexane
Small column sphedex
Fr 29
100% Hexane
Compound CD.1
5.2 mg
Converted to
Compound CD.2
1.7 mg
Fr 16-17
100% Hexane
Small column sphedex
Fr 26
100% DCM
Compound CD.3
7.1 mg
Fr 60-64
20:5 DCM:Hexane
Compound CD.5
1.5 mg
Fr 76-78
100% DCMPTLC 2X (100% DCM))
Compound CD.6
7.5 mg
Fr 79-82
100% DCMPTLC 2X (100% DCM))
Compound CD.13
20 mg
Fr 86
24:1 DCM:EtOAc
Small column (SiO2CC)
F 38-42
24:1 DCM:EtOAc
Compound CD.10
1.8 mg
Fr 88-90
24:1 DCM:EtOAc
Small column (SiO2CC)
F 51-53
29:1 DCM:EtOAc
Compound CD.7
1.6 mg
Fr 98-100
24:1 DCM:EtOAc
Small column (SiO2CC)
F 87-89
37:1 DCM:EtOAc
Compound CD.15
3.3 mg
Fr 112-116
24:1 DCM:EtOAc
Small column sphedex
Fr 28-32
100% DCM
PTLC 3X
(39:1 DCM:EtOAc)
Compound CD.14
2.9 mg
Fr 125-126
23.5:1.5 DCM:EtOAc
PTLC 2X
(39:1 DCM:EtOAc)
Compound CD.8
10.2 mg
Fr 140
23:3 DCM:EtOAc
Compound CD.11
3.2 mg
Fr 149
21:4 DCM:EtOAc
Compound CD.4
3.0 mg
Fr 160
13:12 DCM:EtOAc
Compound CD.9 15.4 mg
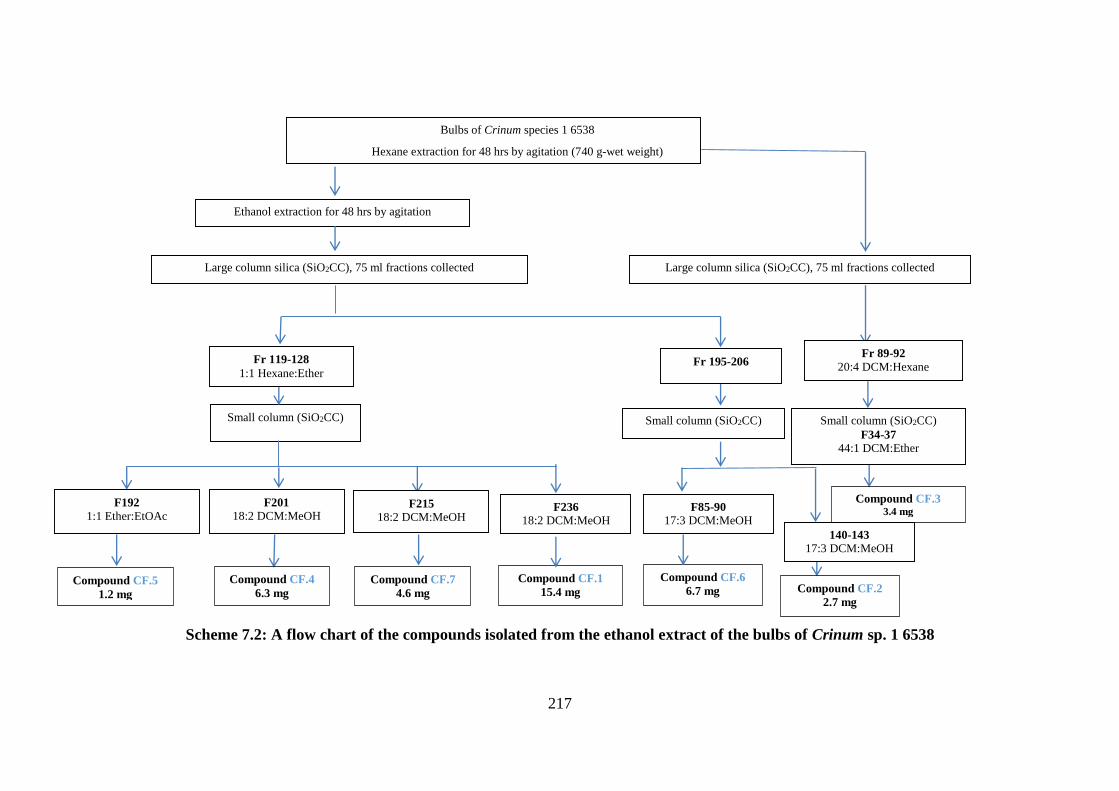
217
Scheme 7.2: A flow chart of the compounds isolated from the ethanol extract of the bulbs of Crinum sp. 1 6538
Compound CF.2
2.7 mg
Small column (SiO2CC)
Bulbs of Crinum species 1 6538
Hexane extraction for 48 hrs by agitation (740 g-wet weight)
Ethanol extraction for 48 hrs by agitation
Large column silica (SiO2CC), 75 ml fractions collected
Fr 119-128
1:1 Hexane:Ether
Fr 89-92
20:4 DCM:Hexane
Compound CF.3 3.4 mg
Fr 195-206
18:7 DCM:MeOH
Large column silica (SiO2CC), 75 ml fractions collected
Compound CF.5
1.2 mg
Compound CF.7
4.6 mg
Compound CF.4
6.3 mg
Compound CF.1
15.4 mg
F192 1:1 Ether:EtOAc
F201 18:2 DCM:MeOH
F215 18:2 DCM:MeOH
F236 18:2 DCM:MeOH
Small column (SiO2CC)
F34-37 44:1 DCM:Ether
Small column (SiO2CC)
F85-90 17:3 DCM:MeOH
140-143 17:3 DCM:MeOH
Compound CF.6
6.7 mg
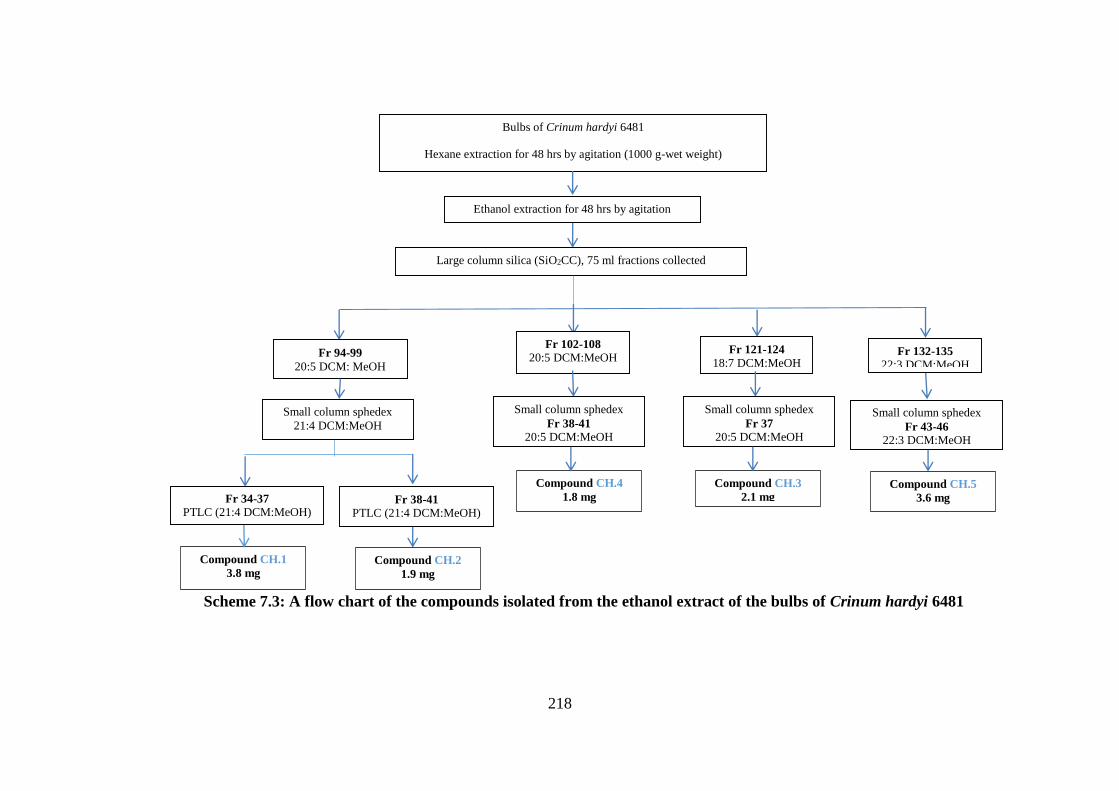
218
Scheme 7.3: A flow chart of the compounds isolated from the ethanol extract of the bulbs of Crinum hardyi 6481
Bulbs of Crinum hardyi 6481
Hexane extraction for 48 hrs by agitation (1000 g-wet weight)
Ethanol extraction for 48 hrs by agitation
Large column silica (SiO2CC), 75 ml fractions collected
Fr 94-99
20:5 DCM: MeOH
Fr 102-108
20:5 DCM:MeOH
Compound CH.4
1.8 mg
Fr 132-135
22:3 DCM:MeOH
Small column sphedex
Fr 43-46
22:3 DCM:MeOH
Compound CH.5
3.6 mg Fr 34-37
PTLC (21:4 DCM:MeOH)
Compound CH.1
3.8 mg
Fr 38-41
PTLC (21:4 DCM:MeOH)
Compound CH.2
1.9 mg
Small column sphedex
Fr 38-41
20:5 DCM:MeOH
Fr 121-124
18:7 DCM:MeOH
Compound CH.3
2.1 mg
Small column sphedex
Fr 37
20:5 DCM:MeOH
Small column sphedex
21:4 DCM:MeOH
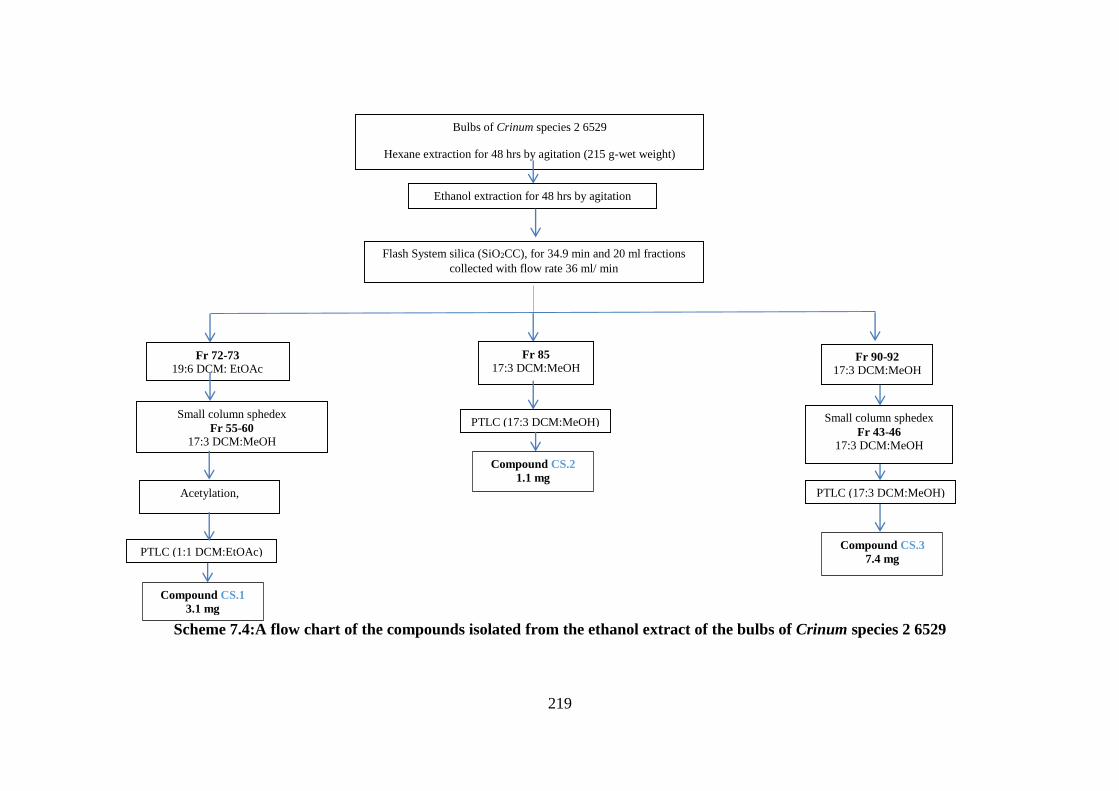
219
Scheme 7.4:A flow chart of the compounds isolated from the ethanol extract of the bulbs of Crinum species 2 6529
Bulbs of Crinum species 2 6529
Hexane extraction for 48 hrs by agitation (215 g-wet weight)
Ethanol extraction for 48 hrs by agitation
Flash System silica (SiO2CC), for 34.9 min and 20 ml fractions
collected with flow rate 36 ml/ min
Fr 72-73
19:6 DCM: EtOAc
Small column sphedex
Fr 55-60
17:3 DCM:MeOH
Fr 85
17:3 DCM:MeOH
Acetylation,
PTLC (1:1 DCM:EtOAc)
Compound CS.1
3.1 mg
PTLC (17:3 DCM:MeOH)
Compound CS.2
1.1 mg
Fr 90-92
17:3 DCM:MeOH
Small column sphedex
Fr 43-46
17:3 DCM:MeOH
PTLC (17:3 DCM:MeOH)
Compound CS.3
7.4 mg
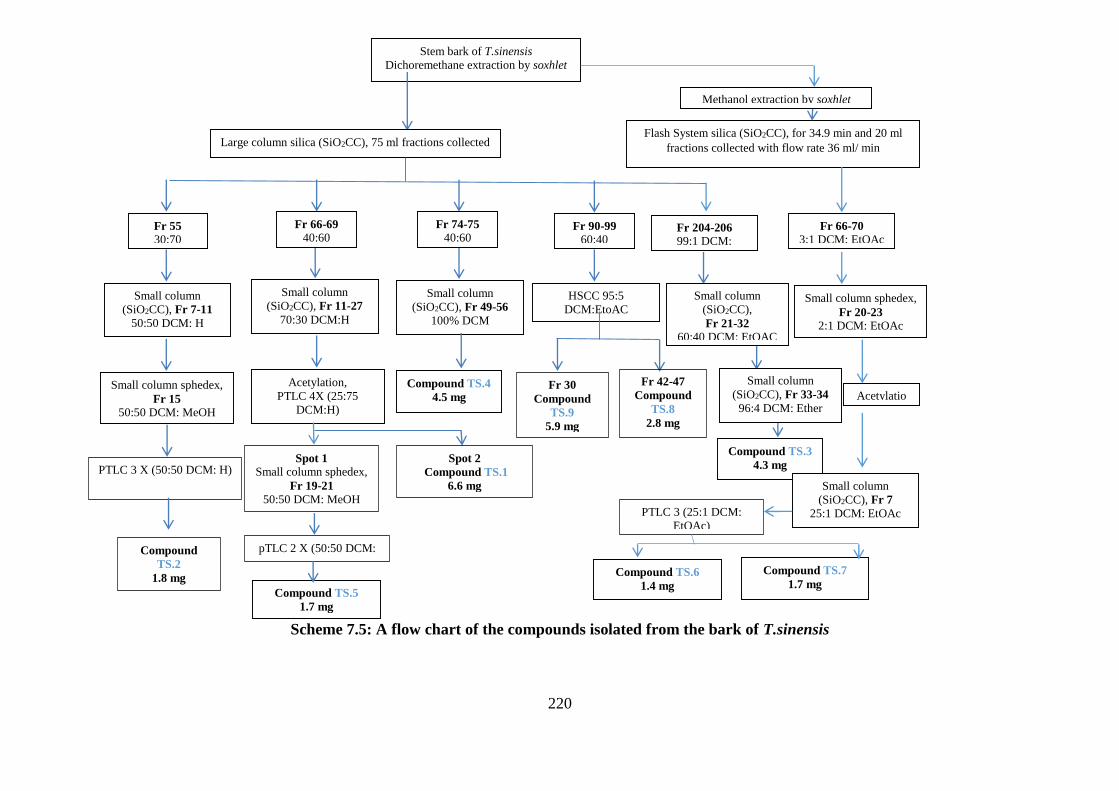
220
Scheme 7.5: A flow chart of the compounds isolated from the bark of T.sinensis
Stem bark of T.sinensis
Dichoremethane extraction by soxhlet
Large column silica (SiO2CC), 75 ml fractions collected
Fr 55
30:70
DCM: H
Small column
(SiO2CC), Fr 7-11
50:50 DCM: H
Small column sphedex,
Fr 15
50:50 DCM: MeOH
PTLC 3 X (50:50 DCM: H)
Fr 204-206
99:1 DCM:
MeOH
Small column
(SiO2CC),
Fr 21-32
60:40 DCM: EtOAC
Small column
(SiO2CC), Fr 33-34
96:4 DCM: Ether
Fr 74-75
40:60
DCM: H
Small column
(SiO2CC), Fr 49-56
100% DCM
Fr 90-99
60:40
DCM: H
Fr 66-69
40:60
DCM: H
Small column
(SiO2CC), Fr 11-27
70:30 DCM:H
HSCC 95:5
DCM:EtoAC
Acetylation,
PTLC 4X (25:75
DCM:H)
Spot 1
Small column sphedex,
Fr 19-21
50:50 DCM: MeOH
pTLC 2 X (50:50 DCM:
H)
Spot 2
Compound TS.1
6.6 mg
Fr 30
Compound
TS.9
5.9 mg
Fr 42-47
Compound
TS.8
2.8 mg
Compound
TS.2
1.8 mg
Compound TS.5
1.7 mg
Compound TS.4
4.5 mg
Compound TS.3
4.3 mg
Methanol extraction by soxhlet
Flash System silica (SiO2CC), for 34.9 min and 20 ml
fractions collected with flow rate 36 ml/ min
Fr 66-70
3:1 DCM: EtOAc
Small column sphedex,
Fr 20-23
2:1 DCM: EtOAc
Acetylatio
n
Small column
(SiO2CC), Fr 7
25:1 DCM: EtOAc
PTLC 3 (25:1 DCM:
EtOAc)
)
Compound TS.6
1.4 mg
Compound TS.7
1.7 mg
221
Reference
1- Chin, Y.-W., Balunas, M., Chai, H., Kinghorn, A. D., 2006. Drug discovery from natural
sources. The American Association of Pharmaceutical scientists 8, E239-E253.
2- Newman, D. J., Cragg, G. M., Snader, K. M., 2000. The influence of natural products upon
drug discovery. Natural Product Reports 17, 215-234.
3- Phillipson, J. D., 2001. Phytochemistry and medicinal plants. Phytochemistry 56, 237-243.
4- Balunas, M. J., Kinghorn, A. D., 2005. Drug discovery from medicinal plants. Life
Sciences 78, 431-441.
5- Ganesan, A., 2004. Natural products as a hunting ground for combinatorial chemistry.
Current Opinion in Biotechnology 15, 584-590.
6- Joy, P., Thomas, J., Mathew, S., Skaria, B. P., 1998. Medicinal plants. Tropical
Horticulture 2, 449-632.
7- Pan, S.-Y., Litscher, G., Gao, S.-H., Zhou, S.-F., Yu, Z.-L., Chen, H.-Q., Zhang, S.-F.,
Tang, M.-K., Sun, J.-N., Ko, K.-M., 2014. Historical perspective of traditional indigenous
medical practices: the current renaissance and conservation of herbal resources. Evidence-
based Complementary and Alternative Medicine : eCAM 2014, 525340.
8- Farnsworth, N. R., Akerele, O., Bingel, A. S., Soejarto, D. D., Guo, Z., 1985. Medicinal
plants in therapy. Bulletin of the World Health Organization 63, 965.
9- Webster, G. L., 1994. Classification of the Euphorbiaceae. Annals of the Missouri
Botanical Garden 81, 3-32.
10- Secco, R. d. S., Cordeiro, I., Senna-Vale, L. d., Sales, M. F. d., Lima, L. R. d., Medeiros,
D., Sá Haiad, B. d., Oliveira, A. S. d., Caruzo, M. B. R., Carneiro-Torres, D., Bigio, N. C.,
2012. An overview of recent taxonomic studies on Euphorbiaceae s.l. in Brazil. Rodriguésia
63, 227-242.
11- Webster, G. L., 1975. Conspectus of a new classification of the Euphorbiaceae. Taxon
24, 593-601.
12- The Angiosperm Phylogeny, G., 2009. An update of the Angiosperm Phylogeny Group
classification for the orders and families of flowering plants: APG III. Botanical Journal of
the Linnean Society 161, 105-121.
13- Wurdack, K. J., Hoffmann, P., Chase, M. W., 2005. Molecular phylogenetic analysis of
uniovulate Euphorbiaceae (Euphorbiaceae sensu stricto) using plastid RBCL and TRNL-F
DNA sequences. American Journal of Botany 92, 1397-1420.
14- Berry, P. E., Hipp, A. L., Wurdack, K. J., Van Ee, B., Riina, R., 2005. Molecular
phylogenetics of the giant genus Croton and tribe Crotoneae (Euphorbiaceae sensu stricto)
using ITS and trnL-trnF DNA sequence data. American Journal of Botany 92, 1520-1534.
15- Webster, G. L., 1994. Synopsis of the genera and suprageneric taxa of Euphorbiaceae.
Annals of the Missouri Botanical Garden 81, 33-144.
222
16- Webster, G. L., 1993. A provisional synopsis of the sections of the genus Croton
(Euphorbiaceae). Taxon, 793-823.
17- Salatino, A., Salatino, M. L. F., Negri, G., 2007. Traditional uses, chemistry and
pharmacology of Croton species (Euphorbiaceae). Journal of the Brazilian Chemical Society
18, 11-33.
18- Gupta, D., Bleakley, B., Gupta, R. K., 2008. Dragon's blood: botany, chemistry and
therapeutic uses. Journal of Ethnopharmacology 115, 361-380.
19- Sollmann, T., 1920. A sketch of the medical history of Dragon's blood. Journal of the
American Pharmaceutical Association 9, 141-144.
20- Jones, K., 2003. Review of sangre de drago (Croton lechleri) - a South American tree sap
in the treatment of diarrhea, inflammation, insect bites, viral Infections, and wounds:
traditional uses to clinical research. The Journal of Alternative and Complementary Medicine
9, 877-896.
21- Aguilar-Guadarrama, A. B., Rios, M. Y., 2004. Three new sesquiterpenes from Croton
arboreous. Journal of Natural Products 67, 914-917.
22- Huang, W., Wang, J., Liang, Y., Ge, W., Wang, G., Li, Y., Yin Chung, H., 2015. Potent
anti-angiogenic component in Croton crassifolius and its mechanism of action. Journal of
Ethnopharmacology 175, 185-191.
23- Thongtan, J., Kittakoop, P., Ruangrungsi, N., Saenboonrueng, J., Thebtaranonth, Y.,
2003. New antimycobacterial and antimalarial 8,9-secokaurane diterpenes from Croton
kongensis. Journal of Natural Products 66, 868-870.
24- Lopes, M. I. L. e., Saffi, J., Echeverrigaray, S., Henriques, J. A. P., Salvador, M., 2004.
Mutagenic and antioxidant activities of Croton lechleri sap in biological systems. Journal of
Ethnopharmacology 95, 437-445.
25- Porras-Reyes, B. H., Lewis, W. H., Roman, J., Simchowitz, L., Mustoe, T. A., 1993.
Enhancement of wound healing by the alkaloid taspine defining mechanism of action.
Experimental Biology and Medicine 203, 18-25.
26- Milanowski, D. J., Winter, R. E. K., Elvin-Lewis, M. P. F., Lewis, W. H., 2002.
Geographic distribution of three alkaloid chemotypes of Croton lechleri. Journal of Natural
Products 65, 814-819.
27- Suárez, A. r. I., Compagnone, R. S., Salazar-Bookaman, M. M., Tillett, S., Delle
Monache, F., Di Giulio, C., Bruges, G., 2003. Antinociceptive and anti-inflammatory effects
of Croton malambo bark aqueous extract. Journal of Ethnopharmacology 88, 11-14.
28- Asare, G. A., Sittie, A., Bugyei, K., Gyan, B. A., Adjei, S., Addo, P., Wiredu, E. K.,
Nyarko, A. K., Otu-Nyarko, L. S., Adjei, D. N., 2011. Acute toxicity studies of Croton
membranaceus root extract. Journal of Ethnopharmacology 134, 938-943.
29- Bayor, M. T., Gbedema, S. Y., Annan, K., 2009. The antimicrobial activity of Croton
membranaceus, a species used in formulations for measles in Ghana. Journal of
Pharmacognosy and Phytotherapy 1, 047-051.
223
30- Giang, P. M., Jin, H. Z., Son, P. T., Lee, J. H., Hong, Y. S., Lee, J. J., 2003. ent-Kaurane
diterpenoids from Croton tonkinensis inhibit LPS-Induced NF-κB activation and no
production. Journal of Natural Products 66, 1217-1220.
31- Ngadjui, B. T., Folefoc, G. G., Keumedjio, F., Dongo, E., Sondengam, B. L., Connolly, J.
D., 1999. Crotonadiol, a labdane diterpenoid from the stem barkof Croton zambesicus.
Phytochemistry 51, 171-174.
32- Block, S., Stevigny, C., De Pauw-Gillet, M., de Hoffmann, E., Llabres, G., Adjakidje, V.,
Quetin-Leclercq, J., 2002. ent-Trachyloban-3 β-ol, a new cytotoxic diterpene from Croton
zambesicus. Planta Medica 68, 647-649.
33- Cuong, N. M., Sung, T. V., Ahn, B.-Z., 2002. Cytotoxic compounds from Croton
cascarilloides. Korean Journal of Pharmaacognosy 33, 207-210.
34- Lima, G. S., Castro-Pinto, D. B., Machado, G. C., Maciel, M. A. M., Echevarria, A.,
2015. Antileishmanial activity and trypanothione reductase effects of terpenes from the
Amazonian species Croton cajucara Benth (Euphorbiaceae). Phytomedicine 22, 1133-1137.
35- Reyes, B. M., Ramírez-Apan, M. T., Toscano, R. A., Delgado, G., 2010. Triterpenes from
Garcia parviflora. Cytotoxic evaluation of natural and semisynthetic friedelanes. Journal of
Natural Products 73, 1839-1845.
36- Tene, M., Ndontsa, B. L., Tane, P., de Dieu Tamokou, J., Kuiate, J.-R., 2009.
Antimicrobial diterpenoids and triterpenoids from the stem bark of Croton macrostachys.
International Journal of Biological and Chemical Sciences 3.
37- Sato, A., Ogiso, A., Kuwano, H., 1980. Acyclic diterpenes from Croton kerrii.
Phytochemistry 19, 2207-2209.
38- Itokawa, H., Ichihara, Y., Takeya, K., Morita, H., Motidome, M., 1991. Diterpenes from
Croton salutaris. Phytochemistry 30, 4071-4073.
39- Ogiso, A., Kitazawa, E., Kurabayashi, M., Sato, A., Takahashi, S., Noguchi, H., Kuwano,
H., Kobayashi, S., Mishima, H., 1978. Isolation and structure of antipeptic ulcer diterpene
from Thai medicinal plant. Chemical & Pharmaceutical Bulletin 26, 3117-3123.
40- Wungsintaweekul, J., De-Eknamkul, W., 2005. Biosynthesis of plaunotol in Croton
stellatopilosus proceeds via the deoxyxylulose phosphate pathway. Tetrahedron Letters 46,
2125-2128.
41- Nomura, H., Kawasaki, A., Mizuno, Y., Kouyama, T., Nakamura, M., Iwao, T., 1997.
The effect of plaunotol on stomatitis induced by interferon. Current Therapeutic Research 58,
428-433.
42- Block, S., Baccelli, C., Tinant, B., Van Meervelt, L., Rozenberg, R., Habib Jiwan, J.-L.,
Llabrès, G., De Pauw-Gillet, M.-C., Quetin-Leclercq, J., 2004. Diterpenes from the leaves of
Croton zambesicus. Phytochemistry 65, 1165-1171.
43- Roengsumran, S., Petsom, A., Kuptiyanuwat, N., Vilaivan, T., Ngamrojnavanich, N.,
Chaichantipyuth, C., Phuthong, S., 2001. Cytotoxic labdane diterpenoids from Croton
oblongifolius. Phytochemistry 56, 103-107.
224
44- Ramos, F., Takaishi, Y., Kashiwada, Y., Osorio, C., Duque, C., Acuña, R., Fujimoto, Y.,
2008. Ent-3,4-seco-labdane and ent-labdane diterpenoids from Croton stipuliformis
(Euphorbiaceae). Phytochemistry 69, 2406-2410.
45- Zhang, Z.-X., Li, H.-H., Qi, F.-M., Xiong, H.-Y., Dong, L.-L., Fan, G.-X., Fei, D.-Q.,
2014. A new halimane diterpenoid from Croton crassifolius. Notes 35, 1557.
46- Sun, Y., Wang, M., Ren, Q., Li, S., Xu, J., Ohizumi, Y., Xie, C., Jin, D.-Q., Guo, Y.,
2014. Two novel clerodane diterpenenes with NGF-potentiating activities from the twigs of
Croton yanhuii. Fitoterapia 95, 229-233.
47- Song, J.-T., Han, Y., Wang, X.-L., Shen, T., Lou, H.-X., Wang, X.-N., 2015.
Diterpenoids from the twigs and leaves of Croton caudatus var. tomentosus. Fitoterapia 107,
54-59.
48- Vasconcelos, M. A., Arruda, F. V. S., Santos, H. S., Rodrigues, A. S., Bandeira, P. N.,
Albuquerque, M. R. J. R., Cavada, B. S., Teixeira, E. H., Henriques, M., Pereira, M. O.,
2014. Effect of a casbane diterpene isolated from Croton nepetaefolius on the prevention and
control of biofilms formed by bacteria and Candida species. Industrial Crops and Products
61, 499-509.
49- e Silva Filho, F. A., Nunes da Silva Junior, J., Braz-Filho, R., de Simone, C. A., Silveira,
E. R., Lima, M. A. S., 2013. Crotofolane- and casbane-type diterpenes from Croton
argyrophyllus. Helvetica Chimica Acta 96, 1146-1154.
50- Kawakami, S., Matsunami, K., Otsuka, H., Shinzato, T., Takeda, Y., Kawahata, M.,
Yamaguchi, K., 2010. A crotofolane-type diterpenoid and a rearranged nor-crotofolane-type
diterpenoid with a new skeleton from the stems of Croton cascarilloides. Tetrahedron Letters
51, 4320-4322.
51- Barreto, M. B., Gomes, C. L., Freitas, J. V. B. d., Pinto, F. d. C. L., Silveira, E. R.,
Gramosa, N. V., Torres, D. S. C., 2013. Flavonoides e terpenoides de Croton muscicarpa
(Euphorbiaceae). Química Nova 36, 675-679.
52- Cai, Y., Evans, F. J., Roberts, M. F., Phillipson, J. D., Zenk, M. H., Gleba, Y. Y., 1991.
Polyphenolic compounds from Croton lechleri. Phytochemistry 30, 2033-2040.
53- Ravanelli, N., Santos, K. P., Motta, L. B., Lago, J. H. G., Furlan, C. M., 2016. Alkaloids
from Croton echinocarpus Baill.: anti-HIV potential. South African Journal of Botany 102,
153-156.
54- Amaral, A. C. F., Barnes, R. A., 1998. A tetrahydroprotoberberine alkaloid from Croton
hemiargyreus. Phytochemistry 47, 1445-1447.
55- Barbosa, P. S., Abreu, A. d. S., Batista, E. F., Guilhon, G. M. S. P., Müller, A. H.,
Arruda, M. S. P., Santos, L. S., Arruda, A. C., Secco, R. S., 2007. Glutarimide alkaloids and
terpenoids from Croton pullei var. glabrior Lanj. Biochemical Systematics and Ecology 35,
887-890.
56- Dewick, P. M., 2002. Medicinal natural products: a biosynthetic approach, 2nded. John
Wiley and Sons, Chichester, England.
225
57- Baser, K. H. C., Buchbauer, G., 2015. Handbook of essential oils: science, technology,
and applications. Taylor and Francis Group, CRC Press, USA.
58- Kawakami, S., Matsunami, K., Otsuka, H., Inagaki, M., Takeda, Y., Kawahata, M.,
Yamaguchi, K., 2015. Crotocascarins I–K: crotofolane-type diterpenoids, crotocascarin γ,
isocrotofolane glucoside and phenolic glycoside from the leaves of Croton cascarilloides.
Chemical and Pharmaceutical Bulletin 63, 1047-1054.
59- MacMILLAN, J., Beale, M. H., 1999. Diterpene biosynthesis. Comprehensive Natural
Products Chemistry 2, 217-243.
60- Nabeta, K., Ishikawa, T., Okuyama, H., 1995. Sesqui- and di-terpene biosynthesis from 13C labelled acetate and mevalonate in cultured cells of Heteroscyphus planus. Journal of the
Chemical Society, Perkin Transactions 1, 3111-3115.
61- Merritt, A. T., Ley, S. V., 1992. Clerodane diterpenoids. Natural Product Reports 9, 243-
287.
62- Mander, L., Liu, H.-W., 2010. Comprehensive natural products II: chemistry and biology.
volum 10. Elsevier Science, Amsterdam.
63- Baker, J. G., Wright C. H., 1913. Croton dichogamus Pax [Family: Euphorbiaceae]. Flora
of Tropical Africa 6, 441.
64- Govaerts, R., 1999. World checklist of Euphorbiaceae. Facilitated by the Royal Botanic
Gardens, Kew. Accessed via http://apps.kew.org/wcsp/namedetail.do?name_id=49769.
Retrieved 07-01-2016.
65- GBIF, Secretariat, 2013. GBIF backbone taxonomy. Accessed via
http://www.gbif.org/species/3059533. Retrieved 17-01-2016
66- Wrubel, E., 2015. Croton dichogamus. Accessed via
http://conabio.inaturalist.org/observations/1858894. Retrieved 25-01-2016
67- Mohagheghzadeh, A., Faridi, P., Shams-Ardakani, M., Ghasemi, Y., 2006. Medicinal
smokes. Journal of Ethnopharmacology 108, 161-184.
68- Fratkin, E., 1996. Traditional medicine and concepts of healing among Samburu
pastoralists of Kenya. Journal of Ethnobiology 16, 63-97.
69- Muthee, J. K., Gakuya, D. W., Mbaria, J. M., Kareru, P. G., Mulei, C. M., Njonge, F. K.,
2011. Ethnobotanical study of anthelmintic and other medicinal plants traditionally used in
Loitoktok district of Kenya. Journal of Ethnopharmacology 135, 15-21.
70- Chhabra, S. C., Throuwa, C. L., Thiong, G. T., Akeng'a, T. R. A., Wambua, P., Ndunda,
B., Onyango, I. O., 2007. Phytochemical and biological studies of the genus Croton for the
development of agrochemical and pharmaceutical products. Journal of the Kenya Chemical
Society 4, 33-46.
71- Omolo, M. O., Okinyo, D., Ndiege, I. O., Lwande, W., Hassanali, A., 2005. Fumigant
toxicity of the essential oils of some African plants against Anopheles gambiae sensu stricto.
Phytomedicine 12, 241-246.
226
72- Johns, T., Mahunnah, R. L. A., Sanaya, P., Chapman, L., Ticktin, T., 1999. Saponins and
phenolic content in plant dietary additives of a traditional subsistence community, the Batemi
of Ngorongoro District, Tanzania. Journal of Ethnopharmacology 66, 1-10.
73- Jogia, M. K., Andersen, R. J., Parkanyi, L., Clardy, J., Dublin, H. T., Sinclair, A. R. E.,
1989. Crotofolane diterpenoids from the African shrub Croton dichogamus Pax. The Journal
of Organic Chemistry 54, 1654-1657.
74- Hemanth Kumar, K., Razack, S., Nallamuthu, I., Khanum, F., 2014. Phytochemical
analysis and biological properties of Cyperus rotundus L. Industrial Crops and Products 52,
815-826.
75- Block, S., Flamini, G., Brkic, D., Morelli, I., Quetin-Leclercq, J., 2006. Analysis of the
essential oil from leaves of Croton zambesicus Muell. Arg. growing in Benin. Flavour
Fragrance J. 21, 222-224.
76- Scifinder, 2016. Chemical abstracts service: Columbus, OH. Retrieved 25-06-2016
77- Pavia, D. L., Lampman, G. M., Kriz, G. S., Vyvyan, J. R., 2009. Introduction to
spectroscopy. 4thed. Cengage Learing, USA.
78- Joseph-Nathan, P., Martińez, E., Santillan, R. L., Wesener, J. R., Günther, H., 1984. Two-
dimensional NMR studies of cyperene. Organic Magnetic Resonance 22, 308-311.
79- Xu, Y., Zhang, H.-W., Wan, X.-C., Zou, Z.-M., 2009. Complete assignments of 1H and 13C NMR data for two new sesquiterpenes from Cyperus rotundus L. Magnetic Resonance in
Chemistry 47, 527-531.
80- Bordoloi, M., Shukla, V. S., Nath, S. C., Sharma, R. P., 1989. Naturally occurring
cadinenes. Phytochemistry 28, 2007-2037.
81- Suga, T., Shishibori, T., Kosela, S., Sood, V. K., 1975. The neutral volatiles of
Boenninghausenia albiflora. Phytochemistry 14, 308-309.
82- El-Seedi, H., Ghia, F., Torssell, K. B. G., 1994. The international journal of plant
biochemistry Cadinane sesquiterpenes from Siparuna macrotepala. Phytochemistry 35, 1495-
1497.
83- Dias, I. J. M., da Camara, C. A. G., Nogueira, P. C. L., 2006. Volatile constituents of the
leaves of Croton sellowii Baill (Euphorbiaceae). Journal of Essential Oil Research 18, 360-
361.
84- Franco, M. S., Cordero, C. P., Morantes, S. J., Aristizabal, F., Osorio, C., 2011. Cytotoxic
labdane diterpenoids isolated from the hexane fraction of the Croton stipuliformis stem bark.
Vitae 18, 173-182.
85- Kuo, Y.-H., Yu, M.-T., 1999. Four new sesquiterpenes from the heartwood of Juniperus
formosana var. concolor. Chemical and Pharmaceutical Bulletin 47, 1017-1019.
86- Zhang, H.-J., Hung, N. V., Cuong, N. M., Soejarto, D. D., Pezzuto, J. M., Fong, H. H. S.,
Tan, G. T., 2005. Sesquiterpenes and butenolides, natural anti-HIV constituents from Litsea
verticillata. Planta Medica 71, 452-457.
227
87- Shang, S.-Z., Kong, L.-M., Yang, L.-P., Jiang, J., Huang, J., Zhang, H.-B., Shi, Y.-M.,
Zhao, W., Li, H.-L., Luo, H.-R., Li, Y., Xiao, W.-L., Sun, H.-D., 2013. Bioactive phenolics
and terpenoids from Manglietia insignis. Fitoterapia 84, 58-63.
88- McCHESNY, J. D., E.R.Silveira, 1990. ent-Clerodanes of Croton sonderlanus.
Fitoterapia LXI, 172.
89- Monte, F. J. Q., Dantas, E. M. G., Raimundo Braz, F., 1988. New diterpenoids from
Croton argyrophylloides. Phytochemistry 27, 3209-3212.
90- Fazio, C., Passannanti, S., Pia Paternostro, M., Piozzi, F., 1992. Neo-clerodane
diterpenoids from Stachys rosea. Phytochemistry 31, 3147-3149.
91- Pudhom, K., Sommit, D., 2011. Clerodane diterpenoids and a trisubstituted furan from
Croton oblongifolius. Phytochemistry Letters 4, 147-150.
92- Ekong, D. E. U., Okogun, J. I., 1969. West African timbers. Part XXV. Diterpenoids of
Gossweilerodendron balsamiferum harms. Journal of the Chemical Society C: Organic, 2153-
2156.
93- Liu, C.-P., Xu, J.-B., Zhao, J.-X., Xu, C.-H., Dong, L., Ding, J., Yue, J.-M., 2014.
Diterpenoids from Croton laui and their cytotoxic and antimicrobial activities. Journal of
Natural Products 77, 1013-1020.
94- Jones, W. P., Lobo-Echeverri, T., Mi, Q., Chai, H.-B., Soejarto, D. D., Cordell, G. A.,
Swanson, S. M., Kinghorn, A. D., 2007. Cytotoxic constituents from the fruiting branches of
Callicarpa americana collected in Southern Florida,1. Journal of Natural Products 70, 372-
377.
95- Alqahtani, A. M., 2015. Phytochemical investigation of members of the Asparagaceae
and Euphorbiaceae families. PhD thesis. Department of Chemistry, Faculty of Engineering
and Physical Sciences, University of Surrey, UK.
96- Graikou, K., Aligiannis, N., Chinou, I., Skaltsounis, A.-L., Tillequin, F. and Litaudon, M.
, 2005. Chemical constituents from Croton insularis. Helvetica Chimica Acta 88:, 2654–
2660.
97- De, P. T., Urones, J. G., Marcos, I. S., Basabe, P., Cuadrado, M. J. S., Fernandez Moro,
R., 1987. Triterpenes from Euphorbia broteri. Phytochemistry 26, 1767-1776.
98- Tchissambou, L., Chiaroni, A., Riche, C., Khuong-Huu, F., 1990. Crotocorylifuran and
crotohaumanoxide, new diterpenes from Croton Haumanianus J. Leonard. Tetrahedron 46,
5199-5202.
99- Kawakami, S., Toyoda, H., Harinantenaina, L., Matsunami, K., Otsuka, H., Shinzato, T.,
Takeda, Y., Kawahata, M., Yamaguchi, K., 2013. Eight new diterpenoids and two new nor-
diterpenoids from the Stems of Croton cascarilloides. Chemical and Pharmaceutical Bulletin
61, 411-418.
100- da Silva San Gil, R. A., Albuquerque, M. G., de Alencastro, R. B., da Cunha Pinto, A.,
do Espírito Santo Gomes, F., de Castro Dantas, T. N., Maciel, M. A. M., 2008. Solid-state 13C NMR and molecular modeling studies of acetyl aleuritolic acid obtained from Croton
cajucara Benth. Journal of Molecular Structure 885, 82-88.
228
101- Mathabe, M. C., Hussein, A. A., Nikolova, R. V., Basson, A. E., Meyer, J. J. M., Lall,
N., 2008. Antibacterial activities and cytotoxicity of terpenoids isolated from Spirostachys
africana. Journal of Ethnopharmacology 116, 194-197.
102- Kubitzki, K., 1998. The families and genera of vascular plants. Springer-Verlag, Berlin
Heidelberg.
103- Hickey, M., King, C., 1988. 100 families of flowering plants, 2nded. Cambridge
University Press, New York, USA.
104- Chase, M. W., Reveal, J. L., Fay, M. F., 2009. A subfamilial classification for the
expanded asparagalean families Amaryllidaceae, Asparagaceae and Xanthorrhoeaceae.
Botanical Journal of the Linnean Society 161, 132-136.
105- Jin, Z., 2013. Amaryllidaceae and sceletium alkaloids. Natural Product Reports 30, 849-
868.
106- He, M., Qu, C., Gao, O., Hu, X., Hong, X., 2015. Biological and pharmacological
activities of Amaryllidaceae alkaloids. Royal Society of Chemistry Advances 5, 16562-
16574.
107- Refaat, J., Kamel, M. S., Ramadan, M. A., Ali, A. A., 2012. Crinum; an endless source
of bioactive principles: a review. Part III; crinum alkaloids: belladine-, galanthamine-,
lycorenine-, tazettine-type alkaloids and other minor types. International Journal of
Pharmaceutical Sciences and Research 3, 3630.
108- Verdoorn, I. C., 1973. The Genus Crinum in Southern Africa.
109- Snijman, D. A., Linder, H. P., 1996. Phylogenetic Relationships, Seed Characters, and
dispersal system evolution in Amaryllideae (Amaryllidaceae). Annals of the Missouri
Botanical Garden 83, 362-386.
110- Fennell, C. W., van Staden, J., 2001. Crinum species in traditional and modern
medicine. Journal of Ethnopharmacology 78, 15-26.
111- Thi Ngoc Tram, N., Titorenkova, T. V., St. Bankova, V., Handjieva, N. V., Popov, S. S.,
2002. Crinum L. (Amaryllidaceae). Fitoterapia 73, 183-208.
112- Carr, D. G. G., 2006. Vascular plant family Access via
http://www.botany.hawaii.edu/faculty/carr/phylo_amaryllid.htm. Retrieved: 20-05-2016.
113- Ilavenil, S., Kaleeswaran, B., Sumitha, P., Tamilvendan, D., Ravikumar, S., 2011.
Protection of human erythrocyte using Crinum asiaticum extract and lycorine from oxidative
damage induced by 2-amidinopropane. Saudi Journal of Biological Sciences 18, 181-187.
114- Samud, A. M., Asmawi, M. Z., Sharma, J. N., Yusof, A. P. M., 1999. Anti-
inflammatory activity of Crinum asiaticum plant and its effect on bradykinin-induced
contractions on isolated uterus. Immunopharmacology 43, 311-316.
115- Likhitwitayawuid, K., Angerhofer, C. K., Chai, H., Pezzuto, J. M., Cordell, G. A.,
Ruangrungsi, N., 1993. Cytotoxic and antimalarial alkaloids from the bulbs of Crinum
amabile. Journal of Natural Products 56, 1331-1338.
229
116- Ratnasooriya, W. D., Deraniyagala, S. A., Bathige, S. D. N. K., Hettiarachchi, H. D. I.,
2005. Leaf extract of Crinum bulbispermum has antinociceptive activity in rats. Journal of
Ethnopharmacology 97, 123-128.
117- Amos, S., Binda, L., Akah, P., Wambebe, C., Gamaniel, K., 2003. Central inhibitory
activity of the aqueous extract of Crinum giganteum. Fitoterapia 74, 23-28.
118- Houghton, P. J., Agbedahunsi, J. M., Adegbulugbe, A., 2004. Choline esterase
inhibitory properties of alkaloids from two Nigerian Crinum species. Phytochemistry 65,
2893-2896.
119- Duri, Z. J., Scovill, J. P., Huggins, J. W., 1994. Activity of a methanolic extract of
Zimbabwean Crinum macowanii against exotic RNA viruses in vitro. Phytotherapy Research
8, 121-122.
120- Bastida, J., Berkov, S., Torras, L., Pigni, N. B., de Andrade, J. P., Martínez, V., Codina,
C., Viladomat, F., 2011. Chemical and biological aspects of Amaryllidaceae alkaloids.
Recent Advances in Pharmaceutical Sciences 3, 65-100.
121- Miyakado, M., Kato, T., Ohno, N., Koshimizu, K., 1975. Alkaloids of Urginea altissima
and their antimicrobial activity against Phytophthora capsici. Phytochemistry 14, 2717.
122- Mulholland, D. A., Crouch, N., Decker, B., Smith, M. T., 2002. The isolation of the
Amaryllidaceae alkaloid crinamine from Dioscorea dregeana (Dioscoreaceae). Biochemical
Systematics and Ecology 30, 183-185.
123- Wang, Y.-H., Zhang, Z.-K., Yang, F.-M., Sun, Q.-Y., He, H.-P., Di, Y.-T., Mu, S.-Z.,
Lu, Y., Chang, Y., Zheng, Q.-T., Ding, M., Dong, J.-H., Hao, X.-J., 2007.
Benzylphenethylamine alkaloids from Hosta plantaginea with inhibitory activity against
Tobacco Mosaic virus and acetylcholinesterase. Journal of Natural Products 70, 1458-1461.
124- Lilienfeld, S., 2002. Galantamine — a novel cholinergic drug with a unique dual mode
of action for the treatment of patients with Alzheimer's disease. CNS Drug Reviews 8, 159-
176.
125- Raskind, M. A., 2003. Update on Alzheimer drugs (galantamine). The neurologist 9,
235-240.
126- Saltan Çitoğlu, G., Bahadır Acıkara, Ö., Sever Yılmaz, B., Özbek, H., 2012. Evaluation
of analgesic, anti-inflammatory and hepatoprotective effects of lycorine from Sternbergia
fisheriana (Herbert) Rupr. Fitoterapia 83, 81-87.
127- Ilavenil, S., Karthik, D., Arasu, M. V., Vijayakumar, M., Srigopalram, S., Arokiyaraj,
S., Ravikumar, S., Choi, K. C., 2015. Hepatoprotective mechanism of lycorine against carbon
tetrachloride induced toxicity in swiss albino mice – A proteomic approach. Asian Pacific
Journal of Reproduction 4, 123-128.
128- Liu, X.-s., Jiang, J., Jiao, X.-y., Wu, Y.-e., Lin, J.-h., Cai, Y.-m., 2009. Lycorine induces
apoptosis and down-regulation of Mcl-1 in human leukemia cells. Cancer Letters 274, 16-24.
230
129- Cao, Z., Yu, D., Fu, S., Zhang, G., Pan, Y., Bao, M., Tu, J., Shang, B., Guo, P., Yang,
P., Zhou, Q., 2013. Lycorine hydrochloride selectively inhibits human ovarian cancer cell
proliferation and tumor neovascularization with very low toxicity. Toxicology Letters 218,
174-185.
130- Toriizuka, Y., Kinoshita, E., Kogure, N., Kitajima, M., Ishiyama, A., Otoguro, K.,
Yamada, H., Ōmura, S., Takayama, H., 2008. New lycorine-type alkaloid from Lycoris
traubii and evaluation of antitrypanosomal and antimalarial activities of lycorine derivatives.
Bioorganic and Medicinal Chemistry 16, 10182-10189.
131- Song, J.-H., Zhang, L., Song, Y., 2014. Alkaloids from Lycoris aurea and their
cytotoxicities against the head and neck squamous cell carcinoma. Fitoterapia 95, 121-126.
132- Evidente, A., Andolfi, A., Abou-Donia, A. H., Touema, S. M., Hammoda, H. M.,
Shawky, E., Motta, A., 2004. (−)-Amarbellisine, a lycorine-type alkaloid from Amaryllis
belladonna L. growing in Egypt. Phytochemistry 65, 2113-2118.
133- McNulty, J., Nair, J. J., Codina, C., Bastida, J., Pandey, S., Gerasimoff, J., Griffin, C.,
2007. Selective apoptosis-inducing activity of crinum-type Amaryllidaceae alkaloids.
Phytochemistry 68, 1068-1074.
134- Doskočil, I., Hošťálková, A., Šafratová, M., Benešová, N., Havlík, J., Havelek, R.,
Kuneš, J., Královec, K., Chlebek, J., Cahlíková, L., 2015. Cytotoxic activities of
Amaryllidaceae alkaloids against gastrointestinal cancer cells. Phytochemistry Letters 13,
394-398.
135- Adekanmi Adewusi, E., Fouche, G., Steenkamp, V., 2012. Cytotoxicity and
acetylcholinesterase inhibitory activity of an isolated crinine alkaloid from Boophane disticha
(Amaryllidaceae). Journal of Ethnopharmacology 143, 572-578.
136- Antoun, M. D., Mendoza, N. T., Ríos, Y. R., Proctor, G. R., Wickramaratne, D. B. M.,
Pezzuto, J. M., Kinghorn, A. D., 1993. Cytotoxicity of hymenocallis expansa Alkaloids.
Journal of Natural Products 56, 1423-1425.
137- Havelek, R., Seifrtova, M., Kralovec, K., Bruckova, L., Cahlikova, L., Dalecka, M.,
Vavrova, J., Rezacova, M., Opletal, L., Bilkova, Z., 2014. The effect of Amaryllidaceae
alkaloids haemanthamine and haemanthidine on cell cycle progression and apoptosis in p53-
negative human leukemic Jurkat cells. Phytomedicine 21, 479-490.
138- Ghosal, S., S. Saini, K., Razdan, S., 1985. Crinum alkaloids: their chemistry and
biology. Phytochemistry 24, 2141-2156.
139- Ali, A. A., El Saved, H. M., Abdalliah, O. M., Steglich, W., 1986. Oxocrinine and other
alkaloids from Crinum americanum. Phytochemistry 25, 2399-2401.
140- Ghosal, S., Singh, S. K., Unnikrishnan, S. G., 1990. Effects of stress on alkaloid
metabolism in Crinum asiaticum. Phytochemistry 29, 805-811.
141- Ghosal, S., Unnikrishnan, S., Singh, S. K., 1989. Occurrence of two epimeric alkaloids
and metabolism compared with lycorine in Crinum latifolium. Phytochemistry 28, 2535-
2537.
231
142- Jeffs, P. W., Abou-Donia, A., Campau, D., Staiger, D., 1985. Alkaloids of the
Amaryllidaceae. 27. Structures of 9-O-demethylhomolycorine and 5.alpha.-
hydroxyhomolycorine. Alkaloids of Crinum defixum, C. scabrum, and C. latifolium.
Assignment of aromatic substitution patterns from 1H-coupled carbon-13 spectra. The Journal
of Organic Chemistry 50, 1732-1737.
143- Guerrieri, C. G., Pigni, N. B., de Andrade, J. P., dos Santos, V. D., Binns, F., de Souza
Borges, W., Viladomat, F., Bastida, J., Alkaloids from Crinum erubescens Aiton. Arabian
Journal of Chemistry.
144- Nair, J. J., Campbell, W. E., Gammon, D. W., Albrecht, C. F., Viladomat, F., Codina,
C., Bastida, J., 1998. Alkaloids from Crinum delagoense1. Phytochemistry 49, 2539-2543.
145- Lam Huong, P., Döpke, W., Wagner, J., Mügge, C., 1998. Alkaloids from Crinum
amabile. Phytochemistry 48, 371-376.
146- Nguyen, H.-Y. T., Vo, B.-H. T., Nguyen, L.-T. H., Bernad, J., Alaeddine, M., Coste, A.,
Reybier, K., Pipy, B., Nepveu, F., 2013. Extracts of Crinum latifolium inhibit the cell
viability of mouse lymph oma cell line EL4 and induce activation of anti-tumour activity of
macrophages in vitro. Journal of Ethnopharmacology 149, 75-83.
147- Ali, A. A., Kating, H., Frahm, A. W., 1981. Four 6-hydroxylated alkaloids in the crinine
series from Crinum augustum. Phytochemistry 20, 1731-1733.
148- Wildman, W. C., Heimer, N. E., 1967. Alkaloid biosynthesis and interconversions.
Conversion of caranine to lycorine. Journal of the American Chemical Society 89, 5265-
5269.
149- Vickery, M. L. B. V., 1981. Secondary plant metabolism. Macmillan, London.
150- Harken, R. D., Christensen, C. P., Wildman, W. C., 1976. Interconversions in the
pluviine-lycorenine series. The Journal of Organic Chemistry 41, 2450-2454.
151- Pohi, T.-L., 2002. Extractive from the Amaryllidacea and the Hyacinthaceae. PhD
thesis. Department of Chemistry, University of Natal, Natal, South Africa.
152- Haslam, E., 1985. Metabolites and metabolism: a commentary on secondary
metabolism. Clarendon Press, Oxford.
153- Humbert, H.-. 1950. Flore de Madagascar et des Comores : plantes vasculaires / publiée
sous les auspices du gouvernement général de Madagascar et sous la direction de H.
Humbert. Imprimerie officielle; Muséum national d'histoire naturelle, Tananarive :Paris.
154- Contu, S., 2014. . Crinum firmifolium. The IUCN Red List of Threatened Species 2014:
e.T44393580A44525974. Accessed via http://dx.doi.org/10.2305/IUCN.UK.2014-
1.RLTS.T44393580A44525974.en. Retrieved 27-04- 2016.
155- 2016. Crinum firmifolium A native to Madagascar (D Lehmiller). Accessed via
http://216.92.239.193/v/Crinum-
Lilies/Crinum_firmifolium_Madagascar_D_Lehmiller.jpg.html. Retrieved 29-04-2016.
156- Razafimbelo, J., Andriantsiferana, M., Baudouin, G., Tillequin, F., 1996. Alkaloids from
Crinum firmifolium var. hygrophilum. Phytochemistry 41, 323-326.
232
157- Nair, J. J., Machocho, A. K., Campbell, W. E., Brun, R., Viladomat, F., Codina, C.,
Bastida, J., 2000. Alkaloids from Crinum macowanii. Phytochemistry 54, 945-950.
158- Campbell, W. E., Nair, J. J., Gammon, D. W., Bastida, J., Codina, C., Viladomat, F.,
Smith, P. J., Albrecht, C. F., 1998. Cytotoxic and antimalarial alkaloids from Brunsvigia
littoralis. Planta Medica. 64, 91-93.
159- Wagner, J., Pham, H. L., Döpke, W., 1996. Alkaloids from Hippeastrum equestre Herb.
—5. Circular dichroism studies. Tetrahedron 52, 6591-6600.
160- Chetty, J., 2001. Extractive from the Amaryllidaceae: Brunsvigia radulosa and
Cyrtanthus breviflorus. Department of Chemistry., vol. Master of Science. University of
Natal, Durban, South Africa.
161- Hunger, A., Reichstein, T., 1953. Isolation of lycorine from the bulbs of a Crinum
species of Madagascar (Crinum firmifolium Baker). Helvetica Chimica Acta 36, 824-828.
162- Sun, Q., Shen, Y.-H., Tian, J.-M., Tang, J., Su, J., Liu, R.-H., Li, H.-L., Xu, X.-K.,
Zhang, W.-D., 2009. Chemical Constituents of Crinum asiaticum L. var. sinicum Baker and
their cytotoxic cctivities. Chemistry and Biodiversity 6, 1751-1757.
163- Bastida, J., Codina, C., Peeters, P., Rubiralta, M., Orozco, M., Luque, F. J., Chhabra, S.
C., 1995. Alkaloids from Crinum kirkii. Phytochemistry 40, 1291-1293.
164- Suau, R., Gómez, A. I., Rico, R., 1990. Ismine and related alkaloids from Lapiedra
martinezii. Phytochemistry 29, 1710-1712.
165- Koorbanally, N., Mulholland, D. A., Crouch, N., 2000. Alkaloids and triterpenoids from
Ammocharis coranica (Amaryllidaceae). Phytochemistry 54, 93-97.
166- Ghosal, S., Saini, K. S., Frahm, A. W., 1983. Alkaloids of Crinum latifolium.
Phytochemistry 22, 2305-2309.
167- Mugabo, P., Philander, A., Raji, I., Dietrich, D., Green, I., 2014. Effects of hippadine on
the blood pressure and heart rate in male spontaneously hypertensive Wistar rats. Journal of
Ethnopharmacology 158, Part A, 123-131.
168- Ghosal, S., Rao, P. H., Jaiswal, D. K., Kumar, Y., Frahm, A. W., 1981. Alkaloids of
Crinum pratense. Phytochemistry 20, 2003-2007.
169- Kissling, J., Ioset, J.-R., Marston, A., Hostettmann, K., 2005. Bio-guided isolation of
cholinesterase inhibitors from the bulbs of Crinum powellii. Phytotherapy Research 19, 984-
987.
170- Feng, T., Wang, Y.-Y., Su, J., Li, Y., Cai, X.-H., Luo, X.-D., 2011. Amaryllidaceae
alkaloids from Lycoris radiata. Helvetica Chimica Acta 94, 178-183.
171- Almanza, G. R., Fernández, J. M., Wakori, E. W. T., Viladomat, F., Codina, C., Bastida,
J., 1996. Alkaloids from Narcissus cv. Salome. Phytochemistry 43, 1375-1378.
172- Pagliosa, L. B., Monteiro, S. C., Silva, K. B., de Andrade, J. P., Dutilh, J., Bastida, J.,
Cammarota, M., Zuanazzi, J. A. S., 2010. Effect of isoquinoline alkaloids from two
Hippeastrum species on in vitro acetylcholinesterase activity. Phytomedicine 17, 698-701.
233
173- Boit, H. G., Dopke, W., 1958. Masonine, a new amaryllidaceous alkaloid.
Naturwissenschaften 45, 85.
174- Kreh, M., Matusch, R., 1995. O-Methyloduline and N-demethylmasonine, alkaloids
from Narcissus pseudonarcissus. Phytochemistry 38, 1533-1535.
175- Pigni, N. B., Ríos-Ruiz, S., Martínez-Francés, V., Nair, J. J., Viladomat, F., Codina, C.,
Bastida, J., 2012. Alkaloids from Narcissus serotinus. Journal of Natural Products 75, 1643-
1647.
176- Machocho, A., Chhabra, S. C., Viladomat, F., Codina, C., Bastida, J., 1999. Alkaloids
from Ammocharis tinneana. Phytochemistry 51, 1185-1191.
177- Haughwitz, R. D., Jeffs, P. W., Wenkert, E., 1965. 358. Proton magnetic resonance
studies of some amaryllidaceae alkaloids of the 5,10b-ethanophenanthridine series and of
criwelline and tazettine. Journal of the Chemical Society (Resumed), 2001-2009.
178- Viladomat, F., Codina, C., Bastida, J., Mathee, S., Campbell, W. E., 1995. Further
alkaloids from Brunsvigia josephinae. Phytochemistry 40, 961-965.
179- Viladomat, F., Almanza, G. R., Codina, C., Bastida, J., Campbell, W. E., Mathee, S.,
1996. Alkaloids from Brunsvigia orientalis. Phytochemistry 43, 1379-1384.
180- Viladomat, F., Bastida, J., Codina, C., Campbell, W. E., Mathee, S., 1994. Alkaloids
from Brunsvigia josephinæ. Phytochemistry 35, 809-812.
181- Berkov, S., Romani, S., Herrera, M., Viladomat, F., Codina, C., Momekov, G., Ionkova,
I., Bastida, J., 2011. Antiproliferative alkaloids from Crinum zeylanicum. Phytotherapy
Research 25, 1686-1692.
182- Moodley, N., 2004. The chemical investigation of the Amaryllidaceae and
Hyacinthaceae. PhD thesis. School of Pure and Applied Chemistry, University of KwaZulu-
Natal, Durban, South Africa.
183- M. Llabrés, J., Viladomat, F., Bastida, J., Codina, C., Serrano, M., Rubiralta, M., Feliz,
M., 1986. Two alkaloids from Narcissus requienii. Phytochemistry 25, 1453-1459.
184- Abdallah, O. M., 1993. Narcisine, an alkaloid from Narcissus tazetta. Phytochemistry
34, 1447-1448.
185- Lamoral-Theys, D., Andolfi, A., Van Goietsenoven, G., Cimmino, A., Le Calvé, B.,
Wauthoz, N., Mégalizzi, V., Gras, T., Bruyère, C., Dubois, J., 2009. Lycorine, the main
phenanthridine Amaryllidaceae alkaloid, exhibits significant antitumor activity in cancer cells
that display resistance to proapoptotic stimuli: an investigation of structure− activity
relationship and mechanistic insight. Journal of medicinal chemistry 52, 6244-6256.
186- Mabberley, D. J., 2011. Meliaceae. In: Kubitzki, K. (Ed.), The families and genera of
vascular Plants. Flowering Plants. Eudicots Sapindales, Cucurbitales, Myrtaceae, vol. X.
Springer-Verlag Berlin Heidelberg, Germany.
187- Muellner, A. N., Samuel, R., Johnson, S. A., Cheek, M., Pennington, T. D., Chase, M.
W., 2003. Molecular phylogenetics of Meliaceae (Sapindales) based on nuclear and plastid
DNA sequences. American Journal of Botany 90, 471-480.
234
188- Gouvêa, C. F., Dornelas, M. C., Rodriguez, A. P. M., 2008. Floral development in the
tribe Cedreleae (Meliaceae, Sub-family Swietenioideae): Cedrela and Toona. Annals of
Botany 101, 39-48.
189- Edmonds, J. M., Staniforth, M., 1998. Plate 348. Toona sinensis. Curtis's Botanical
Magazine 15, 186-193.
190- Negi, J. S., Bisht, V., Bhandari, A. K., Bharti, M., Sundriyal, R., 2011. Chemical and
pharmacological aspects of Toona (Meliaceae). Research Journal of Phytochemistry 5, 14-21.
191- Dong, X.-J., Zhu, Y.-F., Bao, G.-H., Hu, F.-L., Qin, G.-W., 2013. New limonoids and a
dihydrobenzofuran norlignan from the roots of Toona sinensis. Molecules 18, 2840-2850.
192- Wang, K.-J., Yang, C.-R., Zhang, Y.-J., 2007. Phenolic antioxidants from Chinese toon
(fresh young leaves and shoots of Toona sinensis). Food Chemistry 101, 365-371.
193- Liao, J.-W., Hsu, C.-K., Wang, M.-F., Hsu, W.-M., Chan, Y.-C., 2006. Beneficial effect
of Toona sinensis Roemor on improving cognitive performance and brain degeneration in
senescence-accelerated mice. British Journal of Nutrition 96, 400-407.
194- Yu, B.-C., Yu, W.-J., Huang, C.-Y., Chen, Y.-H., Tsai, Y.-C., Chang, C.-C., Chang, S.-
J., 2012. Toona sinensis leaf aqueous extract improves the functions of sperm and testes via
regulating testicular proteins in rats under oxidative stress. Evidence-Based Complementary
and Alternative Medicine 2012, 10.
195- Yu, W.-J., Chang, C.-C., Kuo, T.-F., Tsai, T.-C., Chang, S.-J., 2012. Toona sinensis
Roem leaf extracts improve antioxidant activity in the liver of rats under oxidative stress.
Food and Chemical Toxicology 50, 1860-1865.
196- Hsieh, T.-J., Wang, J.-C., Hu, C.-Y., Li, C.-T., Kuo, C.-M., Hsieh, S.-L., 2008. Effects
of rutin from Toona sinensis on the immune and physiological responses of white shrimp
(Litopenaeus vannamei) under Vibrio alginolyticus challenge. Fish ans Shellfish Immunology
25, 581-588.
197- Hsiang, C.-Y., Hseu, Y.-C., Chang, Y.-C., Kumar, K. J. S., Ho, T.-Y., Yang, H.-L.,
2013. Toona sinensis and its major bioactive compound gallic acid inhibit LPS-induced
inflammation in nuclear factor-κB transgenic mice as evaluated by in vivo bioluminescence
imaging. Food Chemistry 136, 426-434.
198- Yang, S., Zhao, Q., Xiang, H., Liu, M., Zhang, Q., Xue, W., Song, B., Yang, S., 2013.
Antiproliferative activity and apoptosis-inducing mechanism of constituents from Toona
sinensis on human cancer cells. Cancer Cell International 13, 1-8.
199- Lin, Q., Li, M., Zhou, R., Liu, Y., 2012. Chemical composition and anti-bacterial
activity of essential oil from Cedrela sinensis (A. Juss.) Roem. seed. African Journal of
Biotechnology 11, 1789-1795.
200- Mitsui, K., Saito, H., Yamamura, R, Fukaya, H., Hitotsuyanagi, Y., Takeya, K., 2007.
Apotirucallane and tirucallane triterpenoids from Cedrela sinensis. Chemical and
Pharmaceutical Bulletin 55, 1442-1447.
201- Mitsui, K., Maejima, M., Saito, H., Fukaya, H., Hitotsuyanagi, Y., Takeya, K., 2005.
Triterpenoids from Cedrela sinensis. Tetrahedron 61, 10569-10582.
235
202- Hsieh, M.-M., Chen, C.-Y., Hsieh, S.-L., Hsieh, S.-F., Ben, L. P.-H., Li, C.-T., Hsieh,
T.-J., 2006. Separation of phenols from the leaves of Toona sinensis (Meliaceae) by capillary
electrophoresis. Journal of the Chinese Chemical Societ (Taipei, Taiwan) 53, 1203-1208.
203- Luo, X.-D., Wu, S.-H., Ma, Y.-B., Wu, D.-G., 2000. Limonoids and phytol derivatives
from Cedrela sinensis. Fitoterapia 71, 492-496.
204- Lee, I.-S., Kim, H.-J., Youn, U.-J., Chen, Q.-C., Kim, J.-P., Ha, D. T., Ngoc, T. M.,
Min, B.-S., Lee, S.-M., Jung, H.-J., Na, M.-K., Bae, K.-H., 2010. Dihydrobenzofuran
norlignans from the leaves of Cedrela sinensis A. Juss. Helvetica Chimica Acta 93, 272-276.
205- da Silva, M., Agostinho, S. M. M., de Paula, J. R., Neto, J. O., Castro-Gamboa, I.,
Rodrigues, E., Fernandes, J. B., Vieira, P. C., 1999. Chemistry of Toona ciliata and Cedrela
odorata graft (Meliaceae): chemosystematic and ecological significance. Pure and Applied
Chemistry 71, 1083-1087.
206- Majumder, P. L., Pal, A., 1985. 24-Methylene cycloartanyl p-hydroxycinnamate from
the orchid Cirrhopetalum elatum. Phytochemistry 24, 2120-2122.
207- Ferreira, J., Floriani, A. E. O., Filho, V. C., Monache, F. D., Yunes, R. A., Calixto, J. B.,
Santos, A. R. S., 2000. Antinociceptive properties of the methanolic extract and two
triterpenes isolated from Epidendrum mosenii stems (Orchidaceae). Life Sciences 66, 791-
802.
208- Asli Barla, H. B., Kultur, S., Oksuz, S., 2006. Secondary metabolites from Euphorbia
helioscopia and their vasodepressor activity. Turkish Journal of Chemistry 30, 325-332.
209- De, P. T., Urones, J. G., Marcos, I. S., Basabe, P., Cuadrado, M. S., Fernandez Moro,
R., 1987. Triterpenes from Euphorbia broteri. Phytochemistry 26, 1767-1776.
210- Takao Murakami, N. T., Satake, T., Saiki Y., Chen, C.-M., 1985. Chemical and
Chemotaxonomical studies on Filices. LVII.1 chemical studies on the constituent of Colysis
hemionitidea (Wall) Presl. and Microsorium fortunei (Moore) Ching. Yakugaku Zasshi 105,
655-658.
211- Ageta, H., Arai, Y., 1984. Fern constituents: Cycloartane triterpenoids and allied
compounds from Polypodium formosanum and P. niponicum. Phytochemistry 23, 2875-2884.
212- Wang, N., Jinhui; W., Jie; C., Xian, L., 2003. Chemical constituents of Pyrrosia
petiolosa (Christ) Ching. Journal of Shenyang Pharmaceutical University 20, 425-427.
213- Dewick, P. M., 2002. Medicinal natural products: a biosynthetic approach, 3nded. John
Wiley and Sons, Chichester, England.
214- Josinete S. Alves, J. C. M. d. C., Maisa O. Freire, Emidio V. Leit ˜ao da-Cunha,, Silva,
J. M. B.-F. a. M. S. d., 2000. Complete assignment of the 1H and 13C NMR spectra of four
triterpenes of the ursane, artane, lupane and friedelane groups. Magnetic Resonance in
Chemistry 38, 201-206.
215- Ohtsu, H., Tanaka, R., Michida, T., Shingu, T., Matsunaga, S., 1998. Tetracyclic
triterpenes and other constituents from the leaves and bark of Larix kaempferi.
Phytochemistry 49, 1761-1768.
236
216- Kikuchi, T., Akihisa, T., Tokuda, H., Ukiya, M., Watanabe, K., Nishino, H., 2007.
Cancer chemopreventive effects of cycloartane-type and related triterpenoids in in Vitro and
in Vivo models. Journal of Natural Products 70, 918-922.
217- Hong, Z.-L., Xiong, J., Wu, S.-B., Zhu, J.-J., Hong, J.-L., Zhao, Y., Xia, G., Hu, J.-F.,
2013. Tetracyclic triterpenoids and terpenylated coumarins from the bark of Ailanthus
altissima (“Tree of Heaven”). Phytochemistry 86, 159-167.
218- Chen, H., Ma, S.-G., Fang, Z.-F., Bai, J., Yu, S.-S., Chen, X.-G., Hou, Q., Yuan, S.-P.,
Chen, X., 2013. Tirucallane triterpenoids from the stems of Brucea mollis. Chemistry and
Biodiversity 10, 695-702.
219- McChesney, J., Dou, J., Sindelar, R., Goins, D. K., Walker, L., Rogers, R., 1997.
Tirucallane-type triterpenoids: nmr and X-ray diffraction analyses of 24-epi-piscidinol A and
piscidinol A. Journal of Chemical Crystallography 27, 283-290.
220- Vieira, I., de Aquino Azevedo, O., de Souza, J., Braz-Filho, R., dos Santos Gonçalves,
M., de Araújo, M., 2013. Hirtinone, a Novel cycloartane-type triterpene and other compounds
from Trichilia hirta L. (Meliaceae). Molecules 18, 2589-2597.
221- Xiao-po, Z., Yue-hu, P. E. I., Ming-sheng, L. I. U., Sheng-li, K., Jun-qing, Z., 2011.
Triterpenoids from the leaves of Cerbera manghas. (English). Natural Product Research and
Development 23, 443-445.
222- Toshihiro Akihisa, E. M., Wijeratne, K., Tokuda, H., Enjo, F., Toriumi, M., Kimura, Y.,
Koike, K., Nikaido, T., Tezuka, Y., Nishino, H., 2002. Eupha-7,9(11),24-trien-3β-ol
(“Antiquol C”) and other triterpenes from Euphorbia antiquorum Latex and their inhibitory
effects on Epstein−Barr virus activation. Journal of Natural Products 65, 158–162.
223- Sun, L., Li, D.-L., Tao, M.-H., Dan, F.-J., Zhang, W.-M., 2012. Two New
Sesquiterpenes from the Marine Fungus Eutypella scoparia FS26 from the South China Sea.
Helvetica Chimica Acta 95, 157-162.
224- Li, F., Li, K., Li, X., Wang, B., 2011. Chemical constituents of marine algal-derived
endophytic fungus Exophiala oligosperma EN-21. Chinese Journal of Oceanology and
Limnology 29, 63-67.
225- Xue, J., Xie, L., Liu, B.-R., Yu, L.-X., 2010. Triterpenoids from the fruits of Forsythia
suspensa. Chinese Journal of Natural Medicines 8, 414-418.
226- Choi, S., Choi, S., Lee, K., 2004. Pytochemical constituents of the aerial parts from
solidago virga-aurea var. gigantea. Archives of Pharmacal Research 27, 164-168.
227- Maurya, R., Srivastava, A., Shah, P., Siddiqi, M. I., Rajendran, S. M., Puri, A., Yadav,
P. P., 2012. β-Amyrin acetate and β-amyrin palmitate as antidyslipidemic agents from
Wrightia tomentosa leaves. Phytomedicine 19, 682-685.
228- Matsunaga, S., Tanaka, R., Akagi, M., 1988. Triterpenoids from Euphorbia maculata.
Phytochemistry 27, 535-537.
229- Santana, J. S., Sartorelli, P., Lago, J. H. G., Matsuo, A. L., 2012. Isolamento e avaliação
do potencial citotóxico de derivados fenólicos de Schinus terebinthifolius Raddi
(Anacardiaceae). Química Nova 35, 2245-2248.
237
230- Zapesochnaya, G. G., Kurkin, V. A., Braslavskii, V. B., Filatova, N. V., 2002. Phenolic
compounds of Salix acutifolia Bark. Chemistry of Natural Compounds 38, 314-318.
231- Baldé, A. M., Pieters, L. A., Gergely, A., Kolodziej, H., Claeys, M., Vlietinck, A. J.,
1991. A-type proanthocyanidins from stem-bark of Pavetta owariensis. Phytochemistry 30,
337-342.
232- Chang, Q., Wang, Z., Jia, J., 2014. Chemical constituents from the water extract of
Alpinia oxyphylla Miq. (I). Zhongguo Xiandai Yingyong Yaoxue 31, 549-551.
233- Lakornwong, W., Kanokmedhakul, K., Kanokmedhakul, S., 2014. Chemical
constituents from the roots of Leea thorelii Gagnep. Nat. Prod. Res. 28, 1015-1017.
234- Nonaka, G.-I., Miwa, N., Nishioka, I., 1982. Stilbene glycoside gallates and
proanthocyanidins from Polygonum multiflorum. Phytochemistry 21, 429-432.
235- Ito, A., Yasumoto, K., Kasai, R., Yamasaki, K., 1994. A sterol with an unusual side
chain from Anoectochilus koshunensis. Phytochemistry 36, 1465-1467.
236- Şabudak, T., Tareq Hassan Khan, M., Iqbal Choudhary, M., Oksuz, S., 2006. Potent
tyrosinase inhibitors from Trifolium balansae. Natural Product Research 20, 665-670.
237- Wei, X., Rodríguez, A. D., Wang, Y., Franzblau, S. G., 2008. Synthesis and in vitro
biological evaluation of ring B abeo-sterols as novel inhibitors of Mycobacterium
tuberculosis. Bioorganic & Medicinal Chemistry Letters 18, 5448-5450.
238- Prachayasittikul, S., Suphapong, S., Worachartcheewan, A., Lawung, R., Ruchirawat,
S., Prachayasittikul, V., 2009. Bioactive metabolites from Spilanthes acmella Murr.
Molecules 14, 850-867.
239- Kontiza, I., Abatis, D., Malakate, K., Vagias, C., Roussis, V., 2006. 3-Keto steroids
from the marine organisms Dendrophyllia cornigera and Cymodocea nodosa. Steroids 71,
177-181.
240- Hamburger, M., Hostettmann, K., 1991. 7. Bioactivity in plants: the link between
phytochemistry and medicine. Phytochemistry 30, 3864-3874.
241- World Health, Organisation., 1999. WHO Monographs on Selected Medicinal Plants,
Volume 1.
242- Rode, H., 2008. Apoptosis, cytotoxicity and cell proliferation. 4thed. Roche Diagnostics
GmbH, Roche Applied Science, Germany.
243- West, D., 2012. The discovery and characterization of anticancer procaspase activating
compounds. PhD thesis. University of Illinois at Urbana-Champaign.
244- Ekwall, B., Silano, V., Paganuzzi-Stammati, A., Zucco, F., 1990. Toxicity tests with
mammalian cell cultures. Short-term toxicity tests for non-genotoxic effects. John Wiley and
Sons, Inc., New York.
245- Repetto, G., del Peso, A., Zurita, J. L., 2008. Neutral red uptake assay for the estimation
of cell viability/cytotoxicity. Nature protocols 3, 1125-1131.
238
246- Chiba, K., Kawakami, K., Tohyama, K., 1998. Simultaneous evaluation of cell viability
by neutral red, MTT and crystal violet staining assays of the same cells. Toxicology in Vitro
12, 251-258.
247- ANIARA, Neutral red applications, 2007. Accessed via
http://www.aniara.com/pdf/INS-AKRN96.pdf. Retrived 01-06-2016.
248- Artymovich, K., Appledorn, D. M., 2015. A multiplexed method for kinetic
measurements of apoptosis and proliferation using live-content imaging. In: Mor, G., Alvero,
B. A. (Eds.), apoptosis and cancer: methods and protocols. Springer New York, New York,
NY.
249- Artymovich, K., Nelson, T., Dale, T., Alcantara, S., Endsley, E., Appledorn, D. M.,
Trezise, D., Groppi, V., CellPlayer™ 96-well kinetic Caspase-3/7 apoptosis assay.
Application Note 1000, 2.
250- Artymovich, K., Patel, K., Szybut, C., Garay, P. M., O'Callaghan, T., Dale, T., Trezise,
D., Appledorn, D. M., CellPlayerTM Kinetic Proliferation Assay. Accessed via
http://www.essenbioscience.com/media/uploads/files/8000-0213-A00_-
_CellPlayer_Kinetic_Proliferation_Assay_Application_Note.pdf. Retrived 15-06-2016.
251- Lindholm, P., Gullbo, J., Claeson, P., Göransson, U., Johansson, S., Backlund, A.,
Larsson, R., Bohlin, L., 2002. Selective cytotoxicity evaluation in anticancer drug screening
of fractionated plant extracts. Journal of biomolecular screening 7, 333-340.
252- Suggitt, M., Bibby, M. C., 2005. 50 years of preclinical anticancer drug screening:
empirical to target-driven approaches. Clinical Cancer Research 11, 971-981.
253- Boyd, M. R., 1997. The NCI in vitro anticancer drug discovery screen. Anticancer Drug
Development Guide. Springer.
254- National cancer institute, Developmental Therapeutics Program (DTP). Accessed via
https://dtp.cancer.gov/discovery_development/nci-60/default.htm. Retrieved 01-06-2016