Embed Size (px)
Citation preview
- 1 -
Department for Farm Animals and Veterinary Public Health
University of Veterinary Medicine Vienna
Institute of Animal Nutrition and Functional Plant Compounds
“Functional Botanical Substances”
(Head: Prof. Dr. Johannes Novak)
Phytochemical investigation of an antimalarial plant
Zanthoxylum zanthoxyloides
Diploma thesis
University of Veterinary Medicine Vienna
submitted by
Johannes Michael Klinger
Vienna, January 2017
- 2 -
Index1. Introduction: ............................................................................................................................. 6
1.1. Introduction and Research Question ................................................................................... 6
1.2. Malaria .............................................................................................................................. 9
1.2.1. The disease ...................................................................................................................... 9
1.2.2. The Plasmodium life cycle ............................................................................................. 10
1.3. Zanthoxylum zanthoxyloides ................................................................................................ 13
1.3.1. Origins and family tree ............................................................................................. 13
1.3.2. Botanic description .................................................................................................. 15
1.3.3.Common usage of Zanthoxylum zanthoxyloides in traditional medicine and cultural life . 19
1.3.2.1. Oral Application ................................................................................................... 19
1.3.2.2. External Application ............................................................................................. 21
1.3.2.3. Cultural Aspects ................................................................................................... 22
1.3.3. Selected phytochemical analysis done in the past research papers ........................... 23
2. Material and Methods ............................................................................................................. 30
2.1. The Samples .................................................................................................................... 30
2.2. General Preparation ......................................................................................................... 30
2.3. Spectrophotometric Analysis ............................................................................................ 30
2.3.1. Total Phenolics ......................................................................................................... 30
2.3.2. Antioxidant Activity.................................................................................................. 32
2.3.3. Fe 3+-Reduction ....................................................................................................... 33
2.4. Chromatographic Analysis ............................................................................................... 35
2.4.1. Thin Layer Chromatography (TLC) ............................................................................ 35
2.4.2. High-performance liquid Chromatography (HPLC) .................................................... 36
2.5. Statistical Evaluation: ........................................................................................................... 37
3. Results .................................................................................................................................... 38
3.1. Results of the photometric analysis .................................................................................. 38
3.1.1. Total Phenolic (mg caffeic acid/g DW)..................................................................... 38
3.1.2. Fe3+-Reduction (mg Trolox/g DW) ........................................................................... 40
3.1.3. Activity DPPH (mg Trolox/g DW) ........................................................................... 41

- 3 -
3.2. Results from the chromatographic analysis ....................................................................... 43
3.2.1. TLC (Thin Layer Chromatography) .......................................................................... 43
3.2.2. HPLC (High Performance Liquid Chromatography) .................................................... 47
3.3. Results in terms of comparability amongst the extract solutions ........................................ 48
3.3.1. Root samples ................................................................................................................. 49
3.3.1.1. HPLC in root samples (High Performance Liquid Chromatography) ............................ 49
3.3.1.1.1. Fagaramide .............................................................................................................. 49
3.3.1.1.2. Sesamin ................................................................................................................... 50
3.3.1.2. .................................................................................................................................... 52
Results from the Photometric Analysis..................................................................................... 52
3.3.1.2.1. Total Phenolics ..................................................................................................... 53
3.3.1.2.2. DPPH .................................................................................................................. 54
3.3.1.2.3. FRAP ................................................................................................................... 55
3.3.2. Leaf samples ............................................................................................................ 56
3.3.2.1. Total phenolics ..................................................................................................... 56
3.3.2.2. DPPH .................................................................................................................. 57
3.3.2.3. .................................................................................................................................... 58
Ferric reduction (FRAP) .......................................................................................................... 58
3.4. Results in terms of comparability amongst the origin of the samples ...................................... 59
3.4.1. HPLC Results .................................................................................................................. 59
3.4.1.1. Fagaramide ................................................................................................................. 59
3.4.1.2. .................................................................................................................................... 60
Sesamin .................................................................................................................................. 60
3.4.2. Photometric Analysis ..................................................................................................... 62
3.4.2.1.Total Phenolic .............................................................................................................. 62
3.4.2.2..................................................................................................................................... 64
DPPH....................................................................................................................................... 64
3.4.2.3. FRAP ........................................................................................................................... 66

- 4 -
4. Discussion ............................................................................................................................... 68
4.1. A first glance ................................................................................................................... 68
4.2. Mobile phase for the TLC (“the running solution dilemma”) ............................................. 68
4.3. Comparison of Root and leaf samples ............................................................................... 69
4.4. Compounds in terms of origin .......................................................................................... 70
4.4.1. Photometric Analysis ............................................................................................... 70
4.4.2. Chromatographic Analysis ............................................................................................. 71
5. Abstracts ................................................................................................................................. 73
5.1. In English ........................................................................................................................ 73
5.2. In German ....................................................................................................................... 74
6. Appendix ................................................................................................................................. 76
6.1. References: ...................................................................................................................... 76
6.2. Graphic footage: ................................................................................................................... 80
6.3. Selected results of the photometric analysis ...................................................................... 81
6.4. HPLC data: ..................................................................................................................... 84
7. Special Thanks: ....................................................................................................................... 86

- 5 -
Dedicated To
My Loving Parents,
Who Supported Me My Entire Life
Thank You

6
1. Introduction:
1.1. Introduction and Research Question
In 1640 Agostino Salumbrino1 introduced in Europe to the grounded bark of Cinchona
calisaya from South America, blended it with sweetened water and produced what was
later named “tonic water”. Cinchona calisaya is the botanical name of the chinchona tree;
its origins are the highlands of northern South America. With this composition he
subsequently cured fever symptoms caused by malaria-related pathogens. This highly
infectious disease was endemic in the city of Rome and in its surrounding swamps and
marshes in the middle of the 17th century. The word Malaria derives from the Latin words
“mala” and “aria” which literally translates to “bad” and “air”. This Name was chosen
because of the horrible air quality in and around the eternal city during the endemic period.
Though it worked very well on numerous diseased victims, the European pharmacists’
society did not avail them of this opportunity to incorporate this new remedy. Finally the
English Pharmacist Robert Talbot (1642 – 1681) perceived the potential of this new plant.
Furthermore he even cured the English King Charles II (1630 – 1685) and the French King
Louis XIV (1638 – 1715) from a set of symptoms that were also caused by a mosquito-
borne infection, which was almost certainly a malaria infection. Especially due to the case
of the French king Louis XIV the European pharmacists acknowledged the root bark from
Cinchona calisaya as the potential drug that it was and still is. Additionally the famous
English doctor Thomas Sydenham (1624 - 1689) endorsed the positive effects on the
human body, which was finally the inception of a striking success for the later named
quinine in pharmacology use during the following two and a half centuries. In 1820
quinine was first isolated and named by the French scientists Pierre Joseph Pelletier and
Joseph Bienaimé Caventou (Meyer 2012, Wikipedia 2014).
To this day the blood parasite Plasmodium spp, that causes malaria symptoms, has not
completely grown resistant to the essence of Cinchona Calisaya although it has been in use
for nearly 400 years.
1 Agostino Salumbrino (1561-1642) was a Jesuit pharmacist, how lived in Lima, Peru and worked a lot withlocal medical plants

7
Furthermore it is however noteworthy that some resistances have been observed. But
compared to the evolvement of growing resistance in the field of bacteriology this
phenomenon is quite astounding. Furthermore this particular plant and its secondary
product is not the only one in use. Many different species have been in use for decades.
They just have not been given enough attention. Luckily this has changed in last couple
of decades and there are numerous international programs to determine various plant
species that hold the potential to not only treat but maybe even cure malaria. Through many
new diseases such as the virus infection ebola, malaria has not been the center of
attention in the research world, even though it still claims countless victims every day
across the world. In the international research project MEAMP financed by the Austrian
research program APPEAR, which is dedicated to contribute to fight this disease, five
different local medicinal plants have been selected that may have this potential to be a
strong weapon against this disease, which is still present in everyday life in many countries
throughout the world, especially in third world countries. The selected plants were chosen
according to their use in traditional medicine against Malaria in Burkina Faso. The
phytochemical investigation and following isolation of compounds may truly draw more
attention to this particularly promising field of research.
Figure 1 Malaria endemic areas (www.nathnac.org)
8
In detail, the primary materials were collected from the wild as reference and target
samples purchased from the market. This added up to 25 samples of Z. zanthoxyloides in
total, two leaf samples which were both acquired at the market. The rest were root
samples. The use of reference is especially important for roots. Due to the fact that the
precise distinction between roots in general can be very difficult, as there are few
morphological characteristics that would make an identification possible. So, in order to
confirm this, a specific pattern of a chromatographic analysis from a reference sample can
be compared to a market sample and provide the necessary information and confirmation.

9
1.2.Malaria
1.2.1. The disease
Given how long we have been confronted with this disease we are just at the very
beginning of fighting it in a more or less profound way. But what makes this malady so
dangerous and tenacious, that humanity has not been able to contain it more effectively?
To understand the disease malaria, the life cycle and the pathogen itself must be carefully
examined.
The pathogens leading to malaria are members of the genusPlasmodium(Plasmodiidae).
This family is a member of the KingdomChromalveolata, SuperphylumAlveolata,
PhylumApicomplexa, ClassAconoidasidaand the order ofHaemosporida(Lucius and
Loos-Frank, 2008 ).Haemosporidaare blood parasites with a host shift, which means that
they need the intestinal system of a blood-sucking insect within their development to
sexually procreate. The various species of pathogens result in distinct forms of human
malaria. The most important are (Lucius and Loos-Frank 2008 ):
• Plasmodium falciparum, which leads to malaria tropica,
• Plasmodium vivax, which leads to malaria tertiana,
• Plasmodium ovale, which leads to malaria tertiana,
• Plasmodium malariae, which leads to malaria quartana
• Plasmodium knowlesi
The most common infection is malaria tropica with almost 75 %, followed by malaria
tertiana with about 20 % and malaria quartana with about 5 %. The classic symptoms are
fever attack every other day, which can be ascribed with the accumulation of various
metabolic products produced by the host. If the fever peak manifests every 3 days it is
most likely to be caused byPlasmodium vivax.In analogyPlasmodium malariaewill
manifest with ague fever every 4 days (Lucius and Loos-Frank 2008, Mehlhorn 2012).

10
1.2.2. The Plasmodium life cycle
With the sting from infested Anopheles maculipennis the Plasmodium parasite is
introduced into the system. Plasmodium is now in its transportation form: sporozoite. This
sporozoite will then attach to a liver or endothelial cell and penetrate it. In these cells it will
grow and go through multiple cell divisions. This phase is called schizogony or
endohistocytic phase. The following cells – merozoites – will then erupt from the cell in
which they have proliferated and reenter the blood system. They are now capable of
attacking and penetrating erythrocytes. Apparently they prefer immature red blood cells.
Therefore, they attack not more than 2 % of the erythrocytes. Subsequently they will attach
and enter a red blood cell and start evolving into an amoeboid cell in order to produce yet
again more merozoites. These afflicted cells can be detected easily, because they are much
bigger than the other red blood cells and have the characteristic “Schüffner’s stipplings”
within them. This is a residual body within erythrocytes that correlate with a Plasmodium
infection. Subsequently these newly produced merozoites will then destroy the erythrocyte
in which they have underwent their development. This leads to residual body in the red
blood cells that used to be hemoglobin, though its original molecular structure was
damaged and destroyed. If all the parasites originate in one infection the cycle of
schizogony will proceed in sync (Lucius and Loos-Frank 2008).
The overflow of metabolism products in the blood will eventually lead to spike of fever
every three to four days depending on the pathogen. The amoeboid cell does not only
produce merozoites. Some also produce micro- and macrogamonts which circulate the
blood waiting for their departure which will verifiably occur when the Anopheles
maculipennis strikes again. By sucking the blood this mosquito will reintroduce the
gamont back to its original gastrointestinal system. On the one hand the one microgamont
will produce eight microgametes through multiple cell division, while the one
macrogamete will mature into one macrogamete. This phase in the cycle is called
gametogony and it will only happen in the middle section of the mosquito’s intestine. This
is the place of fertilization. Further on the newly formed zygote will elongate and penetrate
the intestinal lumen and the endothelial cells as an Oocyte. After passing the intestinal
endothelial layer it will ensconce itself in the muscle layer of the gut.

11
Encystation, meiosis and multiple cell division will then prolong into a poly-nuclear mass
of plasma. From this construct many little sporozoites will pinch of and take their journey
through the vesicular system. There they will eventually reach the mosquitos’ salivary
gland, where it will find its last resort within Anopheles maculipennis. Here they await the
next sting victim to restart the cycle and evolve into their next stage inside the human body
(Lucius and Loos-Frank 1997& 2008, Mehlhorn 2012)
Figure 2 Life cycle of P.falciparum (Lucius & Loos-Frank, 1997)
Understanding this cycle there are necessary precautions to be made, even if a patient
already suffers from this mosquito-borne infectious disease. For instance, if a patient is
infected he still needs to make certain required arrangements to break the cycle. Otherwise

12
the number of mosquitos, who carry the Plasmodium parasite, will steadily increase.
Consequently, this is one of the main complications when dealing with malaria patients.
The big problem at hand is that after being stung and infected the patient is more likely to
be careless during the time of day when the Anopheles female is out searching for a victim.
This crucial mentioned time period is usually around nightfall, when the previously
infected patient is possibly less anxious to prevent a sting by the mosquito. Unfortunately
this crucially benefits the pathogen and may engender severe consequences for the
uninfected.

13
1.3. Zanthoxylum zanthoxyloides
1.3.1. Origins and family tree
Zanthoxylum zanthoxyloides (Lam.) Zepern. & Timler, Rutaceae, is a member of the
subfamily Toddalioideae of the Rutaceae family. A common synonym within this is
Fagara spp.. Z. zanthoxyloides can be found in West Africa particularly in the south of
the Sahara Desert from Senegal in the west to Cameroon in the east. The samples chosen
for this study originate in Burkina Faso. In this particular country and in the surrounding
Z. zanthoxyloides (homotypic synonym: Fagara zanthoxyloides Lam.; heterotopic
synonym: Zanthoxylum senegalense DC, Fagara senegalesis (DC.) A. Chev., Fagara
zanthoxyloides Lam., Zanthoxylum polygamum Schum. et Thonn.) is used in the
traditional medicine to cure various diseases and maladies.
Figure 3: A Z. zanthoxyloides tree in the western region of Burkina Faso

14
In addition to the different Zanthoxylum species they are applied in numerous sectors of
everyday life aside the pharmaceutical use. For instance Zanthoxylum macrophylla or
Fagara macrophylla - which are evidently the same (Waterman 1975) - is principally
used to poison the end of hunting tools such as spears and arrows. In East Africa, more
precisely in Tanzania Zanthoxylum chalybeum is applied for similar use.
Conclusively the use of Zanthoxylum may occur contradictory considering the toxicity
of this plant (Ngono Ngane et al. 2008), but bearing in mind Paracelsus’ “dosis sola
venenum facit” the difference might not be as conflicting as it primary appears.

15
1.3.2. Botanic description
Zanthoxylum is either a small tree or a shrub often elongated into a hedge. The maximal
height differs from 4 m up to almost 11 m. The often very dense and bushy crown can
hardly be penetrated. It is often planted around stables and houses and therefore utilized to
work as a fence. The trunk of the tree or shrub is often quite short. The bark surrounding
the tree differs in color, depending on the amount of sun exposure and the different
nutrients found in the ambient soil. The spectrum of color varies from brown to yellow to
grey or even to red. Additionally the outer layer features fine vertical rifts with occasional
wood-based protuberances that are prickles (Figure 6). The cut surface appears yellow-
colored and orange-spotted underneath, including a certain aromatic smell. The foliage
alternately
Figure 4: Leafs of a Z.zantoxyloides tree, with the characteristic elliptic shape and thefruit

16
arranged and with the opposite leaflets here and there. The main leaves are glabrous and
placed on a petiole with a length of 2-5 cm. The lamina can reach a length up to 20 cm but
the average lies at about 13 cm. It also features ventrally buckled thorns on the side.
Moreover, it is spiny on its ventral surface. The leaflets are quite smaller with a lamina
height of 5-10 cm. It is furthermore attached to the branch by a petiole with about 5 mm of
length. Base and apex appear obtuse or rounded. The general shape of the leaves can be
considered elliptical as can be observed in Figure 4. The lamina is generally veined with
eight to fourteen sets of lateral vesicles, which are barely noticeable. They eventually meet
near the margin. The glandular vessels on the surface of the leaves hold the essential oils of
the plant. The odors within these containers can be freed if the compartments are
compromised. If penetrated the volatile matter will emerge of which the smell recalls
Figure 5: The trunk of the Zanthoxylum. zanthoxyloides tree

17
lemon or pepper. This appears to be logical since they are both members of the Rutaceae
and the smell of lemon is often considered to be typical for that plant family. The panicle is
often axillary and can reach a length of fifteen centimeters. The flower is unisexual,
pentamerous and colored green or sometimes even white, whilst the corolla remains
marginally open. The prior ovaries are within the female blossom and are regularly single-
celled. The brown-colored fruit of this sex is an ovoid follicle with a radius of about two to
three millimeters. Additionally glandular vessels can be further found on the fruit. The
seeds within the green or red colored fruit are dark brown or even black and very
persistent, whilst stored safely within the fruit. The average weight of the seeds differs
(from 15.9 g – 18.1 g / 1000 seeds) (Schmelzer & Gurib-Fakim 2004). The male flowers
with the stamen are a little excreted, which is very typical for the male sex in this botanic
family.
Figure 6: The stem of Z. zanthoxyloides with the typical wooden-based protuberances
18
Zanthoxylum can bloom one or even two times a year. It usually flowers within the first
half of the dry period. Additionally, it can also bloom during a rainy period. The main
habitat of Zanthoxylum is in West Africa from Senegal in the west to Nigeria in the east. It
does not grow in always dry parts of western Africa such as savanna regions. Throughout
its natural habitat it shows gregarious behavior. It can be mainly found in fringing forests.
Although due its hydrophilic attitude it additionally indwells areas that are in proximity to
rivers and damp territories. Furthermore, its ability to withstand termite attacks can also be
found in vicinity to their nests. This again makes it a very useful material whilst doing
construction work (Arbonnier 2004 & Adesina 2005).

19
1.3.3.Common usage of Zanthoxylum zanthoxyloides in traditional medicine and culturallife
One of the main usages of Zanthoxylum in traditional African medicine lies on its
antiseptic features. Nevertheless, various applications are considered to vigorously
oppress pain and therefore have an analgesic effect. In addition, its impact on the
sudoriparous glands is also mentionable, causing perspiration (Parmpeh & Mensah-
Attipoe 2008, Queiros et al. 2006). The drugs made from the root and the seeds of the
plant should always remember and consider this as a mentionable side effect.
1.3.2.1. Oral Application
In the countries mentioned above Z. is used to treat various kinds of diseases. Mainly the
leaves, roots and the stem bark are used in different forms of extracts. For instance, roots
and stem mark are used to produce macerations, decoctions and infusions. They are then
applied to people tormented by numerous maladies and their symptoms such as malaria,
general body weakness, paralysis, tuberculosis, edema and all sorts of fevers (Meyer
2012, Ogwal-Okeng et al. 2003). It is worth mentioning and rather curious that it is
also applied to treat and cure sickle cell anemia. Because of its popular use as medicinal
plant the stem bark and roots of the Z. are even exported from some West African countries
such as Burkina Faso, Ghana, and Cote d’Ivoire. Furthermore, an infusion can be prepared
to treat gastrointestinal problems such as dysentery and colic. In addition, it can also be
brought into action if the patient is infected with intestinal worms. Prominent examples
include hookworms. Additionally, it is also used against infection with Schistosoma
species. Subsequently Z. concoctions are intended to ease pain during child birth. It can
also be used to treat gonorrhea and urethritis. Moreover, it is a common treatment against
migraines and other various forms of neuralgia (Neuwinger 1997).
20
It is widely documented that roots and stem bark of Z. have a numbing effect on skin and
mucosa. Therefore, these parts of the plant are often in use to treat various forms of
toothache. Given that common usage it is often colloquially called “Toothache-tree”
among the numerous tribes and villages in West African countries. Furthermore, the
description “Toothbrush-tree” is also commonly used in various cases. It is also
mentionable that young roots of the tree seem to have a more promising effect on gum
infections or even just sore gums. Subsequently a decoction of stem bark or roots also
serves as a mouthwash and is even described to ease sore throats or an inflamed larynx.
This reinforces the analgesic and antiseptic character of this species. Additionally, it is
worth mentioning that the roots and young shoots even serve as a regular chewing device,
without any background of a medical condition. It is just a way of strengthening the teeth
and stimulating salivary. Because even though human salivary is full of various pathogens
and inflammatory substances it also host a selection of antiseptic and anti-inflammatory
substances, such as antibodies, immunoglobulins and mucins. Subsequently this again helps
the body to overcome small infections and minor damage in the mucosa of the oral region
(Schmid 2005).
In addition, it might even help to ease minor forms of digestive disturbances. It is also
worth mentioning that minor conditions of nausea are treatable with this sprout.
Hereinafter it fills the place of the common chewing-gum used in western civilization.
(Iwu 2014, Adesina 2005)

21
1.3.2.2. External Application
Aside from the area of internal application Z. preparations are also used in external
administration. For this application the roots are often chopped or even pulverized and
blended with water resulting in a mass of muddy consistency which is then applied on the
problematic area. This remedy finds application in cases of swellings or snake bites.
Furthermore, it is also commonly used in the treatment of ulcers or abscesses. In addition
many healers of traditional African medicine also treat hemorrhoids, leprosy wounds and
various superficial symptoms of syphilis, although this medical disease is quite severe and
the plant species might only reduce pain but not vanquish the virus (Neuwinger 1997). In
case of hernia induced pains Z. also serves as a medication. It can also be used to ease
the pain of rheumatic and arthritic pain. In Burkina Faso and in Cote d’Ivoire pulped stem
bark can be in use to treat eye infections or even conjunctivitis. Furthermore, it is also in
use against whooping cough. Whooping cough is a bacterial infection with Bordetella
pertussis that mainly infects infants (Queros et al. 2006).
Many other usages are also likely and may even be acknowledged, due to the species
analgesic and antiseptic features. Furthermore, this will yet again be applicable in many
different cases of general inflammation. Positive consequential effects will subsequently be
promising against both external and former mentioned internal maladies, making this a
more encouraging research field.

22
1.3.2.3. Cultural Aspects
The Z. plant is often used in West Africa as a hedge. Because of its density is impenetrable.
The bush itself is often browsed by all sorts of animals such as goats and sheep. Moreover
the stem is often used in religious ceremonies. Because of its high concentration of resin
especially its young twigs and branches are particularly favored. During fire a ceremony
thinned dry twigs and spines are tossed into the flames to create strong and thick smoke.
This fume then gives off a strong scent. Subsequently, the leaves are often found in the
traditional cuisine in West African countries. They smell of citrus fruits and provide this
taste for the food. The cinnamon flavored seeds are equally used to season food.
Furthermore, the seeds are also used as jewelry. Many women make necklaces out of the
little black seeds. Not only is the crown of the plant dense, also the wood of the tree has a
high density. Therefore – provided that the plant itself is big and tall enough – the bole is
commonly used to make poles and other primary structures in constructing work. Because
of its given nature it is very termite resistant. This makes it the ideal base material for
building houses and stables. Due to its general density and its visual cover it is also often
planted used within the local religious customs. Thereinafter it is common use to shield
houses and stables from evil spirits (Ngane et al. 2000, Neuwinger 1997).
But these examples are just a few from the various magical, religious and traditional
usages that Z. provides in West African cultures.

23
1.3.3. Selected phytochemical analysis done in the past research papers
In various studies, done by laboratories in France, Cameroon, Senegal, Nigeria, Burkina
Faso and Benin different Z. species were analysed. For instance in one of the research
programs two Cameroonian Rutaceae (Z. leprieuril and Z. zanthoxyloides) were
investigated. Conclusively it was shown that a 90% EtOH extract of these plants was
able to inhibit the growth of Candida albicans, Cryptococcus neoformans and seven
more filamentous fungi. The minimal inhibitory concentration was established from0.5
up to 1 mg/ml for root concoctions. As for those deriving from the stem of the plant the
necessary concentration intervals were identified from 0.125 up to 1 mg/ml (Ngane et al.
2000). The essential oil of this Cameroonian Z. additionally had monoterpenes as their
main components in following concentration: α-pinene (38.2%), trans-β-ocimene (5.4%),
citronellol (3.3%), sabinene (3.2%), myrcene (3.1%), limonene (3.0%), citronellyl acetate
(3.0%), α-terpinolene (2.7%), α-phellandrene (2.6%), geraniol (1.9%), terpinen-4-ol
(1.5%), p-cymene (1.2%), methyl citronellate (1.2%) and β-pinene (1.2%) (Ngane et al.
2000). Another sample analyzed in that particular study showed very different
concentrations regarding the main components as the subsequent values illustrate: β-
citronellol (18.1%), geraniol (16.2%), 2,6-dimethyl-2,6-octadiene (9.3%), geranyl acetate
(5.9%), isopulegol (5.4%), D-limonene (4.8%), β-citronellal (4.7%) and the sesquiterpene
manoyl oxide (5.5%) (Ngane et al. 2000). Due to research work like this it is now
considered scientific proof that Z.zantoxyloides extract does have an inhibitory effect on
various microorganisms.
In a research paper done by a team of scientists from the Laboratoire de Chimie Organique
Physique from the University of Montpellier Z. zantoxyloides leaves and fruits were
phytochemically analyzed. The result regarding the composition of the plants leaves
showed that the leaf oil composition presented only monoterpene hydrocarbons in a
concentration of 98.2%, among them α-pinene (26.5%), myrcene (30.0%) and (E)-β-
ocimene (31.9%) were the most predominant (Menut et al. 2000). Additionally, the
fruits were also analyzed and the results show that the complexity of the fruit oil
composition was considerable. The major compound were monoterpenoids with 85.5 %

24
also showing a lot of oxygen activity. The share of these compounds laid at 30.9 %,
whilst linalool and geranial presented the largest share within this group. Interestingly
Figure 7: Structure of some isolated bioactive compounds found in Zanthoxylum(NEGI et al. 2011)
(E)-β-ocimene w a s both high in fruit oil with 41.5 % as well as leaf oil with 31.9 %
(Menut et al 2000). Since the country of Benin evidently adjoins Burkina Faso in the
north-west it is most likely that the phytochemical compositions are roughly similar and
therefore comparable, as the botanical similarities are not affected by human frontiers.

25
Nevertheless it stands to reason to assume deviating results when Zanthoxylum
zantoxyloides species are collected in different countries.

26
Furthermore, the root and stem bark of Z. zantoxyloides were analyzed as it can also often
be found in the traditional medicine throughout West Africa. In these studies it was proven
that the lignan sesamine is a component in both parts, whereas the root bark also contains
seasmine’s epimer asarinin.
Figure 8 Sesamin (C20H18O6)
Further on various alkaloids were identified in stem and root bark such as aporphine
alkaloids. Moreover, the stem bark contains many coumarins such as xanthotoxin,
scopoletin, imperatorin, scoparone, bergapten, umbelliferone, mermesin and pimpinellin
which here in after featured antifungal characteristics. In the root the aporphines
tembetarine and magnoflorine were identified as well as N-methyl-corydine and
berberine. In addition, a group of furoquinoline and benzophenanthridine alkaloids
were also identified within these parts of the species. To be more precisely the
benzophenanthridines actually found in the stem of the tree were chelerythrine and
fagaronine. Additionally, berberine and cheleterythrine both possess antimicrobial
activities, which were reasonably encouraging. Fagaronine proved to be a useful
medicine against leukemic diseases. The discovery of the auspicious alkaloid and its
ability to attack either P-388 or L-1210 leukemic cells is considered a great scientific
achievement. Additionally, the root bark covered an even wider spectrum of
benzophenanthridine alkaloids. In addition to the two also detected in the stem two
more where eventually

27
found. These are oxychelerythrine and dihydroavicine and they are only common in the
root not the stem bark. Furthermore, the furoquinoline alkaloids in the root were identified
as 8-methoxydictamine and skimmianine.
Several different groups of amides were further isolated from root bark extract, such as
aliphatic and aromatic amides. The aromatic amides are mainly fagaramide,
piperlonguminine, rubemamin, arnottianamide and N-isopentyl-cinnamamide. One of the
most interesting amides found in the Z.’ root bark is pellitorine. Pellitorine was earlier
described by Bowden and Ross in 1963 and even before that by Paris and Magnon in 1947.
Figure 9 Fagaramide (C14H17NO3)
The main quality of pellitorine is its local anesthetic character, for which the root bark
extracts are used in traditional medicine. . This quite unique ingredient can interestingly
enough even be isolated in the fruits and the stem bark. Due to the isolation of known
anti-inflammatory and analgesic compounds, such as pellitorine, the positive effect on
various maladies is yet again ensured. Moreover pellitorine showed promising
antibacterial and anti-sickling effects in in vitro studies. Unfortunately, it is also very
expensive, which was the main reason it was not considered a reference in this particular
thesis. Nevertheless it is indeed a promising compound, especially considering its impact
and potential as pharmacological agent.

28
The phenolic acids identified in the root bark are the vanillic acid and the hydroxymethyl-
benzoic acid. Furthermore, a series of benzoic acids were detected and isolated such as the
parahydroxy-, parafluoro- and 2-hydroxy-benzoic acid. Additionally, the divanilloylquinic
acids burkinabin A, B, and C where found among the spectrum of discovered acids in
crude root bark extracts.
Figure 10: Burkinabin A, B, C (Ouattara et al. 2004)
In conclusion it can be acknowledged that crude bark MeOH or aqueous extract can
evidently be administered to cure various maladies caused by general or local
inflammation. Subsequently its usage against a series of pathogens was also well
established (Prempeh & Mensah-Attipoe 2009, Prempeh & Mensah-Attipoe 2008, Queiros
et al. 2006, Adesina 2005, Ngassoum 2003, Ossoba Et Al. 1989).
Although the positive and encouraging features of various concoctions are reasonably
promising the shown toxicity in numerous animal trials must not be left out of
consideration.

29
The LD50 of the methanolic extract was found at 5.1 g/kg body weight in mice within a
confidence limit of 95 %. Clinically
the animals presented certain neurological symptoms. These cerebral irritations often
occurred just before the mice died. Under the microscope focal necrosis herds were
identifiable in renal tubules and liver samples (Ogwal-Okeng 2003, Arbonnier 2004,
Ouattara et al. 2004).
Therefore it is necessary and recommended to prolong the investigation on how these
bioactive compounds truly interact with the human body. The focus of this research should
evidently be the activity that Z. extracts have on the cerebral mechanisms. Additionally, it
is also worth mentioning that the former documented liver and kidney cell destruction
should also be considered in future research work.
30
2. Material and Methods
2.1. The Samples
The eight different reference samples were collected in the west of Burkina Faso in the
regions Cascades, Sud-Ouest and Hauts Bassins. The seventeen market samples were
acquired on herbal markets in the capital Ouagadougou (10) and the city of Bobo-
Dioulasso (7). Mainly all the samples were root samples except for two leaf samples from
Bobo-Dioulasso (sample 14 EM_Bbo_189 and samples 15 EM_Bbo_190.
2.2. General Preparation
All the plant material was ground and furthermore weighted in portions of 500 mg. Five
extracts were prepared for each sample with different solvents of different polarity
(methanol (MeOH), ethanol (EtOH), acetone (DMK), dichloromethane (DCM) and water
(H2O)). These extract samples were generally stored at -20 ° C and defrosted at room
temperature for at least 30 minutes before usage in various analysis.
2.3. Spectrophotometric Analysis
2.3.1. Total Phenolics
The reagent used in this phytochemical method was the Folin-Ciocalteu-Reagent (FCR).
The Z. extract (10 µl) was mixed with 100 µl of H20 and 5 µl of FCR, in a microplate well.
The mixture was incubated at room temperature for 3 min, and 10 µl of sodium carbonate
(35 g in 100 ml H2O) was added. The final volume per well was filled to 250 µl with H20.Subsequently the plate was covered with Parafilm® (Pechiney Plastic Packaging, Chicago
IL, USA) and incubated in the dark for 60 min. The absorbance was measured at 750 nm
using a microplate reader. Caffeic acid was used as standard at the concentration range of

31
0 -2.5 µg and the results were expressed as mg of caffeic acid equivalent (CAE) per gram
of plant dry weight (DW). The results represent the means of quadruplet measurement.
In the microplate the phenolic ingredient interacted in an alkali environment with the
Folin-Ciocalteu-Reagent (MERCK, Vienna, Austria), which was indicated in a change of
color. This distinguish shade of blue corresponds with the amount of phenolic compounds
in the samples used. After incubation the plate was put in a microplate reader (iMark
Microplate Absorbance Reader®, Bio-Rad, California USA) for photometric analysis. It
was measured at 750 nm with a mixing time of 20 seconds. The software Microplate-
Manager 6.0 was used to determine the absorption of each compartment on the plate. The
calibration curve was made using different quantities of caffeic acid – starting at 0µl and
ending at 25 µl – and H20 adding up to 110 µl in each compartment on the plate.
Afterwards FCR was added in a volume of 5 µl. After a short incubation time of 3 min,
whilst the plate was lightly agitated, 10 µl of sodium carbonate was added as well as
125 µl of H20. After a defined time the plate was measured in mentioned device. The
results were furthermore evaluated in a specially designed Excel-sheet.
The Z. zanthoxyloides samples were treated equally, only instead of caffeic acid in
numerous concentrations the samples were used in a volume of 10 µl with 100 µl of H20
adding up to the above-quoted 110 µl. Each sample was repeated 4 times in a plate and the
average of the 4 results minus the zero value was taken as an estimate within the
calibration.
Due to different concentration of phenolic compounds in some of the samples the
absorption was not within the boundaries of the calibration curve and therefore not
evaluable. These samples were diluted to fit into the linear range.

32
2.3.2. Antioxidant Activity
The stable radical 2,2-diphenyl-1-picrylhydrazyl (DPPH ®, Sigma-Aldrich, Missouri USA)is reduced in the presence of an antioxidant substance. The absorption was measured with
a photometer (iMark Microplate Absorbance Reader®, Bio-Rad, California USA). An
amount of 3.8 mg pure DPPH® powder was mixed with 25 ml of MeOH conc. to achieve
the necessary ratio of DPPH® solution. The resulting mixture was permanently stirred toprevent precipitation. The calibration curve was generated by adding a known
concentration of an antioxidant to DPPH®:
0.0063 g 6-hydroxy-2,5,7,8-tetramethylchroman-2-carboxylic acid (Trolox®, Sigma-Aldrich, Missouri USA) were mixed with 10 ml of EtOH (99 %) and then put into an
ultrasonic bath (Bandelin Sonorex RK 156 BH® Germany) for a period of 3 minutes. In
order to calculate a curve, varying quantity of trolox®-EtOH solution was pipetted in amicroplate in following concentrations: 0 %, 1 %, 2 %, 4 %, 6 %, 8 % and
50 %.
The DCM samples were not analyzed in this method. The wells were first filled with 85 µlof MeOH conc and then afterwards filled up to 100 µl with 15 µl of extract. The exact ratioof the two ingredients was adjusted if the shade of color was to extreme. Immediately after
the first two solutions 100 µl of DPPH® was added. Henceforth the plate was sealed with a
layer of Parafilm® (Pechiney Plastic Packaging, Chicago IL, USA). After this step the
microplate covered with the Parafilm® was stored in the dark for 30 minutes beforeundergoing photometric analysis in the microplate reader. This measurement wasperformed at a wavelength of 490 nm for a time period of exactly
20 seconds. The results were stored and processed in an Excel-sheet for further calculation
and evaluation.

33
2.3.3.Fe3+-Reduction
This method yet again detects antioxidant activity within plant-extracts, though a different
reactant is being reduced. In this particular case Fe3+is being reduced in a special buffered
solution. As standard 6-hydroxy-2,5,7,8-tetramethylchroman-2-carboxylic acid (Trolox®,
Sigma-Aldrich, Missouri USA) is used. The applicable solution of trolox®was obtained
by dissolving 6.2 mg in MeOH. Afterwards the solution must spend 5 min. in an
ultrasonic bath (Bandelin Sonorex RK 156 BH®Germany).
30 ml of the special buffered Fe3+reduction-reagent consist of:
• 25 ml of an ethanoic acid buffer solution: (300 mM); 1.55 g of Na-CH3COOH x
3 H2O in 8 ml of ethanoic acid are added to 500 ml of H20 with a pH of 3.6),
• 2.5 ml of 2,4,6-Tris(2-pyridyl)-s-triazin short TPTZ:0.0312 g of TPTZ (TPTZ
98%, Sigma-Aldrich, Missouri USA) in 10 ml of HCL with 40 mM were made and
stirred in an ultrasonic bath for 5 min. Finally, the glass container with TPTZ was
coated with aluminum foil to shield the solution from light.
• and 2.5 ml of a FeCl3-solution:0.032 g FeCl3x 6 H2O mixed with 10 ml of H20
and the glass container surrounded yet again by aluminum foil to prevent
degradation.
This reagent was freshly prepared each day in order to be properly reduced by the
antioxidant substances or by the standard Trolox®.
In order to calculate a calibration curve, varying amounts of Trolox®-MeOH solution were
prepared in test tubes in following concentrations: 0 %, 1.5 %, 4 %, 8 %, 16 %, 32 %, 45
% and 64 %. Afterwards 6 µl of each concentration was pipetted on a Microplate (ProteOn
Standard Microplates®Bio-Rad, California USA). Thereinafter 15 µl of H20 and 180 µl of
the reduction-reagent are added to each concentration.
Subsequently 9 µl of plant-extract are pipetted onto the microplate. Additionally, 15 µl of
H20 and another 180 µl of the reduction-reagent are added to the plate. After this step a
Parafilm layer envelopes the plate to conceal the micro-environment. It was then stored in
the dark for a period of 5 minutes.

34
The absorbances were read at a wave length of 593 nm with 20 seconds mixing time. The
results were stored and processed in an Excel-sheet for further calculation and evaluation.

35
2.4. Chromatographic Analysis
2.4.1. Thin Layer Chromatography (TLC)
Thin Layer Chromatography (TLC) is a chromatography method to separate compounds of
a mixture. The method is performed on a glass sheet coated with an absorbent (in our case
silica gel). This absorbent is the stationary phase. After applying the sample, the plate is
transferred into a chamber and a solvent mixture (= mobile phase) is migrating through the
plate driven by capillary forces.
The samples were applied on 20 cm x 10 cm silica gel plates (TLC Glass Plate SG 60 F254,
EMD/Merck KGaA, Darmstadt) by using a Linomat (Linomat IV Sample Applicator,
Camag Scientific Inc, Muttenz Switzerland) in 5 mm wide lines of extract with a space of 5
mm between the samples. 15 µl of extracts and 5 µl of the references were used. Due to the
fact that the usual mobile phase was not effectively separating the compounds, different
solutions were tested in a series trials. After optimization the mobile phase consisted of
seven parts of hexane and three parts of ethyl acetate. The distance of the base line and the
solvent front was approximately 8 cm long.
In addition to the extracts a group of selected references were pipetted onto the silica gelplate.
1. Caffeic acid (Sigma-Aldrich, Missouri USA)
2. Vanillic acid (Carl Roth GmbH, Karlsruhe)
3. Lupeol (Carl Roth GmbH, Karlsruhe)
4. Sanguinarin (Sigma-Aldrich, Missouri USA)
5. Fagaramide (Sigma-Aldrich, Missouri USA)
6. Sesamine (Sigma-Aldrich, Missouri USA)
7. Quercetin (Carl Roth GmbH, Karlsruhe)
8. Gallic Acid (Carl Roth GmbH, Karlsruhe)

36
After the procedure of separating in a closed environment the silica gel plate was carefully
dried. The plates were observed under natural white light, 254 nm and 366 nm and
polarized light with 650 nm (Reprostar 3, CAMAG, Muttenz). The penta-cyclic terpene
lupeol was not visible under these conditions. In order to assess the qualification and
semi-quantification of this compound the silica gel plates were sprayed with anisaldehyde
reagent (4-Anisaldehyde > 97.5 %, Carl Roth GmbH, Karlsruhe). The applied reagent
made the evaluation of lupeol possible and furthermore simplified the sesamine analysis
considerably. The documentation was achieved by taking pictures with a common digital
camera (Samsung PL120, Samsung Electronics, Seoul South Korea). For further
investigation the pictures were transferred to a computer and organized in a PowerPoint
file. A complete collection of the slides within this file can be found in the Appendix.
2.4.2. High-performance liquid Chromatography (HPLC)
500µl of the extracts were mixed with 500 µl of concentrated MeOH in a syringe, followed
by pressing the mixture through a filter (Rotilabo® syringe filter Nylon unsterilized, Carl
Roth GmbH, Karlsruhe) into a small flat-bottomed test tube. These test tubes were
especially designed to work in the autosampler of the HPLC-system. 10µl of the sample
were injected into the HPLC-system (600 S Controller, 717plus Autosampler, 996
Photodiode Array Detector, Waters GmbH, Wien, Austria). The HPLC was equipped with
a Luna (Torrance, CA, USA) C18 column (150 × 4.6 mm i.d.; 5 μm) and operated at a
flow rate of 1 ml/min with a standard running solution for this machine. Whilst the
samples pass the column, their compounds separate due to different interactions with the
adsorbent material and the mobile phase within the column.
Detection was performed at 254 nm. Identification of the substances was achieved by
original pure reference substances and comparison of spectral data. To determine the
concentration of the compounds, a calibration curve for the reference compounds was
established in the concentration range from 1 to 500 µg/ml.

37
2.5. Statistical Evaluation:
The statistical program used to calculate the results from each individual method within
this thesis was IBM SPSS Statistics 23, IBM GmbH, Wien). Differences between leaf and
root samples were analyzed using a Students t-Test. Comparison between origin and
extract were performed using a 2-factorial ANOVA. Mean values were compared in
assistance to a Tukey-B statistical evaluation.

38
3.Results
First it was considered a matter of great importance to determine causal links between
origin of a sample and the correlating various solvents that were used to prepare the
different extracts, as well as the possible differences between leaf and root samples from
different origins. In latter there was incidentally a significant difference in total phenolic
and ferric reduction from the photometric analysis. Furthermore it also showed significant
differences in the case of fagaramide in the HPLC. While the results from the DPPH and
sesamin from the HPLC showed no such phenomenon.
3.1.Results of the photometric analysis
The collected data of all the different results from each of the three photometric methods can
be found in the appendix under the chapter “6.3. Selected results from the photometric
analysis”.
3.1.1. Total Phenolic (mg caffeic acid/g DW)
The results from the total phenolic photometric analysis showed a wide range of results,
especially in the various solutions. The highest concentration of caffeic acid was found in
a MeOH solution; market sample EM_Oua_122 with 64.29 mg/g DW. This was a market
sample acquired in Ouagadougou, the capital of Burkina Faso. Given the fact that all the
other results were considerably lower, the possibility of a measurement error cannot be
ruled out. In this case, the maximum concentration is found in the market sample
EM_Bbo_189 with 13.17 mg caffeic acid/g DW, which is also a MeOH solution.
This sample was however purchased at a market in Bobo-Dioulasso. The lowest trace was
detected in field sample RC_ZXR_1 with 0.94 mg caffeic acid/g DW. This happened to be
a DMK solution, which was cropped in the region Cascades. The homogeneous cohorting
between the various solvents was preformed to determine comparability.

39
Hereinafter the results from the photometric total phenolic performance provided two
groups could be significantly differentiated among the extracts:
1. GROUP 1: H20 and EtOH
2. GROUP 2: DMK and MeOH
Regarding the three origins (Ouagadougou, Bobo-Dioulasso and References), they were
not distinguishable from each other
Recapitulatory the results show that the phenolic compound was averaged higher in the
market samples than in the collected reference samples. This phenomenon is made clear in
the following table, that show the mean values of the total phenolic compounds in market
samples from Ouagadougou and Bobo-Dioulasso, as well as the field samples from the
west regions of Burkina Faso.
Table 1: Averaged Total Phenolic values including standard deviation(mg caffeic acid/g DW)
Average (TP) MEOH ETOH DMK H2O
Ouagadougou 10.41 ± 1.14 3.01 ± 1.16 1.48 ± 0.33 7.52 ± 2.59
Bobo-Dioulasso 5.45 ± 4.86 2.47 ± 1.63 1.31 ± 0.20 6.04 ± 0.71
Field Samples 3.34 ± 0.95 2.32 ± 0.44 1.34 ± 0.33 6.11 ± 1.99
When looking at the statistical analysis it appears that the total phenolic compounds are
more cumulative in leaf than in root samples. This fact can especially be observed in
MeOH extracts.

40
3.1.2. Fe3+-Reduction (mg Trolox/g DW)
The outcome of the Fe3+-Reduction photometric analysis showed a well-balanced range of
results among the various solutions. The only exceptions are the solutions made with H20.
Which showed a wide range of numbers among the results from 1.74 mg Trolox/g DW in
market sample (Ouagadougou) EM_Oua_118 to 38.77 mg Trolox/g DW in the field
sample RH_ZXR_2. However, this sample also showed the highest concentration of trolox
found in all used solution. This field sample RH_ZXR_2 was cropped in the region Hauts-
Bassins. The results from the ferric reduction were statistically treated in accordance with
the results of total phenolic content present similar pathway to a significant grouping. The
first aspect was once again the extract and was partied as followed:
1. GROUP 1: H20
2. GROUP 2: DMK, EtOH and MeOH
Secondly the origin was evaluated in light of significant comparability:
1. GROUP 1: Ouagadougou and Bobo-Dioulasso
2. GROUP 2: Collected references from the in the field
After consulting Dr. Lamien-Meda the decision to exclude these samples in this particular
matter was generally agreed upon.
Given this, the assumption, that the H20 solutions will have to be totally taken out of
consideration, whilst evaluating this particular method, might not be overall conclusive.
Furthermore, smallest trace of trolox was detected in field sample EM_Oua_114 with 0.89
mg trolox/g DW in an EtOH solution. This market sample was acquired in Ouagadougou.
The following table shows that the mean values are considerably higher in the field
samples than in the market samples.

41
Table 2: Averaged Fe3+-Reduction (mg Trolox/g DW)
Fe3+-Reduction MeOH EtOH Acetone H2O
Ouagadougou 3.22 ± 0.96 2.30 ± 1.13 3.26 ± 0.63 20.32 ± 11.47
Bobo-Dioulasso 4.01 ± 2.12 2.48 ± 0.68 2.30 ± 0.75 16.10 ± 2.40
Field Samples 5.90 ± 2.00 3.97 ± 0.61 3.16 ± 0.61 27.45 ± 7.12
3.1.3. Activity DPPH (mg Trolox/g DW)
The results of this final photometric analysis show a more narrow range of the averaged
results among all the used solutions. On one side the maximum, 8.15 mg Trolox/g DW,
was found in the market sample EM_Oua_122 from Ouagadougou, on the other side the
minimum, 0.01 mg Trolox/g DW was detected in the market sample EM_Bbo_189 from
Bobo-Dioulasso.
In the case of DPPH, the applied statistical procedure was done likewise as with the results
from the Total Phenolic. The outcome concerning the extract comparability grouping
presented two categories:
1. GROUP 1: H20 and Acetone
2. GROUP 2: EtOH and MeOH
The grouping regarding origin was also noteworthy. Hereinafter all three origins presented
individual cohorts, that were statistically significant:
1. GROUP 1: Ouagadougou
2. GROUP 2: Bobo-Dioulasso
3. GROUP 3: Collected references from the in the field
The following table shows, that the depending on the solution used and the origin of the
sample strongly influenced on the result. For instance, the field samples showed the

42
highest values in the methanol solutions. The market samples from Ouagadougou were
able to achieve the maximum in the EtOH solutions, whereas the market samples from
Bobo- Dioulasso obtain the highest data of antioxidant activity in the H20 category.
Table 3: Antioxidant Activity DPPH (mg trolox/g DW)
DPPH MeOH EtOH Acetone H2O
Ouagadougou 4.07 ± 1.36 5.40 ± 1.55 1.87 ± 0.54 2.37 ± 1.50
Bobo-Dioulasso 3.56 ± 1.75 4.32 ± 2.31 098 ± 0.62 2.74 ± 1.52
Field Samples 5.91 ± 0.94 5.36 ± 2.27 4.76 ± 2.02 2.56 ± 0.97
43
3.2. Results from the chromatographic analysis
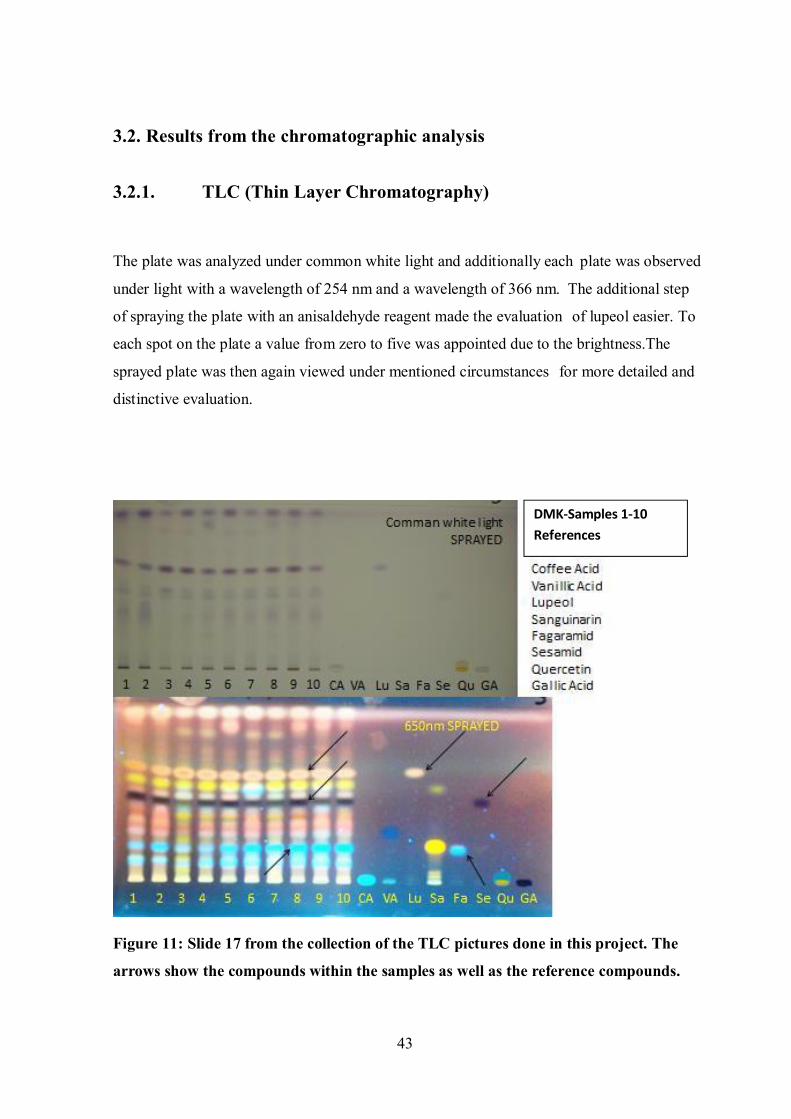
3.2.1. TLC (Thin Layer Chromatography)
The plate was analyzed under common white light and additionally each plate was observed
under light with a wavelength of 254 nm and a wavelength of 366 nm. The additional step
of spraying the plate with an anisaldehyde reagent made the evaluation of lupeol easier. To
each spot on the plate a value from zero to five was appointed due to the brightness.The
sprayed plate was then again viewed under mentioned circumstances for more detailed and
distinctive evaluation.
Figure 11: Slide 17 from the collection of the TLC pictures done in this project. The
arrows show the compounds within the samples as well as the reference compounds.
DMK-Samples 1-10References

44
As observable in Figure 11, the bars from the TLC under common white light represent only
lilac to purple bars amongst the samples. The darkest and best visible bars appear at the
same level on which the reference lupeol also appears. After spraying the plate with anis-
aldehyde reagent the plate was again observed, but under polarized light with a wavelength
of 650 nm. Hereby, lupeol was again visible but in a different color, namely peach to beige.
Fagaramide was also detectable in the samples in a light blue color. The brightness in
sample six to ten was especially noteworthy. Sesamine was also observable in a dark
purple to black color in common white light, but only after being sprayed. When the plate
was not sprayed, hardly any component was visible on the plate. This phenomenon can be
well observed in Figure 12. Only the chromatographic footprint of sanguinarine is
observable, which clearly indicates that it does not show up in the field samples. The
samples in general and under polarized light presented a lot more bars. Although they did
not include caffeic acid, vanillic acid, sanguinarine, quercetin or gallic acid, as these
references did not produce similar data. None of the references mentioned was detectable
in the samples. Concluding each sample presented about 20 very similar bars, of which the
three formerly mentioned references were identified.
Figure 12: DMK-Plate with field samples A-H and then additionally the referencesamples in following order: caffeic acid, vanillic acid, sanguinarine, fagaramide,sesamin, quercetin and gallic acid (without anis-aldehyde reagent and observedund common white light)

45
The assigned values (one through five) are viewed in the following table. Especially
the samples 6, 8, 9 and 10 contained a lot of fagaramide. This goes for all solutions
except the one with H20. This is observable in Table 4 for the market samples.
Table 4: Market samples: collected TLC data of lupeol (L), fagaramide (F) andsesamin (S) inn different solvents established after assigning numbers to the barbrightness
Ethanol Methanol Acetone DCM H2OSample L F S L F S L F S L F S L F S
1 3 2 3 2 2 2 3 3 4 3 2 4 0 1 12 2 4 1 2 4 2 3 4 3 3 4 3 0 2 13 4 1 2 3 1 1 5 2 1 5 1 1 0 1 14 4 1 3 4 3 4 5 2 3 5 2 3 0 2 15 2 5 3 2 4 4 3 4 4 4 4 4 0 3 16 2 5 2 4 5 3 4 5 2 4 5 3 3 3 27 2 5 3 3 5 3 4 4 2 4 4 2 1 3 28 3 5 3 3 5 4 4 5 4 4 5 4 2 4 39 3 5 3 3 5 2 5 5 2 5 5 2 1 3 110 1 5 3 2 5 2 3 5 3 3 5 3 0 1 211 2 2 1 3 3 1 3 2 1 3 3 1 0 2 112 1 4 3 3 4 2 3 4 2 2 4 3 0 3 313 1 3 3 3 4 2 3 3 3 2 3 4 0 2 216 2 4 1 4 5 1 4 4 2 3 4 2 3 2 217 1 1 2 4 3 2 3 1 4 2 1 3 0 1 2
The shortage of reference compound and the difficulties obtaining an appropriate
mobile phase limited the amount of samples to be considered in this method.
Nevertheless the MeOH, EtOH, DMK and DCM field samples were run with a
selection of reference samples later on to obtain more knowledge in terms of
comparability. The H2O samples were not considered anymore. The RF-values
were established and compared between the market samples and the field samples.

46
It is noteworthy to mention that lupeol was not run in with the field samples. Following up
the data from field samples were collected and are observable in Table 5.
Table 5: Field samples, collected TLC data established after assigning numbers to thebar brightness
Table 6: RF-Values of the market and the field samples,lupeol RF- value from the field samples were estimated
AVERAGE SAMPLES (RF-Values)MARKET FIELD
Lu Fa Se Lu (estimated) Fa Se0.69 0.28 0.52 0.73 0.29 0.55
The Table 6 shows that the average Rf-values only differ from each other slightly. Since
the plates both looked very alike and the reference lupeol was not available anymore the
Rf-Value for lupeol from the field samples was estimated and calculated against mean
values from all the other samples. This comparison led to the calculation of a coefficient
which was then multiplied with the lupeol Rf-value from the market samples. This resulted
in the Rf-value lupeol from the field samples.
A collected TLC Plate data can be found in the appendix.

47
3.2.2. HPLC (High Performance Liquid Chromatography)
All results of the HPLC analysis regarding the compounds that were actually identified
were listed as mean values with standard deviation. For the samples on through seventeen,
this is observable in Table 7. Only fagaramide and sesamine were established, as lupeol
was not detectable.
Table 7: Established values (mean and standard deviation) without the results fromthe different water solutions

48
3.3. Results in terms of comparability amongst the extract solutions
Each sample was prepped the same way, whether it was a market sample (numbered) or a
field sample (categorized alphabetically). A MeOH, an EtOH, a DMK, a DCM and a H2O
extract solution was made for each and every sample.

49
3.3.1. Root samples
3.3.1.1. HPLC in root samples (High Performance Liquid Chromatography)
3.3.1.1.1. Fagaramide
Statistical evaluation of the HPLC results showed that there is a significant difference
between the various solvents to concentrate fagaramide out of the roots. This was
statistically affirmed with a Tukey-B Test and is observable in Figure 13. Fagaramide
acts, as described above, as a very considerable antiplasmodial agent. In Figure 13 the
subgrouping of extracts according to their potential to concentrate fagaramide is shown.
The various extract solutions were able to educe fagaramide in concentrations from
28.34 µg/ml in H2O up to 163.03 µg/ml in DCM extracts. The other samples were
quantified as following EtOH (137.47 µg/ml), DMK (147.75 µg/ml) and MeOH (1610.92
µg/ml).
Figure 13: Subgrouping the fagaramide content in different extracts of the roots (different lettersindicate significant differences).
H2O was not able to procure a great amount of fagaramide out of the plant material and
significantly differed from the other extracts, whilst those other extracts (MeOH, EtOH,
DMK and DCM) showed no significant difference amongst each other in the terms of
extracting fagaramide from the plant. So forth two groups were established: group a with
50
only H2O and group b containing EtOH, DMK, MeOH and DCM..
3.3.1.1.2. Sesamin
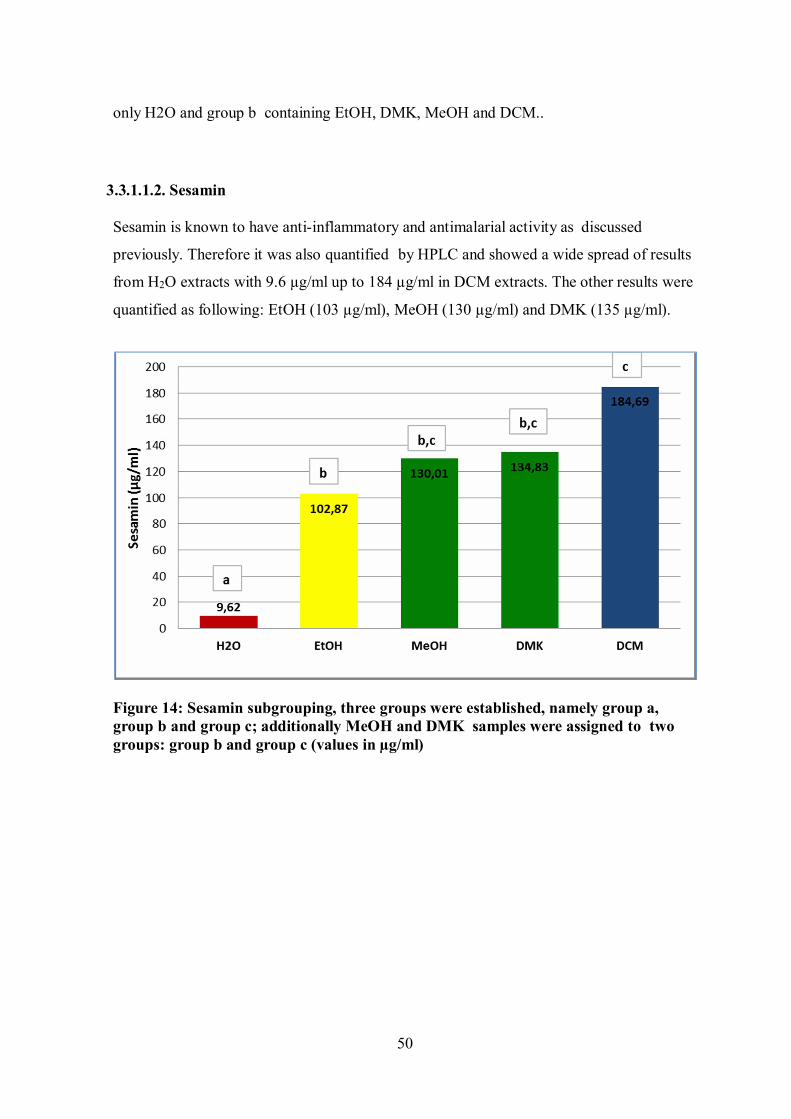
Sesamin is known to have anti-inflammatory and antimalarial activity as discussed
previously. Therefore it was also quantified by HPLC and showed a wide spread of results
from H2O extracts with 9.6 µg/ml up to 184 µg/ml in DCM extracts. The other results were
quantified as following: EtOH (103 µg/ml), MeOH (130 µg/ml) and DMK (135 µg/ml).
Figure 14: Sesamin subgrouping, three groups were established, namely group a,group b and group c; additionally MeOH and DMK samples were assigned to twogroups: group b and group c (values in µg/ml)

51
The results showed that there were three groups that differed significantly from each other,
although two extract solutions were allocated to two groups. This can all be observed in
Figure 13. Group a, similar to the fagaramide grouping, only housed the H2O extracts. In
group b there are the EtOH extracts and group c contains DCM extracts. MeOH and DMK
were assigned to both groups b and c

52
3.3.1.2. Results from the Photometric Analysis
The anti-oxidative activity of a concoction is always valued in case of an infection, no
matter what sort of pathogen the organism is confronted with. In the first step only the root
samples were statistically investigated by a Tukey-B Test. The demanding question hereby
was if the results differed from each other in light of their extraction solvent. To enlighten
this matter the samples anti-oxidative characteristics were statistically assessed amongst
each method. The result was that their activity did indeed significantly differ from each
other, regardless which of the formerly mentioned methods was applied. Then again also
the subgrouping did present different results for each used method. It is however
noticeable that especially the leaf samples did sometimes not produce any data within the
method.

53
3.3.1.2.1.Total Phenolics
In this method the total phenolic contents of the DMK extracts (1.40 mg caffeic acid/g
DW) and the EtOH extracts (2.44 mg caffeic acid/g DW) did not differ significantly
from each other, they were placed in group a. The MeOH extracts (3.63 mg caffeic
acid/g DW) were put into group b and the H2O extracts (6.71 mg caffeic acid/g DW) into
group c. All three groups differed from each other statistically significant, which is
observable in Figure 15.
Figure 15: Total Phenolics content subgrouping, three groups were established,namely group a, group b and group c (mg caffeic acid/g DW)

54
3.3.1.2.2.DPPH
In case of the DPPH the antioxidant activity of the DMK extracts (2.75 mg Trolox/g DW)
and the H2O extracts (2.52 mg Trolox/g DW) did not differ significantly from each other
and were labeled group a. MeOH extracts (4.39 mg Trolox/g DW) and EtOH extracts
(4.86 mg Trolox/g DW), which both did not vary from each other significantly were
addressed as group b. Both groups did nevertheless differ from each other statistically
significant (Figure 16).
Figure 16: DPPH subgrouping, two groups were established namely group a andgroup b (values in mg Trolox/g DW)

55
3.3.1.2.3.FRAP
The ferric reduction showed that there are two groups (group a and b) of extracts that differ
from each other statistically. Group a is made up by the antioxidant activity of EtOH
extracts (2.99 mg caffeic acid/g DW), DMK extracts (3.09 mg caffeic acid/g DW) and
MeOH extracts(4.07 mg caffeic acid/g DW). The second one named group b houses only
H2O extracts (21.88 mg caffeic acid/g DW). Both groups differed from each other
statistically significant (Figure 17).
Figure 17: Ferric reduction subgrouping, two groups were established, namely groupa and group b (values in mg caffeic acid/g DW)

56
3.3.2. Leaf samples
The antioxidative activity was again tested in terms of comparability amongst the extract
solutions MeOH, EtOH and DMK. The results showed that all the various extract solutions
differed from each other statistically significant.
3.3.2.1. Total phenolics
The results from the total phenolic contents showed that the various extract solutions all
differed from each other statistically significant. Again subgroups were formed as
observable in Figure 18. Group a inhabited the total phenolic content of the DMK
extracts (1.24 mg caffeic acid/g DW), group b of the EtOH extracts (4.82 mg caffeic acid/g
DW) and group c of the MeOH extracts (12.49 mg caffeic acid/g DW). All three groups
differed from each other statistically significant (Figure 18).
Figure 18: Total Phenolic content subgrouping, three groups were established,namely group a, group b and group c (values in mg caffeic acid/g DW)

57
3.3.2.2. DPPH
The DPPH results showed that the antioxidant activity in all the various extract solutions
differed from each other statistically significant. Subgroups were again formed and the
antioxidant activity in the DMK extracts (0.24 mg Trolox/g DW) named group a , in the
MeOH extracts (5.98 mg Trolox/g DW) group b and in the EtOH extracts (7.69 mg
Trolox/g DW) group c. Figure 19 visualizes this quite nicely.
Figure 19: DPPH subgrouping, three groups were established, namely group a, groupb and group c (values inmg Trolox/g DW)

58
3.3.2.3. Ferric reduction (FRAP)
The third method the ferric reduction presented only two groups, namely group a and b
statistically differed from one another. The antioxidant activity of the DMK extracts (1.43
mg caffeic acid/g DW) and the EtOH extracts (1.73 mg caffeic acid/g DW) were placed
into group a, whereas MeOH extracts (6.94 mg caffeic acid/g DW) were put into group b.
This grouping is depicted in Figure 20.
Figure 20: Ferric reduction subgrouping, two groups were established, namely groupa and group b (values in mg caffeic acid/g DW)

59
3.4. Results in terms of comparability amongst the origin of the samples
The origin of the samples is wide spread. There are the market samples from Bobo-
Dioulasso and the capital Ouagadougou and there are the reference samples from 4
different regions of the country. Because the few leaf samples were only ever acquired in
the capital of Burkina Faso it was not considered in this issue.
3.4.1. HPLC Results
3.4.1.1. Fagaramide
The concentration of fagaramide among the samples was compared in regard to the origin
of the sample. The results and the following subgrouping was the same for all five extract
solutions. The applied test showed that there were two subgroups a and b. The group a was
inhabited by the reference samples and by the market samples from Bobo-Dioulasso. On
the other hand the market samples from Bobo-Dioulasso were also put in group b together
with the samples from Ouagadougou. This is expressed in Figure 21.
Figure 21: Concentrations of fagaramide regarding the origin of the samples in groupa, b or both (µg/ml)

60
3.4.1.2. Sesamin
The concentration of Sesamin among the samples was compared in regard to the origin of
the sample. In case of the DMK extracts the applied statistical test showed that there were
two subgroups group a and group b. Group a was only inhabited by the reference samples.
The second group was called group b. In this group the market samples from Bobo-
Dioulasso and from Ouagadougou were placed. The same phenomenon was observable
with the extracts from DCM, eventually giving the same grouping as previously obtained
with the DKM samples. The EtOH-samples presented three different subgroups a, b and c.
Figure 22: Concentrations of sesamine regarding the origin of the samples in group a, b or c(µg/ml)

61
The reference samples were put into group a, the samples from Bobo-Dioulasso were
placed into group b and the samples from Ouagadougou were set in group c. In the
reference samples sesamine could not be detected in the H2O extracts. Sesamine was
found only in the market samplesand the samples were placed into two different subgroups
group a and b, due to a Tukey-B-Test. The MeOH extracts presented two different groups.
Group a was inhabited only by the reference samples and group b by both of the market
samples.

62
3.4.2. Photometric Analysis
3.4.2.1.Total Phenolic
The results from the Tukey-B test in accordance with the DMK samples show that all
three sample origins were placed into the same group (reference samples: 1.33 mg caffeic
acid/g DW, Bobo-Dioulasso: 1.34 mg caffeic acid/g DW and Ouagadougou 1.48 mg
caffeic acid/g DW). On the other hand the EtOH samples all presented the diverse data
which resulted in forming three different subgroups. Group a is composed of the
reference samples (1.52 mg caffeic acid/g DW) and of the market samples from Bobo-
Dioulasso (2.32 mg caffeic acid/g DW). Although those market samples were also put
into group b with the samples from Ouagadougou (3.01 mg caffeic acid/g DW).
Figure 23: Total phenolics content subgrouping of all four extract solutions regardingthe origin of the samples; only within the EtOH samples there were three groupsestablished, namely group a and group b, additionally the market samples fromBobo-Dioulasso were assigned to both subgroups (values in mg caffeic acid/g DW)

63
The H2O samples showed that all three origins were put into the same subgroup in
accordance to their total phenolics concentration (reference samples: 6.04 mg caffeic
acid/g DW, Bobo-Dioulasso: 6.11 mg caffeic acid/g DW and Ouagadougou 7.52 mg
caffeic acid/g DW). The MeOH samples presented the same result for as the H2O
samples.
Therefore there is also only one subgroup (reference samples: 2.64 mg caffeic acid/g
DW, Bobo-Dioulasso: 3.34 mg caffeic acid/g DW and Ouagadougou 4.43 mg caffeic
acid/g DW).

64
3.4.2.2. DPPH
The results from the Tukey-B test in case of the antioxidant activity measured with DPPH in
DMK extracts show that all the market samples from Bobo-Dioulasso and from
Ouagadougou were placed into the same group (Bobo-Dioulasso: 1.28 mg Trolox/g DW
and Ouagadougou: 1.87 mg Trolox/g DW). This group was named group a. The reference
samples (4.76 mg Trolox/g DW) were put in to the singular group b
Figure 24: DPPH subgrouping regarding the origin of the samples, the data from DMKand EtOH samples produced two soupbgroups each, whereas the MeOH samplesprovided three subgroups, namely group a, group b and group c (all values in mgTrolox/g DW)

65
On the other hand the EtOH samples presented data which resulted in forming two
different subgroups. The market samples from Bobo-Dioulasso were put into group a (2.97
Trolox/g DW). Additionally group b is inhabited by the reference samples (5.36 mg
Trolox/g DW) and by the market samples from Ouagadougou (5.40 Trolox/g DW). The
H2O samples showed that all three origins were put into the same subgroup in accordance
to their total phenolic concentration (reference samples: 2.56 mg Trolox/g DW, Bobo-
Dioulasso: 2.74 mg Trolox/g DW and Ouagadougou 2.37 mg Trolox/g DW). In the case of
MeOH samples the result presented three different subgroups: group a with the Bobo-
Dioulasso samples (2.59 mg Trolox/g DW), group b with the Ouagadougou samples
(4.07 mg Trolox/g DW) and group c with the reference samples (5.91 mg Trolox/g DW).
This all is observable in Figure 23.

66
3.4.2.3. FRAP
Regarding the DMK samples in the ferric reducing antioxidative power (FRAP) tests the
results from the Tukey-B test present that all three sample origins were placed into the same
group (reference samples: 3.16 mg caffeic acid/g DW, Bobo-Dioulasso: 2.65 mg caffeic
acid/g DW and Ouagadougou 3.26 mg caffeic acid/g DW). Additionally the same results
were observed in case of the H2O samples group (reference samples: 27.45 mg caffeic acid/g
DW, Bobo-Dioulasso: 16.10 mg caffeic acid/g DW and Ouagadougou 20.32 mg caffeic
acid/g DW).
Figure 25: FRAP subgrouping regarding the origin of the samples in group a or b (mgcaffeic acid/g DW)
On the other hand the EtOH samples all presented the diverse data which resulted in
forming two different subgroups. Group a is inhabited by the market samples from
Ouagadougou (2.30 mg caffeic acid/g DW) and by the market samples from Bobo-
Dioulasso (2.78 mg caffeic acid/g DW). On the other hand reference samples were put into
group b (3.97 mg caffeic acid/g DW).

67
The MeOH samples presented the data that led to the formation of two subgroups, group a
and group b. Here the market samples from Ouagadougou (3.22 mg caffeic acid/g DW)
and the market samples from Bobo-Dioulasso (2.83 mg caffeic acid/g DW) were placed
into group a. The reference samples were put into group b (5.90 mg caffeic acid/g DW).

68
4.Discussion
4.1.A first glance
When first looking at results in terms of comparability it might seem quite intricate to
evaluate the data coming from the water samples, as their results are so frequently off the
charts and produce a staggering overall standard deviation. This might derive from a
commonly known difficulty to maintain comparable results from water extractions
(Lamien-Meda, personal communication). Nevertheless, in some cases it has proven itself
valuable to include a water extraction in the laboratory work.
Another problem that manifested, was the fact that due to the high costs in obtaining the
reference compounds – such as lupeol and sanguinarin – the window of opportunities in
this matter was quite narrow, because their chemical structure in pure substance is quite
delicate to handle. Nevertheless all the necessary “lab-work” was completed in all
conscience within 3 months.
4.2. Mobile phase for the TLC (“the running solution dilemma”)
Whilst running the first couple of TLCs it became clear, that the used mobile phase was not
quite suitable for these plants compounds. The separation in the beginning was not going
very well and it soon became clear, that a different solvent mixture would be needed.
With a lot of effort, research and the help provided by Dr. Roland Meda a new mobile
phase was found, which separated the various compounds to our satisfaction. The best
mobile phase used in this thesis was achieved as follows:
• 30,8 ml Ethyl Acetate
• 5,2 ml MeOH
• 4,0 ml H20
But due to the many failed attempts in establishing a correct chemical compostion of the
69
running solution much of the expensive reference compounds had to be sacrificed.
Additionally the amount sanguinarine was more limited from the beginning.
4.3. Comparison of Root and leaf samples
The comparison between leaf and root samples among the various extracts presented
following results:
• Methanol extracts:Total phenolic concentrations did actually present data that
indicated a statistical difference between root and leaf samples. The same results
were established with the results from the ferric reduction.
• Ethanol extracts:The total phenolic results showed a statistical difference
between the 2 different type of samples. On the contrary in the case of
ferric reduction it seems that there are no statistical differences.
• Acetone extracts:In comparison between leaf and root samples there seems to be
no statistical difference in the case of total phenolic on the one hand, but there
appears to be one regarding the ferric reduction on the other.
• Extracts from H20:Hereby there was again a statistical difference detectable with
the total phenolic deliverables as well as the ones from the ferric reduction. .
In case of the DPPH samples the results were quite simple. All of the different extract
solutions showed a statistical difference amongst the root and leaf samples.
Overall it seems that methanol might be the most useful solvent for extracting the various
compounds, in particular phenolic substances, in a satisfying way and enriching them. It is not
amazing, that those substances once enriched in polar solvents like MeOH furthermore achieve
better results in tests for antioxidant activity such as DPPH and FRAP than extracts of more apolar
solvents. This was shown quite nicely in ferric reduction antioxidant power test: even though the
samples are in statistically significant different groups they appear to maintain a steady, but still
quite high level of mean values in recognition to their TROLOX
concentration. Against this no other extract solution was able to perform as well as this
particular solution.

70
4.4.Compounds in terms of origin
4.4.1. Photometric Analysis
As shown above the cohorting proved itself to be quite successful and show an overall
distinction between the samples obtained in the west of Burkina Faso around the city of
Bobo-Dioulasso and the ones that were procured in the capital of the country in
Ougadougou. Furthermore there was also a difference in the quantity of the compounds
either bought or collected. The quality of the product from Zanthoxylum appears to be
higher and more beneficial when bought on the market and even more when acquired on
one in the capital of the country.
This phenomenon is quite interesting as most of the plants are home and harvested in the
western regions of Burkina Faso around the city of Bobo-Dioulasso. This is also the
origin of all the field samples used in this project. One can definitely assume that the long
hours of transportation to the capital markets and the probably poorly manner of
conserving the product would result in some sort of impairment on the product.
Nevertheless this is not the case. On possibility is that the markets import a certain amount
of plants from other countries in West Africa. That could give an explanation to these
circumstances. Whether or not this hypothesis is accurate or false cannot be ascertained.
In the case of the total phenolics concentration it was established that the highest amount
can be found in market samples. Beneficial to the quantity is the usage of an alcoholic
solution, such as ethanol or methanol, though methanol seems to exceed the prior in this
matter with an overall average caffeic acid of 10.4 mg/g in an Ouagadougou market
sample. This surpasses all the other mean values up to over three times. Furthermore the
methanol samples are also more successful in maintaining a high concentration in light of
antioxidant activity. This is documented in their performance in the methods ferric
reduction and DPPH. In both cases the methanol extract obtained the highest levels of
TROLOX concentration. Interestingly enough the field samples were also able to perform
very well within these methods. This concludes a contradictory opinion that market
samples might not always have the edge over the field samples in terms of compound

71
quantity. Evidently in the case of DPPH methanol and ethanol competed admirably for the
best quantity. Recapitulatory surprisingly ethanol was in the ascendancy in the end.
4.4.2. Chromatographic Analysis
As established the occurring problems with the mobile phase maintained a problem
throughout the chromatographic analysis. Especially sanguinarine presented itself difficult
to detect. Even though it is mentioned and well established that sanguinarine is a known
compound of Zanthoxylum it could not be found in the samples. There was evidently a
certain pattern in the samples that could maybe be this sought out compound because it
presented a similar color. Nevertheless the pattern presented from the reference compound
deviated too extensively. On the one hand sanguinarine could be overlapped by sesamine in
that specific TLC system, interacted with some property of the experiment or on the other
hand did not anymore have its original chemical integrity and construction.
For caffeic acid hexane/ethyl acetate (seven+ three) was not the appropriate mobile phase
which can be seen at the starting point of the TLC plate where a great amount of the
substance remained.
Vanillic acid could not be detected in the Zanthoxylum z. samples by means of TLC.
Maybe this compound was under the detection limit or overlayed by other compounds.
However, three substances that are known compounds of this plant were actually detected
by means of TLC. Lupeol, fagaramide and sesamine were almost always identifiable on the
sprayed plates. According to the brightness of color and the thickness of the bar patterns
numbers were assigned to the samples. Water solutions proofed themselves to be
inadequate to be appropriated for this method, especially for the lupeol. Amongst the three
fagaramide had the highest concentration and achieved the highest score the most often.
The quantification of fagaramide and sesamine proofed to be very effective in the HPLC.
Fagaramide values were highest in the market samples from the capital of Burkina Faso. To
emphasize the quality of market products sesamine concentrations were also highest in
the market samples from this region. Unfortunately lupeol, though definitely very
prominent in the TLC was not detectable in the HPLC under the described conditions, even
72
though a thorough search in the results from the HPLC was performed, to maybe after all
unkennel lupeol.
Many valuable phytochemical data about Zanthoxylum z. were collected in this thesis.
Over all according to the data presented in this project it can surely be maintained that
the market samples in combination with the location Ouagadougou and an alcoholic
extract solution (preferably MeOH) is the most beneficial to achieve highest
concentration of the phytochemical compounds used in this study.

73
5. Abstracts
5.1. In English
To this day Malaria is still a very common threat, especially in West Africa and there in
Burkina Faso. Fighting this disease has been the center of attention in many traditional
concoctions made to treat this disease. Especially among native tribes the usage of the
surrounding flora, such as the plant Zanthoxylum zanthoxyloides, has been well
established and was successful. The research focused mainly on the developing and
investigating the various methods to safely and easily determine this particular plant. Two
different plant organs namely leaf and root were acquired from herbal markets in the
capital Ouaguadougou and the city of Bobo-Dioulasso. The references samples were
harvested and collected in four different regions in the west of Burkina Faso. Overall there
were 25 different samples. Solutions were made with MeOH, EtOH, DMK, DCM and
H2O as extract solvents. Fagaramide and sesamin were perfectly detectable in the
chromatographic methods (TLC and HPLC), whereas lupeol was only detectable in the
TLC. The quantification of fagaramide and sesamin in the HPLC did present some data
that varied depending on the origin of the product and the extract solution used.
Additionally methods to determine the antioxidant activity were also performed such as
total phenolics content, ferric reduction and DPPH. The results were statistically analyzed,
which led to a homogeneous cohorting between the various extraction solvents to
determine comparability Thereinafter the samples were also analyzed and compared
regarding their origin. The thoroughly promising results showed that MeOH functions as
a very considerable extract solvent for quantifying fagaramide and sesamine in an extract
solution. On the other hand H2O did not present itself reliable when it comes to procuring
essential compounds for treating malaria.
The significance of creating a reliable method is incredibly important to ensure product
quality. In case of Zanthoxylum zanthoxyloides was merely a first step.
74
5.2. In German
Bis zum heutigen Tag ist Malaria eine ständige Gefahr in vielen Ländern in West Afrika, wie
zum Beispiel in Burkina Faso. Der Kampf gegen diese Krankheit stand bei vielen
traditionellen Naturheilern eingeborener Stämme schon lange im Mittelpunkt des Interesses.
Zur Anwendung kamen hierbei auch viele Pflanzen der lokalen Flora. Eine dieser Pflanzen ist
Zanthoxylum zanthoxyloides, die auch im Fokus dieser Arbeit stand. Primär wurde Wert
darauf gelegt Systeme und Methoden zu finden, die die Möglichkeit einer Identitäts-,
Reinheits- und Qualitätsprüfung bieten, um sicher zu gehen, dass man tatsächlich diese
Pflanze vor sich hat und es zu keiner Verfälschung kommen kann. Auf Märkten in der
Hauptstadt von Burkina Faso, Ouaguadougou, und in der Stadt Bobo-Dioulasso wurden
sowohlWurzel- als auch Blattproben dieser Pflanze gekauft. Desweiteren wurden
Referenzproben in vier verschiedenen Regionen im Westen des Landes gesammelt. Aus den
Proben wurden MeOH-, EtOH-, DMK-, DCM- und H2O-Extrakte hergestellt. Die in der
Dünnschichtchromatographie (DC) gefundenen Substanzen Fagaramid und Sesamin wurden
anschließend in der HPLC quantifiziert und deren Werte nach Herkunft der Droge und
Extraktionsmittel verglichen, um Unterschiede zu eruieren. Das in der DC gefundene Lupeol
konnte in der HPLC unter den für Fagaramid und Sesamin geeigneten Bedingungen nicht
sicher detektiert werden.
Zusätzlich zu den chromatographischen Methoden wurden photometrische Methoden
durchgeführt, um das antioxidative Potential zu untersuchen. Hierbei wurden die
MethodenGesamtphenolgehalt, Eisen III reduktion und DPPH verwendet. Die Ergebnisse der
Proben wurden statistisch ausgewertet und nach Fähigkeit der Extraktionsmittel und
Herkunft der Proben gruppiert. Die durchaus erfreulichen Ergebnisse zeigten, dass Methanol
als hervorragendes Extraktionsmittel fungiert, vor allem wenn es darum geht die Substanzen
Fagaramid and Sesamin aus der Zanthoxylum Wurzel zu qunatifizieren. Eine reine H2O
Lösung wird jedoch nicht sehr erfolgreich sein können, wenn es sich um eine
Malariatherapie handelt. Das Extraktionsvermögen ist unzureichend und die Löslichkeit der
Wurzel und ihrer Komponenten in H2O ist einfach zu gering.

75
Es ist von größter Wichtigkeit und Dringlichkeit, dass man sichere und möglichst simple
Methoden zur Verifizierung von Pflanzenmaterial dieser Art etabliert. Diese Arbeit leistet
hierbei einen kleinen Beitrag..

76
6.Appendix
6.1.References:
ADESANYA S, SOFOWORA A. 1983. Biological standardization of Zanthoxylum rootsfor anti-sickling activity. Planta Medica 48(1): pages 27–33.
ADESINA S K. 2005. The Nigerina Zanthoxylum zanthoxyloides; chemical and biologicalvalues. African Journal of traditional, complementary and alternative Medicines 2(3);pages 282-301
ARBONNIER M. 2004. Trees shrubs and lianas of West African dry zones. First edition.Paris. CIRAD Margraf Publishers; pages 474, pages: 66, 83, 107, 128, 130, 474, 519-533,540 - 546
BOCH J. 1984. Tropenmedizin, Parasitologie. First Edition. Bern, Frankfurt, New York,Oxford, Vienna. Peter Lang:
IWU M. 2014. Handbook of African Medicinal Plants. Second Edition. Florida. CRCPress: pages 335 ff.
LUCIUS R, LOOS-FRANK B. 1997&2008.Parasitologie. First edition. Heidelberg, Berlin.
Spektrum Akademischer Verlag:
MEHLHORN H. 2012. Die Parasiten des Menschen: Erkrankungen erkennen, bekämpfen
und vorbeugen. .7Auflage. Heidelberg, Berlin. Spektrum Akademischer Verlag
MENUT C, LAMATY G, BESSIÈRE J.-M., MOLANGUI T. 2000. Aromatic Plants of
Tropical West Africa. X. Volatile Constituents of Zanthoxylum zanthoxyloides Lam.

77
Leaves and Fruit Pericarps from Benin. Journal of essential oil research. Volume 12 issue
one. Pages 33-35
MEYER A. 2012. PTA Phramazeutische Zeitung. Issue 11/2012. Archived athttp://ptaforum.pharmazeutische-zeitung.de/index.php?id=2782 (Access: 29. 12 2014)
NEUWINGER H D. 1997. Afrikanische Arzneipflanzen und Jagdgifte Chemie,Pharmakologie und Toxikologie. 2nd edition. Stuttgart. WVG mbH: pages 526, 807, 816 -827
NGONO NGANE R A, EBELLE ETAME R M, KOANGA MOGTOMO M, NDIFOR F,BIYITI L, BOUCHET P H, AMVAM ZOLLO P H. 2008. Fungicidal Effect and AcuteToxicity of Extracts from Zanthoxylum xanthoxyloides (Rutaceae). International Journalof infectious diseases. Volume 12: Page 282
NGANE A N, BIYITI L, ZOLLO P, BOUCHET P. 2000. Evaluation of antifungal activityof extracts of two Cameroonian Rutaceae: Zanthoxylum leprieurii Guill. et Perr. andZanthoxylum xanthoxyloides Waterm. Journal of Ethnopharmacology. 70(3): 335 - 342
NGASSOUM M, ESSIA-NGANG J, TATSADJIEU L, JIROVETZ, L, BUCHBAUER G,ADJOUDJI O. 2003. Antimicrobial study of essential oils of Ocimum gratissimum leavesand Zanthoxylum xanthoxyloides fruits from Cameroon. Fitoterapia 74: pages 284–287.
OGWAL-OKENG J, OBUA C, ANOKBONGGO W. 2003. Acute toxicity effects of themethanolic extract of Fagara zanthoxyloides (Lam.) root-bark. African Health Sciences3(3): pages 124-126
OSOBA O, ADESANYA, S, DUROSIMI M. 1989. Effect of Zanthoxylum xanthoxyloidsand some substituted benzoic acids on glucose-6-phosphate and 6-phosphogluconatedehydrogenases in Hbss red blood cells. Journal of Ethnopharmacology 27: pages 177–183.
78
OUATTARAA B, ANGENOTA L, GUISSOUB P, FONDUC P, DUBOISD J,FRÉDÉRICHA M, JANSENA O, HEUGENE J, WAUTERSA J, TITSA M.2004.LC/MS/NMR Analysis of isomeric divanilloylquinic acids from the root bark ofFagara zanthoxyloides Lam. Photochemistry Volume 65 Issue 8: pages 1145–1151
PREMPEH A, MENSAH-ATTIPOE J. 2008. Analgesic activity of crude aqueousextract of the root bark of Zanthoxylum xanthoxylodes. Ghana Medical Journal 42(2):pages 79 - 84
PREMPEH A, MENSAH-ATTIPOE J. 2008. Crude aqueous extract of the rootbark of Zanthoxylum xanthoxyloides inhibits white blood cells migration in acuteinflammation. Ghana Medical Journal 42(3): pages 117–119.
PREMPEH A, MENSAH-ATTIPOE J. 2009. Inhibition of vascular response ininflammation by crude aqueous extract of the root bark of Zanthoxylumxanthoxyloides. Ghana Medical Journal 43(2): pages 77–81.
QUEIROS E, HAY A E, CHAAIB F, VAN DIEMEN D, DIALLO D,HOSTETTMANNK. 2006. New and bioactive aromatic compounds from Zanthoxylum zanthoxyloides.Planta Medica 72: Pages 746 - 750
SCHMELZER , GURIB-FAKIM A. 2004. WHO Monographs on Selected MedicinalPlants. Volume 2. Wageningen, PROTA Foundations: pages 287 – 290
SCHMIDT R, LANG F, THEWS G. 2005. Physiologie des Menschen mitPathophysiologie. 29. Auflage. Springer, Heidelberg
WEHNER R, GEHRING W. 2007. Zoologie. 24th edition. New York, Stuttgart.Thieme: 582, 640-642, 683-684, 769

79
WIKIPEDIA: http://en.wikipedia.org/wiki/Quinine#History (Access: 29.1.2014)
PUBCHEM: https://pubchem.ncbi.nlm.nih.gov/compound/Fagaramide#section=Top
(access: 8.6.2016).

80
6.2. Graphic footage:
Figure 1: www.nathnac.org (Access: 8.1.2014)
Figure 2: LUCIUS R, LOOS-FRANK B. 1997.Parasitologie. First edition.Heidelberg,
Berlin. Spektrum Akademischer Verlag: Page 98, Picture 2.28
Figure 3 – 6: Pictures made by the project team (APPEAR 2014)
Figure 7: NEGI J, BISHT V, BHANDARI A, SINGH P, SUNDRIYAL1 R. 2011.
Chemical constituents and biological activities of the genus Zanthoxylum: A review.
African Journal of Pure and Applied Chemistry Vol. 5(12), pages 412-416.
Figure 8 & 9: PUBCHEM
https://pubchem.ncbi.nlm.nih.gov/compound/Fagaramide#section=Top (access: 8.6.2016)
Figure 10: OUATTARAA B, ANGENOTA L, GUISSOUB P, FONDUC P, DUBOISD J,FRÉDÉRICHA M, JANSENA O, HEUGENE J, WAUTERSA J, TITSA M. 2004.LC/MS/NMR Analysis of isomeric divanilloylquinic acids from the root bark of Fagarazanthoxyloides Lam. Photochemistry Volume 65 Issue 8: pages 1145–1151
Figure 11 – 24: Created by the author
All tables were created by the author.

81
6.3. Selected results of the photometric analysis
The results from the photometric analysis show a wide range of results, especially in thevarious solutions.
All tables were created by the author.
Appendix Table 1: Total Phenolics complete data
Sample TP(mg caffeic acid/g DW)
MEOH ETOH Aceton H2O1 EM_Oua_114 4,64 3,16 1,63 8,322 EM_Bbo_196 2,68 2,50 1,28 5,493 EM_Oua_118 2,17 1,48 1,20 5,084 EM_Oua_120 5,24 3,25 1,42 6,705 EM_Oua_122 64,29 5,08 2,00 11,286 EM_Oua_124 3,28 2,68 1,15 5,697 EM_Oua_126 3,08 1,88 1,59 6,508 EM_Oua_128 12,02 4,71 1,73 12,029 EM_Oua_130 3,98 3,29 1,87 4,8810 EM_Oua_132 2,77 2,08 1,01 9,2611 EM_Bbo_183 3,77 1,29 1,13 5,1512 EM_Bbo_185 2,06 1,73 1,67 5,8913 EM_Bbo_186 2,52 1,73 1,13 7,0414 EM_Bbo_189 13,17 5,01 1,32 No Result15 EM_Bbo_190 11,82 4,64 1,18 No Result16 EM_Bbo_193 2,13 1,30 1,28 6,3617 EM_Bbo_194 2,72 1,56 1,46 5,76A RH_ZXR_1 3,16 1,65 1,00 5,82B RH_ZXR_2 4,66 2,89 1,66 7,71C RH_ZXR_3 3,95 2,01 1,36 7,64D RH_ZXR_4 3,96 2,14 1,00 7,17E RS_ZXR_1 3,71 2,04 1,33 7,37F RC_ZXR_1 1,75 2,83 0,94 6,50G RC_ZXR_2 3,23 2,37 1,67 1,85H RC_ZXR_3 2,29 2,67 1,77 4,81

82
Appendix Table 2: Antioxidant Activity (DPPH) complete data
Sample DPPH (mg trolox/g DW)
MEOH ETOH Aceton H2O1 EM_Oua_114 4,77 5,91 1,62 1,932 EM_Bbo_196 2,83 4,06 1,19 2,113 EM_Oua_118 2,56 3,23 1,44 0,164 EM_Oua_120 4,69 5,25 1,95 4,105 EM_Oua_122 6,49 8,15 2,82 5,326 EM_Oua_124 3,16 5,75 1,59 2,367 EM_Oua_126 3,21 4,92 1,99 3,088 EM_Oua_128 5,91 7,16 2,35 1,589 EM_Oua_130 4,36 6,02 2,45 0,6610 EM_Oua_132 2,72 3,57 1,33 2,4511 EM_Bbo_183 3,63 3,07 1,81 3,8912 EM_Bbo_185 1,97 2,76 1,36 2,0813 EM_Bbo_186 2,04 2,85 1,43 1,8414 EM_Bbo_189 5,91 7,57 0,01 No Result15 EM_Bbo_190 6,06 7,82 0,47 No Result16 EM_Bbo_193 2,77 3,02 0,78 3,1717 EM_Bbo_194 2,53 3,17 1,01 2,73A RH_ZXR_1 5,29 1,22 5,12 2,90B RH_ZXR_2 6,93 6,97 1,81 2,69C RH_ZXR_3 6,83 6,94 7,19 2,23D RH_ZXR_4 6,87 7,32 6,15 0,56E RS_ZXR_1 6,23 6,00 5,52 3,02F RC_ZXR_1 4,36 2,43 4,92 3,65G RC_ZXR_2 5,43 5,84 5,94 2,01H RC_ZXR_3 5,37 6,15 1,42 3,40

83
Appendix Table 3: Fe3+ Reduction (Trolox) complete Data
Sample FRAP (mg Trolox/g DW)
MEOH ETOH Aceton H2O1 EM_Oua_114 2,96 0,89 3,48 14,412 EM_Bbo_196 4,57 4,45 2,97 4,183 EM_Oua_118 3,50 2,49 2,64 1,744 EM_Oua_120 3,17 1,16 3,31 23,375 EM_Oua_122 4,43 1,74 4,42 35,786 EM_Oua_124 1,93 3,40 3,30 21,277 EM_Oua_126 1,85 2,83 3,62 21,478 EM_Oua_128 3,27 1,86 3,87 37,299 EM_Oua_130 2,45 1,27 2,47 21,52
10 EM_Oua_132 4,12 2,97 2,47 22,1811 EM_Bbo_183 2,51 2,47 3,38 18,9012 EM_Bbo_185 3,58 3,09 3,00 16,1413 EM_Bbo_186 2,98 2,63 2,41 13,5614 EM_Bbo_189 7,02 2,35 1,31 No Result15 EM_Bbo_190 6,85 1,12 1,56 No Result16 EM_Bbo_193 3,54 2,56 2,25 18,0417 EM_Bbo_194 1,56 3,16 2,19 13,87A RH_ZXR_1 5,30 3,12 2,36 25,36B RH_ZXR_2 8,84 4,79 4,18 38,77C RH_ZXR_3 7,16 4,13 3,49 31,22D RH_ZXR_4 7,75 4,68 3,56 32,01E RS_ZXR_1 6,42 4,11 3,17 28,41F RC_ZXR_1 2,80 4,13 2,39 28,15G RC_ZXR_2 4,54 3,46 3,26 17,02H RC_ZXR_3 4,38 3,36 2,92 18,67

84
6.4. HPLC data:
Appendix Table 4: Fagaramide concentrations from market samples (1-17) andreference samples (A-H) (values in µg/ml)
MeOH EtOH Aceton DCM H201 82.46 68.29 79.43 89.16 6.992 125.88 68.29 126.45 189.05 23.283 53.32 33.41 43.48 48.04 4.964 47.07 47.93 45.15 58.52 12.765 271.25 62.93 227.61 270.71 50.246 382.80 347.93 312.35 288.49 96.407 345.46 293.08 362.50 439.32 72.728 388.29 379.76 307.89 377.54 69.339 427.58 426.89 334.08 415.61 70.1110 415.70 390.55 377.02 384.59 51.3111 93.74 54.44 97.36 84.63 10.8312 173.89 205.27 199.50 210.38 26.2313 168.82 149.70 133.34 128.53 26.8614 No Results No Results No Results No Results No Results15 No Results No Results No Results No Results No Results16 226.07 210.62 222.81 223.32 32.0217 45.76 45.50 43.55 43.17 9.57A 27.59 22.38 17.31 23.18 2.51B 98.54 84.60 123.03 114.67 13.70C 46.93 31.03 59.27 63.36 11.62D 44.67 35.29 35.66 39.58 10.22E 112.84 76.31 100.01 111.41 18.59F 16.03 55.97 23.41 60.80 16.19G 78.06 46.79 64.50 58.63 9.94H 28.51 24.94 62.53 27.04 5.51

85
Appendix Table 4: Sesamin concentrations from market samples (1-17) andreference samples (A-H) (values in µg/ml)
Me OH EtOH Aceton DCM H201 218.44 203.83 341.66 278.98 34.572 113.71 103.11 145.75 165.55 4.253 98.73 70.49 146.54 No Results No Results4 136.09 155.18 160.95 160.11 155.185 192.16 157.60 219.95 202.12 6.726 175.10 168.79 197.64 157.68 No Results7 211.36 205.01 371.76 305.71 6.118 389.11 243.07 212.83 240.22 5.669 144.28 110.40 148.19 No Results No Results10 230.52 209.45 224.91 169.75 No Results11 132.51 74.58 170.63 123.17 No Results12 276.13 No Results 364.66 354.82 4.5313 No Results No Results 288.96 249.95 4.2314 No Results No Results No Results No Results No Results15 No Results No Results No Results No Results No Results16 172.92 172.37 173.69 178.15 No Results17 245.62 238.52 299.46 223.30 No ResultsA 21.82 26.06 85.30 33.17 No ResultsB 44.47 48.34 167.00 53.89 No ResultsC 33.56 25.96 122.67 47.99 No ResultsD 42.80 82.08 94.51 37.92 No ResultsE 38.65 15.06 90.63 31.21 No ResultsF 7.11 23.76 51.90 39.21 No ResultsG 19.93 0.00 21.53 6.81 No ResultsH 45.14 32.36 46.83 41.33 No Results

86
7. Special Thanks:
A special thanks to Prof. Dr. Johannes NOVAK for his guidance and his highly valuedcontributions during the last period of my thesis. Especially his help with the statisticalanalysis was deeply appreciated.
A special thanks to Dr. Roland MEDA from the Université Polytechnique de Bobo-Dioulasso for his contribution regarding the creation of the mobile phase for the TLCmethod.