Embed Size (px)
Citation preview

Research ArticlePhytochemical and Safety Evaluation of Hydroethanolic LeafExtract of Tecoma stans (L.) Juss. ex Kunth
Christopher Larbie , Christabel Owusu Nyarkoh, and Clement Owusu Adjei
Department of Biochemistry and Biotechnology, Kwame Nkrumah University of Science and Technology, Kumasi, Ghana
Correspondence should be addressed to Christopher Larbie; [email protected]
Received 19 February 2019; Accepted 20 March 2019; Published 8 April 2019
Academic Editor: Armando Zarrelli
Copyright © 2019 Christopher Larbie et al. This is an open access article distributed under the Creative Commons AttributionLicense, which permits unrestricted use, distribution, and reproduction in any medium, provided the original work is properlycited.
Tecoma stans (yellow bell) is a popular ornamental plant mostly found in the tropical regions. It is reported to have significantpharmacological activity and has gained attention by natives of various cultures. This study focused on the phytoconstituentsscreening, antioxidant activity, and heavy metal analysis as well as the acute and subchronic toxicity of the hydroethanolicleaf extract (TSE) using standard methods. The presence of flavonoids, alkaloids, cardiac glycosides, saponins, coumarins, andterpenoids in the raw leaf of the plant was observed while the hydroethanolic extract contained coumarins, saponins, cardiacglycosides, and flavonoids. The DPPH percentage scavenging activity of the crude extract was 64.32% while the fractions, ethylacetate (55.26%), methanol (60.72%), and hydro (36.97%.), gave varying activities.TheUV-Vis and FT-IR indicated the presence ofalcohols, phenols, alkanes, alkenes, carbonyls (general), aliphatic amines, aromatics, ketones, ethers, esters, carboxylic acids, alkylhalides, saturated aliphatic acids, 1∘ and 2∘ amines, amides, and 𝛼,𝛽-unsaturated aldehydes. The heavymetal analysis showed a highlevel of iron (Fe) and zinc (Zn) in the raw leaf. The median acute toxicity (LD
50) of the extract was determined to be <5000mg/kg
body weight in mice. Subchronic use for 28 days resulted in significant weight gain, reduction in platelet levels, decrease in WBCs,and increase in blood glucose compared to the normal. TSE caused no adverse effects on vital organs. No mortality was recorded.The hydroethanolic extract of T. stans could therefore be considered safe in moderate doses.
1. Introduction
Plants have been used for the treatment of several diseasesfor so many years now before the introduction of orthodoxdrugs which have their bioactive constituents synthesizedfrom plants with modifications. Antibacterial, antifungal,antimicrobial, and anticancer properties are all found asa result of the secondary metabolites of plants [1–3]. Inrecent years, there has been an increasing utilisation ofmedicinal plant because of the conviction that these plantsare characteristically innocuous. Be that as it may, numerousadverse responses to medicinal plants have been reported,and with the worldwide ascent in their use, the safety andefficacy of medicinal plants have become a general concern.As indicated by WHO, out of the numerous plants utilisedfor their medicinal purposes all over the world, just a fewhave been examined scientifically [4]. This calls for thoroughassessment of medicinal plants to guarantee their quality,efficacy, and safety preceding their acceptance and use [5].
Tecoma stans (L.) Juss. exKunth, commonly knownas yel-low bell, belongs to the family Bignoniaceae and is distributedworldwide, mostly growing in the tropical and subtropicalcountries. Phytochemical studies on the plant have shownthe presence of alkaloids, tecomanine, iridoid glycosides,lapachol, and other primary and secondary plant metabolitessuch as sugars, triterpenoids, sterols, and phenolics. Allthese compounds have been identified in the whole plant atdifferent concentrations [6, 7]. Almost each part of the plantis of therapeutic value. Its leaves show anthelmintic activity,antispasmodic effect, antibacterial activity, anticancer activ-ity, and wound healing property [8, 9]. Flowers showedantidiabetic and anticancer activity while roots showedantibacterial activity. Aerial parts showed antioxidant whilethe bark possesses wound healing activity [10].
Nonetheless, the toxicity and efficacy of the leaf extracthave not been scientifically evaluated. Primary studies in thismanner are required to help in clinical work as a gauge forfuture research. The current study focused on determining
HindawiEvidence-Based Complementary and Alternative MedicineVolume 2019, Article ID 7417624, 12 pageshttps://doi.org/10.1155/2019/7417624
2 Evidence-Based Complementary and Alternative Medicine
the phytochemical constituents, antioxidant activity, heavymetal concentration, and UV-Vis and FT-IR spectra of thehydroethanolic leaf extract of T. stans cultivated in Ghana aswell as its acute and subchronic toxicity in animals.
2. Materials and Methods
2.1. Plant Extraction and Fractionation. The leaves of T.stans were collected from the lawns behind the ChemistryBuilding, KNUST Kumasi Campus, before 9:00 am on the1st and 8th of September, 2017. The leaves were washed andshade-dried for 3 weeks and milled coarsely. A 500 g amountof plant material was extracted twice by percolation using 5 Lof 50% of hydroethanolic solution (50:50 v/v ethanol: water).The resulting extracts were pulled together and concentratedusing Rotary evaporator at 60∘C done under pressure. Theextract was freeze-dried to obtain the powdered form of theT. stans extracts (TSE).
2.2. Sequential Fraction of the Extract. The crude extract wassubjected to sequential fractionation with organic solventsof increasing polarity: petroleum ether, ethyl acetate, andmethanol. These solvents were used in the fractionation ofTSE using a separating funnel. About thirty (30) grams ofTSE was weighed into the separating funnel and 300mL ofthe solvent was added and shaken vigorously and extractedfor 48 hours. The residue was taken out, dried to evaporatethe solvent, and then extracted with subsequent solvent. Theresidue left was labelled as hydro fraction. The four fractionsobtained were concentrated and air-dried. They were desig-nated as petroleum ether, ethyl acetate, and methanolic andhydroethanolic fractions.
2.3. Phytochemical Screening. The presence of the secondarymetabolites of the T. stans extract which includes glycosides,tannins, coumarins, saponins, flavonoids, sterols, and ter-penoids was tested for using standard methods describedpreviously [11–13].
2.4. Determination of DPPH Scavenging Activity. Theantioxi-dant activity of the TSEwas examined using scavenging effectof the stable DPPH free radical [14]. The plant extracts werediluted using twofold dilution to obtain concentrations of 0-10mg/mL. DPPH of 0.05mM was prepared with methanolas blank. A volume of 100𝜇L of DPPH was added to 100 𝜇Lof each extract. Ascorbic acid was used as the standard withconcentrations ranging from 0 to 10mg/mL and distilledwater as the blank. Negative controls were included. After20 minutes of incubation the absorbance was measuredusing a Plate reader (Synergy H1, USA) at a wavelength of517 nm. Triplicate experiments were performed. The radicalscavenging activity of the stem and leaf extractswas expressedas percentage of inhibition using the formula:
Percent (%) inhibition of DPPH activity
=𝐴𝐵−𝐴𝐴
𝐴𝐵× 100
(1)
where AA and AB represent the absorbance values of thetest and of the blank, respectively. A graph of percentageof inhibition versus concentration was used to determinethe concentration of the sample required for 50% inhibition(EC50).
2.5. Determination of Total Phenolic Content (TPC). The totalphenolic content of the fractions was assessed by Folin-Ciocalteu (FC) procedure [15] with some modifications.Gallic acid was used as the standard. Approximately, 50 𝜇Lof extract was mixed with 3mL of distilled water and 250𝜇Lof FC reagent. The mixture was allowed to stand for 5minutes, and then 750𝜇L of 20% Na
2CO3 was added. Theresulting mixture was vigorously vortexed for 2min and thenincubated for 30min at room temperature. The absorbanceof the solution was measured at 760 nm using a UV-VisSpectrophotometer (Shimadzu 1201, Japan). All determina-tions were performed in triplicate. Gallic acid (0.2mg/mL,0.4mg/mL, 0.6mg/mL, 0.8mg/mL, and 1mg/mL) was usedas standard to prepare a calibration curve, from whichpolyphenolic content in terms of the gallic acid equivalentin one gram of each extract was determined. The regressionequation y = 0.1x + 0.0032 with a regression factor R2 = 0.9976was obtained. The total phenolic content was calculated fromthe calibration curve and final results were expressed as mgGAE/100g DM.
2.6. Determination of Total Flavonoid Content (TFC). Thealuminium chloride colorimetric assay method [16] wasemployed to evaluate total flavonoid content (TFC) usingquercetin as standard. An aliquot of 500𝜇L of extract andfractions was mixed with 1.5mL of 99.9% ethanol (EtOH),100𝜇l of 1M potassium acetate, 100𝜇L of 10% aluminiumchloride, and 3mL of distilled water.Themixture was shakenvigorously and left to stand in the dark at room temperature.The resulting mixtures were incubated for 30min at roomtemperature, and corresponding absorbance wasmeasured at415 nm. All determinations were carried out in triplicate. Astandard calibration curve was constructed using quercetinstandard solutions of 20, 40, 60, 80, 100, and 120 𝜇g/mL.500𝜇L of each standardwas treated in the samemanner as thesamples above, and a calibration linear regression equation y= 0.0058x - 0.0032 was generated with R2 = 0.9951. Flavonoidcontent of each extract was determined from the curve andthe results were recalculated and expressed as 𝜇g QE/100gDM.
2.7. Determination of Total Tannins (TT). The amount oftannins in plant extract and fractions was determined byFolin-Ciocalteu method with slight modifications [15]. 100uL of the sample extract and fractions was added to 5mL ofdistilled water, 500𝜇L of Folin-Ciocalteu reagent, and 1mL of35%Na
2CO3 solution. Themixture was shaken well and keptat room temperature for 30min. A set of reference standardsolutions of gallic acid (0.2, 0.4, 0.6, 0.8, and 1mg/mL)were prepared in the same manner as described earlier.Absorbance for test and standard solutions was measuredagainst the blank at 725nm with an UV/Visible Spectropho-tometer. The total tannins content was determined from
Evidence-Based Complementary and Alternative Medicine 3
calibration curve: y = 0.1173x + 0.0086, R2 = 0.9952, and theresults expressed tannin content in terms of mg of GAE /100gDM.
2.8. Heavy Metal Analysis. About 1 g of each of the extractswas weighed into a 50ml digestion tube. The samples weresubjected to wet digestion. One mL of H2O, 2mL of HCl,5mL of 1:1 HNO3:HClO4, and 2mL of H2SO4 were addedand allowed to stand for 20mins. A temperature of 150∘Cwas regulated to allow the samples to be heated in a digestionblock. The digested samples were cooled and further dilutedwith 50mL of distilled water. The digests were then analysedfor the levels of heavy metals using Atomic AbsorptionSpectrophotometer (AAS).Themetals included lead, copper,cadmium, nickel, zinc, and iron.
2.9. UV-VIS and Fourier-Transformed Infrared Spectropho-tometry (FT-IR-S) Analyses. About 10mg/mL of fractions ofTSE were diluted in a ratio 1:10 using respective solventsand were further analysed at a wavelength ranging from200 to 450 nm using a double beam Ultraviolet-Visible Spec-trophotometer (Perkin Elmer, USA). The peaks showing themaximum wavelength were recorded. The functional groupanalyses were performed on the fractions using the FT-IR(Perkin Elmer, USA).
2.10. Animals. Albino rats (120-150 g) and mice (20-25 g)were used for the study. They were obtained from the animalfacility of the University of Ghana Medical School, KorleBu, Ghana, and kept at the animal holding facility of theDepartment of Biochemistry and Biotechnology, KNUST,Kumasi. The animals were kept in aluminium cages beddedwith sawdust. The animals had free access to feed (Mash,Agricare, Kumasi, Ghana) and freshly prepared distilledwater ad libitum prior to commencement of study to acclima-tize to laboratory conditions. They were marked exclusivelyon their tails using permanentmarkers for easy identification.All studies were performed according to the guidelinesof the Committee for the Purpose of Control and Super-vision of Experiment on Animals (CPCSEA, New Delhi,India) and Guide for Care and Use of Laboratory Animals[17].
2.11. Acute Oral Toxicity Assessment. Albino mice of eithersexeswere used for the acute oral toxicity studies.The animalswere put into five groups with three animals each: onecontrol group and four treated groups. After an overnightfast, the control group received sterile distilled water whileeach treated group received 100, 1000, 2500, and 5000mg/kgb.wt administered orally with the aid of a feeding needleconnected to syringe at stated doses dissolved in appropriatevolume of sterile distilled water. Doses were selected basedon the fixed dose method [18].The animals were observed forsigns of toxicity andmortality for the first critical 4 hours andthereafter daily for 7 days.The oral median lethal dose (LD
50)was calculated as the geometric mean of dose that caused 0%and 100% mortality, respectively. This was used to guide theselection of three doses (100, 250, and 500mg/kg b.wt) forsubchronic toxicity studies [19].
2.12. Subchronic Toxicity Studies. The subchronic toxicitystudies were carried out using methods previously described[19]. Briefly, 12 males and 12 female albino rats were dividedinto 4 groups with 3 rats in each group. A 12-hour fast wasallowed before the start of treatment. For each sex, group Iserved as the vehicle control and received 1mL/g b.wt freshlyprepared distilled water daily while groups II, III, and IVwereadministered 100, 250, and 500mg extract /kg b.wt. daily inappropriate volume of distilled water for 28 days.The animalswere treated with the extract once daily and observed forsigns of toxicity.
2.13. Effect of Treatment on Body Weight. Rats were weighedon the first day (D0) and, thereafter, at the end of every fourdays using amass balance.The percent change in bodyweightwas calculated using the formula
Percent Change in Body Weight
=𝑊𝑒𝑖𝑔ℎ𝑡
𝑛−𝑊𝑒𝑖𝑔ℎ𝑡
0
𝑊𝑒𝑖𝑔ℎ𝑡0
× 100%(2)
where Weightn is the weight on D4, D8, D12, D16, D20, D24,and D28 and Weighto is the weight on the first day (D0).
2.14. Effect of Treatment on Haematological Parameters ofAnimals. At the end of the experiment period, animals werefasted overnight and exposed to light ether anaesthetization.Incisions were then made at the cervical regions using sterileblade and blood collected into EDTA tubes for haematologyanalyses using Sysmex Haematology System (USA). Theparameters, haemoglobin concentration (HGB), red bloodcell (RBC) count, platelet count, white blood cells, lym-phocytes, haematocrit, mean corpuscular volume (MCV),mean corpuscular haemoglobin (MCH), mean corpuscularhaemoglobin concentration (MCHC), red cell distributionwidth (RDW), plateletcrit, platelet distributionwidth (PDW),and platelet larger cell ratio (P-LCR), were determined.
2.15. Effect of Treatment on Some Biochemical Parameters ofAnimals. Blood was collected into gel activated tubes, leftto clot, and centrifuged for 10 minutes at 3500 rpm. Theserumobtainedwas analysed for the levels of AlanineAmino-transferase (ALT), Aspartate Aminotransferase (AST), totalbilirubin, total cholesterol (TC), high density lipoproteins(HDL), low density lipoproteins (LDL), Triglycerides (TG),creatinine, urea, and fasting blood glucose using the SelectraE (Vital Scientific, Japan) and reagents from ELITECH(France).
2.16. Effect of Treatment on Absolute and Relative OrganWeights. Major body organs which include liver, kidney,heart, stomach, spleen, lung, testes (male), and uterus(female) were excised and washed with buffered saline solu-tion, blotted dry, observed macroscopically, and weighed toobtain the Absolute Organ Weight (AOW). The Relative
4 Evidence-Based Complementary and Alternative Medicine
Table 1: Phytoconstituents of raw leaf and hydroethanolic extract of T. stans.
Phytoconstituents Raw Leaf TSEGlycosides + +Tannins + +Flavonoids + +Alkaloids + -Saponins + +Coumarins + +Sterols - -
DPPH Scav. Activity (p<0.0001)
Extracts
% S
cave
ngin
g Ac
tivity
TLC TLE TLM TLH0
20
40
60
80
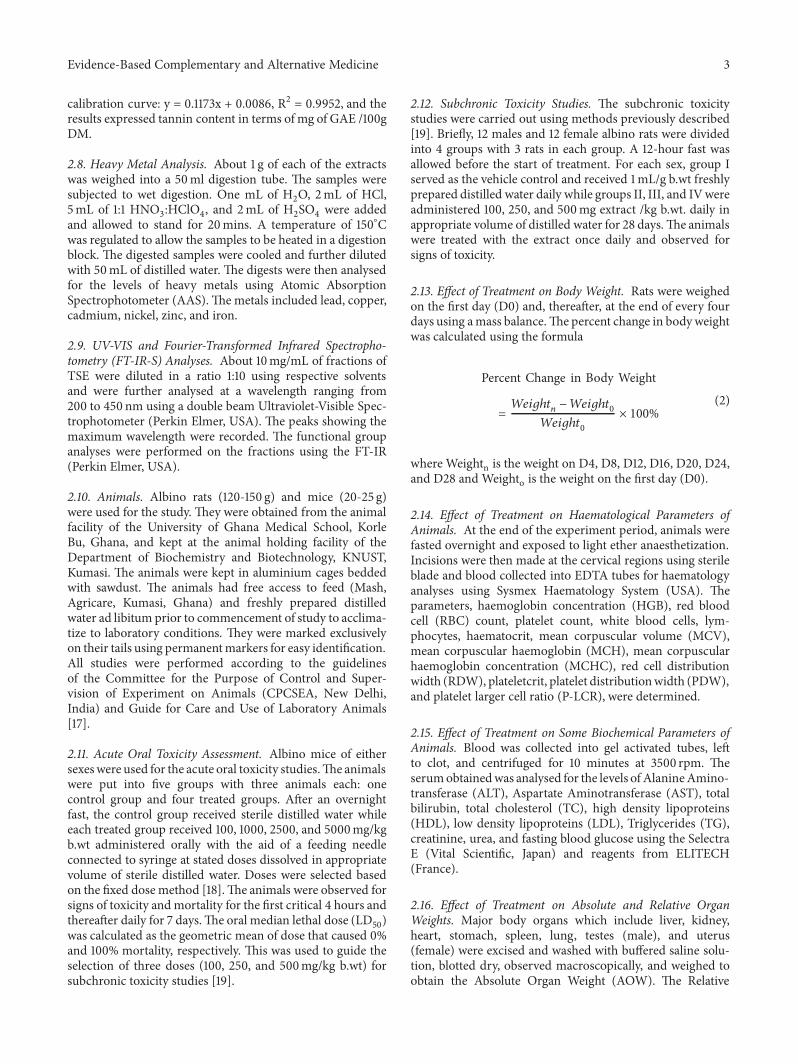
Figure 1: Percentage scavenging activity of crude (TLC), ethylacetate (TLE), methanol (TLM), and hydro (TLH) fractions of T.stans.
Organ Weight of each organ was calculated using the follow-ing formula.
Relative Organ Weight
=𝐴𝑏𝑠𝑜𝑙𝑢𝑡𝑒 𝑂𝑟𝑔𝑎𝑛 𝑊𝑒𝑖𝑔ℎ𝑡
𝐵𝑜𝑑𝑦 𝑊𝑒𝑖𝑔ℎ𝑡 𝑎𝑡 𝑆𝑎𝑐𝑟𝑖𝑓𝑖𝑐𝑒× 100%
(3)
2.17. Statistical Analysis. Experimental results were expressedasmean± SEM.Differences inmeanwere assessed using one-way ANOVA followed by the Tukey’s multiple comparisontest at significance level of p<0.05. All data was evaluatedusing the GraphPad Prism 6 for Windows.
3. Results
3.1. Phytochemical Constituents of T. stans. The presence (+)or absence (-) of phytochemical constituents of the raw plantmaterial and the hydroethanolic extract of the leaves is shownin Table 1. The plant and extract were absent with sterols.
3.2. DPPH Percentage (%) Scavenging Activity of Fractions.Figure 1 shows the DPPH scavenging effect of the crudeextract and fractions. The crude extracts (TLC) had thehighest activity while the hydro fractions (TLH) had the leastpercentage.
3.3. Total Phenols, Tannins, and Flavonoid of T. stans CrudeExtract and Fractions. Figure 2 shows the total phenol, tan-nins, and flavonoid content of crude extract and fractions ofT. stans. This was based on the standard curves generated forspecific standards. The ethyl acetate fraction was the richestin phenols, tannins, and flavonoids while the methanol wasthe lowest.
3.4. Heavy Metal Analysis. Figure 3 shows the metal contentof raw plant material and crude extract. The raw leaves gave ahigh concentration of iron (Fe) as compared to the extract.The zinc in raw leaves also gave a high concentration ascompared to the extract. Nickel (Ni) and lead (Pb) were belowdetection limit (0.0001 ppm).
3.5. UV-VIS Spectrophotometry. The intensity and peakof the fractions of T. stans are as shown in Figure 4. Thehydro fraction had four (4) intense peaks (697.4 nm–0.4225;322.6nm–0,6033; 327.9 nm–0,6406; 285.4 nm–0.7860); thepetroleum ether fraction had 5 peaks (247.4 nm–0.8114;204.0 nm–0.6758; 201.9 nm–0.6542; 212.2 nm–0.6264;205.9 nm–0.6062), and the methanol extract had 3 peaks(287.9 nm–0.5222; 204.0 nm–1.658; 202.0 nm–1.680).
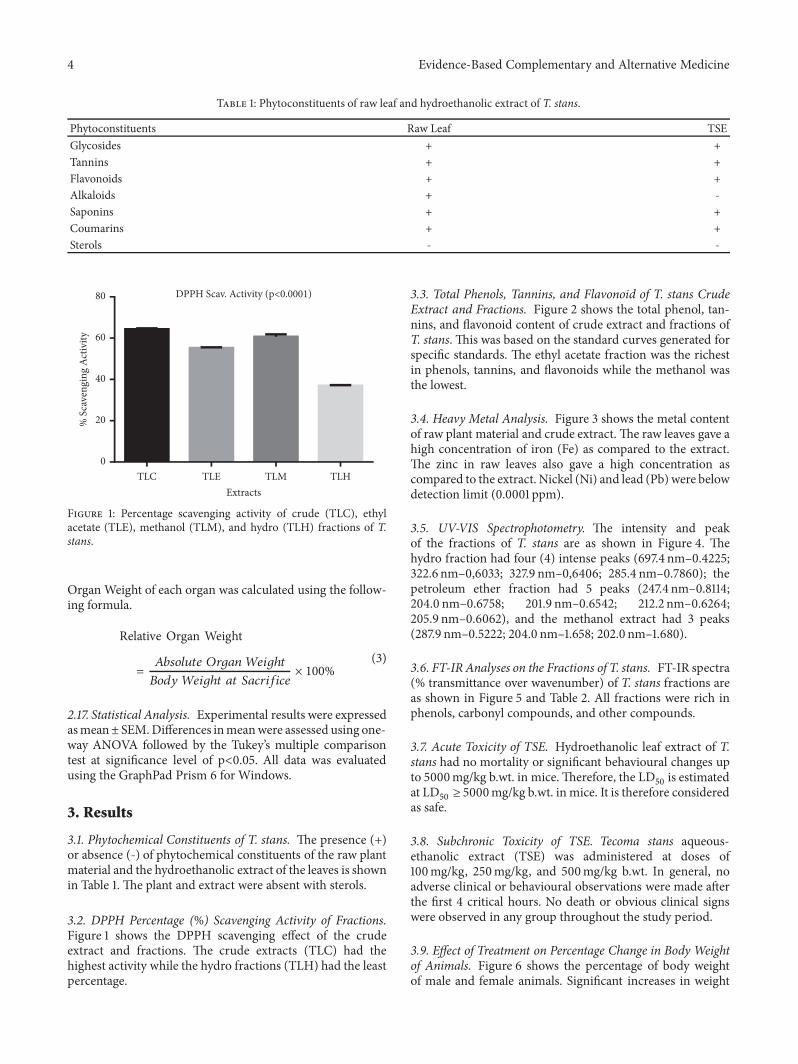
3.6. FT-IR Analyses on the Fractions of T. stans. FT-IR spectra(% transmittance over wavenumber) of T. stans fractions areas shown in Figure 5 and Table 2. All fractions were rich inphenols, carbonyl compounds, and other compounds.
3.7. Acute Toxicity of TSE. Hydroethanolic leaf extract of T.stans had no mortality or significant behavioural changes upto 5000mg/kg b.wt. in mice.Therefore, the LD
50 is estimatedat LD50 ≥ 5000mg/kg b.wt. in mice. It is therefore consideredas safe.
3.8. Subchronic Toxicity of TSE. Tecoma stans aqueous-ethanolic extract (TSE) was administered at doses of100mg/kg, 250mg/kg, and 500mg/kg b.wt. In general, noadverse clinical or behavioural observations were made afterthe first 4 critical hours. No death or obvious clinical signswere observed in any group throughout the study period.
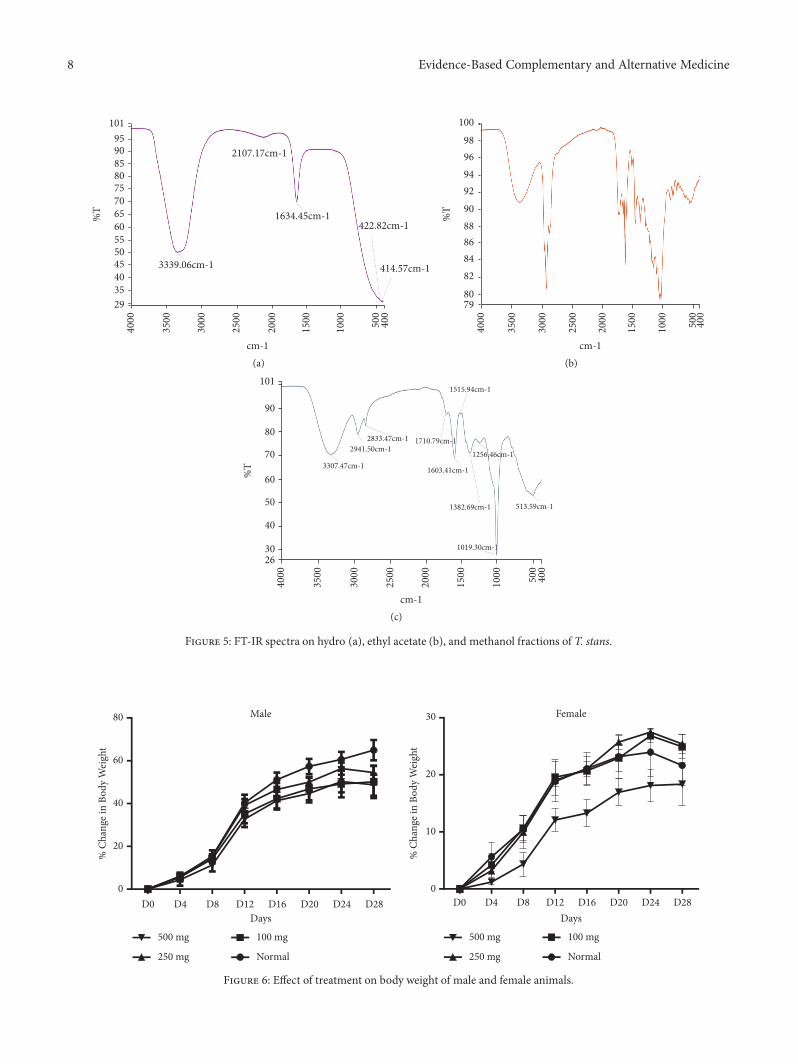
3.9. Effect of Treatment on Percentage Change in Body Weightof Animals. Figure 6 shows the percentage of body weightof male and female animals. Significant increases in weight

Evidence-Based Complementary and Alternative Medicine 5
Phytochemical
mg
GA
E
Total Phenols Total Tannins0
2
4
6
8
10
12 p<0.0001 p<0.0001 Total Flavanoid (p<0.0001)
Extracts
mg
QE
Crude EthylAc MetOH Hydro0
50
100
150
200
250
Crude
EthylAc
MetOH
Hydro
Crude
EthylAc
MetOH
Hydro
Figure 2: Total phenols, tannins, and flavonoid content of crude and fractions of T. stans.
T stans
Metals
Con
c (m
g/L)
Fe Zn Ni Cu Pb0
1
2
3
4
Leaves Raw
Leaves Extract
∗∗∗∗
∗∗∗∗
Figure 3: Heavy metal analysis of raw leaves and crude.
was observed at all doses from Day 0 to Day 28 in bothmale and female rats. Throughout the study, there was nosignificant change in male rats as compared with the normal.Female rats administered 250mg/kg b.wt. showed the highestincrease in body weight compared to the normal followed bythe 100mg/kg b.wt while there were no significant change inthe 500mg/kg b.wt.
3.10. Effect of Treatment on Relative Organ Weight. Table 3shows the effect of treatment on Relative Organ Weight ofanimals. No significant changes were observed in all organsat all doses among male and female rats.
3.11. Effect of Treatment on Haematological Indices of Animals.From Table 4, there was a significant increase in WBC countin male animals treated with 500mg (p<0.01) compared with
the other groups and a significant decrease in WBC count infemale rats treatedwith 100 mg (p<0.05) and 250mg (p<0.01).Also, significant decrease in %PCT in male rats was observedat 250mg (p<0.05) and significant decrease in P-LCR infemale rats at 100mg (p<0.05) dose.
3.12. Effect of Treatment on Biochemical Parameters of Ani-mals. As shown in Table 5, significant increase in AST levelswas observed at 500mg (p<0.01) in the male rats andAST/ALT ratio showed a significant increase in female ratsat 500mg (p<0.05) compared to the normal. Significantincrease in TBil was observed at 500mg (p<0.001) and IBil at500mg (p<0.01). Creatinine increased significantly at 250mg(p<0.01) compared to the normal in both male and femalerats. FBG showed significant increase in male rats at 500mg(p<0.01), and a significant increase was observed in femalerats administered 500mg (p<0.001) compared to the normal.
4. Discussion
Awareness of the chemical components of plants is importantfor the discovery of therapeutic bioactive compounds foundin medicinal plant as well as the synthesis of new drugs [20].The presence of glycosides, tannins, flavonoids, alkaloids,saponins, and coumarins in the raw leaves and extract canhave synergistic effect influencing the efficacy of the extractto produce a desired or intended pharmacological effectreported [21]. This was further confirmed by the UV-Visand FT-IR spectra, showing varying functional groups in thefractions
DPPH percentage scavenging activity is the percentagefor a compound to mop out free radicals released in a body.This is normally calculated to find out the potency of aplant material in relation to its antioxidant activity. Basedon the observations, the crude hydroethanolic extract hadthe highest scavenging activity (64.32%), thus contributing to

6 Evidence-Based Complementary and Alternative MedicineA
2.6
2.4
2.2
2.0
1.8
1.6
1.4
1.2
1.0
0.8
0.6
0.4
0.2−0.0
−0.1
nm200 300 400 500 600 700
(a)
A
nm200 300 400 500 600 700
0.8
0.8
0.7
0.6
0.5
0.4
0.3
0.2
0.1
−0.0
(b)
A
nm200 300 400 500 600 700
1.7
1.6
1.4
1.2
1.0
0.8
0.6
0.4
0.2
−0.0
−0.0
(c)
Figure 4: UV-VIS spectrum of hydro (a), ethyl acetate (b), and methanol (c) fraction of T. stans.
the ameliorative effect described for some disease conditions[22]. This scavenging activity could be caused by the phenolsand flavonoid measured in the extracts
The accumulation of heavy metals has been reported insome medicinal plants [23–25], which could explain someassociated toxicity. To this effect, some heavy metals wereassessed in the extract. Nickel and lead were not detected;however, the extract was rich in iron and zinc that couldenhance some biochemical effects.
Acute toxicity study provides initial information on themode of toxic action of an agent, acts as the basis forclassification and labelling, and helps in deciding the doseof novel compounds in animal studies. In the current study,the LD50 ≥ 5000mg/kg b.wt was observed, indicating theextract to be safe at the acute level. Subchronic toxicityprovides information on dosage level safe for administrationand targeted organ toxicity and identifies observable adverseeffect that may affect the average lifespan of experimentalanimals. Consequently, in this study, TSE was evaluated inrats at doses 100, 250, and 500mg/kg b.wt. for 28 days. Thebody weight changes, a sensitive indicator of general health
status of animals [26], was observed. TSE did not interferewith the normal metabolism of animals but rather improvedappetite and food utilisation.
Organweight determination in subchronic toxicity servesas a sensitive indicator of chemical changes to organs [27]. Italso indicates which organs are being targeted in case of anymajor toxicities as well as accumulation of the test substance[28]. In this study, no serration or damages were observed onharvested organs indicating any subchronic toxicity on theorgans observed.
The haematological parameters can be used to determinethe blood relating functions of plant extract. The TSE indi-cated a nonsignificant difference on the RBC count and itsindices except a significant rise in the %HCT in the female at250mg. This may reflect an absolute increase in the numberof erythrocytes or a decrease in plasma volume in conditionssuch as dehydration [29]. In general, it can be said that theresults obtained do not affect erythropoiesis, morphology,or osmotic fragility of red blood cells [30]. In the WBCs,the male rats showed significant increase in WBC level at500mg indicating an increase in immunity when compared

Evidence-Based Complementary and Alternative Medicine 7
Table 2: Functional groups present in fractions of T. stans.
Wave numbers (cm−1) Y (%T) Bond AssignmentsHydro fraction3339.06 50.56 O-H stretch, H bonded Alcohols, phenols2107.17 95.75 C≡C stretch Alkynes1634.45 70.36 C=O stretch Carbonyls (general), 𝛼, 𝛽-unsaturated aldehydes, ketones422.82 31.11 Unknown Unknown414.57 31.14 Unknown UnknownEthyl acetate fraction3373.96 90.79 O-H stretch, H-bonded Alcohols, phenols2926.73 80.64 O-H stretch Carboxylic acids2872.58 87.17 N-H stretch 1∘, 2∘ amines, amides1726.16 89.32 C=O stretch 𝛼,𝛽-aldehydes, ketones, saturated aliphatic acids1655.64 89.42 C=C stretch Alkenes1457.11 88.34 C-H bend Alkanes1377.97 88.37 Unknown Unknown1215.54 85.51 C-H wag Alkyl halides1153.59 83.07 C-O stretch Alcohols, carboxylic acids, esters, ethers837.67 91.50 C-Cl stretch Alkyl halides773.57 92.13 C-Cl stretch Alkyl halides556.54 90.63 C-Br stretch Alkyl halidesMethanol fraction3307.47 70.71 O-H stretch, free hydroxyl Alcohols, phenols2941.5 78.95 O-H stretch Carboxylic acids2833.47 82.61 C-H stretch Alkanes1710.79 87.57 C=O stretch 𝛼.𝛽-unsaturated aldehydes, ketones.1603.41 69.06 C-C stretch (in ring) Aromatics1515.94 87.45 N-O asymmetric stretch Nitro compounds1382.69 71.15 C-H rock Alkanes1256.46 75.39 C-N stretch Aliphatic amines1019.30 27.61 C-O stretch Alcohols, carboxylic acids, esters, ethers.513.59 52.92 C-Br stretch Alkyl halides
Table 3: Effect of TSE on the Relative Organ Weight (Row) of Animals.
Normal 100mg 250mg 500mgMaleLiver 3.18±0.22 3.02±0.07 3.08±0.16 3.25±0.05Kidneys 0.55±0.02 0.58±0.03 0.56±0.04 0.55±0.01Testes 1.16±0.01 1.27±0.08 1.17±0.01 1.04±0.10Lung 0.63±0.07 0.82±0.02 0.77±0.07 0.68±0.02Stomach 0.60±0.03 0.69±0.09 0.58±0.02 0.61±0.01Heart 0.32±0.02 0.34±0.02 0.32±0.03 0.30±0.01Spleen 0.19±0.01 0.18±0.00 0.18±0.01 0.19±0.01FemaleLiver 2.95±0.10 3.16±0.11 2.78±0.09 2.83±0.11Kidneys 0.58±0.00 0.58±0.00 0.58±0.01 0.61±0.02Lung 0.73±0.07 0.84±0.01 0.81±0.15 0.55±0.04Stomach 0.65±0.03 0.63±0.04 0.63±0.01 0.55±0.02Heart 0.35±0.02 0.31±0.01 0.34±0.01 0.33±0.10Uterus 0.26±0.03 0.27±0.04 0.24±0.02 0.19±0.02Spleen 0.23±0.01 0.23±0.01 0.22±0.01 0.20±0.01Mean±SEM (n=3).
8 Evidence-Based Complementary and Alternative Medicine
%T
cm-1
101
95
90
85
80
75
70
65
60
55
50
45
40
35
29
4000
3500
3000
2500
2000
1500
1000
500
400
3339.06cm-1
2107.17cm-1
1634.45cm-1422.82cm-1
414.57cm-1
(a)
%T
cm-1
4000
3500
3000
2500
2000
1500
1000
500
400
100
98
96
94
92
90
88
86
84
82
80
79
(b)
%T
cm-1
4000
3500
3000
2500
2000
1500
1000
500
400
101
90
80
70
60
50
40
30
26
3307.47cm-1
2941.50cm-12833.47cm-1 1710.79cm-1
1603.41cm-1
1515.94cm-1
1256.46cm-1
1382.69cm-1
1019.30cm-1
513.59cm-1
(c)
Figure 5: FT-IR spectra on hydro (a), ethyl acetate (b), and methanol fractions of T. stans.
Male
% C
hang
e in
Body
Wei
ght
D0 D4 D8 D12 D16 D20 D24 D280
20
40
60
80 Female
DaysD0 D4 D8 D12 D16 D20 D24 D28
0
10
20
30
Normal
100 mg 500 mg
250 mg Normal
100 mg 500 mg
250 mg
Days
% C
hang
e in
Body
Wei
ght
Figure 6: Effect of treatment on body weight of male and female animals.

Evidence-Based Complementary and Alternative Medicine 9
Table 4: Effect of TSE on haematological parameter of animals.
Normal 100mg 250mg 500mgMaleWBCx103/𝜇L 6.10±0.50 5.83±0.92 6.03±0.35 8.57±0.87∗ ∗ ∗∗RBCx106/𝜇L 8.09±0.46 7.78±0.19 8.24±0.17 8.06±0.17HGB g/dL 14.10±0.66 14.07±0.12 14.83±0.17 14.47±0.20HCT % 58.26±3.44 56.53±1.56 60.50±0.75 57.67±1.03MCV/ Fl 72.03±0.74 72.60±0.21 73.47±1.36 71.57±0.32LYM% 61.20±3.91 62.77±0.84 66.93±0.92 65.26±1.46MCHC g/Dl 24.23±0.35 24.93±0.72 24.50±0.40 21.70±3.36RDW-SD/Fl 43.80±1.27 47.66±3.25 46.87±0.95 44.33±1.17MCH pg 17.43±0.20 18.10±0.49 18.03±0.20 15.53±2.47RDW-CV/% 15.16±0.29 16.76±1.64 16.03±0.38 15.43±0.42PDW/Fl 10.23±0.23 9.87±0.40 10.23±0.75 10.07±0.14MPV/Fl 8.40±0.11 8.20±0.17 8.30±0.42 8.23±0.09P-LCR/% 13.56±1.01 12.13±1.02 13.67±2.67 13.03±0.28PLT 10∧3/𝜇l 1058.67±80.76 969.33±163.24 750.00±62.55 1014.00±189.94PCT/% 0.89±0.06 0.79±0.13 0.62±0.03∗ 0.84±0.16FemaleWBC × 10∧3/𝜇l 7.30±0.30 4.97±0.33 5.03±0.35 7.40±0.26∗ ∗ ∗∗RBC × 10∧6/𝜇L 7.20±0.06 7.35±0.06 7.73±0.06 7.16±0.13HGB g/Dl 13.43±0.09 13.60±0.26 14.03±0.26 13.30±0.36HCT % 52.07±0.88 53.17±0.82 56.53±1.20∗ 50.97±1.57MCV/ Fl 72.30±0.60 72.33±0.49 73.16±1.69 71.13±0.96LYM% 63.47±0.48 66.47±1.53 64.40±0.44 66.83±0.87RDW-SD/Fl 39.83±0.75 41.07±1.88 41.17±1.22 39.33±0.39MCH pg 18.63±0.12 18.47±0.23 18.17±0.34 18.57±0.17P-LCR/% 11.90±0.56 10.07±0.39 12.70±1.00 13.27±0.75RDW-CV/% 13.40±0.25 13.90±0.87 13.67±0.17 13.43±0.37PDW/Fl 9.83±0.19 9.33±0.17 10.03±0.19 10.17±0.23MPV/Fl 8.13±0.09 7.83±0.03 8.20±0.15 8.23±0.09PLT 10∧3/𝜇l 1323.00±156.52 1038.67±73.49 1105.33±105.49 1083.67±139.71PCT(%) 0.81±1.20 0.73±0.79 1.05±0.93 0.76±1.15Mean±SEM (n=3); statistical significance; ∗p<0.5, ∗ ∗ ∗∗p<0.001 compared among the treated and normal groups.
to the other groups and the normal. Also, female rats showedsignificant decrease in WBCs at 100mg and 250mg doseswhen compared to the 500mg and the normal. This on theother hand indicates decline in immunity. This suggests thatthe extract at the small doses of 100mg and 250mg couldcause immunological defects in the female rats which renderthem vulnerable to infections since WBCs are the first lineof cellular defence that respond to infectious agents, tissueinjury, or any inflammation. Significant decrease in plateletcount was observed in male rats treated with 250mg anda significant decrease in plateletcrit (%PCT) in male ratstreatedwith 250mg,with possible effect in preventing plateletaggregation, a prominent effect in disease condition [31].
Abnormal levels of hepatic enzymes biomarkers usuallyrefer to high levels of the enzymes in blood, which ispractically an indicator of a damaged liver. Conversely, lowbiomarker levels usually have no clinical significance and areassociated with a healthy liver [32]. In this study, significantincrease in AST levels was observed at 500mg in the male
rats.This suggests that, at higher doses, the TSE compromisesthe liver function which may lead to damage of the liver asit increased gradually from the 100mg to 500mg when com-pared to the normal.The impaired liver function at 500 mg/kgwas further corroborated by the increased total bilirubin(TBil) levels. With respect to renal function, high clearanceof creatinine and urea from the blood is significant for properfunctioning kidneys. In this study, significant increase increatinine levels was observed at 250mg compared with thenormal in both male and female rats. The high level showsrenal disease and muscle wasting disorders [33].
The study also revealed significant increase in FBGobserved in male and female rats administered 500mg com-pared to the normal. High FBG is usually related to hormoneaction. These hormones include insulin, which facilitates themovement of glucose from food ingested into the body cellsfor energy production, and glucagon, which breaks downglycogen stored in the liver and muscles, releasing glucose toproduce energywhen levels from food are lowor not available

10 Evidence-Based Complementary and Alternative Medicine
Table 5: Effect of TSE on the biochemical parameters of animals.
Normal 100 mg 250 mg 500 mgMaleALT (U/L) 63.87±5.27 48.70±3.45 65.57±0.98 71.50±2.26AST (U/L) 148.00±2.55 153.43±2.48 169.30±6.50 189.47±15.60∗∗AST/ALT 0.67±0.52 1.47±0.28 0.83±0.44 1.67±0.29TBil (𝜇mol/L) 1.63±0.55 2.96±0.88 1.85±0.42 2.68±0.27DBil (𝜇mol/L) 0.95±0.05 1.49±0.65 0.98±0.03 1.04±0.17IBil (𝜇mol/L) 0.67±0.52 1.47±0.28 0.83±0.44 1.67±0.29Creat (𝜇mol/L) 28.50±6.22 24.27±1.19 49.67±9.19∗∗ 23.03±4.95Urea (mmol/l) 11.04±0.85 8.09±1.25 8.95±0.58 9.26±1.02K (mmol/L) 7.30±0.45 6.27±0.19 7.00±0.35 6.83±0.44Na (mmol/L) 143.00±0.43 142.43±0.55 142.90±0.42 143.80±1.95Cl (mmol/L) 105.57±0.53 102.77±0.67 104.80±0.87 106.43±1.05TChol (mmol/L) 1.87±0.07 2.13±0.26 2.11±0.21 2.04±0.09Trigs (mmol/L) 1.19±0.15 1.35±0.29 1.14±0.12 1.33±0.16VLDL (mmol/L) 0.53±0.09 0.60±0.15 0.50±0.06 0.60±0.10HDL (mmol/L) 0.58±0.02 0.79±0.07 0.53±0.07 0.59±0.09LDL (mmol/L) 0.74±0.03 0.73±0.31 1.06±0.16 0.85±0.11Glucose (mmol/L) 1.72±0.32 2.48±0.21 3.02±0.33 4.60±0.77LDH (U/L) 4617.76±101.23 4521.53±404.56 4340.33±184.88 4462.07±649.88FemaleALT (U/L) 56.70±4.22 49.97±2.98 56.63±3.86 46.20±2.46AST (U/L) 149.77±8.24 143.07±5.01 144.37±19.11 169.17±10.95AST/ALT 2.67±0.18 2.87±0.09 2.57±0.26 3.67±0.14TBil (𝜇mol/L) 1.36±0.27 1.91±0.43 1.68±0.21 3.31±0.46∗ ∗ ∗DBil (𝜇mol/L) 0.93±0.11 1.45±0.24 1.06±0.09 1.22±0.21IBil (𝜇mol/L) 0.43±0.18 0.80±0.40 0.63±0.02 2.07±0.42Creat (𝜇mol/L) 28.50±0.66 25.80±5.05 41.70±5.03∗∗ 22.87±3.33Urea (mmol/l) 10.61±0.46 12.61±0.82 11.64±1.20 7.55±1.45K (mmol/L) 7.07±0.29 7.13±1.24 7.20±0.40 5.80±0.21Na (mmol/L) 142.73±0.43 142.77±0.58 141.20±0.93 145.47±1.44Cl (mmol/L) 106.33±0.80 106.97±1.30 105.97±0.81 109.13±1.33TChol (mmol/L) 2.15±0.03 2.45±0.07 2.36±0.06 2.11±0.17Trigs (mmol/L) 1.27±0.22 1.07±0.30 0.96±0.29 1.62±0.26VLDL (mmol/L) 0.57±0.09 0.50±0.15 0.43±0.12 0.73±0.12HDL (mmol/L) 0.87±0.11 0.71±0.27 0.76±0.08 0.43±0.04LDL (mmol/L) 0.70±0.12 1.25±0.20 1.16±0.15 0.95±0.17Glucose (mmol/L) 1.20±0.10 1.42±0.48 1.26±0.15 5.09±0.34LDH 4052.10±101.65 3860.33±90.55 4039.20±239.98 3301.40±638.74Mean±SEM (n=3); statistical significance; ∗p<0.5, ∗∗p<0.01, and ∗ ∗ ∗p<0.001 compared among the treated and normal groups.
[34]. It is very common to have a high glucose level after afast due to the action of glucagon.Therefore, the significantlyhigh fasting blood glucose at 500mg/kg could indicate someform of hormonal imbalance at the highest dose affecting thesuitable breakdown of glucose. The determination of lactatedehydrogenase (LDH) activity has a wide variety of clinicaluses. As an intracellular enzyme, its increase indicates tissuedamage with its consequent release to the blood stream. Inthis study, no significant change was observed in the LDHlevels at all doses in both male and female rats. This result
indicates that there was no significant damage to tissues andmajor organs in both sexes.
5. Conclusion
This study on TSE confirms the presence of the phytochem-icals responsible for its pharmacological activities and thatit can serve as a therapeutic agent. The study also showedthat TSE had no impairment on the nutritional benefits ofthe experimental rats, and it did not pose any deleterious

Evidence-Based Complementary and Alternative Medicine 11
effects to major organs of the body. However, significantdecrease in platelets levels, decrease inWBCs, and increase inblood glucose were observed at higher doses. These findingsshow that Tecoma stans leaves have no prospective adverse ortoxicological effect and suggests that it is safe with controlleduse.
Data Availability
Supporting data for the findings of this study are availableupon request from the corresponding author.
Conflicts of Interest
The authors declare that there are no conflicts of interestregarding the publication of this article.
References
[1] C. Das, S. Dash, D. C. Sahoo, and A. Mohanty, “Evaluation ofmethanolic bark extract of Tecoma stans for wound healing inalbino rats,” International Journal of Pharmacy and Technology,vol. 2, no. 3, pp. 735–742, 2010.
[2] M. DellaGreca, A. Fiorentino, P. Monaco, L. Previtera, F.Temussi, and A. Zarrelli, “New dimeric phenanthrenoids fromthe rhizomes of Juncus acutus. Structure determination andantialgal activity,” Tetrahedron, vol. 59, no. 13, pp. 2317–2324,2003.
[3] T. Cangiano, M. Dellagreca, A. Fiorentino, M. Isidori, P.Monaco, and A. Zarrelli, “Effect of ent-labdane diterpenes frompotamogetonaceae on Selenastrum capricornutum and otheraquatic organisms,” Journal of Chemical Ecology, vol. 28, no. 6,pp. 1091–1102, 2002.
[4] J. Zhang, I. J. Onakpoya, P. Posadzki, and M. Eddouks, “Thesafety of herbal medicine: From prejudice to evidence,” Evi-dence-Based Complementary and Alternative Medicine, pp. 1–3,2015, https://doi.org/10.1155/2015/13.
[5] C. Larbie, K. P. Owusu, D. Torkornoo, and O. Asibey, “Acuteand sub-chronic toxicity of aqueous ethanolic extract of Ficuspumila leaves in rats,” European Journal of Biomedical andPharmaceutical Sciences, vol. 3, no. 8, pp. 22–27, 2016.
[6] B. H. Havsteen, “The biochemistry and medical significance ofthe flavonoids,” Pharmacology & erapeutics, vol. 96, no. 2-3,pp. 67–202, 2002.
[7] B. S. Min, Y. H. Kim, S. M. Lee et al., “Cytotoxic triterpenesfromCrataegus pinnatifida,” Archives of Pharmacal Research,vol. 23, no. 2, pp. 155–158, 2000.
[8] R. Kumanan, C. Sridhar, K. K. Jayaveera, S. Sudha, S. Kumar,and N. Duganath, “Comparative study of anthelmintic activityof different leaf extracts of tecoma stans (L.) on adult indianearthworms,” International Journal of Pharmaceutical and Clin-ical Research, vol. 2, no. 2, pp. 63–65, 2010.
[9] M.K.GharibNaseri,M.AsadiMoghaddam, and S. Bahadoram,“Antispasmodic effect of Tecoma stans (L.) Juss leaf extract onrat ileum,”DARU Journal of Pharmaceutical Sciences, vol. 15, no.3, pp. 123–128, 2007.
[10] S. Kameshwaran, V. Suresh, G. Arunachalam, S. K. Kanthal,and M. Mohanraj, “In vitro and in vivo anticancer activityof methanolic extract of Tecoma stans flowers,” InternationalResearch Journal of Pharmacy, vol. 3, no. 3, pp. 246–251, 2012.
[11] J. B. Harborne, Phytochemical Methods, Chapman and Hall,London, UK, 3rd edition, 1973.
[12] T. N. Rahilla, S. Rukh, and A. A. Ziaidi, “Phytochemicalscreening of medicinal plants belonging to Euphorbiaceae,”Pakistan Veterinary Journal, vol. 14, pp. 160–162, 1994.
[13] A. Sofowora, Phytochemical Screening of Medicinal Plants andTraditional Medicine in Africa, Spectrum Books, Nigeria, 2ndedition, 1993.
[14] A. Braca, C. Sortino, M. Politi, I. Morelli, and J. Mendez,“Antioxidant activity of flavonoids from Licania licaniaeflora,”Journal of Ethnopharmacology, vol. 79, no. 3, pp. 379–381, 2002.
[15] V. L. Singleton, R. Orthofer, and R. M. Lamuela-Raventos,“Analysis of total phenols and other oxidation substrates andantioxidants by means of folin-ciocalteu reagent,” Methods inEnzymology, vol. 299, pp. 152–178, 1999.
[16] J. Zhishen, T.Mengcheng, andW. Jianming, “Thedeterminationof flavonoid contents in mulberry and their scavenging effectson superoxide radicals,” Food Chemistry, vol. 64, no. 4, pp. 555–559, 1999.
[17] National Research Council, Guide for Care And Use of Labo-ratory Animal, National Academic Press, Washington, Wash,USA, 8 edition, 2011.
[18] Organisation for Economic Co-operation and Development,“OECD guideline for testing of chemicals: acute oral toxicity –acute toxic class method,” in Environmental Health and SafetyMonograph Series on Testing andAssessment, 243, pp. 1-2, OECDPublishing, Paris, France, 2001.
[19] F. K. N. Arthur, E. Woode, E. O. Terlabi, and C. Larbie, “Eval-uation of acute and subchronic toxicity of Annona muricata(Linn.) aqueous extract in animals,” European Journal of Exper-imental Biology, vol. 1, no. 4, pp. 115–124, 2011.
[20] C. Katiyar, A. Gupta, S. Kanjilal, and S. Katiyar, “Drug discoveryfrom plant sources: an integrated approach,”AYU, vol. 33, no. 1,pp. 10–19, 2012.
[21] T. K. Milugo, L. K. Omosa, J. O. Ochanda et al., “Antagonisticeffect of alkaloids and saponins onbioactivity in the quinine tree(Rauvolfia caffra sond.): Further evidence to support biotech-nology in traditional medicinal plants,” BMC Complementaryand Alternative Medicine, vol. 26, no. 13, p. 285, 2013.
[22] M. Govindappa, T. S. Sadananda, R. Channabasava, M. K.Jeevitha, K. S. Pooja, and V. B. Raghavendra, “Antimicrobial,antioxidant activity and phytochemical screening of Tecomastans,” Journal of Phytology, vol. 3, pp. 68–76, 2011.
[23] K. Annan, R. Dickson, I. Amponsah, and I. Nooni, “The heavymetal contents of some selectedmedicinal plants sampled fromdifferent geographical locations,” Pharmacognosy Research, vol.5, no. 2, pp. 103–108, 2013.
[24] A. Kulhari, A. Sheorayan, S. Bajar, S. Sarkar, A. Chaudhury, andR. K. Kalia, “Investigation of heavymetals in frequently utilizedmedicinal plants collected from environmentally diverse loca-tions of north western India,” Springerplus, vol. 17, no. 2, p. 676,2013.
[25] H. Sarma, S. Deka, H. Deka, and R. R. Saikia, “Accumulationof heavy metals in selected medicinal plants,” Reviews ofEnvironmental Contamination and Toxicology, vol. 214, pp. 63–86, 2011.
[26] J. El Hilaly, Z. H. Israili, and B. Lyoussi, “Acute and chronictoxicological studies of Ajuga iva in experimental animals,”Journal of Ethnopharmacology, vol. 91, no. 1, pp. 43–50, 2004.
[27] B. Michael, B. Yano, R. S. Sellers et al., “Evaluation of organweights for rodent and non-rodent toxicity studies: a review

12 Evidence-Based Complementary and Alternative Medicine
of regulatory guidelines and a survey of current practices,”Toxicologic Pathology, vol. 35, no. 5, pp. 742–750, 2007.
[28] Organisation for Economic Co-operation and Development,“OECD guideline for testing of chemicals: repeated dose 28-day oral toxicity study in rodents,” in Environmental Health andSafety Monograph Series on Testing and Assessment, 407, pp. 1-2,2008.
[29] C. S. William, http://www.medicinenet.com/haematocrit/arti-cle.htm, 2018.
[30] O. O. Odeyemi, M. T. Yakubu, P. J. Masika, and A. J. Afolayan,“Toxicological evaluation of the essential oil from menthalongifolia l. subsp. capensis leaves in rats,” Journal of MedicinalFood, vol. 12, no. 3, pp. 669–674, 2009.
[31] G. Kakali and B. Maitree, “Overview of platelet physiology: itshemostatic and nonhemostatic role in disease pathogenesis,” e Scientific World Journal, vol. 2014, Article ID 781857, 16pages, 2014.
[32] E. G. Giannini, R. Testa, and V. Savarino, “Liver enzyme alter-ation: a guide for clinicians,” Canadian Medical AssociationJournal, vol. 172, no. 3, pp. 367–379, 2005.
[33] S. S. Patel, M. Z. Molnar, J. A. Tayek et al., “Serum creatinineas a marker of muscle mass in chronic kidney disease: Resultsof a cross-sectional study and review of literature,” Journal ofCachexia, Sarcopenia and Muscle, vol. 4, no. 1, pp. 19–29, 2013.
[34] H. S. Warshaw, retrieved from, http://www.diabeticlivingonline.com/monitoring/blood-sugar/why-are-fastingblood-glucose-numbers-high, 2018.

Stem Cells International
Hindawiwww.hindawi.com Volume 2018
Hindawiwww.hindawi.com Volume 2018
MEDIATORSINFLAMMATION
of
EndocrinologyInternational Journal of
Hindawiwww.hindawi.com Volume 2018
Hindawiwww.hindawi.com Volume 2018
Disease Markers
Hindawiwww.hindawi.com Volume 2018
BioMed Research International
OncologyJournal of
Hindawiwww.hindawi.com Volume 2013
Hindawiwww.hindawi.com Volume 2018
Oxidative Medicine and Cellular Longevity
Hindawiwww.hindawi.com Volume 2018
PPAR Research
Hindawi Publishing Corporation http://www.hindawi.com Volume 2013Hindawiwww.hindawi.com
The Scientific World Journal
Volume 2018
Immunology ResearchHindawiwww.hindawi.com Volume 2018
Journal of
ObesityJournal of
Hindawiwww.hindawi.com Volume 2018
Hindawiwww.hindawi.com Volume 2018
Computational and Mathematical Methods in Medicine
Hindawiwww.hindawi.com Volume 2018
Behavioural Neurology
OphthalmologyJournal of
Hindawiwww.hindawi.com Volume 2018
Diabetes ResearchJournal of
Hindawiwww.hindawi.com Volume 2018
Hindawiwww.hindawi.com Volume 2018
Research and TreatmentAIDS
Hindawiwww.hindawi.com Volume 2018
Gastroenterology Research and Practice
Hindawiwww.hindawi.com Volume 2018
Parkinson’s Disease
Evidence-Based Complementary andAlternative Medicine
Volume 2018Hindawiwww.hindawi.com
Submit your manuscripts atwww.hindawi.com


![Sub-chronic Toxicity Study of Hydroethanolic Leaf Extract of … · 2017-08-24 · histopathological assessment [17]. Semen was also obtained for sperm motility, count, and morphology](https://img.pdfslide.us/doc/110x75/5f37b0a841845b42ab31948e/sub-chronic-toxicity-study-of-hydroethanolic-leaf-extract-of-2017-08-24-histopathological.jpg)