Embed Size (px)
Citation preview

Physiology and Vital Signs after Removal of Life Sustaining Therapy
Dr Sonny Dhanani University of Ottawa
Canadian Critical Care Forum, 2014

Disclosures

DCD Implementation in Canada
0
100
200
300
400
500
600
700
2003 2004 2005 2006 2007 2008 2009 2010 2011 2012
Deceased donation in Canada by donor type
DCD
NDD
Courtesy of Karen Hornby, CBS
20 7
225
47
11
0
50
100
150
200
250
British Columbia
Alberta Ontario Quebec Nova Scotia
DCD Donors by Province 2006-2012

BROADCAST DATE : MAR 21, 2014
Dead Enough
EPISODE SYNOPSIS : It’s a question you might think medical science would have answered long ago – when are you dead?

Supported by most professionals and public AND SAVES LIVES
Still discomfort and controversy
• 1. death determination criteria • 2. cessation of function and irreversibility • 3. autoresuscitation


*no numerical time given # reported 33 minutes, discovered during transport to morgue
Hornby, Hornby, Shemie Crit Care Med 2010;38:1246-53.
0
5
10
15
20
25 Le
telli
er e
t al.,
198
2 (A
R 14
) Li
nko
et a
l., 1
982
(AR
15)*
Ro
seng
arte
n et
al.,
199
1 (A
R 25
) Ro
gers
et a
l., 1
991(
AR 2
4)
Bray
, 199
3 (A
R 5)
M
arte
ns e
t al.,
199
3 (A
R 19
)*
Qui
ck e
t al.,
199
4 (A
R 23
) G
omes
et a
l., 1
996
(AR
11)*
La
pins
ky e
t al.,
199
6 (A
R 13
)*
Voel
ckel
et a
l., 1
996
(AR
26)
Fum
eaux
et a
l., 1
997
(AR
10)*
M
utzb
auer
, 199
7 (A
R 21
)*
Frol
ich,
199
8 (A
R 9)
M
alec
k et
al.,
199
8 (A
R 18
) Br
adbu
ry, 1
999
(AR
4)
Mac
Gill
ivra
y, 1
999
(AR
16)
Wal
ker e
t al.,
200
1 (A
R 27
) Ab
dulla
h, 2
001
(AR
1)
Ben-
Davi
d et
al.,
200
1(AR
3)
Mae
da e
t al.,
200
2 (A
R 17
) Du
ck e
t al.,
200
3 (A
R 8)
Ca
siel
les G
arci
a et
al.,
200
4 (A
R 6)
De
Sal
via
et a
l., 2
004
(AR
7)*
Pusc
hel e
t al ,
200
4 (A
R 22
)#
Al-A
nsar
i et a
l., 2
005
(AR
2)
Mon
ticel
li et
al.,
200
6 (A
R 20
)*
Kam
arai
nen
et a
l., 2
007
(AR
12)
Auto
resu
scita
tion
Tim
e (m
in)
Time from cessation of failed CPR to SROC, as a function of study date
Specific time, ECG monitoring
Specific time, no monitoring
Approximate time
Spontaneous, Unassisted Resumption of Circulation after Cessation of Failed CPR

reported to occur from a few seconds to 33 minutes No AR in adults or children if no CPR did not occur beyond 7 minutes after cessation of failed CPR (from cases with monitoring and exact times documented)


Monitoring after WLST
death declaration study end
consent to WLST
30 mins
consent to study
WLST
Waveform Analysis

• 85% subjects were mechanically • 80% subjects were receiving sedation/analgesia • 34% of subjects were receiving vasopressors • Of those mechanically ventilated, 62% were extubated at or
shortly after withdrawal of life-sustaining therapies and the others remained intubated.
• 80% subjects had sedation/analgesia continued or added after withdrawal of life- sustaining therapies
• All subjects died and clinically observed autoresuscitation
was not reported within the study sample. • The median time from withdrawal of life-sustaining
therapies to clinical declaration of death was 60 minutes (range, 11-2960 minutes).

Did we achieve our Primary Objective?
• Feasibility • Recruitment –91% (41/45) of patients enrolled • Consent rate – 87% • Protocol compliance – 76%
Prospective, observational study of vital sign waveform data for 30 minutes after clinical determination of death

Example 1

Description of monitored activity after WLST ECG and ABP activity
Any form of activity was documented, regardless of scale, quantity, quality, or clinical relevance
At times, difficult to interpret artifact, activity, and meaningful activity
Focus on “activity” versus “function”

ECG activity
In 3/33 patients, ABP and ECG activity stopped at the same time In 5 patients, ECG persisted, intermittently, after
absence of ABP activity median of 11 minutes 11 seconds (range, 37 seconds-36
minutes 29 seconds) after absence of ABP activity In 25 patients, ECG persisted, continuously, after
absence of ABP activity median of 3minutes 10 seconds (range 0-38minutes) after
absence of ABP activity
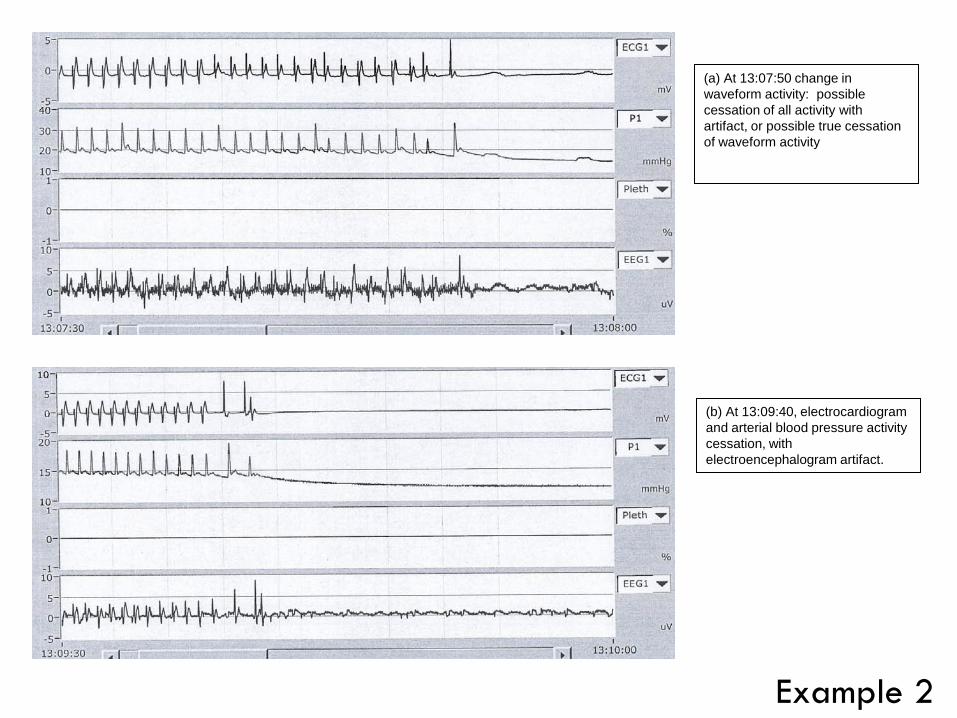
(a) At 13:07:50 change in waveform activity: possible cessation of all activity with artifact, or possible true cessation of waveform activity
(b) At 13:09:40, electrocardiogram and arterial blood pressure activity cessation, with electroencephalogram artifact.
Example 2
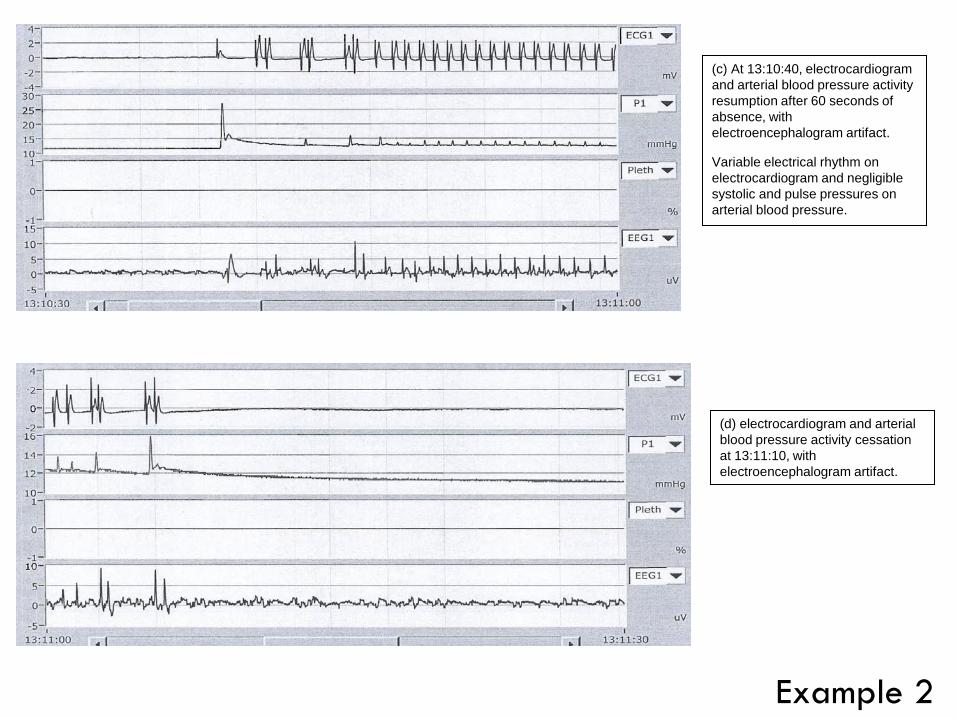
(c) At 13:10:40, electrocardiogram and arterial blood pressure activity resumption after 60 seconds of absence, with electroencephalogram artifact.
Variable electrical rhythm on electrocardiogram and negligible systolic and pulse pressures on arterial blood pressure.
(d) electrocardiogram and arterial blood pressure activity cessation at 13:11:10, with electroencephalogram artifact.
Example 2

ABP activity
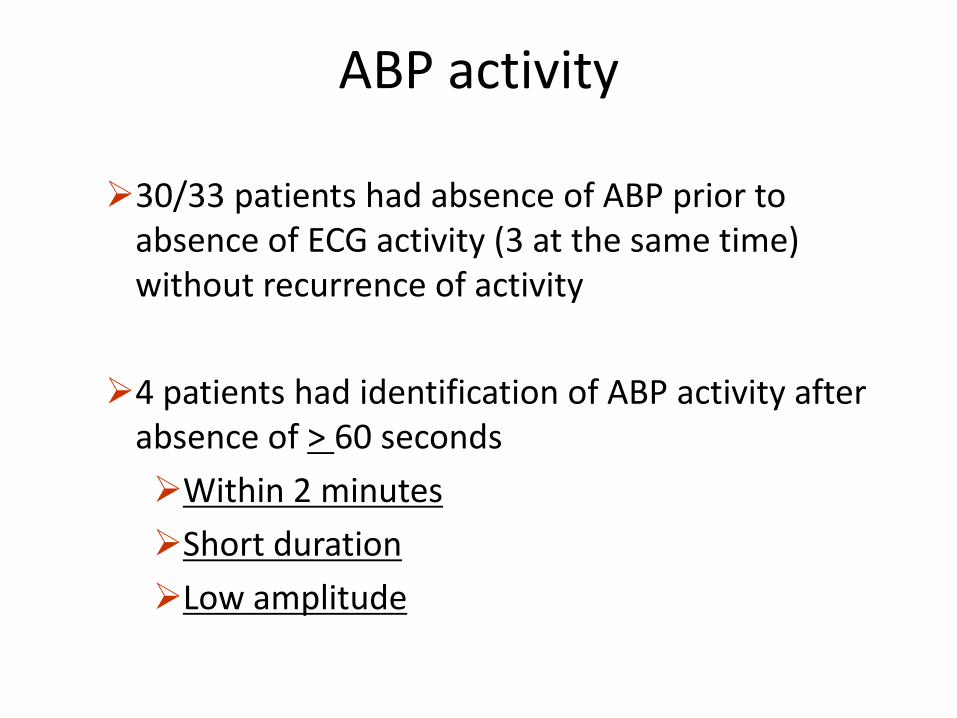
30/33 patients had absence of ABP prior to absence of ECG activity (3 at the same time) without recurrence of activity 4 patients had identification of ABP activity after
absence of > 60 seconds Within 2 minutes Short duration Low amplitude

12 pts Two recordings showed a salvo of 5 to 20 heartbeats 1.23 and 6 minutes after asystole, followed by EKG silence. An arterial catheter in two of these patients did not record measurable tracings during the cardiac activity.

International guideline development for the determination of death. Shemie SD, Hornby L, Baker A, Teitelbaum J, Torrance S, Young K, Capron AM, Bernat JL, Noel L; The International Guidelines for Determination of Death phase 1 participants, in collaboration with the World Health Organization
'the permanent loss of capacity for consciousness and all brainstem functions, as a consequence of permanent cessation of circulation or catastrophic brain injury'.

All 4 patients had EEG findings consistent with coma at the time of WLST.
In 3 patients, isoelectric EEG occurred prior to cessation of ECG and ABP. No return of EEG activity was noted.
In one patient, delta and theta waveform bursts on EEG persisted following the cessation of both ECG and ABP
EEG Activity

Example 3

The EEG became isoelectric 17 minutes after WLST
Example 3

ECG and ABP stopped at 21 minutes following WLST. At 22 minutes and 25 seconds after WLST this patient had return of ECG and ABP for 40 seconds, however, the EEG remained isoelectric during
Example 3

Example 4
Activity versus Function?

CEREBRAL FUNCTION DURING CARDIAC ARREST: TOWARDS A BETTER UNDERSTANDING OF THE DYING BRAIN
Raluca Pana, Laura Hornby, Jeanne Teitelbaum, Sonny Dhanani, Sam Shemie
Scoping review the scientific literature regarding the relationship between brain activity and function and arrest of systemic circulation, with the purpose of describing human neurophysiology during the dying process. Preliminary Results: 860 citations reviewed, 19 articles to be included

26-44 s
60 s 15 s 0 s
Timing of Loss of Consciousness (exhaustion of oxygen stores) and EEG Changes Following Arrest of Circulation in Humans and Animals
20 s
Losasso 1992 (case report-1 person) developed diffuse EEG slowing and suppression within 10-20 s after asystole
10 s
10-20 s
Rossen et al., 1943 n=137 males Average time of 6.8 s from arrest of cerebral circulation to loss of consciousness,
6.8 s
Moss and Rockoff, 1980 (case report- 1 person) During 27 sec period of ventricular asystole, cerebral electrical activity lost within 15 s Stertz et al., 1991, (n= 37 dogs), VF & Hossmann 1988, (n= 143 cats), CI EEG isoelectric within 15 s Steen et al., 1985 , (n=10 monkeys) EEG isoelectric after 15+3 s
Hossmann and Kleihues, 1973 (n=200 cats, 21 monkeys) EEG became isoelectric within 20 s following cerebral ischemia
Bircher et al., 1982 (n=6 dogs) Time to EEG silence as 26(5) (20-30) s
30 s
Lind et al., 1975 (review article) Cerebral ischemia led to an isoelectricelectroencephalogram with a mean time of 37 (26-44)s
44 s
26 s
Clute and Levy 1990 n= 10 pts After brief cardiac arrest, the mean time to EEG changes* was 10.2 (0.4)SEM (3.3-21.1 )s
3.3-21.1 s

Surges of electroencephalogram activity at the time of death: a case series. Chawla 2009 • 7 pts • In each case, loss of blood pressure, as monitored by indwelling arterial line, was
followed by a decline is BIS= PSI activity • followed by a transient spike in BIS/PSI activity that approached levels normally
associated with consciousness. This spike in electroencephalogram (EEG) activity had short duration and the activity then declined to a level of activity associated with burst suppression.
Processed electroencephalogram during donation after cardiac death. Auyong 2010 • 3pts • BIS showed considerable changes traditionally associated with anesthesia
immediately after withdrawal of care.

Bedside staff and patient families had minimal objections to research during the dying process, resulting in high recruitment and consent rates
Prospective collection of ECG, ABP and EEG data during the dying process is possible
Lessons learned Artifact, activity, and meaningful activity Definitions of cessation, resumption, and autoresuscitation Standard electronic platform for data capture and review
Future

Future study needed… ECG may persist well beyond ABP cessation
ABP activity may resume after cessation Within 2 minutes Short duration Low amplitude
EEG may cease minutes before cessation of ABP
Pilot study findings support current DCD practices

Death Prediction and Physiology after Removal of Therapy
500 patients 13 Canadian sites

DePPaRT Collaborators/Co-investigators
CANADA Andrew Baker Stephen Beed Jane Chamber-Evans Jennifer Chandler Chip Doig Peter Dodek Rob Fowler Jan Friedrich Teneille Gofton Vanessa Gruben AnneMarie Guerguerian Christophe Herry George Isac
UK Dale Gardiner Christian Brailsford CZECH REP Frantisek Duska US Tom Nakagawa Paul Shore TRAINEES Alvin Li Loretta Norton Amanda van Beinum CORE TEAM Sonny Dhanani Sam Shemie Laura Hornby Nathan Scales Paulina Mirsky
Greg Knoll Jim Kutsogiannis Lauralyn McIntyre Maureen Meade Laveena Munshi Tim Ramsay Steven Reynolds Damon Scales Jason Shahin Andrew Seely Janet Squires Alexis Turgeon Bryan Young


Organs Transplanted from Ontario DCD Donors
June 1, 2006 – June 30, 2014
ORGAN TRANSPLANTED ORGAN
COUNT* Kidney-Both 11
Kidney-Left 264
Kidney-Right 256
Liver 112
Lung Both 55
Lung-Left 10
Lung-Right 4
Pancreas-Whole 20
Total 732
*Includes accepted out of province offers

"elucidate the natural history of cessation of physiological function after the removal of life support in those expected to die." Objective research can inform the discussion about “death” with descriptive physiologic data
www.ddepict.com