Embed Size (px)
Citation preview
European Journal of Agronomy 11 (1999) 279–291www.elsevier.com/locate/eja
Physiological responses of chickpea genotypes to terminaldrought in a Mediterranean-type environment
L. Leport a,*, N.C. Turner a,b, R.J. French a,c, M.D. Barr a, R. Duda b,d,S.L. Davies a,e, D. Tennant f, K.H.M. Siddique a, f
a Centre for Legumes in Mediterranean Agriculture, University of Western Australia, Nedlands, WA 6907, Australiab CSIRO Plant Industry, Private Bag, PO, Wembley, WA 6014, Australia
c Agriculture Western Australia, PO Box 432, Merredin, WA 6415, Australiad Institut fur Gemusebau, Universitat Hannover, Herrenhauserstrasse 2, D-30419 Hannover, Germany
e Faculty of Agriculture, University of Western Australia, Nedlands, WA 6907, Australiaf Agriculture Western Australia, Locked Bag No. 4, Bentley, WA 6983, Australia
Accepted 19 July 1999
Abstract
Two field experiments were carried out to investigate the effects of terminal drought on chickpea grown underwater-limited conditions in the Mediterranean-climatic region of Western Australia. In the first experiment, five desi(small angular seeds) chickpeas and one kabuli ( large round seeds) chickpea were grown in the field with and withoutirrigation after flowering. In the second experiment, two desi and two kabuli cultivars were grown in the field witheither irrigation or under a rainout shelter during pod filling. Leaf water potential (Yl), dry matter partitioning afterpod set and yield components were measured in both experiments while growth before pod set, photosynthesis, podwater potential and leaf osmotic adjustment were measured in the first experiment only.
In the first experiment, total dry matter accumulation, water use, both in the pre- and post-podding phases, Yland photosynthesis did not vary among genotypes. In the rainfed plants, Yl decreased below −3 MPa whilephotosynthesis decreased to about a tenth of its maximum at the start of seed filling. Osmotic adjustment variedsignificantly among genotypes. Although flowering commenced from about 100 days after sowing (DAS) in bothexperiments, pod set was delayed until 130–135 DAS in the first experiment, but started at 107 DAS in the secondexperiment. Water shortage reduced seed yield by 50 to 80%, due to a reduction in seed number and seed size.Apparent redistribution of stem and leaf dry matter during pod filling varied from 0 to 60% among genotypes, andsuggests that this characteristic may be important for a high harvest index and seed yield in chickpea. © 1999 ElsevierScience B.V. All rights reserved.
Keywords: Assimilate redistribution; Cicer arietinum (L.); Gas exchange; Osmotic adjustment; Water relations
* Corresponding author. Present address: Laboratoire de Physiologie et Biochimie Vegetales, Universite de Rennes I, 263 Avenuedu General Leclerc, Campus de Beaulieu, 35042 Rennes Cedex, France.Tel.: +33-2-99-28-61-63; fax: +33-2-99-28-69-15.
E-mail address: [email protected] (L. Leport)
1161-0301/99/$ – see front matter © 1999 Elsevier Science B.V. All rights reserved.PII: S1161-0301 ( 99 ) 00039-8
280 L. Leport et al. / European Journal of Agronomy 11 (1999) 279–291
1. Introduction under terminal drought, this was more intensivelystudied in a second experiment. In this secondstudy two desi cultivars, Tyson and Sona, and twoChickpea (Cicer arietinum L.) is grown across a
wide range of environments, from the subtropics kabuli cultivars, Kaniva and Bumper, were studiedto determine whether there was any variationof India and north-eastern Australia to
Mediterranean-climatic regions around the among genotypes for assimilate redistribution.Mediterranean basin and in southern Australia(Siddique et al., 1999). It has become an importantpulse crop in Australia over the past decade. In
2. Materials and methodssubtropical areas it is sown after the summermonsoonal rains and grows on stored soil mois-
2.1. Experiment 1ture. In Mediterranean-climatic regions it is sownin autumn or spring and grows during the cool
2.1.1. Trial designwet months of winter and spring. In both environ-Six chickpea (Cicer arietinum L.) genotypes,ments chickpea crops are exposed to drought
including five desi types: cv. Tyson (121 mgduring pod set and seed filling (terminal drought).seed−1), acc. ICCV88201 (194 mg seed−1), acc.Additionally, the crops can be exposed to lowT1587 (165 mg seed−1), acc. T1069 (182 mgtemperatures at flowering that inhibit pod setseed−1), and acc. CTS60543 (158 mg seed−1) and(Lawlor et al., 1998; Srinivasan et al., 1999) andone kabuli type: cv. Kaniva (422 mg seed−1) werehigh temperatures during seed filling that limitgrown in 1995 on a red brown earth (Calcicyields (Buddenhagen and Richards, 1988). WhileHaploxeralf ) with a neutral surface pH (6.2 tochickpea is considered one of the most drought-6.9) and pH increasing with depth to 8.6tolerant of the cool season food legumes, the basis(Thomson et al., 1997) at Merredin (31°30∞ S,of its tolerance is unknown (Singh, 1993).118°12∞ E), Western Australia. The trial was aMethodologies for a better understanding ofrandomized block design with four replicates ofyield improvement under drought conditions haveeach chickpea genotype, and with a buffer plotbeen reviewed recently (Turner, 1997). Leaf water(chickpea, cv. Dooen) at each end of the trial.potential represents an easy measure of water
deficit and leaf gas exchange may provide a good‘sensor’ of the stress. Production of dry matter, 2.1.2. Management
The plants were sown at a depth of 5 cm on 13early vigour, phenological plasticity and osmoticadjustment have been identified as some of the key May 1995 in plots 1.44 m wide (eight rows, 18 cm
apart) and 30 m long at a seeding rate thatcharacteristics for improved yield and yield mainte-nance under drought (Turner, 1997). In the present gave established plant populations of 32–
37 plants m−2. All seeds were inoculated with astudy, these characteristics were studied on sixgenotypes of chickpea grown on a fine-textured, commercial Group N Bradyrhizobium immediately
before sowing. The plots received 72 kg/ha of tripleneutral-to-alkaline soil in the Mediterranean-cli-matic region of Australia. The genotypes used superphosphate drilled with the seed at sowing.
Broad-leafed and grass weeds were controlledwere a desi (small angular seeds) cultivar, Tyson,a kabuli ( large round seeds) cultivar, Kaniva, and by conventional methods. Native budworm
(Helicoverpa spp.) was controlled using insecti-four desi advanced breeding lines, which had 14to 30% higher yields than cv Tyson in 1994, a cides. A 5 m section at one end of each plot was
trickle irrigated commencing at floweringseason with below average rainfall (Siddique, per-sonal communication). The aim of the study was (108 DAS) and ending just before maturity.
Irrigation equivalent to pan evaporation occurredto identify the morphological and physiologicalcharacteristics of chickpea that may affect yields twice weekly, corresponding to 152 mm of water
applied over a 64 day period. Minimum and maxi-in these low rainfall environments. As dry matterredistribution was identified as a key characteristic mum air temperatures, rainfall and incident total
281L. Leport et al. / European Journal of Agronomy 11 (1999) 279–291
solar radiation were recorded on a daily basis 2.1.5. Green area and dry matter partitioningPlant samples (0.5 m2 quadrat) from the rainfedusing an automatic weather station at the site.
end of each plot were harvested at ground levelon 46, 72, 101, 115, 129, 143, 156, 171 DAS andat maturity (186 DAS for Kaniva, 178 DAS for2.1.3. Water potential and photosynthesis
The leaf water potential (Yl) of upper the other genotypes). Any leaf material on theground was collected and added to the sample.(unshaded) expanded leaves and the water poten-
tial of pods (Yp) 20 to 25 days after setting were Border rows were not harvested to avoid edgeeffects. Plant samples were dried to constant weightmeasured around midday (10:30 to 14:30 h) on
clear sunny days (photosynthetically active radia- and weighed. A 0.5 m length of crop was leftbetween sampling areas to minimize edge effectstion above 1700 mmol m−2 s−1) at approximately
weekly intervals between 95 DAS and 174 DAS on the adjacent sampling area. A subsample ofthree (129 and 143 DAS), four (115, 156 andusing the pressure chamber technique as described
previously (Leport et al., 1998). At the same time 171 DAS), five (101 DAS), six (46 and 72 DAS),and 10 uniform plants (at maturity) was alsoand on similar leaves to those used for measure-
ments of leaf water potential, the rate of net collected from the plot adjacent to the quadratcuts. These subsamples were partitioned intophotosynthesis was measured with a portable, open
gas exchange system (Model LCA3, ADC, leaves, stems, flowers, and pods, and, at maturity,seeds for dry matter determination. Green areaHoddesdon, UK ) as described previously (Leport
et al., 1998). All measurements of water potential was determined on the leaf, stem and pod compo-nents (projected area only) using a Li-Cor LI-3100and photosynthesis were replicated three times per
plot and per date of measurement, using a different (Li-Cor Inc., NE, USA) area meter. The greenarea/shoot dry weight ratios of the sample plantsplant for each measurement.and the dry weights of the bulk plant cuts wereused to calculate the green area index.Instantaneous spot measurements of the fraction2.1.4. Osmotic adjustment
At 129, 144 and 164 DAS, upper fully expanded of incident solar radiation intercepted by thecanopy near solar noon were obtained from inci-leaves were sampled and immediately frozen for
osmotic potential measurements while the closest dent photosynthetically active radiation 0.5 mabove and below the canopy with a 0.9 m longleaf on the same plant was collected in a plastic
bag for the measurement of relative water content linear quantum sensor (Li-Cor Inc., NE, USA).At the same time that dry matter samples were(Turner, 1981). Osmotic potential was measured
on expressed sap on the thawed samples by vapour taken, soil water content was measured at 20 cmintervals from 10 cm to 170 cm depths in the soilpressure osmometry using Wescor ( Wescor Inc.,
Logan, UT, USA) C-52 sample chambers and by the neutron scattering technique using a Model503DR CPN (California Nuclear Pacific, CA,a Wescor HR-33T dew-point microvoltmeter
(Turner, 1981). The osmotic potential at full turgor USA) moisture meter.(p100) was calculated as:
2.1.6. Yield componentsYield components were determined on both thep
100=pRWC
irrigated and rainfed plants at maturity. Harvestindex was calculated at maturity as the ratio ofwhere RWC is the relative water content and p
the measured osmotic potential at that RWC. A seed dry weight to total above-ground crop dryweight. The total number of pods (which includedsingle measurement of p and RWC was made per
plot and per date of measurement. The level of all fertile and infertile pods), number of seeds(which included all seeds above 20 mg) and seedosmotic adjustment was estimated from the differ-
ence in p100 between leaves from the rainfed and weights were measured on each of 10 plants, andfrom these measurements the number of pods andirrigated plants.
282 L. Leport et al. / European Journal of Agronomy 11 (1999) 279–291
seeds per plant, number of seeds per pod and shelter reached physiological maturity (131 DAS).In the block under the rainout shelter, irrigationmean seed weight were calculated. Seed and pod
number per square metre were calculated from the was stopped at pod set (107 DAS), and thereafterthe rainout shelter was positioned automaticallynumber of pods (or seeds) per plant and the ratio
of dry matter per unit area and per plant. over the crop during each rainfall event. Irrigationoccurred every two days, corresponding to 44 mmIn the rainfed chickpeas, the start of flowering
and start of podding were recorded, corresponding of water applied over a 15 day period in the blockunder the rainout shelter and to 149 mm of waterto when 50% of plants had at least one fully open
flower with visible corolla coloration, and at least applied over a 39 day period in the irrigated blockoutside the rainout shelter. Rainfall was recordedone visible pod (3 mm), respectively.on a daily basis using a manual rain gauge at thesite. Minimum and maximum air temperatures2.2. Experiment 2were recorded on a daily basis using a data loggerTestostor175 (Testo Gmbh & Co., Lenzkirch,2.2.1. Trial design
Four chickpea genotypes, including two desi Germany).types, cv. Tyson (121 mg seed−1), the newly-released cultivar Sona (220 mg seed−1), a sister 2.2.3. Water potentialline of acc. ICCV88201 used in Experiment 1 Yl was measured 107, 113, 118, 119, 120, 124,(Section 2.1.1), and two kabuli types, cv. Kaniva 127 and 131 DAS, following the same procedure(422 mg seed−1), and the newly-released cultivar as in Experiment 1 (Section 2.1.3).Bumper (470 mg seed−1), obtained from a desi bykabuli cross, were grown in 1997 in a deep yellow
2.2.4. Dry matter partitioningsand (Quartzipsamment) with pH 6.0 to 6.5, atPlant samples from both blocks (hereafterCSIRO Floreat Park, Perth, Western Australia.
referred to as the water stressed and irrigatedThe soil was spatially and vertically uniform. Thetreatments) were harvested weekly at ground levelcrops were grown in two blocks, one of themfrom beginning of pod set (107 DAS) to maturitypositioned so it could be automatically covered by(138 DAS for the water stressed desi cultivars,a rainout shelter during rainfall events, and each141 DAS for the water stressed Kaniva cultivar,block was fully randomized with three replicates145 DAS for the water stressed Bumper cultivar,of each chickpea genotype.and 159 DAS for the irrigated plants). 10 plantswere collected for the first four harvests, and 202.2.2. Managementplants at maturity. Any leaf material on the groundThe plants were sown at a depth of 5 cm on 18was collected and added to the sample.June 1997 in plots 3 m wide (17 rows, 16 cm apart)Subsamples, corresponding to three plants out ofand 4 m long (size of each block 12 m×12 m) atthe 10, or six out of the 20, were partitioned intoa seeding rate that gave established plant popula-leaves, stems, pod walls and seeds for dry weighttions of 30–38 plants m−2. All seeds were inocu-determination. All plant samples were dried tolated with a commercial Group N Bradyrhizobiumconstant weight and weighed. Dry matter per unitimmediately before sowing. The plots receivedarea was calculated from the measured dry matter120 kg/ha of superphosphate two weeks prior toper plant and the measured plant density for thesowing, and 50 kg/ha of a commercial mixed fertil-corresponding plot.izer (corresponding to 6.0 kg/ha of N, 2.6 kg/ha
of P, 7.1 kg/ha of K, 3.5 kg/ha of S, and 1.8 kg/haof Ca) six and 10 weeks after sowing. Weeds were 2.2.5. Yield components
Yield components, start of flowering and startcontrolled chemically. Both blocks were trickleirrigated commencing at flowering (94 DAS). In of podding were determined in both irrigated and
water stressed plants, following the same procedurethe block outside the rainout shelter, irrigationwas maintained until the plants under the rainout as in Experiment 1 (Section 2.1.6).
283L. Leport et al. / European Journal of Agronomy 11 (1999) 279–291
2.3. Statistical analysis
Means and standard errors were calculated withthe SAS (SAS Institute, 1987) MEANS procedureand tests for differences among genotypes andtreatments were performed using a one-way and atwo-way ANOVA (SAS general linear model pro-cedure). Significantly different species (P>0.05)were identified with the LSD test. Correlationswere derived using the SAS CORR SPEARMANprocedure.
3. Results
3.1. Experiment 1
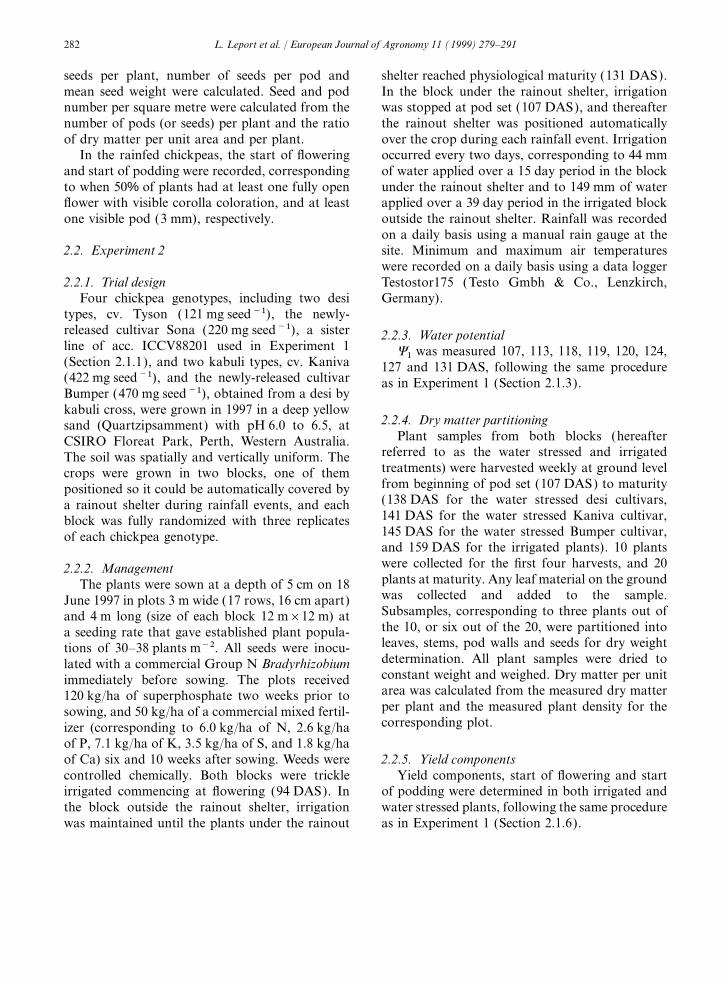
3.1.1. Seasonal conditionsIn 1995 at Merredin, daily maximum air temper-
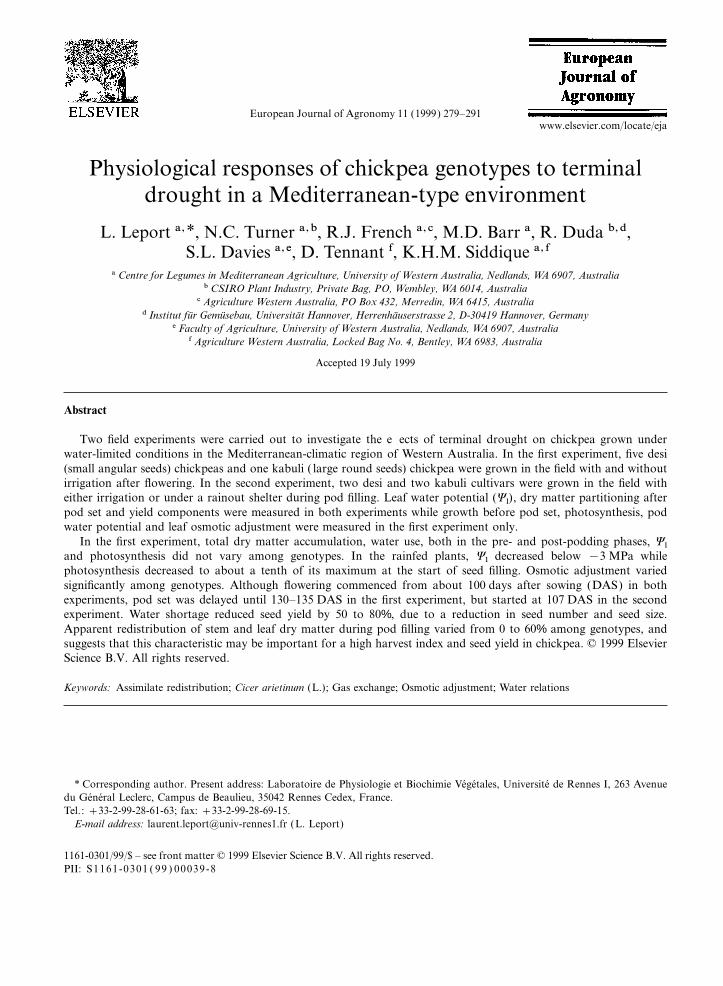
atures were around 16°C from sowing to 100 DAS,around 19°C for the next 45 days and around 25°Cfrom hereafter until maturity [Fig. 1(A)]. Daily Fig. 1. (A) Daily minimum (—) and maximum (…) air temper-minimum air temperatures below 0°C were atures. (B) Daily incident solar radiation. (C) Daily rainfall
during the growing season at Merredin, Western Australia, inobserved on five occasions near the onset of flow-1995 (Experiment 1). The arrows denote the mean date of firstering [Fig. 1(A)]. Until 153 DAS, daily minimumflower (first arrow) and first pod (second arrow) in the rainfedair temperatures were never above 10°C for morechickpeas. The gaps between 25 and 45 DAS (A and B), and
than two consecutive days and then after 153 DAS between 59 and 87 DAS (B) correspond to missing data.rose to above 13°C. Daily total solar radiationwas around 10 MJ m−2 at sowing and increasedsteadily to a maximum of 28 MJ m−2 at 183 DAS rainfall on 159 DAS. The midday pod water poten-
tial (Yp) was always 0.2 to 0.4 MPa above Yl,[Fig. 1(B)]. Including 60 mm just before sowing,growing season rainfall (May–November) was except in rainfed plants after the rainfall event on
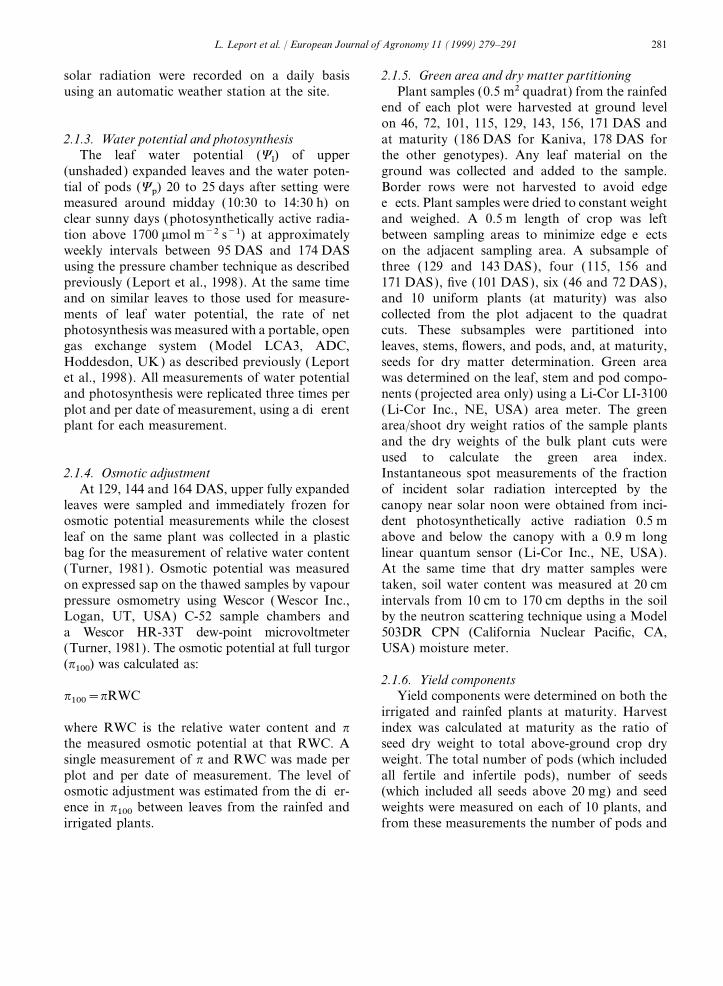
159 DAS when Yl and Yp were similar (Fig. 2).313 mm [Fig. 1(C)], 86 mm more than the long-term average. Before pod set commenced 275 mm The mean photosynthetic rate of the irrigated
plants, except at 151 and 167 DAS, ranged fromfell, but plants received only 38 mm during poddevelopment, including 28 mm on 159 DAS. 21 to 27 mmol m−2 s−1 in all genotypes (Fig. 2.).
The decrease of the rate of net photosynthesis inirrigated plants at 151 and 167 DAS coincided3.1.2. Water potential and photosynthesis
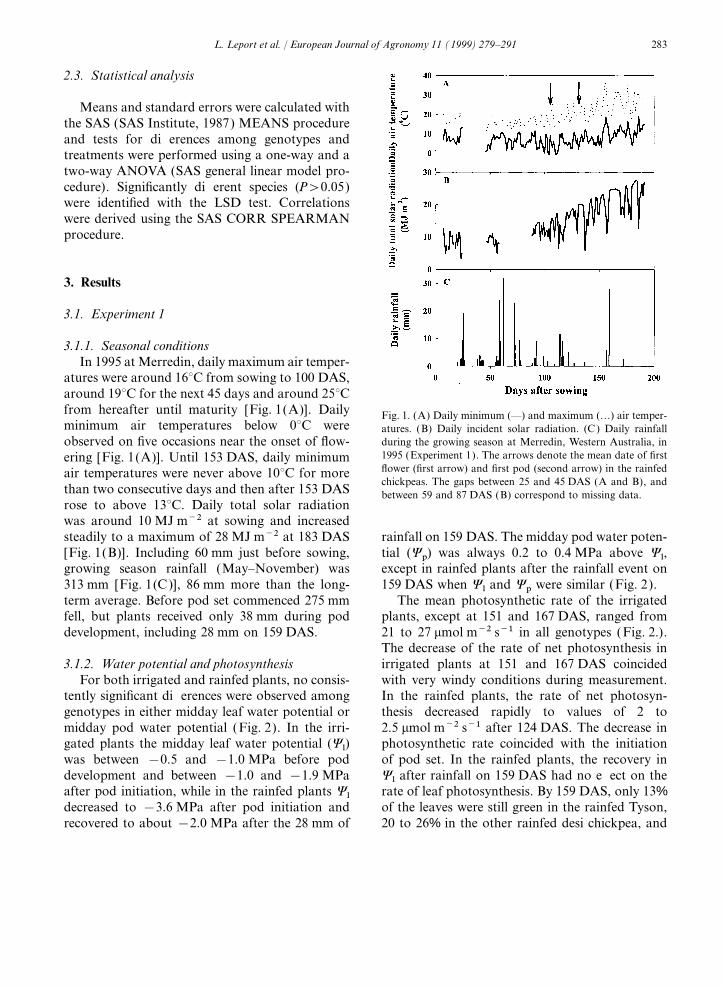
For both irrigated and rainfed plants, no consis- with very windy conditions during measurement.In the rainfed plants, the rate of net photosyn-tently significant differences were observed among
genotypes in either midday leaf water potential or thesis decreased rapidly to values of 2 to2.5 mmol m−2 s−1 after 124 DAS. The decrease inmidday pod water potential (Fig. 2). In the irri-
gated plants the midday leaf water potential (Yl) photosynthetic rate coincided with the initiationof pod set. In the rainfed plants, the recovery inwas between −0.5 and −1.0 MPa before pod
development and between −1.0 and −1.9 MPa Yl after rainfall on 159 DAS had no effect on therate of leaf photosynthesis. By 159 DAS, only 13%after pod initiation, while in the rainfed plants Yl
decreased to −3.6 MPa after pod initiation and of the leaves were still green in the rainfed Tyson,20 to 26% in the other rainfed desi chickpea, andrecovered to about −2.0 MPa after the 28 mm of
284 L. Leport et al. / European Journal of Agronomy 11 (1999) 279–291
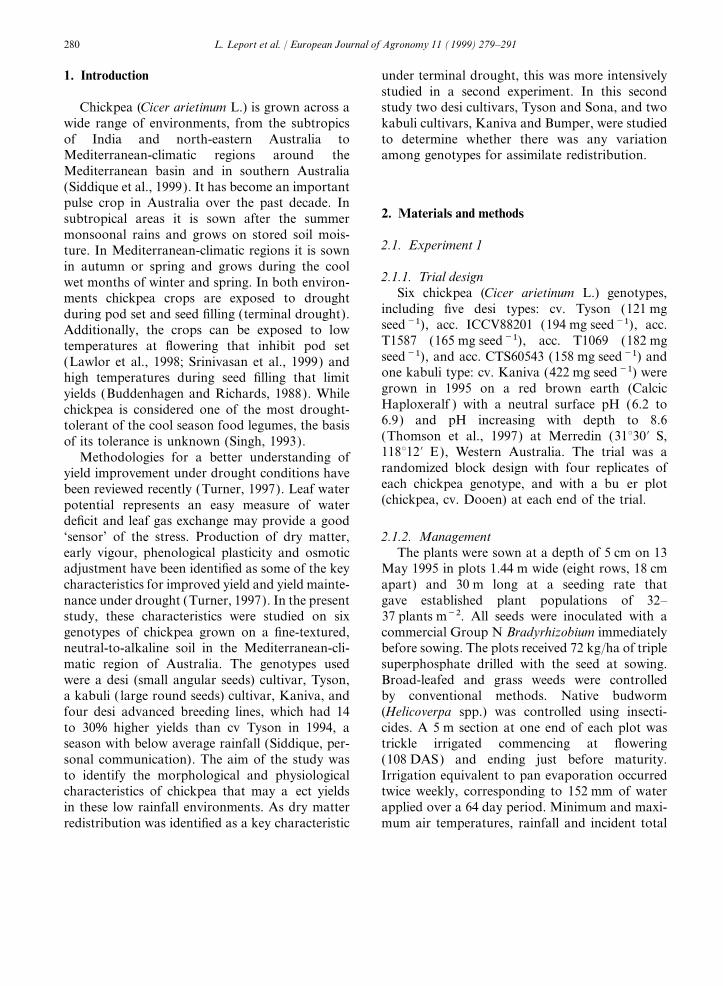
Fig. 3. Change with time of the calculated leaf osmotic potentialat full turgor (p100) in six irrigated (open symbols) and sixrainfed (closed symbols) chickpea genotypes grown in the fieldat Merredin, Western Australia, in 1995 (Experiment 1). Bars=±one standard error of the mean (n=4) when larger thanthe symbol.
Fig. 2. Change with time in the midday leaf net photosynthetic108 DAS for the four other genotypes. The firstrate, leaf and pod water potential of six irrigated (open symbols)
and six rainfed (closed symbols) chickpea genotypes grown in pods were observed four weeks later, on 130 DASthe field at Merredin, Western Australia, in 1995 (Experiment in all desi genotypes including the cold tolerant1). The six genotypes are separated into two groups (A and B) selection CTS60543, and 135 DAS in the kabulifor clarity. The arrows denote the date of first pod in the rainfed
genotype (Fig. 2). The above-ground total drychickpeas. Bars=±one standard error of the mean when largermatter in the irrigated plants at maturity wasthan the symbol.about 1000 g m−2 and only significantly lower inTyson than in the other genotypes (Table 1); inthe rainfed chickpeas the dry matter was about 6038% in the rainfed Kaniva. By 174 DAS, all leaves
were senescent in the rainfed desi plants, while 9% to 70% of that in the irrigated plants (Table 1). Inthe rainfed plots, all genotypes achieved theirof leaves were still green in the rainfed Kaniva.maximum dry weight at 143 DAS, and thendecreased by 10 to 30% in the four desi genotypes3.1.3. Osmotic adjustment
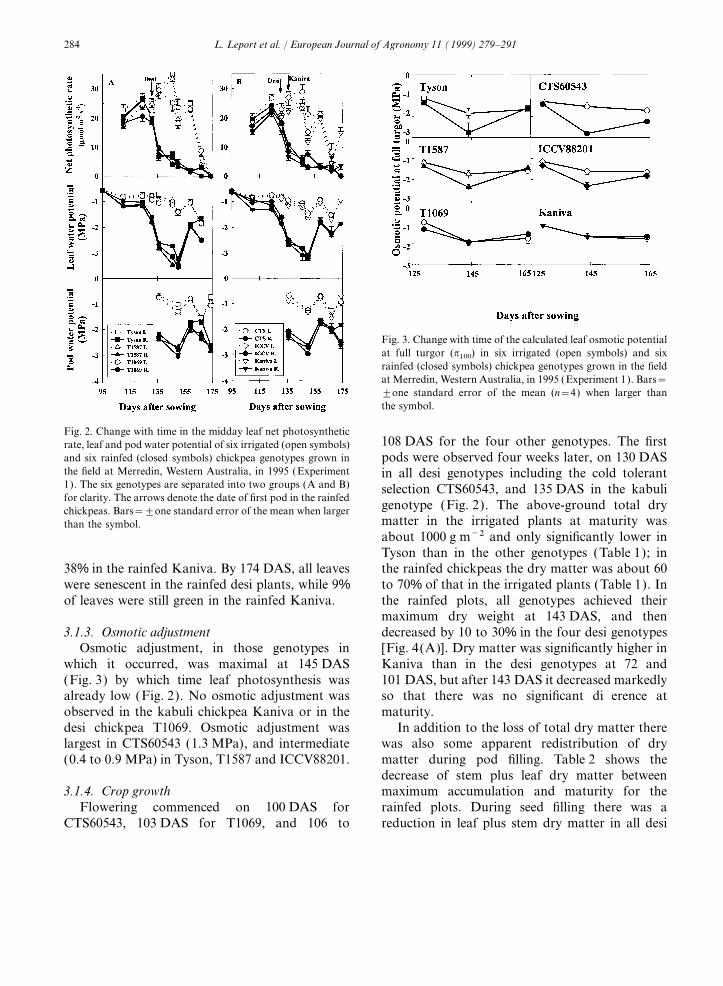
Osmotic adjustment, in those genotypes in [Fig. 4(A)]. Dry matter was significantly higher inKaniva than in the desi genotypes at 72 andwhich it occurred, was maximal at 145 DAS
(Fig. 3) by which time leaf photosynthesis was 101 DAS, but after 143 DAS it decreased markedlyso that there was no significant difference atalready low (Fig. 2). No osmotic adjustment was
observed in the kabuli chickpea Kaniva or in the maturity.In addition to the loss of total dry matter theredesi chickpea T1069. Osmotic adjustment was
largest in CTS60543 (1.3 MPa), and intermediate was also some apparent redistribution of drymatter during pod filling. Table 2 shows the(0.4 to 0.9 MPa) in Tyson, T1587 and ICCV88201.decrease of stem plus leaf dry matter betweenmaximum accumulation and maturity for the3.1.4. Crop growth
Flowering commenced on 100 DAS for rainfed plots. During seed filling there was areduction in leaf plus stem dry matter in all desiCTS60543, 103 DAS for T1069, and 106 to
285L. Leport et al. / European Journal of Agronomy 11 (1999) 279–291
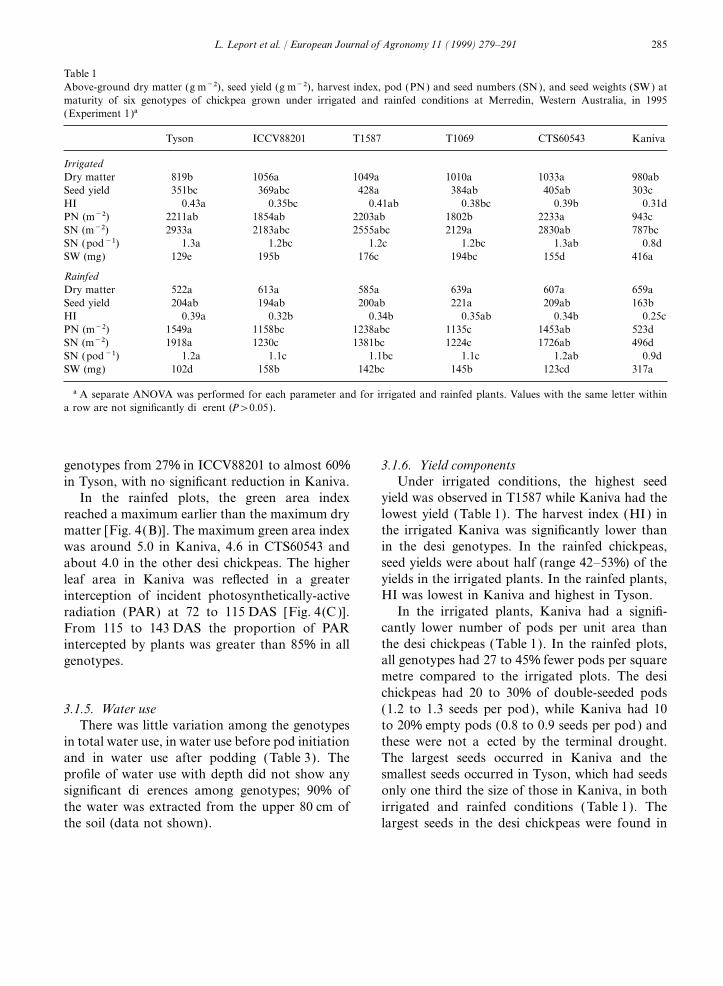
Table 1Above-ground dry matter (g m−2), seed yield (g m−2), harvest index, pod (PN) and seed numbers (SN ), and seed weights (SW ) atmaturity of six genotypes of chickpea grown under irrigated and rainfed conditions at Merredin, Western Australia, in 1995(Experiment 1)a
Tyson ICCV88201 T1587 T1069 CTS60543 Kaniva
IrrigatedDry matter 819b 1056a 1049a 1010a 1033a 980abSeed yield 351bc 369abc 428a 384ab 405ab 303cHI 0.43a 0.35bc 0.41ab 0.38bc 0.39b 0.31dPN (m−2) 2211ab 1854ab 2203ab 1802b 2233a 943cSN (m−2) 2933a 2183abc 2555abc 2129a 2830ab 787bcSN (pod−1) 1.3a 1.2bc 1.2c 1.2bc 1.3ab 0.8dSW (mg) 129e 195b 176c 194bc 155d 416a
RainfedDry matter 522a 613a 585a 639a 607a 659aSeed yield 204ab 194ab 200ab 221a 209ab 163bHI 0.39a 0.32b 0.34b 0.35ab 0.34b 0.25cPN (m−2) 1549a 1158bc 1238abc 1135c 1453ab 523dSN (m−2) 1918a 1230c 1381bc 1224c 1726ab 496dSN (pod−1) 1.2a 1.1c 1.1bc 1.1c 1.2ab 0.9dSW (mg) 102d 158b 142bc 145b 123cd 317a
a A separate ANOVA was performed for each parameter and for irrigated and rainfed plants. Values with the same letter withina row are not significantly different (P>0.05).
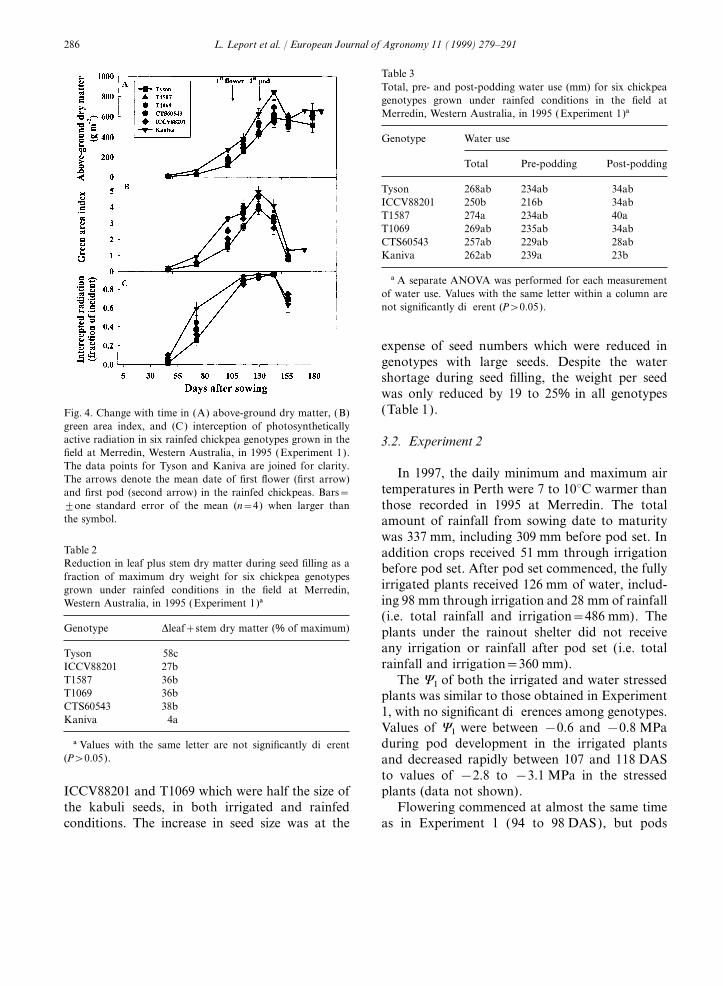
genotypes from 27% in ICCV88201 to almost 60% 3.1.6. Yield componentsUnder irrigated conditions, the highest seedin Tyson, with no significant reduction in Kaniva.
yield was observed in T1587 while Kaniva had theIn the rainfed plots, the green area indexlowest yield (Table 1). The harvest index (HI) inreached a maximum earlier than the maximum drythe irrigated Kaniva was significantly lower thanmatter [Fig. 4(B)]. The maximum green area indexin the desi genotypes. In the rainfed chickpeas,was around 5.0 in Kaniva, 4.6 in CTS60543 andseed yields were about half (range 42–53%) of theabout 4.0 in the other desi chickpeas. The higheryields in the irrigated plants. In the rainfed plants,leaf area in Kaniva was reflected in a greaterHI was lowest in Kaniva and highest in Tyson.interception of incident photosynthetically-active
In the irrigated plants, Kaniva had a signifi-radiation (PAR) at 72 to 115 DAS [Fig. 4(C )].cantly lower number of pods per unit area thanFrom 115 to 143 DAS the proportion of PARthe desi chickpeas (Table 1). In the rainfed plots,intercepted by plants was greater than 85% in allall genotypes had 27 to 45% fewer pods per squaregenotypes.metre compared to the irrigated plots. The desichickpeas had 20 to 30% of double-seeded pods(1.2 to 1.3 seeds per pod), while Kaniva had 103.1.5. Water use
There was little variation among the genotypes to 20% empty pods (0.8 to 0.9 seeds per pod) andthese were not affected by the terminal drought.in total water use, in water use before pod initiation
and in water use after podding (Table 3). The The largest seeds occurred in Kaniva and thesmallest seeds occurred in Tyson, which had seedsprofile of water use with depth did not show any
significant differences among genotypes; 90% of only one third the size of those in Kaniva, in bothirrigated and rainfed conditions (Table 1). Thethe water was extracted from the upper 80 cm of
the soil (data not shown). largest seeds in the desi chickpeas were found in
286 L. Leport et al. / European Journal of Agronomy 11 (1999) 279–291
Table 3Total, pre- and post-podding water use (mm) for six chickpeagenotypes grown under rainfed conditions in the field atMerredin, Western Australia, in 1995 (Experiment 1)a
Genotype Water use
Total Pre-podding Post-podding
Tyson 268ab 234ab 34abICCV88201 250b 216b 34abT1587 274a 234ab 40aT1069 269ab 235ab 34abCTS60543 257ab 229ab 28abKaniva 262ab 239a 23b
a A separate ANOVA was performed for each measurementof water use. Values with the same letter within a column arenot significantly different (P>0.05).
expense of seed numbers which were reduced ingenotypes with large seeds. Despite the watershortage during seed filling, the weight per seedwas only reduced by 19 to 25% in all genotypes(Table 1).Fig. 4. Change with time in (A) above-ground dry matter, (B)
green area index, and (C) interception of photosyntheticallyactive radiation in six rainfed chickpea genotypes grown in the 3.2. Experiment 2field at Merredin, Western Australia, in 1995 (Experiment 1).The data points for Tyson and Kaniva are joined for clarity.
In 1997, the daily minimum and maximum airThe arrows denote the mean date of first flower (first arrow)temperatures in Perth were 7 to 10°C warmer thanand first pod (second arrow) in the rainfed chickpeas. Bars=
±one standard error of the mean (n=4) when larger than those recorded in 1995 at Merredin. The totalthe symbol. amount of rainfall from sowing date to maturity
was 337 mm, including 309 mm before pod set. InTable 2 addition crops received 51 mm through irrigationReduction in leaf plus stem dry matter during seed filling as a before pod set. After pod set commenced, the fullyfraction of maximum dry weight for six chickpea genotypes
irrigated plants received 126 mm of water, includ-grown under rainfed conditions in the field at Merredin,ing 98 mm through irrigation and 28 mm of rainfallWestern Australia, in 1995 (Experiment 1)a(i.e. total rainfall and irrigation=486 mm). The
Genotype Dleaf+stem dry matter (% of maximum) plants under the rainout shelter did not receiveany irrigation or rainfall after pod set (i.e. totalTyson 58crainfall and irrigation=360 mm).ICCV88201 27b
T1587 36b The Yl of both the irrigated and water stressedT1069 36b plants was similar to those obtained in ExperimentCTS60543 38b 1, with no significant differences among genotypes.Kaniva 4a
Values of Yl were between −0.6 and −0.8 MPaduring pod development in the irrigated plantsa Values with the same letter are not significantly different
(P>0.05). and decreased rapidly between 107 and 118 DASto values of −2.8 to −3.1 MPa in the stressedplants (data not shown).ICCV88201 and T1069 which were half the size of
the kabuli seeds, in both irrigated and rainfed Flowering commenced at almost the same timeas in Experiment 1 (94 to 98 DAS), but podsconditions. The increase in seed size was at the
287L. Leport et al. / European Journal of Agronomy 11 (1999) 279–291
Table 4Above-ground dry matter (g m−2), seed yield (g m−2), and har-vest index (HI) at maturity of four cultivars of chickpea grownunder irrigated and water stressed conditions at Perth, WesternAustralia, in 1997 (Experiment 2)a
Tyson Sona Kaniva Bumper
IrrigatedDry matter 496a 494a 561a 524aSeed yield 233a 184a 113b 71cHI 0.47a 0.37a 0.20b 0.14b
Water stressedDry matter 159b 241ab 259ab 327aSeed yield 50b 69a 26c 30c
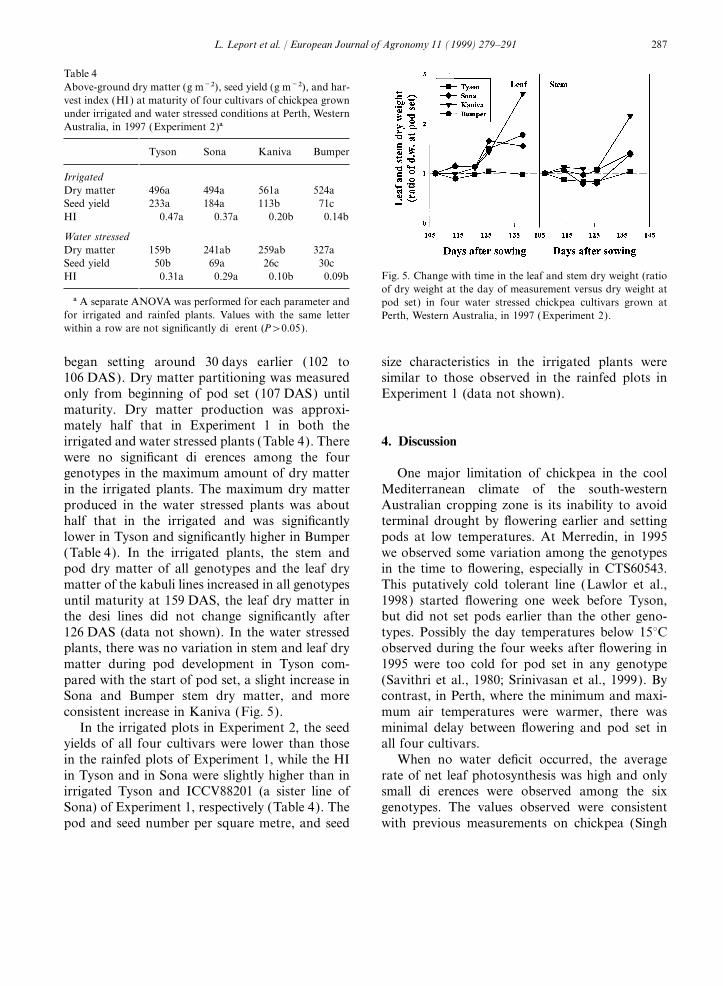
Fig. 5. Change with time in the leaf and stem dry weight (ratioHI 0.31a 0.29a 0.10b 0.09bof dry weight at the day of measurement versus dry weight at
a A separate ANOVA was performed for each parameter and pod set) in four water stressed chickpea cultivars grown atfor irrigated and rainfed plants. Values with the same letter Perth, Western Australia, in 1997 (Experiment 2).within a row are not significantly different (P>0.05).
began setting around 30 days earlier (102 to size characteristics in the irrigated plants weresimilar to those observed in the rainfed plots in106 DAS). Dry matter partitioning was measured
only from beginning of pod set (107 DAS) until Experiment 1 (data not shown).maturity. Dry matter production was approxi-mately half that in Experiment 1 in both theirrigated and water stressed plants (Table 4). There 4. Discussionwere no significant differences among the fourgenotypes in the maximum amount of dry matter One major limitation of chickpea in the cool
Mediterranean climate of the south-westernin the irrigated plants. The maximum dry matterproduced in the water stressed plants was about Australian cropping zone is its inability to avoid
terminal drought by flowering earlier and settinghalf that in the irrigated and was significantlylower in Tyson and significantly higher in Bumper pods at low temperatures. At Merredin, in 1995
we observed some variation among the genotypes(Table 4). In the irrigated plants, the stem andpod dry matter of all genotypes and the leaf dry in the time to flowering, especially in CTS60543.
This putatively cold tolerant line (Lawlor et al.,matter of the kabuli lines increased in all genotypesuntil maturity at 159 DAS, the leaf dry matter in 1998) started flowering one week before Tyson,
but did not set pods earlier than the other geno-the desi lines did not change significantly after126 DAS (data not shown). In the water stressed types. Possibly the day temperatures below 15°C
observed during the four weeks after flowering inplants, there was no variation in stem and leaf drymatter during pod development in Tyson com- 1995 were too cold for pod set in any genotype
(Savithri et al., 1980; Srinivasan et al., 1999). Bypared with the start of pod set, a slight increase inSona and Bumper stem dry matter, and more contrast, in Perth, where the minimum and maxi-
mum air temperatures were warmer, there wasconsistent increase in Kaniva (Fig. 5).In the irrigated plots in Experiment 2, the seed minimal delay between flowering and pod set in
all four cultivars.yields of all four cultivars were lower than thosein the rainfed plots of Experiment 1, while the HI When no water deficit occurred, the average
rate of net leaf photosynthesis was high and onlyin Tyson and in Sona were slightly higher than inirrigated Tyson and ICCV88201 (a sister line of small differences were observed among the six
genotypes. The values observed were consistentSona) of Experiment 1, respectively (Table 4). Thepod and seed number per square metre, and seed with previous measurements on chickpea (Singh
288 L. Leport et al. / European Journal of Agronomy 11 (1999) 279–291
et al., 1982; Leport et al., 1998). With the develop- Pate, 1977), and the pod wall is assumed to playa significant role in the reassimilation of respiredment of water deficits, the rate of photosynthesis
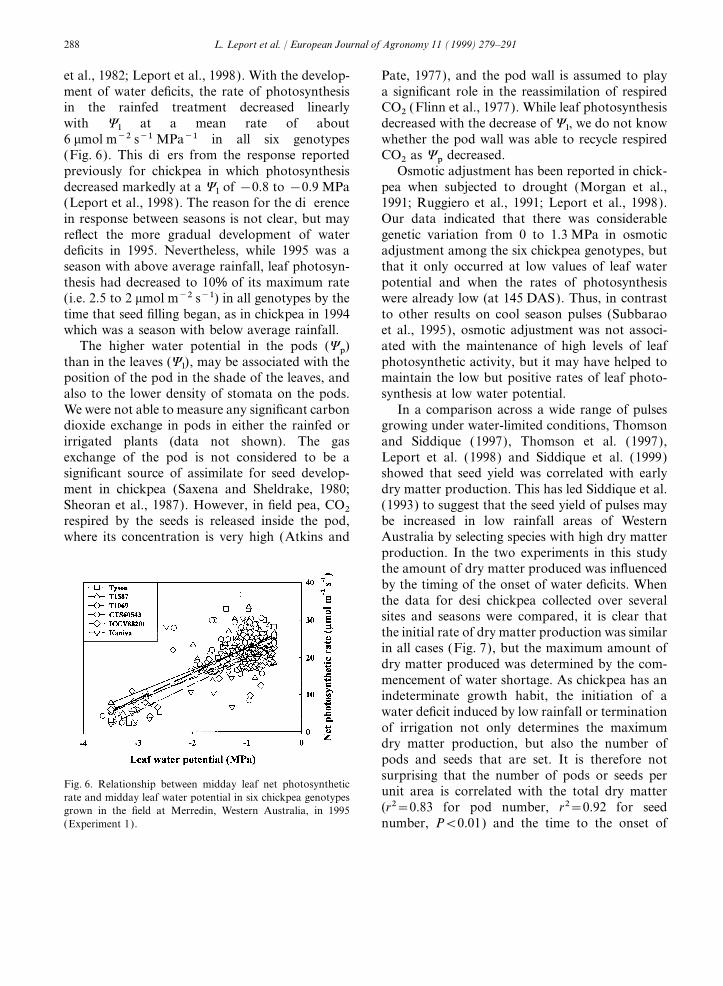
in the rainfed treatment decreased linearly CO2 (Flinn et al., 1977). While leaf photosynthesisdecreased with the decrease of Yl, we do not knowwith Yl at a mean rate of about
6 mmol m−2 s−1 MPa−1 in all six genotypes whether the pod wall was able to recycle respiredCO2 as Yp decreased.(Fig. 6). This differs from the response reported
previously for chickpea in which photosynthesis Osmotic adjustment has been reported in chick-pea when subjected to drought (Morgan et al.,decreased markedly at a Yl of −0.8 to −0.9 MPa
(Leport et al., 1998). The reason for the difference 1991; Ruggiero et al., 1991; Leport et al., 1998).Our data indicated that there was considerablein response between seasons is not clear, but may
reflect the more gradual development of water genetic variation from 0 to 1.3 MPa in osmoticadjustment among the six chickpea genotypes, butdeficits in 1995. Nevertheless, while 1995 was a
season with above average rainfall, leaf photosyn- that it only occurred at low values of leaf waterpotential and when the rates of photosynthesisthesis had decreased to 10% of its maximum rate
(i.e. 2.5 to 2 mmol m−2 s−1) in all genotypes by the were already low (at 145 DAS). Thus, in contrastto other results on cool season pulses (Subbaraotime that seed filling began, as in chickpea in 1994
which was a season with below average rainfall. et al., 1995), osmotic adjustment was not associ-ated with the maintenance of high levels of leafThe higher water potential in the pods (Yp)
than in the leaves (Yl), may be associated with the photosynthetic activity, but it may have helped tomaintain the low but positive rates of leaf photo-position of the pod in the shade of the leaves, and
also to the lower density of stomata on the pods. synthesis at low water potential.In a comparison across a wide range of pulsesWe were not able to measure any significant carbon
dioxide exchange in pods in either the rainfed or growing under water-limited conditions, Thomsonand Siddique (1997), Thomson et al. (1997),irrigated plants (data not shown). The gas
exchange of the pod is not considered to be a Leport et al. (1998) and Siddique et al. (1999)showed that seed yield was correlated with earlysignificant source of assimilate for seed develop-
ment in chickpea (Saxena and Sheldrake, 1980; dry matter production. This has led Siddique et al.(1993) to suggest that the seed yield of pulses maySheoran et al., 1987). However, in field pea, CO2
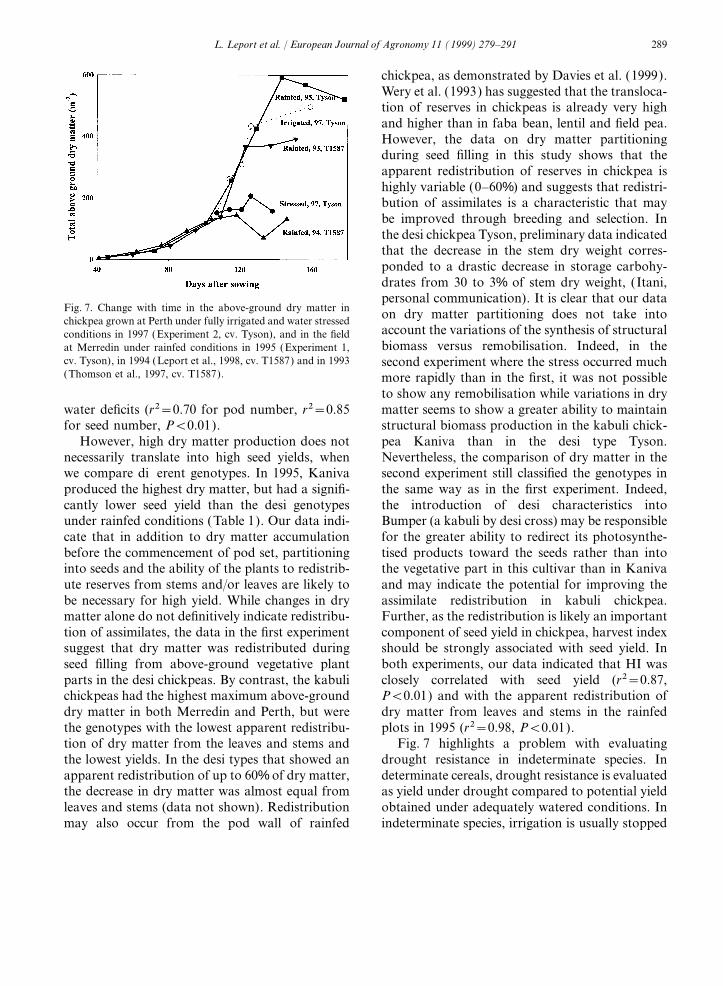
respired by the seeds is released inside the pod, be increased in low rainfall areas of WesternAustralia by selecting species with high dry matterwhere its concentration is very high (Atkins andproduction. In the two experiments in this studythe amount of dry matter produced was influencedby the timing of the onset of water deficits. Whenthe data for desi chickpea collected over severalsites and seasons were compared, it is clear thatthe initial rate of dry matter production was similarin all cases (Fig. 7), but the maximum amount ofdry matter produced was determined by the com-mencement of water shortage. As chickpea has anindeterminate growth habit, the initiation of awater deficit induced by low rainfall or terminationof irrigation not only determines the maximumdry matter production, but also the number ofpods and seeds that are set. It is therefore notsurprising that the number of pods or seeds per
Fig. 6. Relationship between midday leaf net photosyntheticunit area is correlated with the total dry matterrate and midday leaf water potential in six chickpea genotypes(r2=0.83 for pod number, r2=0.92 for seedgrown in the field at Merredin, Western Australia, in 1995
(Experiment 1). number, P<0.01) and the time to the onset of
289L. Leport et al. / European Journal of Agronomy 11 (1999) 279–291
chickpea, as demonstrated by Davies et al. (1999).Wery et al. (1993) has suggested that the transloca-tion of reserves in chickpeas is already very highand higher than in faba bean, lentil and field pea.However, the data on dry matter partitioningduring seed filling in this study shows that theapparent redistribution of reserves in chickpea ishighly variable (0–60%) and suggests that redistri-bution of assimilates is a characteristic that maybe improved through breeding and selection. Inthe desi chickpea Tyson, preliminary data indicatedthat the decrease in the stem dry weight corres-ponded to a drastic decrease in storage carbohy-drates from 30 to 3% of stem dry weight, (Itani,personal communication). It is clear that our data
Fig. 7. Change with time in the above-ground dry matter in on dry matter partitioning does not take intochickpea grown at Perth under fully irrigated and water stressedaccount the variations of the synthesis of structuralconditions in 1997 (Experiment 2, cv. Tyson), and in the fieldbiomass versus remobilisation. Indeed, in theat Merredin under rainfed conditions in 1995 (Experiment 1,
cv. Tyson), in 1994 (Leport et al., 1998, cv. T1587) and in 1993 second experiment where the stress occurred much(Thomson et al., 1997, cv. T1587). more rapidly than in the first, it was not possible
to show any remobilisation while variations in drymatter seems to show a greater ability to maintainwater deficits (r2=0.70 for pod number, r2=0.85
for seed number, P<0.01). structural biomass production in the kabuli chick-pea Kaniva than in the desi type Tyson.However, high dry matter production does not
necessarily translate into high seed yields, when Nevertheless, the comparison of dry matter in thesecond experiment still classified the genotypes inwe compare different genotypes. In 1995, Kaniva
produced the highest dry matter, but had a signifi- the same way as in the first experiment. Indeed,the introduction of desi characteristics intocantly lower seed yield than the desi genotypes
under rainfed conditions (Table 1). Our data indi- Bumper (a kabuli by desi cross) may be responsiblefor the greater ability to redirect its photosynthe-cate that in addition to dry matter accumulation
before the commencement of pod set, partitioning tised products toward the seeds rather than intothe vegetative part in this cultivar than in Kanivainto seeds and the ability of the plants to redistrib-
ute reserves from stems and/or leaves are likely to and may indicate the potential for improving theassimilate redistribution in kabuli chickpea.be necessary for high yield. While changes in dry
matter alone do not definitively indicate redistribu- Further, as the redistribution is likely an importantcomponent of seed yield in chickpea, harvest indextion of assimilates, the data in the first experiment
suggest that dry matter was redistributed during should be strongly associated with seed yield. Inboth experiments, our data indicated that HI wasseed filling from above-ground vegetative plant
parts in the desi chickpeas. By contrast, the kabuli closely correlated with seed yield (r2=0.87,P<0.01) and with the apparent redistribution ofchickpeas had the highest maximum above-ground
dry matter in both Merredin and Perth, but were dry matter from leaves and stems in the rainfedplots in 1995 (r2=0.98, P<0.01).the genotypes with the lowest apparent redistribu-
tion of dry matter from the leaves and stems and Fig. 7 highlights a problem with evaluatingdrought resistance in indeterminate species. Inthe lowest yields. In the desi types that showed an
apparent redistribution of up to 60% of dry matter, determinate cereals, drought resistance is evaluatedas yield under drought compared to potential yieldthe decrease in dry matter was almost equal from
leaves and stems (data not shown). Redistribution obtained under adequately watered conditions. Inindeterminate species, irrigation is usually stoppedmay also occur from the pod wall of rainfed
290 L. Leport et al. / European Journal of Agronomy 11 (1999) 279–291
when plants in the water-limited plot reach physio- tions. Verification of this using labelled carbon iswarranted.logical maturity. In Experiment 2, the irrigation
was stopped in the irrigated treatment when thewater stressed plants were at physiological matu-rity at 130 DAS. This was when water shortage Acknowledgementsstarted in the field at Merredin in Experiment 1.As a consequence, dry matter production, seed We thank J.S. Malden, for dry matter samplingyield and yield components in the irrigated plants and collection of weather data, C.A. Toynes andin Experiment 2 were very similar to those found I.F. LeCoultre, L. Maiolo and L. French, forunder rainfed conditions in Experiment 1. assistance with the measurements at the field site,However, the water stressed plants had markedly and L. Young for the day-to-day running of thereduced total above-ground dry matter, seed experiment. We are grateful to Dr. B.D. Thomsonnumber, seed yield and harvest index, giving a for his helpful advice on the conduct of the experi-relative yield under drought [expressed as a percen- ment at Merredin, Dr. R.J.N. Emery for his helptage of yield potential (Fischer and Maurer, 1978)] with statistical analyses, and Drs. M. Dracup andof about 60% in 1995, 20–30% in 1994 and 1997, S.P. Loss for their useful comments on the manu-but only 14% in 1994 and 1997 if the 1995 irrigated script. This research was supported by theplants were used to give the yield potential. Thus Cooperative Research Centre for Legumes inin indeterminate species such as chickpea it is Mediterranean Agriculture.difficult to compare the drought resistance acrosssites and seasons, as its evaluation may simplyreflect the length of time that irrigation is main-
Referencestained in the plots used to determine potentialyield.
Atkins, C.A., Pate, J.S., 1977. An IRGA technique to measureCO2 content of small volumes of gas from the internal atmo-spheres of plant organs. Photosynthetica 11, 214–216.
Buddenhagen, I.W., Richards, R.A., 1988. Breeding cool-season food legumes for improved performance in stress5. Conclusionsenvironments. In: Summerfield, R.J. (Ed.), World Crops:Cool Season Food Legumes. Kluwer, Dordrecht, pp. 81–95.There were no consistent differences in water
Davies, S.L., Turner, N.C., Siddique, K.H.M., Plummer, J.A.,potential and leaf photosynthesis among the geno- Leport, L., 1999. Seed growth of desi and kabuli chickpeatypes of chickpea exposed to terminal drought. At (Cicer arietinum L.) in a short-season Mediterranean-type
environment. Aust. J. Exp. Agric. 39, 181–188.Merredin, none of the six genotypes studied wereFischer, R.A., Maurer, R., 1978. Drought resistance in springable to avoid drought by early pod development.
wheat cultivars. I. Grain yield responses. Aust. J. Agric.Although some genotypes flowered earlier thanRes. 29, 897–912.
others, all genotypes began pod set at the same Flinn, A.M., Atkins, C.A., Pate, J.S., 1977. Significance oftime due to the failure of flowers to set pods in photosynthetic and respiratory exchanges in the carbon
economy of the developing pea fruit. Plant Physiol. 60,the cool spring temperatures. As a consequence,412–418.at Merredin, where cold temperatures did not
Lawlor, H.J., Siddique, K.H.M., Sedgley, R.H., Thurling, N.,allow early pod set, there was only a poor correla-1998. Improvement of cold tolerance and insect resistance
tion between high seed yield and early growth or in chickpea (Cicer arietinum L.) and the use of AFLPs formaximum dry matter production in the chickpea the identification of molecular markers for these traits. Acta
Hort. 461, 185–192.genotypes studied. However, our data show thatLeport, L., Turner, N.C., French, R.J., Tennant, D., Thomson,a high HI is necessary for a high yield and that
B.D., Siddique, K.H.M., 1998. Water relations, gas-partitioning and redistribution of dry matter fromexchange, and growth of cool-season grain legumes in a
stems and leaves is apparently one of the main Mediterranean-type environment. Eur. J. Agron. 9,characteristics resulting in high seed yield in chick- 295–303.
Morgan, J.M., Rodrıguez-Maribona, B., Knights, E.J., 1991.peas growing under Mediterranean-type condi-
291L. Leport et al. / European Journal of Agronomy 11 (1999) 279–291
Adaptation to water-deficit in chickpea breeding lines by Singh, K.B., 1993. Problems and prospects of stress resistancebreeding in chickpea. In: Singh, K.B., Saxena, M.C. (Eds.),osmoregulation: relationship to grain-yields in the field.
Field Crops Res. 27, 61–70. Breeding for Stress Tolerance in Cool-Season FoodLegumes. Wiley, Chichester, pp. 17–35.Ruggiero, C., De Falco, E., Pardo, A., De Falco, E., 1991.
Variation of leaf water potential and osmotic adjustment of Srinivasan, A., Saxena, N.P., Johansen, C., 1999. Cold toler-ance during early reproduction growth of chickpea (Cicerthree chickpea (Cicer arietinum L.) cultivars sown in winter
and spring. Riv. di Agron. 25, 539–545. arietinum L.): genetic variation in gamete development andfunction. Field Crops Res. 60, 209–222.SAS Institute, 1987. SAS User’s Guide: Statistical Version. 6th
edn., SAS Institute Publishing, Cary. Subbarao, G.B., Johansen, C., Slinkard, A.E., Rao, R.C.N.,Saxena, N.P., Chauhan, Y.S., 1995. Strategies for improvingSavithri, K.S., Ganapathy, P.S., Sinha, S.K., 1980. Sensitivity
to low temperature in pollen germination and fruit-set in drought resistance in grain legumes. Crit. Rev. Plant Sci.14, 469–523.Cicer arietinum L.. J. Exp. Bot. 31, 475–481.
Saxena, N.P., Sheldrake, A.R., 1980. Effects of pod exposure Thomson, B.D., Siddique, K.H.M., 1997. Grain legume speciesin low rainfall Mediterranean-type environments. II.on yield of chickpeas (Cicer arietinum). Field Crops Res.
3, 189–191. Canopy development, radiation interception and dry matterproduction. Field Crops Res. 54, 189–199.Sheoran, I.S., Singal, H.R., Singh, R., 1987. Photosynthetic
characteristics of chickpea (Cicer arietinum L.) pod wall Thomson, B.D., Siddique, K.H.M., Barr, M.D., Wilson, J.M.,1997. Grain legume species in low rainfall Mediterranean-during seed development. Ind. J. Exp. Biol. 25, 843–847.
Siddique, K.H.M., Walton, G.H., Seymour, M., 1993. A com- type environments. I. Phenology and seed yield. Field CropsRes. 54, 173–187.parison of seed yields of winter grain legumes in Western
Australia. Aust. J. Exp. Agric. 33, 915–922. Turner, N.C., 1981. Techniques and experimental approachesfor the measurement of plant water status. Plant Soil 58,Siddique, K.H.M., Brinsmead, R.B., Knight, R., Knights, E.J.,
Paull, J.G., Rose, I.A., 1999. Adaptation of chickpea (Cicer 339–366.Turner, N.C., 1997. Further progress in crop water relations.arietinum L.) and faba bean (Vicia faba L.) to Australia. In:
Knight, R. (Ed.), Cool-season Food Legumes. Kluwer, Ade- Adv. Agron. 58, 293–338.Wery, J., Turc, O., Lecoeur, J., 1993. Mechanisms of resistancelaide, in press
Singh, D.P., Rawson, H.M., Turner, N.C., 1982. Effect of radia- to cold, heat and drought in cool-season legumes, withspecial reference to chickpea and pea. In: Singh, K.B.,tion, temperature and humidity on photosynthesis, transpi-
ration and water use efficiency of chickpea (Cicer arietinum Saxena, M.C. (Eds.), Breeding for Stress Tolerance in Cool-Season Food Legumes. Wiley, Chichester, pp. 271–291.L.). Ind. J. Plant Physiol. 25, 32–39.