Embed Size (px)
Citation preview

Physiological optics and the
photoreceptor mosaic
Andrew Stockman
NEUR 3045Visual Neuroscience

Outline
The eyeVisual opticsImage qualityMeasuring image qualityWhat limits visual performance?Refractive errorsSamplingWhy visual acuity should be limited by the optics and samplingAdaptive opticsChromatic aberrations

The retina is carpeted with light-sensitive rods and cones
An inverted image is formed on the retina by the cornea and lens.
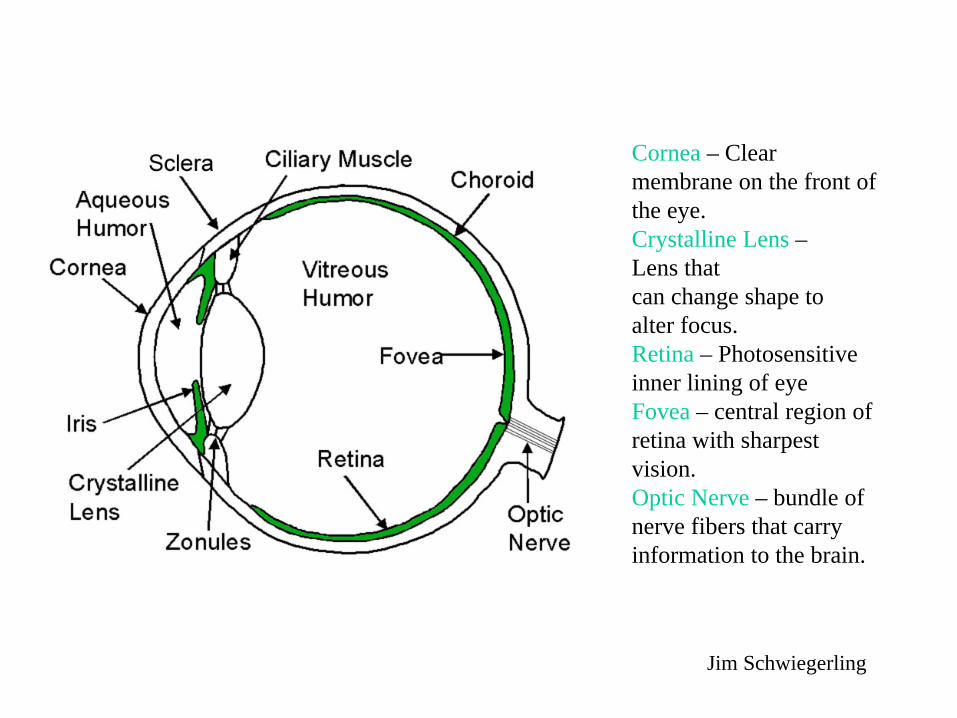
Cornea – Clearmembrane on the front ofthe eye.Crystalline Lens –Lens thatcan change shape toalter focus.Retina – Photosensitiveinner lining of eyeFovea – central region ofretina with sharpestvision.Optic Nerve – bundle ofnerve fibers that carryinformation to the brain.
Jim Schwiegerling

Visual optics

Crystalline lens
Jim Schwiegerling
Cornea

BBC Horizon: Light Fantastic (2006)
Jim Bowmaker dissecting an eye…

Retinal cross-section
Retina 200 ×LIGHT

Accommodation to Target Distance
Distant target, relaxed ciliary muscles
Near target, accommodated eye, constricted ciliary muscles.
Larry Thibos

Jim Schwiegerling
Relaxed ciliary muscle pulls zonules taut an flattens crystalline lens.
Constricted ciliary muscle releases tension on zonules and crystalline lens bulges.
Accommodation

Image quality

Point spread function
OpticalSystemscene image
( )xδ ( )xPSFOpticalSystempoint source point spread function
Optical systems are rarely ideal.
Point spread function of Human Eyes
PSFInput

From Webvision, Michael Kalloniatis
Point in visual space
Point spread function (PSF)

The Point Spread Function (PSF) characterizes the optical performance of the eye.

Measuring image quality “psychophysically”
1. Visual acuity measures

6/60
6/30
6/21
6/15
6/126/9
6/7.56/6
Smallest resolvable black and whitetarget. Many different types oftests are available , but the letter chart introduced by Snellen in 1862 is the most common.

6/60
6/30
6/21
6/15
6/126/9
6/7.56/6
Snellen defined “standard vision” as the ability to recognize one of his optotypes when it subtended 5 minutes of arc. Thus, the optotypecan only be recognized if the person viewing it can discriminate a spatial patterns separated by visual angles of 1 minute of arc.
A Snellen chart is placed at a standard distance, twenty feet in the US (6 metres in Europe). At this distance, the symbols on the line representing "normal" acuity subtend an angle of five minutes of arc, and the thickness of the lines and of the spaces between the lines subtends one minute of arc. This line, designated 20/20, is the smallest line that a person with normal acuity can read at a distance of twenty feet.
The letters on the 20/40 line are twice as large. A person with normal acuity could be expected to read these letters at a distance of forty feet. This line is designated by the ratio 20/40. If this is the smallest line a person can read, the person's acuity is "20/40."
NORMALACUITY

6/60
6/30
6/21
6/15
6/126/9
6/7.56/6


Visual Acuity: four standard methods
Letter acuity
(Snellen)
Grating acuity
2-line resolution
2-point resolution
vs.
vs.
Orientation resolution acuity
Detection acuity
Arthur Bradley
Can the subject correctly identify the letter or the letter orientation?
Can the subject see two lines or points rather than one?

21
MAR
MAR = Minimum Angle of Resolution
MAR is the smallest gap between letter strokes or grating bars that can be detected/resolved.
6/6 (20/20) letter: bar/stroke width = 1 arc minute, letter height = 5 min Grating period = 2 arc minute (1/30 degree) when bar = 1 min, and grating SF = 1/period = 30 c/deg,
{One period or cycle
Arthur Bradley

Snellen Metric Snellen
MAR in arc minutes Log MAR Decimal Grating VA
c/deg
20/10 6/3 0.5 -0.3 2.0 6020/15 6/4.5 0.75 -.12 1.33 4020/20 6/6 1 0.0 1.0 3020/25 6/7.5 1.25 0.1 0.8 2420/30 6/9 1.5 0.18 0.7 2120/40 6/12 2 0.3 0.5 1520/50 6/15 2.5 0.4 0.4 1220/70 6/21 3.5 0.54 0.3 920/100 6/30 5 0.7 0.2 620/200 6/60 10 1.0 0.1 3
Comparison of seven different visual acuity measures
Arthur Bradley
NORMALACUITY
Measuring image quality psychophysically
2. Spatial contrast sensitivity measures

Spatial frequency

Harmonics of a square wave
7531
Steven Lehars
1
35
1+3+5

Harmonics of a square and triangle wave
Square
Triangle

Space Spatial Frequency
All frequencies
One frequency
Fourier transform
Inverse Fourier transform

What would the results for a perfect lens look like?
InverseFourier
transform
PSF
Fourier transform
Image of line
SpatialMTF
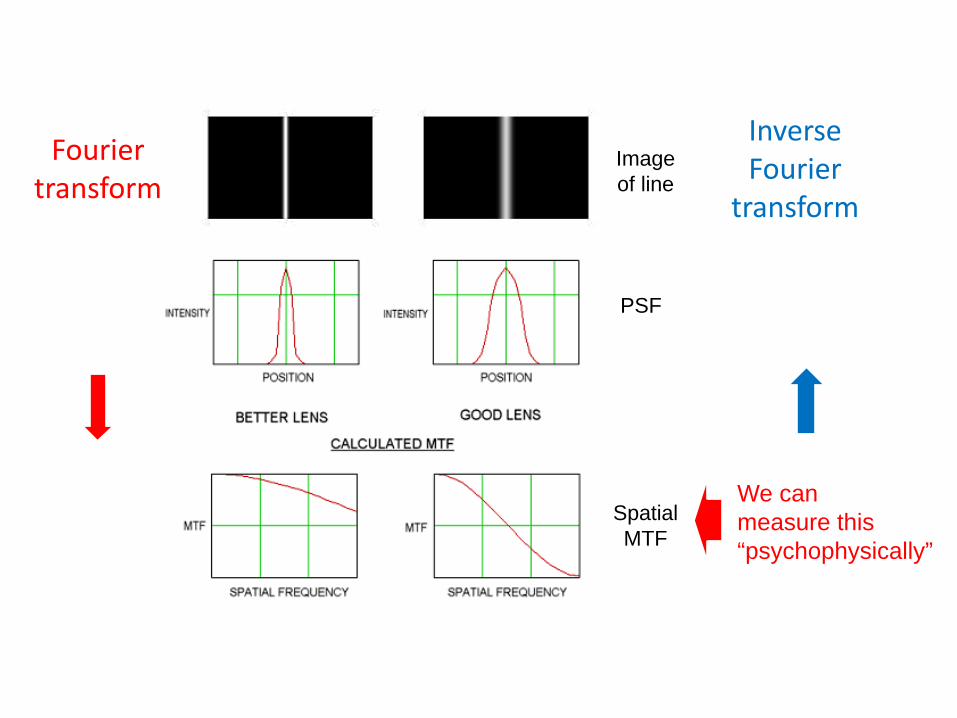
PSF
We canmeasure this “psychophysically”
Fourier transform
Image of line
SpatialMTF
InverseFourier
transform

Source: Hans Irtel
Spatial frequency gratingsIn
crea
sing
spa
tial f
requ
ency
Increasing contrast

Spatial MTF Spatial frequency in this image increases in the horizontal direction and modulation depth decreases in the vertical direction.
Increasing spatial frequency
Incr
easi
ng c
ontra
st

Spatial MTF
Increasing spatial frequency
Incr
easi
ng c
ontra
stThe apparent border between visible and invisible modulation corresponds to your own visual modulation transfer function.

low highmediumSpatial Frequency (c/deg)
Cont
rast
Sen
sitiv
ity
(1/c
ontr
ast t
hres
hold
)Peak CS
Peak SFHigh SFcut-off
Contrast Sensitivity Function (CSF)2. Grating Contrast Sensitivity
Arthur Bradley
“Bandpass”

Example of grating contrast sensitivity test using printed gratingsIn
crea
sing
spa
tial f
requ
ency
Increasing contrast “sensitivity”
Increasing contrast
Arthur Bradley

Spatial CSFs
What happens as the visual system light adapts?

logM
AR
Log Retinal Illuminance (Trolands)
6/60
6/6
Rod vision
logM
AR
Retinal Eccentricity (degrees)
6/60
6/6
Scotopic
0 30
Photopic
Vision is not always 6/6!
Light Level
Eccentricity
Arthur Bradley

Light Level
PhotopicMesopic
Scotopic
20/200 20/15
Eccentricity
Foveal4deg
30deg
Contrast Sensitivity is not constant!
Arthur Bradley
What limits visual performance?
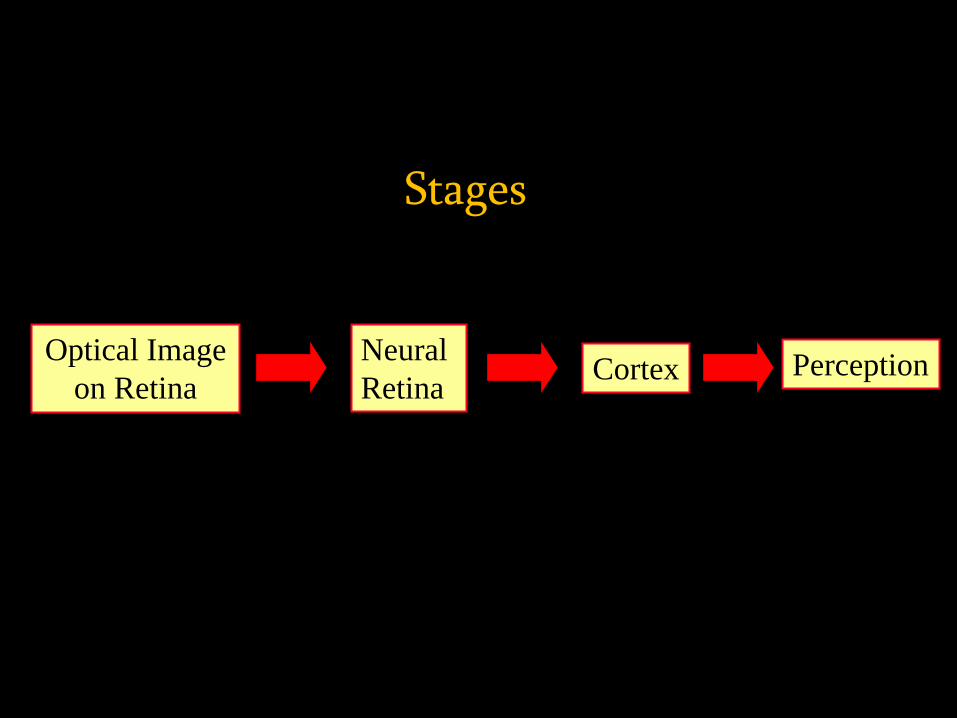
Optical Image on Retina
Neural Retina Cortex Perception
Stages
Arthur Bradley

Optical Image on Retina
Stages
Arthur Bradley
Consider optical limits first

Approximation of diffraction pattern from a slit of width four wavelengths with an incident plane wave. The main central beam, nulls, and phase reversals are apparent (Wikipedia).
The visual image is diffraction limited

Wikipedia
5-wavelength slit1-wavelength slit

From Webvision, Michael Kalloniatis
For a diffraction-limited image an Airy disk pattern is formed on the retina from a point source due to the diffraction at the pupil.
Airy disc (PSF)
Perception
2D profile

From Webvision, Michael Kalloniatis
How does this affect spatial resolution?
Airy disc (PSF)
Perception
2D profile

From Webvision, Michael Kalloniatis
Two points in visual space
Overlapping point spread functions (PSF)

The Rayleigh criterion for resolving two point sources of equal brightness is when the peak of one diffraction pattern lies upon the first minimum of the other. This yields a theoretical maximum angular resolution referred to as diffraction-limited resolution given by:
where Δθ is in radians, D is the diameter of the aperture (i.e. the pupil in this case) in the same units as the wavelength λ of the light.
Two points in visual space
From Webvision,Michael Kalloniatis
Light intensity profile (PSF) at the back of the eye produced by the points

So, for a 550 nm light and a 3 mm diameter pupil, Δθ = 0.77 min of arc.
Two points in visual space
Light intensity profile (PSF) at the back of the eye produced by the points

From Webvision, Michael Kalloniatis
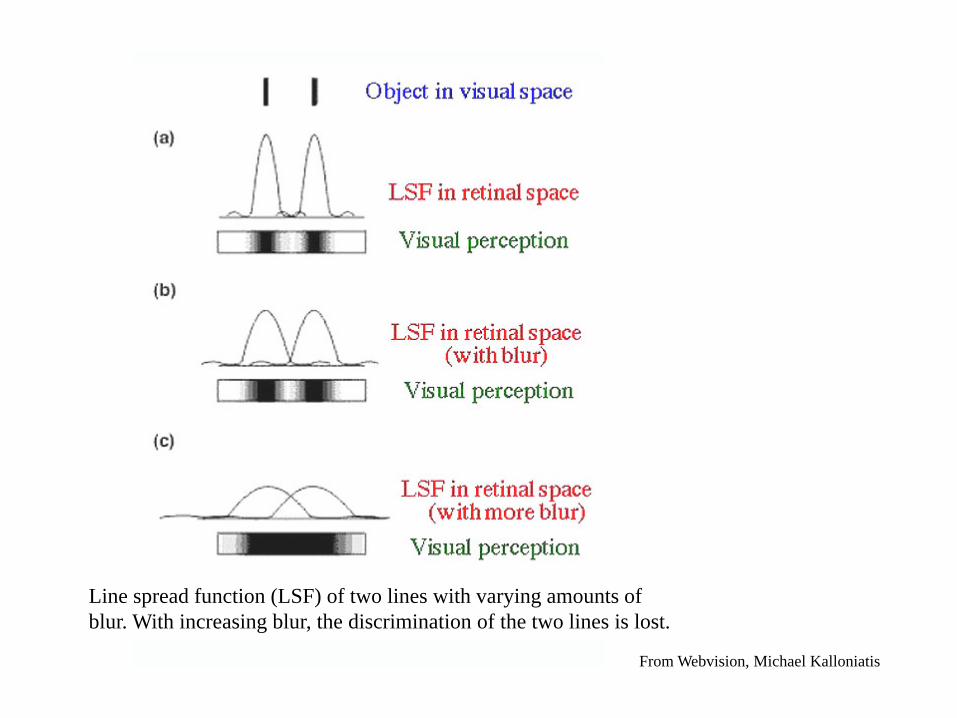
Two lines in visual space
The two lines (a) can be perceptually resolved, but the two lines (b) cannot and are perceived as a single line.
Line spread functions at the back of the eye

Snellen Metric Snellen
MAR in arc
minutes
LogMAR Decimal Grating VA c/deg
JaegerNear VA
20/10 6/3 0.5 -0.3 2.0 60 NA20/15 6/4.5 0.75 -.12 1.33 40 NA20/20 6/6 1 0.0 1.0 30 J1+20/25 6/7.5 1.25 0.1 0.8 24 J120/30 6/9 1.5 0.18 0.7 21 J220/40 6/12 2 0.3 0.5 15 J320/50 6/15 2.5 0.4 0.4 12 J520/70 6/21 3.5 0.54 0.3 9 J720/100 6/30 5 0.7 0.2 6 J1020/200 6/60 10 1.0 0.1 3 J16
Comparison of seven different visual acuity measures
Arthur Bradley
DIFFRACTIONLIMIT

20/20 6/6 1 0.0 1.0 30 J1+
Snellen Metric Snellen
MAR in arc
minutes
LogMAR Decimal Grating VA c/deg
JaegerNear VA
Normal acuity is well matched to the diffraction limited resolution for a 550 nm light and a 3 mm diameter pupil of 0.77 min of arc.

The size of the pupil is an important factor affecting visual acuity.
A large pupil allows more light to reach the retina and reduces diffraction but resolution is reduced because the optical aberrations are greater (a greater area of the lens and cornea are used and they are imperfect).
A small pupil reduces optical aberrations but resolution is then diffraction limited.
A mid-size pupil of about 3 mm to 5 mm represents a compromise between the diffraction and aberration limits
Pupil size

Aberrations of the Eye
Perfect optics Imperfect optics
Larry Thibos

So far we have been talking about foveal vision at optimal light levels with optimal refraction…

Refractive errors

From Webvision, Michael Kalloniatis
Nearsighted
Farsighted
PSFs for different refractive errors
From Webvision, Michael Kalloniatis
Line spread function (LSF) of two lines with varying amounts of blur. With increasing blur, the discrimination of the two lines is lost.
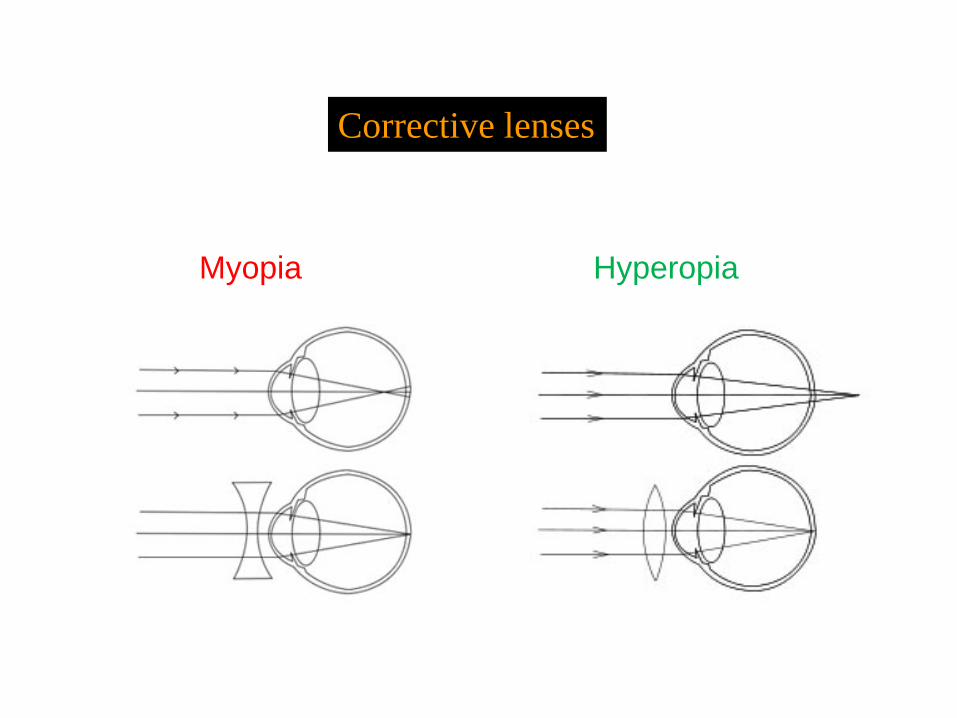
Corrective lenses
Myopia Hyperopia

Focalplane
Light
Lens
Emmetropia(normal)
Myopia(nearsightedness)
Hyperopia(farsightedness)
Presbyopia(aged)

Presbyopia (age related far-sightedness)

What else limits visual performance?

Optical Image on Retina
Neural Retina Cortex Perception
Stages
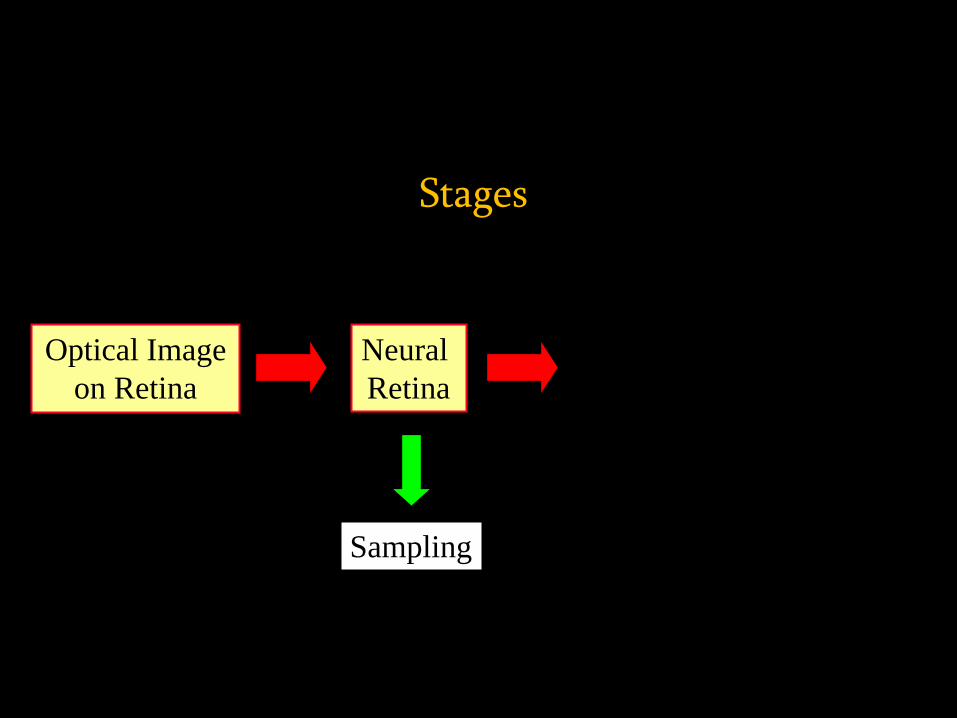
Optical Image on Retina
Neural Retina
Stages
Sampling

Retinal sampling

From Webvision, Michael Kalloniatis

False color images showing the arrangement of L (red), M (green), and S (blue) cones in the retinas of differenthuman subjects. All images are shown to the same scale.
Hofer et al., 2005

Impact of sampling on letter visual acuity: Notice that the foveal sampling is perfectly adequate to represent a 6/6 (20/20) letter, but inadequate to represent a 6/1.5 (20/5) letter.
Austin Roorda, 2004
6/6 letter
6/1.5 letter

Human photoreceptors
Rods Achromatic
night vision 1 type
Short-wavelength-sensitive (S) or “blue” cone
Middle-wavelength-sensitive (M) or “green” cone
Long-wavelength-sensitive (L) or “red” cone
Cones Daytime, achromatic
and chromatic vision 3 types
Rod

Central fovea is rod-free, and the very central foveola is rod- and S-cone free
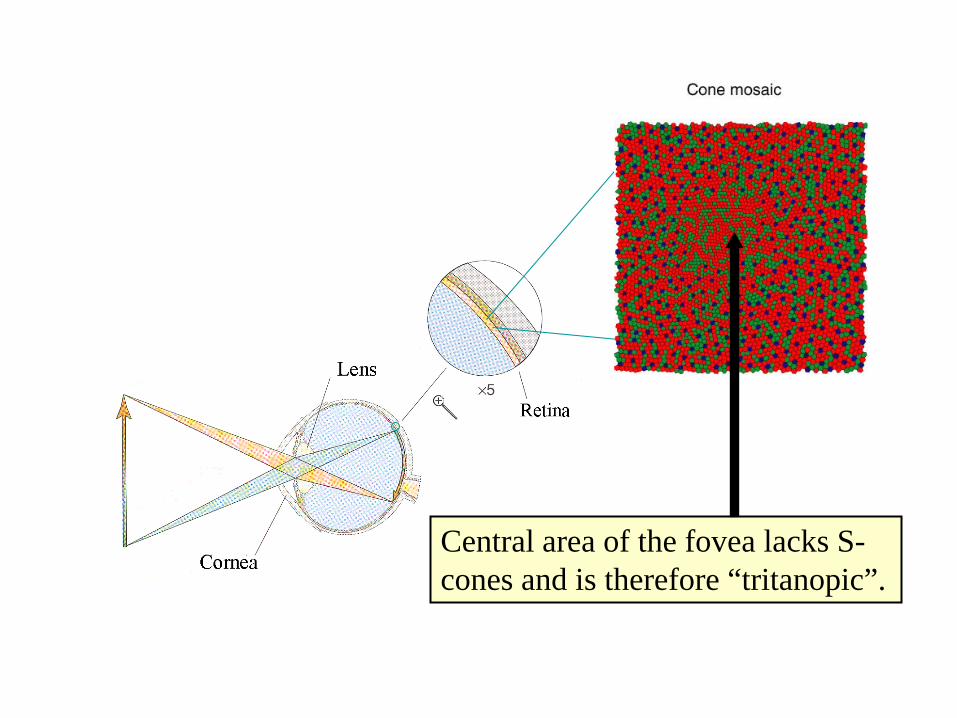
Central area of the fovea lacks S-cones and is therefore “tritanopic”.

In other retinal regions, the S-cone mosaic remains sparse.
Curcio et al.
S-cones form between 5 and
10% of the cone population.

Small field tritanopia

Changes with eccentricity

logM
AR
Retinal Eccentricity (degrees)
6/60
6/6
Scotopic
0 30
Photopic
Eccentricity
Arthur Bradley

Human photoreceptors
Rods Achromatic
night vision 1 type
Short-wavelength-sensitive (S) or “blue” cone
Middle-wavelength-sensitive (M) or “green” cone
Long-wavelength-sensitive (L) or “red” cone
Cones Daytime, achromatic
and chromatic vision 3 types
Rod

Rod and cone distribution
0.3 mm of eccentricity is about 1 deg of visual angle
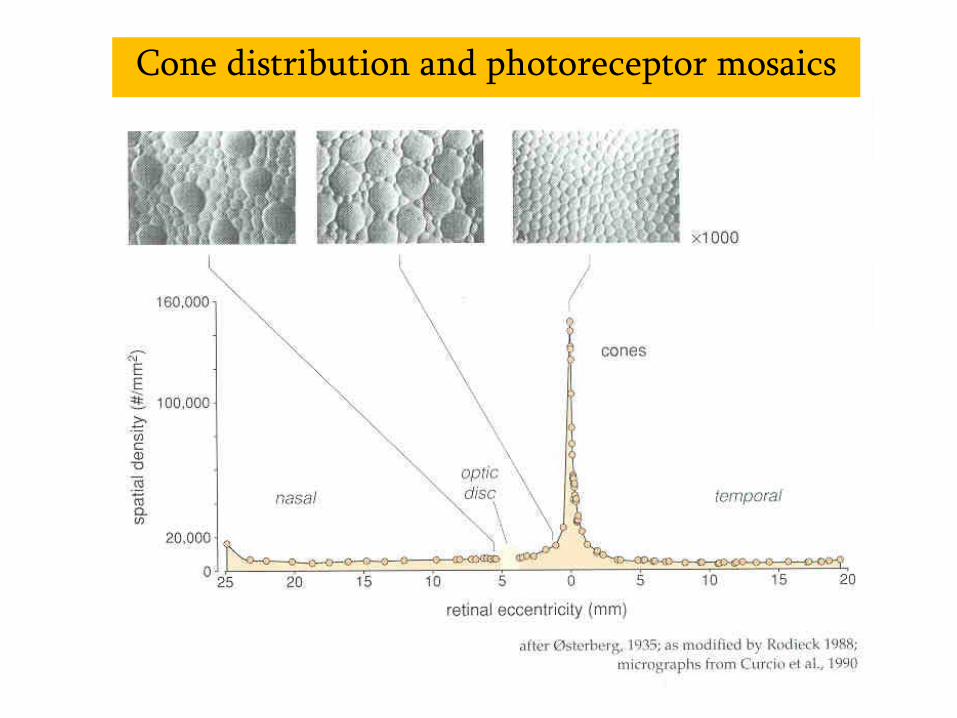
Cone distribution and photoreceptor mosaics

Roorda et al., 2001
Primate retina
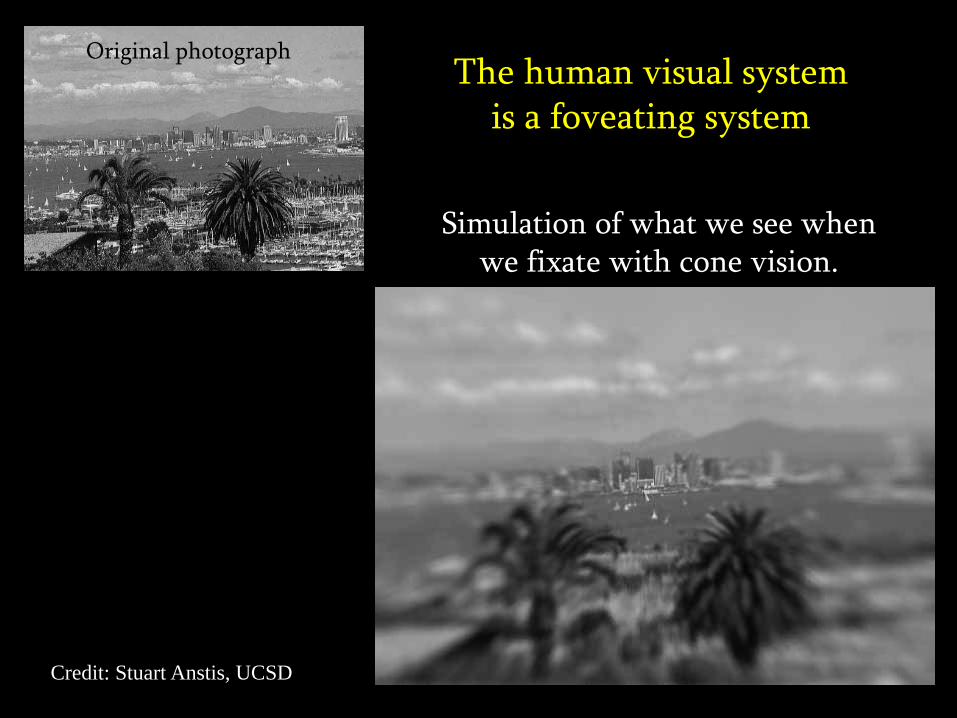
Credit: Stuart Anstis, UCSD
Original photograph
Simulation of what we see when we fixate with cone vision.
The human visual system is a foveating system

Credit: Stuart Anstis, UCSD
Visual acuity gets much poorer with eccentricity

Adaptive optics: viewing the retina through the eye’s optics

False color images showing the arrangement of L (red), M (green), and S (blue) cones in the retinas of differenthuman subjects. All images are shown to the same scale.
Hofer et al., 2005

Jim Schwiegerling

Jim Schwiegerling

Jim Schwiegerling

False color images showing the arrangement of L (red), M (green), and S (blue) cones in the retinas of differenthuman subjects. All images are shown to the same scale.
Hofer et al., 2005
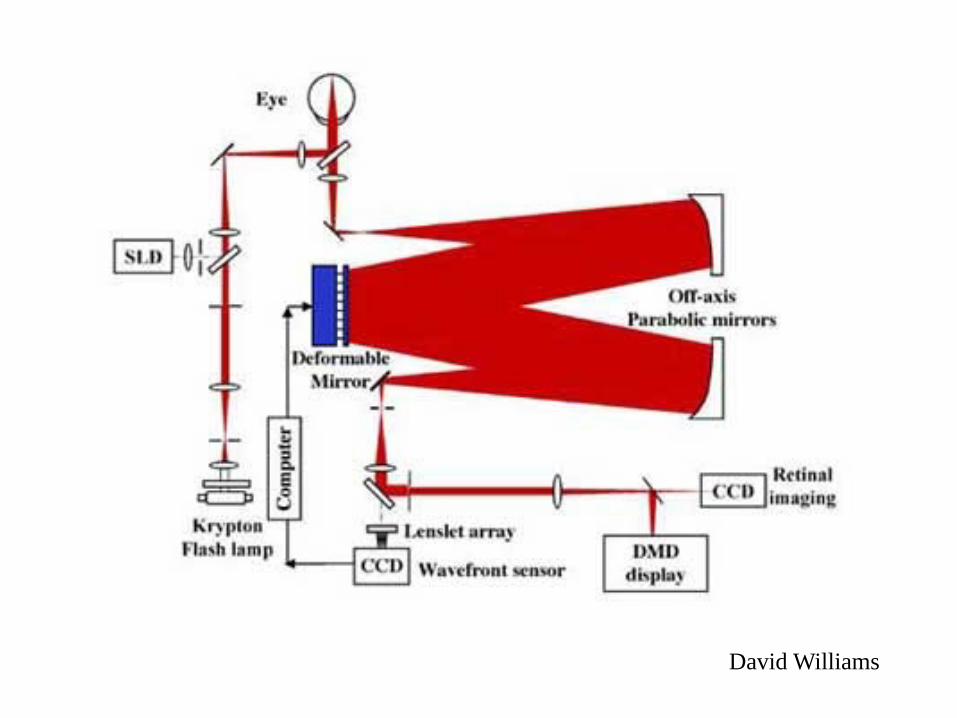
David Williams

Uncorrected
10 arc min
Photos courtesy of A. Roorda, D. Williams, U. Rochester
Corrected

Chromatic aberrations
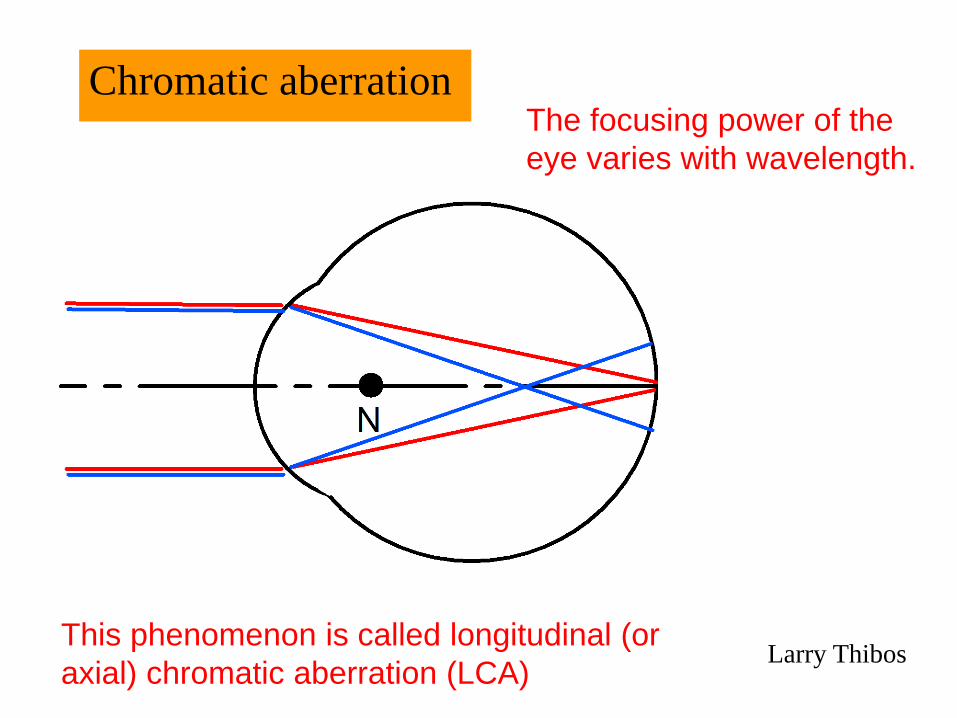
Chromatic aberrationThe focusing power of the eye varies with wavelength.
Larry ThibosThis phenomenon is called longitudinal (or axial) chromatic aberration (LCA)

Base picture: Digital camera world
Chromatic aberration

Effect of chromatic blur on eye chart
Jim Schwiegerling

Akitaoka Kitaoka

Chromostereoscopic windows
Akitaoka Kitaoka

EXTRA SLIDES (not presented)

Why visual acuity should be limited by the optics and sampling
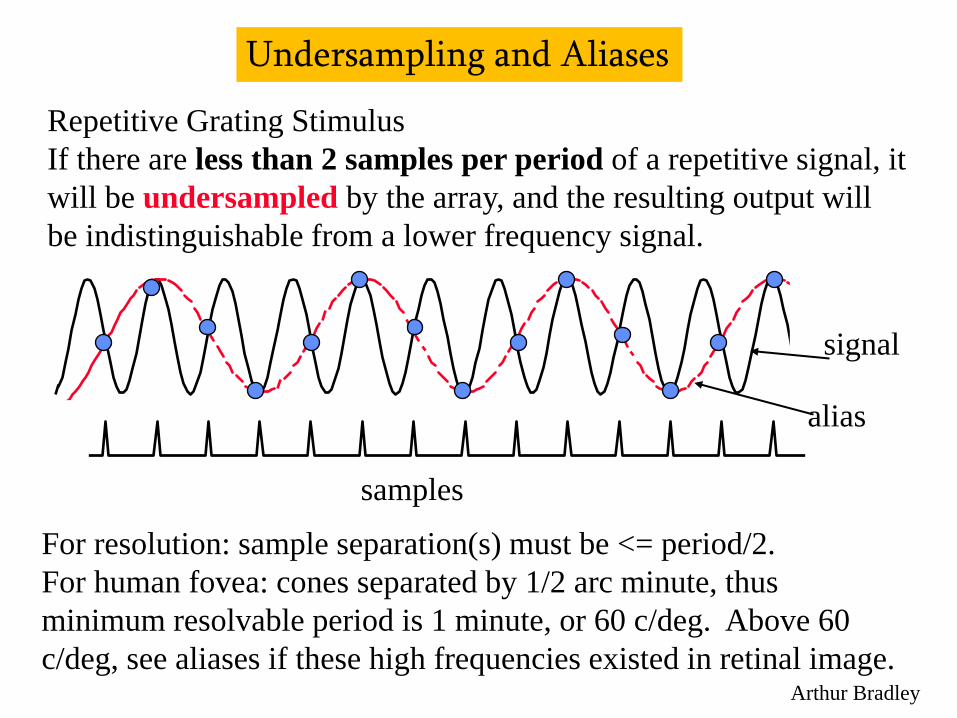
Repetitive Grating StimulusIf there are less than 2 samples per period of a repetitive signal, it will be undersampled by the array, and the resulting output will be indistinguishable from a lower frequency signal.
samples
signal
alias
Undersampling and Aliases
For resolution: sample separation(s) must be <= period/2.For human fovea: cones separated by 1/2 arc minute, thus minimum resolvable period is 1 minute, or 60 c/deg. Above 60 c/deg, see aliases if these high frequencies existed in retinal image.
Arthur Bradley

1
10
100
-40 -30 -20 -10 0 10 20 30 40Spat
ial F
requ
ency
(c/d
)
Eccentricity from Fovea (deg)Nasal Field Temporal Field
50
5
AliasingZone
Detection limit
Resolution limit
Thibos, Walsh & Cheney (1987) Vision Res. 27:2193
Optical limit
The eye’s optics filters out all SF above Nyquist limit in fovea, since foveal nyquist (60 c/deg) is slightly higher than optical cut-off (about 50 c/deg). This is not so in the peripheral retina where the optical cut-off is higher than the nyquist limit, thus aliases can be seen.
Nyquist limit
Arthur Bradley

98
Human peripheral resolution acuity matches RGC sampling density predictions
Res
olut
ion
Lim
it (c
/deg
)
SFmax= 1/2S
Arthur Bradley

Foveal VA and CS are both limited by optical and neural factors
0.001
0.005
0.01
0.05
0.1
0.5
1.0
Spatial frequency (cycles/deg)0 10 20 30 40 50 60 70 80 90
Optical Transfer Function
Neural Threshold
Window ofvisibility
Imag
e C
ontra
st
Arthur Bradley

Impact of sampling on spatial resolution: Helmholtz
Two point Resolution:
Neural Response
Must have sample between images of two points in order to know that there is a gap between the stimuli and thus be able to identify two points as two.
Arthur Bradley

Sampling and periodic patterns.
Shannon’s sampling theorem: basically same idea as Helmholtz (need one sample between each line)
Notice that, at limit of just one sample between each bright line of grating, there will be exactly 2 samples per period of the grating.
In order to resolve a periodic pattern there must be at least 2 samples per period. Therefore, if we know the spacing between samples, we know the maximum resolvable spatial frequency = fmax = 1/(2s), where s = separation between samples.
S
Arthur Bradley

Miscellaneous

What limits resolution acuity?
Two candidate mechanisms:
• filtering (optical or neural)
•undersampling
Arthur Bradley

Filtering Limit to Visual ResolutionLow-pass FilteredOriginal
Arthur Bradley

Sampling Limit to Visual ResolutionUndersampledOriginal

Foveal VA and CS are both limited by optical and neural factors
0.001
0.005
0.01
0.05
0.1
0.5
1.0
Spatial frequency (cycles/deg)0 10 20 30 40 50 60 70 80 90
Optical Transfer Function
Neural Threshold
Window ofvisibility
Imag
e C
ontra
st
Arthur Bradley

Optical Image on Retina
Neural Retina Cortex Perception
Continuous Sampled ContinuousSampled
Neural sampling
Arthur Bradley

2-dimensional undersampling misrepresents spatial frequency and orientation of patterns
Example with less than 2 samples per period Arthur Bradley
Arthur Bradley