Embed Size (px)
Citation preview
Physiological aspects of stomatal regulation and water use in wheat (Triticum aestivum L.)
under terminal drought
Renu Saradadevi MSc (Agronomy)
M Phil (Bioinformatics)
This thesis is presented for the degree of
Doctor of Philosophy
of The University of Western Australia
School of Plant Biology and The UWA Institute of Agriculture
Faculty of Science
March 2015

i
Abstract
Wheat grown in Mediterranean-type environments is often exposed to end-of-season
drought (terminal drought). As terminal drought develops, soil dries in the top layers of the
soil profile, exposing the upper part of the root system to soil water deficit while roots
below may still have access to deeper soil water. It is hypothesised that the part of the root
system exposed to drying soil induces abscisic acid (ABA) production and the
corresponding increase in leaf ABA concentration partially closes stomata, which regulates
the use of available water at depth, allowing completion of grain filling. The aim of this
research was to examine if ABA accumulation and regulation of stomatal conductance in
response to drying soil, would improve water use and grain yield under conditions of
terminal drought. Four experiments were conducted from 2011 to 2014 in controlled
environmental conditions.
In the first experiment described in Chapter 3, four wheat genotypes were grown in a split-
root system and terminal drought was induced in half of the vertically-split root system,
while the other half was kept well watered. Genotypes were selected for their putative
adaptation to contrasting dryland environments in Australia. The aim of this experiment
was to identify genotypes with contrasting stomatal responses and leaf ABA concentration.
The two most contrasting genotypes identified were the cultivar Drysdale and the breeding
line IGW-3262. When one half of the root system was exposed to drying soil, leaf water
potential decreased and Drysdale had lower stomatal conductance and higher leaf ABA
concentration. Leaf water potential remained unchanged in IGW-3262 but stomatal
conductance decreased without concomitant increase in leaf ABA concentration.
In the second experiment (Chapter 4), Drysdale and IGW-3262 were grown in segmented
pots that hydraulically isolated top and bottom root segments. Withholding water from the
top segment alone or from both segments at anthesis exposed either the top half of the root
ii
system or the entire root system to terminal drought. Drysdale had more root biomass in the
top drying segment and initiated stomatal closure earlier than IGW-3262. There was a
strong curvilinear relationship between leaf ABA and stomatal conductance in Drysdale,
but the relationship was weak in IGW-3262. Leaf ABA in IGW-3262 fluctuated regardless
of watering treatments which suggests that factors other than soil water deficit control leaf
ABA. The increase in leaf ABA in water-stressed plants preceded a decline in stomatal
conductance; probably xylem ABA is the driving factor for stomatal regulation. The source
of xylem ABA was not identified as increased root ABA was not detected in either
genotypes in response to drought. Despite sufficient water availability in the bottom
segment, yield in IGW-3262 was similar to plants where both segments were dried, but
Drysdale had higher yield. The results suggest that Drysdale and IGW-3262 differ in their
stomatal response to ABA and in their root capabilities to capture available water at depth.
In the third experiment (Chapter 5), a transpiration assay was conducted to determine (i)
whether xylem ABA is the main driver of stomatal regulation and (ii) whether the two
genotypes differ in their sensitivity to (a) xylem ABA concentration, (b) xylem sap pH or
(c) soil water status. Exogenous ABA was fed to detached leaves to identify the stomatal
response to xylem ABA. The assay confirmed that IGW-3262 stomata are sensitive to
factors other than leaf ABA concentration such as pH and possibly osmolality, whereas
Drysdale stomata are relatively insensitive to these factors.
In the fourth experiment (Chapter 6), post-anthesis water use of Drysdale and IGW-3262
was compared under conditions where water was available in the bottom 30 cm layer of the
1 m soil profile. It was hypothesised that Drysdale used more water which results in less
yield gap under terminal drought compared with IGW-3262. The grain yield of Drysdale
under terminal drought was similar to that under well-watered conditions. However, grain
yield in IGW-3262 decreased by 25% despite available water in the bottom layers of the
soil profile. The yield reduction in IGW-3262 corresponded to the reduction in post-
iii
anthesis water use. The difference in post-anthesis water use when the top soil layer was
dried but water was available at the bottom was due to differences in root capability to
capture water. This difference may be associated with differences in root anatomy or
hydraulic properties.
In summary, this research shows that grain yield under terminal drought depends on post-
anthesis water use regulated by stomatal closure and root capability to extract available
water from soil. The cultivar Drysdale, which was more sensitive to soil water deficit and
had better root capability to extract water from deeper soil, maintained water uptake during
grain filling, resulting in better yield under terminal drought. This study also demonstrates
that the wheat genotypes, Drysdale and IGW-3262, differ in their stomatal sensitivity to
soil water deficit, leaf ABA concentration and pH. Future studies involving more genotypes
are required to identify genotypic variation in stomatal regulation and sensitivity to ABA
that provide an advantage under terminal drought through more effective water use.
Understanding the link between root properties and stomatal regulation that facilitate post-
anthesis water use and yield maintenance are important for developing improved wheat
cultivars capable of maintaining yield under terminal drought.

v
Table of Contents
Abstract ......................................................................................................... i
List of Tables .............................................................................................. ix
List of Figures ........................................................................................... xiii
Acknowledgements .................................................................................. xvii
Statement of candidate contribution ...................................................... xix
1 General introduction ................................................................................ 1
2 Review of the literature ........................................................................... 5
2.1 Introduction ............................................................................................................... 5
2.2 Water deficit: major stress affecting wheat production in Australia .................. 6
2.2.1 Terminal drought in Western Australia ................................................................ 7
2.3 Crop adaptive strategies to combat terminal drought........................................... 8
2.3.1 Stomatal regulation: an important mechanism to control water use under terminal drought .......................................................................................................................... 9
2.3.1.1 Stomatal regulation is governed by soil water status, not leaf water status . 10
2.3.1.2 Root -to -shoot signalling to regulate stomata ............................................. 11
2.3.1.3 Role of ABA in stomatal regulation ............................................................ 12
2.3.1.4 ABA dynamics in plants .............................................................................. 16
2.3.1.5 Tissue sampling for ABA analysis .............................................................. 17
2.3.1.6 How does ABA affect stomatal regulation? ................................................ 23
2.3.2 Root traits to favour terminal drought adaptation in wheat ............................... 26
2.3.2.1 Root distribution: a potential trait to maintain water uptake under drought 26
2.3.2.2 Root hydraulic resistance: a trait that limits water flux through roots ......... 28
2.3.2.3 Root distribution and water use by stomatal regulation ............................... 29
2.4 The effect of stomatal regulation on yield ............................................................. 29
2.4.1 Stomatal conductance and photosynthesis ......................................................... 30
2.4.2 Impact of ABA on yield ..................................................................................... 30
2.5 Summary and research opportunities ................................................................... 31
2.6 Scope of the research .............................................................................................. 33
3 Contrasting stomatal regulation and leaf ABA concentrations in wheat genotypes when split root systems were exposed to terminal drought 35
3.1 Introduction ............................................................................................................. 35
3.2 Materials and methods ........................................................................................... 37
3.2.1 Plant material ...................................................................................................... 37
vi
3.2.2 Split pot and growing conditions ....................................................................... 37
3.2.3 Treatments .......................................................................................................... 39
3.2.4 Measurements..................................................................................................... 40
3.2.5 ABA sampling and analysis ............................................................................... 42
3.2.6 Statistical analysis .............................................................................................. 43
3.3 Results ...................................................................................................................... 43
3.3.1 Phenology ........................................................................................................... 43
3.3.2 Leaf water potential (leaf), gas exchange and leaf tissue ABA ........................ 44
3.3.3 Plant growth ....................................................................................................... 47
3.3.4 Root growth ........................................................................................................ 50
3.3.5 Yield and yield components ............................................................................... 53
3.4 Discussion ................................................................................................................. 56
3.5 Conclusions .............................................................................................................. 60
4 Root biomass in the drying upper layer of the soil profile affects the initial stomatal response of wheat under terminal drought .................. 61
4.1 Introduction ............................................................................................................. 61
4.2 Materials and methods ........................................................................................... 62
4.2.1 Plant material and growing conditions ............................................................... 62
4.2.2 Segmented pots .................................................................................................. 63
4.2.3 Treatments .......................................................................................................... 65
4.2.4 Measurements..................................................................................................... 65
4.2.5 Sampling............................................................................................................. 66
4.2.6 ABA sampling and analysis ............................................................................... 67
4.2.7 Statistical analysis .............................................................................................. 68
4.3 Results ...................................................................................................................... 68
4.3.1 Phenology ........................................................................................................... 68
4.3.2 Soil water content ............................................................................................... 69
4.3.3 Tiller number, leaf area and biomass ................................................................. 70
4.3.4 Leaf water potential (leaf), stomatal conductance (gs), transpiration and leaf net photosynthesis rate ...................................................................................................... 74
4.3.5 Abscisic acid and its metabolites in leaf and root tissues .................................. 76
4.3.6 Yield and yield components ............................................................................... 78
4.4 Discussion ................................................................................................................. 79
4.5 Conclusions .............................................................................................................. 84
5 Stomatal conductance in response to exogenous application of abscisic acid to the flag leaves of two wheat genotypes ........................................ 85
vii
5.1 Introduction ............................................................................................................. 85
5.2 Materials and methods ........................................................................................... 87
5.2.1 Measurements ..................................................................................................... 88
5.2.2 ABA analysis ...................................................................................................... 90
5.2.3 Statistical analysis .............................................................................................. 90
5.3 Results ...................................................................................................................... 91
5.3.1 Impact of soil water deficit on leaf, gs, transpiration and photosynthesis of leaves in intact plants ................................................................................................................. 91
5.3.2 gs and transpiration in detached leaves fed with different concentrations of ABA ..................................................................................................................................... 92
5.3.3 Leaf ABA content as affected by feeding exogenous ABA concentration ........ 95
5.4 Discussion ................................................................................................................. 99
5.4.1 Exogenous ABA concentration higher than that found in xylem sap of water-stressed wheat plants is required to affect similar stomatal closure. ......................... 100
5.4.2 Effect of pH of the solution on gs and transpiration ......................................... 101
5.4.3 Possible differences between genotypes in stomatal sensitivity to factors other than xylem ABA concentration and pH ............................................................................ 102
5.4.4 Evidence for possible differences in ABA metabolism between the cultivar Drysdale and the line IGW-3262 .............................................................................. 102
5.4.5 Stomatal reversal to the usual conductance was not possible in the leaves of plants under 25% PSWC when the leaves were fed with 0ABA solution ........................... 104
5.5 Conclusions ............................................................................................................ 105
6 The root capacity to uptake water from deep soil layers differs in two wheat genotypes contrasting for stomatal conductance ...................... 107
6.1 Introduction ........................................................................................................... 107
6.2 Materials and methods ......................................................................................... 108
6.2.1 Plant materials and growing conditions ........................................................... 108
6.2.2 Treatments ........................................................................................................ 109
6.2.3 Measurements ................................................................................................... 111
6.2.4 Statistical analysis ............................................................................................ 112
6.3 Results .................................................................................................................... 113
6.3.1 Phenology ......................................................................................................... 113
6.3.2 Plant growth ..................................................................................................... 113
6.3.3 Soil drying and leaf water potential ................................................................. 116
6.3.4 Stomatal regulation during post-anthesis ......................................................... 117
6.3.5 Water use and water use efficiency .................................................................. 119
6.3.6 Yield and yield components ............................................................................. 120
6.4 Discussion ............................................................................................................... 123

viii
6.5 Conclusions ............................................................................................................ 128
7 General discussion ................................................................................ 129
7.1 Introduction ........................................................................................................... 129
7.2 Key research findings ........................................................................................... 129
7.3 Future directions and implications ...................................................................... 136
References ................................................................................................ 139
Appendix 1 ............................................................................................... 157
ix
List of Tables
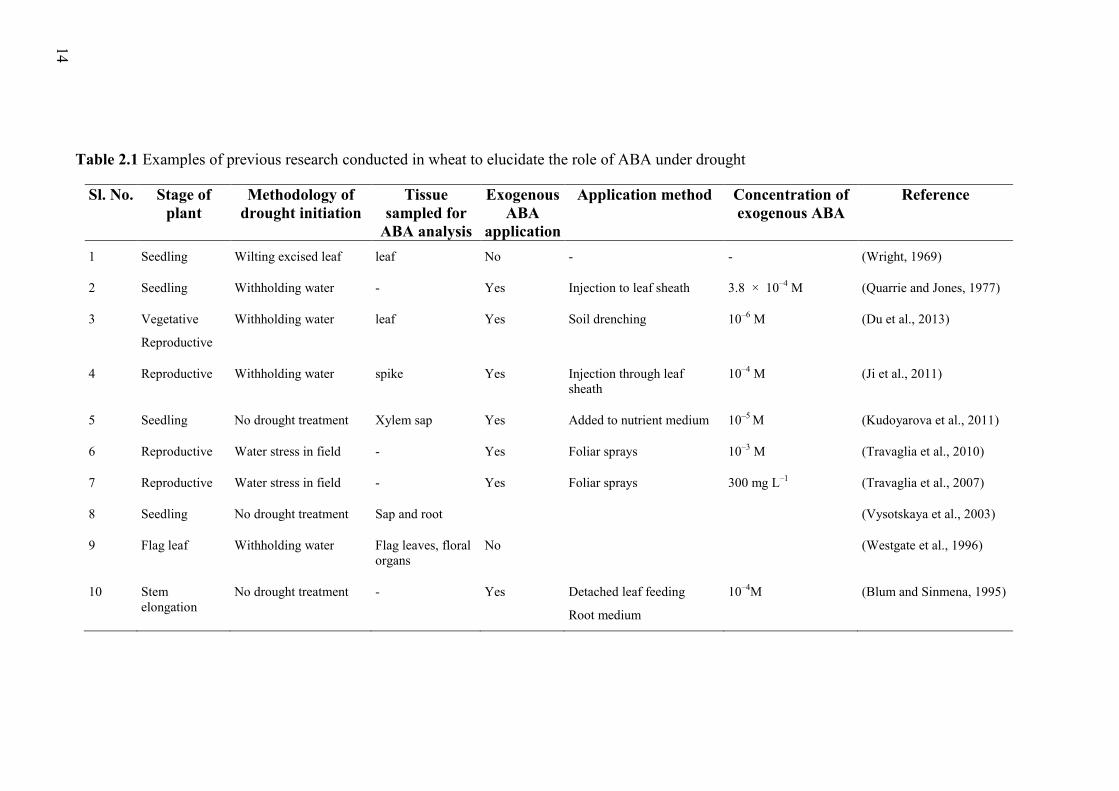
Table 2.1 Examples of previous research conducted in wheat to elucidate the role of ABA under drought .................................................................................................................. 14
Table 2.2 A summary of literature showing methodology used to collect xylem sap from different species .............................................................................................................. 20
Table 3.1 Number of days to anthesis and physiological maturity in four wheat genotypes grown in pots with the root system split between two compartments, where both halves were well-watered (WW) or watering was withheld from one half (WD) or both halves of the split root system (DD) starting at anthesis. Values for days to anthesis are means (n = 35; P < 0.0001; LSD at 95% level of significance = 1). ................................................. 44
Table 3.2 Leaf water potential (leaf), stomatal conductance (gs), leaf transpiration rate and net photosynthesis rate of four wheat genotypes at second harvest (170-190 °Cd after anthesis) that were well-watered (WW) or watering withheld from one (WD) or both (DD) halves of the split root system from anthesis. Values are the means of five replicates. LSD values are at 95% level of significance. Photosynthesis was zero in DD treatment. ...... 46
Table 3.3 Green leaf area and tiller number of four wheat genotypes grown in split pots. Plants were well-watered until maturity (WW) or watering was withheld from one (WD) or both (DD) halves of the split root system from anthesis. Second harvest was done at 190 °Cd for IGW-3262 and 170 °Cd for other three genotypes. Values presented are means (n = 5). LSD values are at 95% level of significance. Interaction genotype x treatment was not significant (P > 0.25). ...................................................................................................... 49
Table 3.4 Shoot biomass of four wheat genotypes that were well-watered until maturity (WW) or watering withheld from one (WD) or both (DD) halves of the split root system from anthesis. The values are means of five replicates. LSD values are at 95% level of significance. Interaction genotype x treatment was not significant at second harvest (P = 0.7) and final harvest (P = 0.06). ..................................................................................... 50
Table 3.5 Root biomass per plant at second and final harvest of four wheat genotypes that were well-watered (WW) until maturity or watering withheld from one (WD) or both (DD) halves of the split root system from anthesis. Values represent means (n = 5). LSD values are at 95% level of significance. ..................................................................................... 51
Table 3.6 Total root length per plant and specific root length at second harvest. Plants were grown in split pots that were well-watered (WW) until maturity or watering withheld from one (WD) or both (DD) halves of the split root system from anthesis. Values are means (n = 5). LSD values are at 95% level of significance. ......................................................... 52
Table 3.7 Yield components and yield of four wheat genotypes that were well-watered until maturity (WW) or watering withheld from anthesis from one (WD) or both (DD) halves of the split root system. Values are means (n = 5) and LSD is at the 95% level of significance. .................................................................................................................... 55
Table 4.1 Mean number of days after sowing (DAS) to anthesis and physiological maturity in the cultivar Drysdale and breeding line IGW-3262 grown in pots with the top and bottom segments hydraulically separated by a wax layer. Segments were either well-watered (WW), had watering withheld from the top segment only (DW) or from both segments (DD), starting from anthesis. Anthesis was determined when 50% of the genotype was flowering (n = 24) and physiological maturity when 50% of flag leaves had yellowed.
x
Values for days to anthesis are means (n = 24; P < 0.0001). Statistical analysis was not carried out for physiological maturity. ............................................................................ 69
Table 4.2 Tiller number, leaf area and shoot biomass per plant of the cultivar Drysdale and breeding line IGW-3262 at anthesis, just before the start of drought treatments, and at the second harvest during grain filling. Sampling at grain filling was at 270 °Cd in IGW-3262 and 210 °Cd in Drysdale after withholding water from anthesis. Values at anthesis are mean of five replicates. Values at grain filling are the combined means of all treatments that were not different (P > 0.05), n = 15. Means followed by different letters are significantly different between genotypes at the 95% level of significance. ....................................... 71
Table 4.3 Root biomass, length and specific root length of the cultivar Drysdale and breeding line IGW-3262 grown in pots horizontally split into two segments with the root system split between top and bottom segments. Measurements were made at anthesis and during grain filling. Sampling at grain filling was at 270 °Cd in IGW-3262 and 210 °Cd in Drysdale after withholding water from anthesis. Values at anthesis are mean of five replicates. Values at grain filling are the combined means of all treatments that were not different (P > 0.05), n = 15. Means followed by different letters are significantly different between genotypes at the 95% level of significance. ...................................................... 72
Table 4.4 Tiller number and shoot biomass at maturity of the cultivar Drysdale and breeding line IGW-3262 grown in pots horizontally split into two segments with the root system split between top and bottom segments. From 50% anthesis, both segments were either well-watered (WW), had watering withheld from the top segment only (DW) or from both segments (DD). Values are the mean, n = 5. LSD values are at 95% significance. Means followed by different letters are significantly different between genotypes and treatments at the 95% level of significance. ................................................................... 73
Table 4.5 Grain yield and yield components of the cultivar Drysdale and breeding line IGW-3262 grown in pots horizontally split into two segments with the root system split between top and bottom segments. From 50% anthesis, both segments were either well-watered (WW), had watering withheld from the top segment only (DW) or from both segments (DD). Values are the mean, n = 5. LSD values are at the 95% significance. Means followed by different letters are significantly different between genotypes and treatments at the 95% level of significance. ......................................................................................... 78
Table 5.1 Stomatal conductance, instantaneous transpiration rate, net photosynthesis and leaf water potential (leaf) of the line IGW-3262 and cultivar Drysdale grown in pots with 90%, 50% and 25% of pot soil water holding capacity (PSWC) after withholding water from anthesis. gs, transpiration rate and photosynthesis rate were measured on the flag leaf of the main stem and leaf was measured on the penultimate leaf. Values are means of 16 replicates. LSD values are at 95% level of significance. ................................................ 91
Table 5.2 Ratios of gs and transpiration rate of flag leaves detached from plants grown in pots with 90%, 50% and 25% of pot soil water holding capacity (PSWC) fed with ABA solutions of different concentration for 2 hours. Ratios were calculated relative to that of flag leaves of well-watered plants (90% PSWC) fed with solution containing no ABA. ABA solutions were of 0, 10–8, 10–7 and 10–6 M concentrations at pH 6 and 7. The # symbol indicates that values for pH 6 and pH 7 are combined, n = 8. Values for conductance ratio of IGW-3262 are means of 4 replicates. LSD values are at 95% significance. Interaction effects of PSWC treatment x ABA concentrations x pH and ABA concentrations x pH were not significant. ................................................................................................................. 94
Table 5.3 Accumulation of ABA metabolite, PA and molar ratio of PA to ABA in the flag leaves of plants were grown in pots with 90%, 50% and 25% of pot soil water holding capacity (PSWC) when fed with ABA solutions of different concentration. ABA solutions
xi
were of 0, 10–8, 10–7 and 10–6 M ABA. Values are means of four replicates. LSD values are at 95% level of significance. ........................................................................................... 98
Table 5.4 Accumulation of glucose ester of ABA (ABA-GE) and molar ratio of ABAGE to ABA in the flag leaves of plants grown in pots with 90%, 50% and 25% of pot soil water holding capacity (PSWC) when fed with ABA solutions of different concentration. ABA solutions were of 0, 10–8, 10–7 and 10–6 M ABA. Values are means of four replicates. LSD values are at 95% level of significance. .......................................................................... 99
Table 6.1 Days to anthesis (n = 25) and physiological maturity (n = 4) when drought was induced from anthesis by withholding water completely (WS), withholding watering to 60% pot water capacity and then watering was restricted to the bottom 30 cm of the soil profile in the pot (WB) and when watering was maintained at 90% pot water capacity from anthesis to physiological maturity (WW). Data are means ± SEM. Means followed by different letters are significantly different between genotype (days to anthesis) or genotype and treatment (days to physiological maturity) at 95% level of significance. .............. 113
Table 6.2 Number of tillers, shoot biomass and root biomass of IGW-3262 and Drysdale when drought was induced from anthesis by withholding water completely (WS), withholding watering to 60% pot water capacity and then watering was restricted to the bottom 30 cm of the soil profile in the pot (WB) and when watering was maintained at 90% pot water capacity from anthesis to physiological maturity (WW). Values are means (n = 4). Means within the same column followed by different letters are different at 95% level of significance. LSD values are at 95% level of significance. .......................................... 115
Table 6.3 Post-anthesis water use and water use efficiency, and total water use efficiency (WUE) of IGW-3262 and Drysdale when water was withheld from anthesis by withholding water completely (WS), withholding watering to 60% of pot water capacity and then restricted watering to the bottom 30 cm of the soil profile in the pot (WB) and when watering maintained pot water holding capacity at 90% from anthesis to physiological maturity (WW). Post-anthesis WUE was calculated as grain yield per unit of post-anthesis water used (transpired) and total WUE was calculated as grain yield per unit of total water consumed. Each value is a mean of 4 replicates. Means within the same column with the same letters are not different at 95% level of significance. .......................................... 120
Table 6.4 Yield and yield components of IGW-3262 and Drysdale when drought was induced from anthesis by withholding water completely (WS), withholding watering to 60% pot water capacity and then watering was restricted to the bottom 30 cm of the soil profile in the pot (WB) and when watering maintained pot water holding capacity at 90% from anthesis to physiological maturity (WW). Values are means (n = 4). Means within the same column with the same letters are not different at 95% level of significance. LSD values are at 95% level of significance. ........................................................................ 122
Table 7.1 Summary of experiments described in this thesis including hypotheses tested, whether the hypotheses were accepted or rejected and key findings of each study. .... 130

xiii
List of Figures
Figure 2.1 Primary wheat growing regions (grain belt) in Australia ............................... 5
Figure 2.2 Average wheat yield in Australia from 1971 to 2013. Black bars represent the years in which average yield dropped below 1 t/ha due to severe drought....................... 6
Figure 2.3 Schematic representation of kinetics of ABA through the plant .................. 25
Figure 2.4 Schematic representation of the research gap identified by this review of literature. Green arrows represent scope of this study in relation to the previous research works in this area (red, yellow and blue arrow). ............................................................. 33
Figure 3.1 Diagram of the specially-designed split pots used to expose different halves of wheat root systems to water deficit at anthesis (a). Partition wall fixed on one half of the pot (b). A flexible tube held the germinated seed in place (inset) so that roots could be divided equally into each compartment of the pot (c)..................................................... 38
Figure 3.2 Typical examples of wheat plants at second harvest when watering was withheld from both halves of the split root system (DD), one half of the split root system (WD) and when both halves of the split root system were well-watered (WW). ........... 41
Figure 3.3 Mean leaf ABA concentration in the cultivar Drysdale and the line IGW-3262 at 170 °Cd and 190 °Cd respectively after withholding water from one half (WD) or both halves of the split root system (DD) compared with both halves well-watered (WW). Error bars represent ± SEM, n = 5. Interaction for genotype x treatment was significant, P = 0.001. LSD for the interaction was 230.86 ng g-1 and different letters indicate significant differences between genotypes. ...................................................................................... 47
Figure 3.4 Mean tiller number (a), leaf area (b), and shoot biomass (c) per plant of four wheat genotypes at anthesis (Z65), just before watering treatments were applied. Error bars represent ± SEM, n = 5. Different letters indicate significant differences between genotypes. ....................................................................................................................... 48
Figure 3.5 Root distribution between two halves of the split root system. (a) Root biomass measured at anthesis (just before withholding water), 170–190 thermal days after withholding water from one half of root systems (second harvest) and at final harvest. (b) Root length (m plant-1) and specific root length (SRL) (m g-1) measured at second harvest. Data from all genotypes were combined. Error bars represent ± SEM; n = 20; * represents significant difference between two pot compartments. .................................................. 50
Figure 4.1 Mean vapour pressure deficit (VPD) in the glasshouse during the times (11.30 am to 1.30 pm) when gas exchange measurements were conducted from anthesis (0 °Cd) in the cultivar Drysdale and breeding line IGW-3262. Each data point is the mean of nine measurements, recorded at 15 minute intervals. ............................................................. 63
Figure 4.2 Diagram of the specially-designed segmented pots used to expose upper and bottom parts of the wheat root system to water deficit from anthesis (a). A wax layer hydraulically separated the two segments to prevent the flow of water and nutrients between the segments, but allowed root penetration (b). Perforated tubes for aeration (transparent tube that runs diagonally down the pot segment) and irrigation (black ring) were installed in the bottom segment to prevent hypoxic conditions and maintain soil moisture contents at required levels, respectively (c). .................................................... 64
Figure 4.3 Soil water content (% pot capacity) in top (a) and bottom (b) segments of the pot in IGW-3262 and Drysdale plants. At anthesis (0 °Cd), watering was withheld from either the top pot segment alone in the DW treatment or from both the top and bottom pot
xiv
segments in the DD treatment, while both segments in the WW treatment were maintained at 90% pot soil water capacity until maturity. Each data point is the mean of five replicates and errors bars represent SEM. Curves represent best fit to the data ( P < 0.05). ......... 70
Figure 4.4 Change in leaf water potential (leaf) (a,b), stomatal conductance (gs) (c, d), transpiration rate (e,f) and photosynthesis rate (g, h) in IGW-3262 (left panel) and Drysdale (right panel) over thermal time after anthesis. At anthesis (0 °Cd), water was withheld from the top pot segment in the DW treatment or from both top and bottom pot segments in the DD treatment, while both pot segments in the WW treatment and bottom segments in the DW treatment were maintained at 90% pot capacity until maturity. Each data point is the mean of five replicates, except for leaf water potential where the mean was of three or four replicates. Error bars represent SEM. ............................................................................. 75
Figure 4.5 Changes in leaf abscisic acid (ABA) concentration with thermal time after anthesis (a, b) and its relationship with stomatal conductance (gs) (c, d) in IGW-3262 (left panel) and Drysdale (right panel). At anthesis (0 °Cd), water was withheld from the top pot segment (DW) or from both top and bottom pot segments (DD), while both pot segments in WW and bottom segments in DW were maintained at 90% pot capacity until maturity. Each data point is the mean of five replicates; error bars are SEM. ............................... 76
Figure 4.6 Changes in the ratio of molar concentrations of phaseic acid (PA) to ABA (a, b) and glucose ester of ABA (ABA-GE) to ABA (c, d) in leaf tissues of IGW-3262 (left panel) and Drysdale (right panel). At anthesis (0 °Cd), water was withheld from the top pot segment (DW) or from both top and bottom pot segments (DD) while both pot segments in WW and bottom segments in DW were maintained at 90% pot capacity until maturity. Each data point is the mean of three to five replicates; error bars are SEM. .................. 77
Figure 5.1 A diagrammatic representation of the experimental design to test the effect of abscisic acid (ABA) concentration and xylem pH on stomatal conductance of flag leaves excised from the main stem of IGW or Drysdale. The cut end of leaves was inserted into vials containing ABA solutions of differing concentrations and pH. To avoid direct light, vials were covered with aluminium foil and sealed with insulation tape. The design was replicated for each genotype and each soil moisture status before leaf excision. ........... 89
Figure 5.2 Stomatal conductance (gs) of (a) IGW-3262 and (b) Drysdale in flag leaves on the main stem just before excision (intact leaves) and detached leaves two hours after insertion into buffer solutions, MES (pH 6) and HEPES (pH 7), without ABA. Error bars represent SEM, n = 4. Different letters indicate significant differences between intact and detached leaves. .............................................................................................................. 92
Figure 5.3 Leaf water potential (leaf) of detached flag leaves in wheat plants grown in pots with 90%, 50% and 25% of pot soil water holding capacity (PSWC) and after feeding with ABA solutions of different concentration for 2 h. Data for genotypes and different ABA solutions were combined. Error bars represent SEM, n = 4. Different letters indicate significant differences between PSWC treatments. ........................................................ 93
Figure 5.4 Average ABA flux into leaves of IGW-3262 (a) and Drysdale (b) when flag leaves detached from plants grown in pots with 90%, 50% and 25% of pot soil water holding capacity (PSWC) were fed with ABA solutions of different concentration. ABA solutions were of 0, 10–8, 10–7 and 10–6 M ABA. Error bars are SEM, n = 4. ................ 96
Figure 5.5 Leaf ABA in (a) IGW-3262 and (b) Drysdale when flag leaves of the main stem of well-watered plants (90% PSWC) and plants at 25% pot water holding capacity (25% PSWC) were fed with ABA solutions of different concentration. ABA solutions were of 0, 10–8, 10–7 and 10–6 M ABA. Error bars are SEM, n = 4. ............................... 97
xv
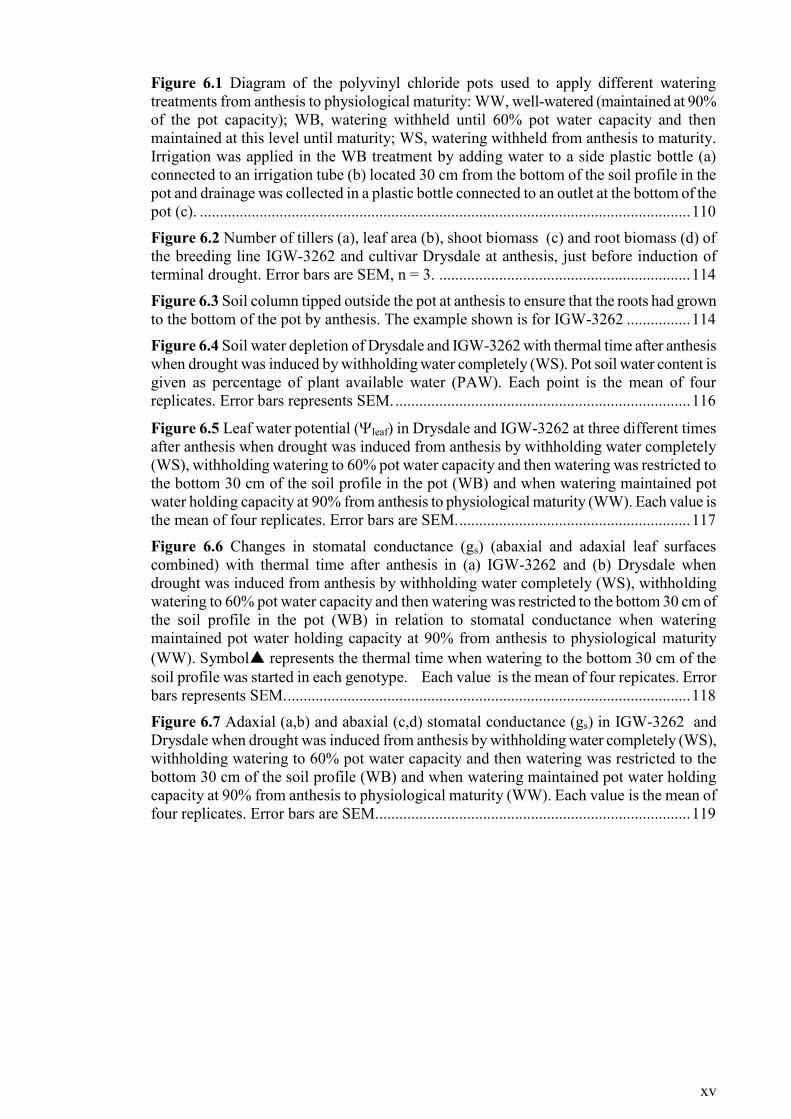
Figure 6.1 Diagram of the polyvinyl chloride pots used to apply different watering treatments from anthesis to physiological maturity: WW, well-watered (maintained at 90% of the pot capacity); WB, watering withheld until 60% pot water capacity and then maintained at this level until maturity; WS, watering withheld from anthesis to maturity. Irrigation was applied in the WB treatment by adding water to a side plastic bottle (a) connected to an irrigation tube (b) located 30 cm from the bottom of the soil profile in the pot and drainage was collected in a plastic bottle connected to an outlet at the bottom of the pot (c). ........................................................................................................................... 110
Figure 6.2 Number of tillers (a), leaf area (b), shoot biomass (c) and root biomass (d) of the breeding line IGW-3262 and cultivar Drysdale at anthesis, just before induction of terminal drought. Error bars are SEM, n = 3. ............................................................... 114
Figure 6.3 Soil column tipped outside the pot at anthesis to ensure that the roots had grown to the bottom of the pot by anthesis. The example shown is for IGW-3262 ................ 114
Figure 6.4 Soil water depletion of Drysdale and IGW-3262 with thermal time after anthesis when drought was induced by withholding water completely (WS). Pot soil water content is given as percentage of plant available water (PAW). Each point is the mean of four replicates. Error bars represents SEM. .......................................................................... 116
Figure 6.5 Leaf water potential (leaf) in Drysdale and IGW-3262 at three different times after anthesis when drought was induced from anthesis by withholding water completely (WS), withholding watering to 60% pot water capacity and then watering was restricted to the bottom 30 cm of the soil profile in the pot (WB) and when watering maintained pot water holding capacity at 90% from anthesis to physiological maturity (WW). Each value is the mean of four replicates. Error bars are SEM. .......................................................... 117
Figure 6.6 Changes in stomatal conductance (gs) (abaxial and adaxial leaf surfaces combined) with thermal time after anthesis in (a) IGW-3262 and (b) Drysdale when drought was induced from anthesis by withholding water completely (WS), withholding watering to 60% pot water capacity and then watering was restricted to the bottom 30 cm of the soil profile in the pot (WB) in relation to stomatal conductance when watering maintained pot water holding capacity at 90% from anthesis to physiological maturity (WW). Symbol▲ represents the thermal time when watering to the bottom 30 cm of the soil profile was started in each genotype. Each value is the mean of four repicates. Error bars represents SEM. ..................................................................................................... 118
Figure 6.7 Adaxial (a,b) and abaxial (c,d) stomatal conductance (gs) in IGW-3262 and Drysdale when drought was induced from anthesis by withholding water completely (WS), withholding watering to 60% pot water capacity and then watering was restricted to the bottom 30 cm of the soil profile (WB) and when watering maintained pot water holding capacity at 90% from anthesis to physiological maturity (WW). Each value is the mean of four replicates. Error bars are SEM............................................................................... 119

xvii
Acknowledgements
My journey during the past four years as a PhD candidate was frequently challenging
constantly faced with many tough and difficult situations. I take this opportunity to
acknowledge all those who have in one way or other helped me to succeed against several
odds and achieve my objectives.
I express sincere gratitude and indebtedness to my coordinating supervisor Hackett
Professor Kadambot Siddique for his exceptional guidance, constructive criticism and
support throughout my candidature. Professor Siddique was always approachable
regardless of his busy work schedule and motivated me to keep on track to finish. I am
grateful to my co-supervisor Adjunct Professor Jairo Palta (CSIRO and UWA) for his
expert advice and guidance, especially during my research at CSIRO. His friendly nature
has helped me to feel at ease during difficult times. I was always inspired by my co-
supervisor, Dr Helen Bramley’s approach to research and I admire her research ideas and
dedication. She was very strict and tough when it comes to research, yet gentle enough to
make me comfortable to work with.
I acknowledge the Endeavour postgraduate scholarships which helped me to undertake PhD
studies at UWA. I thank the UWA Institute of Agriculture and School of Plant Biology for
funding my research.
Thanks to Dr Everard Edwards, CSIRO for his collaboration on this project and for the
valuable inputs in interpreting results on ABA. Thanks to the friendly and supportive staff
in School of Plant Biology; with special mention to Professor Erik Veneklaas and Mr Greg
Cawthray. I remember the glasshouse Manager Mr Robert Creasy and Ms Christiane
Ludwig (CSIRO) for their help and support during my experiments. I acknowledge all
those who have directly and indirectly helped me throughout the PhD programme; special

xviii
mention to Mr Bruce Piper, InterGrain, CSIRO, Mr Raymond Scott, Mr Bill Pisiani, Mr
Daniel Prestage and Dr Mahmud Rahman. I thank Associate Professor Katia Stefanova and
statisticians at UWA Statistics Clinic for their help and support with statistical analysis. My
colleagues Ms Chandima Ranawana and Dr Eduardo Oliveira played a big role in shaping
up this thesis through their generous comments and support. I remember with gratefulness
how relieving it was to spend time with my office mates and colleagues at School of Plant
Biology discussing our progress and common concerns.
It was through my former teachers at Kerala Agricultural University, India, Dr George
Thomas and Professor Prasada Rao that I came to know about the research opportunity at
UWA. I consider them the leading lights for my research. My cousin Mr Suresh Pillai was
a motivational force for my travel to Australia.
I thank Mrs Almaz Siddique for making me feel at home in Perth. I also thank my case
managers at Scope Global, Mr Ben Mattson, Ms Vanessa Wright and Ms Ammeline
Balanag for their support throughout my candidature.
I am blessed with wonderful parents and a loving young sister. They always trusted me and
stood by me about my decisions and choices. I am thankful to my father-in-law for being
supportive. My husband and kids strongly supported and encouraged me to pursue my
research. Spending time with my family had always helped me to overcome mental and
physical stress and gave me an inner strength to overcome difficult periods.
I remember two beautiful persons who are not with me now; my grandmother and my
mother-in-law. They always wanted me to advance my career and become self reliant. I
remember them with affection and reverence. It was with God's grace that I recovered from
my health problems and complete the PhD research. I thank God almighty for everything.
xix
Statement of candidate contribution
The work presented in this thesis does not contain any material that has been accepted for
award of any other degree or diploma at any other University.
1. I declare that this thesis is my own work and was not written by another
person except where acknowledgement is made in the text. This thesis
contains material previously published in the journal: ‘Field Crops
Research’ 2014, volume 162.
2. The above publication pertaining to this thesis was written by me and the
co-authors were involved in the discussion of results, structure of the paper
and editorial comments to finalise them. All contributions made by other
individuals have been duly acknowledged.
3. I declare that I received assistance from Dr Everard Edwards for ABA
analysis of Chapters 3, 4 and 5.
Renu Saradadevi

Chapter 1 – General introduction
1
1 General introduction
Wheat (Triticum aestivum L.) is the third most produced cereal after maize and rice in the
world (FAO, 2013). Global wheat production averages 650 million metric tonnes (Mt),
65% of which is used as food (FAO, 2013). In Australia, more than half of the cropping
area is used for wheat production with 40% of the wheat produced coming from southern
and western Australia (ABARES, 2013). This wheat-growing region has a Mediterranean-
type climate characterised by wet winters and dry summers. High variability in rainfall and
temperatures in this area leads to frequent end-of-season drought (terminal drought)
(Turner and Begg, 1981). Predictions for further reductions in rainfall and increased
temperature (Ragab and Prudhomme, 2002) are forecasting more frequent drought spells
(Farre and Foster, 2010), that threaten future grain production in the south-western
Australian cropping region. Simulation studies have forecast yield reduction of more than
80% under severe terminal drought in this region (Asseng et al., 2004). Considering the
current pressure on the agricultural production system to meet increasing global demands
for wheat, it is crucial to focus research on reducing the gap between potential yield and
actual yield under drought scenarios.
When terminal drought develops, soil dries from the top, exposing the shallow part of the
root system to dry soil while the bottom part is in contact with available soil water. Plant
roots sense the drying soil and produce signals, which on transmission to shoots trigger
stomatal closure to regulate the crop water use through transpiration (Gollan et al., 1986;
Blum and Johnson, 1993). The plant hormone abscisic acid (ABA) is considered the major
chemical signal involved in this process and there is evidence of increased ABA
accumulation in leaves of drying wheat plants (Henson et al., 1989b; Ali et al., 1998).
However, crop production is linked to crop transpiration (Sinclair et al., 1984) such that
limiting transpiration may reduce yield.
Chapter 1 – General Introduction
2
The role of ABA in regulating stomatal aperture in response to drought has been mainly
studied on crops other than wheat such as maize, sunflower and tomato. Studies conducted
on wheat have been limited and mainly focussed on seedlings and plants during the
vegetative growth (Munns and King, 1988; Munns, 1992; Munns et al., 1993). A few
studies, conducted during the reproductive growth of wheat, have focussed on the impact of
accumulated ABA on pollen sterility and yield (Dembinska et al., 1992; Ji et al., 2011). The
role of leaf ABA on regulating water use by reducing transpiration through stomatal closure
and its effect on wheat yield is unknown. Therefore, the overall aim of this thesis was to
determine whether ABA-mediated stomatal response to water deficit controls water use to
reduce the yield gap under terminal drought conditions.
Chapter 2 reviews the literature and summarises the development of terminal drought and
crop response and adaptation when the root system is exposed to drying soil. The focus is
mainly on wheat’s ability to regulate water use through regulating stomatal conductance.
The review identifies the importance of exploring the role of ABA in stomatal regulation in
response to terminal drought conditions, how root distribution affects ABA signalling and
subsequent stomatal regulation and how this affects grain yield.
Chapter 3 describes a glasshouse experiment conducted to identify the physiological
response of four wheat genotypes with putative tolerance to terminal drought. A paper with
information from this chapter was published in 2014 in ‘Field Crops Research’, volume
162 (Appendix 1). The chapter reports differences between the genotypes in leaf ABA
accumulation and stomatal closure when half of the root system (split vertically) was
exposed to drying soil. Chapter 4 describes how two of the most contrasting genotypes
responded when grown in segmented pots that exposed the top part of the root system to
drying soil while water was available for deeper roots to extract. The contrasting genotypes
differed in their stomatal response to soil water which possibly arose from the different
Chapter 1 – General introduction
3
signal strengths associated with root distribution in the upper drying soil layer. Chapter 5
describes a transpiration bioassay to identify differential sensitivity of stomata in two wheat
genotypes to exogenously applied ABA. ABA feeding could initiate stomatal regulations
similar to that in response to drying soil, but only at high concentrations indicating that
xylem ABA may not be the sole driver of stomatal regulation. Chapter 6 describes how a
root system with better capacity of extracting available water at depth during post-anthesis
can minimise grain yield reduction under terminal drought.
Chapter 7, the general discussion, integrates the key findings from the experimental
program (Chapters 3, 4, 5 and 6) and explores the implications of the key findings for
improving the yield performance of wheat under terminal drought conditions prevalent in
Mediterranean-type climatic regions. It also discusses the shortcomings of this research and
directions for future research to elucidate ABA-mediated stomatal regulation of water use
in wheat under terminal drought.

Chapter 2 – Review of the literature
5
2 Review of the literature
2.1 Introduction
Wheat (Triticum aestivum L.) is the second most important dietary intake grain after rice
(FAO, 2013). Average annual global production is around 650 million metric tonnes, , from
which 22 million metric tonnes are produced in Australia (FAO, 2013). The annual value of
Australia wheat production is about $7 billion and more than 80% of the produce is being
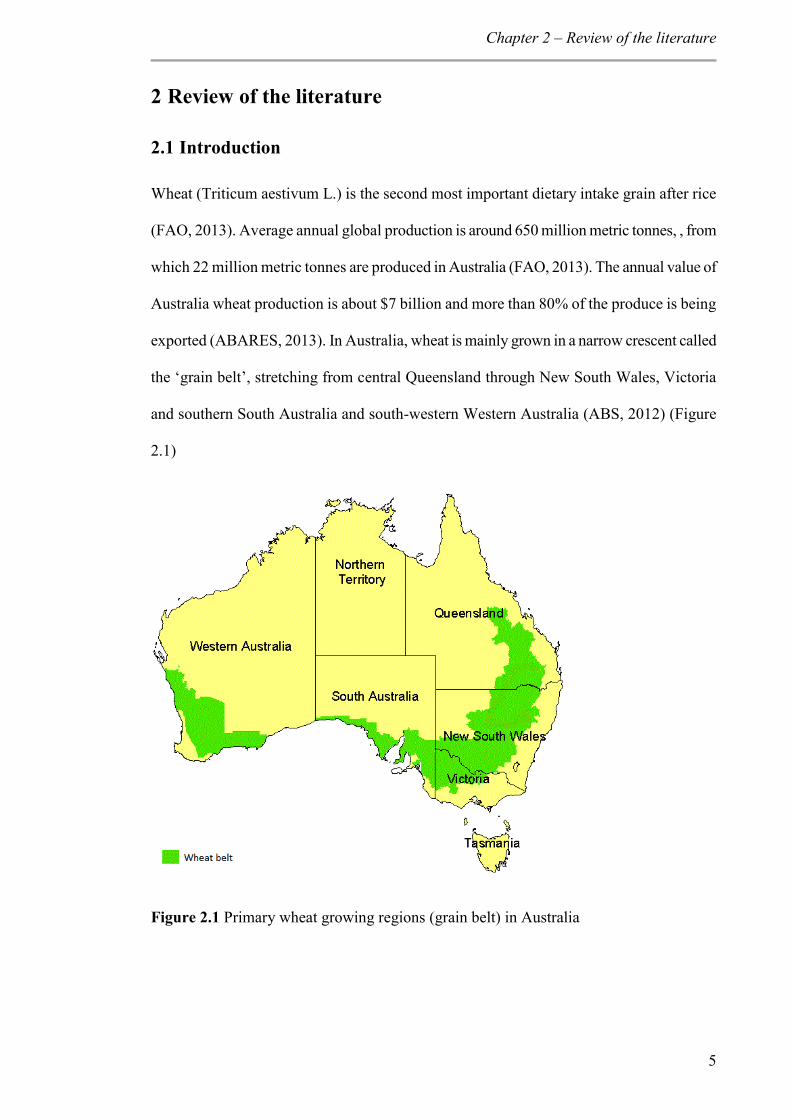
exported (ABARES, 2013). In Australia, wheat is mainly grown in a narrow crescent called
the ‘grain belt’, stretching from central Queensland through New South Wales, Victoria
and southern South Australia and south-western Western Australia (ABS, 2012) (Figure
2.1)
Figure 2.1 Primary wheat growing regions (grain belt) in Australia
Chapter 2 – Review of the literature
6
2.2 Water deficit: major stress affecting wheat production in Australia
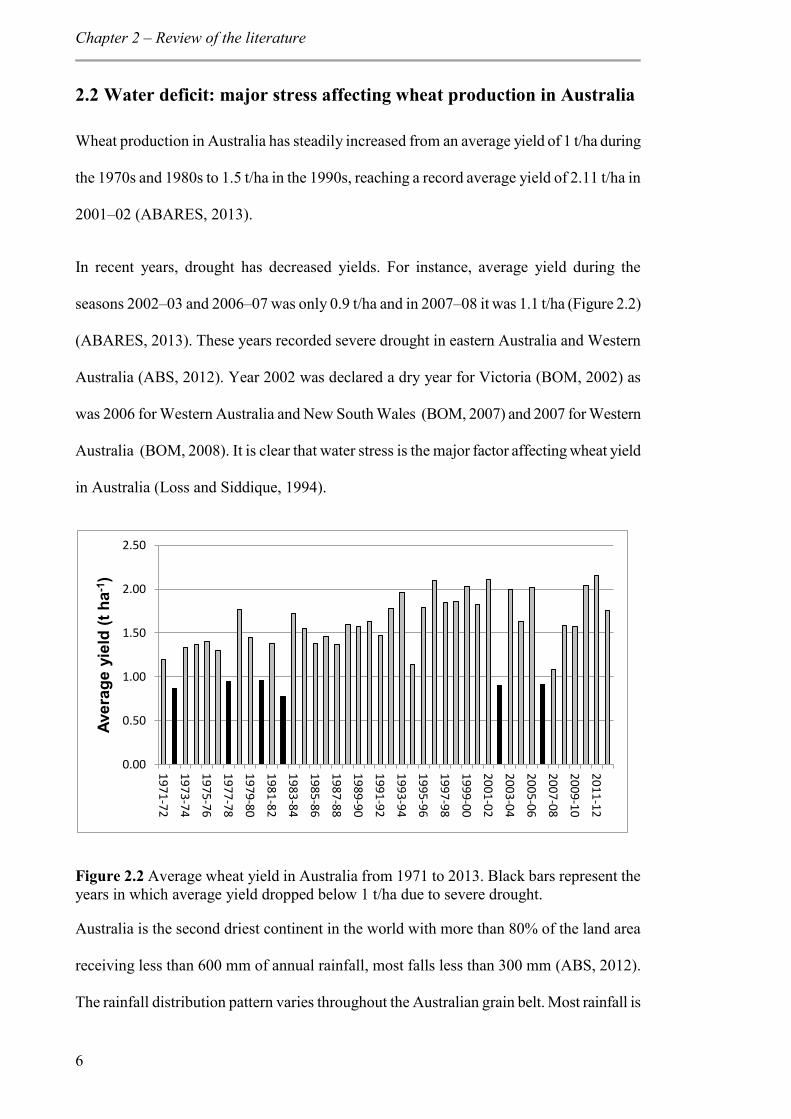
Wheat production in Australia has steadily increased from an average yield of 1 t/ha during
the 1970s and 1980s to 1.5 t/ha in the 1990s, reaching a record average yield of 2.11 t/ha in
2001–02 (ABARES, 2013).
In recent years, drought has decreased yields. For instance, average yield during the
seasons 2002–03 and 2006–07 was only 0.9 t/ha and in 2007–08 it was 1.1 t/ha (Figure 2.2)
(ABARES, 2013). These years recorded severe drought in eastern Australia and Western
Australia (ABS, 2012). Year 2002 was declared a dry year for Victoria (BOM, 2002) as
was 2006 for Western Australia and New South Wales (BOM, 2007) and 2007 for Western
Australia (BOM, 2008). It is clear that water stress is the major factor affecting wheat yield
in Australia (Loss and Siddique, 1994).
Figure 2.2 Average wheat yield in Australia from 1971 to 2013. Black bars represent the years in which average yield dropped below 1 t/ha due to severe drought.
Australia is the second driest continent in the world with more than 80% of the land area
receiving less than 600 mm of annual rainfall, most falls less than 300 mm (ABS, 2012).
The rainfall distribution pattern varies throughout the Australian grain belt. Most rainfall is
0.00
0.50
1.00
1.50
2.00
2.50
19
71
-72
19
73
-74
19
75
-76
19
77
-78
19
79
-80
19
81
-82
19
83
-84
19
85
-86
19
87
-88
19
89
-90
19
91
-92
19
93
-94
19
95
-96
19
97
-98
19
99
-00
20
01
-02
20
03
-04
20
05
-06
20
07
-08
20
09
-10
20
11
-12
Aver
age
yiel
d (t
ha-1
)
Chapter 2 – Review of the literature
7
received during summer in the northern region while it is fairly evenly distributed
throughout the year in the south-east (ABS, 2012). South-western Western Australia and
southern South Australia have a Mediterranean-type climate with wet winters and dry
summers (Henson et al., 1989a; Siddique et al., 1990b). Hence the pattern of development
of water deficit and its impact on yield varies with the growing region and season.
2.2.1 Terminal drought in Western Australia
Western Australia grows wheat in approximately 5 million hectare area, which constitutes
30% of the Australian grain belt (ABARES, 2013). Annual wheat production in Western
Australia is valued AUD 1.8 billion (ABS, 2012) and accounts for 38% of the national
produce. More than 75% of annual rainfall in WA is received from May to October
(Ludwig and Asseng, 2006) and more than 65% is received during winter (Aschmann,
1973). Rainfed wheat cropping is the only option as there is not sufficient water available
for irrigation. Annual rainfall in this area has decreased since the 1970s with a reduction of
up to 20% and a 60% reduction by 2050 has been predicted (Pittock, 1993). Due to the low
rainfall and high temperatures, increasing frequency of low yield years has been predicted
in the Western Australian grain belt (Farre and Foster, 2010).
Crop growth is low during winter due to low temperature and radiation (Palta and Watt,
2009). The low transpiration demand due to low temperature, low vapour pressure deficit
(VPD) and low variability in winter rainfall reduces the occurrence of water stress during
vegetative growth. Low and erratic rainfall, increased temperatures and VPD, and
evaporative demand in spring and early summer leads to soil water shortage, which often
causes crop water deficit after flowering (Turner and Asseng, 2005). End-of-season drought
or terminal drought is the most significant stress affecting wheat yield (Saini and Aspinall,
1981), but the degree of grain yield reduction depends on the time and rate of development
of the crop water deficit (Kobata et al., 1992; Palta et al., 1994). A 50% grain yield
Chapter 2 – Review of the literature
8
reduction occurred in wheat when terminal drought was induced at flowering (Dias de
Oliveira et al., 2013). Under extreme terminal drought conditions, wheat yield can fall
below 0.5 t/ha (Asseng et al., 2004). Reduced rainfall predicted during autumn may delay
sowing until later in the season and could therefore, further increase the risk of exposure to
terminal drought (Farre and Foster, 2010). The impact of water stress on wheat yield is
determined by how it affects the physiological processes and conditions in plants, which
varies between wheat genotypes (Kramer, 1980).
In water-limited environment, grain yield is a function of water use, water use efficiency
and harvest index (Passioura, 1983). Hence, terminal drought can be combated to a
considerable extent by breeding new varieties with traits to improve water use efficiency
(Turner and Asseng, 2005). Water use efficiency (WUE) describes the biomass
accumulated per unit of water consumed, and is often used in different levels and units
(Turner, 1986; Tambussi et al., 2007). Reduced water uptake will clearly improve WUE,
but will result in reduced yield as per Passioura’s equation described above.
2.3 Crop adaptive strategies to combat terminal drought
End-of-season drought or terminal drought occurs when crop enter their reproductive
growth stage (Turner and Begg, 1981). Since wheat is a determinate crop (Atwell et al.,
1999), adaptation mechanisms such as reductions in leaf area, tiller number and biomass
are no longer feasible under terminal drought. Drought escapism, the ability to complete a
lifecycle before severe plant water deficit develop (Kramer, 1980), has been used by crop
breeders for earliness (Siddique et al., 1989). However, earliness may reduce yield
potential in years where rainfall is plentiful (Turner, 1986). Furthermore, under
Mediterranean-type climates, drought escapism should be accompanied by low temperature
tolerance (Kramer, 1980). Under prevailing unpredictable rainfall conditions, adaptive
measures to tolerate drought either by postponing or enduring dehydration (Turner, 1986)
Chapter 2 – Review of the literature
9
help to sustain physiological activities and minimise yield loss in instances where rainfall
is minimal. Osmotic adjustment to tolerate dehydration has no direct influence on grain
yield other than modifying water extraction pattern (Morgan and Condon, 1986; Serraj and
Sinclair, 2002).
Terminal drought affects grain filling (Fischer and Kohn, 1966; Saini and Aspinall, 1981;
Rajala et al., 2009), resulting in shrivelled grains (Mitchell et al., 2013). The carbohydrate
requirement for grain filling is partly met by current assimilates and partly by translocation
of assimilates stored in vegetative parts. Under terminal drought, the major source of
carbon for grain filling is stored assimilates in the tillers (Pheloung and Siddique, 1991;
Kobata et al., 1992; Blum, 1998) as photosynthesis will be limited by water stress. The
proportion of biomass converted to grain yield is determined mainly by the water used after
anthesis (Passioura, 1983). Thus, every extra millimetre of water extracted during the grain
filling can result in yield advantage (Manschadi et al., 2006; Kirkegaard, 2007). Therefore,
sustaining water uptake during grain filling is critical to improve grain yield under terminal
drought. Plant strategies like stomatal closure to limit water loss and/or root properties to
slow down soil moisture depletion may protract physiological processes for yield
improvement under terminal drought.
2.3.1 Stomatal regulation: an important mechanism to control water use under
terminal drought
More than 90% of water uptake in plants is lost through transpiration (Pei et al., 1998)
mainly through diminutive pores in the leaf epidermis called stomata. Leaf transpiration is
determined by leaf to air vapour pressure deficit and the resistance to the movement of
water from leaf to the atmosphere (Farquhar and Sharkey, 1982). Reducing the width of the
stomatal opening reduces the ease with which water passes from the plant to the
Chapter 2 – Review of the literature
10
atmosphere (stomatal conductance) and is considered as a drought adaptive mechanism
(Schmidt, 1983).
2.3.1.1 Stomatal regulation is governed by soil water status, not leaf water status
Opening and closing of stomata is controlled by two specialised cells called guard cells that
encompass the stomata and is facilitated by changes in turgor inside guard cells (Zelitch,
1967). Guard cells adjust their turgor by the influx or efflux of organic ions like K+, H+ and
Cl– and metabolism of organic acids like malic acid (Raschke, 1975). An increase in guard
cell turgor results in widening of stomata (stomata open) and loss of water results in
narrowing (stomata close). Hence it was initially believed that under water stress, stomata
regulate in response to reduction in leaf water status or turgor (Jones, 1998) that arises due
to decreased water supply from the root. Under field conditions, leaf water status declines
earlier than root water status (Kramer, 1988). However, genotypes may differ in their
ability to regulate stomata in response to their leaf water status. For example, isohydric
genotypes initiates stomatal closure to maintain leaf water status while stomatal regulation
is triggered by a reduced leaf water potential in anisohydric genotypes (Tardieu et al., 1996;
Schultz, 2003; Gallé et al., 2013). Root pressurisation and split – root experiments, in
which leaf water status could be maintained, showed that stomatal conductance decreased
with soil dryness irrespective of leaf water status (Gollan et al., 1986; Passioura, 1988a).
Most research supported soil water status as the prime factor affecting stomatal closure
(Aston and Lawlor, 1979; Schulze, 1986; Schulze et al., 1988; Saab and Sharp, 1989;
Zhang and Davies, 1990a) and it is now generally accepted that root sense the drying soil
and sends signals to the shoot to which stomata responds and regulate the opening to
minimise water loss (Gollan et al., 1986; Blum and Johnson, 1993).
Chapter 2 – Review of the literature
11
2.3.1.2 Root -to -shoot signalling to regulate stomata
Stomatal regulation in response to soil dryness indicates communication between the
drying soil and responding leaves. As roots are in direct contact with the drying soil, it has
been postulated that roots generate and transmit signals to the leaves such that the stomata
respond (Gollan et al., 1986; Passioura, 1988b; Blum and Johnson, 1993). The involvement
of root signals in controlling stomata has been confirmed by many studies and a vast pool
of data supports a chemical signal, the plant hormone abscisic acid (ABA) (Loveys and
Kriedemann, 1974; Zhang et al., 1987; Henson et al., 1989b; Zhang and Davies, 1990a;
Munns and Sharp 1993).
ABA has been strongly advocated as the chemical signal involved in this root-to-shoot
communication process, but it has not been confirmed as the sole signal involved. For
example, Munns and King (1988) showed the presence of a compound different to ABA in
the xylem sap of wheat plants that reduces stomatal conductance and increases leaf ABA
concentration. In recent years, hormone interactions (Acharya and Assmann, 2009) and
interactions between hormones and the environment have also attracted much interest.
Thus, the involvement of other hormones and chemicals like cytokinin, auxins, ethylene,
jasmonic acid, salicylic acid, H2O2 and ionic substances has been suggested which can act
either as positive (presence or increased concentration causes stomatal closure) or negative
(absence or decreased concentration reduces stomatal conductance) signals (Schachtman
and Goodger, 2008; Acharya and Assmann, 2009; Wilkinson et al., 2012). Esters of ABA,
especially glucose esters, can play a significant role as a root signal (Munns and Sharp
1993; Sauter et al., 2002). An increase in xylem pH (Davies and Zhang, 1991; Sobeih et al.,
2004) has also been considered as a root signal or an amplifier of root signal which
facilitates redistribution of sequestrated leaf ABA to reach guard cells.
Chapter 2 – Review of the literature
12
A recent study with grafted Arabidopsis plants with either ABA-deficient stock or scion
point to little importance of ABA as a root signal, but emphasise the importance of leaf
ABA in stomatal regulation (Christmann et al., 2007). Supplying water directly to leaves of
water stressed plants reverted stomatal closure indicating that hydraulic signals were also
involved in stomatal regulation (Comstock, 2002; Christmann et al., 2007). A drop in root
water potential, with a net result of decreased soil water potential and water flux, can be
considered the signal generator to regulate stomata (Tardieu et al., 1991). No consensus
has been reached regarding the root signal that causes stomatal closure when soil dries.
Whatever it may be, ABA concentration in wheat leaves increases in response to water
stress (Wright, 1969) and modulates stomatal conductance (Mittelheuser and Van
Steveninck, 1969).
2.3.1.3 Role of ABA in stomatal regulation
An increased concentration of ABA in leaves associated with reduced stomatal
conductance (gs) under water stress has been confirmed by several studies conducted in
various species including wheat (Wright, 1969; Loveys and Kriedemann, 1974; Quarrie and
Jones, 1977; Quarrie, 1980; Blackman and Davies, 1985; Zhang et al., 1987; Henson et al.,
1989b; Davies and Zhang, 1991; Munns and Sharp 1993). Leaf ABA as the main driver of
stomatal regulation was questioned when several studies in species like maize demonstrated
that xylem ABA increases much earlier than leaf ABA and correlated better with gs than
leaf ABA (Blackman and Davies, 1985; Zhang and Davies, 1990a; Tardieu et al., 1992b).
This is because leaf ABA consists of ABA sequestrated into the mesophyll chloroplast
which has no effect on stomatal regulation (Dodd et al., 1996). However, this is not clearly
demonstrated in wheat probably because very few studies have measured xylem sap ABA
in wheat under drying soil conditions (Table 2.1) due to the difficulty in obtaining xylem
sap (Cramer and Lewis, 1993; Munns et al., 1993). In addition, strong correlation between
Chapter 2 – Review of the literature
13
leaf ABA and gs has been demonstrated in wheat (Henson et al., 1989b; Ali et al., 1998),
unlike in maize and sunflower (Zhang and Davies, 1990b; Tardieu et al., 1992b).
This does not suggest that xylem ABA has no role in stomatal regulation in wheat. The
limited studies that have extracted xylem sap from wheat seedlings by pressuring the whole
plant have demonstrated that xylem sap ABA increases with reduction in soil moisture, and
turgid wheat leaves reduced gs when fed the collected sap (Munns and King, 1988; Munns
et al., 1993). Wheat leaves fed with exogenous ABA also mimicked the effect of water
stress by closing their stomata (Mittelheuser and Van Steveninck, 1969; Quarrie and Jones,
1977), confirming the involvement of xylem ABA in stomatal regulation. Nevertheless, the
exogenous ABA concentration required to mimic stomatal response was 100 times that of
its endogenous ABA (Munns and King, 1988) indicating that other factors act in
conjunction with xylem ABA in stomatal closure, such as the presence of other compounds
(Munns et al., 1993) or xylem sap pH (Wilkinson and Davies, 1997; Sobeih et al., 2004).
Alternatively, leaf ABA may also contribute to ABA that reach guard cells in water
stressed plants (Cowan et al., 1982; Bahrun et al., 2002), especially in mature plants since
stomatal sensitivity to xylem ABA decreases with ageing in wheat (Atkinson et al., 1989).
Increased accumulation of leaf ABA in non-pressurised plants compared to pressurised
wheat plants under similar moisture stress supports leaf as the major source of ABA at the
reproductive stage (Westgate et al., 1996). Flag leaf ABA increases in response to turgor
loss and is the source for ABA to the spike (Morgan and King, 1984). Hence at least in
wheat plants at the reproductive stage, leaf ABA is significant and a close correlation
between leaf ABA and gs exists (Henson et al., 1989b). Evidence from different species
including wheat suggests that stomatal regulation can be considered the net result of an
integrative response of both root and leaf ABA (Tardieu and Davies, 1993).
14
Table 2.1 Examples of previous research conducted in wheat to elucidate the role of ABA under drought
Sl. No. Stage of plant
Methodology of drought initiation
Tissue sampled for
ABA analysis
Exogenous ABA
application
Application method Concentration of exogenous ABA
Reference
1 Seedling Wilting excised leaf leaf No - - (Wright, 1969)
2 Seedling Withholding water - Yes Injection to leaf sheath 3.8 × 10⁻⁴ M (Quarrie and Jones, 1977)
3 Vegetative
Reproductive
Withholding water leaf Yes Soil drenching 10–6 M (Du et al., 2013)
4 Reproductive Withholding water spike Yes Injection through leaf sheath
10–4 M (Ji et al., 2011)
5 Seedling No drought treatment Xylem sap Yes Added to nutrient medium 10–5 M (Kudoyarova et al., 2011)
6 Reproductive Water stress in field - Yes Foliar sprays 10–3 M (Travaglia et al., 2010)
7 Reproductive Water stress in field - Yes Foliar sprays 300 mg L–1 (Travaglia et al., 2007)
8 Seedling No drought treatment Sap and root (Vysotskaya et al., 2003)
9 Flag leaf Withholding water Flag leaves, floral organs
No (Westgate et al., 1996)
10 Stem elongation
No drought treatment - Yes Detached leaf feeding
Root medium
10–4M (Blum and Sinmena, 1995)
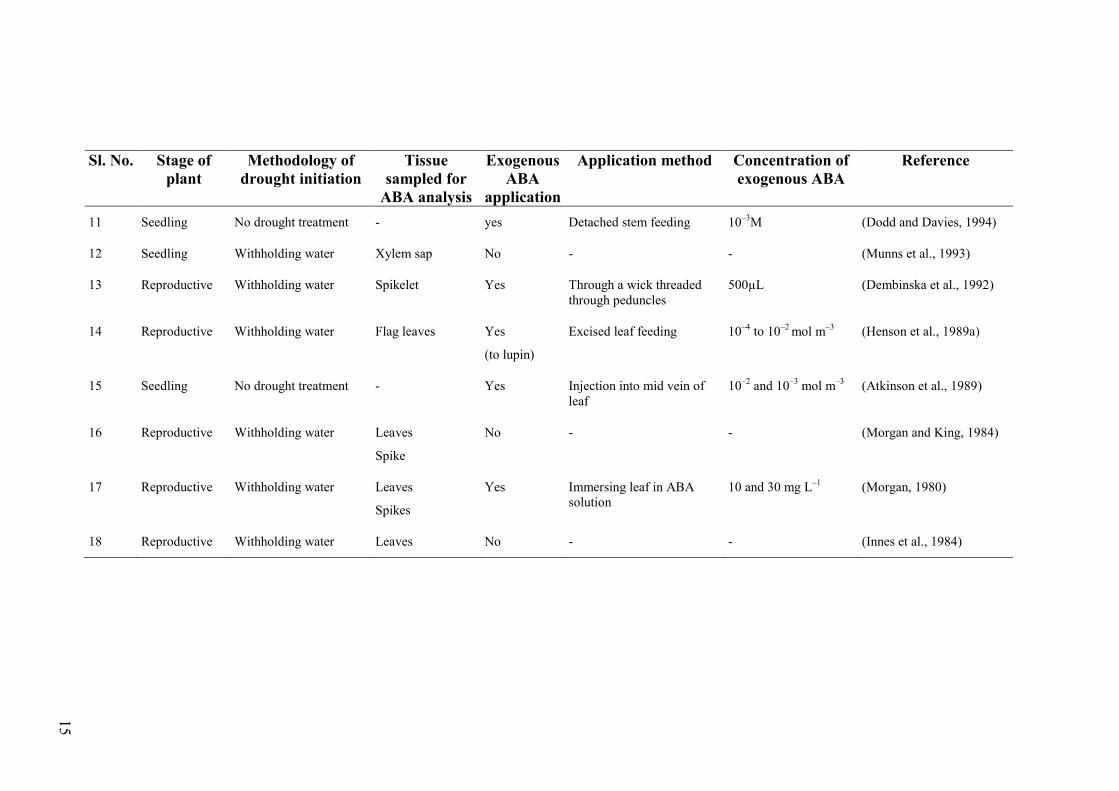
15
Sl. No. Stage of plant
Methodology of drought initiation
Tissue sampled for
ABA analysis
Exogenous ABA
application
Application method Concentration of exogenous ABA
Reference
11 Seedling No drought treatment - yes Detached stem feeding 10–3M (Dodd and Davies, 1994)
12 Seedling Withholding water Xylem sap No - - (Munns et al., 1993)
13 Reproductive Withholding water Spikelet Yes Through a wick threaded through peduncles
500µL (Dembinska et al., 1992)
14 Reproductive Withholding water Flag leaves Yes
(to lupin)
Excised leaf feeding 10–4 to 10–2 mol m–3 (Henson et al., 1989a)
15 Seedling No drought treatment - Yes Injection into mid vein of leaf
10–2 and 10–3 mol m–3 (Atkinson et al., 1989)
16 Reproductive Withholding water Leaves
Spike
No - - (Morgan and King, 1984)
17 Reproductive Withholding water Leaves
Spikes
Yes Immersing leaf in ABA solution
10 and 30 mg L–1 (Morgan, 1980)
18 Reproductive Withholding water Leaves No - - (Innes et al., 1984)
16
2.3.1.4 ABA dynamics in plants
ABA is synthesised in root apical cells and also in mesophyll cells in the leaves (Hartung et
al., 2002). Plant roots absorb ABA and its conjugates (ABA-glucose ester) from the soil
solution (Hartung et al., 2002). Root cells synthesise ABA when their water status is
reduced by 50% or more (Hartung et al., 2002). ABA in the root tissues takes both
apoplastic and symplastic pathways to reach xylem (Hartung et al., 2002). Xylem ABA acts
as an early signal that initiates stomatal regulation (Zhang and Davies, 1990a). As water
deficit increases, ABA biosynthesis in leaves is triggered by a reduced leaf water potential
or turgor (Westgate et al., 1996). ABA concentration increases in all leaf tissues including
guard cells (Harris et al., 1988). Leaf-synthesised ABA is loaded into the phloem and
transported to the roots (Slovik et al., 1995; Kudoyarova et al., 2011) either to enter the
xylem (Liang et al., 1997) or to be deposited in root tissues (Hartung et al., 2002). During
transportation from root to leaves, stem parenchyma cells also contribute to xylem ABA
under conditions of high concentration and pH gradient (Sauter and Hartung, 2002). ABA
is a weak acid (Hartung and Slovik, 1991), so xylem ABA reaching the leaf lamina gets
sequestrated into alkaline compartments of leaf tissues (Cowan et al., 1982; Slovik et al.,
1995) depending on the pH gradient between the tissue and xylem (Wilkinson and Davies,
1997). With higher xylem sap pH, ABA sequestration to leaf tissue is reduced or the
redistribution of leaf tissue ABA to reach guard cells is favoured (Cowan et al., 1982;
Popova et al., 2000). In addition, guard cells can synthesise ABA (Bauer et al., 2013).
ABA also gets degraded to form phaseic acid (PA), which may be further metabolised to
dihydrophaseic acid (DPA) (Harrison and Walton, 1975; Creelman and Zeevaart, 1984).
Alternatively, ABA conjugates with glucose to form ABA-glucose ester (ABA-GE) which
is not active in stomatal regulation (Zeevaart and Creelman, 1988). Esters of ABA are
present in the xylem sap of several species (Jeschke et al., 1997; Hansen and Dörffling,
1999; Sauter et al., 2002) and is believed to be involved in root-to-shoot signalling. In
Chapter 2 – Review of the literature
17
wheat, the high-molecular weight compound with anti-transpiration properties in the xylem
sap of water-stressed plants is possibly glucose esters of ABA (Munns and King, 1988;
Munns et al., 1993 ). ABA-GE is capable of releasing free ABA upon hydrolysis by β-
glucosidases (Dietz et al., 2000; Lee et al., 2006; Schroeder and Nambara, 2006; Xu et al.,
2012). Thus, bulk leaf ABA is the net result of ABA transported through xylem,
biosynthesis in leaves, degradation and conjugation (Figure 2.3).
2.3.1.5 Tissue sampling for ABA analysis
A strong correlation exists with ABA and gs, but the relationship varies with species and
the tissue sampled (section 2.3.1.3). The main reason for this discrepancy is that ABA
concentration in the leaf tissue or xylem sap does not relate to those reaching guard cells,
which acts on stomata (Munns and Sharp 1993). The most accurate option is to measure
ABA nearest to the site of action, which is the guard cells, but this is possible only in some
species like Commelina where the epidermis can be stripped easily (Blackman and Davies,
1983) and guard cells can be isolated by killing all other epidermal cells by a low pH
treatment (MacRobbie, 1980). Due to this limitation in isolating the epidermis in some
species and laborious process involved in collecting sufficient epidermal tissue for analysis,
xylem sap is considered the best option to explain stomatal behaviour (Dodd et al., 1996).
Xylem sap sampling is not easy in cereals as it is difficult to collect sufficient volume of
xylem sap to quantify ABA (Dodd and Davies, 1996), especially in wheat and barley
(Cramer and Lewis, 1993; Munns et al., 1993). Hence, most studies where xylem sap ABA
is measured have been conducted on maize due to ease of extraction of a large volume of
sap (Dodd and Davies, 1996) (Table 2.2). Besides, much attention is needed to get a
representative sample as ABA concentration varies with the volume of the collected sap
(Borel and Simonneau, 2002), the method of collection (Quarrie and Lister, 1983), the
18
point of collection (Netting et al., 2012) and the time of collection (Schurr et al., 1992;
Tardieu and Davies, 1992).
2.3.1.5.1 Xylem sap sampling techniques
A commonly used method to collect exuded root xylem sap is from detached root stumps
(Zhang and Davies, 1990a; Vysotskaya et al., 2003). Removing the aerial part will cease
transpiration, which increases root pressure thus causing exudation. However, little exudate
was collected from wheat grown under hydroponics, even without water stress (Cramer and
Lewis, 1993). Root exudation did not yield any sap from barley plants also (Martin-
Vertedor and Dodd, 2011). Nevertheless, Ali et al. (1998) collected xylem sap from water-
stressed wheat plants grown in lysimeters through root exudation. The drawback in exudate
collection is that the flux of sap exudation will be much lower due to lack of transpiration
pull (Schurr, 1998), which alters the ABA concentration in the sap (Else et al., 1994;
Goodger et al., 2005). Information about fluxes and ABA concentration is needed (Schurr,
1998) to account for the changes in stomatal opening. It is ideal to collect the sap when the
flow rate is similar to the transpiring rate of an intact plant (Else et al., 1995), but negative
pressure in the xylem of transpiring plants make collection extremely difficult (Schurr,
1998).
The pressurisation technique allows sap collection to occur at a similar rate of flux as in
intact transpiring plant (Munns et al., 1993), but the ABA concentration may vary due to
wounding (Else et al., 1994) and the interruption of the flow of signals and ions from
phloem to xylem (Schurr, 1998). Pressurisation can be applied to extract sap from other
plant parts like leaves, but the volume of extraction without water contamination from
internal compartments is limited (Dodd, 2007). Some studies have collected xylem sap
from wheat by pressurising the whole root system in a pressure chamber (Table 2.2). The
Chapter 2 – Review of the literature
19
lack of pressure chambers (Dodd, 2007) suitable for large flowering stage plants limits its
applicability to seedlings.
The application of external forces such as a vacuum is another method of collecting xylem
sap. As the xylem fluid is under less axial resistance compared to fluid in surrounding
tissues, application of a slight force will separate xylem sap thereby minimising the risk of
contamination with other fluids. Applying negative pressure through a vacuum stimulates
conditions similar to intact transpiring plants (Freundl et al., 1998). However, few
experiments have used this technique to extract xylem sap (Table 2.2)
Controversy exists regarding which xylem sap sampling procedures best represent ABA
concentration in the xylem sap of a transpiring plant. As the site of action is on leaves and
due to ease of access and abundance (Dodd et al., 1996), leaf tissue is the most sampled in
studies on wheat (Table 2.1 and 2.2)
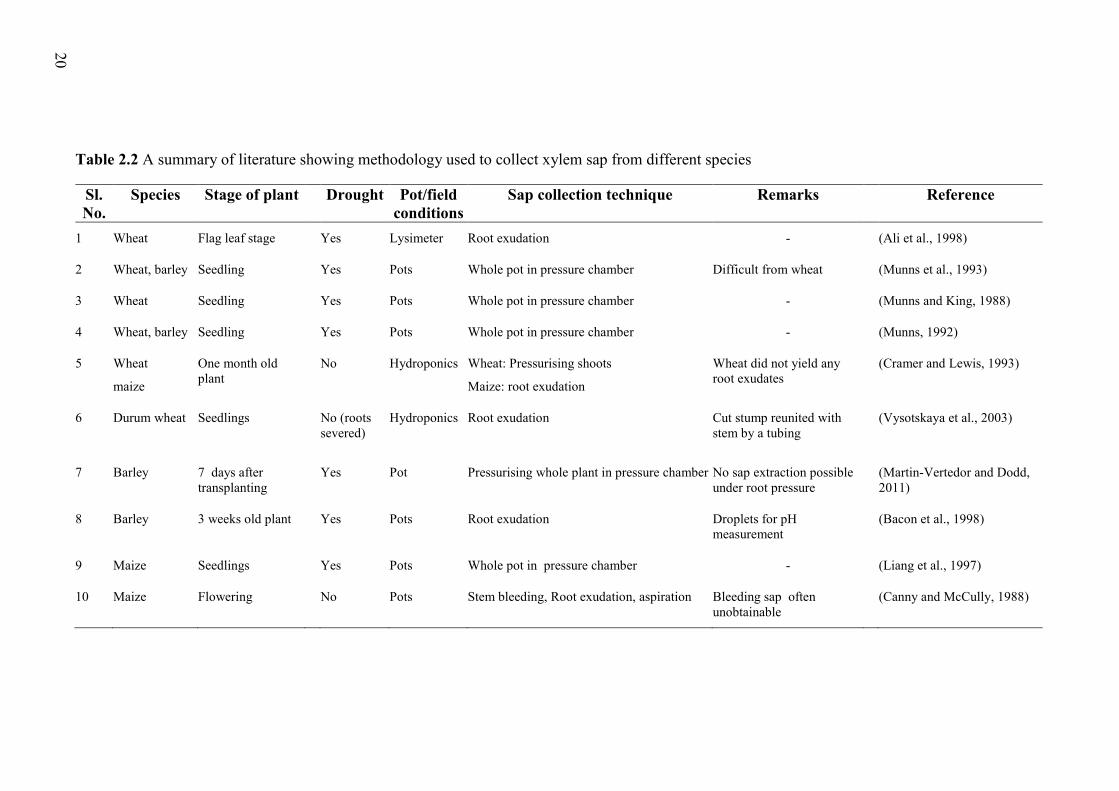
20
Table 2.2 A summary of literature showing methodology used to collect xylem sap from different species
Sl. No.
Species Stage of plant Drought Pot/field conditions
Sap collection technique Remarks Reference
1 Wheat Flag leaf stage Yes Lysimeter Root exudation - (Ali et al., 1998)
2 Wheat, barley Seedling Yes Pots Whole pot in pressure chamber Difficult from wheat (Munns et al., 1993)
3 Wheat Seedling Yes Pots Whole pot in pressure chamber - (Munns and King, 1988)
4 Wheat, barley Seedling Yes Pots Whole pot in pressure chamber - (Munns, 1992)
5 Wheat
maize
One month old plant
No Hydroponics Wheat: Pressurising shoots
Maize: root exudation
Wheat did not yield any root exudates
(Cramer and Lewis, 1993)
6 Durum wheat Seedlings No (roots severed)
Hydroponics Root exudation Cut stump reunited with stem by a tubing
(Vysotskaya et al., 2003)
7 Barley 7 days after transplanting
Yes Pot Pressurising whole plant in pressure chamber No sap extraction possible under root pressure
(Martin-Vertedor and Dodd, 2011)
8 Barley 3 weeks old plant Yes Pots Root exudation Droplets for pH measurement
(Bacon et al., 1998)
9 Maize Seedlings Yes Pots Whole pot in pressure chamber - (Liang et al., 1997)
10 Maize Flowering No Pots Stem bleeding, Root exudation, aspiration Bleeding sap often unobtainable
(Canny and McCully, 1988)
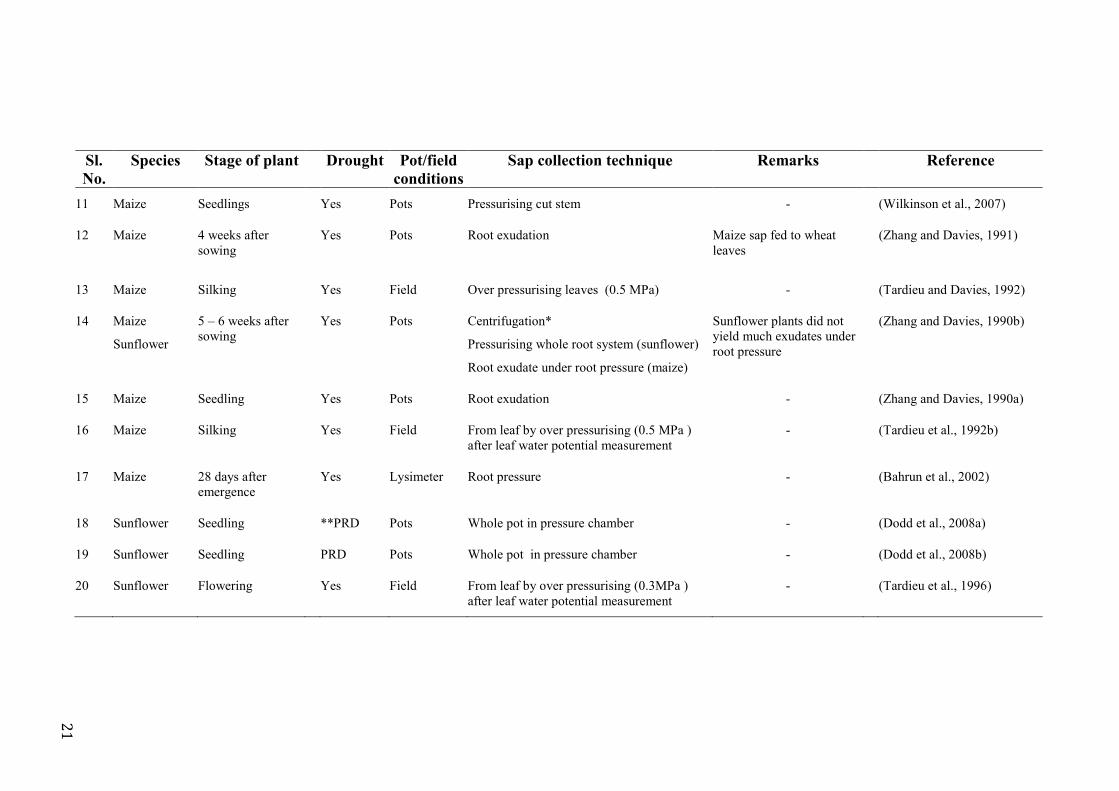
21
Sl. No.
Species Stage of plant Drought Pot/field conditions
Sap collection technique Remarks Reference
11 Maize Seedlings Yes Pots Pressurising cut stem - (Wilkinson et al., 2007)
12 Maize
4 weeks after sowing
Yes Pots Root exudation Maize sap fed to wheat leaves
(Zhang and Davies, 1991)
13 Maize Silking Yes Field Over pressurising leaves (0.5 MPa) - (Tardieu and Davies, 1992)
14 Maize
Sunflower
5 – 6 weeks after sowing
Yes Pots Centrifugation*
Pressurising whole root system (sunflower)
Root exudate under root pressure (maize)
Sunflower plants did not yield much exudates under root pressure
(Zhang and Davies, 1990b)
15 Maize Seedling Yes Pots Root exudation - (Zhang and Davies, 1990a)
16 Maize Silking Yes Field From leaf by over pressurising (0.5 MPa ) after leaf water potential measurement
- (Tardieu et al., 1992b)
17 Maize 28 days after emergence
Yes Lysimeter Root pressure - (Bahrun et al., 2002)
18 Sunflower Seedling **PRD Pots Whole pot in pressure chamber - (Dodd et al., 2008a)
19 Sunflower Seedling PRD Pots Whole pot in pressure chamber - (Dodd et al., 2008b)
20 Sunflower Flowering Yes Field From leaf by over pressurising (0.3MPa ) after leaf water potential measurement
- (Tardieu et al., 1996)
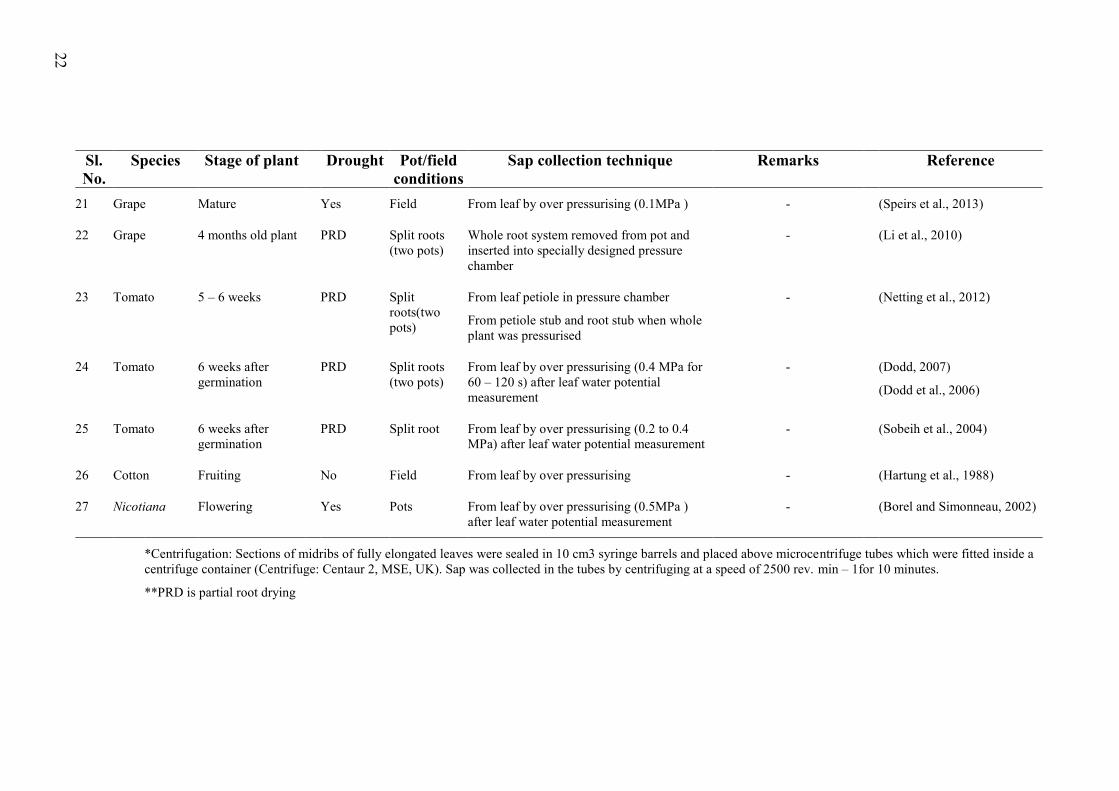
22
Sl. No.
Species Stage of plant Drought Pot/field conditions
Sap collection technique Remarks Reference
21 Grape Mature Yes Field From leaf by over pressurising (0.1MPa ) - (Speirs et al., 2013)
22 Grape 4 months old plant PRD Split roots (two pots)
Whole root system removed from pot and inserted into specially designed pressure chamber
- (Li et al., 2010)
23 Tomato 5 – 6 weeks PRD Split roots(two pots)
From leaf petiole in pressure chamber
From petiole stub and root stub when whole plant was pressurised
- (Netting et al., 2012)
24 Tomato 6 weeks after germination
PRD Split roots (two pots)
From leaf by over pressurising (0.4 MPa for 60 – 120 s) after leaf water potential measurement
- (Dodd, 2007)
(Dodd et al., 2006)
25 Tomato 6 weeks after germination
PRD Split root From leaf by over pressurising (0.2 to 0.4 MPa) after leaf water potential measurement
- (Sobeih et al., 2004)
26 Cotton Fruiting No Field From leaf by over pressurising - (Hartung et al., 1988)
27 Nicotiana Flowering Yes Pots From leaf by over pressurising (0.5MPa ) after leaf water potential measurement
- (Borel and Simonneau, 2002)
*Centrifugation: Sections of midribs of fully elongated leaves were sealed in 10 cm3 syringe barrels and placed above microcentrifuge tubes which were fitted inside a centrifuge container (Centrifuge: Centaur 2, MSE, UK). Sap was collected in the tubes by centrifuging at a speed of 2500 rev. min – 1for 10 minutes.
**PRD is partial root drying
Chapter 2 – Review of the literature
23
2.3.1.6 How does ABA affect stomatal regulation?
Stomata open or close by a change in the shape of the bordering guard cells due to relative
changes in turgor between guard cells and surrounding epidermal cells (Meidner and
Mansfield, 1968). Stomata open when guard cell turgor is low compared to epidermal cells
and close if it is high. Guard cell turgor is maintained by the influx and efflux of certain
ions like K+, Cl–, H+ etc, importantly K+. Studies have shown that ABA closes stomata
even in turgid leaves (Mittelheuser and Van Steveninck, 1969; Zhang and Davies, 1991); a
reasonable assumption that ABA regulates ion fluxes into and out of guard cells. Elevated
levels of ABA around guard cells could initiate the loss of K+ leading to stomatal closure
(Mansfield and Jones, 1971). However, whether ABA aids stomatal regulation by
inhibiting influx or by facilitating efflux is contradictory. Thus, ABA reportedly affects the
efflux of anions rather than inhibiting the influx in Commelina species (MacRobbie, 1981)
but inhibits influx in Vicia faba (Horton and Moran, 1972). While, exogenous ABA
application in Arabidopsis thaliana did not affect guard cell K+ channels (Aurisano et al.,
1993). Thus, mechanisms of ABA-mediated stomatal regulation are not yet clear despite
the large number of studies; the data generated to unveil mechanisms underlying ABA-
mediated stomatal response to water stress disagree, revealing the complexity of the
phenomenon (see below and Figure 2.3).
1. ABA is not the sole chemical involved in stomatal regulation; several other
phytohormones and/or compounds are involved and hence stomatal response is the net
result of the interaction between several hormones and other environmental factors
2. A multitude of factors determine the accumulation of ABA and stomatal response to a
given concentration of ABA: (i) genetic factors (Quarrie, 1980), (ii) water status of plants
such as leaf water potential (Quarrie, 1980) or turgor (Morgan and King, 1984), (iii) soil
water status, (iv) pH (Slovik et al., 1995; Hartung et al., 2002), (v) soil compaction
Chapter 2 – Review of the literature
24
(Tardieu et al., 1992b), (vi) environmental factors such as temperature (Wright, 1969; Dodd
and Davies, 1994), light or time of day, (vii) changes in water flux through the xylem
(Slovik et al., 1995) and (viii) previous exposure to ABA flux (Atkinson et al., 1989).
3. The ABA concentration reaching the guard cells at any given time can vary due to
sequestration, remobilisation and degradation and/or conjugation. All the mechanisms are
not yet fully understood.
4. ABA is synthesised in several tissues including roots, leaves and guard cells (Bauer et
al.). In addition ABA is taken up by roots from the soil (Hartung et al., 2002)
5. ABA is mobile within the plant travelling up and down the plant; from root to leaves
through xylem and from leaves to roots through phloem. ABA from leaves is also exported
to spikes. Regulation of this movement and its physiological implications is not yet clear
(Seo and Koshiba, 2011)
6. The action of ABA is not limited to stomatal regulation, but is involved in many
physiological functions from seed germination, growth (Milborrow, 1967), tiller production
(Quarrie and Jones, 1977), root hydraulic conductivity (Davies et al., 1982), cell wall
rigidity (Davies et al., 1982), pollen sterility (see section 2.4.2), and in determining yield
(Travaglia et al., 2007).
The involvement of ABA in stomatal regulation is equivocal, but the above-listed
intricacies have limited the understanding of complex mechanism of ABA-mediated
stomatal regulation under water stress. Moreover, stomata is controlled by several
feedback loops (Raschke, 1975) involving external and internal factors such as light, VPD,
intercellular CO2 concentration, leaf turgor and soil water status.
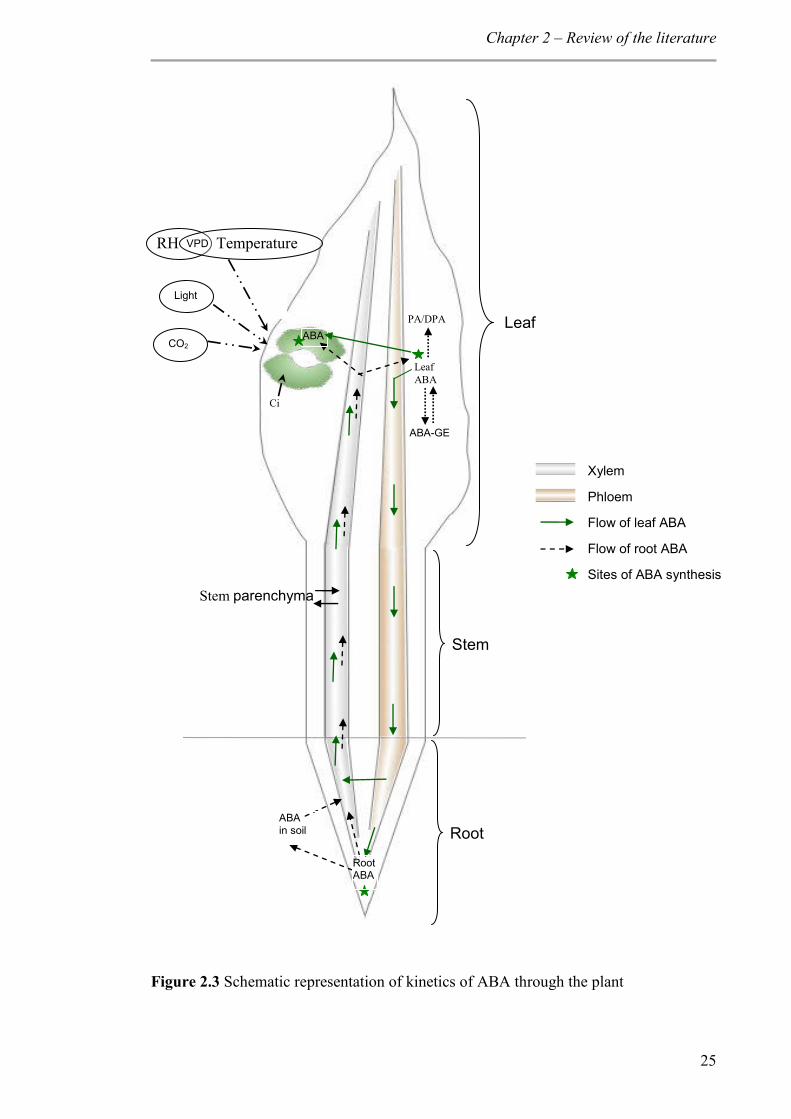
Chapter 2 – Review of the literature
25
Figure 2.3 Schematic representation of kinetics of ABA through the plant
PA/DPA
LeafABA
ABA-GE
Stem
Root
Leaf
Ci
RH Temperature VPD
CO2
Light
RootABA
ABA in soil
Stem parenchyma
Xylem
Phloem
Flow of leaf ABA
Flow of root ABA
Sites of ABA synthesis
ABA
Chapter 2 – Review of the literature
26
2.3.2 Root traits to favour terminal drought adaptation in wheat
2.3.2.1 Root distribution: a potential trait to maintain water uptake under drought
Root characteristics, especially distribution patterns and architecture, have a significant role
in crop productivity under water deficit conditions (Lynch, 1995; Manschadi et al., 2006).
However, research in this area has been limited because of the difficulty in studying root
form and function in-situ.
In wheat, root distribution and architecture varies with genotypes (O'Toole and Bland,
1987; Siddique et al., 1990a; Manschadi et al., 2006; Palta et al., 2011) and with soil
environment (Bingham and Bengough, 2003; Kirkegaard, 2007). Genotypic variations in
root characteristics significantly impact water uptake and yield under water-limited
environments (Manschadi et al., 2006). Root traits such as root distribution with depth
(Oyanagi, 1994), root length density, xylem vessel diameter (Richards and Passioura,
1989), root-to-shoot ratio (Siddique et al., 1990a) and root vigour (Palta and Watt, 2009;
Palta et al., 2011) are often considered favourable in drought-prone environments.
A deeper root system is generally considered important (Oyanagi, 1994; Manschadi et al.,
2006; Wasson et al., 2012), as this trait appears beneficial in capturing moisture from
deeper soil layers, especially during grain filling (Passioura, 1983). This is particularly true
in areas where crop growth depends mainly on stored soil moisture such as the north-
eastern grain belt of Australia (Manschadi et al., 2006). In the Mediterranean-type climate
of the southern and western grain belt of Australia, where crops rely solely on seasonal
rainfall events, a vigorous root system is advocated for increased growth and yield of wheat
(Palta et al., 2011).
Crop growth is slow during winter (Palta and Watt, 2009) when more than 65% of annual
rainfall is received in the Mediterranean region of Australia (Loss and Siddique, 1994).
Chapter 2 – Review of the literature
27
Hence water received during winter far exceeds crop demand and drains down the soil
profile (Palta and Watt, 2009). Root vigour, early root development and branching, favour
effective capture of soil moisture and nutrients. By spring and early summer, the soil starts
drying near the surface where most of the roots are concentrated (Turner and Asseng,
2005). Under terminal drought conditions, vigorous roots are less advantageous (Palta et
al., 2011) and root growth in the deeper soil layers is considered advantageous (Loss and
Siddique, 1994). Therefore under terminal drought conditions, genotypes capable of
sustaining root growth post-anthesis to extract additional water from deeper soil profile
would be beneficial (Vadez, 2014).
Wheat roots reach maximum growth by anthesis (Siddique et al., 1990a; Gregory et al.,
1992) and further growth is generally not noticed. However, post-anthesis root growth is
observed in some wheat genotypes such as SeriM82 (Manschadi et al., 2006) and when the
primary carbon sink (spikes) are removed from the plant (Richards et al., 2007). This shows
that wheat roots can grow beyond anthesis stage in certain circumstances. However,
continued root growth will result in unbalanced assimilate partitioning from the shoot to
root limiting grain yield (Passioura, 1983; Song et al., 2009). In crops like wheat, which are
grown primarily for grains, assimilate diversion to such adaptation is not conducive for
improved grain yield. Furthermore, roots below 70 cm in the soil profile take up limited
amounts of water (Ali et al., 1998). A deeper root system, therefore does not implicate
efficient water extraction from deeper soil profile. Wheat roots do not absorb water
uniformly along their root length (Passioura, 1983; Bramley et al., 2009) which may be due
to poor root-soil contact (White and Kirkegaard, 2010) or impermeability of root
(Passioura, 1983).
Chapter 2 – Review of the literature
28
2.3.2.2 Root hydraulic resistance: a trait that limits water flux through roots
Water flow through plants is governed by the driving forces and resistance imposed by the
conduit (Boyer, 1985). Considerable resistance to water flow through the plant is provided
by roots (Newman, 1976). Therefore resistance to water flow (low conductance) within the
root prevents absorption and the supply of water to the shoot even though root growth is
sufficient to reach available water within the soil.
Water absorbed by roots flows across the root radius to reach xylem (radial pathway) and
then follows a longitudinal pathway to the shoot through the xylem (axial pathway). Hence,
root hydraulic resistance is a combination of resistances offered by both radial and axial
pathways, with radial flow being the greatest constraint (Steudle and Peterson, 1998;
Bramley et al., 2009). Root structure and anatomy contributes to the hydraulic properties of
roots (Bramley et al., 2009). For instance, small xylem vessels impart larger resistance to
water flow through the xylem (Richards and Passioura, 1989). Likewise, the predominant
radial pathway adopted affects hydraulic conductance. For example, apoplastic flow is
driven by the hydrostatic gradient and involves minimal resistance compared with the
symplastic pathway (Steudle and Peterson, 1998). In wheat, significant radial water flow
occurs symplastically (Bramley et al., 2009), which is facilitated by the membrane-bound
protein, aquaporin. Aquaporin activity can potentially be enhanced by interactions with
ABA (Hose et al., 2000). A higher concentration of ABA was observed in wheat roots in
association with increased root hydraulic conductance following excision of four out of five
seminal roots (Vysotskaya et al., 2003; Vysotskaya et al., 2004). This hike in root ABA and
subsequent enhancement of root hydraulic conductivity to meet increased transpiration
demand is due to redistribution of ABA from leaf to root (Kudoyarova et al., 2011). Thus
leaf ABA is involved in regulating root hydraulic conductivity, in addition to its role in
regulating stomata.
Chapter 2 – Review of the literature
29
2.3.2.3 Root distribution and water use by stomatal regulation
The prime water conservation technique under water stress—stomatal closure — is in
response to the signals generated and transmitted from the roots (see section 2.3.1.2).
Hence root characteristics might play an important role in this signal generation process.
Wheat plants regulated stomata in response to drying signals from the roots in the top
drying layer of the soil profile even though leaf water status was maintained by unlimited
water supply from deeper soil layers (Blum and Johnson, 1993). These findings were
substantiated with increased ABA concentration in barley leaves when more seminal roots
were distributed in the dry half of the pots (Martin-Vertedor and Dodd, 2011). This proves
that the root distribution plays an important role in signal generation and subsequent
stomatal regulation. Therefore, under terminal drought conditions in the Mediterranean-
type regions of Australia, a greater root distribution in drying upper soil layers may
accumulate ABA in leaves and regulate stomata to conserve water for grain filling. This
may help the plant as an early signalling mechanism to regulate stomata and conserve water
well before a large part of the root zone has been depleted of water.
2.4 The effect of stomatal regulation on yield
The main objective of any wheat breeding program is yield improvement. Unfortunately,
many favourable plant responses to moisture stress have negative effects on grain yield
(Schmidt, 1983; Turner, 1986). Blum and Johnson (1993) reported a negative impact on
yield of wheat cultivars with reduced stomatal conductance in response to top dry soil. This
may be due to reduced photosynthesis due to stomatal closure (see section 2.4.1) or the
adverse effect of ABA on pollen sterility as reported by several scientists (see section
2.4.2).
Chapter 2 – Review of the literature
30
2.4.1 Stomatal conductance and photosynthesis
Stomata serve as a portal through which water exits the leaf and CO2 diffuses into leaf
tissue for photosynthesis. Therefore, stomatal regulation to limit water use during water
deficit is at the expense of CO2 diffusion into leaf tissue which subsequently reduces
photosynthesis (Chaves et al., 2009). In addition to the reduced CO2 influx, soil water
deficits reduces mesophyll conductance of CO2 limiting photosynthesis (Flexas et al.,
2004). As the relative water content decreases due to soil water deficit, decreased ATP
synthesis and consequent RuBP synthesis causes metabolic limitation of photosynthesis
(Lawlor, 2002; Lawlor and Cornic, 2002). Interestingly, the rate of reduction of CO2
assimilation is comparatively less than the reduction in transpiration (Holaday et al., 1992).
In well-adapted plants, the stomatal role in controlling photosynthesis is not more than 20%
of the total photosynthetic inhibition (Jones, 1998).
2.4.2 Impact of ABA on yield
Reduction in grain set due to drought has been associated with increased ABA
concentration in leaves and spikes (Morgan and King, 1984). Yield reduction in response to
exogenous ABA application supports the negative impact of ABA on grain set and yield
(Morgan, 1980). A reduction in the number of grains per ear in genotypes selected for high
leaf ABA levels even under well-watered conditions suggests that leaf ABA negatively
influences wheat pollination (Innes et al., 1984). Therefore yield reduction is observed
when the drought coincides with pollen mother cell meiosis and not during any later
developmental stage (Saini and Aspinall, 1981). Furthermore, ABA-associated pollen
sterility is more pronounced in drought-sensitive wheat genotypes compared to drought
tolerant ones (Ji et al., 2011). In a split-root study, where the dry half of the root system
contributed to increased leaf ABA while the other half supplied water to maintain leaf
Chapter 2 – Review of the literature
31
water potential, no yield reduction was noticed (Dembinska et al., 1992) . This suggests
that endogenous ABA is not the sole factor affecting grain set under drought.
Conversely, ABA is reported to have a positive influence on grain yield by affecting the
redistribution of carbohydrates from the shoot into wheat grain (Travaglia et al., 2007).
Increased grain yield by foliar application of ABA in a wheat field was confirmed by
Travaglia et al. (2010). This disagrees to the findings of King and Patrick (1982) where no
such involvement of ABA in assimilate transport to grain was observed. Du et al. (2013)
also observed no yield benefit by drenching soil with exogenous ABA. Lack of consensus
among researchers with regard to positive, negative or neutral influences of ABA on grain
yield suggests that the timing of water stress is of utmost importance. Pre – anthesis (during
spike development and pollen meiosis) water stress reduced grain number while post-
anthesis water stress reduced the grain size (Dolferus et al., 2011). This is because high
ABA level at early reproductive stage affects the grain set and reduces grain number while
the post-anthesis water stress promotes grain filling by redistributing reserved
carbohydrates to the grain (Liu et al., 2005). Based on the above studies, it appears that
ABA negatively affects grain set, but has a positive effect on grain filling by facilitating
assimilate partitioning to grains.
2.5 Summary and research opportunities
Terminal drought is the major abiotic stress affecting wheat grain yield in Mediterranean-
type environment in south-western Australia. In this environment, every extra millimetre of
soil water extracted during grain filling benefits grain yield and water use efficiency.
Stomatal regulation is an important mechanism that controls water use. The role of ABA in
regulating gs under water deficit has been explored extensively in crops such as maize,
tomato and sunflower, with few studies in wheat. Most studies in wheat have been
conducted during the vegetative growth focussing on the effect of ABA on gs as an
Chapter 2 – Review of the literature
32
adaptive mechanism. Not many studies have focussed on the role of ABA in controlling
water use during grain filling through regulation of stomatal aperture in relation to grain
yield when exposed to terminal drought. ABA reportedly has negative and positive impacts
on grain set, depending on the stage during which the plant was exposed to drought. Studies
focussing on terminal drought should unravel the mechanisms of ABA-mediated stomatal
regulation and its impact on grain yield in wheat.
ABA accumulation in the leaves is initiated through a root-to-shoot signalling process. The
signal involved in this process is not clear, but is controlled by the roots in contact with the
drying soil. Root being the source of drying signal, root density in the drying soil layer may
have an impact on signal strength and subsequent stomatal closure. This has been identified
in crops such as barley, but has not studied in wheat. Understanding the link between root
distribution and stomatal closure is important to identify traits for efficient management of
available resources under terminal drought conditions. The major research gap identified in
this review of literature is the lack of understanding on the impact of ABA accumulation
and stomatal regulation on wheat water use and grain yield under terminal drought
conditions (Figure 2.4).
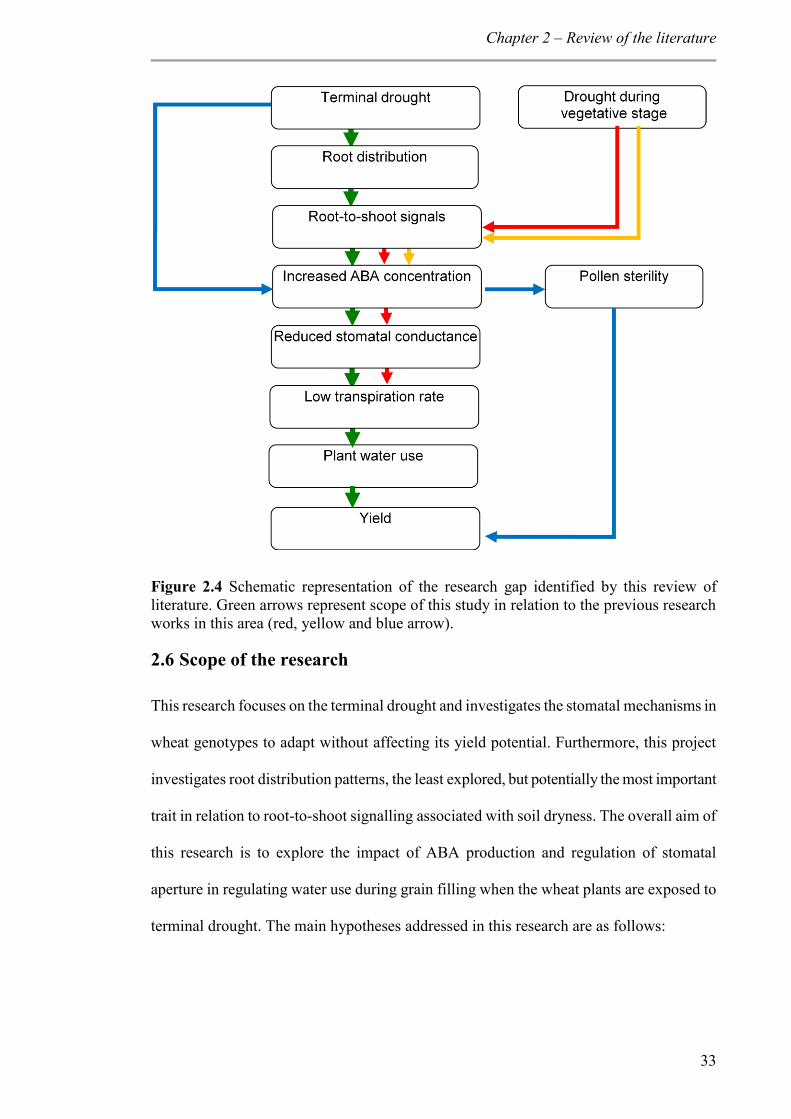
Chapter 2 – Review of the literature
33
Figure 2.4 Schematic representation of the research gap identified by this review of literature. Green arrows represent scope of this study in relation to the previous research works in this area (red, yellow and blue arrow).
2.6 Scope of the research
This research focuses on the terminal drought and investigates the stomatal mechanisms in
wheat genotypes to adapt without affecting its yield potential. Furthermore, this project
investigates root distribution patterns, the least explored, but potentially the most important
trait in relation to root-to-shoot signalling associated with soil dryness. The overall aim of
this research is to explore the impact of ABA production and regulation of stomatal
aperture in regulating water use during grain filling when the wheat plants are exposed to
terminal drought. The main hypotheses addressed in this research are as follows:
Chapter 2 – Review of the literature
34
1. differences in stomatal response to soil water deficit corresponds to increased
accumulation of ABA in the leaves
2. more root density distributed in the drying upper soil layer leads to early stomatal
closure in response to soil water deficit
3. xylem ABA is the major driver to initiate stomatal closure
4. stomatal sensitivity to xylem ABA concentration differs between genotypes
5. stomatal sensitivity to xylem ABA concentration differs with xylem sap pH and
water status of the plant.
6. wheat genotypes differ in their root capability to extract water from the bottom of
the soil profile
7. early stomatal closure conserves water for use during grain filling period which
reduces yield gap.
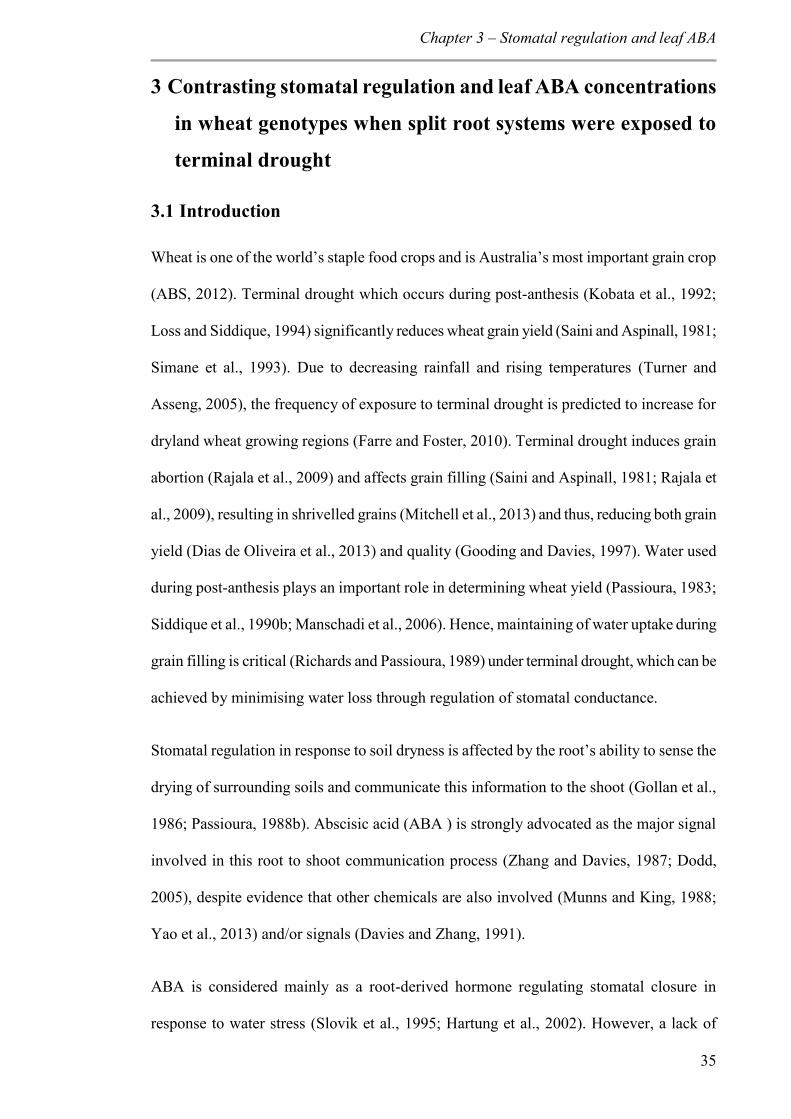
Chapter 3 – Stomatal regulation and leaf ABA
35
3 Contrasting stomatal regulation and leaf ABA concentrations
in wheat genotypes when split root systems were exposed to
terminal drought
3.1 Introduction
Wheat is one of the world’s staple food crops and is Australia’s most important grain crop
(ABS, 2012). Terminal drought which occurs during post-anthesis (Kobata et al., 1992;
Loss and Siddique, 1994) significantly reduces wheat grain yield (Saini and Aspinall, 1981;
Simane et al., 1993). Due to decreasing rainfall and rising temperatures (Turner and
Asseng, 2005), the frequency of exposure to terminal drought is predicted to increase for
dryland wheat growing regions (Farre and Foster, 2010). Terminal drought induces grain
abortion (Rajala et al., 2009) and affects grain filling (Saini and Aspinall, 1981; Rajala et
al., 2009), resulting in shrivelled grains (Mitchell et al., 2013) and thus, reducing both grain
yield (Dias de Oliveira et al., 2013) and quality (Gooding and Davies, 1997). Water used
during post-anthesis plays an important role in determining wheat yield (Passioura, 1983;
Siddique et al., 1990b; Manschadi et al., 2006). Hence, maintaining of water uptake during
grain filling is critical (Richards and Passioura, 1989) under terminal drought, which can be
achieved by minimising water loss through regulation of stomatal conductance.
Stomatal regulation in response to soil dryness is affected by the root’s ability to sense the
drying of surrounding soils and communicate this information to the shoot (Gollan et al.,
1986; Passioura, 1988b). Abscisic acid (ABA ) is strongly advocated as the major signal
involved in this root to shoot communication process (Zhang and Davies, 1987; Dodd,
2005), despite evidence that other chemicals are also involved (Munns and King, 1988;
Yao et al., 2013) and/or signals (Davies and Zhang, 1991).
ABA is considered mainly as a root-derived hormone regulating stomatal closure in
response to water stress (Slovik et al., 1995; Hartung et al., 2002). However, a lack of
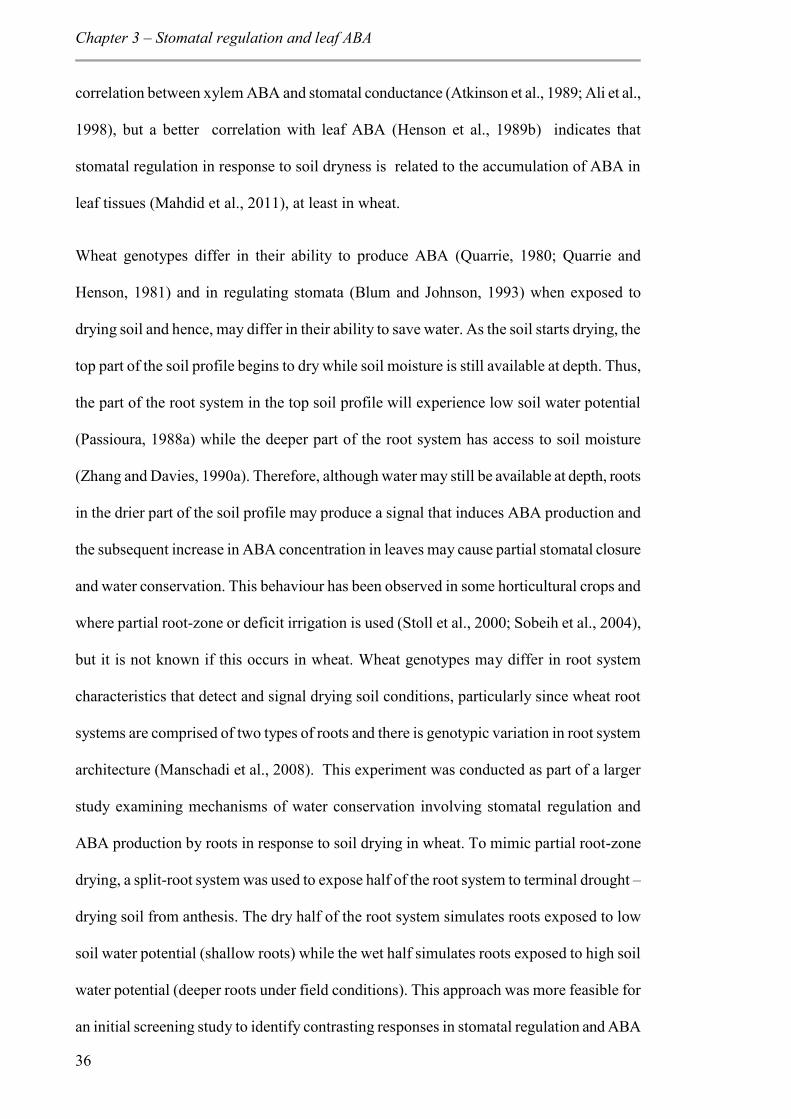
Chapter 3 – Stomatal regulation and leaf ABA
36
correlation between xylem ABA and stomatal conductance (Atkinson et al., 1989; Ali et al.,
1998), but a better correlation with leaf ABA (Henson et al., 1989b) indicates that
stomatal regulation in response to soil dryness is related to the accumulation of ABA in
leaf tissues (Mahdid et al., 2011), at least in wheat.
Wheat genotypes differ in their ability to produce ABA (Quarrie, 1980; Quarrie and
Henson, 1981) and in regulating stomata (Blum and Johnson, 1993) when exposed to
drying soil and hence, may differ in their ability to save water. As the soil starts drying, the
top part of the soil profile begins to dry while soil moisture is still available at depth. Thus,
the part of the root system in the top soil profile will experience low soil water potential
(Passioura, 1988a) while the deeper part of the root system has access to soil moisture
(Zhang and Davies, 1990a). Therefore, although water may still be available at depth, roots
in the drier part of the soil profile may produce a signal that induces ABA production and
the subsequent increase in ABA concentration in leaves may cause partial stomatal closure
and water conservation. This behaviour has been observed in some horticultural crops and
where partial root-zone or deficit irrigation is used (Stoll et al., 2000; Sobeih et al., 2004),
but it is not known if this occurs in wheat. Wheat genotypes may differ in root system
characteristics that detect and signal drying soil conditions, particularly since wheat root
systems are comprised of two types of roots and there is genotypic variation in root system
architecture (Manschadi et al., 2008). This experiment was conducted as part of a larger
study examining mechanisms of water conservation involving stomatal regulation and
ABA production by roots in response to soil drying in wheat. To mimic partial root-zone
drying, a split-root system was used to expose half of the root system to terminal drought –
drying soil from anthesis. The dry half of the root system simulates roots exposed to low
soil water potential (shallow roots) while the wet half simulates roots exposed to high soil
water potential (deeper roots under field conditions). This approach was more feasible for
an initial screening study to identify contrasting responses in stomatal regulation and ABA
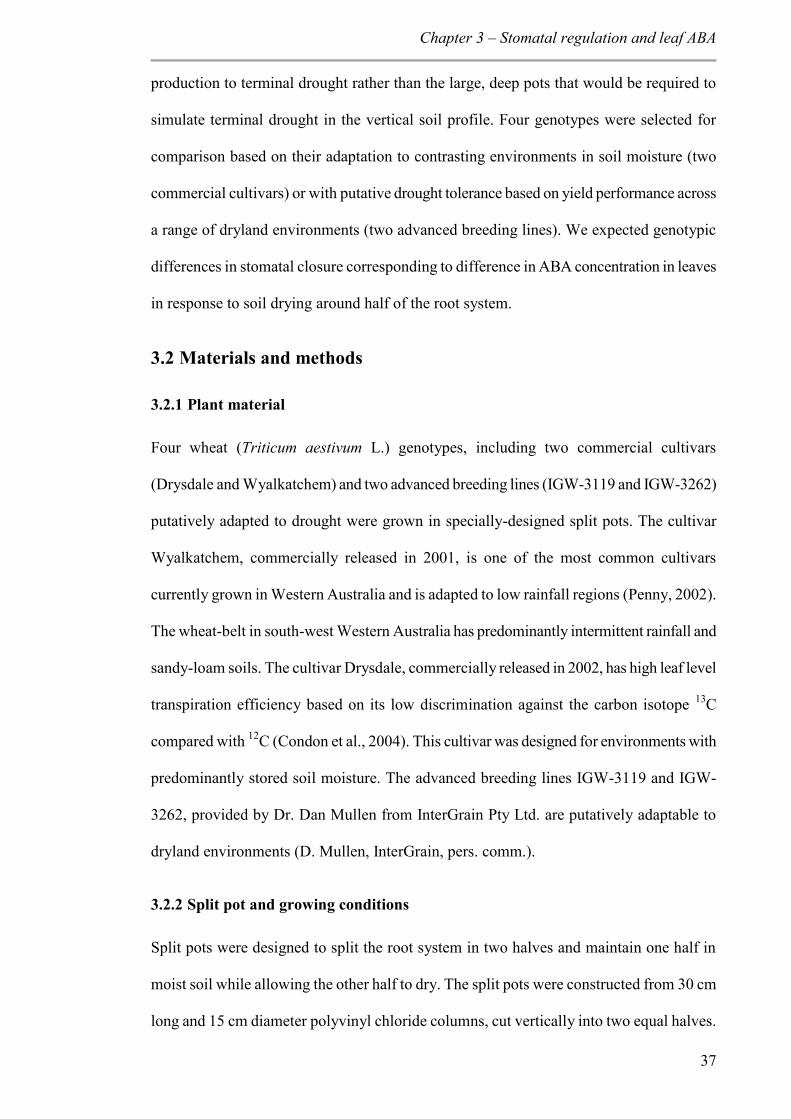
Chapter 3 – Stomatal regulation and leaf ABA
37
production to terminal drought rather than the large, deep pots that would be required to
simulate terminal drought in the vertical soil profile. Four genotypes were selected for
comparison based on their adaptation to contrasting environments in soil moisture (two
commercial cultivars) or with putative drought tolerance based on yield performance across
a range of dryland environments (two advanced breeding lines). We expected genotypic
differences in stomatal closure corresponding to difference in ABA concentration in leaves
in response to soil drying around half of the root system.
3.2 Materials and methods
3.2.1 Plant material
Four wheat (Triticum aestivum L.) genotypes, including two commercial cultivars
(Drysdale and Wyalkatchem) and two advanced breeding lines (IGW-3119 and IGW-3262)
putatively adapted to drought were grown in specially-designed split pots. The cultivar
Wyalkatchem, commercially released in 2001, is one of the most common cultivars
currently grown in Western Australia and is adapted to low rainfall regions (Penny, 2002).
The wheat-belt in south-west Western Australia has predominantly intermittent rainfall and
sandy-loam soils. The cultivar Drysdale, commercially released in 2002, has high leaf level
transpiration efficiency based on its low discrimination against the carbon isotope 13C
compared with 12C (Condon et al., 2004). This cultivar was designed for environments with
predominantly stored soil moisture. The advanced breeding lines IGW-3119 and IGW-
3262, provided by Dr. Dan Mullen from InterGrain Pty Ltd. are putatively adaptable to
dryland environments (D. Mullen, InterGrain, pers. comm.).
3.2.2 Split pot and growing conditions
Split pots were designed to split the root system in two halves and maintain one half in
moist soil while allowing the other half to dry. The split pots were constructed from 30 cm
long and 15 cm diameter polyvinyl chloride columns, cut vertically into two equal halves.
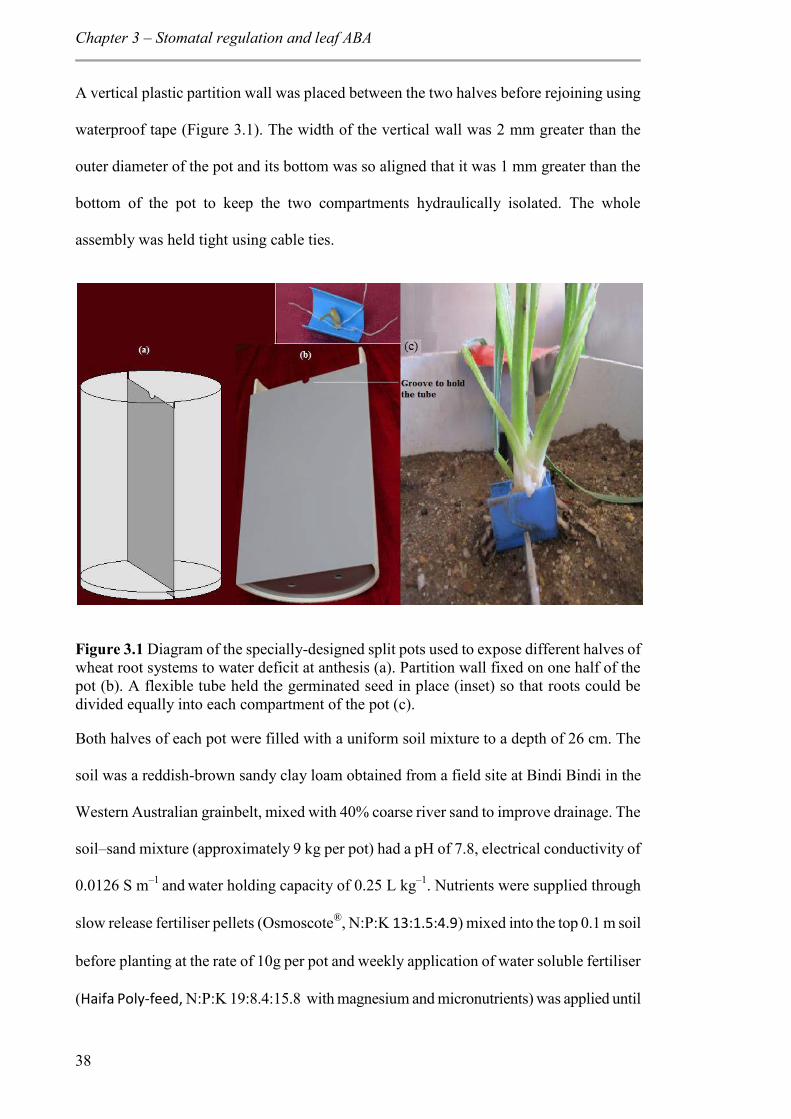
Chapter 3 – Stomatal regulation and leaf ABA
38
A vertical plastic partition wall was placed between the two halves before rejoining using
waterproof tape (Figure 3.1). The width of the vertical wall was 2 mm greater than the
outer diameter of the pot and its bottom was so aligned that it was 1 mm greater than the
bottom of the pot to keep the two compartments hydraulically isolated. The whole
assembly was held tight using cable ties.
Figure 3.1 Diagram of the specially-designed split pots used to expose different halves of wheat root systems to water deficit at anthesis (a). Partition wall fixed on one half of the pot (b). A flexible tube held the germinated seed in place (inset) so that roots could be divided equally into each compartment of the pot (c).
Both halves of each pot were filled with a uniform soil mixture to a depth of 26 cm. The
soil was a reddish-brown sandy clay loam obtained from a field site at Bindi Bindi in the
Western Australian grainbelt, mixed with 40% coarse river sand to improve drainage. The
soil–sand mixture (approximately 9 kg per pot) had a pH of 7.8, electrical conductivity of
0.0126 S m–1 and water holding capacity of 0.25 L kg–1. Nutrients were supplied through
slow release fertiliser pellets (Osmoscote®, N:P:K 13:1.5:4.9) mixed into the top 0.1 m soil
before planting at the rate of 10g per pot and weekly application of water soluble fertiliser
(Haifa Poly-feed, N:P:K 19:8.4:15.8 with magnesium and micronutrients) was applied until
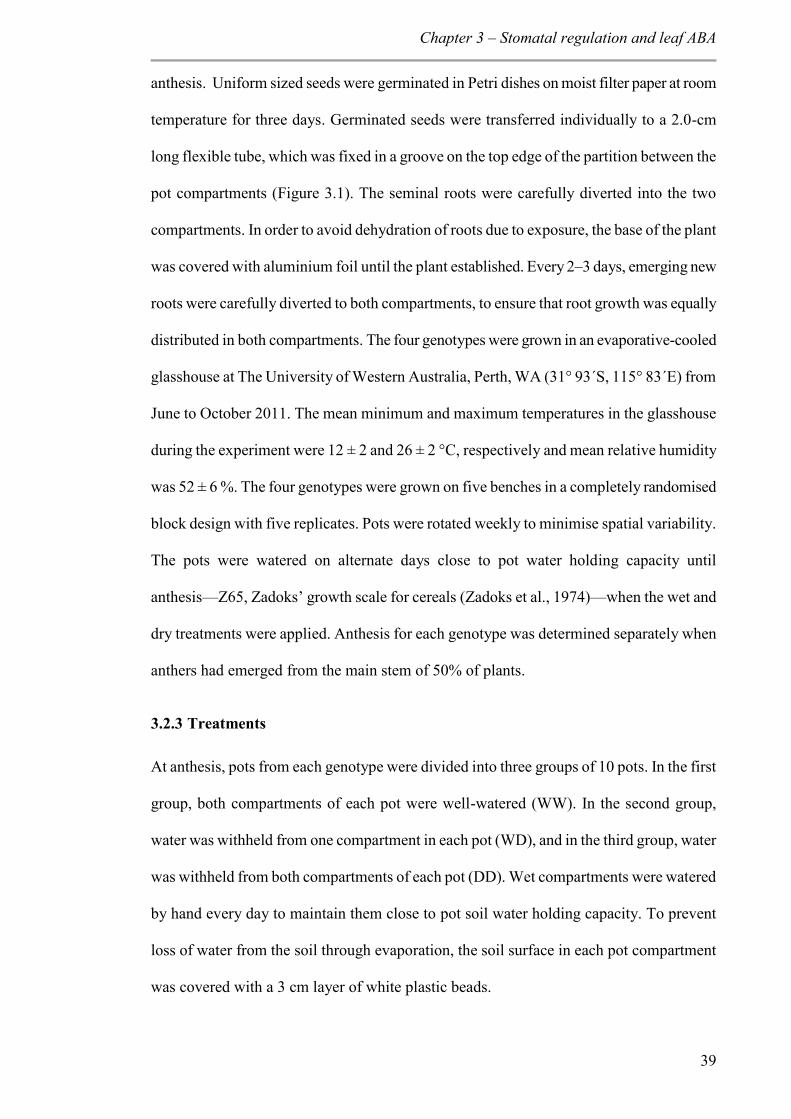
Chapter 3 – Stomatal regulation and leaf ABA
39
anthesis. Uniform sized seeds were germinated in Petri dishes on moist filter paper at room
temperature for three days. Germinated seeds were transferred individually to a 2.0-cm
long flexible tube, which was fixed in a groove on the top edge of the partition between the
pot compartments (Figure 3.1). The seminal roots were carefully diverted into the two
compartments. In order to avoid dehydration of roots due to exposure, the base of the plant
was covered with aluminium foil until the plant established. Every 2–3 days, emerging new
roots were carefully diverted to both compartments, to ensure that root growth was equally
distributed in both compartments. The four genotypes were grown in an evaporative-cooled
glasshouse at The University of Western Australia, Perth, WA (31° 93´S, 115° 83´E) from
June to October 2011. The mean minimum and maximum temperatures in the glasshouse
during the experiment were 12 ± 2 and 26 ± 2 °C, respectively and mean relative humidity
was 52 ± 6 %. The four genotypes were grown on five benches in a completely randomised
block design with five replicates. Pots were rotated weekly to minimise spatial variability.
The pots were watered on alternate days close to pot water holding capacity until
anthesis—Z65, Zadoks’ growth scale for cereals (Zadoks et al., 1974)—when the wet and
dry treatments were applied. Anthesis for each genotype was determined separately when
anthers had emerged from the main stem of 50% of plants.
3.2.3 Treatments
At anthesis, pots from each genotype were divided into three groups of 10 pots. In the first
group, both compartments of each pot were well-watered (WW). In the second group,
water was withheld from one compartment in each pot (WD), and in the third group, water
was withheld from both compartments of each pot (DD). Wet compartments were watered
by hand every day to maintain them close to pot soil water holding capacity. To prevent
loss of water from the soil through evaporation, the soil surface in each pot compartment
was covered with a 3 cm layer of white plastic beads.
Chapter 3 – Stomatal regulation and leaf ABA
40
3.2.4 Measurements
Shoot and root biomass was measured in all four genotypes three times during the
experiment: (1) at anthesis, before terminal drought was induced, (2) when the plants in the
DD treatment showed permanent wilting symptoms, which was at 190 °Cd (with a base
temperature of 0 °C) for the IGW lines and 170 °Cd for Drysdale and Wyalkatchem
(Figure 3.2), and (3) at the final harvest. Before each sampling, the number of tillers per
plant was recorded; the shoots were then cut from the roots at the crown. Leaf area was
measured at anthesis and at the second harvest. Measurements were made using a portable
leaf area meter (LI-3000, LI-COR Biosciences, Nebraska, USA). Shoot and leaves were
separately dried in an oven at 60 °C for 48 hours and then weighed. Immediately after
harvesting the shoots, each split pot was opened and the roots in each half were recovered
from the soil by repeated gentle washing and sieving on a 1.4-mm sieve to produce a clean
sample, as described by Liao et al. (2006) and Palta et al. (2007). Roots were then dried in
an oven at 60 °C for 72 hours and weighed. At the second harvest, root length as well as
root dry weight was measured after the roots were recovered from the soil in each half.
Roots were stained for 30 min with 0.1% (w/v) methylene blue, placed in about 3 mm of
water in a glass tray (0.2 x 0.3 m), and untangled with a plastic spatula to minimise
overlapping. The glass tray was placed on a flatbed scanner with transparency unit (Epson
STD4800). Scanning was done at 400 dpi resolution and the images were analysed for total
root length using WinRHIZO Pro 2009b (Regent Instruments Inc., Canada). Root material
was then dried and weighed. Specific root length (SRL) was calculated as root length per
unit biomass of root.
Chapter 3 – Stomatal regulation and leaf ABA
41
Figure 3.2 Typical examples of wheat plants at second harvest when watering was withheld from both halves of the split root system (DD), one half of the split root system (WD) and when both halves of the split root system were well-watered (WW).
At final harvest, the number of spikes per plant and spikelets per spike were counted.
Spikes were separated from shoots, oven dried at 40 °C for 6 to 7 days and threshed by
hand. The number and weight of grains per plant were also recorded. Harvest index (HI)
was calculated as the ratio of grain yield to shoot biomass.
Leaf water potential (leaf), stomatal conductance (gs), transpiration and leaf net
photosynthesis rate were measured on the flag leaf of the main stem of five replicate plants
just before the second harvest, which was between 81 and 84 DAS (permanent wilting in
DD treatment). Measurements were made between 10.30 am and 1.30 pm, on days with
Chapter 3 – Stomatal regulation and leaf ABA
42
clear sky. Rates of leaf net photosynthesis, gs and transpiration were measured with a LI-
COR gas-exchange system (LI-6400, LI-COR Biosciences, Nebraska, USA) with LED
light source on the leaf chamber. In the LI-COR cuvette, CO2 concentration was set to 380
µmol mol–1 and LED light intensity 900 μmol m–2 s–1, which is the average saturation
intensity for photosynthesis in wheat (Austin, 1990). Immediately after these measurements
were made, leaf was measured using a Scholander pressure chamber (model 1000, PMS
Instrument Co., Oregon, USA). The flag leaf was loosely covered with a plastic sheath
before excision and during the measurement to avoid evaporation (Turner, 1988).
3.2.5 ABA sampling and analysis
After gas exchange and leaf measurements, the same flag leaf was snap frozen in liquid
nitrogen and stored at –80 °C. ABA analysis was done on two genotypes contrasting in
stomatal conductance in response to soil drying. Analysis was carried out as per the
protocol described by Speirs et al. (2013). Briefly, 50–100 mg of ground frozen tissue was
extracted overnight at 4 °C in 500 μL of 20% aqueous methanol. After centrifugation, a
deuterated internal standard (400 μL, containing D3–7’,7’,7’-PA and -dihydrophaseic acid,
D5–4,5,8’,8’,8’-ABA-GE and D6–3’,5’,5’,7’,7’,7’-ABA, all at a concentration of 10 ng
mL–1) was added to the supernatants. Phenomenex SPE columns (60 mg mL–1: 8B-S100-
UAK) were equilibrated with 1 mL methanol and 1 mL nanopure water, as per the
manufacturer’s directions. The samples were loaded onto the columns, washed with 20%
aqueous methanol (1 mL), and eluted with 90% aqueous methanol (1 mL). An aliquot (50
μL) of the eluate was dried in a vacuum centrifuge in preparation for analysis by liquid
chromatography/mass spectrometry (LC-MS/MS). The dried leaf extracts were dissolved in
50 μL aqueous acetonitrile (10% with 0.05% acetic acid) and 20 μL was analysed by LC-
MS/MS (Agilent 6410). Separations were carried out on a Phenomenex C18(2) 75 mm ×
4.5 mm × 5 μm column at 40 °C. Solvents were nanopure water and acetonitrile, both with
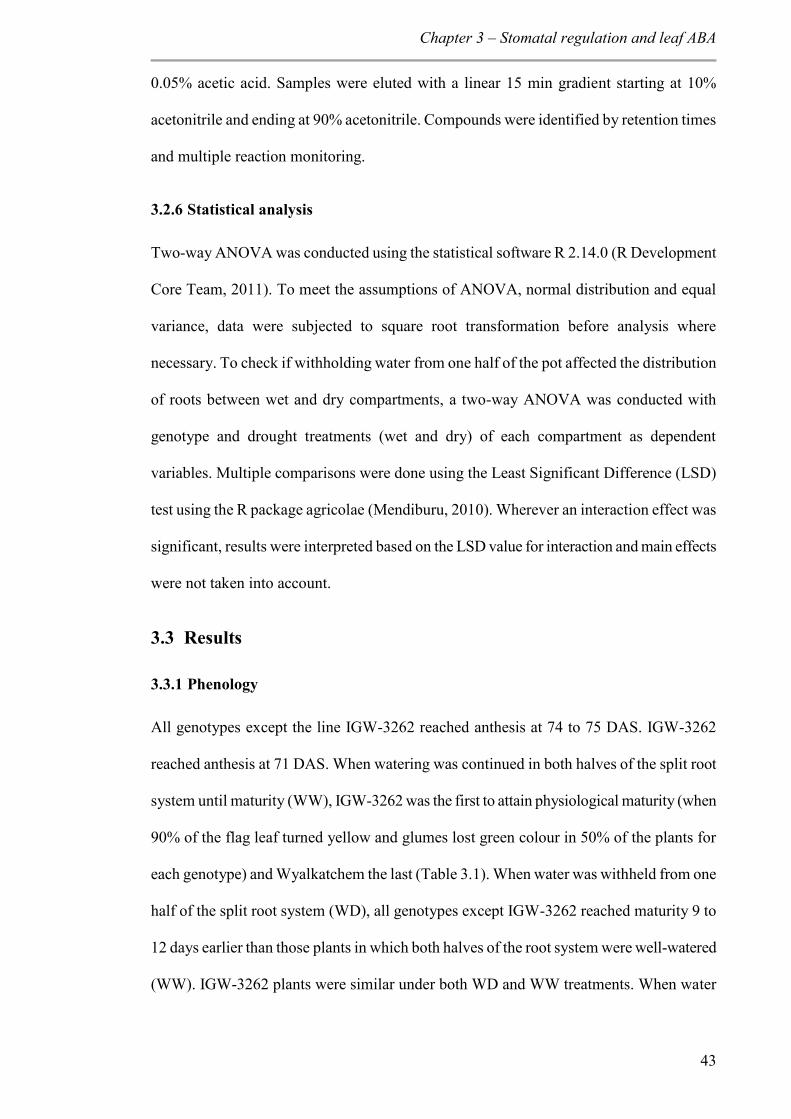
Chapter 3 – Stomatal regulation and leaf ABA
43
0.05% acetic acid. Samples were eluted with a linear 15 min gradient starting at 10%
acetonitrile and ending at 90% acetonitrile. Compounds were identified by retention times
and multiple reaction monitoring.
3.2.6 Statistical analysis
Two-way ANOVA was conducted using the statistical software R 2.14.0 (R Development
Core Team, 2011). To meet the assumptions of ANOVA, normal distribution and equal
variance, data were subjected to square root transformation before analysis where
necessary. To check if withholding water from one half of the pot affected the distribution
of roots between wet and dry compartments, a two-way ANOVA was conducted with
genotype and drought treatments (wet and dry) of each compartment as dependent
variables. Multiple comparisons were done using the Least Significant Difference (LSD)
test using the R package agricolae (Mendiburu, 2010). Wherever an interaction effect was
significant, results were interpreted based on the LSD value for interaction and main effects
were not taken into account.
3.3 Results
3.3.1 Phenology
All genotypes except the line IGW-3262 reached anthesis at 74 to 75 DAS. IGW-3262
reached anthesis at 71 DAS. When watering was continued in both halves of the split root
system until maturity (WW), IGW-3262 was the first to attain physiological maturity (when
90% of the flag leaf turned yellow and glumes lost green colour in 50% of the plants for
each genotype) and Wyalkatchem the last (Table 3.1). When water was withheld from one
half of the split root system (WD), all genotypes except IGW-3262 reached maturity 9 to
12 days earlier than those plants in which both halves of the root system were well-watered
(WW). IGW-3262 plants were similar under both WD and WW treatments. When water
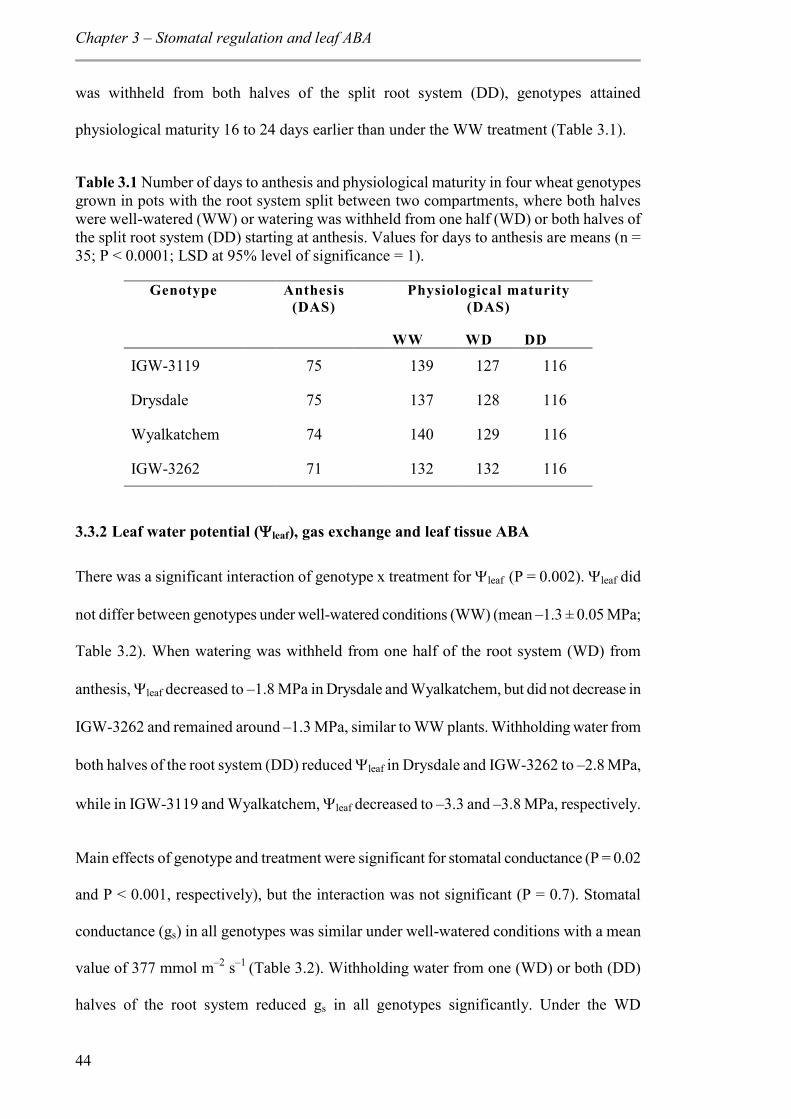
Chapter 3 – Stomatal regulation and leaf ABA
44
was withheld from both halves of the split root system (DD), genotypes attained
physiological maturity 16 to 24 days earlier than under the WW treatment (Table 3.1).
Table 3.1 Number of days to anthesis and physiological maturity in four wheat genotypes grown in pots with the root system split between two compartments, where both halves were well-watered (WW) or watering was withheld from one half (WD) or both halves of the split root system (DD) starting at anthesis. Values for days to anthesis are means (n = 35; P < 0.0001; LSD at 95% level of significance = 1).
Genotype Anthesis (DAS)
Physiological maturity (DAS)
WW WD DD
IGW-3119 75 139 127 116
Drysdale 75 137 128 116
Wyalkatchem 74 140 129 116
IGW-3262 71 132 132 116
3.3.2 Leaf water potential (leaf), gas exchange and leaf tissue ABA
There was a significant interaction of genotype x treatment for leaf (P = 0.002). leaf did
not differ between genotypes under well-watered conditions (WW) (mean –1.3 ± 0.05 MPa;
Table 3.2). When watering was withheld from one half of the root system (WD) from
anthesis, leaf decreased to –1.8 MPa in Drysdale and Wyalkatchem, but did not decrease in
IGW-3262 and remained around –1.3 MPa, similar to WW plants. Withholding water from
both halves of the root system (DD) reduced leaf in Drysdale and IGW-3262 to –2.8 MPa,
while in IGW-3119 and Wyalkatchem, leaf decreased to –3.3 and –3.8 MPa, respectively.
Main effects of genotype and treatment were significant for stomatal conductance (P = 0.02
and P < 0.001, respectively), but the interaction was not significant (P = 0.7). Stomatal
conductance (gs) in all genotypes was similar under well-watered conditions with a mean
value of 377 mmol m–2 s–1 (Table 3.2). Withholding water from one (WD) or both (DD)
halves of the root system reduced gs in all genotypes significantly. Under the WD
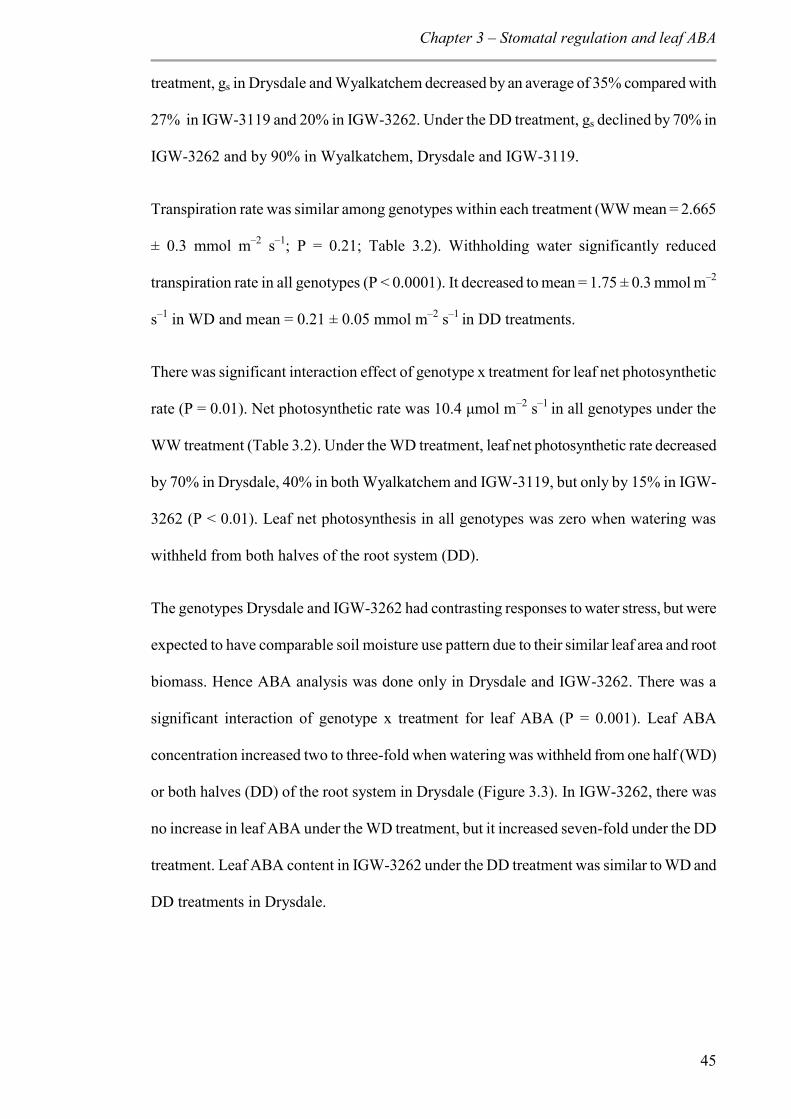
Chapter 3 – Stomatal regulation and leaf ABA
45
treatment, gs in Drysdale and Wyalkatchem decreased by an average of 35% compared with
27% in IGW-3119 and 20% in IGW-3262. Under the DD treatment, gs declined by 70% in
IGW-3262 and by 90% in Wyalkatchem, Drysdale and IGW-3119.
Transpiration rate was similar among genotypes within each treatment (WW mean = 2.665
± 0.3 mmol m–2 s–1; P = 0.21; Table 3.2). Withholding water significantly reduced
transpiration rate in all genotypes (P < 0.0001). It decreased to mean = 1.75 ± 0.3 mmol m–2
s–1 in WD and mean = 0.21 ± 0.05 mmol m–2 s–1 in DD treatments.
There was significant interaction effect of genotype x treatment for leaf net photosynthetic
rate (P = 0.01). Net photosynthetic rate was 10.4 μmol m–2 s–1 in all genotypes under the
WW treatment (Table 3.2). Under the WD treatment, leaf net photosynthetic rate decreased
by 70% in Drysdale, 40% in both Wyalkatchem and IGW-3119, but only by 15% in IGW-
3262 (P < 0.01). Leaf net photosynthesis in all genotypes was zero when watering was
withheld from both halves of the root system (DD).
The genotypes Drysdale and IGW-3262 had contrasting responses to water stress, but were
expected to have comparable soil moisture use pattern due to their similar leaf area and root
biomass. Hence ABA analysis was done only in Drysdale and IGW-3262. There was a
significant interaction of genotype x treatment for leaf ABA (P = 0.001). Leaf ABA
concentration increased two to three-fold when watering was withheld from one half (WD)
or both halves (DD) of the root system in Drysdale (Figure 3.3). In IGW-3262, there was
no increase in leaf ABA under the WD treatment, but it increased seven-fold under the DD
treatment. Leaf ABA content in IGW-3262 under the DD treatment was similar to WD and
DD treatments in Drysdale.
46
Table 3.2 Leaf water potential (leaf), stomatal conductance (gs), leaf transpiration rate and net photosynthesis rate of four wheat genotypes at second harvest (170-190 °Cd after anthesis) that were well-watered (WW) or watering withheld from one (WD) or both (DD) halves of the split root system from anthesis. Values are the means of five replicates. LSD values are at 95% level of significance. Photosynthesis was zero in DD treatment.
Leaf water potential
(MPa)
Stomatal conductance
(mmol H2O m–2 s–1)
Transpiration (mmol H2O m–2 s–1)
Photosynthesis (μmol CO2 m–2 s–1)
WW WD DD WW WD DD WW WD DD WW WD
IGW-3119 –1.42 –1.68 –3.32 386 281 40 2.75 1.94 0.16 10.6 6.8
Drysdale –1.17 –1.74 –2.71 376 245 40 2.24 1.53 0.13 10.3 3.0
Wyalkatchem –1.29 –1.87 –3.98 358 234 40 2.82 1.69 0.19 9.7 5.7
IGW-3262 –1.32 –1.36 –2.80 389 309 125 2.88 1.85 0.35 10.8 9.2
LSD (genotype) 0.25 43 NS 1.8 LSD (treatment) 0.21 37 0.33 1.3 LSD (genotype x treatment) 0.43 NS NS 2.5
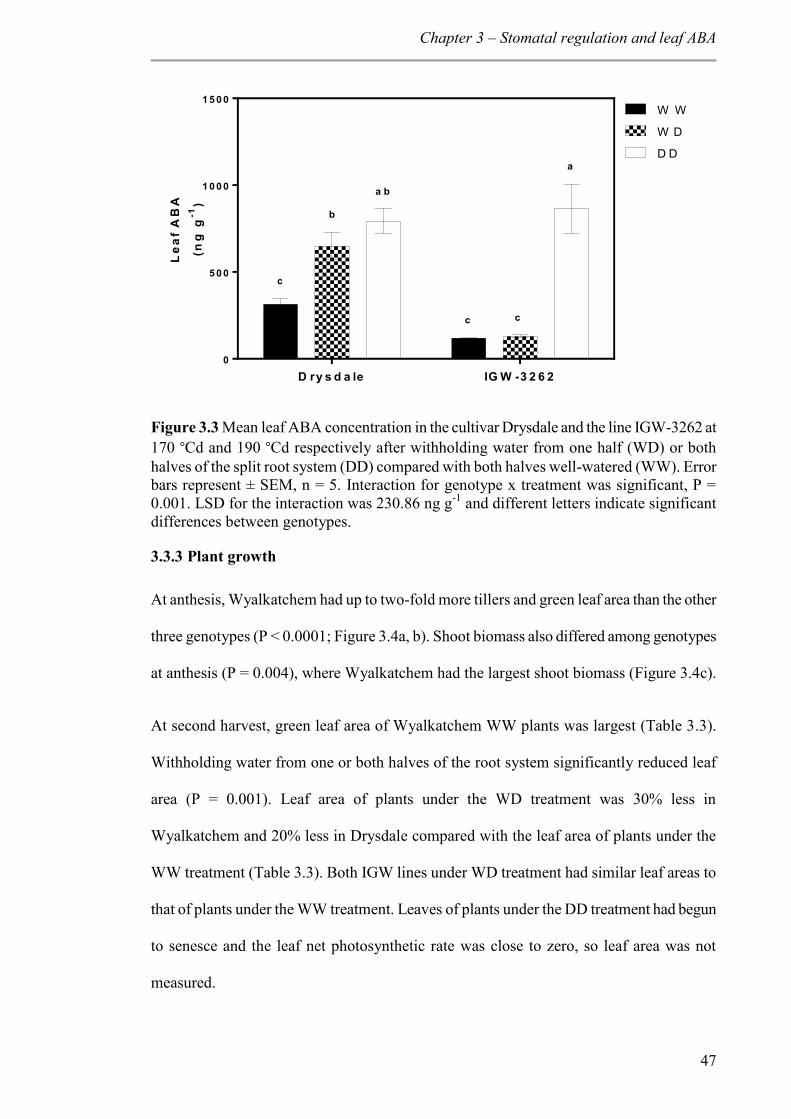
Chapter 3 – Stomatal regulation and leaf ABA
47
D ry s d a le IG W -3 2 6 20
5 0 0
1 0 0 0
1 5 0 0
Le
af
AB
A
(ng
g-1
)
W W
W D
D D
a b
a
b
c
c c
Figure 3.3 Mean leaf ABA concentration in the cultivar Drysdale and the line IGW-3262 at 170 °Cd and 190 °Cd respectively after withholding water from one half (WD) or both halves of the split root system (DD) compared with both halves well-watered (WW). Error bars represent ± SEM, n = 5. Interaction for genotype x treatment was significant, P = 0.001. LSD for the interaction was 230.86 ng g-1 and different letters indicate significant differences between genotypes.
3.3.3 Plant growth
At anthesis, Wyalkatchem had up to two-fold more tillers and green leaf area than the other
three genotypes (P < 0.0001; Figure 3.4a, b). Shoot biomass also differed among genotypes
at anthesis (P = 0.004), where Wyalkatchem had the largest shoot biomass (Figure 3.4c).
At second harvest, green leaf area of Wyalkatchem WW plants was largest (Table 3.3).
Withholding water from one or both halves of the root system significantly reduced leaf
area (P = 0.001). Leaf area of plants under the WD treatment was 30% less in
Wyalkatchem and 20% less in Drysdale compared with the leaf area of plants under the
WW treatment (Table 3.3). Both IGW lines under WD treatment had similar leaf areas to
that of plants under the WW treatment. Leaves of plants under the DD treatment had begun
to senesce and the leaf net photosynthetic rate was close to zero, so leaf area was not
measured.
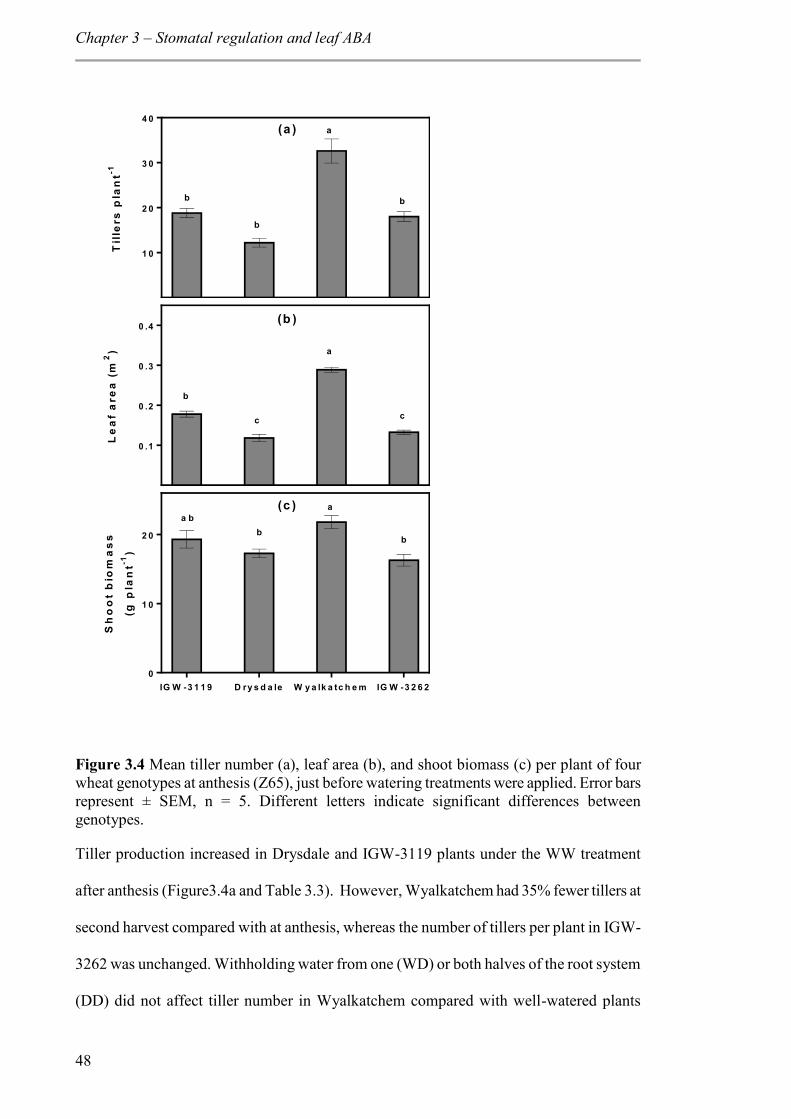
Chapter 3 – Stomatal regulation and leaf ABA
48
1 0
2 0
3 0
4 0T
ille
rs p
lan
t-1
b
b
b
a
0 .1
0 .2
0 .3
0 .4
Le
af
are
a (
m2
) a
b
c c
IG W -3 1 1 9 D ry s d a le W y a lk a tc h e m IG W -3 2 6 20
1 0
2 0
Sh
oo
t b
iom
as
s
(g p
lan
t-1)
a
bb
a b
(a )
(b )
(c )
Figure 3.4 Mean tiller number (a), leaf area (b), and shoot biomass (c) per plant of four wheat genotypes at anthesis (Z65), just before watering treatments were applied. Error bars represent ± SEM, n = 5. Different letters indicate significant differences between genotypes.
Tiller production increased in Drysdale and IGW-3119 plants under the WW treatment
after anthesis (Figure3.4a and Table 3.3). However, Wyalkatchem had 35% fewer tillers at
second harvest compared with at anthesis, whereas the number of tillers per plant in IGW-
3262 was unchanged. Withholding water from one (WD) or both halves of the root system
(DD) did not affect tiller number in Wyalkatchem compared with well-watered plants
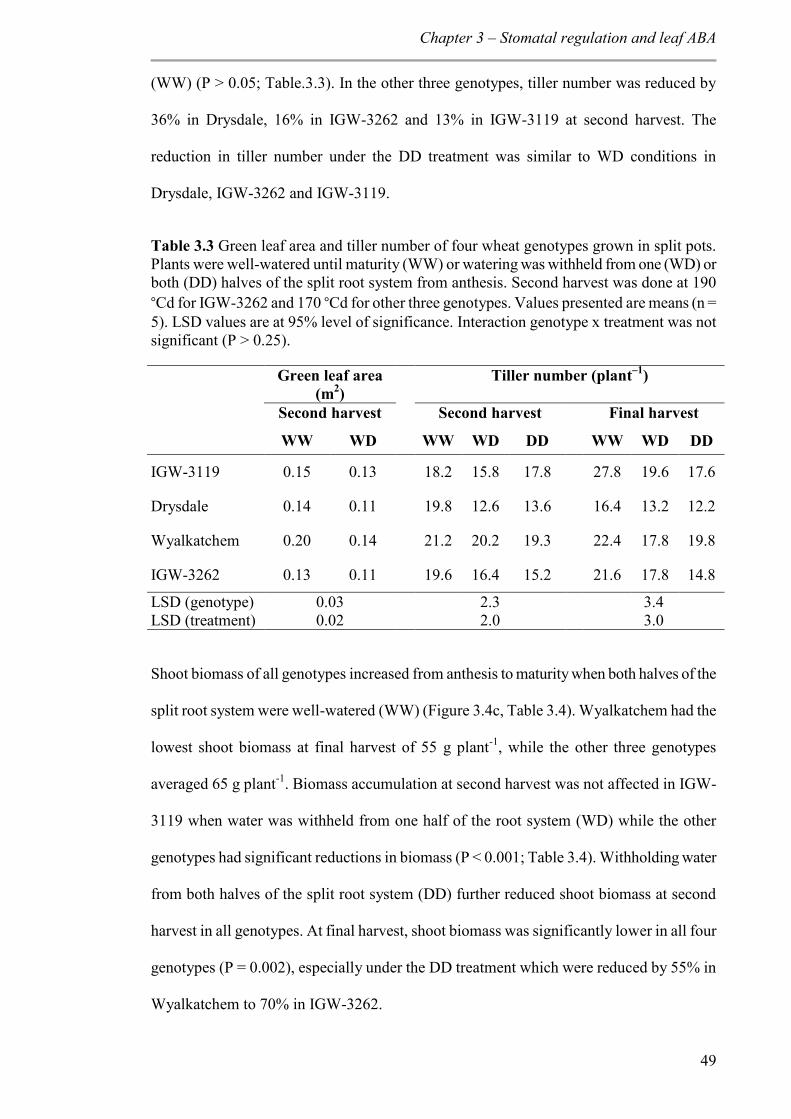
Chapter 3 – Stomatal regulation and leaf ABA
49
(WW) (P > 0.05; Table.3.3). In the other three genotypes, tiller number was reduced by
36% in Drysdale, 16% in IGW-3262 and 13% in IGW-3119 at second harvest. The
reduction in tiller number under the DD treatment was similar to WD conditions in
Drysdale, IGW-3262 and IGW-3119.
Table 3.3 Green leaf area and tiller number of four wheat genotypes grown in split pots. Plants were well-watered until maturity (WW) or watering was withheld from one (WD) or both (DD) halves of the split root system from anthesis. Second harvest was done at 190 °Cd for IGW-3262 and 170 °Cd for other three genotypes. Values presented are means (n = 5). LSD values are at 95% level of significance. Interaction genotype x treatment was not significant (P > 0.25).
Green leaf area (m2)
Tiller number (plant–1)
Second harvest Second harvest Final harvest
WW WD WW WD DD WW WD DD
IGW-3119 0.15 0.13 18.2 15.8 17.8 27.8 19.6 17.6
Drysdale 0.14 0.11 19.8 12.6 13.6 16.4 13.2 12.2
Wyalkatchem 0.20 0.14 21.2 20.2 19.3 22.4 17.8 19.8
IGW-3262 0.13 0.11 19.6 16.4 15.2 21.6 17.8 14.8
LSD (genotype) 0.03 2.3 3.4 LSD (treatment) 0.02 2.0 3.0
Shoot biomass of all genotypes increased from anthesis to maturity when both halves of the
split root system were well-watered (WW) (Figure 3.4c, Table 3.4). Wyalkatchem had the
lowest shoot biomass at final harvest of 55 g plant-1, while the other three genotypes
averaged 65 g plant-1. Biomass accumulation at second harvest was not affected in IGW-
3119 when water was withheld from one half of the root system (WD) while the other
genotypes had significant reductions in biomass (P < 0.001; Table 3.4). Withholding water
from both halves of the split root system (DD) further reduced shoot biomass at second
harvest in all genotypes. At final harvest, shoot biomass was significantly lower in all four
genotypes (P = 0.002), especially under the DD treatment which were reduced by 55% in
Wyalkatchem to 70% in IGW-3262.
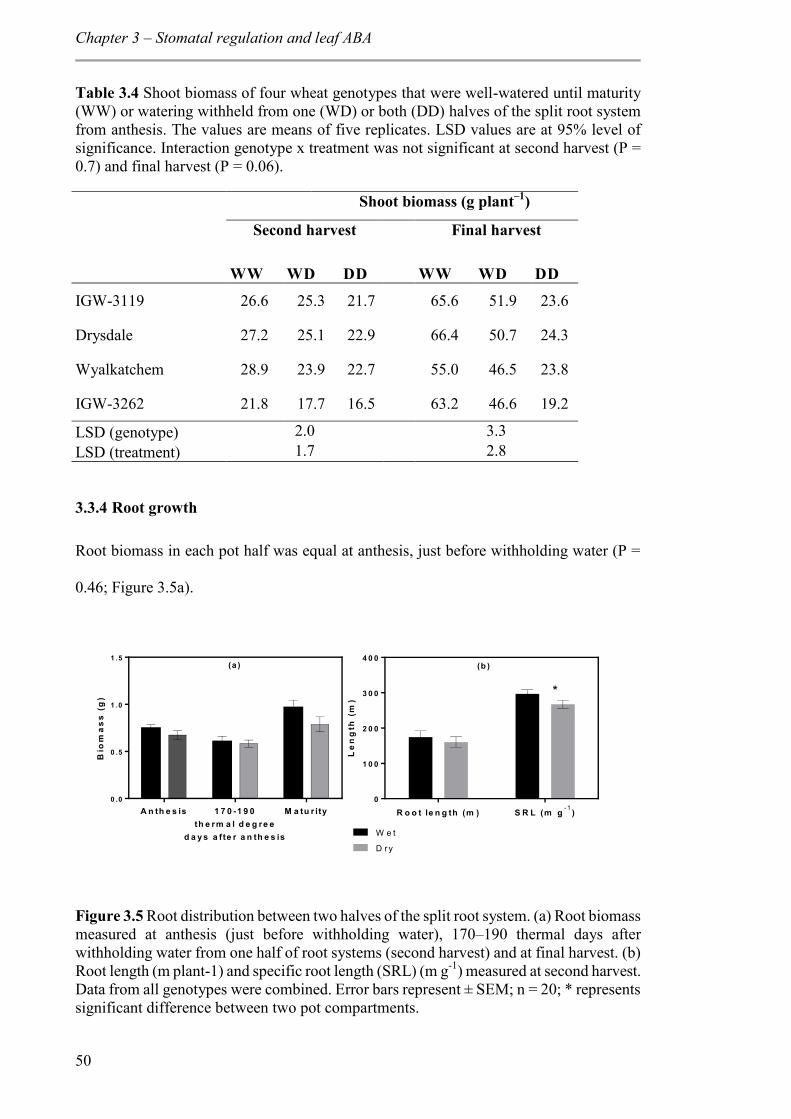
Chapter 3 – Stomatal regulation and leaf ABA
50
Table 3.4 Shoot biomass of four wheat genotypes that were well-watered until maturity (WW) or watering withheld from one (WD) or both (DD) halves of the split root system from anthesis. The values are means of five replicates. LSD values are at 95% level of significance. Interaction genotype x treatment was not significant at second harvest (P = 0.7) and final harvest (P = 0.06).
Shoot biomass (g plant–1)
Second harvest Final harvest
WW WD DD WW WD DD
IGW-3119 26.6 25.3 21.7 65.6 51.9 23.6
Drysdale 27.2 25.1 22.9 66.4 50.7 24.3
Wyalkatchem 28.9 23.9 22.7 55.0 46.5 23.8
IGW-3262 21.8 17.7 16.5 63.2 46.6 19.2
LSD (genotype) 2.0 3.3 LSD (treatment) 1.7 2.8
3.3.4 Root growth
Root biomass in each pot half was equal at anthesis, just before withholding water (P =
0.46; Figure 3.5a).
A n th e s is 1 7 0 -1 9 0th e rm a l d e g re e
d a y s a fte r a n th e s is
M a tu r ity0 .0
0 .5
1 .0
1 .5
Bio
ma
ss
(g
)
R o o t le n g th (m ) S R L (m g -1 )0
1 0 0
2 0 0
3 0 0
4 0 0
Le
ng
th (
m)
*
W e t
D r y
(a ) (b )
Figure 3.5 Root distribution between two halves of the split root system. (a) Root biomass measured at anthesis (just before withholding water), 170–190 thermal days after withholding water from one half of root systems (second harvest) and at final harvest. (b) Root length (m plant-1) and specific root length (SRL) (m g-1) measured at second harvest. Data from all genotypes were combined. Error bars represent ± SEM; n = 20; * represents significant difference between two pot compartments.
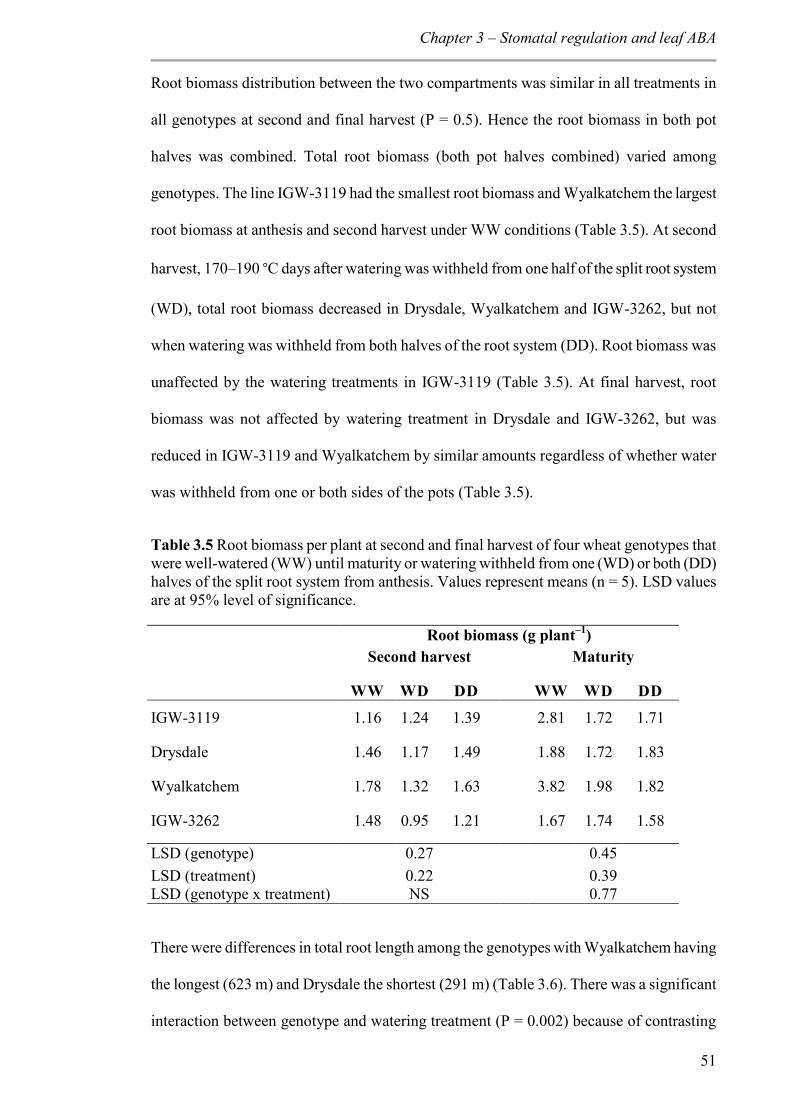
Chapter 3 – Stomatal regulation and leaf ABA
51
Root biomass distribution between the two compartments was similar in all treatments in
all genotypes at second and final harvest (P = 0.5). Hence the root biomass in both pot
halves was combined. Total root biomass (both pot halves combined) varied among
genotypes. The line IGW-3119 had the smallest root biomass and Wyalkatchem the largest
root biomass at anthesis and second harvest under WW conditions (Table 3.5). At second
harvest, 170–190 °C days after watering was withheld from one half of the split root system
(WD), total root biomass decreased in Drysdale, Wyalkatchem and IGW-3262, but not
when watering was withheld from both halves of the root system (DD). Root biomass was
unaffected by the watering treatments in IGW-3119 (Table 3.5). At final harvest, root
biomass was not affected by watering treatment in Drysdale and IGW-3262, but was
reduced in IGW-3119 and Wyalkatchem by similar amounts regardless of whether water
was withheld from one or both sides of the pots (Table 3.5).
Table 3.5 Root biomass per plant at second and final harvest of four wheat genotypes that were well-watered (WW) until maturity or watering withheld from one (WD) or both (DD) halves of the split root system from anthesis. Values represent means (n = 5). LSD values are at 95% level of significance.
Root biomass (g plant–1) Second harvest Maturity
WW WD DD WW WD DD
IGW-3119 1.16 1.24 1.39 2.81 1.72 1.71
Drysdale 1.46 1.17 1.49 1.88 1.72 1.83
Wyalkatchem 1.78 1.32 1.63 3.82 1.98 1.82
IGW-3262 1.48 0.95 1.21 1.67 1.74 1.58
LSD (genotype) 0.27 0.45 LSD (treatment) 0.22 0.39 LSD (genotype x treatment) NS 0.77
There were differences in total root length among the genotypes with Wyalkatchem having
the longest (623 m) and Drysdale the shortest (291 m) (Table 3.6). There was a significant
interaction between genotype and watering treatment (P = 0.002) because of contrasting
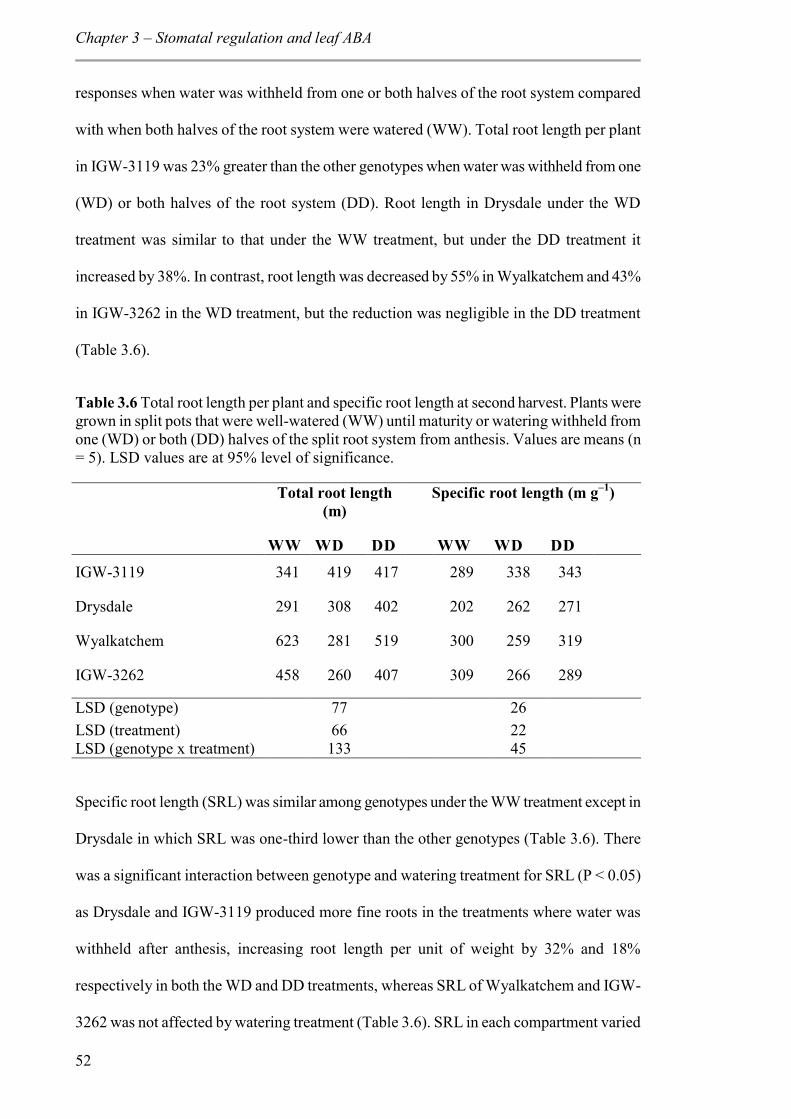
Chapter 3 – Stomatal regulation and leaf ABA
52
responses when water was withheld from one or both halves of the root system compared
with when both halves of the root system were watered (WW). Total root length per plant
in IGW-3119 was 23% greater than the other genotypes when water was withheld from one
(WD) or both halves of the root system (DD). Root length in Drysdale under the WD
treatment was similar to that under the WW treatment, but under the DD treatment it
increased by 38%. In contrast, root length was decreased by 55% in Wyalkatchem and 43%
in IGW-3262 in the WD treatment, but the reduction was negligible in the DD treatment
(Table 3.6).
Table 3.6 Total root length per plant and specific root length at second harvest. Plants were grown in split pots that were well-watered (WW) until maturity or watering withheld from one (WD) or both (DD) halves of the split root system from anthesis. Values are means (n = 5). LSD values are at 95% level of significance.
Total root length (m)
Specific root length (m g–1)
WW WD DD WW WD DD
IGW-3119 341 419 417 289 338 343
Drysdale 291 308 402 202 262 271
Wyalkatchem 623 281 519 300 259 319
IGW-3262 458 260 407 309 266 289
LSD (genotype) 77 26 LSD (treatment) 66 22 LSD (genotype x treatment) 133 45
Specific root length (SRL) was similar among genotypes under the WW treatment except in
Drysdale in which SRL was one-third lower than the other genotypes (Table 3.6). There
was a significant interaction between genotype and watering treatment for SRL (P < 0.05)
as Drysdale and IGW-3119 produced more fine roots in the treatments where water was
withheld after anthesis, increasing root length per unit of weight by 32% and 18%
respectively in both the WD and DD treatments, whereas SRL of Wyalkatchem and IGW-
3262 was not affected by watering treatment (Table 3.6). SRL in each compartment varied
Chapter 3 – Stomatal regulation and leaf ABA
53
with treatment, with more root length in wet compartment (P = 0.017; Figure 3.5b) in all
genotypes.
3.3.5 Yield and yield components
There was a significant interaction between genotype x treatment on grain yield (P =
0.015). Wyalkatchem under the WW treatment had the lowest grain yield of about 29 g
plant–1, while Drysdale and IGW lines had similar yields of about 36 g plant–1. Grain yield
under the WD treatment decreased by 16% in IGW-3119, 17% in Wyalkatchem, 20% in
Drysdale and 26% in IGW-3262 (Table 3.7; P < 0.01). Under the DD treatment, grain yield
in all genotypes was only 10% of that under the WW treatment.
There was significant interaction effect of genotype x treatment for spikes per plant (P <
0.001). The number of spikes per plant varied from 14 in Drysdale to 21 in IGW-3262
(Table 3.7). The number of spikes in IGW-3262 decreased by 29% and 50%, respectively
under the WD and DD treatments. The number of spikes per plant did not change in
Wyalkatchem under both WD and DD treatments. The spike number in IGW-3119 and
Drysdale was not affected under the WD treatment, but decreased by 21% and 26%
respectively under the DD treatment. Treatments in which water was withheld from one
half (WD) and both halves of the root system (DD) did not change the number of spikelets
per spike (P = 0.21; data not shown).
The number of grains per spike varied across the genotypes with Drysdale having the
greatest number across all treatments followed by IGW-3262 (P < 0.0001; Table 3.7). The
line IGW-3119 and cultivar Drysdale increased the number of grains per spike under the
WD treatment compared with WW treatment by 6% (Table 3.7; P < 0.0001), whereas there
was no change in IGW-3119 and Wyalkatchem. Under the DD treatment, there were 15 to
20% fewer grains per spike in all genotypes.
Chapter 3 – Stomatal regulation and leaf ABA
54
1000-grain weight under the WW treatment was highest in IGW-3119 (51 g) and lowest in
IGW-3262 (40 g). Drysdale and Wyalkatchem had similar 1000-grain weights of 47 g
under the WW treatment. Withholding water from one half of the root system (WD)
reduced 1000-grain weight by 20% in IGW-3119, 12% in Drysdale and IGW-3262 and 7%
in Wyalkatchem (P = 0.005). All genotypes had similar 1000-grain weights under the DD
treatment. Wyalkatchem had lowest harvest index of 0.53 among WW plants (P = 0.003;
Table 3.7). Harvest index increased in Drysdale and IGW-3119 under the WD treatment
but did not change in Wyalkatchem and IGW-3262. Under the DD treatment, all genotypes
had lower harvest index compared with WW treatment. Drysdale and IGW-3262 had
higher harvest index under DD treatment (P < 0.0001).
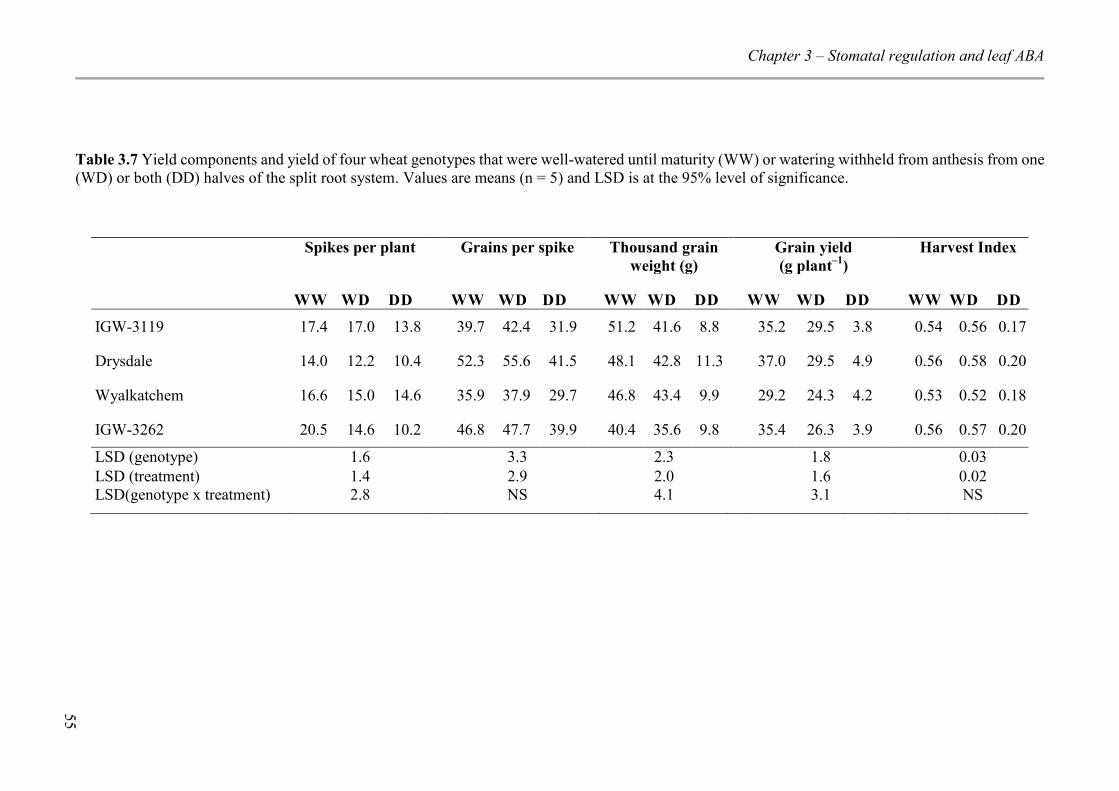
Chapter 3 – Stomatal regulation and leaf ABA
55
Table 3.7 Yield components and yield of four wheat genotypes that were well-watered until maturity (WW) or watering withheld from anthesis from one (WD) or both (DD) halves of the split root system. Values are means (n = 5) and LSD is at the 95% level of significance.
Spikes per plant Grains per spike Thousand grain weight (g)
Grain yield (g plant–1)
Harvest Index
WW WD DD WW WD DD WW WD DD WW WD DD WW WD DD
IGW-3119 17.4 17.0 13.8 39.7 42.4 31.9 51.2 41.6 8.8 35.2 29.5 3.8 0.54 0.56 0.17
Drysdale 14.0 12.2 10.4 52.3 55.6 41.5 48.1 42.8 11.3 37.0 29.5 4.9 0.56 0.58 0.20
Wyalkatchem 16.6 15.0 14.6 35.9 37.9 29.7 46.8 43.4 9.9 29.2 24.3 4.2 0.53 0.52 0.18
IGW-3262 20.5 14.6 10.2 46.8 47.7 39.9 40.4 35.6 9.8 35.4 26.3 3.9 0.56 0.57 0.20
LSD (genotype) 1.6 3.3 2.3 1.8 0.03 LSD (treatment) 1.4 2.9 2.0 1.6 0.02 LSD(genotype x treatment) 2.8 NS 4.1 3.1 NS
Chapter 3 – Stomatal regulation and leaf ABA
CCh
56
3.4 Discussion
Stomatal regulation in wheat in response to water deficit is reported to be closely related to
increased leaf ABA concentration following a reduction in leaf water potential (Quarrie and
Lister, 1983; Henson et al., 1989b). Contrasting responses in gs and leaf ABA
concentration, as well as contrasting responses in leaf were observed in this study when
one half (WD) or both halves of the split root system (DD) of wheat were exposed to
drying soil. Stomatal conductance of the cultivars Drysdale and Wyalkatchem under the
WD treatment declined with leaf and increased leaf ABA (only measured in Drysdale). On
the other hand, IGW lines reduced gs under the WD treatment without decline in leaf or
increase in leaf ABA. A lack of correlation between leaf ABA concentration and gs has
been observed in maize (Zhang and Davies, 1990a; Tardieu et al., 1992b), despite ABA in
the xylem sap correlating well with gs (Tardieu et al., 1992b). The results with IGW-3262
indicate that bulk leaf ABA is not the main driver of gs and probably does not reflect the
ABA level acting on stomata in some wheat genotypes.
The contrasting responses in leaf when watering was withheld from one half of the split
root system (WD) and the corresponding changes in stomata and leaf ABA indicate that the
root system of the IGW lines detected the drying soil and produced a signal that triggered
partial stomatal closure to prevent water loss and maintain leaf water balance. This root-
derived signal could have been ABA (Hartung et al., 2002; Slovik et al.,1995), hydraulic
(Comstock, 2002; Christmann et al., 2007), due to change in pH (Hartung et al., 1988;
Sobeih et al., 2004) or change in the concentration of another phytohormone (Acharya and
Assmann, 2009). Because gas exchange and leaf were only measured at the second
harvest, we do not know if Drysdale and Wyalkatchem also started to close stomata before
any noticeable change in leaf or leaf ABA. However, other studies have observed that
Drysdale tends to reduce transpiration rate only after soil water decreases considerably
Chapter 3 – Stomatal regulation and leaf ABA
57
(Schoppach and Sadok, 2012). Hence, Drysdale roots seem to be less sensitive to drying
soil, but ABA increases in leaves in response to decreasing leaf (Hartung et al., 2002;
Westgate et al., 1996), which ultimately caused closure of stomata. It therefore appears that
stomatal responses in wheat under terminal drought occur in two stages: primarily in
response to a root-derived signal and secondarily in response to a leaf-derived signal. Two-
stage stomatal response to soil dryness is consistent with the observations in wheat by
Xiong et al. (2006) and Du et al. (2013).
Wheat genotypes differed in their ability to maintain leaf when water was withheld from
one half of the split root system (WD). Genotypic differences in the strategies to maintain
leaf water status have been reported in species like grapes (Schultz, 2003), wherein
isohydric varieties regulate stomata to maintain leaf and anisohydric varieties allow leaf
to decline under soil water deficits (Tardieu et al., 1996; McDowell et al., 2008). Lack of
soil moisture measurements makes it difficult to ensure that soil moisture status in all
genotypes was similar, especially because the leaf area varied between genotypes.
Genotypes reached anthesis on different days (Table 3.1) and hence, watering treatment
also commenced on different days. However, vapour pressure deficit (VPD) during the
period between anthesis and second harvest was 1.18 ± 0.03 kPa for all genotypes,
indicating similar driving force for transpiration. IGW-3262 reached permanent wilting
stage by 190 °Cd while in all other genotypes it was 170 °Cd. Wyalkatchem plants might
have dried the soil more quickly than IGW-3262 due to its larger leaf area and root
biomass. But this does not appear to be the case with Drysdale since its leaf area and root
biomass was similar to IGW-3262 at anthesis and when gas exchange measurements were
made. Without the split root system and given the above details, IGW-3262 and Drysdale
would be expected to have similar patterns in water use. Comparing the leaf of Drysdale
and IGW-3262 WD plants with WW plants, IGW-3262 would be considered isohydric and
Chapter 3 – Stomatal regulation and leaf ABA
CCh
58
the cultivar Drysdale as anisohydric. Contrasting iso- and anisohydric behaviour has been
observed previously in wheat genotypes, but under osmotic stress (Gallé et al., 2013).
Genotypic difference in the maintenance of leaf in WD plants despite having similar leaf
area, transpiration rate and VPD level indicates difference in their root level capability to
supply water to meet the transpiration demand. The wet half of the Drysdale root system
with access to sufficient water was unable to maintain the water status of the shoot,
whereas IGW-3262 roots in the wet half of the root system supplied sufficient water to
maintain shoot water status. Iso- and anisohydric behaviour is regulated by stomatal control
(McDowell et al., 2008) and/or hydraulic conductance (Schultz, 2003). Hence, we propose
that isohydric genotypes adapt in response to root signals, maintaining leaf hydration
possibly through root hydraulic conductance, which sustains stomatal regulation. However,
as the soil drying intensifies, leaf declines inducing stomatal closure through increased leaf
ABA synthesis. In contrast, leaf in anisohydric genotypes decreases either because their
root system is less sensitive to soil water potential to initiate stomatal closure and/or their
stomatal sensitivity to ABA probably depends on tissue water potential (Tardieu and
Davies, 1992).
Drysdale increased SRL when watering was withheld from one half (WD) and both halves
of the root system (DD) in response to decreasing soil moisture. An increase in root length
with no increase in root biomass under the DD treatment suggests that the difference in
SRL was due to production of thin roots and not due to root shrinkage (Huck et al., 1970).
Some wheat genotypes are known to produce fine roots under water stress conditions
(Manske and Vlek, 2002). Thin roots potentially increased the surface area per unit root
volume, resulting in more effective water absorption per unit mass. More thin roots (high
SRL) produced in wet compartments than in dry compartments (Figure 3.5) indicate a
compensatory adjustment in all genotypes to supplement water supply to shoot. High
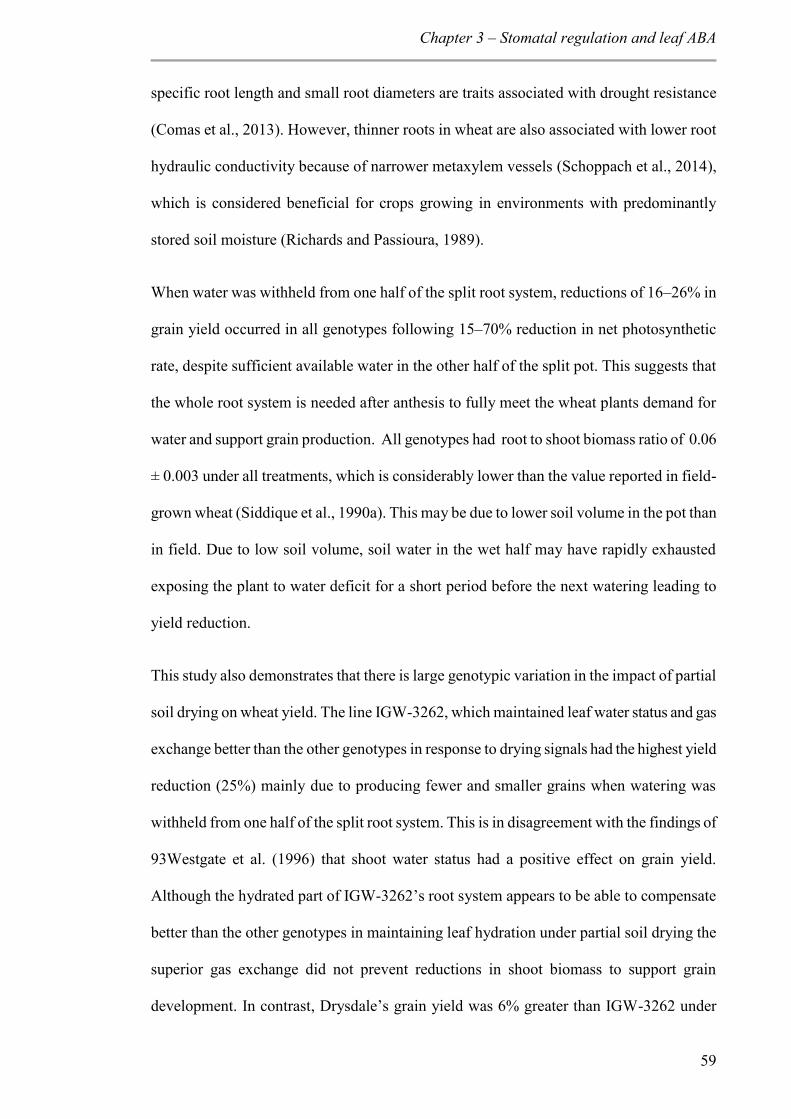
Chapter 3 – Stomatal regulation and leaf ABA
59
specific root length and small root diameters are traits associated with drought resistance
(Comas et al., 2013). However, thinner roots in wheat are also associated with lower root
hydraulic conductivity because of narrower metaxylem vessels (Schoppach et al., 2014),
which is considered beneficial for crops growing in environments with predominantly
stored soil moisture (Richards and Passioura, 1989).
When water was withheld from one half of the split root system, reductions of 16–26% in
grain yield occurred in all genotypes following 15–70% reduction in net photosynthetic
rate, despite sufficient available water in the other half of the split pot. This suggests that
the whole root system is needed after anthesis to fully meet the wheat plants demand for
water and support grain production. All genotypes had root to shoot biomass ratio of 0.06
± 0.003 under all treatments, which is considerably lower than the value reported in field-
grown wheat (Siddique et al., 1990a). This may be due to lower soil volume in the pot than
in field. Due to low soil volume, soil water in the wet half may have rapidly exhausted
exposing the plant to water deficit for a short period before the next watering leading to
yield reduction.
This study also demonstrates that there is large genotypic variation in the impact of partial
soil drying on wheat yield. The line IGW-3262, which maintained leaf water status and gas
exchange better than the other genotypes in response to drying signals had the highest yield
reduction (25%) mainly due to producing fewer and smaller grains when watering was
withheld from one half of the split root system. This is in disagreement with the findings of
93Westgate et al. (1996) that shoot water status had a positive effect on grain yield.
Although the hydrated part of IGW-3262’s root system appears to be able to compensate
better than the other genotypes in maintaining leaf hydration under partial soil drying the
superior gas exchange did not prevent reductions in shoot biomass to support grain
development. In contrast, Drysdale’s grain yield was 6% greater than IGW-3262 under
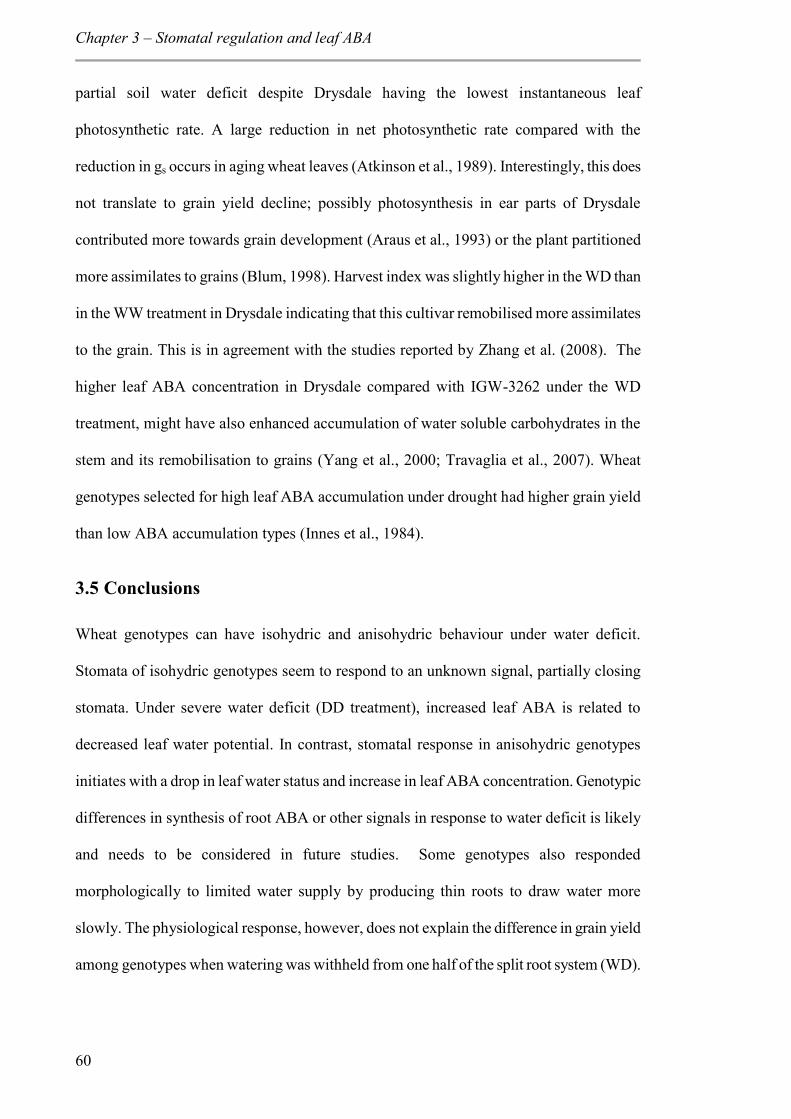
Chapter 3 – Stomatal regulation and leaf ABA
CCh
60
partial soil water deficit despite Drysdale having the lowest instantaneous leaf
photosynthetic rate. A large reduction in net photosynthetic rate compared with the
reduction in gs occurs in aging wheat leaves (Atkinson et al., 1989). Interestingly, this does
not translate to grain yield decline; possibly photosynthesis in ear parts of Drysdale
contributed more towards grain development (Araus et al., 1993) or the plant partitioned
more assimilates to grains (Blum, 1998). Harvest index was slightly higher in the WD than
in the WW treatment in Drysdale indicating that this cultivar remobilised more assimilates
to the grain. This is in agreement with the studies reported by Zhang et al. (2008). The
higher leaf ABA concentration in Drysdale compared with IGW-3262 under the WD
treatment, might have also enhanced accumulation of water soluble carbohydrates in the
stem and its remobilisation to grains (Yang et al., 2000; Travaglia et al., 2007). Wheat
genotypes selected for high leaf ABA accumulation under drought had higher grain yield
than low ABA accumulation types (Innes et al., 1984).
3.5 Conclusions
Wheat genotypes can have isohydric and anisohydric behaviour under water deficit.
Stomata of isohydric genotypes seem to respond to an unknown signal, partially closing
stomata. Under severe water deficit (DD treatment), increased leaf ABA is related to
decreased leaf water potential. In contrast, stomatal response in anisohydric genotypes
initiates with a drop in leaf water status and increase in leaf ABA concentration. Genotypic
differences in synthesis of root ABA or other signals in response to water deficit is likely
and needs to be considered in future studies. Some genotypes also responded
morphologically to limited water supply by producing thin roots to draw water more
slowly. The physiological response, however, does not explain the difference in grain yield
among genotypes when watering was withheld from one half of the split root system (WD).
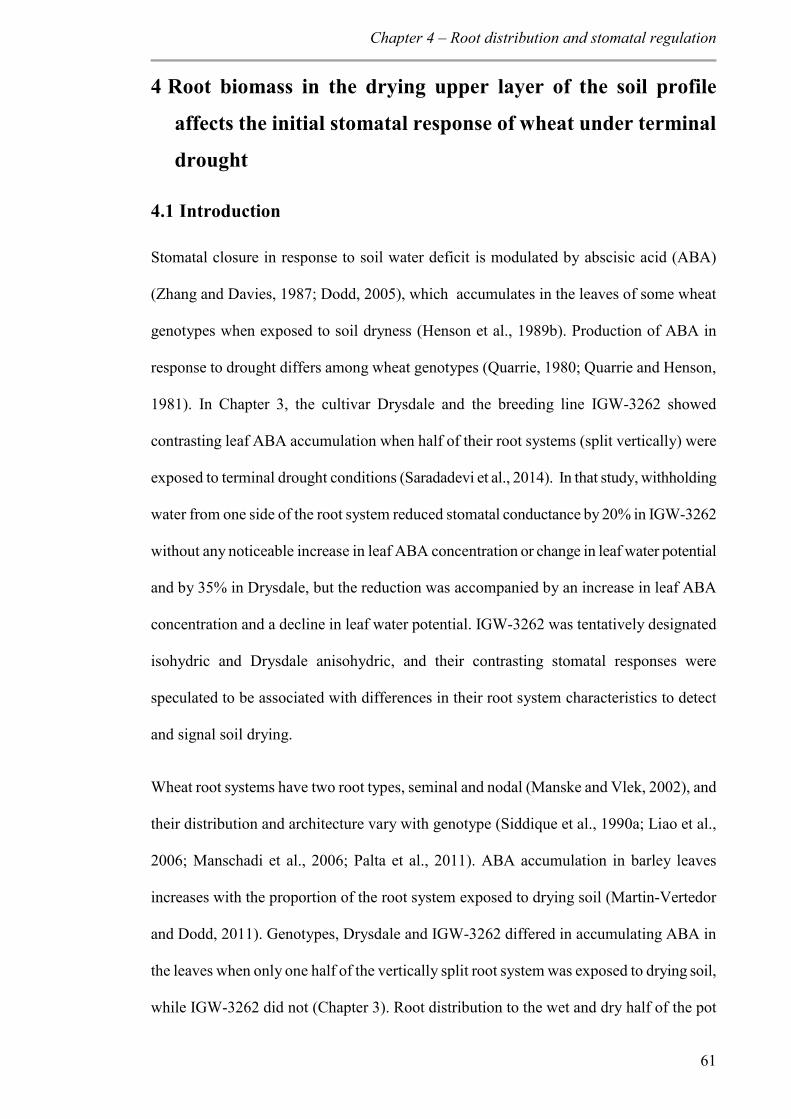
Chapter 4 – Root distribution and stomatal regulation
61
4 Root biomass in the drying upper layer of the soil profile
affects the initial stomatal response of wheat under terminal
drought
4.1 Introduction
Stomatal closure in response to soil water deficit is modulated by abscisic acid (ABA)
(Zhang and Davies, 1987; Dodd, 2005), which accumulates in the leaves of some wheat
genotypes when exposed to soil dryness (Henson et al., 1989b). Production of ABA in
response to drought differs among wheat genotypes (Quarrie, 1980; Quarrie and Henson,
1981). In Chapter 3, the cultivar Drysdale and the breeding line IGW-3262 showed
contrasting leaf ABA accumulation when half of their root systems (split vertically) were
exposed to terminal drought conditions (Saradadevi et al., 2014). In that study, withholding
water from one side of the root system reduced stomatal conductance by 20% in IGW-3262
without any noticeable increase in leaf ABA concentration or change in leaf water potential
and by 35% in Drysdale, but the reduction was accompanied by an increase in leaf ABA
concentration and a decline in leaf water potential. IGW-3262 was tentatively designated
isohydric and Drysdale anisohydric, and their contrasting stomatal responses were
speculated to be associated with differences in their root system characteristics to detect
and signal soil drying.
Wheat root systems have two root types, seminal and nodal (Manske and Vlek, 2002), and
their distribution and architecture vary with genotype (Siddique et al., 1990a; Liao et al.,
2006; Manschadi et al., 2006; Palta et al., 2011). ABA accumulation in barley leaves
increases with the proportion of the root system exposed to drying soil (Martin-Vertedor
and Dodd, 2011). Genotypes, Drysdale and IGW-3262 differed in accumulating ABA in
the leaves when only one half of the vertically split root system was exposed to drying soil,
while IGW-3262 did not (Chapter 3). Root distribution to the wet and dry half of the pot
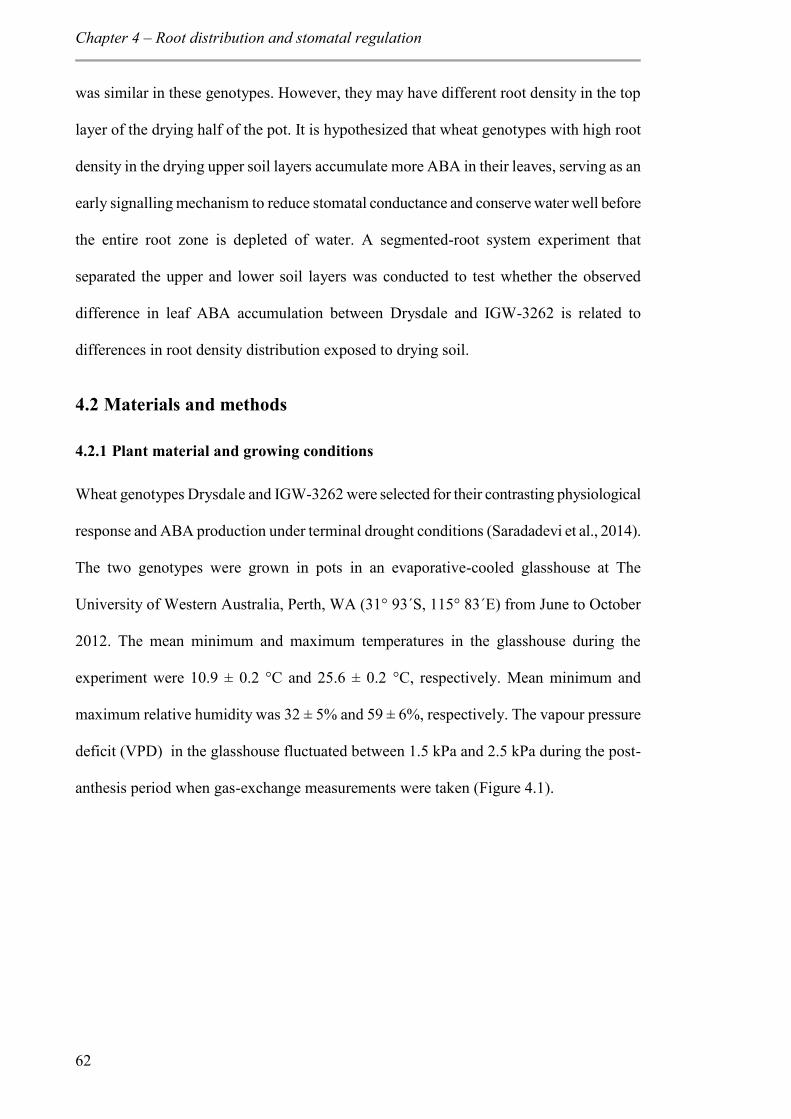
Chapter 4 – Root distribution and stomatal regulation
CCh
62
was similar in these genotypes. However, they may have different root density in the top
layer of the drying half of the pot. It is hypothesized that wheat genotypes with high root
density in the drying upper soil layers accumulate more ABA in their leaves, serving as an
early signalling mechanism to reduce stomatal conductance and conserve water well before
the entire root zone is depleted of water. A segmented-root system experiment that
separated the upper and lower soil layers was conducted to test whether the observed
difference in leaf ABA accumulation between Drysdale and IGW-3262 is related to
differences in root density distribution exposed to drying soil.
4.2 Materials and methods
4.2.1 Plant material and growing conditions
Wheat genotypes Drysdale and IGW-3262 were selected for their contrasting physiological
response and ABA production under terminal drought conditions (Saradadevi et al., 2014).
The two genotypes were grown in pots in an evaporative-cooled glasshouse at The
University of Western Australia, Perth, WA (31° 93´S, 115° 83´E) from June to October
2012. The mean minimum and maximum temperatures in the glasshouse during the
experiment were 10.9 ± 0.2 °C and 25.6 ± 0.2 °C, respectively. Mean minimum and
maximum relative humidity was 32 ± 5% and 59 ± 6%, respectively. The vapour pressure
deficit (VPD) in the glasshouse fluctuated between 1.5 kPa and 2.5 kPa during the post-
anthesis period when gas-exchange measurements were taken (Figure 4.1).
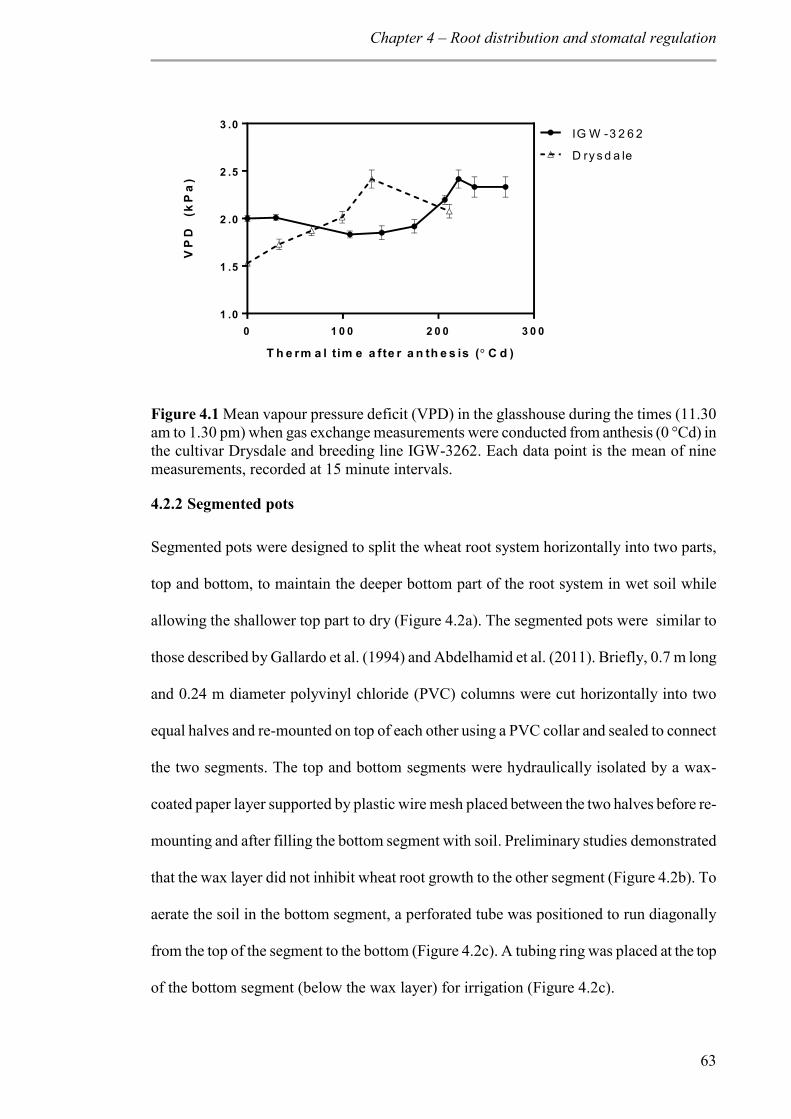
Chapter 4 – Root distribution and stomatal regulation
63
0 1 0 0 2 0 0 3 0 01 .0
1 .5
2 .0
2 .5
3 .0
T h e rm a l tim e a fte r a n th e s is ( C d )
VP
D
(kP
a)
IG W -3 2 6 2
D ry s d a le
Figure 4.1 Mean vapour pressure deficit (VPD) in the glasshouse during the times (11.30 am to 1.30 pm) when gas exchange measurements were conducted from anthesis (0 °Cd) in the cultivar Drysdale and breeding line IGW-3262. Each data point is the mean of nine measurements, recorded at 15 minute intervals.
4.2.2 Segmented pots
Segmented pots were designed to split the wheat root system horizontally into two parts,
top and bottom, to maintain the deeper bottom part of the root system in wet soil while
allowing the shallower top part to dry (Figure 4.2a). The segmented pots were similar to
those described by Gallardo et al. (1994) and Abdelhamid et al. (2011). Briefly, 0.7 m long
and 0.24 m diameter polyvinyl chloride (PVC) columns were cut horizontally into two
equal halves and re-mounted on top of each other using a PVC collar and sealed to connect
the two segments. The top and bottom segments were hydraulically isolated by a wax-
coated paper layer supported by plastic wire mesh placed between the two halves before re-
mounting and after filling the bottom segment with soil. Preliminary studies demonstrated
that the wax layer did not inhibit wheat root growth to the other segment (Figure 4.2b). To
aerate the soil in the bottom segment, a perforated tube was positioned to run diagonally
from the top of the segment to the bottom (Figure 4.2c). A tubing ring was placed at the top
of the bottom segment (below the wax layer) for irrigation (Figure 4.2c).
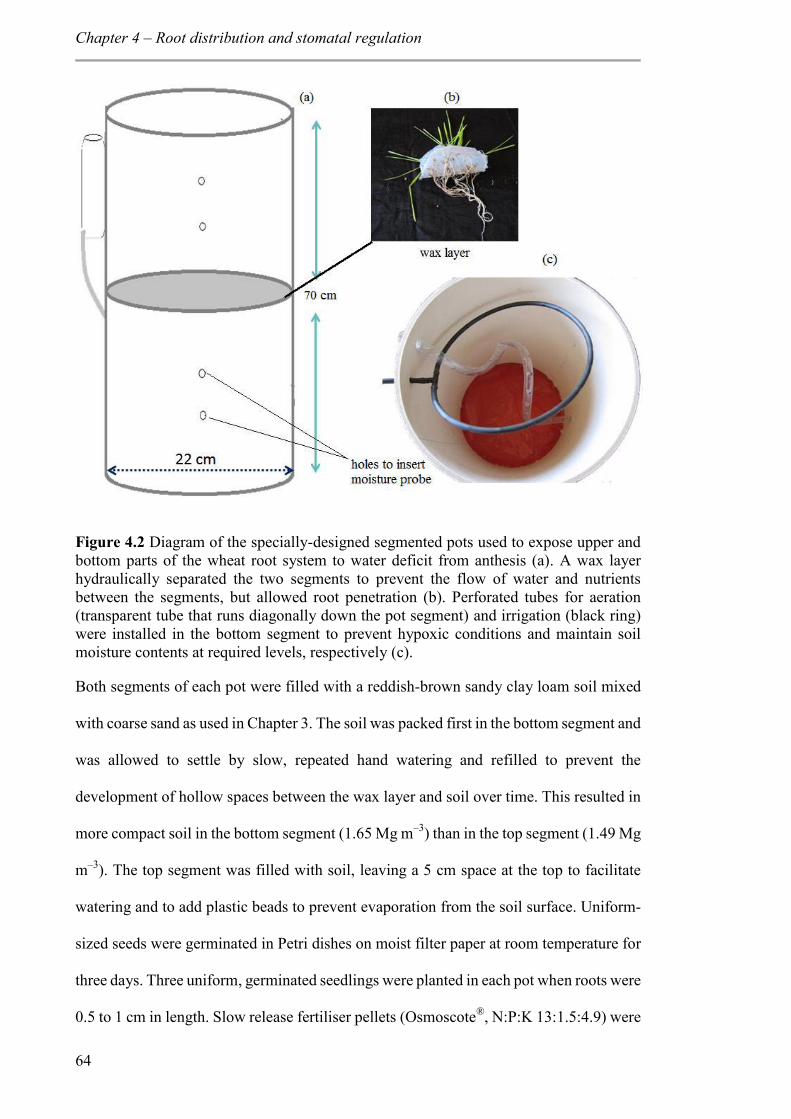
Chapter 4 – Root distribution and stomatal regulation
CCh
64
Figure 4.2 Diagram of the specially-designed segmented pots used to expose upper and bottom parts of the wheat root system to water deficit from anthesis (a). A wax layer hydraulically separated the two segments to prevent the flow of water and nutrients between the segments, but allowed root penetration (b). Perforated tubes for aeration (transparent tube that runs diagonally down the pot segment) and irrigation (black ring) were installed in the bottom segment to prevent hypoxic conditions and maintain soil moisture contents at required levels, respectively (c).
Both segments of each pot were filled with a reddish-brown sandy clay loam soil mixed
with coarse sand as used in Chapter 3. The soil was packed first in the bottom segment and
was allowed to settle by slow, repeated hand watering and refilled to prevent the
development of hollow spaces between the wax layer and soil over time. This resulted in
more compact soil in the bottom segment (1.65 Mg m–3) than in the top segment (1.49 Mg
m–3). The top segment was filled with soil, leaving a 5 cm space at the top to facilitate
watering and to add plastic beads to prevent evaporation from the soil surface. Uniform-
sized seeds were germinated in Petri dishes on moist filter paper at room temperature for
three days. Three uniform, germinated seedlings were planted in each pot when roots were
0.5 to 1 cm in length. Slow release fertiliser pellets (Osmoscote®, N:P:K 13:1.5:4.9) were
Chapter 4 – Root distribution and stomatal regulation
65
mixed into the top 0.1 m of soil in each segment (25 g each) before the two segments were
assembled. Two weeks after planting, a water soluble fertiliser with Mg, Cu, Zn, Mo, S and
other micronutrients was applied. The soil water content of each segment was monitored
separately by inserting a 0.22 m long soil moisture probe (CS620 Hydrosense, Campbell
Scientific Inc., Logan, UT, USA) through the horizontal holes in the middle part of each
segment (Figure 4.2a). The soil moisture probes were previously calibrated using the same
soil–sand mixture to convert the probe reading from percentage volumetric content to
gravimetric soil moisture content. The pots were watered on alternate days to maintain the
soil water content close to 90% of pot soil water holding capacity until plants were at 50%
anthesis—Z65, Zadoks’ growth scale for cereals (Zadoks et al., 1974). Terminal drought
was then induced by withholding watering from two-thirds of the pots. Anthesis for each
genotype was determined when anthers had emerged from the main stem of 50% of the
plants.
4.2.3 Treatments
At 50% anthesis in each genotype, the pots were divided into three groups of ten pots. In
the first group, both segments of each pot were well-watered (WW). In the second group,
water was withheld from the top segment in each pot (DW), and in the third group, water
was withheld from both segments of each pot (DD). Wet soil segments were watered by
hand every alternate day to maintain soil water content close to 90% of pot soil capacity
based on moisture probe readings. To prevent water loss from the soil through evaporation,
the soil surface in the top segment of each pot was covered with a 3 cm layer of white
plastic beads.
4.2.4 Measurements
Leaf water potential (leaf), stomatal conductance (gs), transpiration and leaf net
photosynthesis rate were measured on the flag leaf of the different tillers of two plants in
Chapter 4 – Root distribution and stomatal regulation
CCh
66
each of five replicate pots in both genotypes. Measurements were made between 10.30 am
and 1.30 pm on days with clear sky. Rates of leaf net photosynthesis, gs and transpiration
were measured with a LI-COR gas-exchange system (LI-6400, LI-COR Biosciences,
Nebraska, USA) with LED light source on the leaf chamber. In the LI-COR cuvette, CO2
concentration was set to 380 µmol mol–1 and LED light intensity 1000 μmol m–2 s–1, which
is the average saturation intensity for photosynthesis in wheat (Austin, 1990). Immediately
after these measurements were made, leaf was measured using a Scholander-type pressure
chamber (Model 1000, PMS Instrument Co., Oregon, USA). The flag leaf was loosely
covered with a plastic sheath before excision and during the measurement to avoid
evaporation (Turner, 1988). After leaf was measured, the flag leaf was wrapped in
aluminium foil, snap frozen in liquid nitrogen and stored at –80 °C for ABA analysis.
4.2.5 Sampling
Shoot and root biomass were measured three times during the experiment at: (1) 50%
anthesis, before terminal drought was induced, (2) grain filling , when leaf water potential
in the DW treatment fell to –2 MPa, which occurred at 270 °Cd in IGW-3262 and 210 °Cd
in Drysdale after withholding water from anthesis and (3) physiological maturity, when
90% of the flag leaves had turned yellow and glumes had lost their green colour in 50% of
the plants for each genotype (Hanft and Wych, 1982). Pots in which leaves were removed
for leaf and ABA measurements were harvested at grain filling. On each occasion, the
number of tillers per plant was recorded; shoots were then cut from the roots at the crown.
Green leaf area was measured at anthesis and grain filling using a portable leaf area meter
(LI-3000, LI-COR Biosciences, Nebraska, USA). Shoots and leaves were separately dried
in an oven at 60 °C for 48 hours and then weighed. Immediately after harvesting the shoots,
both pot segments were separated and the roots in each segment recovered from the soil by
repeated washing and sieving on a 1.4-mm sieve to produce a clean sample (Liao et al.,
Chapter 4 – Root distribution and stomatal regulation
67
2006; Palta et al., 2007). Roots were then dried in an oven at 60 °C for 72 hours and
weighed. Root biomass per plant is the average root biomass of the three plants grown in a
pot (one replicate). Root lengths were also measured before drying at the grain filling and
physiological maturity harvests. Roots were stained for 30 min with 0.1% (w/v) methylene
blue, placed in about 3 mm of water in a glass tray (0.2 0.3 m) and then untangled with a
plastic spatula to minimise overlapping. The glass tray was placed on a flatbed scanner with
transparency unit (Epson STD4800). Scanning was done at 400 dpi resolution and the
images were analysed for total root length using WinRHIZO Pro 2009b (Regent
Instruments Inc., Canada). Specific root length (SRL) in each segment was calculated as
root length per unit of root biomass.
At the final harvest, the number of spikes per plant and spikelets per spike were counted.
Spikes were separated from shoots, oven dried at 40 °C for one week and threshed by hand.
The number and weight of grains per plant were recorded as an average of three plants in a
pot (one replicate). Harvest index (HI) was calculated as the ratio of grain yield to shoot
biomass.
4.2.6 ABA sampling and analysis
In addition to flag leaves, root samples were collected from the top of each segment, close
to the centre of the pot at the grain-filling harvest. The soil was removed with a quick wash,
and roots snap frozen in liquid nitrogen and stored at –80 °C until analysis. Analysis was
carried out by liquid chromatography/mass spectrometry (LC-MS/MS) as per the protocol
described by Speirs et al. (2013) and used in Chapter 3. Briefly, ABA and its catabolites
phaseic acid (PA), dihydrophaseic acid (DPA) and glucose ester (ABA-GE) were separated
from ground leaf tissue extracts using Phenomenex SPE columns at 40 °C. The separated
samples were eluted with acetonitrile and compounds were identified by retention times
and multiple reaction monitoring.
Chapter 4 – Root distribution and stomatal regulation
CCh
68
4.2.7 Statistical analysis
The experiment was arranged in a randomised complete block design, with replication as
the blocking factors. Growth and yield data were analysed with a two-way ANOVA using
statistical software R 2.14.0 (R Development Core Team, 2011) followed by the Least
Significant Difference (LSD) test for multiple comparisons. The block effect was
insignificant in all parameters tested. Growth measured at anthesis was compared using the
unpaired t-test. Time series measurement of soil water content was compared through
regression analysis. Non-linear regression curve fitting was done using GraphPad Prism
6.03. Best fit was selected after comparing different models based on the extra sum of
squares F test. The curves were compared by performing extra sum of squares F test.
Thermal time (accumulated daily average temperature, base temperature 0 °C) from
anthesis was used for comparison because each genotype reached anthesis on different days
and hence gas-exchange measurements were made on different days.
4.3 Results
4.3.1 Phenology
The breeding line IGW-3262 reached anthesis 7 days (107 °Cd) earlier (P < 0.001) and
physiological maturity 4 days (84 °Cd) later than Drysdale (Table 4.1). In the DW
treatment, time to physiological maturity decreased by 19–20 days (380 to 398 °Cd)
compared with the WW treatment. The DD treatment reduced the time to physiological
maturity by an additional 13 days (236 °Cd) in IGW-3262 and 9 days (158 °Cd) in
Drysdale compared with the DW treatment (Table 4.1).
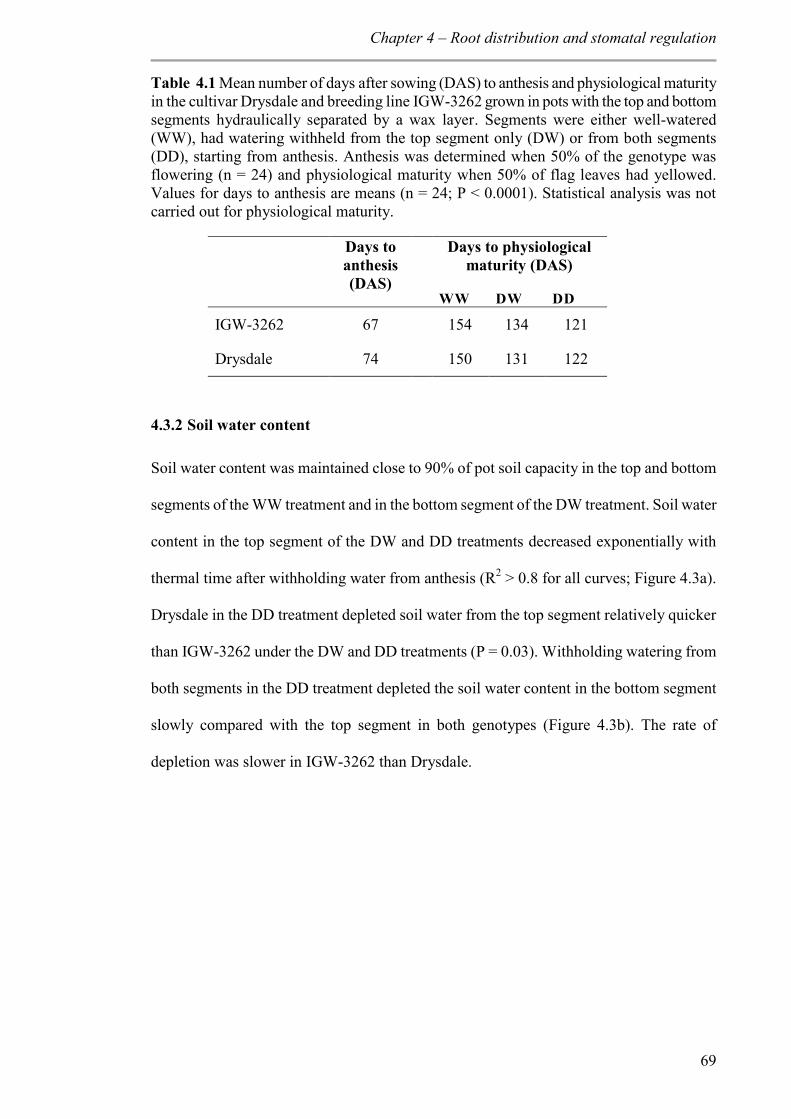
Chapter 4 – Root distribution and stomatal regulation
69
Table 4.1 Mean number of days after sowing (DAS) to anthesis and physiological maturity in the cultivar Drysdale and breeding line IGW-3262 grown in pots with the top and bottom segments hydraulically separated by a wax layer. Segments were either well-watered (WW), had watering withheld from the top segment only (DW) or from both segments (DD), starting from anthesis. Anthesis was determined when 50% of the genotype was flowering (n = 24) and physiological maturity when 50% of flag leaves had yellowed. Values for days to anthesis are means (n = 24; P < 0.0001). Statistical analysis was not carried out for physiological maturity.
Days to anthesis (DAS)
Days to physiological maturity (DAS)
WW DW DD
IGW-3262 67 154 134 121
Drysdale 74 150 131 122
4.3.2 Soil water content
Soil water content was maintained close to 90% of pot soil capacity in the top and bottom
segments of the WW treatment and in the bottom segment of the DW treatment. Soil water
content in the top segment of the DW and DD treatments decreased exponentially with
thermal time after withholding water from anthesis (R2 > 0.8 for all curves; Figure 4.3a).
Drysdale in the DD treatment depleted soil water from the top segment relatively quicker
than IGW-3262 under the DW and DD treatments (P = 0.03). Withholding watering from
both segments in the DD treatment depleted the soil water content in the bottom segment
slowly compared with the top segment in both genotypes (Figure 4.3b). The rate of
depletion was slower in IGW-3262 than Drysdale.
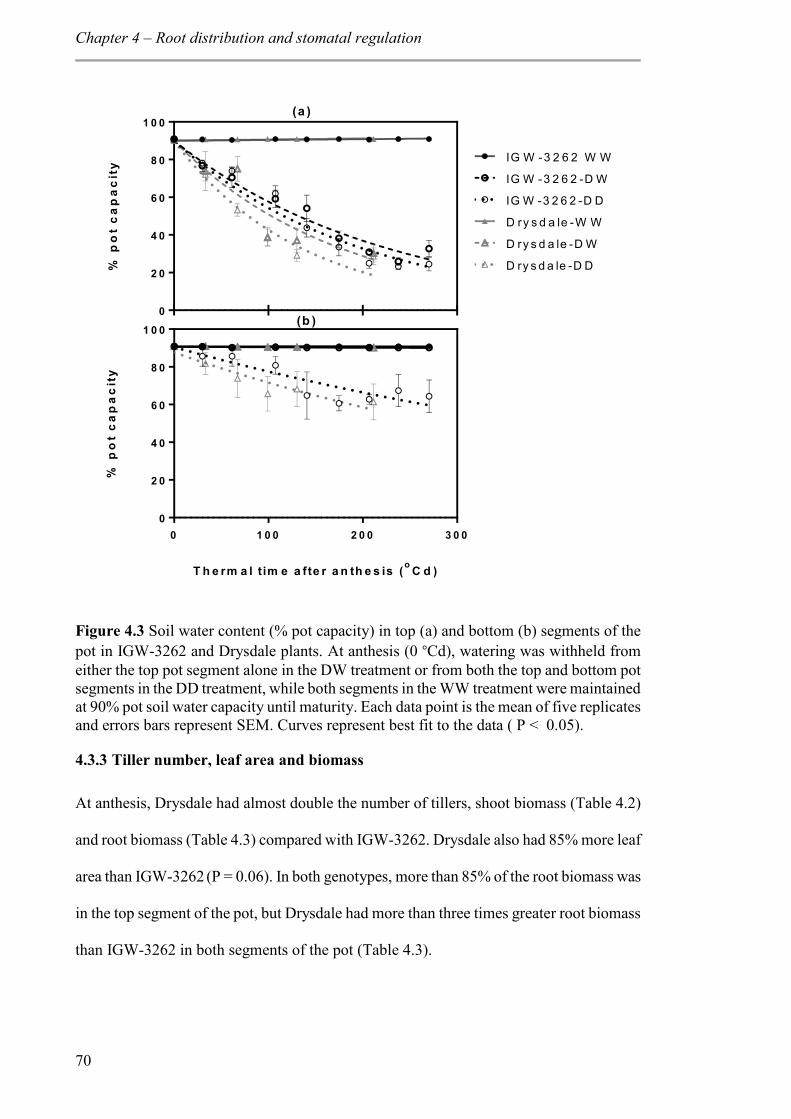
Chapter 4 – Root distribution and stomatal regulation
CCh
70
0
2 0
4 0
6 0
8 0
1 0 0%
po
t c
ap
ac
ity IG W -3 2 6 2 W W
IG W -3 2 6 2 -D W
IG W -3 2 6 2 -D D
D ry s d a le -W W
D ry s d a le -D W
D ry s d a le -D D
0 1 0 0 2 0 0 3 0 00
2 0
4 0
6 0
8 0
1 0 0
T h e rm a l tim e a fte r a n th e s is (o C d )
% p
ot
ca
pa
cit
y(a )
(b )
Figure 4.3 Soil water content (% pot capacity) in top (a) and bottom (b) segments of the pot in IGW-3262 and Drysdale plants. At anthesis (0 °Cd), watering was withheld from either the top pot segment alone in the DW treatment or from both the top and bottom pot segments in the DD treatment, while both segments in the WW treatment were maintained at 90% pot soil water capacity until maturity. Each data point is the mean of five replicates and errors bars represent SEM. Curves represent best fit to the data ( P < 0.05).
4.3.3 Tiller number, leaf area and biomass
At anthesis, Drysdale had almost double the number of tillers, shoot biomass (Table 4.2)
and root biomass (Table 4.3) compared with IGW-3262. Drysdale also had 85% more leaf
area than IGW-3262 (P = 0.06). In both genotypes, more than 85% of the root biomass was
in the top segment of the pot, but Drysdale had more than three times greater root biomass
than IGW-3262 in both segments of the pot (Table 4.3).
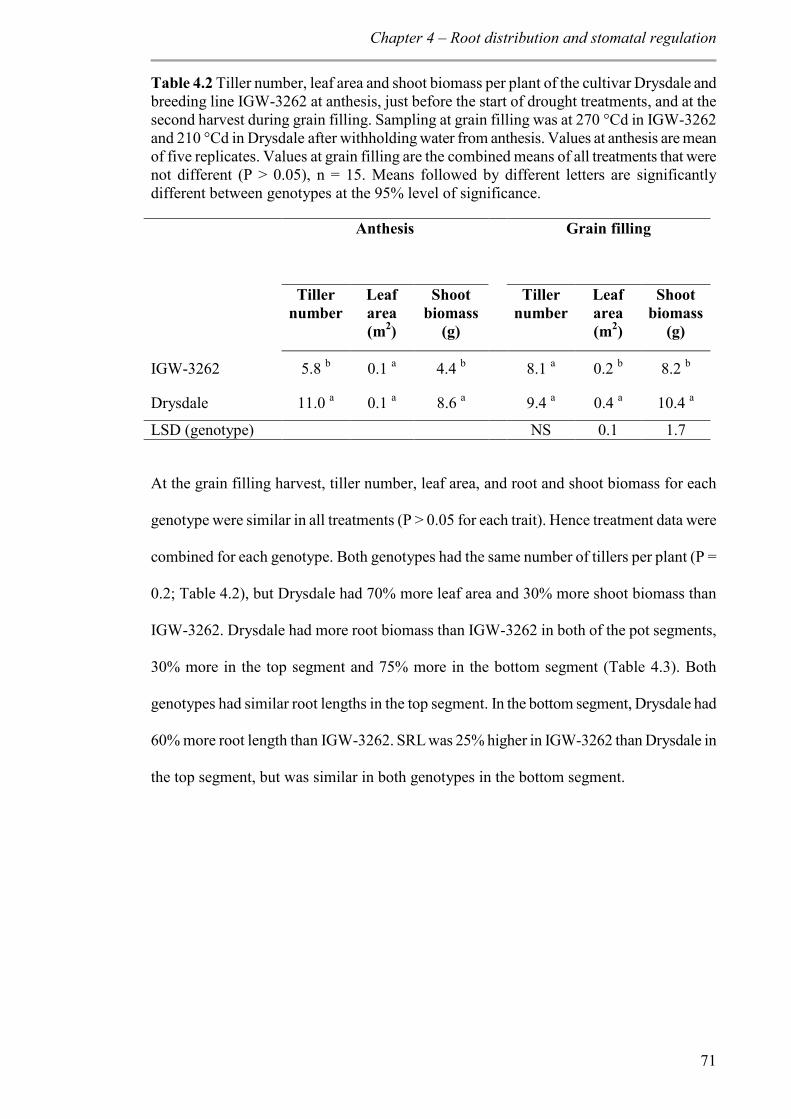
Chapter 4 – Root distribution and stomatal regulation
71
Table 4.2 Tiller number, leaf area and shoot biomass per plant of the cultivar Drysdale and breeding line IGW-3262 at anthesis, just before the start of drought treatments, and at the second harvest during grain filling. Sampling at grain filling was at 270 °Cd in IGW-3262 and 210 °Cd in Drysdale after withholding water from anthesis. Values at anthesis are mean of five replicates. Values at grain filling are the combined means of all treatments that were not different (P > 0.05), n = 15. Means followed by different letters are significantly different between genotypes at the 95% level of significance.
Anthesis Grain filling
Tiller
number Leaf area (m2)
Shoot biomass
(g)
Tiller number
Leaf area (m2)
Shoot biomass
(g)
IGW-3262 5.8 b 0.1 a 4.4 b 8.1 a 0.2 b 8.2 b
Drysdale 11.0 a 0.1 a 8.6 a 9.4 a 0.4 a 10.4 a
LSD (genotype) NS 0.1 1.7
At the grain filling harvest, tiller number, leaf area, and root and shoot biomass for each
genotype were similar in all treatments (P > 0.05 for each trait). Hence treatment data were
combined for each genotype. Both genotypes had the same number of tillers per plant (P =
0.2; Table 4.2), but Drysdale had 70% more leaf area and 30% more shoot biomass than
IGW-3262. Drysdale had more root biomass than IGW-3262 in both of the pot segments,
30% more in the top segment and 75% more in the bottom segment (Table 4.3). Both
genotypes had similar root lengths in the top segment. In the bottom segment, Drysdale had
60% more root length than IGW-3262. SRL was 25% higher in IGW-3262 than Drysdale in
the top segment, but was similar in both genotypes in the bottom segment.
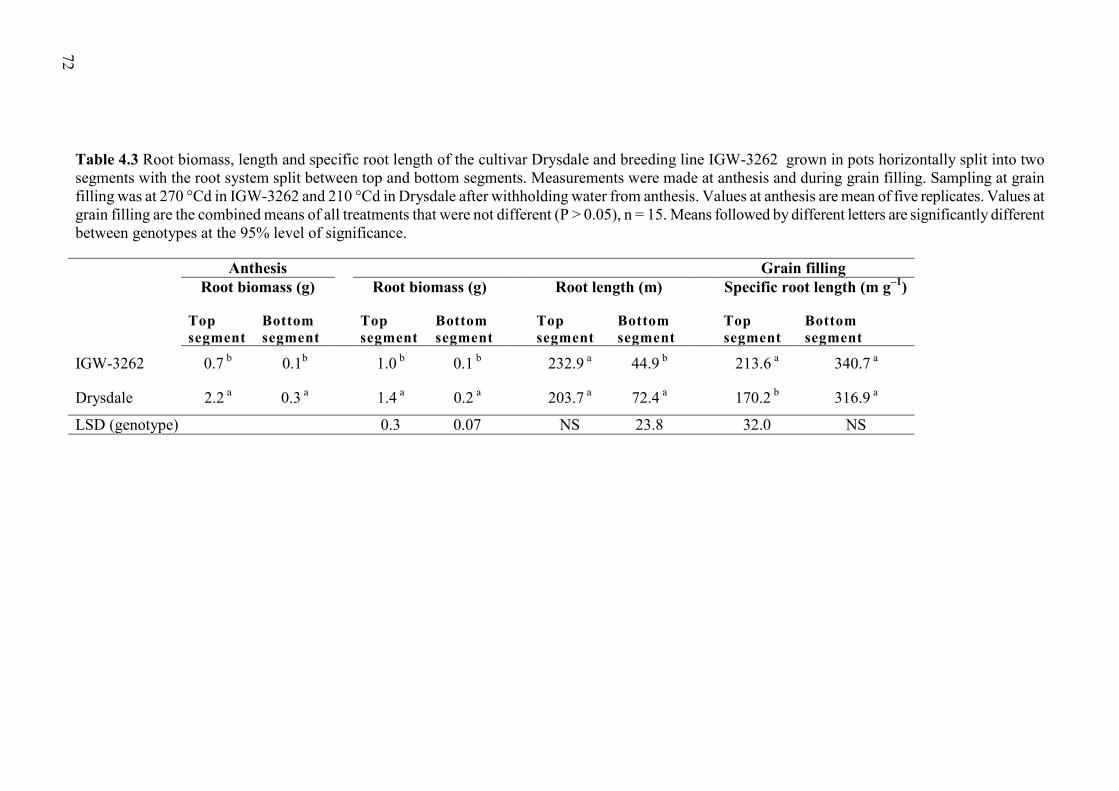
72
Table 4.3 Root biomass, length and specific root length of the cultivar Drysdale and breeding line IGW-3262 grown in pots horizontally split into two segments with the root system split between top and bottom segments. Measurements were made at anthesis and during grain filling. Sampling at grain filling was at 270 °Cd in IGW-3262 and 210 °Cd in Drysdale after withholding water from anthesis. Values at anthesis are mean of five replicates. Values at grain filling are the combined means of all treatments that were not different (P > 0.05), n = 15. Means followed by different letters are significantly different between genotypes at the 95% level of significance.
Anthesis Grain filling Root biomass (g) Root biomass (g) Root length (m) Specific root length (m g–1)
Top segment
Bottom segment
Top segment
Bottom segment
Top segment
Bottom segment
Top segment
Bottom segment
IGW-3262 0.7 b 0.1b 1.0 b 0.1 b 232.9 a 44.9 b 213.6 a 340.7 a
Drysdale 2.2 a 0.3 a 1.4 a 0.2 a 203.7 a 72.4 a 170.2 b 316.9 a
LSD (genotype) 0.3 0.07 NS 23.8 32.0 NS
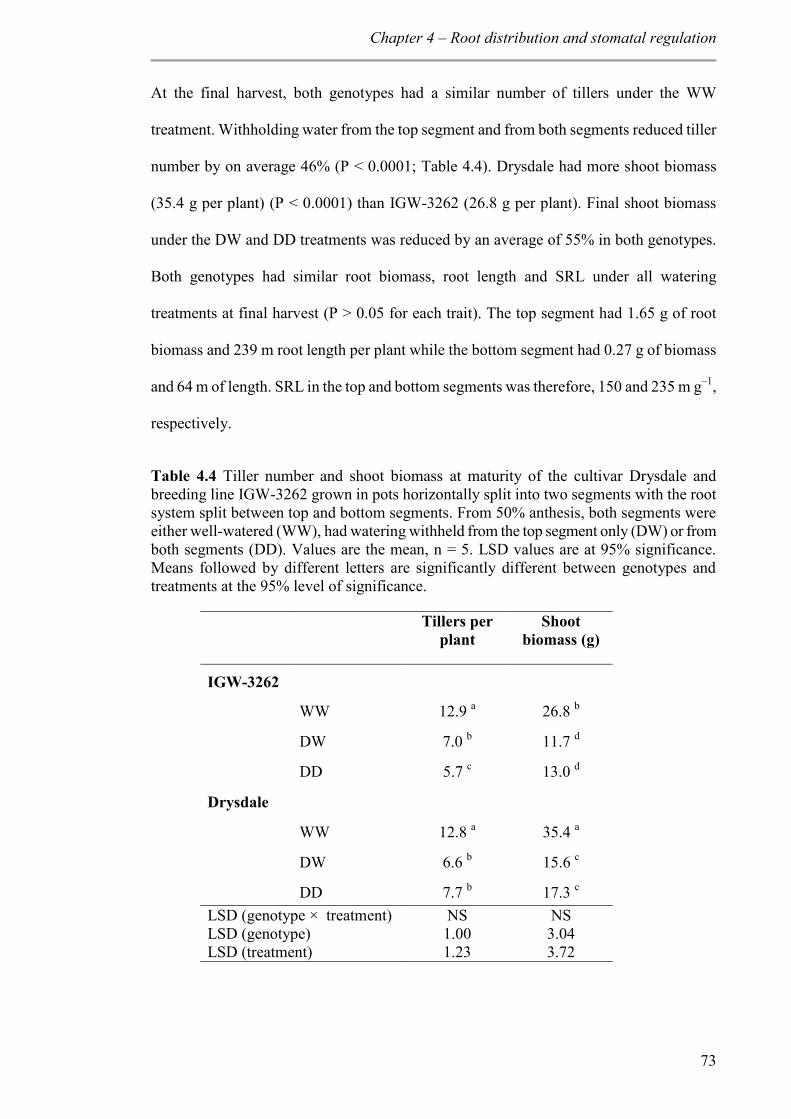
Chapter 4 – Root distribution and stomatal regulation
73
At the final harvest, both genotypes had a similar number of tillers under the WW
treatment. Withholding water from the top segment and from both segments reduced tiller
number by on average 46% (P < 0.0001; Table 4.4). Drysdale had more shoot biomass
(35.4 g per plant) (P < 0.0001) than IGW-3262 (26.8 g per plant). Final shoot biomass
under the DW and DD treatments was reduced by an average of 55% in both genotypes.
Both genotypes had similar root biomass, root length and SRL under all watering
treatments at final harvest (P > 0.05 for each trait). The top segment had 1.65 g of root
biomass and 239 m root length per plant while the bottom segment had 0.27 g of biomass
and 64 m of length. SRL in the top and bottom segments was therefore, 150 and 235 m g–1,
respectively.
Table 4.4 Tiller number and shoot biomass at maturity of the cultivar Drysdale and breeding line IGW-3262 grown in pots horizontally split into two segments with the root system split between top and bottom segments. From 50% anthesis, both segments were either well-watered (WW), had watering withheld from the top segment only (DW) or from both segments (DD). Values are the mean, n = 5. LSD values are at 95% significance. Means followed by different letters are significantly different between genotypes and treatments at the 95% level of significance.
Tillers per plant
Shoot biomass (g)
IGW-3262
WW 12.9 a 26.8 b
DW 7.0 b 11.7 d
DD 5.7 c 13.0 d
Drysdale
WW 12.8 a 35.4 a
DW 6.6 b 15.6 c
DD 7.7 b 17.3 c LSD (genotype × treatment) NS NS LSD (genotype) 1.00 3.04 LSD (treatment) 1.23 3.72
Chapter 4 – Root distribution and stomatal regulation
74
4.3.4 Leaf water potential (leaf), stomatal conductance (gs), transpiration and leaf net
photosynthesis rate
When water was withheld from the top segment alone and from both segments, leaf
decreased with thermal time compared to that of the WW treatment (Figure 4.4a, b). After
withholding water from anthesis, IGW-3262 maintained leaf as per the WW treatment
until 141 °Cd in the DW and 107 °Cd in the DD treatments and then started declining. leaf
had decreased by 40% in DW and 50% in DD treatment at 207 °Cd. In Drysdale, leaf in
the DW and DD treatments was lower than the WW treatment as early as 67 °Cd after
withholding water from anthesis. leaf decreased by similar amounts in both DW and DD
treatments, to 50% by 211 °Cd.
In WW plants, gs varied between 200 and 470 mmol m–2 s–1 in IGW-3262 and in Drysdale
between 220 and 330 mmol m–2 s–1. gs declined in both genotypes in the DW and DD
treatments, with the reduction observed earlier in Drysdale than in IGW-3262 (Figure 4.4c
and d). In Drysdale, gs in the DW and DD treatments was 40% lower by 67 °Cd compared
with the WW treatment. In IGW-3262, gs reduction was only observed at 141 °Cd in the
DD treatment and at 175 °Cd in the DW treatment.
Transpiration rate in the WW treatment fluctuated more in IGW-3262 (Figure 4.4e) than
Drysdale with Drysdale showing a slight linear increase with thermal time after anthesis
(Figure 4.4f). Transpiration rate was lower in the DW and DD treatments in both genotypes
compared with the WW treatment. Similar to the gs response, transpiration rate in Drysdale
was significantly lower in DW and DD treatments at an earlier thermal time compared with
IGW-3262.
The net photosynthesis rate under WW conditions varied in IGW-3262 (Figure 4.4g), but
remained stable in Drysdale (Figure 4.4h). After withholding post-anthesis watering,
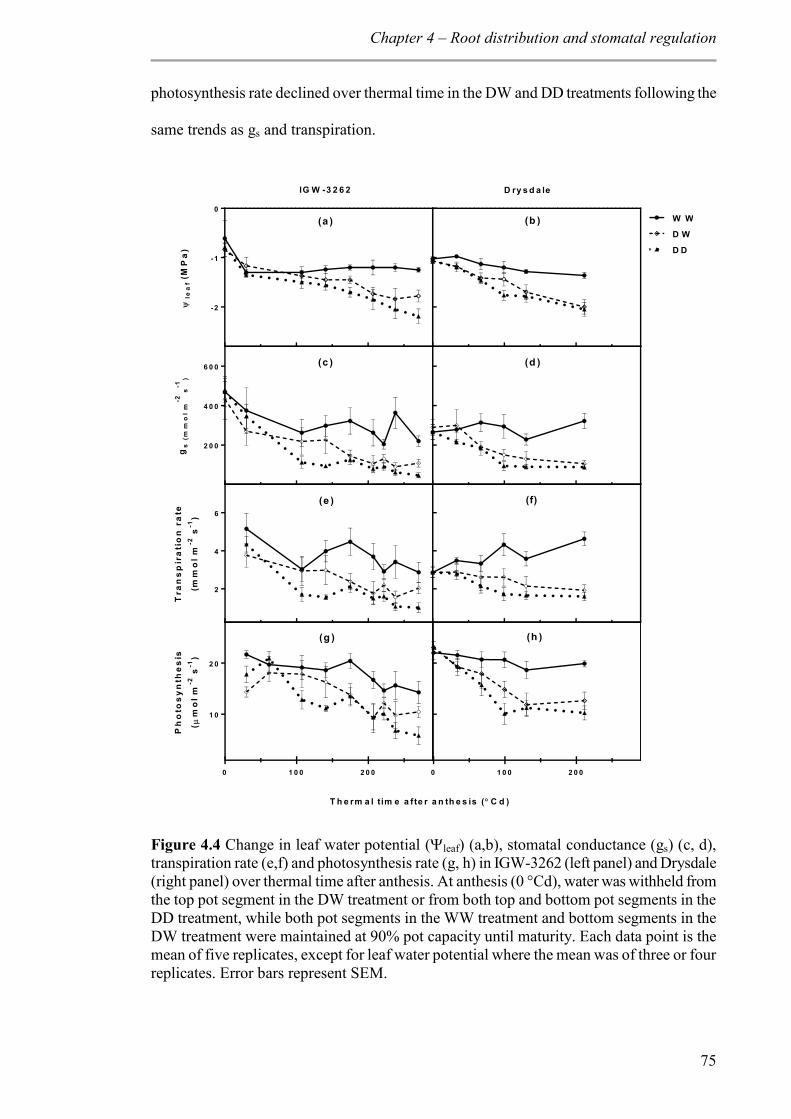
Chapter 4 – Root distribution and stomatal regulation
75
photosynthesis rate declined over thermal time in the DW and DD treatments following the
same trends as gs and transpiration.
-2
-1
0
le
af
(MP
a)
W W
D W
D D
2 0 0
4 0 0
6 0 0
gs
(m
mo
l m
-2 s
-1)
2
4
6
Tra
ns
pir
ati
on
ra
te
(mm
ol
m-2
s-1
)
0 1 0 0 2 0 0
1 0
2 0
Ph
oto
sy
nth
es
is
( m
ol m
-2 s
-1)
0 1 0 0 2 0 0
IG W -3 2 6 2 D ry s d a le
(a ) (b )
(c ) (d )
(e ) (f)
(g ) (h )
T h e rm a l tim e a fte r a n th e s is ( C d )
Figure 4.4 Change in leaf water potential (leaf) (a,b), stomatal conductance (gs) (c, d), transpiration rate (e,f) and photosynthesis rate (g, h) in IGW-3262 (left panel) and Drysdale (right panel) over thermal time after anthesis. At anthesis (0 °Cd), water was withheld from the top pot segment in the DW treatment or from both top and bottom pot segments in the DD treatment, while both pot segments in the WW treatment and bottom segments in the DW treatment were maintained at 90% pot capacity until maturity. Each data point is the mean of five replicates, except for leaf water potential where the mean was of three or four replicates. Error bars represent SEM.
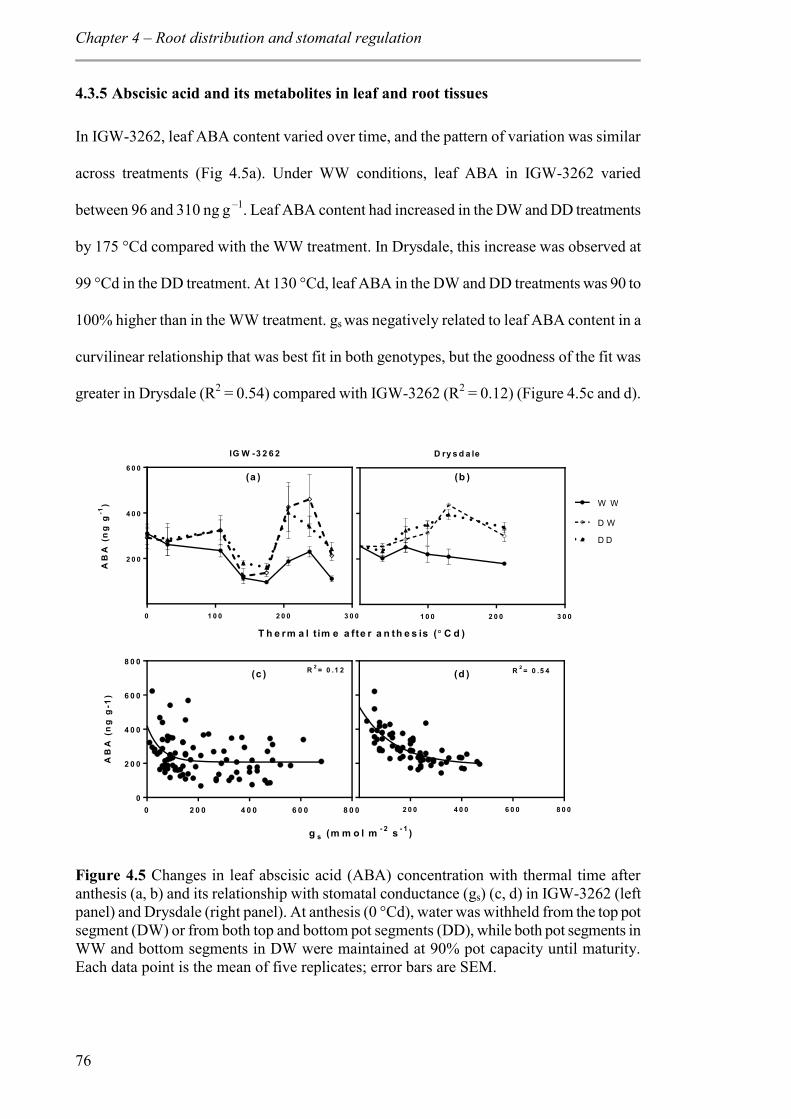
Chapter 4 – Root distribution and stomatal regulation
76
4.3.5 Abscisic acid and its metabolites in leaf and root tissues
In IGW-3262, leaf ABA content varied over time, and the pattern of variation was similar
across treatments (Fig 4.5a). Under WW conditions, leaf ABA in IGW-3262 varied
between 96 and 310 ng g –1. Leaf ABA content had increased in the DW and DD treatments
by 175 °Cd compared with the WW treatment. In Drysdale, this increase was observed at
99 °Cd in the DD treatment. At 130 °Cd, leaf ABA in the DW and DD treatments was 90 to
100% higher than in the WW treatment. gs was negatively related to leaf ABA content in a
curvilinear relationship that was best fit in both genotypes, but the goodness of the fit was
greater in Drysdale (R2 = 0.54) compared with IGW-3262 (R2 = 0.12) (Figure 4.5c and d).
0 1 0 0 2 0 0 3 0 0
2 0 0
4 0 0
6 0 0
AB
A (
ng
g-1
)
1 0 0 2 0 0 3 0 0
W W
D W
D D
0 2 0 0 4 0 0 6 0 0 8 0 00
2 0 0
4 0 0
6 0 0
8 0 0
AB
A (
ng
g-1
)
R 2 = 0 .1 2
2 0 0 4 0 0 6 0 0 8 0 0
R 2 = 0 .5 4
(a ) (b )
(c ) (d )
g s (m m o l m - 2 s - 1 )
IG W -3 2 6 2 D ry s d a le
T h e rm a l t im e a f te r a n th e s is ( C d )
Figure 4.5 Changes in leaf abscisic acid (ABA) concentration with thermal time after anthesis (a, b) and its relationship with stomatal conductance (gs) (c, d) in IGW-3262 (left panel) and Drysdale (right panel). At anthesis (0 °Cd), water was withheld from the top pot segment (DW) or from both top and bottom pot segments (DD), while both pot segments in WW and bottom segments in DW were maintained at 90% pot capacity until maturity. Each data point is the mean of five replicates; error bars are SEM.
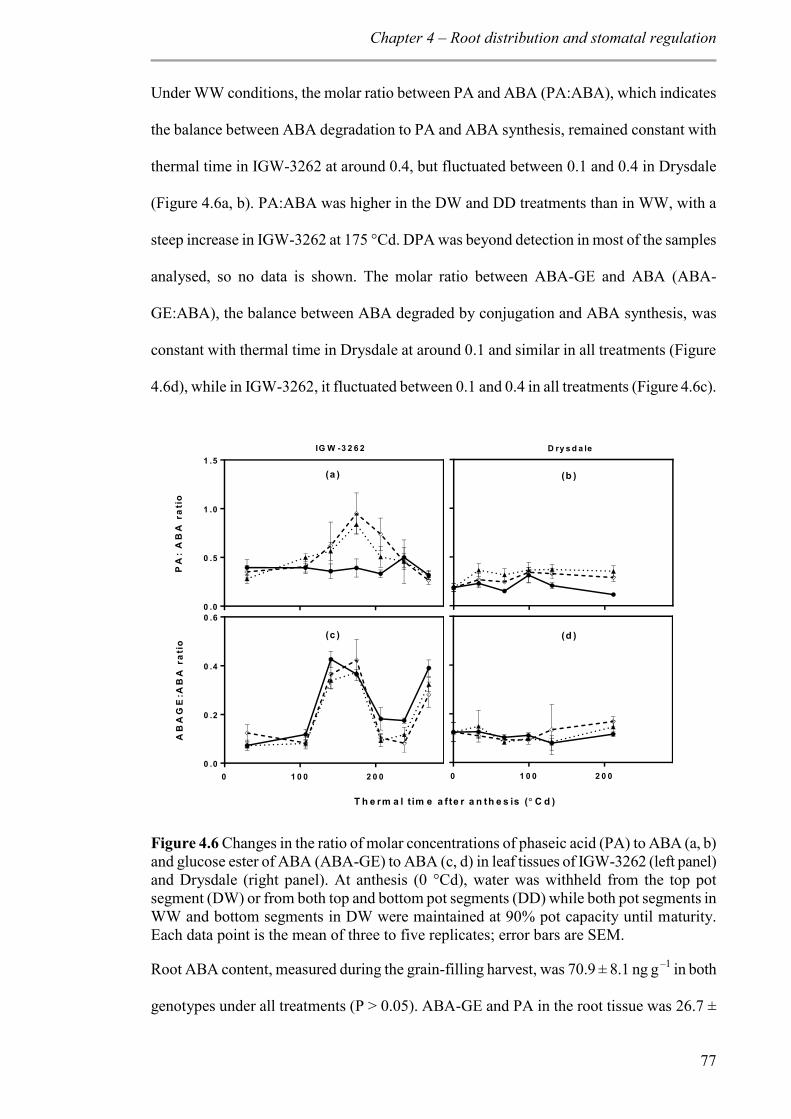
Chapter 4 – Root distribution and stomatal regulation
77
Under WW conditions, the molar ratio between PA and ABA (PA:ABA), which indicates
the balance between ABA degradation to PA and ABA synthesis, remained constant with
thermal time in IGW-3262 at around 0.4, but fluctuated between 0.1 and 0.4 in Drysdale
(Figure 4.6a, b). PA:ABA was higher in the DW and DD treatments than in WW, with a
steep increase in IGW-3262 at 175 °Cd. DPA was beyond detection in most of the samples
analysed, so no data is shown. The molar ratio between ABA-GE and ABA (ABA-
GE:ABA), the balance between ABA degraded by conjugation and ABA synthesis, was
constant with thermal time in Drysdale at around 0.1 and similar in all treatments (Figure
4.6d), while in IGW-3262, it fluctuated between 0.1 and 0.4 in all treatments (Figure 4.6c).
0 .0
0 .5
1 .0
1 .5
PA
: A
BA
ra
tio
0 1 0 0 2 0 00 .0
0 .2
0 .4
0 .6
AB
AG
E:A
BA
ra
tio
0 1 0 0 2 0 0
(a ) (b )
(c ) (d )
T h e rm a l t im e a f te r a n th e s is ( C d )
IG W -3 2 6 2 D ry s d a le
Figure 4.6 Changes in the ratio of molar concentrations of phaseic acid (PA) to ABA (a, b) and glucose ester of ABA (ABA-GE) to ABA (c, d) in leaf tissues of IGW-3262 (left panel) and Drysdale (right panel). At anthesis (0 °Cd), water was withheld from the top pot segment (DW) or from both top and bottom pot segments (DD) while both pot segments in WW and bottom segments in DW were maintained at 90% pot capacity until maturity. Each data point is the mean of three to five replicates; error bars are SEM.
Root ABA content, measured during the grain-filling harvest, was 70.9 ± 8.1 ng g –1 in both
genotypes under all treatments (P > 0.05). ABA-GE and PA in the root tissue was 26.7 ±
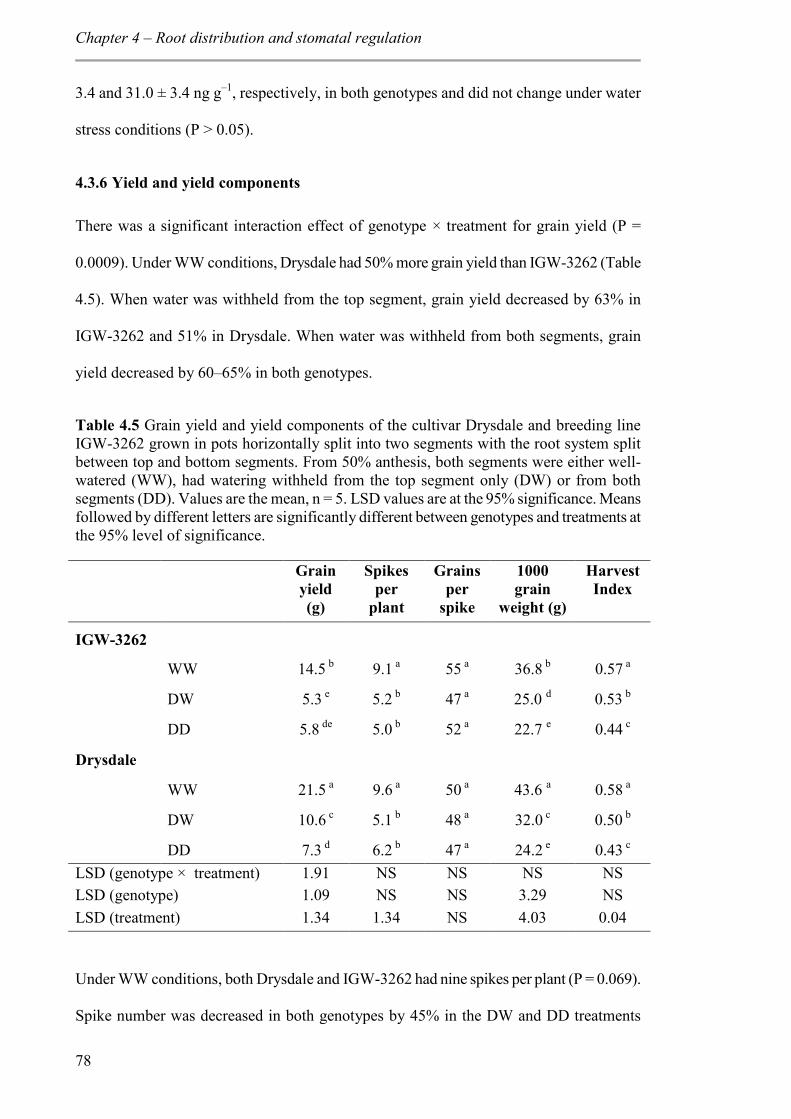
Chapter 4 – Root distribution and stomatal regulation
78
3.4 and 31.0 ± 3.4 ng g–1, respectively, in both genotypes and did not change under water
stress conditions (P > 0.05).
4.3.6 Yield and yield components
There was a significant interaction effect of genotype × treatment for grain yield (P =
0.0009). Under WW conditions, Drysdale had 50% more grain yield than IGW-3262 (Table
4.5). When water was withheld from the top segment, grain yield decreased by 63% in
IGW-3262 and 51% in Drysdale. When water was withheld from both segments, grain
yield decreased by 60–65% in both genotypes.
Table 4.5 Grain yield and yield components of the cultivar Drysdale and breeding line IGW-3262 grown in pots horizontally split into two segments with the root system split between top and bottom segments. From 50% anthesis, both segments were either well-watered (WW), had watering withheld from the top segment only (DW) or from both segments (DD). Values are the mean, n = 5. LSD values are at the 95% significance. Means followed by different letters are significantly different between genotypes and treatments at the 95% level of significance.
Grain yield (g)
Spikes per
plant
Grains per
spike
1000 grain
weight (g)
Harvest Index
IGW-3262
WW 14.5 b 9.1 a 55 a 36.8 b 0.57 a
DW 5.3 e 5.2 b 47 a 25.0 d 0.53 b
DD 5.8 de 5.0 b 52 a 22.7 e 0.44 c
Drysdale
WW 21.5 a 9.6 a 50 a 43.6 a 0.58 a
DW 10.6 c 5.1 b 48 a 32.0 c 0.50 b
DD 7.3 d 6.2 b 47 a 24.2 e 0.43 c LSD (genotype × treatment) 1.91 NS NS NS NS LSD (genotype) 1.09 NS NS 3.29 NS LSD (treatment) 1.34 1.34 NS 4.03 0.04
Under WW conditions, both Drysdale and IGW-3262 had nine spikes per plant (P = 0.069).
Spike number was decreased in both genotypes by 45% in the DW and DD treatments
Chapter 4 – Root distribution and stomatal regulation
79
(Table 4.5). Both genotypes averaged 50 grains per spike under all watering treatments (P >
0.05). The 1000-grain weight was 18% higher in Drysdale than in IGW-3262 under WW
conditions (Table 4.5), decreased by 25% in Drysdale and 35% in IGW-3262 in the DW
treatment and was similar in both genotypes in the DD treatment.
Harvest index (HI) was 0.57 in both genotypes under WW conditions (P = 0.76) and
decreased in both genotypes to 0.53 in the DW treatment and 0.43 in the DD treatment
(Table 4.5).
4.4 Discussion
The wheat cultivar Drysdale and the breeding line IGW-3262 differ in how they regulate
stomatal conductance when exposed to terminal drought conditions. When watering was
withheld from either the top segment (DW) or both segments (DD) of the pot, Drysdale
started closing stomata earlier than IGW-3262. Drysdale had a larger leaf area than IGW-
3262, indicating higher transpiration demand, and more root biomass, particularly in the top
segment of the pot, which resulted in slightly earlier and faster soil water depletion than
IGW-3262.
The soil water content in the top soil segment after a marked reduction in gs in Drysdale
was around 60% of pot capacity, while it was only 50% in IGW-3262. Considerably higher
root biomass in the drying top segment in Drysdale may have served as a signal generation
source resulting in relatively higher leaf ABA concentration and subsequent stomatal
closure. Reduced gs associated with an increase in leaf ABA concentration has been
observed in barley leaves when a larger proportion of root system was exposed to drying
soil (Martin-Vertedor and Dodd, 2011).
Chapter 4 – Root distribution and stomatal regulation
80
Increased ABA synthesis in root tissues exposed to drying soil is reportedly the signal for
stomatal closure (Hartung et al., 2002; Speirs et al., 2013). However, it does not seem
possible that increased synthesis of ABA in root tissues in both genotypes served as the
drying signal to initiate stomatal closure in this study, because increased ABA
concentration in root tissues was not detected in response to soil water deficit. This is
supported by the findings of Christmann et al. (2005) in Arabidopsis where no increase in
root ABA was observed under water stress.
Xylem ABA has better control of stomatal conductance than leaf ABA under water stress
in species like maize (Tardieu et al., 1992b). In wheat, xylem sap ABA concentration
increased in response to water stress (Munns and King, 1988; Ali et al., 1998), but a clear
influence on stomatal conductance has not been established (Atkinson et al., 1989; Ali et
al., 1998). In this study, a decline in gs was observed to precede a remarkable increase in
leaf ABA in both genotypes similar to that previously observed in maize (Blackman and
Davies, 1985; Zhang and Davies, 1990a; Tardieu et al., 1992b). This suggests that xylem
ABA may be the driver for the initial gs response to water stress (Zhang and Davies, 1990a;
Tardieu et al., 1992b). It is not clear if ABA synthesised in the root is transported away
from the root through xylem (Slovik et al., 1995; Hartung et al., 2002). An alternative to
root ABA as the source of xylem ABA, is possibly that leaf ABA was translocated to the
roots through phloem (Zeevaart and Boyer, 1984; Slovik et al., 1995; Kudoyarova et al.,
2011) and contributed to high xylem ABA (Hartung et al., 2002). Alkalinisation of xylem
sap due to reduced NO3 uptake may also have contributed to the increased translocation of
leaf ABA into the xylem and leaf apoplast in the absence of de novo synthesis (Gollan et
al., 1992; Schurr et al., 1992; Wilkinson et al., 2007).
The high sensitivity of Drysdale stomata to drying soil signals was not expected since the
anisohydric behaviour described in Chapter 3 was thought to be due to a slow stomatal
Chapter 4 – Root distribution and stomatal regulation
81
response to drying soil (Saradadevi et al., 2014). In Chapter 3, root system was split
vertically into two halves and distribution to both wet and dry compartments was equal at
the time of imposing water stress. The water flow from one-side of the root exposed to wet
soil may have diluted the signal concentration generated by the other half of roots in drying
soil (Tardieu et al., 1992a). However, in the current study more of the root system was
distributed in the top segment. The bulk density of the soil in the bottom segment was
higher than in the top segment and probably sufficient to cause soil compaction (Tardieu et
al., 1992a). Subsoil compaction is common in the Western Australian wheat belt (Dracup
et al., 1992; Chen et al., 2014) and may have restricted root penetration and growth (Hurd,
1968) resulting in less than 20% of the total root biomass distributed in the bottom
segment.
In lupin, when the upper half of the root system was exposed to drying soil, the lower half
provided sufficient water to the shoot to maintain Ψleaf and gs at similar levels to well-
watered plants (Gallardo et al., 1994). In wheat, roots in the deeper layer that comprised
only 3% of the total root biomass was sufficient to supply water to the plant when the top
soil layer dried (Gregory et al., 1978a; Gregory et al., 1978b). However, in this study,
withholding water from the top segment in the DW treatment developed plant water deficit
and reduced gas exchange even though sufficient water was available in the bottom
segment and is similar to the response of faba bean (Abdelhamid et al., 2011) when soil in
the upper half of the root system was dried. Higher soil compaction in the bottom segment
may have restricted soil water extraction (Tardieu et al., 1992a). Similar leaf and gas
exchange in DW and DD treatments supports this assumption. As a result of the soil
compaction in the bottom segment, the experimental procedures described here were
unable to validate the effect of water flow from the bottom roots in the signal perception in
leaves.
Chapter 4 – Root distribution and stomatal regulation
82
The relationship between ABA accumulation in leaves and gs appears to differ between
Drysdale and IGW-3262. In Drysdale, the decline in gs was negatively associated with
increases in ABA content in leaf tissue as observed previously (Saradadevi et al., 2014) and
another wheat genotype by Henson et al. (1989b). In IGW-3262, the relationship between
leaf ABA and gs was weaker and so leaf ABA was discounted as the major driver for
stomatal regulation (Saradadevi et al., 2014). Leaf ABA varied in IGW-3262 in all
watering treatments with sharp declines at 141, 175 and 279 °Cd, indicating that factors
other than soil water status were influencing leaf ABA accumulation. Soil compaction can
trigger ABA accumulation in the leaves; however it is unlikely to cause fluctuation in the
ABA level (Tardieu et al., 1992a). Hence, the variations in leaf ABA concentration may
possibly be caused by environmental factors such as humidity. Exposure to high humidity
has been reported to reduce leaf ABA concentration in Arabidopsis (Okamoto et al., 2009).
ABA level in tissues can be lowered by two alternate pathways: hydrolysis to PA and
conjugation with glucose to form the ester, ABA-GE (Cutler and Krochko, 1999).
Expression of genes favouring breakdown of ABA to PA has been observed under low
VPD conditions in grape vine (Speirs et al., 2013). However, the PA:ABA ratio in IGW-
3262 was relatively constant apart from a peak at 175 °Cd in DW and DD treatments
corresponding to the decline in leaf ABA. When converted to PA, further metabolism to
DPA and other catabolites (Cowan and Railton, 1987; Zhou et al., 2004) suggest that the
PA pool alone does not represent ABA catabolism. However, the PA: ABA ratio was
higher in IGW-3262 than Drysdale indicating that more ABA is metabolised in IGW-3262.
Alternatively, further catabolism of PA to other products may be slow in IGW-3262.
Interestingly, ABA-GE: ABA ratio fluctuated in IGW-3262, and the pattern of fluctuation
was similar to the variation in leaf ABA level, with a higher ratio corresponding to a dip in
ABA level. So, it can be assumed that the reduction in leaf ABA was due to its increased
catabolism to ABA-GE in addition to being converted to PA under DW and DD treatments
Chapter 4 – Root distribution and stomatal regulation
83
and mainly by ABA-GE under WW treatment. Conjugation of ABA with glucose to form
ABA-GE is considered an irreversible process to sequester ABA from the cells (Zeevaart
and Creelman, 1988). Our results suggest that variation in leaf ABA and stomatal
behaviour observed between Drysdale and IGW-3262 are related to the difference in ABA
catabolism. However, with limited data available, a clear conclusion cannot be drawn at
this time.
Grain yield reduced in Drysdale and IGW-3262 consistent with the yield reduction
observed in field grown wheat under terminal drought (Dias de Oliveira et al., 2013). A
similar yield reduction was reported in faba bean when soil in the top segment dried while
that in the bottom segment had sufficient water (Abdelhamid et al., 2011). A reduction in
the number of fertile tillers (tillers with spikes) and poor grain filling, reflected in the lower
1000-grain weight, contributed to this yield reduction. The size of the reduction in grain
yield due to terminal drought in Drysdale was less than IGW-3262 in the DW treatment,
despite root restrictions for extracting water from the bottom segment. Early stomatal
closure in response to the drying top soil may have resulted in more efficient water use in
Drysdale than in IGW-3262 (Sinclair et al., 1984). Conversely, later stomatal closure in
IGW-3262 enabled photosynthesis rates to be maintained, which likely supported the extra
vegetative growth, tiller production and root growth that occurred in IGW-3262 after
anthesis. However, some of these late-formed tillers did not produce a spike or the small
ear failed to fill grains. The yield of Drysdale in the DW treatment was 45% more than in
the DD treatments indicating that roots in the bottom segment made a significant
contribution to the plant water supply. Higher yield in DW than DD treatment was
surprising since physiological response of Drysdale under DW treatment within 300 °Cd
after withholding water from anthesis was not better than DD treatment. The drying signals
from the top roots may have declined or stopped when water flow from those roots
eventually reduced as soil water was exhausted (Dodd et al., 2008a). Alternatively, the
Chapter 4 – Root distribution and stomatal regulation
84
hydraulic conductivity of roots in the bottom segment may have increased in due course to
meet transpiration demand (Vysotskaya et al., 2003; Vysotskaya et al., 2004). In contrast,
IGW-3262 had similar yields in the DW than DD treatments indicating that bottom roots
were not effective in extracting water as in Drysdale. This suggests that Drysdale bottom
roots have better capability to extract water compared to those of IGW-3262, even under
conditions where root growth was restricted. The severe yield reduction and lower HI in
Drysdale and IGW-3262 under the DD treatment arose from a dramatic reduction in 1000-
grain weight reflecting the impact terminal drought has on the grain yield of wheat.
4.5 Conclusions
Initial stomatal closure in the wheat cultivar Drysdale and breeding line IGW-3262 in
response to terminal drought is linked to differences in root density in the upper drying soil
layer and is probably associated with signal strength translocated to the shoot. Drysdale had
more root biomass in the drying top soil layer and initiated stomatal closure earlier than
IGW-3262. Xylem ABA appears to mediate initial stomatal regulation in both genotypes.
Both genotypes clearly differed in their stomatal response to soil water deficit, and also in
their relationship between gs and leaf ABA. The mechanism of this variation is unclear, but
presumably is due to ABA metabolism. In addition to early stomatal closure, Drysdale
seems to be better at extracting water from the bottom segment resulting in a narrower yield
gap than IGW-3262.
Chapter 5 – Stomatal response to exogenous ABA
85
5 Stomatal conductance in response to exogenous application of
abscisic acid to the flag leaves of two wheat genotypes
5.1 Introduction
The regulation of stomatal conductance (gs) to minimise water loss through transpiration in
response to drying soil conserves soil water and facilitates prolonged availability of soil
water to plants. Closing stomata at the end of the season is not generally acceptable as it
reduces photosynthesis. However, keeping stomata open could rapidly exhaust soil water.
For every extra millimetre of water that is used after anthesis, wheat yield increases. Hence,
reducing gs to prolong availability of soil water during grain filling can be rewarding in
wheat production, especially under terminal drought where crops rely on stored soil
moisture. As the soil dries, the root system senses the drying soil and produces and
transport soil drying signals to the shoot. Increased abscisic acid (ABA) concentration in
the leaves leads to stomatal closure in wheat (Henson et al., 1989b), but the relationship
between leaf ABA and gs varies with genotypes. In the vertical split root system (Chapter
3) and horizontally segmented root study (Chapter 4), there was a strong negative
association between leaf ABA and gs in the cultivar Drysdale, while the relationship was
weak in the line IGW-3262. In Chapter 4, a reduction in gs preceded an increase in leaf
ABA suggesting xylem ABA was the possible signal that initiated stomatal closure in both
genotypes (Zhang and Davies, 1990a; Tardieu et al., 1992b). The source of ABA
contributing to xylem ABA is not clear since there was no increase in ABA in the root
tissue in response to drying the soil. This does not necessarily imply that the root is not the
source of increased xylem ABA because synthesised ABA may be transported away from
the root before any apparent increase in concentration. Alternatively, leaf ABA translocated
to xylem through phloem can be a contributor of xylem ABA. In addition, signals other
Chapter 5 – Stomatal response to exogenous ABA
86
than ABA, such as xylem pH (Hartung et al., 1988; Wilkinson and Davies, 1997) and
hydraulic signals (Comstock, 2002) can act as an early signal to initiate stomatal closure.
In addition to the fluctuations in gs observed in IGW-3262 in Chapter 4, leaf ABA also
fluctuated irrespective of drought treatment. However, fluctuations in gs were not in tune
with the fluctuation in leaf ABA resulting in a weak relationship between gs and leaf ABA
in IGW-3262. If stomatal closure is driven by xylem ABA concentration then the
fluctuation in gs in IGW-3262 should be in response to differences in xylem ABA
concentration. Thus, one would expect the stomata in IGW-3262 to be more sensitive to
xylem ABA concentration. On the contrary, stomata in Drysdale closed earlier than IGW-
3262 when soil water was depleted from the top soil layer. Drysdale also demonstrated a
strong relationship between leaf ABA and gs. Therefore, it appears that these genotypes
differ in stomatal sensitivity to xylem ABA, if xylem ABA is the driving force of stomatal
regulation in both genotypes.
To test whether stomata are more sensitive to xylem ABA in IGW-3262 compared with
Drysdale, a leaf feeding experiment was designed. Stomatal conductance was measured on
detached leaves with their cut ends bathed in solutions containing different concentrations
of ABA. A leaf feeding experiment was chosen rather than quantifying ABA concentration
in xylem exudates from roots because collection of sufficient xylem sap volume for ABA
analysis is difficult (Dodd and Davies, 1996) in wheat and barley (Cramer and Lewis,
1993; Munns et al., 1993). In wheat, xylem sap has been collected in limited studies,
mainly from seedlings, either by pressurizing the whole root system in a pressure chamber
(Munns et al., 1993) or by exudation (Ali et al., 1998; Vysotskaya et al., 2003). Neither of
these methods produced adequate sap volume for analysis in drought stressed wheat in
preliminary tests for this study. Additional objectives were to identify if stomatal sensitivity
varies with (i) soil water status or (ii) pH of xylem sap.
Chapter 5 – Stomatal response to exogenous ABA
87
5.2 Materials and methods
The cultivar Drysdale and the breeding line IGW-3262 were grown in pots in an
evaporative-cooled glasshouse at UWA from June to October 2013. Ninety six plastic pots
of 0.24 m diameter were filled to a depth of 0.30 m with soil. The soil was a 3:2 mixture of
soil and sand as described in detail in Chapter 3. The pot soil water capacity (PSWC) of
each pot was determined by weighing the pot after 48 hours of saturation. Two pre-
germinated seeds were planted in each pot. Pots were maintained at 90% PSWC until
anthesis to prevent anaerobic conditions due to the clayey texture of soil. At anthesis,
watering was withheld from two-thirds of the pots, while the remaining pots were
maintained at 90% PSWC. In order to avoid fluctuations in gs due to atmospheric
conditions such as VPD as observed in Chapter 4, plants were moved to a controlled
environment room the day before measurements. The environmental conditions were set
similar to average conditions in the glasshouse and light intesity under which similar
bioassays were conducted (Munns and King, 1988; Zhang and Davies, 1991; Munns, 1992;
Munns et al., 1993).
The walk-in controlled environment room (interior capacity 16 m3) was maintained at
22/12 °C day/night temperature, 65 ± 5% relative humidity (RH) and 12 hour daylight
intensity of 300 µmol m–2 s–1 photosynthetically active radiation at canopy level. Lighting
was provided through metal halide lamps (Eye Lighting, Multi-Ace, MF 1000W BUH,
Tokyo, Japan) and was regulated diurnally. Air temperature was regulated by refrigerative
cooling and electric element heaters. Required humidity levels were maintained using
steam injection and dehumidification (Munters, Sweden). Airflow was distributed
downward uniformly.
Chapter 5 – Stomatal response to exogenous ABA
88
5.2.1 Measurements
Measurements were taken when half of the pots from which water was withheld reached
50% PSWC and the other half 25% PSWC. Stomatal conductance (gs), instantaneous
transpiration rate and photosynthetic rate in flag leaves on the main stem from both
genotypes under well-watered and water deficit conditions were measured. Measurements
were made with a LI-COR gas exchange system (LI-6400, LI-COR Biosciences, Nebraska,
USA) with LED light source on the leaf chamber, between 10 and 11 am. CO2
concentration in the LI-COR cuvette was set to 380 ppm and LED light intensity 300 μmol
m–2 s–1, equivalent to the leaf-level light intensity in the controlled environment room. Leaf
water potential (leaf) was measured on the penultimate leaf on the main stem using a
Scholander pressure chamber (model 1000, PMS Instrument Co., Oregon, USA).
Immediately after measuring gs, flag leaves were detached from the main stem by cutting
under water to avoid embolism. The cut ends of the detached leaves were placed in pre-
weighed plastic vials containing 10 ml of solution with or without ABA. ABA solutions
were prepared using reagent grade (±)-ABA (Sigma-Aldrich, St Louis, USA) dissolved in
methanol and diluted to concentrations of 10–6 M, 10–7 M or 10–8 M. To test sensitivity
changes in response to pH, ABA solutions were buffered to pH 6 and 7 using 10 mM
solutions of the organic buffers MES (pH 6) or HEPES (pH 7), respectively. These buffers
have been used previously in exogenous ABA feeding trials with different plant species
(Guerrero and Mullet, 1986; Lee et al., 1990; Trejo et al., 1993; Schwartz et al., 1994). To
avoid direct light, vials were covered with aluminium foil and sealed with insulation tape.
Four leaves for each ABA concentration were used as replications. One replication was
measured per day for each genotype and same procedure was repeated for remaining three
replicates on consecutive days (Figure 5.1). The vials with leaves were kept at leaf-level
height of intact plants in the controlled environment room for 2 hours. After 2 hours, gs of
the leaves was measured, final weight of vials was recorded and leaf was measured. Soon
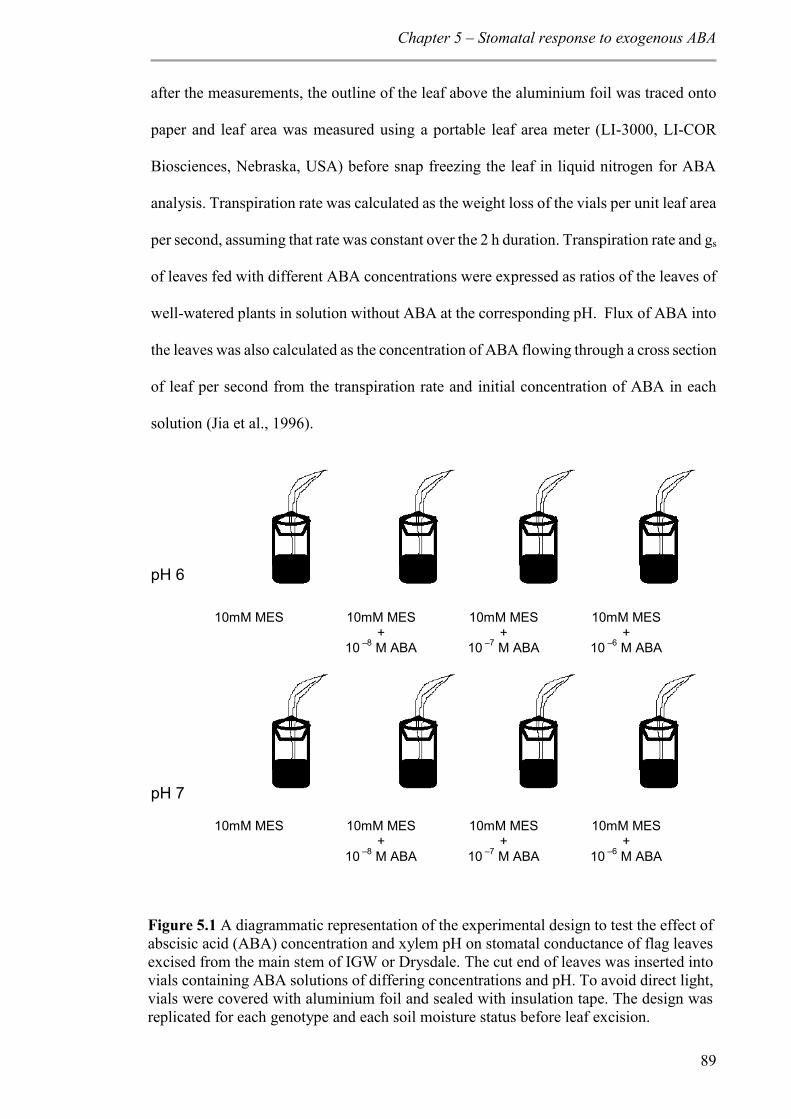
Chapter 5 – Stomatal response to exogenous ABA
89
after the measurements, the outline of the leaf above the aluminium foil was traced onto
paper and leaf area was measured using a portable leaf area meter (LI-3000, LI-COR
Biosciences, Nebraska, USA) before snap freezing the leaf in liquid nitrogen for ABA
analysis. Transpiration rate was calculated as the weight loss of the vials per unit leaf area
per second, assuming that rate was constant over the 2 h duration. Transpiration rate and gs
of leaves fed with different ABA concentrations were expressed as ratios of the leaves of
well-watered plants in solution without ABA at the corresponding pH. Flux of ABA into
the leaves was also calculated as the concentration of ABA flowing through a cross section
of leaf per second from the transpiration rate and initial concentration of ABA in each
solution (Jia et al., 1996).
pH 6
pH 7
10mM MES 10mM MES
+ 10 –8 M ABA
10mM MES +
10 –7 M ABA
10mM MES +
10 –6 M ABA
10mM MES 10mM MES
+ 10 –8 M ABA
10mM MES +
10 –7 M ABA
10mM MES +
10 –6 M ABA
Figure 5.1 A diagrammatic representation of the experimental design to test the effect of abscisic acid (ABA) concentration and xylem pH on stomatal conductance of flag leaves excised from the main stem of IGW or Drysdale. The cut end of leaves was inserted into vials containing ABA solutions of differing concentrations and pH. To avoid direct light, vials were covered with aluminium foil and sealed with insulation tape. The design was replicated for each genotype and each soil moisture status before leaf excision.
Chapter 5 – Stomatal response to exogenous ABA
90
5.2.2 ABA analysis
ABA analysis was carried out by liquid chromatography/mass spectrometry (LC-MS/MS)
as per the protocol of Speirs et al. (2013) and described in Chapter 3. Briefly, ABA and its
catabolites, phaseic acid (PA), dihydrophaseic acid (DPA) and glucose ester (ABA-GE),
were separated from ground leaf tissue extracts using Phenomenex SPE columns at 40 °C.
The separated samples were eluted with acetonitrile and compounds were identified by
retention times and multiple reaction monitoring.
5.2.3 Statistical analysis
Gas exchange measurements in intact flag leaves just before detachment were analysed by
performing two-way ANOVA using the statistical software R 2.14.0 (R Development Core
Team, 2011). Mean values of flag leaves of two plants grown per pot were considered a
single replication and there were 16 replications for each treatment.
For the ABA feeding part of the study, a three way ANOVA was carried out separately for
two genotypes with PSWC treatments, ABA concentrations and pH as main factors.
Separate analysis was carried out for each genotype as gs in IGW-3262 was reduced even in
control solution (See section 5.3.2). Ratio data were transformed logarithmically, wherever
necessary, to satisfy the requirements of normal distribution and equality of variance for
ANOVA. For leaf ABA, a three way ANOVA was carried out with genotypes, PSWC
treatments and ABA concentrations as main factors. Multiple comparisons were done by
LSD test.
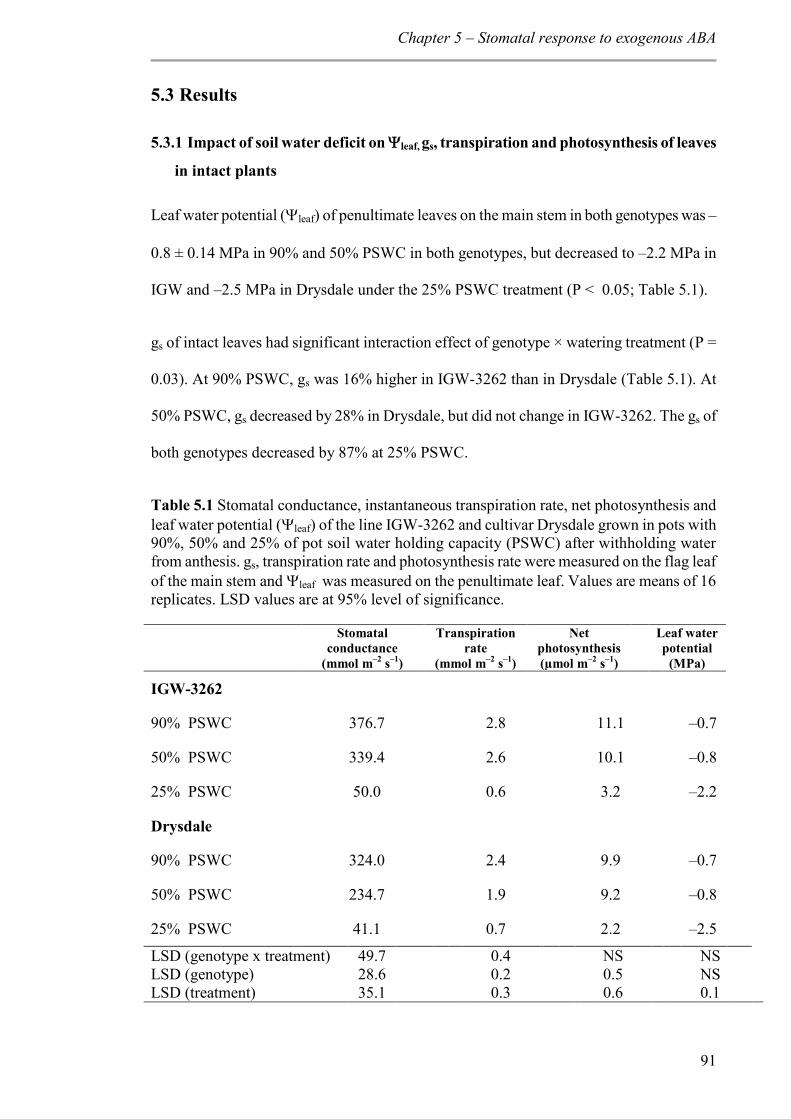
Chapter 5 – Stomatal response to exogenous ABA
91
5.3 Results
5.3.1 Impact of soil water deficit on leaf, gs, transpiration and photosynthesis of leaves
in intact plants
Leaf water potential (leaf) of penultimate leaves on the main stem in both genotypes was –
0.8 ± 0.14 MPa in 90% and 50% PSWC in both genotypes, but decreased to –2.2 MPa in
IGW and –2.5 MPa in Drysdale under the 25% PSWC treatment (P < 0.05; Table 5.1).
gs of intact leaves had significant interaction effect of genotype × watering treatment (P =
0.03). At 90% PSWC, gs was 16% higher in IGW-3262 than in Drysdale (Table 5.1). At
50% PSWC, gs decreased by 28% in Drysdale, but did not change in IGW-3262. The gs of
both genotypes decreased by 87% at 25% PSWC.
Table 5.1 Stomatal conductance, instantaneous transpiration rate, net photosynthesis and leaf water potential (leaf) of the line IGW-3262 and cultivar Drysdale grown in pots with 90%, 50% and 25% of pot soil water holding capacity (PSWC) after withholding water from anthesis. gs, transpiration rate and photosynthesis rate were measured on the flag leaf of the main stem and leaf was measured on the penultimate leaf. Values are means of 16 replicates. LSD values are at 95% level of significance.
Stomatal conductance
(mmol m–2 s–1)
Transpiration rate
(mmol m–2 s–1)
Net photosynthesis (µmol m–2 s–1)
Leaf water potential
(MPa)
IGW-3262
90% PSWC 376.7 2.8 11.1 –0.7
50% PSWC 339.4 2.6 10.1 –0.8
25% PSWC 50.0 0.6 3.2 –2.2
Drysdale
90% PSWC 324.0 2.4 9.9 –0.7
50% PSWC 234.7 1.9 9.2 –0.8
25% PSWC 41.1 0.7 2.2 –2.5
LSD (genotype x treatment) 49.7 0.4 NS NS LSD (genotype) 28.6 0.2 0.5 NS LSD (treatment) 35.1 0.3 0.6 0.1
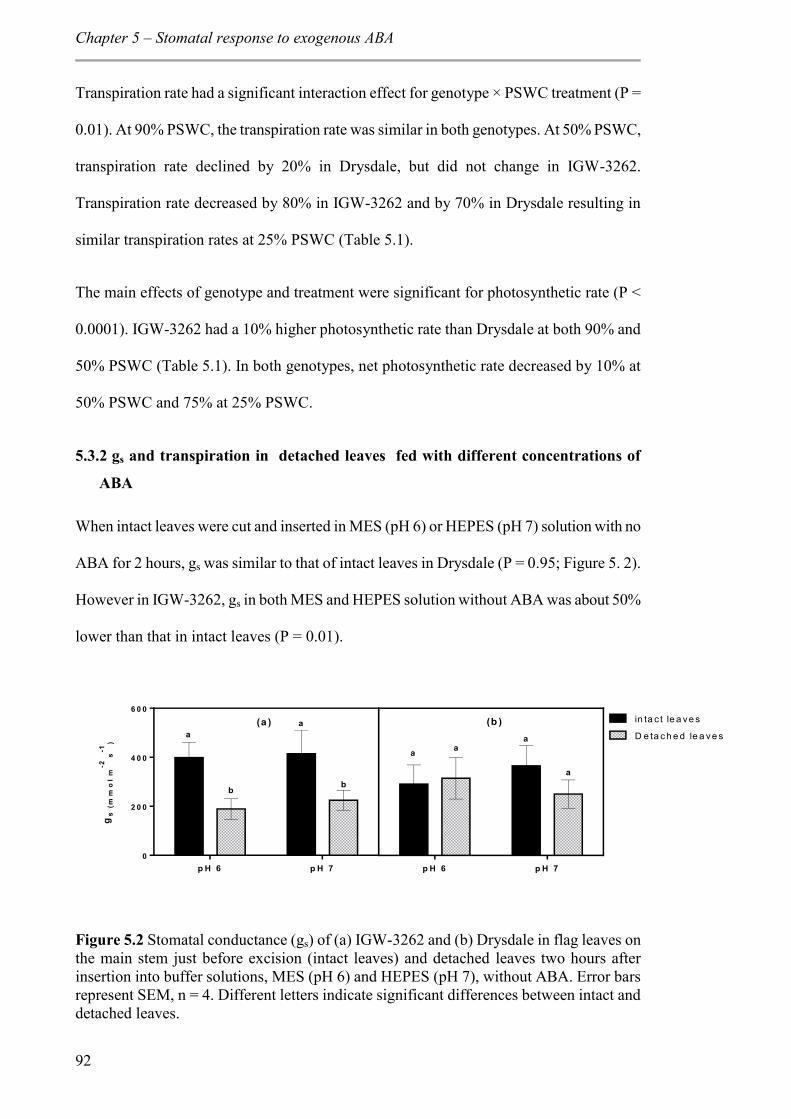
Chapter 5 – Stomatal response to exogenous ABA
92
Transpiration rate had a significant interaction effect for genotype × PSWC treatment (P =
0.01). At 90% PSWC, the transpiration rate was similar in both genotypes. At 50% PSWC,
transpiration rate declined by 20% in Drysdale, but did not change in IGW-3262.
Transpiration rate decreased by 80% in IGW-3262 and by 70% in Drysdale resulting in
similar transpiration rates at 25% PSWC (Table 5.1).
The main effects of genotype and treatment were significant for photosynthetic rate (P <
0.0001). IGW-3262 had a 10% higher photosynthetic rate than Drysdale at both 90% and
50% PSWC (Table 5.1). In both genotypes, net photosynthetic rate decreased by 10% at
50% PSWC and 75% at 25% PSWC.
5.3.2 gs and transpiration in detached leaves fed with different concentrations of
ABA
When intact leaves were cut and inserted in MES (pH 6) or HEPES (pH 7) solution with no
ABA for 2 hours, gs was similar to that of intact leaves in Drysdale (P = 0.95; Figure 5. 2).
However in IGW-3262, gs in both MES and HEPES solution without ABA was about 50%
lower than that in intact leaves (P = 0.01).
p H 6 p H 70
2 0 0
4 0 0
6 0 0
gs
(m
mo
l m
-2 s
-1)
p H 6 p H 7
in ta c t le a ve s
D e ta c h e d le a v e s(a ) (b )
a
b
a
b
a aa
a
Figure 5.2 Stomatal conductance (gs) of (a) IGW-3262 and (b) Drysdale in flag leaves on the main stem just before excision (intact leaves) and detached leaves two hours after insertion into buffer solutions, MES (pH 6) and HEPES (pH 7), without ABA. Error bars represent SEM, n = 4. Different letters indicate significant differences between intact and detached leaves.
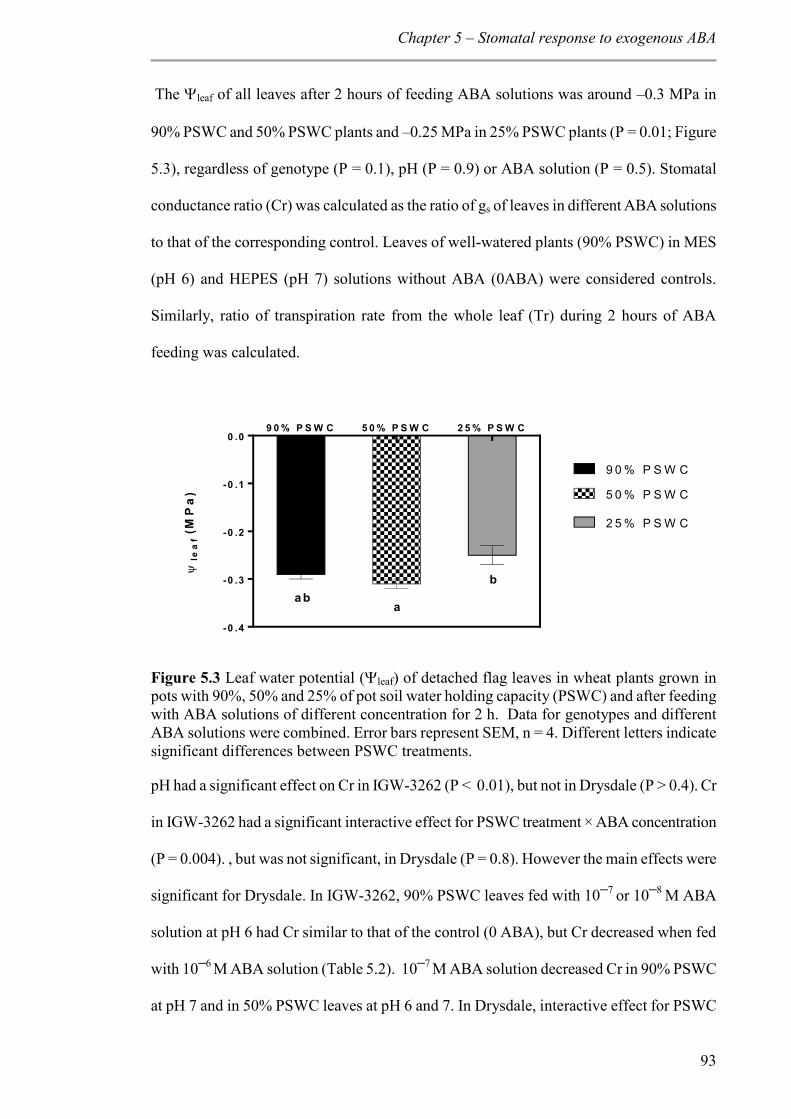
Chapter 5 – Stomatal response to exogenous ABA
93
The leaf of all leaves after 2 hours of feeding ABA solutions was around –0.3 MPa in
90% PSWC and 50% PSWC plants and –0.25 MPa in 25% PSWC plants (P = 0.01; Figure
5.3), regardless of genotype (P = 0.1), pH (P = 0.9) or ABA solution (P = 0.5). Stomatal
conductance ratio (Cr) was calculated as the ratio of gs of leaves in different ABA solutions
to that of the corresponding control. Leaves of well-watered plants (90% PSWC) in MES
(pH 6) and HEPES (pH 7) solutions without ABA (0ABA) were considered controls.
Similarly, ratio of transpiration rate from the whole leaf (Tr) during 2 hours of ABA
feeding was calculated.
9 0 % P S W C 5 0 % P S W C 2 5 % P S W C
-0 .4
-0 .3
-0 .2
-0 .1
0 .0
le
af
(MP
a)
9 0 % P S W C
5 0 % P S W C
2 5 % P S W C
aa b
b
Figure 5.3 Leaf water potential (leaf) of detached flag leaves in wheat plants grown in pots with 90%, 50% and 25% of pot soil water holding capacity (PSWC) and after feeding with ABA solutions of different concentration for 2 h. Data for genotypes and different ABA solutions were combined. Error bars represent SEM, n = 4. Different letters indicate significant differences between PSWC treatments.
pH had a significant effect on Cr in IGW-3262 (P < 0.01), but not in Drysdale (P > 0.4). Cr
in IGW-3262 had a significant interactive effect for PSWC treatment × ABA concentration
(P = 0.004). , but was not significant, in Drysdale (P = 0.8). However the main effects were
significant for Drysdale. In IGW-3262, 90% PSWC leaves fed with 10─7 or 10─8 M ABA
solution at pH 6 had Cr similar to that of the control (0 ABA), but Cr decreased when fed
with 10─6 M ABA solution (Table 5.2). 10─7 M ABA solution decreased Cr in 90% PSWC
at pH 7 and in 50% PSWC leaves at pH 6 and 7. In Drysdale, interactive effect for PSWC
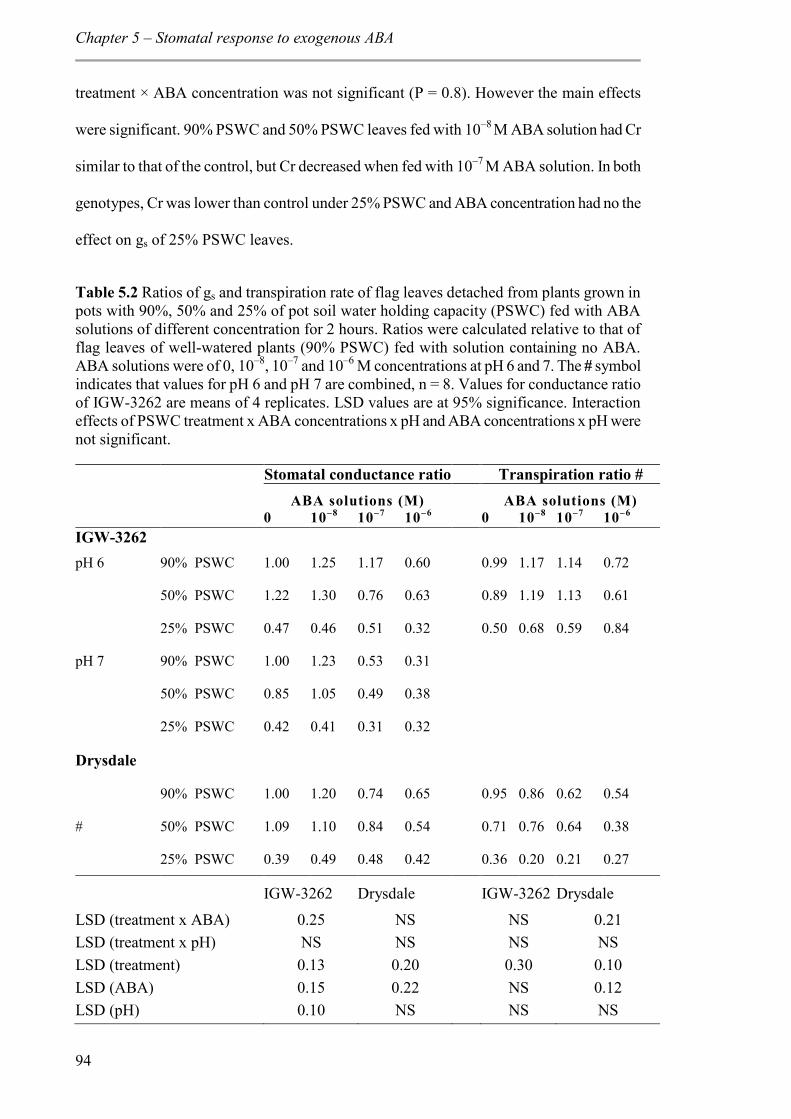
Chapter 5 – Stomatal response to exogenous ABA
94
treatment × ABA concentration was not significant (P = 0.8). However the main effects
were significant. 90% PSWC and 50% PSWC leaves fed with 10–8 M ABA solution had Cr
similar to that of the control, but Cr decreased when fed with 10–7 M ABA solution. In both
genotypes, Cr was lower than control under 25% PSWC and ABA concentration had no the
effect on gs of 25% PSWC leaves.
Table 5.2 Ratios of gs and transpiration rate of flag leaves detached from plants grown in pots with 90%, 50% and 25% of pot soil water holding capacity (PSWC) fed with ABA solutions of different concentration for 2 hours. Ratios were calculated relative to that of flag leaves of well-watered plants (90% PSWC) fed with solution containing no ABA. ABA solutions were of 0, 10–8, 10–7 and 10–6 M concentrations at pH 6 and 7. The # symbol indicates that values for pH 6 and pH 7 are combined, n = 8. Values for conductance ratio of IGW-3262 are means of 4 replicates. LSD values are at 95% significance. Interaction effects of PSWC treatment x ABA concentrations x pH and ABA concentrations x pH were not significant.
Stomatal conductance ratio Transpiration ratio # ABA solutions (M) ABA solutions (M) 0 10–8 10–7 10–6 0 10–8 10–7 10–6 IGW-3262 pH 6 90% PSWC 1.00 1.25 1.17 0.60 0.99 1.17 1.14 0.72
50% PSWC 1.22 1.30 0.76 0.63 0.89 1.19 1.13 0.61
25% PSWC 0.47 0.46 0.51 0.32 0.50 0.68 0.59 0.84
pH 7 90% PSWC 1.00 1.23 0.53 0.31
50% PSWC 0.85 1.05 0.49 0.38
25% PSWC 0.42 0.41 0.31 0.32
Drysdale
90% PSWC 1.00 1.20 0.74 0.65 0.95 0.86 0.62 0.54
# 50% PSWC 1.09 1.10 0.84 0.54 0.71 0.76 0.64 0.38
25% PSWC 0.39 0.49 0.48 0.42 0.36 0.20 0.21 0.27
IGW-3262 Drysdale IGW-3262 Drysdale
LSD (treatment x ABA) 0.25 NS NS 0.21 LSD (treatment x pH) NS NS NS NS LSD (treatment) 0.13 0.20 0.30 0.10 LSD (ABA) 0.15 0.22 NS 0.12 LSD (pH) 0.10 NS NS NS
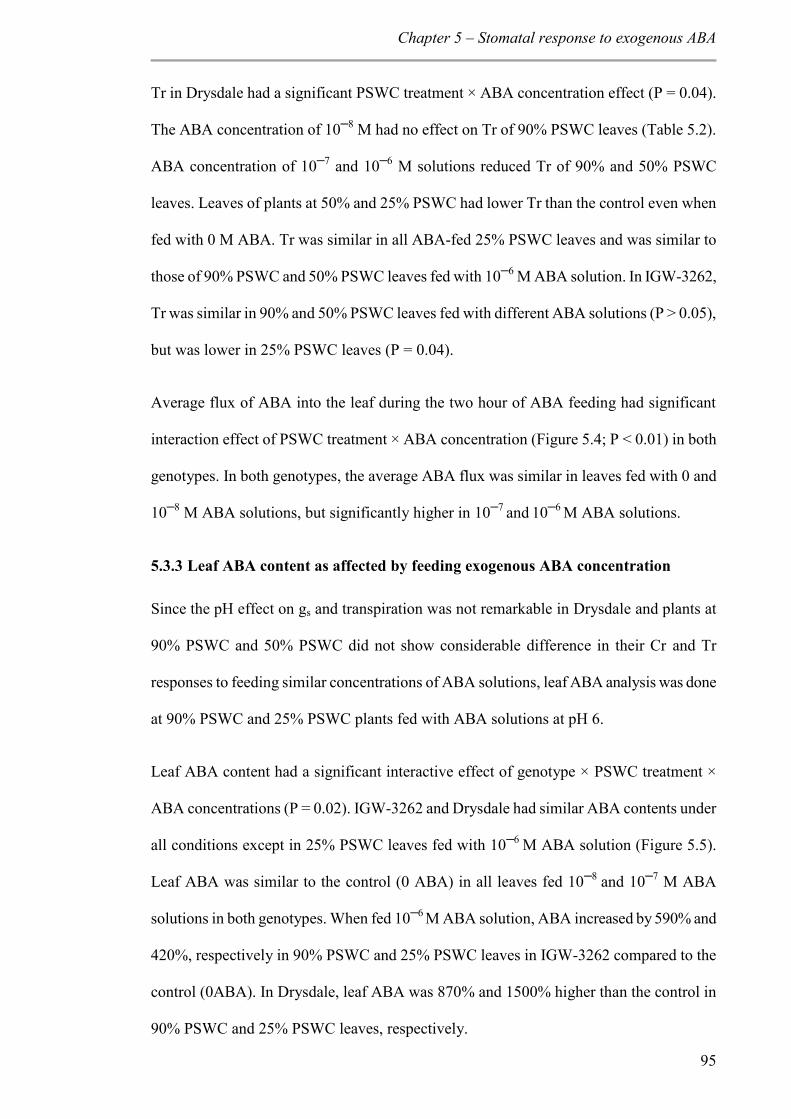
Chapter 5 – Stomatal response to exogenous ABA
95
Tr in Drysdale had a significant PSWC treatment × ABA concentration effect (P = 0.04).
The ABA concentration of 10─8 M had no effect on Tr of 90% PSWC leaves (Table 5.2).
ABA concentration of 10─7 and 10─6 M solutions reduced Tr of 90% and 50% PSWC
leaves. Leaves of plants at 50% and 25% PSWC had lower Tr than the control even when
fed with 0 M ABA. Tr was similar in all ABA-fed 25% PSWC leaves and was similar to
those of 90% PSWC and 50% PSWC leaves fed with 10─6 M ABA solution. In IGW-3262,
Tr was similar in 90% and 50% PSWC leaves fed with different ABA solutions (P > 0.05),
but was lower in 25% PSWC leaves (P = 0.04).
Average flux of ABA into the leaf during the two hour of ABA feeding had significant
interaction effect of PSWC treatment × ABA concentration (Figure 5.4; P < 0.01) in both
genotypes. In both genotypes, the average ABA flux was similar in leaves fed with 0 and
10─8 M ABA solutions, but significantly higher in 10─7 and 10─6 M ABA solutions.
5.3.3 Leaf ABA content as affected by feeding exogenous ABA concentration
Since the pH effect on gs and transpiration was not remarkable in Drysdale and plants at
90% PSWC and 50% PSWC did not show considerable difference in their Cr and Tr
responses to feeding similar concentrations of ABA solutions, leaf ABA analysis was done
at 90% PSWC and 25% PSWC plants fed with ABA solutions at pH 6.
Leaf ABA content had a significant interactive effect of genotype × PSWC treatment ×
ABA concentrations (P = 0.02). IGW-3262 and Drysdale had similar ABA contents under
all conditions except in 25% PSWC leaves fed with 10─6 M ABA solution (Figure 5.5).
Leaf ABA was similar to the control (0 ABA) in all leaves fed 10─8 and 10─7 M ABA
solutions in both genotypes. When fed 10─6 M ABA solution, ABA increased by 590% and
420%, respectively in 90% PSWC and 25% PSWC leaves in IGW-3262 compared to the
control (0ABA). In Drysdale, leaf ABA was 870% and 1500% higher than the control in
90% PSWC and 25% PSWC leaves, respectively.
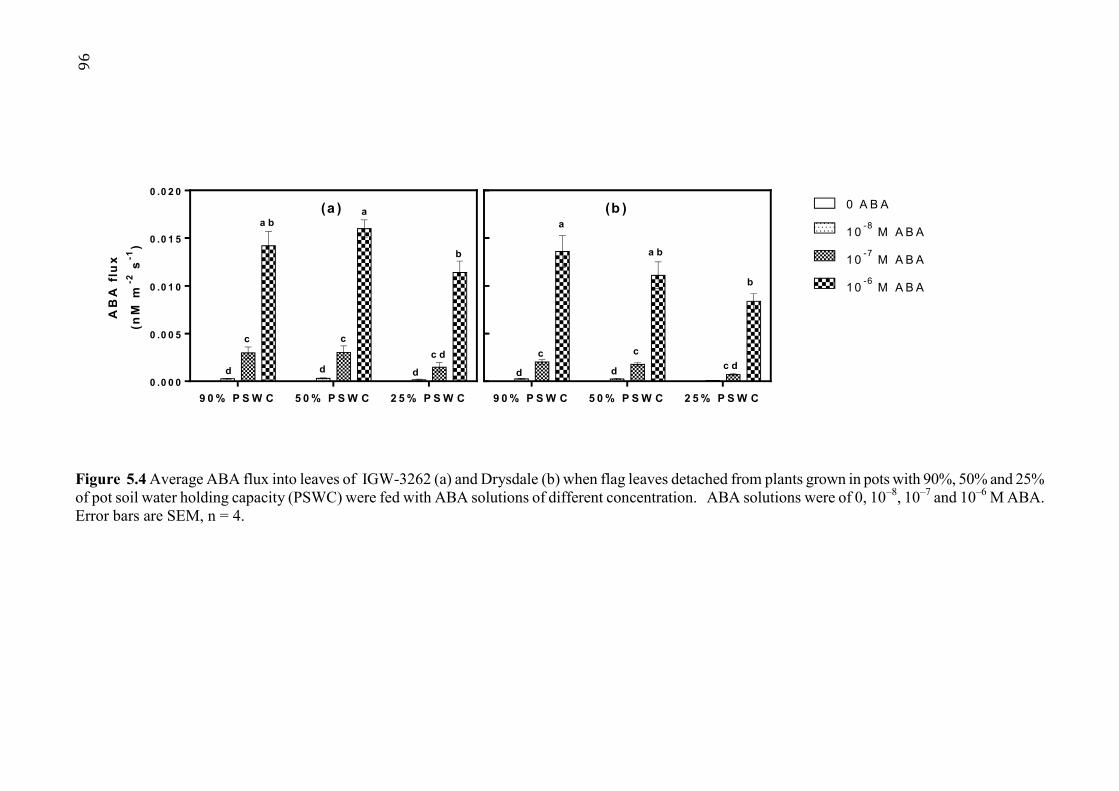
96
9 0 % P S W C 5 0 % P S W C 2 5 % P S W C0 .0 0 0
0 .0 0 5
0 .0 1 0
0 .0 1 5
0 .0 2 0
AB
A f
lux
(nM
m-2
s-1
)
9 0 % P S W C 5 0 % P S W C 2 5 % P S W C
0 A B A
10 -8 M A B A
10 -7 M A B A
10 -6 M A B A
(a ) (b )a b
a
b
c dcc
d d d d d c d
a
a b
b
cc
Figure 5.4 Average ABA flux into leaves of IGW-3262 (a) and Drysdale (b) when flag leaves detached from plants grown in pots with 90%, 50% and 25% of pot soil water holding capacity (PSWC) were fed with ABA solutions of different concentration. ABA solutions were of 0, 10–8, 10–7 and 10–6 M ABA. Error bars are SEM, n = 4.
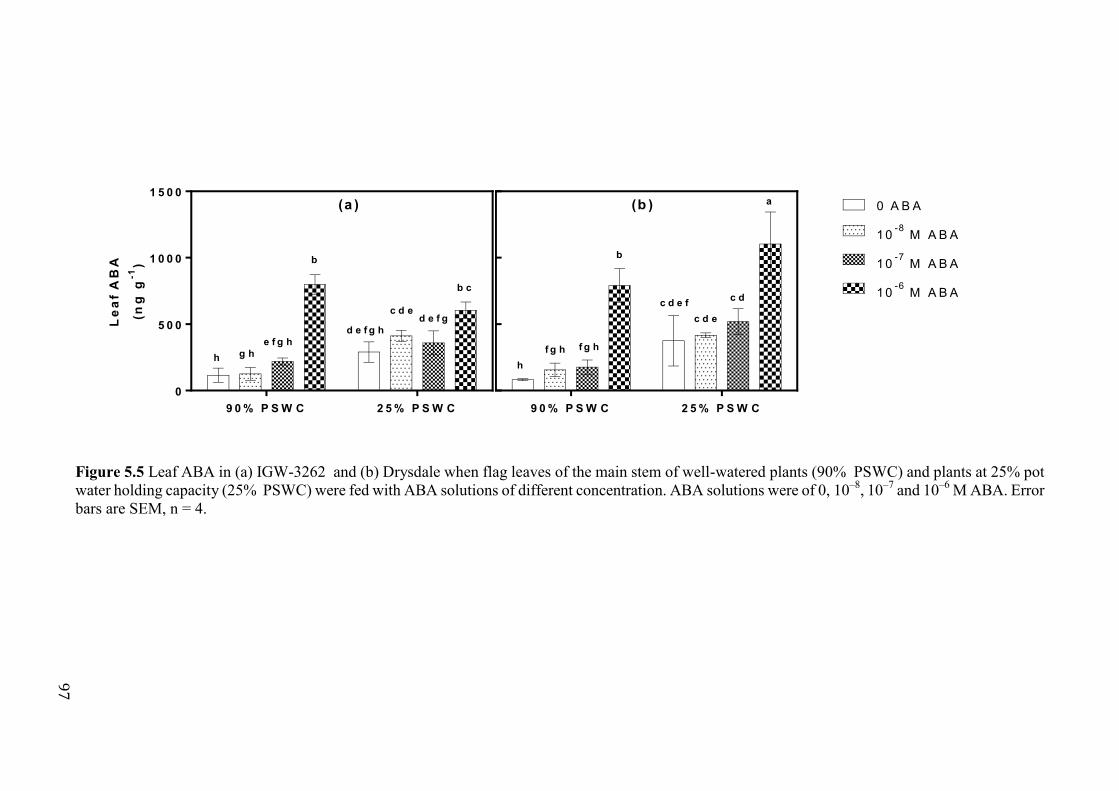
97
9 0 % P S W C 2 5 % P S W C0
5 0 0
1 0 0 0
1 5 0 0
Le
af
AB
A
(ng
g-1
)
9 0 % P S W C 2 5 % P S W C
0 A B A
10 -7 M A B A
10 -6 M A B A
10 -8 M A B A
(a ) (b ) a
bb
b cc d
c d ec d e
d e f gd e f g h
e f g hg hh
hf g h f g h
c d e f
Figure 5.5 Leaf ABA in (a) IGW-3262 and (b) Drysdale when flag leaves of the main stem of well-watered plants (90% PSWC) and plants at 25% pot water holding capacity (25% PSWC) were fed with ABA solutions of different concentration. ABA solutions were of 0, 10–8, 10–7 and 10–6 M ABA. Error bars are SEM, n = 4.
Chapter 5 – Stomatal response to exogenous ABA
98
There was a significant PSWC treatment × ABA concentration interaction effect on phaseic
acid (PA) content (P < 0.001), but no significant difference between genotypes (P = 0.6).
PA was similar to the control in 90% PSWC leaves fed with 10─7 and 10─8 M ABA
solutions, but increased by 250 to 400% when fed 10─6 M ABA (Table 5.3). PA content in
25% PSWC leaves in all ABA solutions was similar. The ratio of PA to ABA was higher
in 25% PSWC leaves than 90% PSWC leaves. The ratio increased with ABA concentration
of 10─6 M, but was similar to the control in 10─7 and 10─8 M ABA (Table 5.3).
Table 5.3 Accumulation of ABA metabolite, PA and molar ratio of PA to ABA in the flag leaves of plants were grown in pots with 90%, 50% and 25% of pot soil water holding capacity (PSWC) when fed with ABA solutions of different concentration. ABA solutions were of 0, 10–8, 10–7 and 10–6 M ABA. Values are means of four replicates. LSD values are at 95% level of significance.
There was a significant genotype × PSWC treatment (P < 0.001) interaction effect on leaf
ABA-GE content. Drysdale had lower ABA-GE content than IGW-3262 at 90% PSWC and
25 % PSWC (Table 5.4). ABA-GE increased in the 25% PSWC leaves by 150% in
Drysdale and 210% in IGW-3262 compared to that in 90% PSWC leaves. Genotype ×
PA (ng g–1) PA : ABA ABA solutions (M) ABA solutions (M)
0 10–8 10–7 10–6 0 10–8 10–7 10–6
IGW-3262
90% PSWC 49.8 40.3 54.5 173.5 0.4 0.4 0.3 0.2
25% PSWC 1038.3 1151.3 1117.3 1181.3 3.1 2.7 3.2 1.9
Drysdale
90% PSWC 34.3 58.7 66.0 182.3 0.4 0.5 0.4 0.2
25% PSWC 886.3 1223.5 1471.3 1395 2.5 2.8 2.8 1.1
LSD (genotype x treatment x ABA) NS NS LSD (genotypes x treatment) NS NS LSD (genotype x ABA) NS NS LSD (treatment x ABA ) 2.6 NS LSD (genotype) NS NS LSD (treatment) 1.6 0.3 LSD (ABA) 2.0 0.4
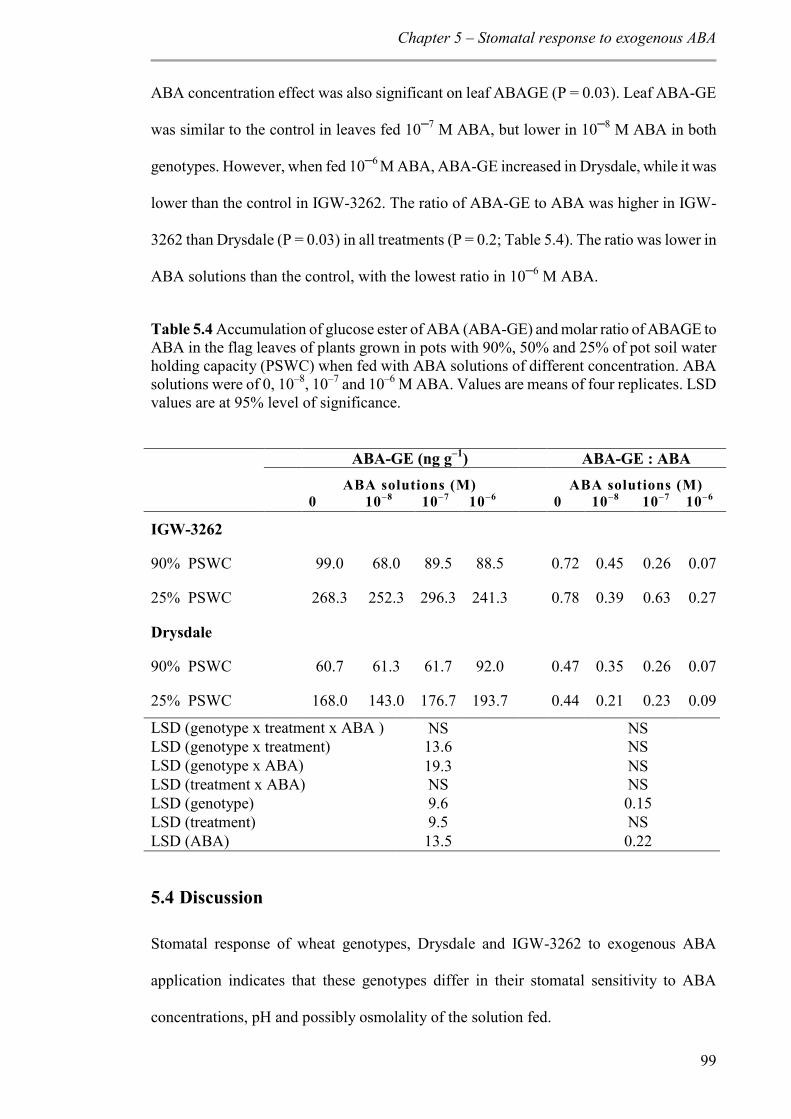
Chapter 5 – Stomatal response to exogenous ABA
99
ABA concentration effect was also significant on leaf ABAGE (P = 0.03). Leaf ABA-GE
was similar to the control in leaves fed 10─7 M ABA, but lower in 10─8 M ABA in both
genotypes. However, when fed 10─6 M ABA, ABA-GE increased in Drysdale, while it was
lower than the control in IGW-3262. The ratio of ABA-GE to ABA was higher in IGW-
3262 than Drysdale (P = 0.03) in all treatments (P = 0.2; Table 5.4). The ratio was lower in
ABA solutions than the control, with the lowest ratio in 10─6 M ABA.
Table 5.4 Accumulation of glucose ester of ABA (ABA-GE) and molar ratio of ABAGE to ABA in the flag leaves of plants grown in pots with 90%, 50% and 25% of pot soil water holding capacity (PSWC) when fed with ABA solutions of different concentration. ABA solutions were of 0, 10–8, 10–7 and 10–6 M ABA. Values are means of four replicates. LSD values are at 95% level of significance.
5.4 Discussion
Stomatal response of wheat genotypes, Drysdale and IGW-3262 to exogenous ABA
application indicates that these genotypes differ in their stomatal sensitivity to ABA
concentrations, pH and possibly osmolality of the solution fed.
ABA-GE (ng g–1) ABA-GE : ABA ABA solutions (M) ABA solutions (M) 0 10–8 10–7 10–6 0 10–8 10–7 10–6
IGW-3262
90% PSWC 99.0 68.0 89.5 88.5 0.72 0.45 0.26 0.07
25% PSWC 268.3 252.3 296.3 241.3 0.78 0.39 0.63 0.27
Drysdale
90% PSWC 60.7 61.3 61.7 92.0 0.47 0.35 0.26 0.07
25% PSWC 168.0 143.0 176.7 193.7 0.44 0.21 0.23 0.09
LSD (genotype x treatment x ABA ) NS NS LSD (genotype x treatment) 13.6 NS LSD (genotype x ABA) 19.3 NS LSD (treatment x ABA) NS NS LSD (genotype) 9.6 0.15 LSD (treatment) 9.5 NS LSD (ABA) 13.5 0.22
Chapter 5 – Stomatal response to exogenous ABA
100
5.4.1 Exogenous ABA concentration higher than that found in xylem sap of water-
stressed wheat plants is required to affect similar stomatal closure.
gs and transpiration rate of intact flag leaves of IGW-3262 did not decline at 50% PSWC,
but declined in Drysdale by 28% confirming the observation in Chapter 4 that Drysdale is
more sensitive to soil water deficit than IGW-3262. This reduction in gs may be in response
to increased xylem ABA concentration (Tardieu et al., 1992b). The ABA concentration in
the xylem sap of wheat exposed to drought that closed stomata was 10 –8 M ABA (Munns
et al., 1993). One would expect that at 50% PSWC leaves of Drysdale to maintain reduced
gs when fed 10─8 M ABA solution. On the contrary, 10─8M ABA solution maintained
similar Cr and Tr values to control plants, but a higher concentration of 10─7M ABA
solution could reduce Cr of 50% PSWC leaves similar to intact leaves. An ABA
concentration as high as 10–6 M was required to reduce stomatal conductance (Cr) and
transpiration rate (Tr) of well watered (90% PSWC) and 50% PSWC plants to values
similar to that of 25% PSWC plants. This is in accordance with the observations of Munns
et al. (1993) on the transpiration effect when exogenous ABA solution was fed to wheat
plants.
The lack of reduction in transpiration rate and gs when plants were fed with concentrations
of ABA similar to those found in xylem sap of wheat under water-stress was not due to
increased sequestration of ABA to leaf tissues or increased ABA metabolism (Trejo et al.,
1993); leaf ABA and the ABA metabolites PA and ABA-GE were not remarkably higher
than control in leaves fed with ABA solution of 10─8 M concentrations. The increased leaf
due to ABA feeding may have reduced the stomatal sensitivity to ABA concentration and
altered the gs response to ABA concentration (Tardieu et al., 1993). Thus, it appears that
stomatal closure is a function of ABA concentration in the xylem sap as well as hydration
status of the leaves (Tardieu and Davies, 1992). Alternatively, stomatal response may be a
function of ABA flux through the xylem (Raschke, 1975). ABA flux in Drysdale in 10─8 M
Chapter 5 – Stomatal response to exogenous ABA
101
ABA solution was similar to the control. As the ABA concentration increased to 10─6 M, gs
decreased to a level similar to gs in plants under 25% PSWC. Leaf ABA also increased,
even though ABA metabolism increased with increasing concentration of ABA (Jia et al.,
1996). Considering the ABA flux of 0.01 nM ABA m─2 s─1 in leaves fed 10─6 M solution,
and assuming that ABA reaching the leaves was segregated into leaf tissue, the average
ABA that could accumulate in leaf tissue is approximately 380 ng g─1. Leaf ABA content
of flag leaves fed with 0 ABA solution was considered as the initial leaf ABA content
before feeding ABA solutions. Thus, the maximum leaf ABA content expected on leaves
fed 10─6 M is around 500 ng g─1. However, the leaf ABA content in 10─6 M ABA-fed
leaves was 100% higher than expected. Moreover, this accumulated leaf ABA is above that
which is rapidly metabolised to PA and ABA-GE. In species like commelina and maize,
ABA fed through xylem rapidly metabolised within 45 minutes of feeding (Jia et al., 1996).
It is reasonable, therefore, to assume that elevated leaf ABA content in the flag leaves fed
with 10─6 M ABA resulted from increased leaf ABA synthesis. Increased ABA synthesis,
despite leaf as high as –0.3 MPa, suggests that lower leaf to trigger ABA synthesis in
leaves (Henson, 1985) is not always essential.
5.4.2 Effect of pH of the solution on gs and transpiration
Stomata in IGW-3262 appear to be more sensitive to factors other than ABA concentration,
including pH of the solution. As the pH of the feeding solution increased from 6 to 7, gs
decreased indicating that there was an effect of pH on gs in IGW-3262. This is consistent
with the findings in maize (Bahrun et al., 2002), Commelina communis (Wilkinson and
Davies, 1997) and capsicum (Dodd et al., 2003), where a rise in xylem pH induced stomatal
closure. However, a rise in xylem pH alone (without ABA) did not initiate a reduction in
transpiration in tomato leaves (Wilkinson et al., 1998). Similarly, there was no reduction in
gs in Drysdale when the pH of the solution increased with or without the presence of ABA.
Chapter 5 – Stomatal response to exogenous ABA
102
5.4.3 Possible differences between genotypes in stomatal sensitivity to factors other
than xylem ABA concentration and pH
gs in IGW-3262 under both MES and HEPES solutions without ABA decreased to half of
the intact plants while Drysdale maintained high gs. The high leaf after feeding the leaves
with ABA solutions in comparison with that of intact plants indicates that there were no
cavitations or blockage of xylem vessels that caused the reduction in gs in IGW-3262. The
reduction in gs was not in response to any increase in leaf tissue ABA and for that reason
leaf ABA can be excluded as the driving factor for gs in IGW-3262 (Saradadevi et al.
(2014) and Chapter 3). Since the experiment was conducted in controlled environment
conditions, this gs response is unlikely to be associated with environmental effects.
Moreover, the gs response was similar across replications, which was scattered on different
days. Thus, it appears that stomata in IGW-3262 are sensitive to other factors besides
xylem ABA concentration and pH, probably to the osmolality of the xylem sap (Kelly et
al., 2013). In addition to the increase in xylem ABA concentration, significant changes in
the composition of xylem sap has been reported in species such as sunflower (Gollan et al.,
1992) and maize (Bahrun et al., 2002). Increased concentrations of malate and mannitol—
the end products of photosynthesis— in the apoplast are thought to play in closing stomata
(Patonnier et al., 1999), possibly due to osmotic changes that regulate stomatal aperture
(MacRobbie, 1980). Alternatively, lack of supply of signals such as cytokinin from the root
may have restricted stomatal opening in IGW-3262 (Blackman and Davies, 1985).
5.4.4 Evidence for possible differences in ABA metabolism between the cultivar
Drysdale and the line IGW-3262
Leaf ABA when fed with 10─8 and 10─7 M ABA solutions was similar to the control in both
genotypes. As ABA concentration increased to 10─6 M, leaf ABA increased in both
genotypes, more so in Drysdale than IGW-3262. This is consistent with the findings from
the split root study described in Chapter 3, where Drysdale increased leaf ABA when half
Chapter 5 – Stomatal response to exogenous ABA
103
of the root system was exposed to drying soil. It can be suggested that Drysdale leaves are
more sensitive to drying signals from the roots producing leaf ABA much faster than IGW-
3262 at similar concentration of xylem ABA. Both genotypes had similar increase in PA in
response to increased ABA synthesis indicating similar rates of ABA metabolism via
hydrolysis. However, ABA metabolism by conjugation with glucose to form its ester ABA-
GE only slightly differs between these two genotypes. When plants were fed with 10─6 M
ABA solution, ABA-GE concentration increased in Drysdale, but decreased in IGW-3262.
A similar discrepancy in the relationship between ABA and ABA-GE in IGW-3262 and
Drysdale was observed in the study described in Chapter 4.
Conjugation of ABA with glucose to form ABA-GE is usually considered an irreversible
process to sequestrate ABA from the cells (Zeevaart and Creelman, 1988). Alternatively,
ABA-GE can be hydrolysed by β-glucosidase to yield biologically-active ABA (Hartung et
al., 2002; Xu et al., 2012). Polymerisation of β-glucosidase localised in endoplasmic
reticulum of Arabidopsis thaliana released free ABA into the apoplastic space of leaves
from ABA-GE in leaf cells (Lee et al., 2006). The reduction in ABA-GE as ABA increased
in IGW-3262 suggests that such hydrolysis to release free ABA happens in IGW-3262. It is
not known if such β-glucosidases function in wheat to release free ABA from ABA-GE.
However, it has been reported that increases in transpiration inhibitory capability of wheat
sap by the polymerisation of small compounds in the sap (Munns et al., 1993) leads to the
possibility of β-glucosidases functioning in wheat. Thus, hydroxylation of leaf ABA-GE to
raise apoplastic ABA is a possible pathway adopted by IGW-3262 to regulate its stomata,
which may explain the weak relationship between leaf ABA and gs observed in Chapters 3
and 4.
Chapter 5 – Stomatal response to exogenous ABA
104
5.4.5 Stomatal reversal to the usual conductance was not possible in the leaves of
plants under 25% PSWC when the leaves were fed with 0ABA solution
At 25% PSWC, leaves had 60% lower gs than the control in all solutions with or without
ABA indicating that factors other than ABA concentration in the xylem sap residing within
leaves also regulate stomata. Thus, previous exposure to higher ABA or other drying
signals seems to alter the sensitivity of stomata to a given ABA concentration. Results also
underline the limitations in the reversal of stomatal closure even after 2 hours of
rehydration. This is consistent with the stomatal response of cherry leaves where gs did not
return to the usual conductance even after three hours of transferring the leaves to ABA
free buffer (Gowing et al., 1993). However, at 50% PSWC leaves which had reduced gs in
intact plants reversed their usual gs values, similar to the control at that lower leaf . It is
expected that at 25% PSWC leaves may have been exposed to a much higher ABA
concentration than at 50% PSWC leaves and that the duration of exposure may have been
longer. Higher leaf ABA concentrations at 25% PSWC leaves may sustain stomatal closure
(Henson et al., 1989b). Reduced gs, despite having similar post-feeding leaf close to
–0.3MPa, implies that stomatal closure is not fully controlled by turgor (Pierce and
Raschke, 1980) or leaf water status (Henson, 1985). The presence of other chemicals such
as cytokinins may be essential to revert stomatal closure (Blackman and Davies, 1983).
Results from the present study suggest that stomatal response is not a direct function of
current xylem ABA concentration (Zhang and Davies, 1990a), but other factors such as pH,
osmolality of the sap as well as previous exposure to higher ABA concentration may be
involved.
Chapter 5 – Stomatal response to exogenous ABA
105
5.5 Conclusions
The stomatal response of wheat genotypes, IGW-3262 and Drysdale, to exogenous ABA
application indicates that stomata in the line IGW-3262 are sensitive to several factors other
than ABA concentration, such as pH and presumably osmolality of the solution. The
differences in the relationship between gs and ABA among the two genotypes may be
associated with different ABA metabolism in these two genotypes. ABA concentration
equivalent to that found in the xylem sap of water-stressed wheat plants was not sufficient
to reduce gs. Instead, a higher concentration was needed to initiate stomatal closure.
Similarly, a complete reversal of stomatal closure upon rehydration was not possible in
plants at 25% PSWC compared to those under 50% PSWC. Thus, the apparent sensitivity
of stomata is not a straight forward relationship with the current xylem ABA concentration,
but appears to be interlinked with several other factors such as pH of xylem sap, water
status of leaves, leaf ABA concentration and possibly osmolality of xylem sap.

Chapter 6 – Root capacity to uptake water
107
6 The root capacity to uptake water from deep soil layers differs
in two wheat genotypes contrasting for stomatal conductance
6.1 Introduction
In the event of terminal drought, soil dries progressively from the shallow to the deeper
layers of the soil profile, exposing the shallow part of the root system to dry soil while the
deeper part of the root system has some water available to complete the grain filling.
Chapter 4 showed that when the root system in the top part of the pot was exposed to
drying soil, the cultivar Drysdale initiated stomatal closure earlier and at soil water content
higher than the breeding line IGW-3262. These responses were related to Drysdale
depleting the soil moisture faster due to greater root biomass in the top soil layer than IGW-
3262.
Stomatal behaviour of these two genotypes also differed. Stomata of IGW-3262 were
sensitive to unknown factors other than soil water status, as observed in chapter 4. Drysdale
stomatal conductance was related to the accumulation of abscisic acid (ABA) in the leaf
tissues (Chapters 3 and 4). However, stomatal closure in both genotypes commenced before
any remarkable increase in leaf ABA was detected. As there was no increase in the ABA
content in root tissues under water deficit conditions, translocation of ABA from the leaves
to the root via phloem was postulated as the source of increased ABA in the xylem sap
ascending to the shoot. The chances of root ABA being translocated to shoot as xylem
ABA without increasing the root ABA content was also not discounted. Sampling the
xylem sap to unravel the mechanism behind different stomatal behaviour of these
genotypes was not possible because of the great difficulty in obtaining xylem sap from full-
grown water-stressed wheat plants (Munns et al., 1993).
Reduced stomatal conductance in response to drying top soil has been reported to have a
negative impact on wheat yield (Blum and Johnson, 1993), particularly affecting grain
Chapter 6 – Root capacity to uptake water
108
filling under terminal drought (Saini and Aspinall, 1981; Kobata et al., 1992; Rajala et al.,
2009) . Grain filling is reduced mainly because reduced stomatal conductance limits
photosynthesis (Henson et al., 1989a; Chaves et al., 2009) and hence, production of current
assimilates, the major source of carbon for grain filling (Kobata et al., 1992; Palta et al.,
1994; Blum, 1998). The proportion of biomass converted to grain yield is determined
mainly by the water used after anthesis (Passioura, 1983). Thus, every extra millimetre of
water used during the grain filling can result in a yield advantage (Manschadi et al., 2006;
Kirkegaard, 2007). Reduced stomatal conductance limits transpiration and may maintain
soil water availability for use during grain filling, resulting in increased water use
efficiency (Sinclair et al., 1984). Conservative water use through reduced stomatal
conductance may outweigh the negative impact of reduced photosynthesis on yield.
In Chapter 4, it was also shown that grain yield reduced in both Drysdale and IGW-3262
when the top soil dried, but the yield reduction was 21% lower in Drysdale than IGW-3262.
The yield difference resulted from a poor grain filling resulting in low 1000─grain weight.
The poor grain filling was likely associated with a reduction in water uptake and use as
duration of grain filling and subsequently final grain weight was reduced (Gooding et al.,
2003). The better yield performance of Drysdale than IGW-3262 under conditions of
terminal drought is likely a result of differences in post-anthesis water use and water use
efficiency due to differences in availability of soil water at depth. To test this hypothesis, an
experiment was conducted in a glasshouse during May to October 2014.
6.2 Materials and methods
6.2.1 Plant materials and growing conditions
Wheat genotypes IGW-3262 and Drysdale were grown in an evaporative-cooled glasshouse
at CSIRO Floreat Park, WA (31° 95´S, 115° 79´E) from May to October 2014. Plants were
grown in polyvinyl chloride pots of 0.15 m diameter and 1.0 m depth filled with the same
Chapter 6 – Root capacity to uptake water
109
soil described in Chapter 3. Uniform-sized seeds were germinated in Petri dishes on moist
filter paper at room temperature for three days. Five pre-germinated seeds were planted per
pot on 6th May 2014, and were thinned to three per pot at the three to four leaf stages. At
planting, nutrients equivalent to 60 kg N ha─1, 77 kg P ha─1 and 70 kg K ha─1 as a
commercial N:P:K fertilizer was mixed in the top 10 cm of the soil in each pot. A water
soluble fertiliser with Mg, Cu, Zn, Mo, S and other micronutrients were supplied through
irrigation at tillering stage. The pots were weighed for soil water content twice a week and
watered to maintain 90% pot water capacity until anthesis when the treatments were
applied. A 5 cm layer of plastic beads was uniformly spread on the top of the soil in each
pot to prevent losses of soil water through evaporation. Plants were also grown in 12 extra
pots for measuring leaf water potential at three different times during the development of
the water stress.
6.2.2 Treatments
Terminal drought treatments were induced at anthesis, (Z 65; Zadoks’ growth scale for
cereals, (Zadoks et al., 1974), when anthers had emerged from the main stem of 50% of the
plants. Terminal drought was induced by withholding water from 28 pots (14 pots per
genotype). In 14 of these pots (7 pots per genotype), the soil profile was allowed to dry
completely (WS). In the other 14 Pots (7 pots per genotype), a known amount of water was
supplied to the bottom 30 cm of the soil profile through an irrigation tube connected to a
plastic bottle (Figure 6.1) to keep the bottom 30 cm of the soil profile in the pot at 100%
water holding capacity (WB).The drained water in this treatment was continuously
collected in a plastic bottle connected to the end of a drainage pipe in each pot and added
back to the bottom 30 cm of the soil the following day after weighing. Injecting water
through the tubing was started when the pot reached 60% of its total water holding capacity
(equivalent to 40% of plant available water assuming that the lower limit of extractable soil
water is 10% soil moisture content) after withholding water at anthesis. This occurred at 99
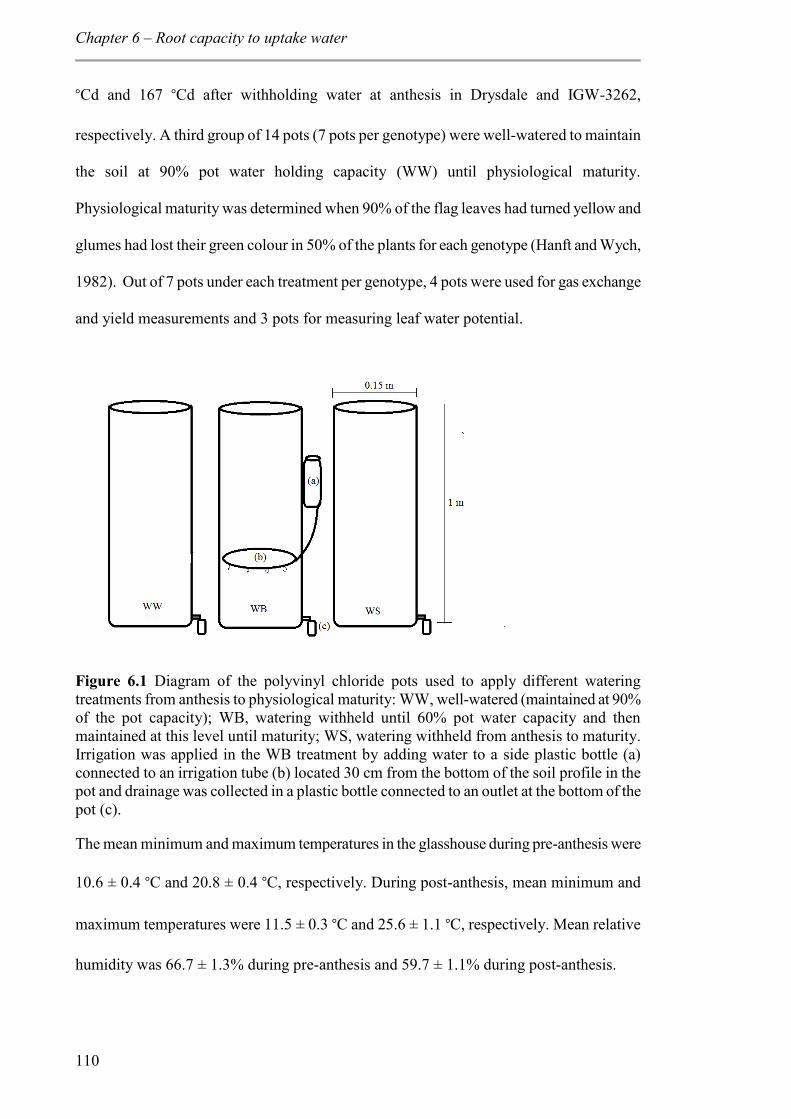
Chapter 6 – Root capacity to uptake water
110
°Cd and 167 °Cd after withholding water at anthesis in Drysdale and IGW-3262,
respectively. A third group of 14 pots (7 pots per genotype) were well-watered to maintain
the soil at 90% pot water holding capacity (WW) until physiological maturity.
Physiological maturity was determined when 90% of the flag leaves had turned yellow and
glumes had lost their green colour in 50% of the plants for each genotype (Hanft and Wych,
1982). Out of 7 pots under each treatment per genotype, 4 pots were used for gas exchange
and yield measurements and 3 pots for measuring leaf water potential.
Figure 6.1 Diagram of the polyvinyl chloride pots used to apply different watering treatments from anthesis to physiological maturity: WW, well-watered (maintained at 90% of the pot capacity); WB, watering withheld until 60% pot water capacity and then maintained at this level until maturity; WS, watering withheld from anthesis to maturity. Irrigation was applied in the WB treatment by adding water to a side plastic bottle (a) connected to an irrigation tube (b) located 30 cm from the bottom of the soil profile in the pot and drainage was collected in a plastic bottle connected to an outlet at the bottom of the pot (c).
The mean minimum and maximum temperatures in the glasshouse during pre-anthesis were
10.6 ± 0.4 °C and 20.8 ± 0.4 °C, respectively. During post-anthesis, mean minimum and
maximum temperatures were 11.5 ± 0.3 °C and 25.6 ± 1.1 °C, respectively. Mean relative
humidity was 66.7 ± 1.3% during pre-anthesis and 59.7 ± 1.1% during post-anthesis.
Chapter 6 – Root capacity to uptake water
111
6.2.3 Measurements
When plants were at 50% anthesis and just before imposing the watering treatments, 3
separate set of pots from each genotype were randomly selected and number of tillers and
emerged spikes recorded. Then the plants were harvested by cutting the shoots from the
roots at the crown. Leaf area was measured using a portable leaf area meter (LI-3000, LI-
COR Biosciences, Nebraska, USA) and shoot and leaves were dried in an oven at 60 °C for
48 hours and then weighed. Immediately after harvesting the shoots, the roots were
recovered from the soil by repeated gentle washing and sieving on a 1.4-mm sieve to
produce a clean sample, as described by Liao et al. (2006) and Palta et al. (2007). Roots
were then dried in an oven at 60 °C for 72 hours and weighed.
Stomatal conductance (gs) was measured on both sides of the flag leaf of the main stem
using a Delta-T AP4 porometer (Delta-T Devices Ltd., Cambridge, UK) between 11:00 and
13:00 h on clear sunny days from anthesis and until the flag leaves in WS treatment dried
and rolled completely. Leaf water potential (leaf) was measured on clear sunny days at
three different time points after withholding water, as reference of the development of the
water deficits. Midday leaf was measured at (1) at anthesis, (2) when pot water content
reached 60% of pot water holding capacity, just before watering was initiated through
irrigation tubes to the bottom one-third of the soil column (167 °Cd for IGW-3262 and 99
°Cd for Drysdale), and (3) when changes in pot weight ceased in the WS treatments. leaf
was measured using a Scholander-type pressure chamber (model 1000, PMS Instrument
Co., Oregon, USA). The flag leaf was loosely covered with a plastic sheath before excision
and during the measurement to avoid evaporation (Turner, 1988).
The amount of water applied to each pot each time was recorded. Pre-anthesis water use
was calculated as the difference in weight of individual pot at planting and at anthesis plus
the water applied in-between. As the soil surface was covered with beads from anthesis,
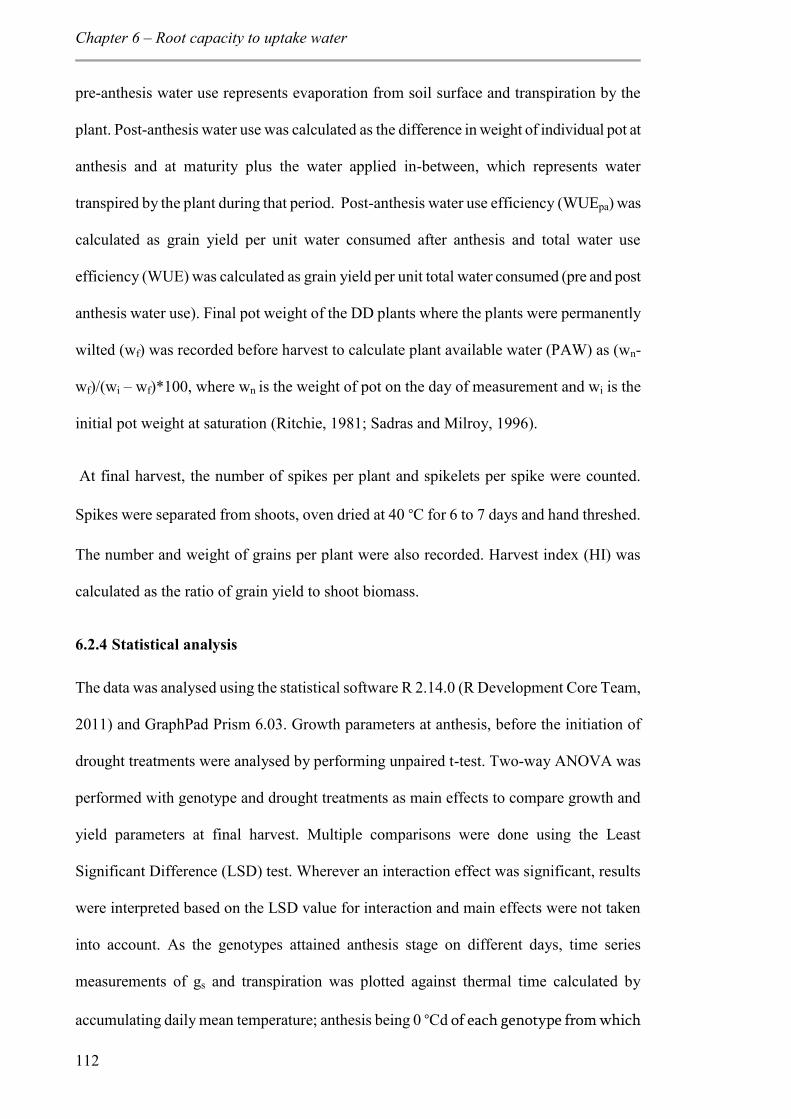
Chapter 6 – Root capacity to uptake water
112
pre-anthesis water use represents evaporation from soil surface and transpiration by the
plant. Post-anthesis water use was calculated as the difference in weight of individual pot at
anthesis and at maturity plus the water applied in-between, which represents water
transpired by the plant during that period. Post-anthesis water use efficiency (WUEpa) was
calculated as grain yield per unit water consumed after anthesis and total water use
efficiency (WUE) was calculated as grain yield per unit total water consumed (pre and post
anthesis water use). Final pot weight of the DD plants where the plants were permanently
wilted (wf) was recorded before harvest to calculate plant available water (PAW) as (wn-
wf)/(wi – wf)*100, where wn is the weight of pot on the day of measurement and wi is the
initial pot weight at saturation (Ritchie, 1981; Sadras and Milroy, 1996).
At final harvest, the number of spikes per plant and spikelets per spike were counted.
Spikes were separated from shoots, oven dried at 40 °C for 6 to 7 days and hand threshed.
The number and weight of grains per plant were also recorded. Harvest index (HI) was
calculated as the ratio of grain yield to shoot biomass.
6.2.4 Statistical analysis
The data was analysed using the statistical software R 2.14.0 (R Development Core Team,
2011) and GraphPad Prism 6.03. Growth parameters at anthesis, before the initiation of
drought treatments were analysed by performing unpaired t-test. Two-way ANOVA was
performed with genotype and drought treatments as main effects to compare growth and
yield parameters at final harvest. Multiple comparisons were done using the Least
Significant Difference (LSD) test. Wherever an interaction effect was significant, results
were interpreted based on the LSD value for interaction and main effects were not taken
into account. As the genotypes attained anthesis stage on different days, time series
measurements of gs and transpiration was plotted against thermal time calculated by
accumulating daily mean temperature; anthesis being 0 °Cd of each genotype from which
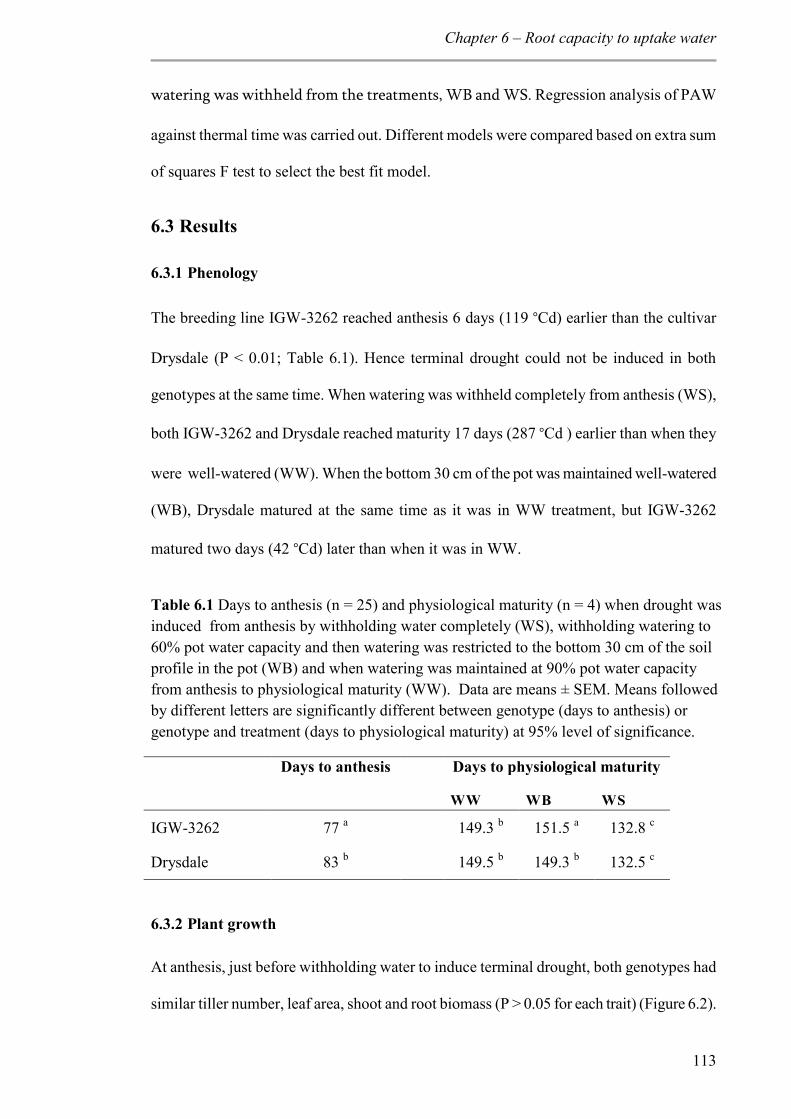
Chapter 6 – Root capacity to uptake water
113
watering was withheld from the treatments, WB and WS. Regression analysis of PAW
against thermal time was carried out. Different models were compared based on extra sum
of squares F test to select the best fit model.
6.3 Results
6.3.1 Phenology
The breeding line IGW-3262 reached anthesis 6 days (119 °Cd) earlier than the cultivar
Drysdale (P < 0.01; Table 6.1). Hence terminal drought could not be induced in both
genotypes at the same time. When watering was withheld completely from anthesis (WS),
both IGW-3262 and Drysdale reached maturity 17 days (287 °Cd ) earlier than when they
were well-watered (WW). When the bottom 30 cm of the pot was maintained well-watered
(WB), Drysdale matured at the same time as it was in WW treatment, but IGW-3262
matured two days (42 °Cd) later than when it was in WW.
Table 6.1 Days to anthesis (n = 25) and physiological maturity (n = 4) when drought was induced from anthesis by withholding water completely (WS), withholding watering to 60% pot water capacity and then watering was restricted to the bottom 30 cm of the soil profile in the pot (WB) and when watering was maintained at 90% pot water capacity from anthesis to physiological maturity (WW). Data are means ± SEM. Means followed by different letters are significantly different between genotype (days to anthesis) or genotype and treatment (days to physiological maturity) at 95% level of significance.
Days to anthesis Days to physiological maturity WW WB WS
IGW-3262 77 a 149.3 b 151.5 a 132.8 c
Drysdale 83 b 149.5 b 149.3 b 132.5 c
6.3.2 Plant growth
At anthesis, just before withholding water to induce terminal drought, both genotypes had
similar tiller number, leaf area, shoot and root biomass (P > 0.05 for each trait) (Figure 6.2).
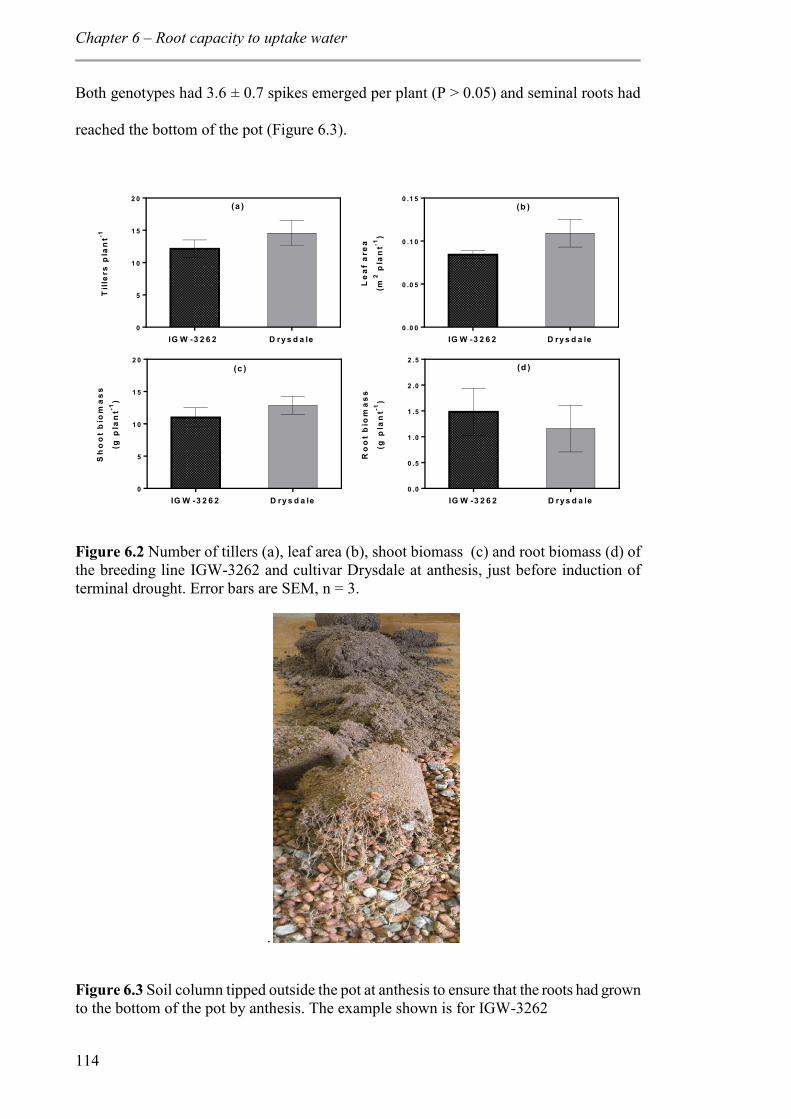
Chapter 6 – Root capacity to uptake water
114
Both genotypes had 3.6 ± 0.7 spikes emerged per plant (P > 0.05) and seminal roots had
reached the bottom of the pot (Figure 6.3).
IG W -3 2 6 2 D ry s d a le0
5
1 0
1 5
2 0
Til
lers
pla
nt-1
IG W -3 2 6 2 D ry s d a le0 .0 0
0 .0 5
0 .1 0
0 .1 5
Le
af
are
a
(m2
pla
nt-1
)
IG W -3 2 6 2 D ry s d a le0
5
1 0
1 5
2 0
Sh
oo
t b
iom
as
s
(g p
lan
t-1)
IG W -3 2 6 2 D ry s d a le0 .0
0 .5
1 .0
1 .5
2 .0
2 .5R
oo
t b
iom
as
s
(g p
lan
t-1)
(a ) (b )
(c ) (d )
Figure 6.2 Number of tillers (a), leaf area (b), shoot biomass (c) and root biomass (d) of the breeding line IGW-3262 and cultivar Drysdale at anthesis, just before induction of terminal drought. Error bars are SEM, n = 3.
.
Figure 6.3 Soil column tipped outside the pot at anthesis to ensure that the roots had grown to the bottom of the pot by anthesis. The example shown is for IGW-3262
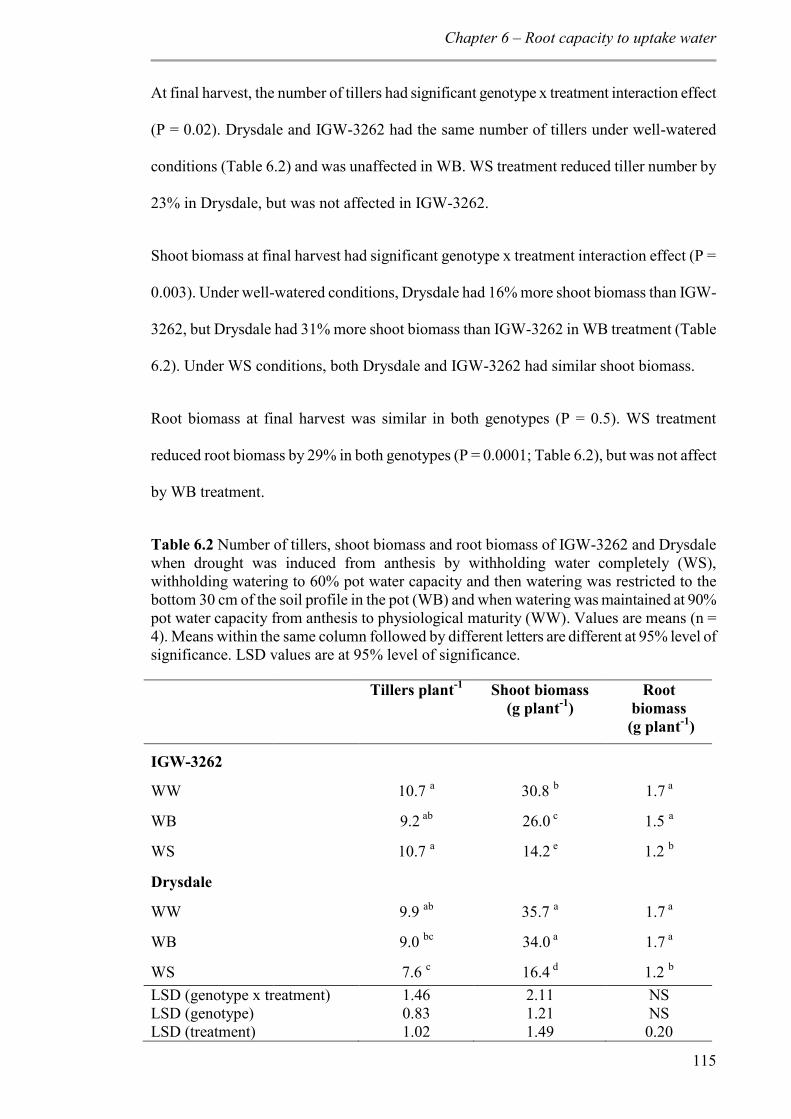
Chapter 6 – Root capacity to uptake water
115
At final harvest, the number of tillers had significant genotype x treatment interaction effect
(P = 0.02). Drysdale and IGW-3262 had the same number of tillers under well-watered
conditions (Table 6.2) and was unaffected in WB. WS treatment reduced tiller number by
23% in Drysdale, but was not affected in IGW-3262.
Shoot biomass at final harvest had significant genotype x treatment interaction effect (P =
0.003). Under well-watered conditions, Drysdale had 16% more shoot biomass than IGW-
3262, but Drysdale had 31% more shoot biomass than IGW-3262 in WB treatment (Table
6.2). Under WS conditions, both Drysdale and IGW-3262 had similar shoot biomass.
Root biomass at final harvest was similar in both genotypes (P = 0.5). WS treatment
reduced root biomass by 29% in both genotypes (P = 0.0001; Table 6.2), but was not affect
by WB treatment.
Table 6.2 Number of tillers, shoot biomass and root biomass of IGW-3262 and Drysdale when drought was induced from anthesis by withholding water completely (WS), withholding watering to 60% pot water capacity and then watering was restricted to the bottom 30 cm of the soil profile in the pot (WB) and when watering was maintained at 90% pot water capacity from anthesis to physiological maturity (WW). Values are means (n = 4). Means within the same column followed by different letters are different at 95% level of significance. LSD values are at 95% level of significance.
Tillers plant-1 Shoot biomass (g plant-1)
Root biomass
(g plant-1)
IGW-3262
WW 10.7 a 30.8 b 1.7 a
WB 9.2 ab 26.0 c 1.5 a
WS 10.7 a 14.2 e 1.2 b
Drysdale
WW 9.9 ab 35.7 a 1.7 a
WB 9.0 bc 34.0 a 1.7 a
WS 7.6 c 16.4 d 1.2 b LSD (genotype x treatment) 1.46 2.11 NS LSD (genotype) 0.83 1.21 NS LSD (treatment) 1.02 1.49 0.20
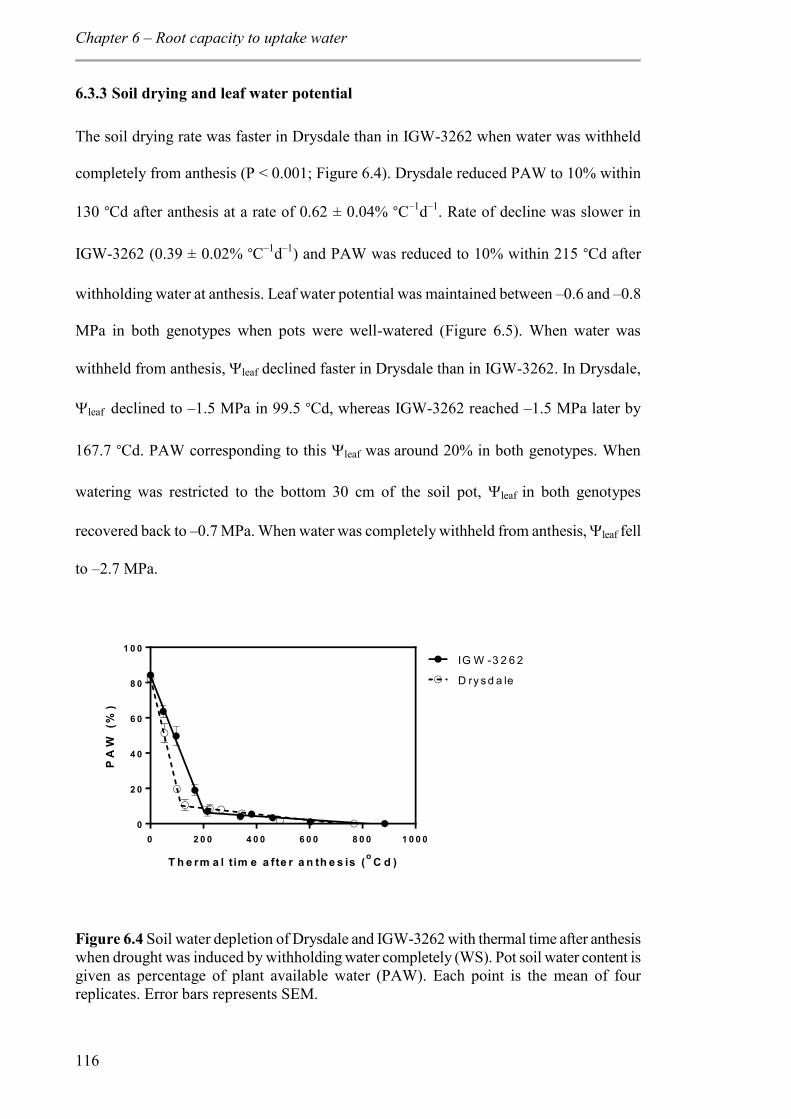
Chapter 6 – Root capacity to uptake water
116
6.3.3 Soil drying and leaf water potential
The soil drying rate was faster in Drysdale than in IGW-3262 when water was withheld
completely from anthesis (P < 0.001; Figure 6.4). Drysdale reduced PAW to 10% within
130 °Cd after anthesis at a rate of 0.62 ± 0.04% °C–1d–1. Rate of decline was slower in
IGW-3262 (0.39 ± 0.02% °C–1d–1) and PAW was reduced to 10% within 215 °Cd after
withholding water at anthesis. Leaf water potential was maintained between –0.6 and –0.8
MPa in both genotypes when pots were well-watered (Figure 6.5). When water was
withheld from anthesis, leaf declined faster in Drysdale than in IGW-3262. In Drysdale,
leaf declined to –1.5 MPa in 99.5 °Cd, whereas IGW-3262 reached –1.5 MPa later by
167.7 °Cd. PAW corresponding to this leaf was around 20% in both genotypes. When
watering was restricted to the bottom 30 cm of the soil pot, leaf in both genotypes
recovered back to –0.7 MPa. When water was completely withheld from anthesis, leaf fell
to –2.7 MPa.
0 2 0 0 4 0 0 6 0 0 8 0 0 1 0 0 00
2 0
4 0
6 0
8 0
1 0 0
T h e rm a l tim e a fte r a n th e s is (o C d )
PA
W (
%)
IG W -3 2 6 2
D ry s d a le
Figure 6.4 Soil water depletion of Drysdale and IGW-3262 with thermal time after anthesis when drought was induced by withholding water completely (WS). Pot soil water content is given as percentage of plant available water (PAW). Each point is the mean of four replicates. Error bars represents SEM.
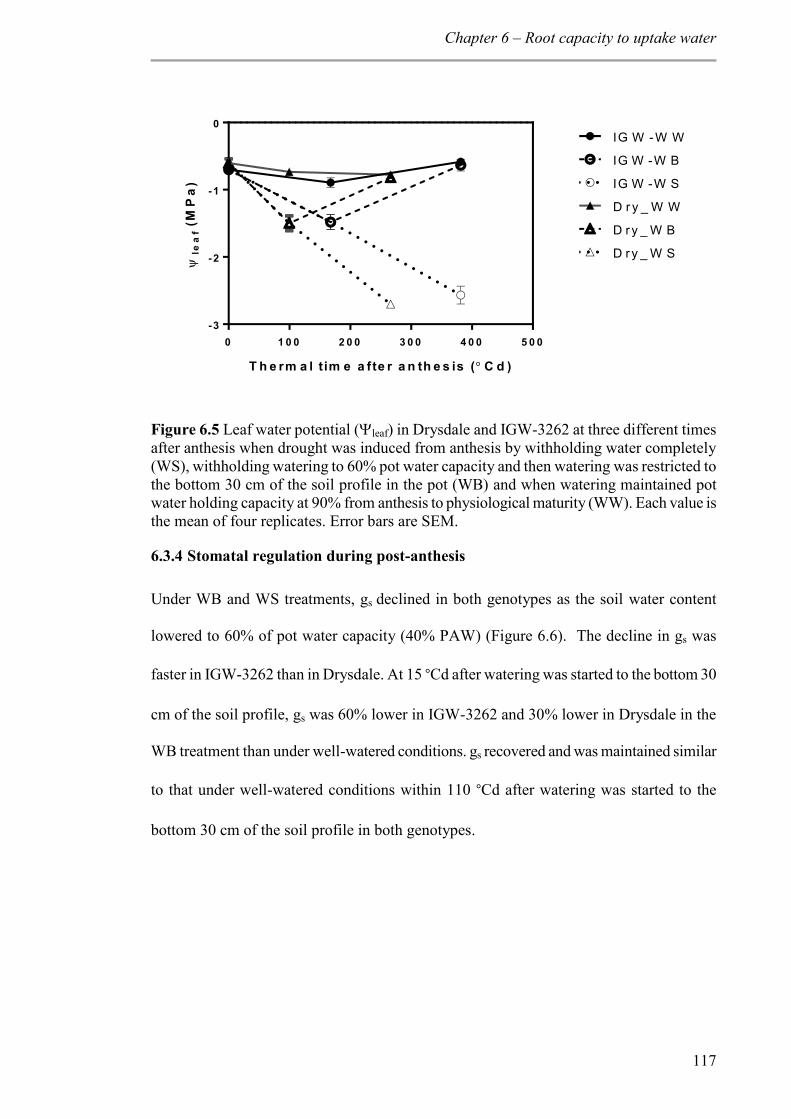
Chapter 6 – Root capacity to uptake water
117
0 1 0 0 2 0 0 3 0 0 4 0 0 5 0 0-3
-2
-1
0
T h e rm a l tim e a fte r a n th e s is ( C d )
le
af
(MP
a)
IG W -W W
IG W -W B
IG W -W S
D r y _ W W
D ry _ W B
D ry _ W S
Figure 6.5 Leaf water potential (leaf) in Drysdale and IGW-3262 at three different times after anthesis when drought was induced from anthesis by withholding water completely (WS), withholding watering to 60% pot water capacity and then watering was restricted to the bottom 30 cm of the soil profile in the pot (WB) and when watering maintained pot water holding capacity at 90% from anthesis to physiological maturity (WW). Each value is the mean of four replicates. Error bars are SEM.
6.3.4 Stomatal regulation during post-anthesis
Under WB and WS treatments, gs declined in both genotypes as the soil water content
lowered to 60% of pot water capacity (40% PAW) (Figure 6.6). The decline in gs was
faster in IGW-3262 than in Drysdale. At 15 °Cd after watering was started to the bottom 30
cm of the soil profile, gs was 60% lower in IGW-3262 and 30% lower in Drysdale in the
WB treatment than under well-watered conditions. gs recovered and was maintained similar
to that under well-watered conditions within 110 °Cd after watering was started to the
bottom 30 cm of the soil profile in both genotypes.
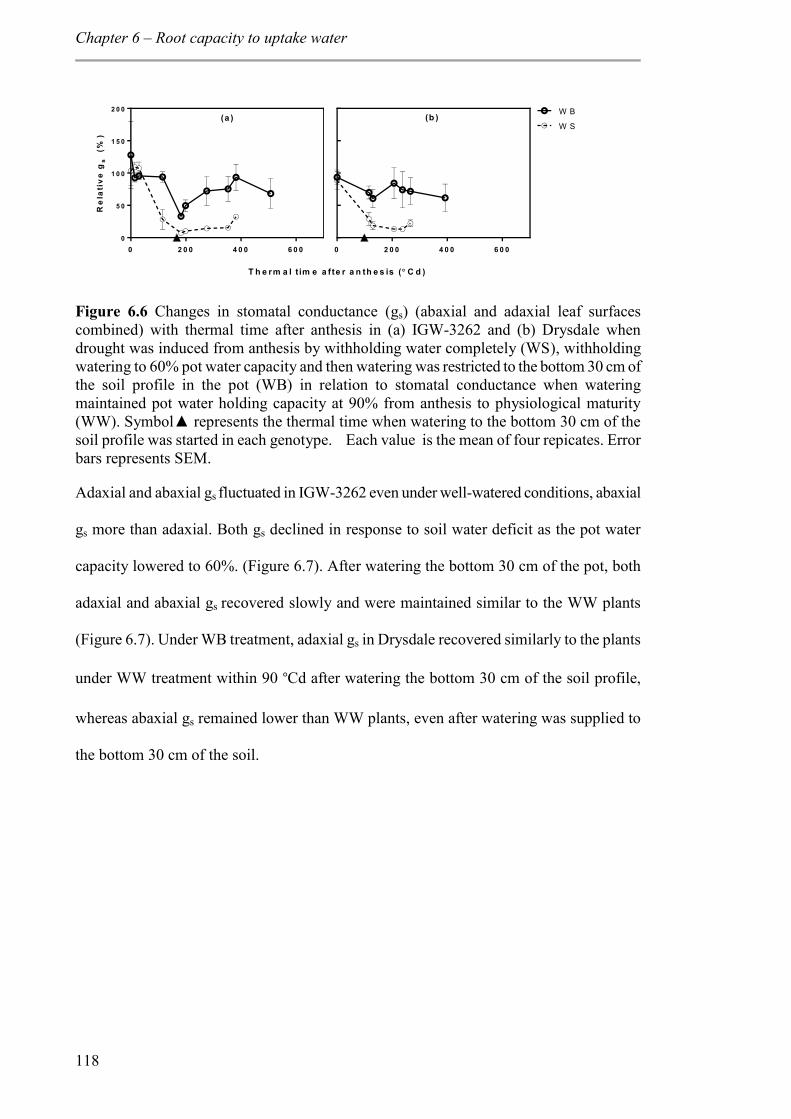
Chapter 6 – Root capacity to uptake water
118
0 2 0 0 4 0 0 6 0 00
5 0
1 0 0
1 5 0
2 0 0R
ela
tiv
e g
s (
%)
0 2 0 0 4 0 0 6 0 0
W B
W S(a ) (b )
T h e rm a l t im e a f te r a n th e s is ( C d )
Figure 6.6 Changes in stomatal conductance (gs) (abaxial and adaxial leaf surfaces combined) with thermal time after anthesis in (a) IGW-3262 and (b) Drysdale when drought was induced from anthesis by withholding water completely (WS), withholding watering to 60% pot water capacity and then watering was restricted to the bottom 30 cm of the soil profile in the pot (WB) in relation to stomatal conductance when watering maintained pot water holding capacity at 90% from anthesis to physiological maturity (WW). Symbol▲ represents the thermal time when watering to the bottom 30 cm of the soil profile was started in each genotype. Each value is the mean of four repicates. Error bars represents SEM.
Adaxial and abaxial gs fluctuated in IGW-3262 even under well-watered conditions, abaxial
gs more than adaxial. Both gs declined in response to soil water deficit as the pot water
capacity lowered to 60%. (Figure 6.7). After watering the bottom 30 cm of the pot, both
adaxial and abaxial gs recovered slowly and were maintained similar to the WW plants
(Figure 6.7). Under WB treatment, adaxial gs in Drysdale recovered similarly to the plants
under WW treatment within 90 °Cd after watering the bottom 30 cm of the soil profile,
whereas abaxial gs remained lower than WW plants, even after watering was supplied to
the bottom 30 cm of the soil.
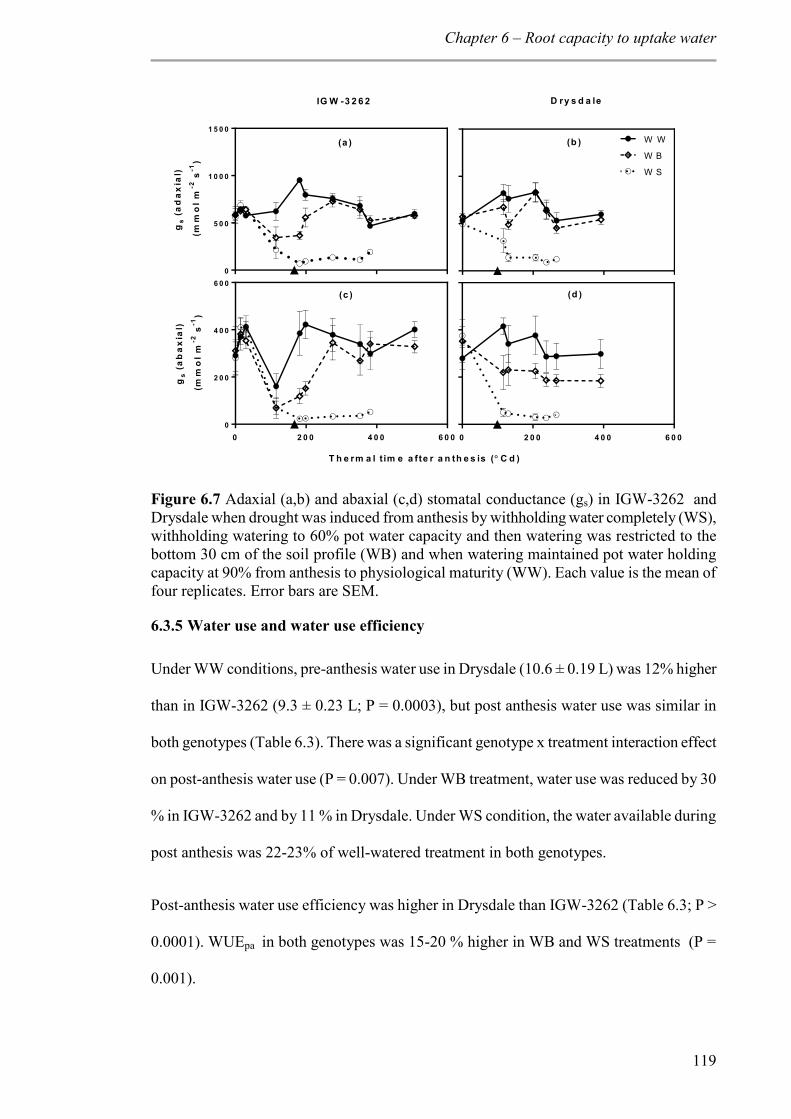
Chapter 6 – Root capacity to uptake water
119
0
5 0 0
1 0 0 0
1 5 0 0
gs
(ad
ax
ial)
(m
mo
l m
-2s
-1)
W W
W B
W S
0 2 0 0 4 0 0 6 0 00
2 0 0
4 0 0
6 0 0
gs
(ab
ax
ial)
(m
mo
l m
-2s
-1)
0 2 0 0 4 0 0 6 0 0
IG W -3 2 6 2 D ry s d a le
T h e rm a l t im e a f te r a n th e s is ( C d )
(a ) (b )
(c ) (d )
Figure 6.7 Adaxial (a,b) and abaxial (c,d) stomatal conductance (gs) in IGW-3262 and Drysdale when drought was induced from anthesis by withholding water completely (WS), withholding watering to 60% pot water capacity and then watering was restricted to the bottom 30 cm of the soil profile (WB) and when watering maintained pot water holding capacity at 90% from anthesis to physiological maturity (WW). Each value is the mean of four replicates. Error bars are SEM.
6.3.5 Water use and water use efficiency
Under WW conditions, pre-anthesis water use in Drysdale (10.6 ± 0.19 L) was 12% higher
than in IGW-3262 (9.3 ± 0.23 L; P = 0.0003), but post anthesis water use was similar in
both genotypes (Table 6.3). There was a significant genotype x treatment interaction effect
on post-anthesis water use (P = 0.007). Under WB treatment, water use was reduced by 30
% in IGW-3262 and by 11 % in Drysdale. Under WS condition, the water available during
post anthesis was 22-23% of well-watered treatment in both genotypes.
Post-anthesis water use efficiency was higher in Drysdale than IGW-3262 (Table 6.3; P >
0.0001). WUEpa in both genotypes was 15-20 % higher in WB and WS treatments (P =
0.001).
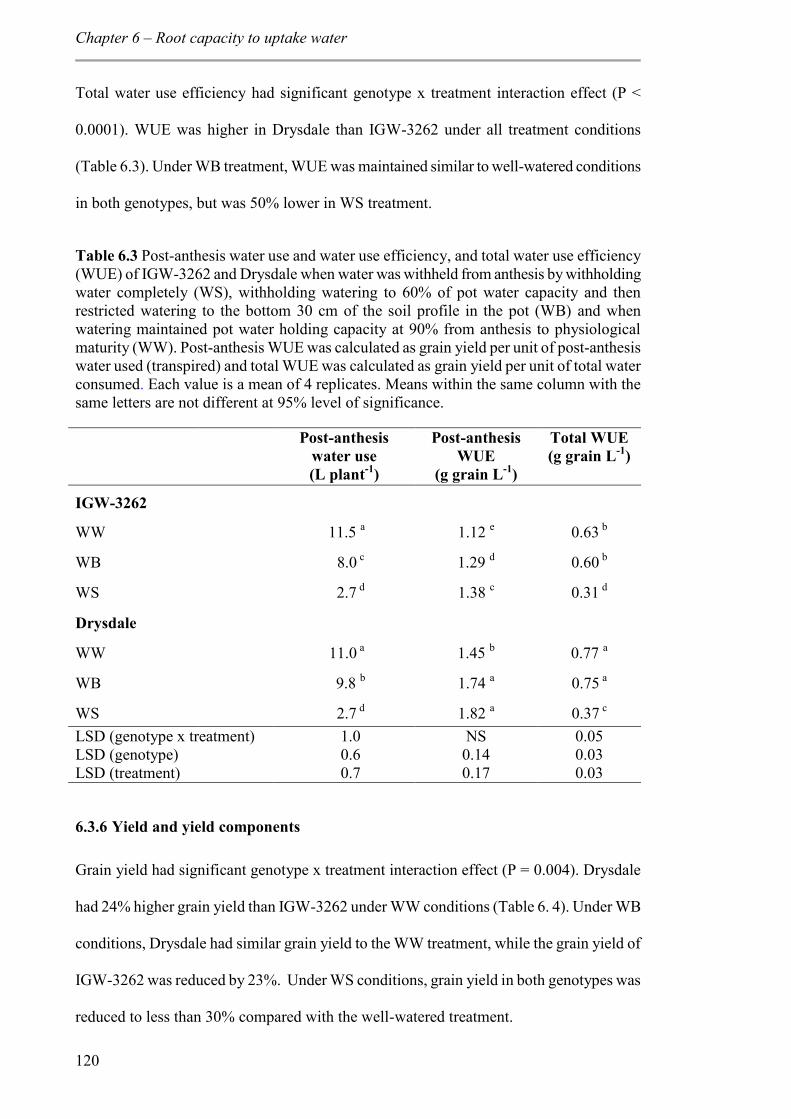
Chapter 6 – Root capacity to uptake water
120
Total water use efficiency had significant genotype x treatment interaction effect (P <
0.0001). WUE was higher in Drysdale than IGW-3262 under all treatment conditions
(Table 6.3). Under WB treatment, WUE was maintained similar to well-watered conditions
in both genotypes, but was 50% lower in WS treatment.
Table 6.3 Post-anthesis water use and water use efficiency, and total water use efficiency (WUE) of IGW-3262 and Drysdale when water was withheld from anthesis by withholding water completely (WS), withholding watering to 60% of pot water capacity and then restricted watering to the bottom 30 cm of the soil profile in the pot (WB) and when watering maintained pot water holding capacity at 90% from anthesis to physiological maturity (WW). Post-anthesis WUE was calculated as grain yield per unit of post-anthesis water used (transpired) and total WUE was calculated as grain yield per unit of total water consumed. Each value is a mean of 4 replicates. Means within the same column with the same letters are not different at 95% level of significance.
Post-anthesis water use (L plant-1)
Post-anthesis WUE
(g grain L-1)
Total WUE (g grain L-1)
IGW-3262
WW 11.5 a 1.12 e 0.63 b
WB 8.0 c 1.29 d 0.60 b
WS 2.7 d 1.38 c 0.31 d
Drysdale
WW 11.0 a 1.45 b 0.77 a
WB 9.8 b 1.74 a 0.75 a
WS 2.7 d 1.82 a 0.37 c LSD (genotype x treatment) 1.0 NS 0.05 LSD (genotype) 0.6 0.14 0.03 LSD (treatment) 0.7 0.17 0.03
6.3.6 Yield and yield components
Grain yield had significant genotype x treatment interaction effect (P = 0.004). Drysdale
had 24% higher grain yield than IGW-3262 under WW conditions (Table 6. 4). Under WB
conditions, Drysdale had similar grain yield to the WW treatment, while the grain yield of
IGW-3262 was reduced by 23%. Under WS conditions, grain yield in both genotypes was
reduced to less than 30% compared with the well-watered treatment.
Chapter 6 – Root capacity to uptake water
121
The number of grains per plant was similar in both genotypes under WW conditions. When
post-anthesis watering was limited to the bottom 30 cm of the pot, IGW-3262 reduced grain
number by 30% and Drysdale by 16%. Under WS conditions, reduction in the number of
grains was 56% and 43%, respectively in IGW-3262 and Drysdale.
There was a significant interaction effect of genotype x treatment for spikes per plant (P <
0.02). The number of spikes in IGW-3262 decreased by 25% and 61%, respectively in WB
and WS treatments (Table 6.4). The number of spikes per plant was not reduced in
Drysdale in WB treatment, but decreased by 42% in WS treatment. The number of
spikelets per spike was 19.4 ± 0.3 in both genotypes (P = 0.06) and was not affected by the
terminal drought treatments (P = 0.16).
The number of grains per spike varied between genotypes (P = 0.02), with Drysdale having
16% more grains per spike than IGW-3262. Post-anthesis watering treatments had no effect
on number of grains per spike (P = 0.8; Table 6.4). 1000-grain weight under WW and WB
treatments was 15-18% higher in Drysdale than IGW-3262 (P = 0.02). WS treatment
reduced 1000-grain weight by 35% in IGW-3262 and 49% in Drysdale (P < 0.001). Harvest
index was higher in Drysdale than IGW-3262 under all treatments (P < 0.001). Harvest
index was reduced by 40% in WS treatment (P < 0.001), but was not affected in WB
treatment.
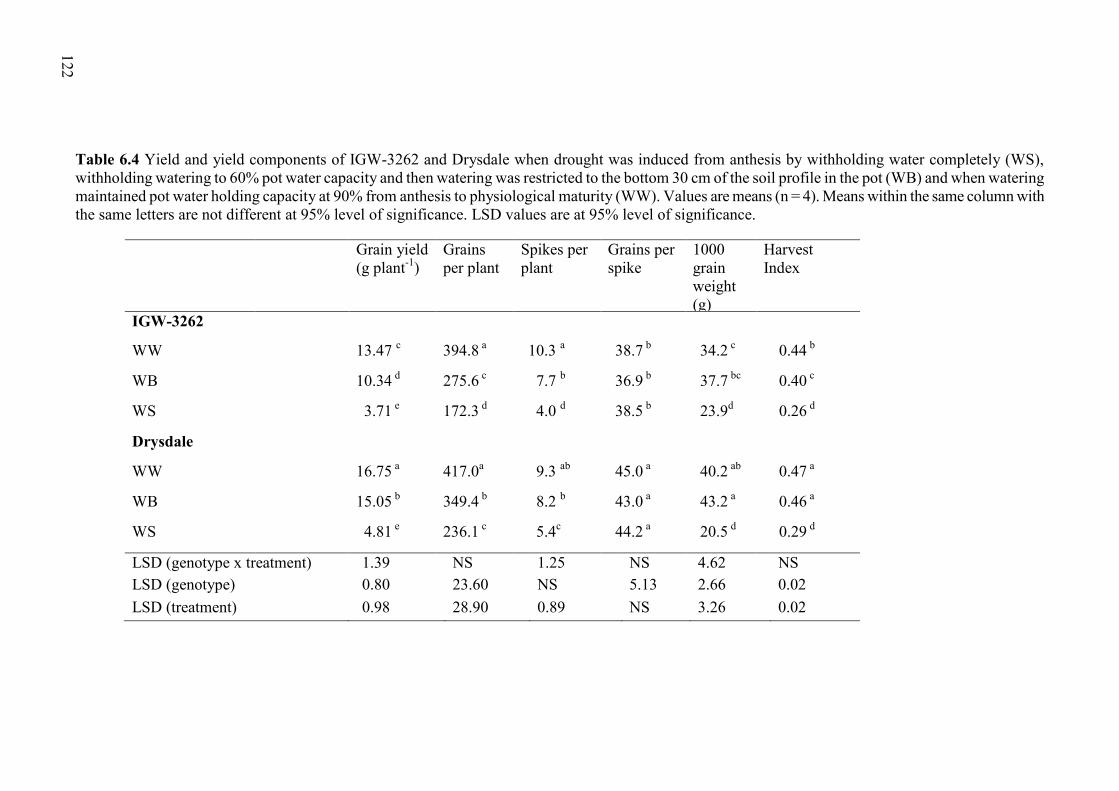
122
Table 6.4 Yield and yield components of IGW-3262 and Drysdale when drought was induced from anthesis by withholding water completely (WS), withholding watering to 60% pot water capacity and then watering was restricted to the bottom 30 cm of the soil profile in the pot (WB) and when watering maintained pot water holding capacity at 90% from anthesis to physiological maturity (WW). Values are means (n = 4). Means within the same column with the same letters are not different at 95% level of significance. LSD values are at 95% level of significance.
Grain yield (g plant-1)
Grains per plant
Spikes per plant
Grains per spike
1000 grain weight (g)
Harvest Index
IGW-3262
WW 13.47 c 394.8 a 10.3 a 38.7 b 34.2 c 0.44 b
WB 10.34 d 275.6 c 7.7 b 36.9 b 37.7 bc 0.40 c
WS 3.71 e 172.3 d 4.0 d 38.5 b 23.9d 0.26 d
Drysdale
WW 16.75 a 417.0a 9.3 ab 45.0 a 40.2 ab 0.47 a
WB 15.05 b 349.4 b 8.2 b 43.0 a 43.2 a 0.46 a
WS 4.81 e 236.1 c 5.4c 44.2 a 20.5 d 0.29 d
LSD (genotype x treatment) 1.39 NS 1.25 NS 4.62 NS LSD (genotype) 0.80 23.60 NS 5.13 2.66 0.02 LSD (treatment) 0.98 28.90 0.89 NS 3.26 0.02
Chapter 6 – Root capacity to uptake water
123
6.4 Discussion
The wheat cultivar Drysdale and the breeding line IGW-3262 differed in their post-anthesis
water use when the soil dried from the top to the bottom but sufficient water was available
in the bottom 30 cm of the soil profile in the 1 m pots. This difference is likely to be
associated with differences in their root system capacity to capture water at depth
(Passioura, 1983; Kirkegaard, 2007) and stomatal response to soil drying (Blum and
Johnson, 1993). Post-anthesis water use in IGW-3262 was low when post-anthesis watering
was limited to the bottom 30 cm of the soil profile in the pots (WB) while Drysdale
maintained similar water use as in WW treatment. This indicates that the two genotypes
differed in their ability to use the available soil water at depth, which was also observed in
chapter 4. Lower root length and root biomass in the bottom segment of IGW-3262
compared with Drysdale as found in Chapter 4 indicates less exploration of soil volume and
consequently less water uptake. IGW-3262 has thinner roots than Drysdale, as
demonstrated by its high specific root length (SRL) (Saradadevi et al., 2014). Thinner roots
may have lower root hydraulic conductivity in wheat (Zhao et al., 2005), depending on root
anatomy and pathway of water flow (Bramley et al., 2009). Alternatively, Drysdale may be
performing hydraulic lift that its shallow roots have access to water (Shen et al., 2011).
Difference in post anthesis water use was reflected in the grain yield of these two genotypes
when watering was restricted to the bottom 30 cm of the soil profile. The grain yield in
Drysdale in WB treatment was similar to when plants were well-watered. However, the
grain yield of IGW-3262 was reduced by 23%, proportional to the reduction in post-
anthesis water use. This is supported by Kirkegaard (2007) and Manschadi et al. (2006) that
every extra millimetre of water captured during grain filling results in yield advantage.
Yield reduction in IGW-3262 when post-anthesis watering was limited to the bottom 30 cm
of the soil profile in the pots (WB) resulted from a reduction in the number of spikes per
Chapter 6 – Root capacity to uptake water
124
plant and consequently less grains per plant than when plants were well-watered (WW).
This may be due to the reduction in gs observed in IGW-3262 soon after anthesis. Water
deficit at anthesis is reported to affect the number of grains (Liu et al., 2005). However,
1000-grain weight was maintained similar to WW treatment. Gain filling was not affected
as the gs in WB treatment returned to that of WW when watering was provided to bottom
30 cm of the soil profile. Reduction in the number of spikes to maintain 1000-grain weight
has been reported in durum wheat under terminal drought conditions (Giunta et al., 1993).
Grain yield in Drysdale was higher than IGW-3262 when plants were well-watered (WW)
throughout grain-filling, resulting in higher WUE. WUE in wheat is closely associated with
pre-anthesis water use (French and Schultz, 1984). Drysdale had 18% higher pre-anthesis
water use than IGW-3262, presumably as a consequence of difference in phenology. IGW-
3262 reached anthesis 6 days earlier than Drysdale and it is possible that the early
flowering had an effect on the growth and proliferation of the bottom roots (Palta and
Gregory, 1997). Despite the differences in time to flowering between Drysdale and IGW-
3262, physiological maturity occurred at a similar time in both genotypes. Thus, IGW-3262
had a longer grain-filling than Drysdale and hence expected to have a higher water use than
Drysdale. However, under well-watered conditions, post-anthesis water use was similar in
IGW-3262 and Drysdale, reflecting differences in their root capability to supply water to
meet plant’s demand even under well-watered conditions.
The available soil water was exhausted faster by Drysdale than by IGW-3262 when
watering was completely withheld from anthesis, which is supported by the observations
reported in Chapter 4. Better water extraction efficiency of roots at depth might have
allowed Drysdale plants to extract and use more water in transpiration, leading to rapid
exhaustion of the available soil water (Sinclair et al., 1984). As a consequence of the fast
soil water exhaustion, gs in Drysdale commenced declining at an earlier thermal time than
Chapter 6 – Root capacity to uptake water
125
IGW-3262. This initial decline in gs when water was withheld from the soil profile could be
in response to drying the top soil (Gollan et al., 1986; Blum and Johnson, 1993).
Faster soil drying rate in Drysdale than IGW-3262 suggests that Drysdale is less
conservative in water use. Drysdale is a well-known drought tolerant cultivar, bred for high
transpiration efficiency (Condon et al., 2004), but it has been classified as non-conservative
in water use by Schoppach and Sadok (2012). This classification was mainly based on its
transpiration response to VPD. The less sensitivity of Drysdale stomata to environmental
factors observed in Chapter 4 is consistent with this conservative nature. In contrast,
Drysdale was observed to close stomata in response to soil water deficit earlier than IGW-
3262 in Chapters 4 and 5. Because of cloudy days, it was not possible to frequently
measure gs after anthesis in this study. So it is unclear whether Drysdale or IGW-3262
closed stomata earlier with changes in soil water status. Regardless of that, the reduction in
gs was greater in IGW-3262 than in Drysdale when watering was completely withheld from
the pot. This is in contrast with the gs response of IGW-3262 in Chapters 3, 4 and 5 where
gs reduction was greater in Drysdale. VPD in the glasshouse was higher during the initial
soil drying phase and IGW-3262 stomata were much sensitive to environmental factors in
chapter 4. Alternatively, intensity of water deficit experienced by IGW-3262 may be higher
than Drysdale.
leaf indicates the intensity of water stress experienced by the plant. However, isohydric
behaviour of IGW-3262 in contrast to anisohydric nature of Drysdale observed in Chapters
3and 4 suggests that similar leaf in Drysdale and IGW-3262 under the WS treatment does
not infer similar intensity of water stress. Remarkably lower gs in IGW-3262 during the
time when the soil water was allowed to be depleted to reach 60% of pot water holding
capacity suggests that stress level may be higher in IGW-3262 than Drysdale.

Chapter 6 – Root capacity to uptake water
126
As soil dried from the top, it was assumed that by 60% pot water holding capacity, the top
two-thirds of the soil pot would have completely exhausted the available soil water and the
bottom one-third of the pot (30 cm) would be at its water holding capacity. If the roots of
IGW-3262 were less active in extracting soil water from the bottom of the pot, it is likely
that this genotype exhausted the soil water from the top of the pot. In contrast, roots of
Drysdale may have extracted water more homogeneously throughout the soil profile.
Detailed measurements of the development and intensity of the post-anthesis water deficits
in different layers of soil profile were not made, but because of the differences between the
two genotypes in their root system capacity to extract soil water from the bottom, it is
possible that intensity of the water deficit in IGW-3262 may be higher than in Drysdale at
similar pot weight.
Contrasting relative stomatal response of Drysdale and IGW-3262 in chapters 3, 4 and 5
and this experiment may also be related to root properties (Aston and Lawlor, 1979). The
experimental procedures used in Chapter 4 resulted in higher soil compaction in the bottom
segment and soil compaction not only affected root growth, but also its functionality
(Dracup et al., 1992). The low capability of the bottom roots to extract water despite
sufficient water was available, may be related to mechanical impedance and poor aeration
(Tardieu et al., 1991; Atwell, 1993). Soil compaction was uniform throughout the soil
profile in Chapters 3 and 5, but the pots were small and may have exhausted soil water very
fast. In this study, soil compaction was conducive to root growth and therefore, root growth
was profuse in the bottom one-third soil column at anthesis as evident in Figure. 6.3.
Despite profuse root growth in the bottom 30 cm of the soil profile, IGW-3262 was not able
to maintain water use and grain yield in WB treatment similar to when the plants were
well-watered. Not only root distribution in the lower soil profile is important, but also its
hydraulic properties need to be favourable to allow extraction of water (Vadez, 2014).
Hydraulic conductivity of wheat roots is variable (Bramley et al., 2007) and has been
Chapter 6 – Root capacity to uptake water
127
shown to increase in response to transpiration demand in hydroponically grown plants
(Vysotskaya et al., 2003; Vysotskaya et al., 2004). Drysdale roots may have superior
hydraulic conductivity that aids water extraction in response to its high plant water demand
maintained by its gs. For instance, Drysdale roots have some compensatory adjustment to
increase the uptake of water under water deficit condition by producing more thin roots
(Saradadevi et al., 2014). Thinner new roots may imply more branching and hence more
root tips, the region where water uptake is maximum in wheat (Bramley et al., 2009).
Conversely, higher leaf observed in Drysdale may also result in higher transpiration pull
facilitating water extraction from deeper soil profile (Aston and Lawlor, 1979; Turner and
Begg, 1981). Consequently, higher water flux from the bottom roots in Drysdale than in
IGW-3262 may have diluted the drying signals from the roots in the top dry soil sustaining
stomatal conductance (Tardieu et al., 1992a).
Both adaxial and abaxial stomata in IGW-3262 responded to changing conditions similarly,
but abaxial stomata seemed to be more sensitive in Drysdale. Increased sensitivity of
abaxial stomata to water deficits and to exogenous ABA compared with adaxial stomata
has been reported in several species like broad bean (Wang et al., 1998) and lupin (Henson
et al., 1989b; Correia and Pereira, 1995). Less sensitivity of adaxial stomata in Drysdale to
changes in soil water status and environmental factors is an important feature as this
differential response may indicate minimal trade off between carbon assimilation and water
loss. Drysdale clearly has a better ability to convert biomass into grain as indicated by a
higher harvest index than IGW-3262 under all treatment conditions. However, root
characteristics clearly show more prominence in regard to capture of available soil water
effectively, even though there are chances that stomatal characteristics might have limited
IGW-3262 root to extract water at their full capacity (Acuña and Wade, 2005).
Chapter 6 – Root capacity to uptake water
128
6.5 Conclusions
Sustained post-anthesis water use is critical for grain yield maintenance in wheat under
terminal drought. Grain yield differences in wheat genotypes Drysdale and IGW-3262
when top soil dried and soil water was available in the bottom 30 cm of the soil profile in
the pots was related to their difference in post-anthesis water use, presumably as a
consequence of their root capacity to extract water from deeper layers. Drysdale exhausted
soil water faster than IGW-3262, sustained gs during minor water deficit confirming its
non-conservative behaviour. Under conditions of sufficient water available at depth, the
non-conservative approach post-anthesis appears to be more beneficial for yield. Under
conditions of limited water availability, yield reduction was massive in both genotypes
emphasising the importance of water available during grain filling for maintaining yield
under terminal drought. Further investigation is needed to unravel the mechanisms that
govern the observed difference in root capability to extract water between genotypes,
probably involving root anatomical and hydraulic properties.
Chapter7 – General discussion
129
7 General discussion
7.1 Introduction
Wheat grown in the Mediterranean-type environment of south-western Australia is often
exposed to end-of-season drought or terminal drought. This is because, in this environment,
rainfall decreases and temperature and evaporative demand increase in the spring when
wheat crops enter reproductive stage (Turner and Nicolas, 1987; Kobata et al., 1992). Post-
anthesis water deficit affects grain yield (Turner and Nicolas, 1987; Kobata et al., 1992;
Dias de Oliveira et al., 2013) due to poor grain filling resulting in shrivelled grains
(Mitchell et al., 2013). Genotypes that maintain water uptake under terminal drought have
high grain yield because this water is immediately used for grain filling (Passioura, 1983;
Angus and van Herwaarden, 2001). Down - regulating stomatal conductance (gs) under
terminal drought could prevent rapid exhaustion of soil water and conserve soil water to
facilitate water availability during grain filling. Stomatal closure in wheat under water
deficit conditions is associated with the accumulation of the plant hormone, abscisic acid
(ABA) in leaf tissues (Henson et al., 1989b; Ali et al., 1998). Studies in several species
including wheat have been conducted to demonstrate the role of ABA in regulation of
stomatal aperture, but not one has concentrated on its impact on water extraction and grain
yield. To address this issue, four glasshouse experiments were conducted exposing different
parts of the root system to dry soil after anthesis. The aim was to determine if root
distribution in drying soil affects ABA accumulation and regulation of stomatal
conductance to improve water use and grain yield under terminal drought.
7.2 Key research findings
Key findings of the experiments undertaken in this study and described in Chapters 3, 4, 5
and 6 of this thesis are summarised in Table 7.1.
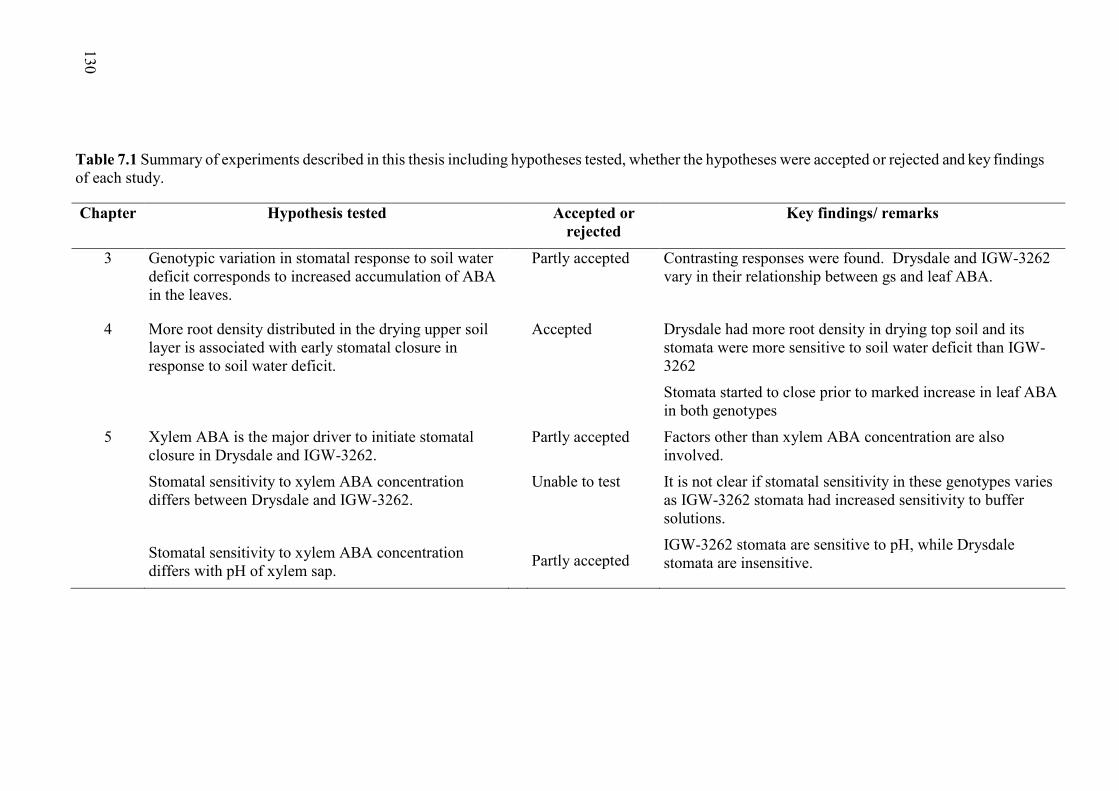
130
Table 7.1 Summary of experiments described in this thesis including hypotheses tested, whether the hypotheses were accepted or rejected and key findings of each study.
Chapter Hypothesis tested Accepted or rejected
Key findings/ remarks
3 Genotypic variation in stomatal response to soil water deficit corresponds to increased accumulation of ABA in the leaves.
Partly accepted Contrasting responses were found. Drysdale and IGW-3262 vary in their relationship between gs and leaf ABA.
4 More root density distributed in the drying upper soil layer is associated with early stomatal closure in response to soil water deficit.
Accepted Drysdale had more root density in drying top soil and its stomata were more sensitive to soil water deficit than IGW-3262
Stomata started to close prior to marked increase in leaf ABA in both genotypes
5 Xylem ABA is the major driver to initiate stomatal closure in Drysdale and IGW-3262.
Partly accepted Factors other than xylem ABA concentration are also involved.
Stomatal sensitivity to xylem ABA concentration differs between Drysdale and IGW-3262.
Stomatal sensitivity to xylem ABA concentration differs with pH of xylem sap.
Unable to test
Partly accepted
It is not clear if stomatal sensitivity in these genotypes varies as IGW-3262 stomata had increased sensitivity to buffer solutions.
IGW-3262 stomata are sensitive to pH, while Drysdale stomata are insensitive.
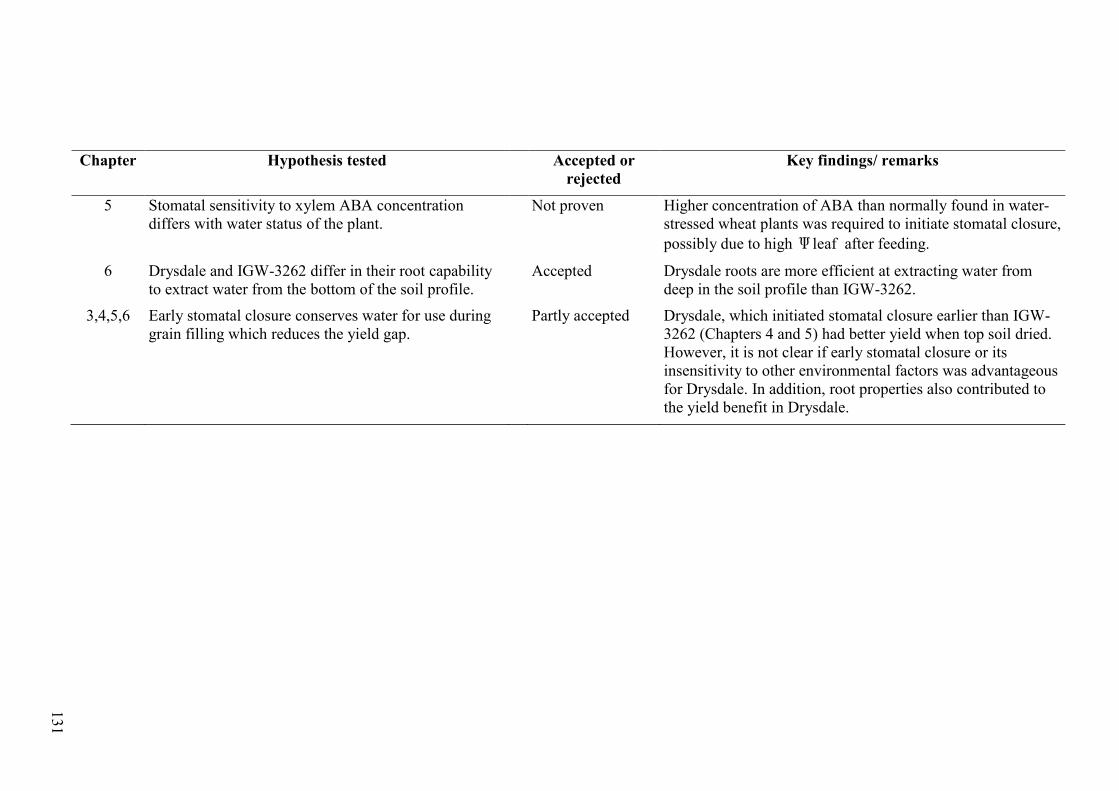
131
Chapter Hypothesis tested Accepted or rejected
Key findings/ remarks
5 Stomatal sensitivity to xylem ABA concentration differs with water status of the plant.
Not proven Higher concentration of ABA than normally found in water-stressed wheat plants was required to initiate stomatal closure, possibly due to high Ψleaf after feeding.
6 Drysdale and IGW-3262 differ in their root capability to extract water from the bottom of the soil profile.
Accepted Drysdale roots are more efficient at extracting water from deep in the soil profile than IGW-3262.
3,4,5,6 Early stomatal closure conserves water for use during grain filling which reduces the yield gap.
Partly accepted Drysdale, which initiated stomatal closure earlier than IGW-3262 (Chapters 4 and 5) had better yield when top soil dried. However, it is not clear if early stomatal closure or its insensitivity to other environmental factors was advantageous for Drysdale. In addition, root properties also contributed to the yield benefit in Drysdale.
Chapter7 – General discussion
132
Contrasting responses in gs and leaf ABA concentration, as well as contrasting responses in
leaf of four drought-tolerant genotypes were observed when one half (WD) or both halves
of the split root system (DD) were exposed to drying soil (Chapter 3). Genotypes Drysdale
and IGW-3262 had the most contrasting physiological responses; IGW-3262 reduced gs
without any noticeable increase in leaf ABA concentration or drop in leaf water potential,
but stomatal closure in Drysdale was accompanied by an increase in leaf ABA
concentration and decline in leaf water potential. Both these genotypes had slightly
different phenology, but the confounding effect of phenology on the difference in
physiological response had been minimised by initiating drought treatment separately on
each genotype when they reached anthesis. Hence, this contrasting physiological response
of these two genotypes could be interpreted as different sensitivities of the root system and
ABA production to soil drying. However, gs and leaf were only measured once after
withholding water and no soil water measurement was possible due to the split pot design.
Hence, it was not identified if Drysdale also started to close stomata before any noticeable
change in leaf or leaf ABA or if stomatal sensitivity to soil water content differed among
genotypes.
When the root systems of cultivar Drysdale and breeding line IGW-3262 were horizontally
split and either the top half of the total root system (DW) or the whole root system (DD)
was exposed to terminal drought (Chapter 4), Drysdale initiated stomatal closure earlier
than IGW-3262. Drysdale had more transpiring area and root biomass in the upper 0–35 cm
of the soil profile than IGW-3262 resulting in slightly earlier and faster soil water
depletion. The soil water content corresponding to the thermal time at which Drysdale
started reducing gs was higher than that at which IGW-3262 started closing its stomata.
The gs reduction in Drysdale at 50% pot soil water content while gs in IGW-3262 was
maintained similar to well-watered plants (Chapter 5) confirms that Drysdale stomata are
Chapter7 – General discussion
133
more sensitive to soil water deficit than IGW-3262. Considerably higher root biomass
distributed in the drying top segment in Drysdale (Chapter 4) may have served as a large
source for signal generation resulting in relatively higher leaf ABA concentration and
subsequent stomatal closure (Martin-Vertedor and Dodd, 2011).
Stomatal conductance also varied in IGW-3262, even under well-watered conditions,
suggesting a possible stomatal response to environmental conditions such as temperature,
humidity, CO2 concentration, radiation or VPD (Raschke, 1975; Xue et al., 2004). Climatic
conditions were not constant in the glasshouse across measurement days as indicated by the
fluctuations in VPD. However, it is not clear if the gs response matches the leaf-to-air VPD,
the important source of variation of gs (Bunce, 1996), which was not measured in this
study. In addition to environmental factors, other factors such as soil compaction (Tardieu
et al., 1991) and nitrogen uptake (Wilkinson et al., 2007) may also have affected gs. On the
other hand, Drysdale stomata appeared to be less sensitive to external factors as indicated
by its relatively stable gs. It is not clear if ABA is involved in the stomatal closure affected
by these factors other than soil moisture deficit or how the interaction between soil water
deficit and external factors affects the ABA concentration and gs. Analysis of ABA
metabolites suggest possible difference in ABA metabolism between Drysdale and IGW-
3262, which may influence the observed differential sensitivity of stomata in these
genotypes to soil water deficit and other unknown factors and their contrasting gs–leaf
ABA relationship.
When the top soil dried after anthesis, initiation of stomatal closure preceded any
remarkable increase in leaf ABA, suggesting that signals transmitted through xylem may be
the driver for the initial gs response to water deficit in both genotypes (Zhang and Davies,
1990a; Tardieu et al., 1992b). Thus, it appears that stomatal responses in wheat under
Chapter7 – General discussion
134
terminal drought occur in two stages: primarily in response to drying signals from the root
and secondarily in response to a leaf-derived signal (Xiong et al., 2006; Du et al., 2013).
It is not clear what served as the primary signal to initiate stomatal closure as no increase in
root ABA was observed under terminal drought treatments (DW and DD, Chapter 4).
However, feeding exogenous ABA to detached wheat leaves could initiate stomatal closure
similar to that of intact plants under drought only at high concentrations than that reported
in the xylem sap of water-stressed wheat plants. This indicates that xylem ABA may not be
the sole driver of stomatal regulation in wheat. Considering the strong relationship between
gs and leaf ABA in Drysdale, it seems that leaf ABA also plays an important role in
stomatal regulation in wheat. However, genotypic variation may exist in this relationship as
suggested by weak relationship in IGW-3262, which may be associated with possible
stomatal sensitivity differences between these genotypes. For example, difference in uptake
of NO3 from the soil as the water uptake slows down due to soil drying can result in
alkalinisation of xylem and subsequent increased stomatal sensitivity to ABA(Wilkinson et
al., 2007).
To test if there are differences between Drysdale and IGW-3262 in stomatal sensitivity to
xylem ABA concentration and pH, flag leaves from well-watered plants were fed with
buffer solutions of different concentrations of ABA at pH 6 and 7. Stomatal closure in
IGW-3262 in response to 0 ABA buffer solutions was unexpected and confirmed its
sensitivity to factors other than ABA, possibly osmolality of the solution (Kelly et al.,
2013). Alternatively, lack of signals from the roots may have restricted stomatal opening in
IGW-3262. For example, continuous supply of cytokinin from the roots was essential to
keep the stomata open in maize (Blackman and Davies, 1985). IGW-3262 stomata were
also sensitive to the solution pH indicating its sensitivity to a multitude of factors other than
Chapter7 – General discussion
135
ABA. Thus, increased sensitivity of IGW-3262 stomata to factors other than ABA explains
the weak relationship between gs and leaf ABA in IGW-3262.
The observed differences in stomatal properties between Drysdale and IGW-3262 did not
result in any yield benefit under conditions of limited post-anthesis water availability as
when watering was withheld completely after anthesis (Chapter 4). However, under
conditions of available water at depth, yield benefit was observed in Drysdale, which
initiated stomatal closure earlier in response to soil water deficit (Chapters 4 and 5), but
demonstrated less sensitivity to other possible variable environmental conditions. Drysdale
had 100% higher grain yield than IGW-3262 when watering was withheld from the top 0–
30 cm of the soil profile. Nevertheless, compared with well-watered treatments, Drysdale
also reduced yield by 50% when water was withheld from the top segment of the pot,
similar to the yield reduction observed in field-grown wheat under post-anthesis water
stress (Dias de Oliveira et al., 2013). The yield reduction in these genotypes, even when
sufficient water was available in the bottom segment for plant extraction, suggests root
limitation to extract water at depth. The soil in the bottom segment was highly compacted
which probably affected not only root growth, but also root functionality (Tardieu et al.,
1992a). However, Drysdale clearly fills grain faster and is better able to translocate biomass
from shoots to grain, probably due to its better root efficiency to extract water from deeper
soil profile.
In a 1-m soil profile with water available in the bottom 30 cm of the soil profile while the
top soil dried from anthesis, no significant yield reduction was observed in Drysdale. IGW-
3262, on the other hand, reduced yield by 25%. Yield reduction in IGW-3262 was
proportional to the reduction in post - anthesis water use. The failure of IGW-3262 bottom
roots to extract water from depth may be due to its reduced hydraulic properties which may
be linked either to root anatomy or transpiration pull driven by stomatal regulation.
Chapter7 – General discussion
136
Root anatomy and hydraulic properties of these genotypes were not studied in this thesis.
However, the relatively lower SRL in Drysdale (Chapter 3 and 4) implies thicker roots than
in IGW-3262. Thicker roots should have lower hydraulic resistance to water flow (Zhao et
al., 2005). However, this varies with root anatomy and the preferred pathway of water flow
(Bramley et al., 2009). Alternatively, wheat roots have the capacity to alter hydraulic
resistance (Bramley et al., 2007), and increased root hydraulic conductivity (inverse of
hydraulic resistivity) to meet the transpiration demand is mediated by ABA (Vysotskaya et
al., 2003; Vysotskaya et al., 2004). Drysdale roots may have increased the hydraulic
conductivity of bottom roots when the top soil was completely exhausted of water.
Moreover, Drysdale produced more thin roots in the wet compartment when the other half
of the pot was dried (Chapter 3). More root production in the wet region of the soil profile
indicates better water extraction as wheat roots absorb water predominantly through the
region near the root tip (Bramley et al., 2009). Further research should examine root
hydraulic properties and the role of ABA in modifying both root and stomatal conductance
to balance water extraction and transpiration.
7.3 Future directions and implications
Terminal drought is the most detrimental abiotic stress affecting wheat grain yield in
Mediterranean-region of south-western Australia. With the changing climatic conditions
that forecasts more frequent exposure to terminal drought in this region, identifying
physiological traits that reduce yield gap is essential. This study identified that the key to
sustaining grain yield under terminal drought conditions is a combination of gs and root
properties to facilitate better post-anthesis water use. Although we do not yet fully
understand how gs is linked to root properties in wheat, this thesis provides the foundation
for further research. Root properties that need further investigation include root
morphology, architecture and hydraulic properties in a wide range of wheat germplasm.
Chapter7 – General discussion
137
Establishing the link between gs and root hydraulic conductance may identify potential
physiological traits that plant breeders can select for to enhance grain yield under terminal
drought conditions.
This study identified contrasting stomatal sensitivity to soil water deficit in drought tolerant
wheat genotypes. While Drysdale stomata were more sensitive to soil water deficit, IGW-
3262 stomata appear to respond to factors other than soil water deficit. This study did not
confirm the factors to which IGW-3262 stomata were sensitive, but suggests it may be
related to environmental factors. Under terminal drought, where every extra millimetre of
water adds to grain yield, less stomatal sensitivity to changing atmospheric conditions as
observed in Drysdale, would be beneficial when water is available in the soil. Sensitive
stomata to atmospheric variation would limit water uptake and grain yield even though
sufficient water is available in the soil for extraction. For example, a very short period of
reduced gs at anthesis (chapter 6) reduced the number of grains considerably in IGW-3262.
However, once the soil water level starts declining, sensitive stomata to water deficit
conditions would extend the grain filling period by slowing down the water use. Further
investigations should be carried out under both controlled and field conditions to
demonstrate how the interaction of environment and soil water deficit affects gs.
This study further identifies that the genotypes differ not only in their gs response to drying
soil and other unknown factors, but also in its relationship with ABA accumulation in their
leaves. IGW-3262 stomata, which were sensitive to factors other than soil water deficit was
also sensitive to non-ABA factors. Drysdale and IGW-3262 possibly differ in ABA
metabolism, which could influence stomatal sensitivity to soil water deficit and
atmospheric conditions. In addition to gs, ABA is reported to regulate root hydraulic
conductance in wheat (Vysotskaya et al., 2003; Vysotskaya et al., 2004). Hence, it is
possible that ABA is the linking factor modulating gs and root hydraulic conductance to
Chapter7 – General discussion
138
regulate water use. If it is possible to obtain xylem sap from mature wheat plants under
water deficit conditions the mechanism behind ABA-mediated stomatal regulation and
water use could be further unravelled. Future studies involving more wheat genotypes are
required to establish genotypic variation in gs response to water stress focussing on ABA.
Accumulation of ABA in the leaf tissue under drought could probably be the trait to select
for. Then, it would be beneficial to screen larger number of genotypes as collecting leaf
samples is easier and convenient than measuring gs in the field. This is important for
developing improved wheat cultivars capable of maintaining yield under terminal drought.
139
References
ABARES. 2013. Australian commodity statistics 2013. Available: http://data.daff.gov.au/anrdl/metadata_files/pb_agcstd9abcc0022013_11a.xml [Accessed 9-12-2014].
Abdelhamid, M. T., Palta, J. A., Veneklaas, E. J., Atkins, C., Turner, N. C. & Siddique, K. H. M. 2011. Drying the surface soil reduces the nitrogen content of faba bean (Vicia faba L.) through a reduction in nitrogen fixation. Plant and Soil, 339, 351-362.
ABS. 2012. Year book Australia, 2012 Available: http://www.abs.gov.au/ausstats/[email protected]/mf/1301.0 [Accessed 9/07/2013].
Acharya, B. R. & Assmann, S. M. 2009. Hormone interactions in stomatal function. Plant Molecular Biology, 451-62.
Acuña, T. L. B. & Wade, L. J. 2005. Root penetration ability of wheat through thin wax-layers under drought and well-watered conditions. Australian Journal of Agricultural Research, 56, 1235-1244.
Ali, M., Jensen, C. R. & Mogensen, V. O. 1998. Early signals in field grown wheat in response to shallow soil drying. Functional Plant Biology, 25, 871-882.
Angus, J. F. & van Herwaarden, A. F. 2001. Increasing water use and water use efficiency in dryland wheat. Agronomy Journal, 93, 290-298.
Araus, J. L., Brown, H. R., Febrero, A., Bort, J. & Serret, M. D. 1993. Ear photosynthesis, carbon isotope discrimination and the contribution of respiratory CO2 to differences in grain mass in durum wheat. Plant, Cell & Environment, 16, 383-392.
Aschmann, H. 1973. Distribution and peculiarity of Mediterranean ecosystems. In: Di Castri, F. & Mooney, H. (eds.) Mediterranean Type Ecosystems. Springer Berlin Heidelberg.
Asseng, S., Jamieson, P. D., Kimball, B., Pinter, P., Sayre, K., Bowden, J. W. & Howden, S. M. 2004. Simulated wheat growth affected by rising temperature, increased water deficit and elevated atmospheric CO2. Field Crops Research, 85, 85-102.
Aston, M. J. & Lawlor, D. W. 1979. The Relationship between transpiration, root water uptake, and leaf water potential. Journal of Experimental Botany, 30, 169-181.
Atkinson, C. J., Davies, W. J. & Mansfield, T. A. 1989. Changes in stomatal conductance in intact ageing wheat leaves in response to abscisic acid. Journal of Experimental Botany, 40, 1021-1028.
Atwell, B. J. 1993. Response of roots to mechanical impedance. Environmental and Experimental Botany, 33, 27-40.
Atwell, B. J., Kriedemann, P. E. & Turnbull., C. G. N. 1999. Water: a limiting factor. Plants in action: adaptation in nature, performance in cultivation. Melbourne, Australia: Macmillian Education Australia Pty Ltd.
140
Aurisano, N., Bertani, A., Mattana, M. & Reggiani, R. 1993. Abscisic acid induced stress-like polyamine pattern in wheat seedlings, and its reversal by potassium ions. Physiologia Plantarum, 89, 687-692.
Austin, R. B. 1990. Prospects for genetically increasing the photosynthetic capacity of crops In: Zelitch, I. (ed.) Perspectives in Biochemical and Genetic Regulation of Photosynthesis. New York: Alan R. Liss Inc.
Bacon, M. A., Wilkinson, S. & Davies, W. J. 1998. pH-regulated leaf cell expansion in droughted plants is abscisic acid dependent. Plant Physiology, 118, 1507-1515.
Bahrun, A., Jensen, C. R., Asch, F. & Mogensen, V. O. 2002. Drought‐induced changes in xylem pH, ionic composition, and ABA concentration act as early signals in field‐grown maize (Zea mays L.). Journal of Experimental Botany, 53, 251-263.
Bauer, H., Ache, P., Lautner, S., Fromm, J., Hartung, W., Al-Rasheid, K A. S., Sonnewald, S., Sonnewald, U., Kneitz, S., Lachmann, N., Mendel, R R., Bittner, F., Hetherington, A M. & Hedrich, R. 2013. The stomatal response to reduced relative humidity requires guard cell-autonomous ABA synthesis. Current Biology, 23, 53-57.
Bingham, I. J. & Bengough, A. G. 2003. Morphological plasticity of wheat and barley roots in response to spatial variation in soil strength. Plant and Soil, 250, 273-282.
Blackman, P. G. & Davies, W. J. 1983. The effects of cytokinins and ABA on stomatal behaviour of maize and Commelina. Journal of Experimental Botany, 34, 1619-1626.
Blackman, P. G. & Davies, W. J. 1985. Root to shoot communication in maize plants of the effects of soil drying. Journal of Experimental Botany, 36, 39-48.
Blum, A. 1998. Improving wheat grain filling under stress by stem reserve mobilisation. Euphytica, 100, 77-83.
Blum, A. & Johnson, J. W. 1993. Wheat cultivars respond differently to a drying top soil and a possible non-hydraulic root signal. Journal of Experimental Botany, 44, 1149-1153.
Blum, A. & Sinmena, B. 1995. Isolation and characterization of variant wheat cultivars for ABA sensitivity. Plant, Cell & Environment, 18, 77-83.
BOM. 2002. 2002 - a dry year throughout the State [Online]. Bureau of Meteorology. Available: http://reg.bom.gov.au/announcements/media_releases/vic/20021230.shtml [Accessed 3 April 2012].
BOM. 2007. New South Wales in 2006: El Niño brings an exceptionally hot and very dry year [Online]. Available: http://www.bom.gov.au/announcements/media_releases/nsw/200701032.shtml [Accessed 3 April 2012].
141
BOM. 2008. A dry year for Perth [Online]. Available: http://www.bom.gov.au/climate/current/annual/wa/archive/2007.perth.shtml [Accessed 3 April 2012].
Borel, C. & Simonneau, T. 2002. Is the ABA concentration in the sap collected by pressurizing leaves relevant for analysing drought effects on stomata? Evidence from ABA‐fed leaves of transgenic plants with modified capacities to synthesize ABA. Journal of Experimental Botany, 53, 287-296.
Boyer, J. S. 1985. Water transport. Annual Review of Plant Physiology, 36, 473-516.
Bramley, H., Turner, N. C., Turner, D. W. & Tyerman, S. D. 2007. Comparison between gradient-dependent hydraulic conductivities of roots using the root pressure probe: the role of pressure propagations and implications for the relative roles of parallel radial pathways. Plant, Cell & Environment, 30, 861-74.
Bramley, H., Turner, N. C., Turner, D. W. & Tyerman, S. D. 2009. Roles of morphology, anatomy, and aquaporins in determining contrasting hydraulic behavior of roots. Plant Physiology, 150, 348-364.
Bunce, J. A. 1996. Does transpiration control stomatal responses to water vapour pressure deficit? Plant, Cell & Environment, 19, 131-135.
Canny, M. & McCully, M. 1988. The xylem sap of maize roots: its collection, composition and formation. Functional Plant Biology, 15, 557-566.
Chaves, M. M., Flexas, J. & Pinheiro, C. 2009. Photosynthesis under drought and salt stress: regulation mechanisms from whole plant to cell. Annals of Botany, 103, 551-560.
Chen, Y. L., Palta, J., Clements, J., Buirchell, B., Siddique, K. H. M. & Rengel, Z. 2014. Root architecture alteration of narrow-leafed lupin and wheat in response to soil compaction. Field Crops Research, 165, 61-70.
Christmann, A., Hoffmann, T., Teplova, I., Grill, E. & Muller, A. 2005. Generation of active pools of abscisic acid revealed by in vivo imaging of water-stressed Arabidopsis. Plant Physiology, 137, 209-19.
Christmann, A., Weiler, E. W., Steudle, E. & Grill, E. 2007. A hydraulic signal in root-to-shoot signalling of water shortage. The Plant Journal, 52, 167-174.
Comas, L. H., Becker, S. R., Cruz, V. M. V., Byrne, P. F. & Dierig, D. A. 2013. Root traits contributing to plant productivity under drought. Frontiers in Plant Science, 4.
Comstock, J. P. 2002. Hydraulic and chemical signalling in the control of stomatal conductance and transpiration. Journal of Experimental Botany, 53, 195-200.
Condon, A. G., Richards, R. A., Rebetzke, G. J. & Farquhar, G. D. 2004. Breeding for high water-use efficiency. Journal of Experimental Botany, 55, 2447-2460.
Correia, M. J. & Pereira, J. S. 1995. The control of leaf conductance of white lupin by xylem ABA concentration decreases with the severity of water deficits. Journal of Experimental Botany, 46, 101-110.
142
Cowan, A. K. & Railton, I. D. 1987. The catabolism of (+/-)-abscisic acid by excised leaves of Hordeum vulgare L. cv Dyan and its modification by chemical and environmental factors. Plant Physiology, 84, 157-63.
Cowan, I. R., Raven, J. A., Hartung, W. & Farquhar, G. D. 1982. A possible role for abscisic acid in coupling stomatal conductance and photosynthetic carbon metabolism in leaves. Functional Plant Biology, 9, 489-498.
Cramer, M. D. & Lewis, O. A. M. 1993. The influence of nitrate and ammonium nutrition on the growth of wheat (Triticum aestivum) and maize (Zea mays) plants. Annals of Botany, 72, 359-365.
Creelman, R. A. & Zeevaart, J. A. D. 1984. Incorporation of oxygen into abscisic acid and phaseic acid from molecular oxygen. Plant Physiology, 75, 166-9.
Cutler, A. J. & Krochko, J. E. 1999. Formation and breakdown of ABA. Trends in Plant Science, 4, 472-478.
Davies, W. J., Rodriguez, J. L. & Fiscus, E. L. 1982. Stomatal behaviour and water movement through roots of wheat plants treated with abscisic acid. Plant, Cell & Environment, 5, 485-493.
Davies, W. J. & Zhang, J. 1991. Root signals and the regulation of growth and development of plants in drying soil. Annual Review of Plant Physiology and Plant Molecular Biology, 42, 55-76.
Dembinska, O., Lalonde, S. & Saini, H. S. 1992. Evidence against the regulation of grain set by spikelet abscisic acid levels in water-stressed wheat. Plant Physiology, 100, 1599-1602.
Dias de Oliveira, E., Bramley, H., Siddique, K. H. M., Henty, S., Berger, J. & Palta, J. A. 2013. Can elevated CO2 combined with high temperature ameliorate the effect of terminal drought in wheat? Functional Plant Biology, 40, 160-171.
Dietz, K. J., Sauter, A., Wichert, K., Messdaghi, D. & Hartung, W. 2000. Extracellular -glucosidase activity in barley involved in the hydrolysis of ABA glucose conjugate in leaves. Journal of Experimental Botany, 51, 937-44.
Dodd, I. C. 2005. Root-to-shoot signalling: Assessing the roles of ‘up’ in the up and down world of long-distance signalling. Plant and Soil, 274, 251-270.
Dodd, I. C. 2007. Soil moisture heterogeneity during deficit irrigation alters root-to-shoot signalling of abscisic acid. Functional Plant Biology, 34, 439-448.
Dodd, I. C. & Davies, W. J. 1994. Leaf growth responses to ABA are temperature dependent. Journal of Experimental Botany, 45, 903-907.
Dodd, I. C. & Davies, W. J. 1996. The relationship between leaf growth and ABA accumulation in the grass leaf elongation zone. Plant, Cell & Environment, 19, 1047-1056.
Dodd, I. C., Egea, G. & Davies, W. J. 2008a. Abscisic acid signalling when soil moisture is heterogeneous: decreased photoperiod sap flow from drying roots limits abscisic acid export to the shoots. Plant, Cell & Environment, 31, 1263-1274.
143
Dodd, I. C., Egea, G. & Davies, W. J. 2008b. Accounting for sap flow from different parts of the root system improves the prediction of xylem ABA concentration in plants grown with heterogeneous soil moisture. Journal of Experimental Botany, 59, 4083-4093.
Dodd, I. C., Stikic, R. & Davies, W. J. 1996. Chemical regulation of gas exchange and growth of plants in drying soil in the field. Journal of Experimental Botany, 47, 1475-1490.
Dodd, I. C., Tan, L. P. & He, J. 2003. Do increases in xylem sap pH and/or ABA concentration mediate stomatal closure following nitrate deprivation? Journal of Experimental Botany, 54, 1281-1288.
Dodd, I. C., Theobald, J. C., Bacon, M. A. & Davies, W. J. 2006. Alternation of wet and dry sides during partial rootzone drying irrigation alters root-to-shoot signalling of abscisic acid. Functional Plant Biology, 33, 1081-1089.
Dolferus, R., Ji, X. & Richards, R. A. 2011. Abiotic stress and control of grain number in cereals. Plant Science, 181, 331-41.
Dracup, M., Belford, R. K. & Gregory, P. J. 1992. Constraints to root growth of wheat and lupin crops in duplex soils. Australian Journal of Experimental Agriculture, 32, 947-961.
Du, Y. L., Wang, Z. Y., Fan, J. W., Turner, N. C., He, J., Wang, T. & Li, F. M. 2013. Exogenous abscisic acid reduces water loss and improves antioxidant defence, desiccation tolerance and transpiration efficiency in two spring wheat cultivars subjected to a soil water deficit. Functional Plant Biology, 40, 494-506.
Else, M. A., Davies, W. J., Whitford, P. N., Hall, K. C. & Jackson, M. B. 1994. Concentrations of abscisic acid and other solutes in xylem sap from root systems of tomato and castor-oil plants are distorted by wounding and variable sap flow rates. Journal of Experimental Botany, 45, 317-323.
Else, M. A., Hall, K. C., Arnold, G. M., Davies, W. J. & Jackson, M. B. 1995. Export of abscisic acid, 1-aminocyclopropane-1-carboxylic acid, phosphate, and nitrate from roots to shoots of flooded tomato plants. Accounting for effects of xylem sap flow rate on concentration and delivery. Plant Physiology, 107, 377-384.
FAO. 2013. FAO statistical year book 2013 - World food and agriculture. Available: http://www.fao.org/economic/ess/ess-publications/ess-yearbook/en/#.VIuQ4Mm6a2o.
Farquhar, G. D. & Sharkey, T. D. 1982. Stomatal conductance and photosynthesis. Annual Review of Plant Physiology, 33, 317-345.
Farre, I. & Foster, I. 2010. Wheat yields and future climate in Western Australia. Available: http://www.agric.wa.gov.au/objtwr/imported_assets/content/lwe/cli/foster_farre_wheat_yield_drying%20climate.pdf [Accessed 13/06/2012].
144
Fischer, R. A. & Kohn, G. D. 1966. The relationship of grain yield to vegetative growth and post-flowering leaf area in the wheat crop under conditions of limited soil moisture. Australian Journal of Agricultural Research, 17, 281-295.
Flexas, J., Bota, J., Loreto, F., Cornic, G. & Sharkey, T. D. 2004. Diffusive and metabolic limitations to photosynthesis under drought and salinity in C3 plants. Plant Biology, 6, 269-79.
French, R. & Schultz, J. 1984. Water use efficiency of wheat in a Mediterranean-type environment. I. The relation between yield, water use and climate. Australian Journal of Agricultural Research, 35, 743-764.
Freundl, E., Steudle, E. & Hartung, W. 1998. Water uptake by roots of maize and sunflower affects the radial transport of abscisic acid and its concentration in the xylem. Planta, 207, 8-19.
Gallardo, M., Turner, N. C. & Ludwig, C. 1994. Water relations, gas exchange and abscisic acid content of Lupinus cosentinii leaves in response to drying different proportions of the root system. Journal of Experimental Botany, 45, 909-918.
Gallé, Á., Csiszár, J., Benyó, D., Laskay, G., Leviczky, T., Erdei, L. & Tari, I. 2013. Isohydric and anisohydric strategies of wheat genotypes under osmotic stress: Biosynthesis and function of ABA in stress responses. Journal of Plant Physiology, 170, 1389-1399.
Giunta, F., Motzo, R. & Deidda, M. 1993. Effect of drought on yield and yield components of durum wheat and triticale in a Mediterranean environment. Field Crops Research, 33, 399-409.
Gollan, T., Passioura, J. B. & Munns, R. 1986. Soil water status affects the stomatal conductance of fully turgid wheat and sunflower leaves. Functional Plant Biology, 13, 459-464.
Gollan, T., Schurr, U. & Schulze, E. D. 1992. Stomatal response to drying soil in relation to changes in the xylem sap composition of Helianthus annuus. I. The concentration of cations, anions, amino acids in, and pH of, the xylem sap. Plant, Cell & Environment, 15, 551-559.
Goodger, J. Q. D., Sharp, R. E., Marsh, E. L. & Schachtman, D. P. 2005. Relationships between xylem sap constituents and leaf conductance of well-watered and water-stressed maize across three xylem sap sampling techniques. Journal of Experimental Botany, 56, 2389-2400.
Gooding, M. J. & Davies, W. P. 1997. Wheat production and utilization: systems, quality and the environment, Cambridge, UK, CAB International.
Gooding, M. J., Ellis, R. H., Shewry, P. R. & Schofield, J. D. 2003. Effects of restricted water availability and increased temperature on the grain filling, drying and quality of winter wheat. Journal of Cereal Science, 37, 295-309.
Gowing, D. J. G., Jones, H. G. & Davies, W. J. 1993. Xylem-transported abscisic acid: the relative importance of its mass and its concentration in the control of stomatal aperture. Plant, Cell & Environment, 16, 453-459.
145
Gregory, P., Tennant, D. & Belford, R. 1992. Root and shoot growth, and water and light use efficiency of barley and wheat crops grown on a shallow duplex soil in a Mediterranean-type environment. Australian Journal of Agricultural Research, 43, 555-573.
Gregory, P. J., McGowan, M. & Biscoe, P. V. 1978a. Water relations of winter wheat: 2. Soil water relations. The Journal of Agricultural Science, 91, 103-116.
Gregory, P. J., McGowan, M., Biscoe, P. V. & Hunter, B. 1978b. Water relations of winter wheat: 1. Growth of the root system. The Journal of Agricultural Science, 91, 91-102.
Guerrero, F. & Mullet, J. E. 1986. Increased abscisic acid biosynthesis during plant dehydration requires transcription. Plant Physiology, 80, 588-591.
Hanft, J. M. & Wych, R. D. 1982. Visual indicators of physiological maturity of hard red spring wheat. Crop Science, 22, 584-588.
Hansen, H. & Dörffling, K. 1999. Changes of free and conjugated abscisic acid and phaseic acid in xylem sap of drought-stressed sunflower plants. Journal of Experimental Botany, 50, 1599-1605.
Harris, M. J., Outlaw, W. H., Mertens, R. & Weiler, E. W. 1988. Water-stress-induced changes in the abscisic acid content of guard cells and other cells of Vicia faba L. leaves as determined by enzyme-amplified immunoassay. Proceedings of the National Academy of Sciences of the United States of America, 85, 2584-2588.
Harrison, M. A. & Walton, D. C. 1975. Abscisic acid metabolism in water-stressed bean leaves. Plant Physiology, 56, 250-254.
Hartung, W., Radin, J. W. & Hendrix, D. L. 1988. Abscisic acid movement into the apoplastic solution of water-stressed cotton leaves. Role of apoplastic pH. Plant Physiology, 86, 908-913.
Hartung, W., Sauter, A. & Hose, E. 2002. Abscisic acid in the xylem: where does it come from, where does it go to? Journal of Experimental Botany, 53, 27-32.
Hartung, W. & Slovik, S. 1991. Physicochemical properties of plant growth regulators and plant tissues determine their distribution and redistribution: stomatal regulation by abscisic acid in leaves. New Phytologist, 119, 361-382.
Henson, I. E. 1985. Dependence of abscisic acid accumulation in Leaves of pearl millet (Pennisetum americanum[L.] Leeke) on rate of development of water stress. Journal of Experimental Botany, 36, 1232-1239.
Henson, I. E., Jensen, C. R. & Turner, N. C. 1989a. Leaf gas exchange and water relations of lupins and wheat. I. Shoot responses to soil water deficits. Functional Plant Biology, 16, 401-413.
Henson, I. E., Jensen, C. R. & Turner, N. C. 1989b. Leaf gas exchange and water relations of lupins and wheat. III. Abscisic acid and drought-induced stomatal closure. Functional Plant Biology, 16, 429-442.
146
Holaday, S. A., Ritchie, S. W. & Nguyen, H. T. 1992. Effects of water deficit on gas-exchange parameters and ribulose 1,5-bisphosphate carboxylase activation in wheat. Environmental and Experimental Botany, 32, 403-410.
Horton, R. F. & Moran, L. 1972. Abscisic acid inhibition of potassium influx into stomatal guard cells. Zeitschrift für Pflanzenphysiologie, 66, 193-196.
Hose, E., Steudle, E. & Hartung, W. 2000. Abscisic acid and hydraulic conductivity of maize roots: a study using cell- and root-pressure probes. Planta, 211, 874-882.
Huck, M. G., Klepper, B. & Taylor, H. M. 1970. Diurnal variations in root diameter. Plant Physiology, 45, 529-530.
Hurd, E. A. 1968. Growth of roots of seven varieties of spring wheat at high and low moisture levels. Agronomy Journal, 60, 201-205.
Innes, P., Blackwell, R. D. & Quarrie, S. A. 1984. Some effects of genetic variation in drought-induced abscisic acid accumulation on the yield and water use of spring wheat. The Journal of Agricultural Science, 102, 341-351.
Jeschke, W. D., Holobradá, M. & Hartung, W. 1997. Growth of Zea mays L. plants with their seminal roots only. Effects on plant development, xylem transport, mineral nutrition and the flow and distribution of abscisic acid (ABA) as a possible shoot to root signal. Journal of Experimental Botany, 48, 1229-1239.
Ji, X., Dong, B., Shiran, B., Talbot, M. J., Edlington, J. E., Hughes, T., White, R. G., Gubler, F. & Dolferus, R. 2011. Control of abscisic acid catabolism and abscisic acid homeostasis is important for reproductive stage stress tolerance in cereals. Plant Physiology, 156, 647-662.
Jia, W., Zhang, J. & Zhang, D.-P. 1996. Metabolism of xylem-delivered ABA in relation to ABA flux and concentration in leaves of maize and Commelina communis. Journal of Experimental Botany, 47, 1085-1091.
Jones, H. G. 1998. Stomatal control of photosynthesis and transpiration. Journal of Experimental Botany, 49, 387-398.
Kelly, G., Moshelion, M., David-Schwartz, R., Halperin, O., Wallach, R., Attia, Z., Belausov, E. & Granot, D. 2013. Hexokinase mediates stomatal closure. The Plant Journal, 75, 977-88.
King, R. W. & Patrick, J. W. 1982. Control of assimilate movement in wheat. Is abscisic acid involved? Zeitschrift für Pflanzenphysiologie, 106, 375-380.
Kirkegaard, J. A., Lilley, J. M., Howe G. N., Graham J. M. 2007. Impact of subsoil water use on wheat yield. Australian Journal of Agricultural Research, 58, 303-315.
Kobata, T., Palta, J. A. & Turner, N. C. 1992. Rate of development of postanthesis water deficits and grain filling of spring wheat. Crop Science, 32, 1238-1242.
Kramer, P. J. 1980. Drought, stress, and the origin of adaptations. In: Kramer, P. J. & Turner, N. C. (eds.) Adaptation of plants to water and high temperature stress. New York: John Wiley & Sons.
147
Kramer, P. J. 1988. Changing concepts regarding plant water relations. Plant, Cell & Environment, 11, 565-568.
Kudoyarova, G., Veselova, S., Hartung, W., Farhutdinov, R., Veselov, D. & Sharipova, G. 2011. Involvement of root ABA and hydraulic conductivity in the control of water relations in wheat plants exposed to increased evaporative demand. Planta, 233, 87-94.
Lawlor, D. W. 2002. Limitation to photosynthesis in water-stressed leaves: stomata vs. metabolism and the role of ATP. Annals of Botany, 871-85.
Lawlor, D. W. & Cornic, G. 2002. Photosynthetic carbon assimilation and associated metabolism in relation to water deficits in higher plants. Plant, Cell & Environment, 25, 275-294.
Lee, J. S., Hasenstein, K. H., Mulkey, T. J., Yang, R. L. & Evans, M. L. 1990. Effects of abscisic acid and xanthoxin on elongation and gravitropism in primary roots of Zea mays. Plant Science, 68, 17-26.
Lee, K. H., Piao, H. L., Kim, H. Y., Choi, S. M., Jiang, F., Hartung, W., Hwang, I., Kwak, J. M., Lee, I. J. & Hwang, I. 2006. Activation of glucosidase via stress-induced polymerization rapidly increases active pools of abscisic acid. Cell, 126, 1109-20.
Li, B., Feng, Z., Xie, M., Sun, M., Zhao, Y., Liang, L., Liu, G., Zhang, J. & Jia, W. 2010. Modulation of the root-sourced ABA signal along its way to the shoot in Vitis riparia×Vitis labrusca under water deficit. Journal of Experimental Botany.
Liang, J., Zhang, J. & Wong, M. H. 1997. How do roots control xylem sap ABA concentration in response to soil drying? Plant and Cell Physiology, 38, 10-16.
Liao, M., Palta, J. A. & Fillery, I. R. P. 2006. Root characteristics of vigorous wheat improve early nitrogen uptake. Australian Journal of Agricultural Research, 57, 1097-1107.
Liu, F., Jensen, C. R. & Andersen, M. N. 2005. A review of drought adaptation in crop plants: changes in vegetative and reproductive physiology induced by ABA-based chemical signals. Australian journal of agricultural research, 56, 1245-1252.
Loss, S. P. & Siddique, K. H. M. 1994. Morphological and physiological traits associated with wheat yield increases in Mediterranean environments. Advances in Agronomy, 52, 229-276.
Loveys, B. R. & Kriedemann, P. E. 1974. Internal control of stomatal physiology and photosynthesis. I. Stomatal regulation and associated changes in endogenous levels of abscisic and phaseic acids. Functional Plant Biology, 1, 407-415.
Ludwig, F. & Asseng, S. 2006. Climate change impacts on wheat production in a Mediterranean environment in Western Australia. Agricultural Systems, 90, 159-179.
Lynch, J. 1995. Root architecture and plant productivity. Plant Physiology, 109, 7-13.
MacRobbie, E. A. C. 1980. Osmotic measurements on stomatal cells of Commelina communis L. Journal of Membrane Biology, 53, 189-198.
148
MacRobbie, E. A. C. 1981. Effects of ABA in ‘isolated’ guard cells of Commelina communis L. Journal of Experimental Botany, 32, 563-572.
Mahdid, M., Kameli, A., Ehlert, C. & Simonneau, T. 2011. Rapid changes in leaf elongation, ABA and water status during the recovery phase following application of water stress in two durum wheat varieties differing in drought tolerance. Plant Physiology and Biochemistry, 49, 1077-1083.
Manschadi, A. M., Christopher, J., deVoil, P. & Hammer, G. L. 2006. The role of root architectural traits in adaptation of wheat to water-limited environments. Functional Plant Biology, 33, 823-837.
Manschadi, A. M., Hammer, G. L., Christopher, J. T. & deVoil, P. 2008. Genotypic variation in seedling root architectural traits and implications for drought adaptation in wheat (Triticum aestivum L.). Plant and Soil, 303, 115-129.
Mansfield, T. A. & Jones, R. J. 1971. Effects of abscisic acid on potassium uptake and starch content of stomatal guard cells. Planta, 101, 147-158.
Manske, G. G. B. & Vlek, P. L. G. 2002. Root architecture-wheat as a model plant. In: Waisel, Y., Eshel, A. & Kafkafi, U. (eds.) Plant Roots: the hidden half. New York: Marcel Dekker, Inc.
Martin-Vertedor, A. I. & Dodd, I. C. 2011. Root-to-shoot signalling when soil moisture is heterogeneous: increasing the proportion of root biomass in drying soil inhibits leaf growth and increases leaf abscisic acid concentration. Plant, Cell & Environment, 34, 1164-1175.
McDowell, N., Pockman, W. T., Allen, C. D., Breshears, D. D., Cobb, N., Kolb, T., Plaut, J., Sperry, J., West, A., Williams, D. G. & Yepez, E. A. 2008. Mechanisms of plant survival and mortality during drought: why do some plants survive while others succumb to drought? New Phytologist, 178, 719-739.
Meidner, H. & Mansfield, T. A. 1968. Physiology of stomata, McGraw-Hill, London.
Mendiburu, F. 2010. Agricolae: Statistical procedures for agricultural research. R package version 1.0-9 [Online]. Available: http://CRAN.R-project.org/package=agricolae.
Milborrow, B. V. 1967. The identification of (+)-abscisin II [(+)-dormin] in plants and measurement of its concentrations. Planta, 76, 93-113.
Mitchell, J. H., Rebetzke, G. J., Chapman, S. C. & Fukai, S. 2013. Evaluation of reduced-tillering (tin) wheat lines in managed, terminal water deficit environments. Journal of Experimental Botany, 64, 3439-3451.
Mittelheuser, C. J. & Van Steveninck, R. F. M. 1969. Stomatal closure and inhibition of transpiration induced by (RS)-abscisic acid. Nature, 221, 281-282.
Morgan, J. M. 1980. Possible role of abscisic acid in reducing seed set in water-stressed wheat plants. Nature, 285, 655-657.
Morgan, J. M. & Condon, A. G. 1986. Water use, grain yield, and osmoregulation in wheat. Functional Plant Biology, 13, 523-532.
149
Morgan, J. M. & King, R. W. 1984. Association between loss of leaf turgor, abscisic acid levels and seed set in two wheat cultivars. Functional Plant Biology, 11, 143-150.
Munns, R. 1992. A leaf elongation assay detects an unknown growth inhibitor in xylem sap from wheat and barley. Functional Plant Biology, 19, 127-135.
Munns, R. & King, R. W. 1988. Abscisic acid is not the only stomatal inhibitor in the transpiration stream of wheat plants. Plant Physiology, 88, 703-708.
Munns, R., Passioura, J. B., Milborrow, B. V., James, R. A. & Close, T. J. 1993. Stored xylem sap from wheat and barley in drying soil contains a transpiration inhibitor with a large molecular size. Plant, Cell & Environment, 16, 867-872.
Munns, R. & Sharp , R. E. 1993. Involvement of abscisic acid in controlling plant growth in soil of low water potential. Australian Journal of Plant Physiology, 20, 425–437.
Netting, A. G., Theobald, J. C. & Dodd, I. C. 2012. Xylem sap collection and extraction methodologies to determine in vivo concentrations of ABA and its bound forms by gas chromatography-mass spectrometry (GC-MS). Plant Methods, 8, 1746-4811.
Newman, E. I. 1976. Water movement through root systems. Philosophical Transactions of the Royal Society of London. Series B, Biological Sciences, 273, 463-478.
O'Toole, J. C. & Bland, W. L. 1987. Genotypic variation in plant crop root systems. Advances in Agronomy, 41, 91-145.
Okamoto, M., Tanaka, Y., Abrams, S. R., Kamiya, Y., Seki, M. & Nambara, E. 2009. High humidity induces abscisic acid 8′-hydroxylase in stomata and vasculature to regulate local and systemic abscisic acid responses in Arabidopsis. Plant Physiology, 149, 825-834.
Oyanagi, A. 1994. Gravitropic response growth angle and vertical distribution of roots of wheat (Triticum aestivum L.). Plant and Soil, 165, 323-326.
Palta, J. & Watt, M. 2009. Vigorous crop root systems: Form and function for improving the capture of water and nutrients. In: Sadras, V. C. & Calderini, D. (eds.) Crop Physiology. Applications for genetic improvement and agronomy. New York: Elsevier.
Palta, J. A., Chen, X., Milroy, S. P., Rebetzke, G. J., Dreccer, M. F. & Watt, M. 2011. Large root systems: are they useful in adapting wheat to dry environments? Functional Plant Biology, 38, 347-354.
Palta, J. A., Fillery, I. R. P. & Rebetzke, G. J. 2007. Restricted-tillering wheat does not lead to greater investment in roots and early nitrogen uptake. Field Crops Research, 104, 52-59.
Palta, J. A. & Gregory, P. J. 1997. Drought affects the fluxes of carbon to roots and soil in 13C pulse-labelled plants of wheat. Soil Biology and Biochemistry, 29, 1395-1403.
Palta, J. A., Kobata, T., Turner, N. C. & Fillery, I. R. 1994. Remobilization of carbon and nitrogen in wheat as influenced by postanthesis water deficits. Crop Science, 34, 118-124.
150
Passioura, J. B. 1983. Roots and drought resistance. Agricultural Water Management, 7, 265-280.
Passioura, J. B. 1988a. Response to Dr P. J. Kramer's article, ‘Changing concepts regarding plant water relations’. Plant, Cell & Environment, 11, 569-571.
Passioura, J. B. 1988b. Root signals control leaf expansion in wheat seedlings growing in drying soil. Functional Plant Biology, 15, 687-693.
Patonnier, M. P., Peltier, J. P. & Marigo, G. 1999. Drought-induced increase in xylem malate and mannitol concentrations and closure of Fraxinus excelsior L. stomata. Journal of Experimental Botany, 50, 1223-1229.
Pei, Z.-M., Ghassemian, M., Kwak, C. M., McCourt, P. & Schroeder, J. I. 1998. Role of farnesyltransferase in ABA regulation of guard cell anion channels and plant water loss. Science, 282, 287-290.
Penny, S. 2002. Taking the why out of Wyalkatchem - the new widely adapted wheat variety. In: Jettner, R. (ed.) 2002 Cereals update. Presented at the Sheraton Hotel, Perth, Western Australia, 20-21 February 2002.
Pheloung, P. C. & Siddique, K. H. M. 1991. Contribution of stem dry matter to grain yield in wheat cultivars. Functional Plant Biology, 18, 53-64.
Pierce, M. & Raschke, K. 1980. Correlation between loss of turgor and accumulation of abscisic acid in detached leaves. Planta, 148, 174-182.
Pittock, B. 1993. Climate change: an australian guide to the science and potential impacts. Available: http://www.ccma.vic.gov.au/soilhealth/climate_change_literature_review/documents/organisations/ago/science-guide.pdf [Accessed 22/04/2013].
Popova, L. P., Outlaw Jr, W. H., Aghoram, K. & Hite, D. R. C. 2000. Abscisic acid – an intraleaf water-stress signal. Physiologia Plantarum, 108, 376-381.
Quarrie, S. A. 1980. Genotypic differences in leaf water potential, abscisic acid and proline concentrations in spring wheat during drought stress. Annals of Botany, 46, 383-394.
Quarrie, S. A. & Henson, I. E. 1981. Abscisic acid accumulation in detached cereal leaves in response to water stress: II. Effects of leaf age and leaf position. Zeitschrift für Pflanzenphysiologie, 101, 439-446.
Quarrie, S. A. & Jones, H. G. 1977. Effects of abscisic acid and water stress on development and morphology of wheat. Journal of Experimental Botany, 28, 192-203.
Quarrie, S. A. & Lister, P. G. 1983. Characterization of spring wheat genotypes differing in drought-induced abscisic acid accumulation. Journal of Experimental Botany, 34, 1260-1270.
R Development Core Team. 2011. R: A language and environment for statistical computing [Online]. R Foundation for Statistical Computing,Vienna, Austria. Available: http://www.R-project.org/.
151
Ragab, R. & Prudhomme, C. 2002. Climate change and water resources management in arid and semi-arid regions: prospective and challenges for the 21st century. Biosystems Engineering, 81, 3-34.
Rajala, A., Hakala, K., Mäkelä, P., Muurinen, S. & Peltonen-Sainio, P. 2009. Spring wheat response to timing of water deficit through sink and grain filling capacity. Field Crops Research, 114, 263-271.
Raschke, K. 1975. Stomatal action. Annual Review of Plant Physiology, 26, 309-340.
Richards, R. A. & Passioura, J. B. 1989. A breeding program to reduce the diameter of the major xylem vessel in the seminal roots of wheat and its effect on grain yield in rain-fed environments. Australian Journal of Agricultural Research, 40, 943-950.
Richards, R. A., Watt, M. & Rebetzke, G. J. 2007. Physiological traits and cereal germplasm for sustainable agricultural systems. Euphytica, 154, 409-425.
Ritchie, J. T. 1981. Water dynamics in the soil-plant-atmosphere system. Plant and Soil, 58, 81-96.
Saab, I. N. & Sharp, R. E. 1989. Non-hydraulic signals from maize roots in drying soil: inhibition of leaf elongation but not stomatal conductance. Planta, 179, 466-474.
Sadras, V. O. & Milroy, S. P. 1996. Soil-water thresholds for the responses of leaf expansion and gas exchange: A review. Field Crops Research, 47, 253-266.
Saini, H. S. & Aspinall, D. 1981. Effect of water deficit on sporogenesis in wheat (Triticum aestivum L.). Annals of Botany, 48, 623-633.
Saradadevi, R., Bramley, H., Siddique, K. H. M., Edwards, E. & Palta, J. A. 2014. Contrasting stomatal regulation and leaf ABA concentrations in wheat genotypes when split root systems were exposed to terminal drought. Field Crops Research, 162, 77-86.
Sauter, A., Dietz, K. J. & Hartung, W. 2002. A possible stress physiological role of abscisic acid conjugates in root-to-shoot signalling. Plant, Cell & Environment, 25, 223-228.
Sauter, A. & Hartung, W. 2002. The contribution of internode and mesocotyl tissues to root‐to‐shoot signalling of abscisic acid. Journal of Experimental Botany, 53, 297-302.
Schachtman, D. P. & Goodger, J. Q. D. 2008. Chemical root to shoot signaling under drought. Trends in Plant Science, 13, 281-7.
Schmidt, J. W. 1983. Drought resistance and wheat breeding. Agricultural Water Management, 7, 181-194.
Schoppach, R. & Sadok, W. 2012. Differential sensitivities of transpiration to evaporative demand and soil water deficit among wheat elite cultivars indicate different strategies for drought tolerance. Environmental and Experimental Botany, 84, 1-10.
152
Schoppach, R., Wauthelet, D., Jeanguenin, L. & Sadok, W. 2014. Conservative water use under high evaporative demand associated with smaller root metaxylem and limited trans-membrane water transport in wheat. Functional Plant Biology, 41, 257-269.
Schroeder, J. I. & Nambara, E. 2006. A quick release mechanism for abscisic acid. Cell, 126, 1023-5.
Schultz, H. R. 2003. Differences in hydraulic architecture account for near-isohydric and anisohydric behaviour of two field-grown Vitis vinifera L. cultivars during drought. Plant, Cell & Environment, 26, 1393-1405.
Schulze, E. D. 1986. Carbon dioxide and water vapor exchange in response to drought in the atmosphere and in the soil. Annual Review of Plant Physiology, 37, 247-274.
Schulze, E. D., Steudle, E., Gollan, T. & Schurr, U. 1988. Response to Dr P. J. Kramer's article, ‘Changing concepts regarding plant water relations’, Volume 11, Number 7, pp. 565–568. Plant, Cell & Environment, 11, 573-576.
Schurr, U. 1998. Xylem sap sampling—new approaches to an old topic. Trends in Plant Science, 3, 293-298.
Schurr, U., Gollan, T. & Schulze, E. D. 1992. Stomatal response to drying soil in relation to changes in the xylem sap composition of Helianthus annuus. II. Stomatal sensitivity to abscisic acid imported from the xylem sap. Plant, Cell & Environment, 15, 561-567.
Schwartz, A., Wu, W. H., Tucker, E. B. & Assmann, S. M. 1994. Inhibition of inward K+ channels and stomatal response by abscisic acid: an intracellular locus of phytohormone action. Proceedings of the National Academy of Sciences of the United States of America, 91, 4019-4023.
Seo, M. & Koshiba, T. 2011. Transport of ABA from the site of biosynthesis to the site of action. Journal of Plant Research, 124, 501-7.
Serraj, R. & Sinclair, T. R. 2002. Osmolyte accumulation: can it really help increase crop yield under drought conditions? Plant, Cell & Environment, 25, 333-341.
Shen, Y., Zhang, Y. & Li, S. 2011. Nutrient effects on diurnal variation and magnitude of hydraulic lift in winter wheat. Agricultural Water Management, 98, 1589-1594.
Siddique, K. H. M., Belford, R. K., Perry, M. W. & Tennant, D. 1989. Growth, development and light interception of old and modern wheat cultivars in a Mediterranean-type environment. Australian Journal of Agricultural Research, 40, 473-487.
Siddique, K. H. M., Belford, R. K. & Tennant, D. 1990a. Root:shoot ratios of old and modern, tall and semi-dwarf wheats in a mediterranean environment. Plant and Soil, 121, 89-98.
Siddique, K. H. M., Tennant, D., Perry, M. W. & Belford, R. K. 1990b. Water use and water use efficiency of old and modern wheat cultivars in a Mediterranean-type environment. Australian Journal of Agricultural Research, 41, 431-447.
153
Simane, B., Struik, P. C., Nachit, M. M. & Peacock, J. M. 1993. Ontogenetic analysis of yield components and yield stability of durum wheat in water-limited environments. Euphytica, 71, 211-219.
Sinclair, T. R., Tanner, C. B. & Bennett, J. M. 1984. Water-use efficiency in crop production. BioScience, 34, 36-40.
Slovik, S., Daeter, W. & Hartung, W. 1995. Compartmental redistribution and long-distance transport of abscisic acid (ABA) in plants as influenced by environmental changes in the rhizosphere —a biomathematical model. Journal of Experimental Botany, 46, 881-894.
Sobeih, W. Y., Dodd, I. C., Bacon, M. A., Grierson, D. & Davies, W. J. 2004. Long-distance signals regulating stomatal conductance and leaf growth in tomato (Lycopersicon esculentum) plants subjected to partial root-zone drying. Journal of Experimental Botany, 55, 2353-2363.
Song, L., Li, F. M., Fan, X. W., Xiong, Y. C., Wang, W. Q., Wu, X. B. & Turner, N. C. 2009. Soil water availability and plant competition affect the yield of spring wheat. European Journal of Agronomy, 31, 51-60.
Speirs, J., Binney, A., Collins, M., Edwards, E. & Loveys, B. 2013. Expression of ABA synthesis and metabolism genes under different irrigation strategies and atmospheric VPDs is associated with stomatal conductance in grapevine (Vitis vinifera L. cv Cabernet Sauvignon). Journal of Experimental Botany, 64, 1907-1916.
Steudle, E. & Peterson, C. A. 1998. How does water get through roots? Journal of Experimental Botany, 49, 775-788.
Stoll, M., Loveys, B. & Dry, P. 2000. Hormonal changes induced by partial rootzone drying of irrigated grapevine. Journal of Experimental Botany, 51, 1627-1634.
Tambussi, E. A., Bort, J. & Araus, J. L. 2007. Water use efficiency in C3 cereals under Mediterranean conditions: a review of physiological aspects. Annals of Applied Biology, 150, 307-321.
Tardieu, F. & Davies, W. J. 1992. Stomatal response to abscisic acid is a function of current plant water status. Plant Physiology, 98, 540-545.
Tardieu, F. & Davies, W. J. 1993. Integration of hydraulic and chemical signalling in the control of stomatal conductance and water status of droughted plants. Plant, Cell & Environment, 16, 341-349.
Tardieu, F., Katerji, N., Bethenod, O., Zhang, J. & Davies, W. J. 1991. Maize stomatal conductance in the field: its relationship with soil and plant water potentials, mechanical constraints and ABA concentration in the xylem sap. Plant, Cell & Environment, 14, 121-126.
Tardieu, F., Lafarge, T. & Simonneau, T. 1996. Stomatal control by fed or endogenous xylem ABA in sunflower: interpretation of correlations between leaf water potential and stomatal conductance in anisohydric species. Plant, Cell & Environment, 19, 75-84.
154
Tardieu, F., Zhang, J. & Davies, W. J. 1992a. What information is conveyed by an ABA signal from maize roots in drying field soil? Plant, Cell & Environment, 15, 185-191.
Tardieu, F., Zhang, J. & Gowing, D. J. G. 1993. Stomatal control by both [ABA] in the xylem sap and leaf water status: a test of a model for draughted or ABA-fed field-grown maize. Plant, Cell & Environment, 16, 413-420.
Tardieu, F., Zhang, J., Katerji, N., Bethenod, O., Palmer, S. & Davies, W. J. 1992b. Xylem ABA controls the stomatal conductance of field-grown maize subjected to soil compaction or soil drying. Plant, Cell & Environment, 15, 193-197.
Travaglia, C., Cohen, A. C., Reinoso, H., Castillo, C. & Bottini, R. 2007. Exogenous abscisic acid increases carbohydrate accumulation and redistribution to the grains in wheat grown under field conditions of soil water restriction. Journal of Plant Growth Regulation, 26, 285-289.
Travaglia, C., Reinoso, H., Cohen, A., Luna, C., Tommasino, E., Castillo, C. & Bottini, R. 2010. Exogenous ABA increases yield in field-grown wheat with moderate water restriction. Journal of Plant Growth Regulation, 29, 366-374.
Trejo, C. L., Davies, W. J. & Ruiz, L. 1993. Sensitivity of Stomata to Abscisic Acid. An Effect of the Mesophyll. Plant Physiology, 102, 497-502.
Turner, N. C. 1986. Crop water deficits: A decade of progress. Advances in Agronomy, Volume 39, 1-51.
Turner, N. C. 1988. Measurement of plant water status by the pressure chamber technique. Irrigation Science, 9, 289-308.
Turner, N. C. & Asseng, S. 2005. Productivity, sustainability, and rainfall-use efficiency in Australian rainfed Mediterranean agricultural systems. Australian Journal of Agricultural Research, 56, 1123-1136.
Turner, N. C. & Begg, J. E. 1981. Plant-water relations and adaptation to stress. Plant and Soil, 58, 97-131.
Turner, N. C. & Nicolas, M. E. 1987. Drought resistance of wheat for light-textured soils in a Mediterranean climate. In: Srivastava, J. P., Porceddu, E., Acevedo, E. & Varma, S. (eds.). Capri, Italy: John Wiley & Sons.
Vadez, V. 2014. Root hydraulics: The forgotten side of roots in drought adaptation. Field Crops Research.
Vysotskaya, L. B., Arkhipova, T. N., Timergalina, L. N., Dedov, A. V., Veselov, S. Y. & Kudoyarova, G. R. 2004. Effect of partial root excision on transpiration, root hydraulic conductance and leaf growth in wheat seedlings. Plant Physiology and Biochemistry, 42, 251-5.
Vysotskaya, L. B., Kudoyarova, G. R., Veselov, S. & Jones, H. G. 2003. Unusual stomatal behaviour on partial root excision in wheat seedlings. Plant, Cell & Environment, 27, 69-77.
155
Wang, X.-Q., Wu, W.-H. & Assmann, S. M. 1998. Differential responses of abaxial and adaxial guard cells of broad bean to abscisic acid and calcium. Plant Physiology, 118, 1421-1429.
Wasson, A. P., Richards, R. A., Chatrath, R., Misra, S. C., Prasad, S. V. S., Rebetzke, G. J., Kirkegaard, J. A., Christopher, J. & Watt, M. 2012. Traits and selection strategies to improve root systems and water uptake in water-limited wheat crops. Journal of Experimental Botany, 63, 3485-3498.
Westgate, M. E., Passioura, J. B. & Munns, R. 1996. Water status and ABA content of floral organs in drought-stressed wheat. Functional Plant Biology, 23, 763-772.
White, R. G. & Kirkegaard, J. A. 2010. The distribution and abundance of wheat roots in a dense, structured subsoil-implications for water uptake. Plant Cell & Environment, 33, 133-48.
Wilkinson, S., Bacon, M. A. & Davies, W. J. 2007. Nitrate signalling to stomata and growing leaves: interactions with soil drying, ABA, and xylem sap pH in maize. Journal of Experimental Botany, 58, 1705-1716.
Wilkinson, S., Corlett, J. E., Oger, L. & Davies, W. J. 1998. Effects of xylem pH on transpiration from wild-type and flacca tomato leaves. Plant Physiology, 117, 703-709.
Wilkinson, S. & Davies, W. J. 1997. Xylem sap pH increase: A drought signal received at the apoplastic face of the guard cell that involves the suppression of saturable abscisic acid uptake by the epidermal symplast. Plant Physiology, 113, 559-573.
Wilkinson, S., Kudoyarova, G. R., Veselov, D. S., Arkhipova, T. N. & Davies, W. J. 2012. Plant hormone interactions: innovative targets for crop breeding and management. Journal of Experimental Botany, 63, 3499-3509.
Wright, S. T. C. 1969. An increase in the “inhibitor-β” content of detached wheat leaves following a period of wilting. Planta, 86, 10-20.
Xiong, Y. C., Li, F. M., Xu, B. C. & Hodgkinson, K. C. 2006. Hydraulic and non-hydraulic root-sourced signals in old and modern spring wheat cultivars in a semiarid area. Journal of Plant Growth Regulation, 25, 120-136.
Xu, Z.-Y., Lee, K. H., Dong, T., Jeong, J. C., Jin, J. B., Kanno, Y., Kim, D. H., Kim, S. Y., Seo, M., Bressan, R. A., Yun, D.-J. & Hwang, I. 2012. A vacuolar β-glucosidase homolog that possesses glucose-conjugated abscisic acid hydrolyzing activity plays an important role in osmotic stress responses in Arabidopsis. The Plant Cell 24, 2184-2199.
Xue, Q., Weiss, A., Arkebauer, T. J. & Baenziger, P. S. 2004. Influence of soil water status and atmospheric vapor pressure deficit on leaf gas exchange in field-grown winter wheat. Environmental and Experimental Botany, 51, 167-179.
Yang, J., Zhang, J., Huang, Z., Zhu, Q. & Wang, L. 2000. Remobilization of carbon reserves is improved by controlled soil-drying during grain filling of wheat. Crop Science, 40, 1645-1655.
156
Yao, Y., Liu, X., Li, Z., Ma, X., Rennenberg, H., Wang, X. & Li, H. 2013. Drought-induced H2O2 accumulation in subsidiary cells is involved in regulatory signaling of stomatal closure in maize leaves. Planta, 238, 217-227.
Zadoks, J. C., Chang, T. T. & Konzak, C. F. 1974. A decimal code for the growth stages of cereals. Weed Research, 14, 415-421.
Zeevaart, J. A. D. & Boyer, G. L. 1984. Accumulation and transport of abscisic acid and its metabolites in Ricinus and Xanthium. Plant Physiology, 74, 934-9.
Zeevaart, J. A. D. & Creelman, R. A. 1988. Metabolism and physiology of abscisic acid. Annual Review of Plant Physiology and Plant Molecular Biology, 39, 439-473.
Zelitch, I. 1967. Control of leaf stomata- their role in transpiration and photosynthesis. American Scientist, 55, 472-486.
Zhang, J. & Davies, W. J. 1987. Increased synthesis of ABA in partially dehydrated root tips and ABA transport from roots to leaves. Journal of Experimental Botany, 38, 2015-2023.
Zhang, J. & Davies, W. J. 1990a. Changes in the concentration of ABA in xylem sap as a function of changing soil water status can account for changes in leaf conductance and growth. Plant, Cell & Environment, 13, 277-285.
Zhang, J. & Davies, W. J. 1990b. Does ABA in the xylem control the rate of leaf growth in soil-dried maize and sunflower plants? Journal of Experimental Botany, 41, 1125-1132.
Zhang, J. & Davies, W. J. 1991. Antitranspirant activity in xylem sap of maize plants. Journal of Experimental Botany, 42, 317-321.
Zhang, J., Schurr, U. & Davies, W. J. 1987. Control of stomatal behaviour by abscisic acid which apparently originates in the roots. Journal of Experimental Botany, 38, 1174-1181.
Zhang, X., Chen, S., Sun, H., Pei, D. & Wang, Y. 2008. Dry matter, harvest index, grain yield and water use efficiency as affected by water supply in winter wheat. Irrigation Science, 27, 1-10.
Zhao, C.-X., Deng, X.-P., Shan, L., Steudle, E., Zhang, S.-Q. & Ye, Q. 2005. Changes in root hydraulic conductivity during wheat evolution. Journal of Integrative Plant Biology, 47, 302-310.
Zhou, R., Cutler, A. J., Ambrose, S. J., Galka, M. M., Nelson, K. M., Squires, T. M., Loewen, M. K., Jadhav, A. S., Ross, A. R. S., Taylor, D. C. & Abrams, S. R. 2004. A new abscisic acid catabolic pathway. Plant Physiology, 134, 361-369.
157
Appendix 1
Article published in Field Crops Research, 2014, 162, 77-86.
158
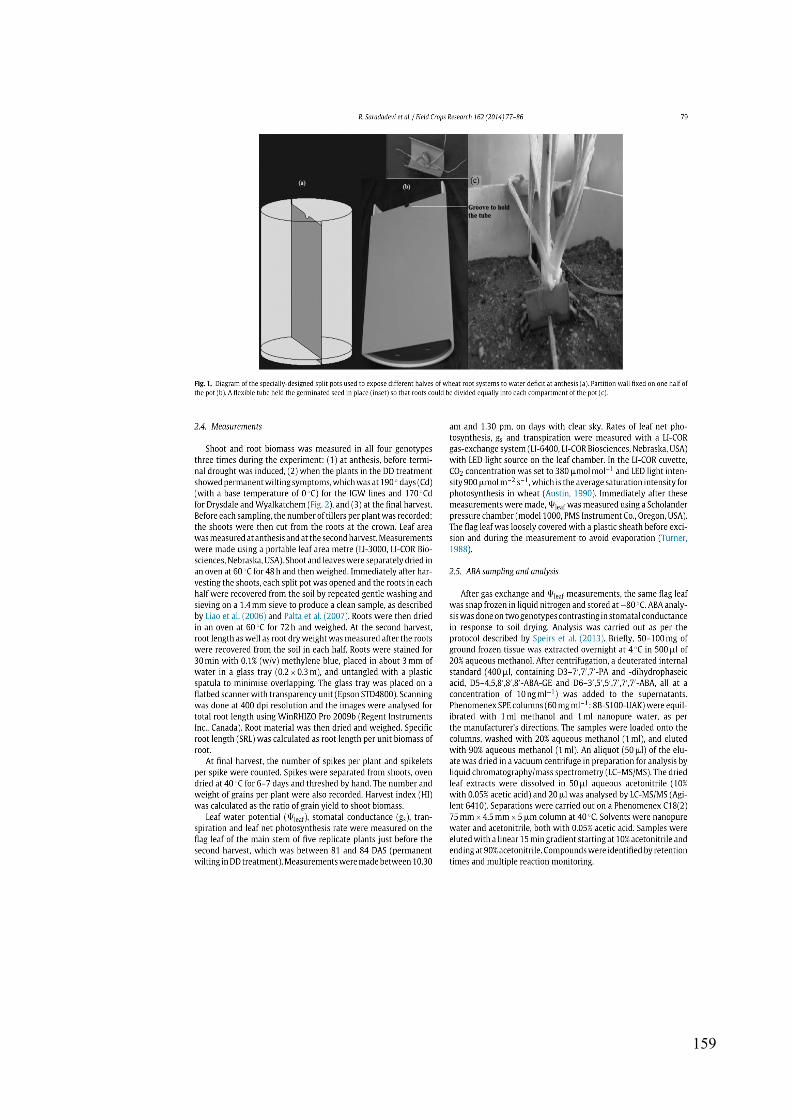
159
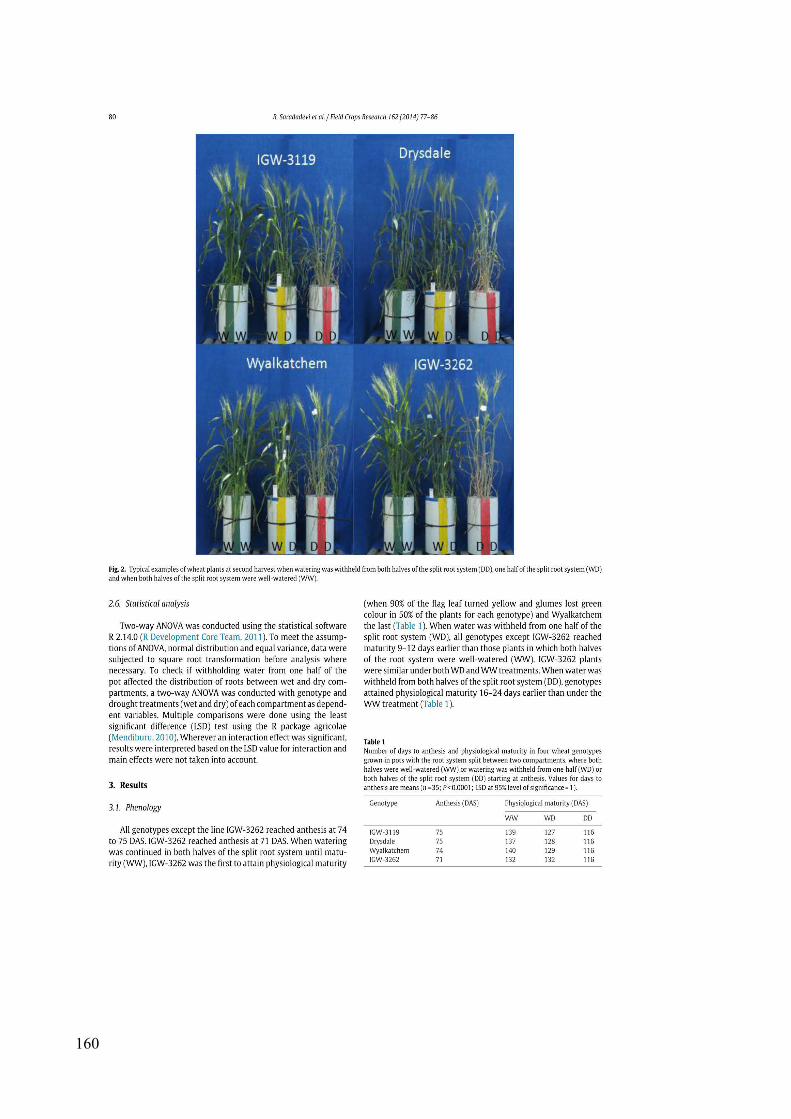
160
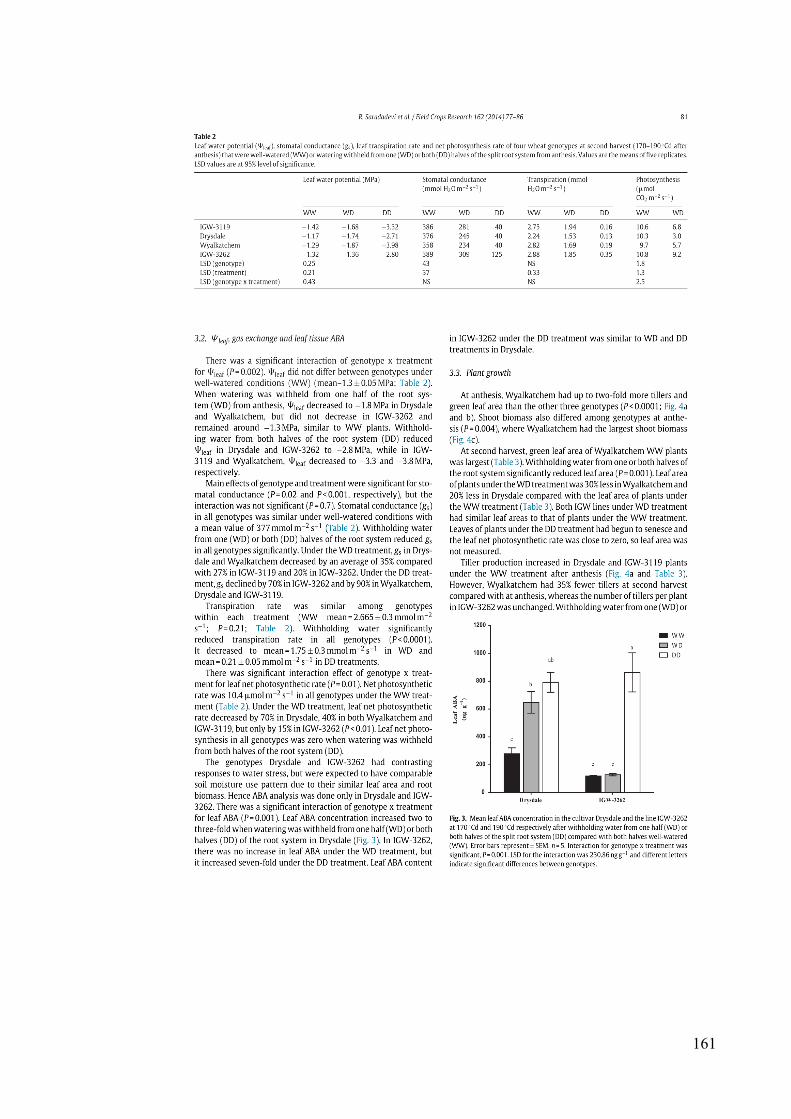
161
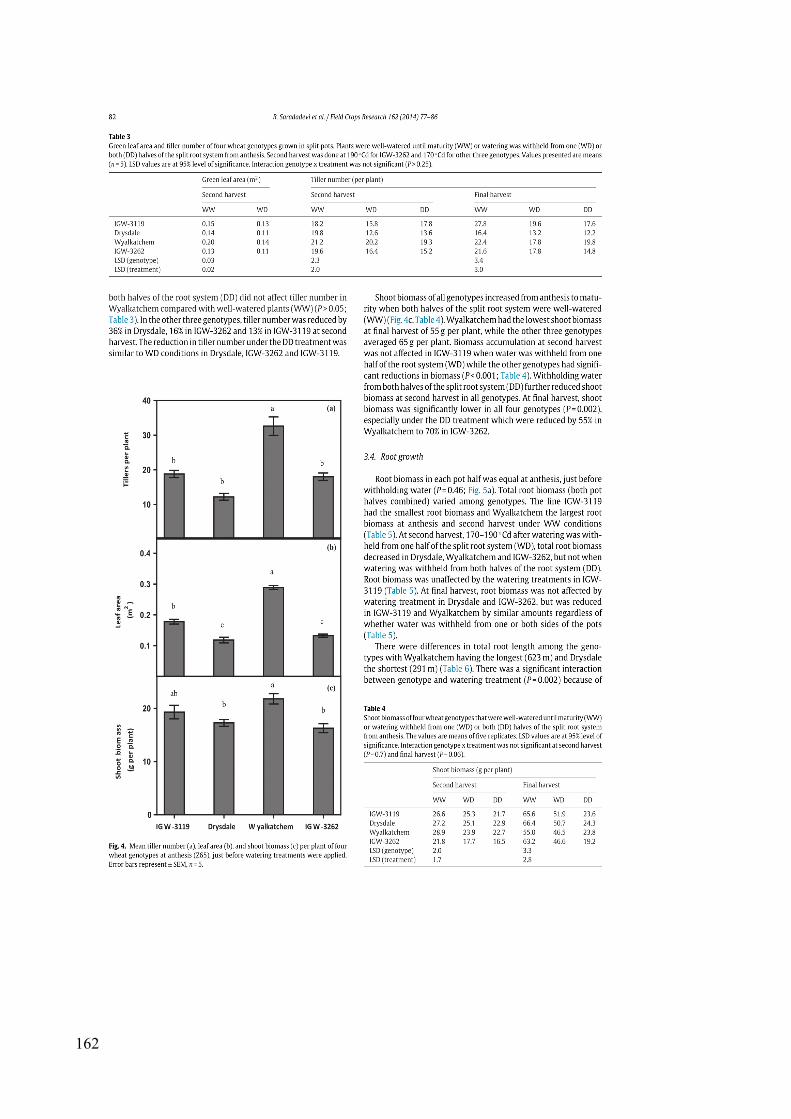
162
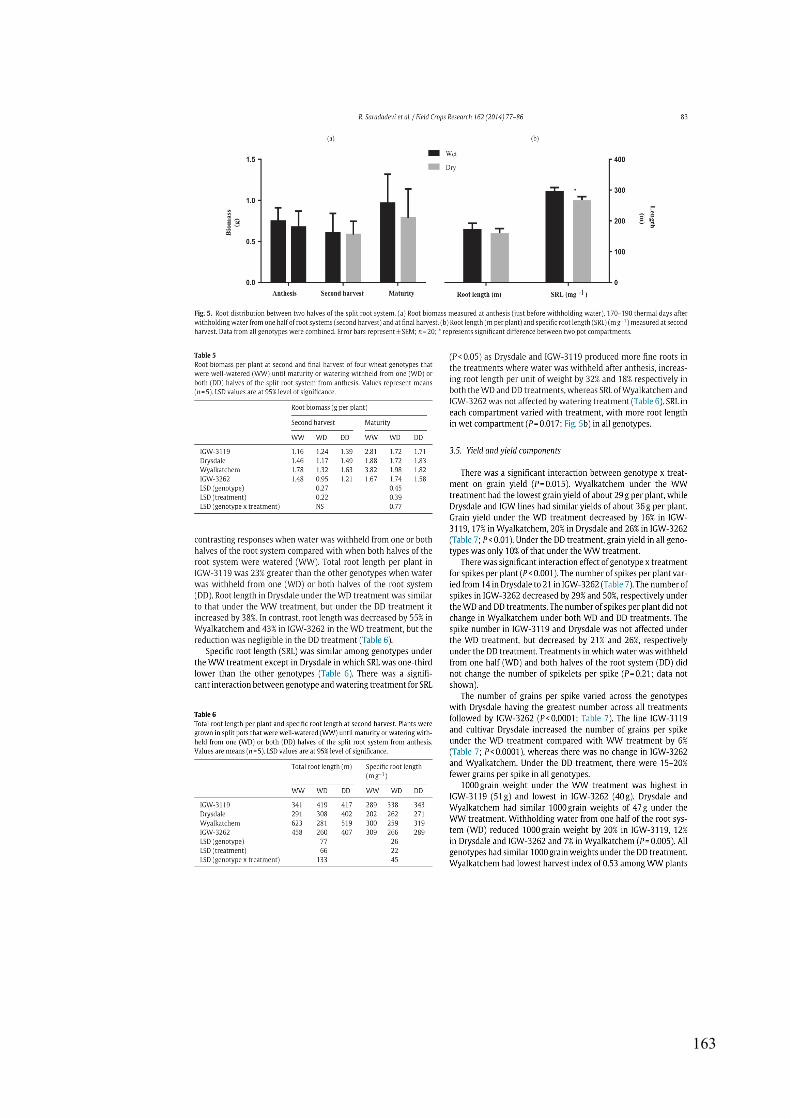
163
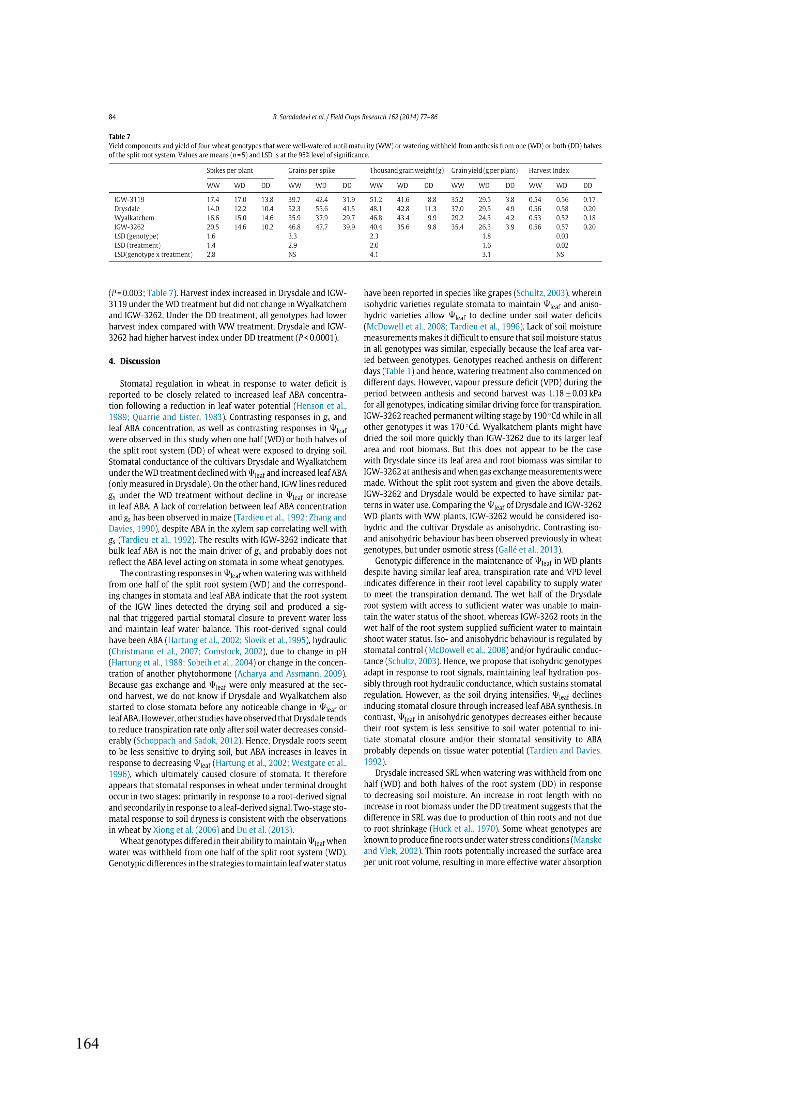
164
165
166


![Review Article Physiological Implications of Hydrogen ...downloads.hindawi.com/journals/omcl/2015/397502.pdf · oxide (NO) during ethylene-induced stomatal closure [ ]. However, the](https://img.pdfslide.us/doc/110x75/601ecbb10ea61746707bd3c0/review-article-physiological-implications-of-hydrogen-oxide-no-during-ethylene-induced.jpg)