Embed Size (px)
Citation preview
Physiological and Genetic Investigations of Iron
Deficiency in Field Peas (Pisum sativum L.)
by
Uyek M. Yakop M.Ag.Sc. University of Adelaide
Thesis submitted to the University of Adelaide
for the degree of
Doctor of Philosophy
School of Agriculture, Food and Wine
Faculty of Sciences, University of Adelaide
July 2012
i
TABLE OF CONTENTS Page Table of Contents i Abstract v Declaration ix Acknowledgements xi Abbreviations xii Chapter 1 – General Introduction
1
Chapter 2 – Literature review
5
2.1 Introduction 5 2.2 Fe in Soil 7 2.2.1 Content and Distribution of Fe in Soil 7 2.2.2 Solubility and Mobility of Fe in Soil 8 2.3 Availability of Fe in Plants 10 2.3.1 Fe Concentration in Plants 10 2.3.2 Fe Uptake and Mobilisation 11 2.3.3 Movement of Fe within Plants 12 2.3.4 Fe Deficiency in Plants 14 2.3.5 Factors Affecting Fe Deficiency 15 2.3.6 Correction of Fe Deficiency 17 2.4 Mechanisms and Inheritance of Nutrient Efficiency 19 2.4.1 Mechanism of Tolerance to Nutrient Deficiency 19 2.4.2 Inheritance of Nutrient Efficiency 19 2.5 The Assessment of Nutrient Efficiency 21 2.5.1 Development of a Suitable Screening Technique 21 Field screening 22 Potted soil and nutrient solution tests 23 In vitro screening methods 25 2.5.2 The Rating of Tolerance to Nutrient Efficiency 25 2.6 Field pea (Pisum sativum L.) 26 2.7 Conclusion 30 Chapter 3 – Development of a screening method to identify peas tolerant to
Fe deficiency
33
3.1 Introduction 33 3.2 Development of a solution screening method to identify peas tolerant to Fe
deficiency (Experiment 1)
35 3.2.1 Introduction 35 3.2.2 General Materials and Methods 35 Genetic materials 35 Container and solution preparation
Experimental design 36 38
ii
3.2.3 Experiment 1.1 The Effect of NaHCO3 on Fe deficiency chlorosis symptoms of field peas
39
3.2.3.1 Material and Methods 39 3.2.3.2 Results 40 Solution pH 40 Chlorosis symptoms 40 Chlorosis symptoms in different NaHCO3 concentrations 40 Chlorosis symptoms amongst genotypes 43 The growth of plants 45 Effect of NaHCO3 on Root/Shoot Ratio 48 3.2.4 Experiment 1.2 The effect of KHCO3 on Fe deficiency chlorosis
symptoms of field peas 50
3.2.4.1 Introduction 50 3.2.4.2 Selecting sample genotypes 51 3.2.4.2.1 Materials and Methods 51 3.2.4.2.2 Results 51 3.2.4.3 The effect of KHCO3 concentration on Fe deficiency chlorosis
symptoms
55 3.2.4.3.1 Materials and Methods 55 3.2.4.3.2 Results 56 The development of chlorosis symptoms 56 The most severe chlorosis symptoms 58 Increase in chlorosis 59 Growth of plants 60 3.3 Development of soil screening method to identify peas tolerant to Fe
deficiency (Experiment 2) 65 3.3.1 Introduction 65 3.3.2 Materials and Methods 66 Soils and pots 66 Genetic materials 67 Experimental design 67 3.3.3 Results 68 Chlorosis symptoms 68 Shoot dry weight 72 Nutrient concentration 73 3.4 The effect of soil moisture on expression of Fe deficiency chlorosis
(Experiment 3) 90
3.4.1 Introduction 90 3.4.2 Materials and Methods 90 Genetic materials 90 Soils and pots 90 Experimental design 91 3.4.3 Results 91 Chlorosis symptoms 91 Shoot dry weight 93 3.5 Confirmation that chlorosis is due to Fe deficiency (Experiment 4) 96
iii
3.5.1 Introduction 96 3.5.2 Material and Methods 97 3.5.3 Results 97 3.6 Discussion 101 Chapter 4 - Investigations into the physiological basis for Fe efficiency in field
peas
109 4.1 Introduction 109 4.2 Materials and Methods 110 4.2.1 Relationship between total and active Fe concentration and chlorosis
(Experiment 1) 110
Soils and solution experiments 110 Genetic materials 110 Experimental design 111 a) Identifying active Fe concentration 111 b) Identifying the concentration of total Fe 112 c) Relationship between active Fe and concentration of total Fe 112 4.2.2 Relationship between Fe(III) reduction and chlorosis (Experiment 2) 113 4.3 Results 114 4.3.1 Relationship between total and active Fe concentration and chlorosis
(Experiment 1)
114 a) Concentration of active Fe 114 b) Concentration of total Fe 114 c) Relationship between active Fe and concentration of total Fe 117 4.3.2 Relationship between Fe(III) reduction and chlorosis (Experiment 2) 119 4.4 Discussion 121 Chapter 5 – Genetics of tolerance to iron deficiency in the field pea cultivar
Santi
127 5.1 Introduction 127 5.2 Materials and Methods 128 5.2.1 Evaluation of F1 hybrids 128 5.2.2 Evaluation of the F2 population and F2 derived F3 families 129 Evaluation of the F2 population 129 F2 derived F3 population 132 5.2.3 Evaluation of the BC1F1 population 133 5.3 Results 134 5.3.1 Reaction of F1 hybrids to Fe deficiency chlorosis 134 5.3.2 Evaluation of the F2 population of Parafield x Santi 137 Morphological characteristics 137 Chlorosis score 138 Chi-square analysis 138 Comparing the observed F2 population variance 139 5.3.3 Evaluation of F2 derived F3 families 140 5.3.4 Evaluation of BC1F1 population 143 5.4 Discussion 144
iv
5.4.1 Evaluation of F1 hybrids 144 5.4.2 Number of genes conferring tolerance to Fe deficiency 146 Chapter 6 – Genetics of tolerance of field pea accessions to Fe deficiency
chlorosis
149 6.1 Introduction 149 6.2 Material and Methods 150 6.3 Results 152 F2 generation 152 Santi crosses 154 Parafield crosses 155 Active Fe 159 6.4 Discussion 167 Chapter 7 – General discussion 171 Appendices 179 References 185
v
ABSTRACT
Iron (Fe) deficiency chlorosis affects both yield and quality of many species, including
cool-season food legumes and the chlorosis symptom is especially prevalent in crops
grown on calcareous soils which are widely distributed in the southern region of Australia.
Although Fe fertilizers have been used to correct the chlorosis and are effective for short
term control, cultivation of tolerant cultivars could reduce the damage in the long term for
all sensitive crops including field peas. The present study was conducted to investigate
various aspects of the genetic tolerance of field pea cultivars Santi and Parafield, in
particular, with the objective of providing the information to implement an efficient
breeding strategy for the long-term control of Fe deficiency chlorosis.
Methods to screen field peas for tolerance to Fe deficiency were developed by utilizing
both solution and pot soil cultures. Nutrient solution with a high concentration (10 mM) of
bicarbonate (HCO3-) in either the sodium (Na) or potassium (K) forms induced symptoms
of Fe deficiency and it was possible to discriminate between tolerant and sensitive field pea
genotypes. Plants grown in NaHCO3 developed symptoms indicative of Na toxicity and
therefore KHCO3 was selected for solution culture studies. On the basis of this result, 37
accessions were screened in solution culture containing 10 mM KHCO3 and eight
accessions that were representative of the range of response to Fe deficiency chlorosis and
variation in plant morphologies were selected for physiological and genetic studies. These
included Santi, Px-95-183-7-1, Px-89-82-1 and Px-97-58-1 (tolerant genotypes) and
Parafield, Glenroy, Px-97-9-4, and Px-96-83-1-1 (moderately sensitive to sensitive
genotypes).
Three cultivars, namely Santi, Glenroy and Parafield were grown in pots to identify the
effect of three types of calcareous soils obtained from Wangary, Glenroy and Millicent and
UC soil as a control, on the Fe chlorosis symptoms. Severe symptoms indicative of Fe
deficiency were induced in plants grown in Wangary and Millicent soils and were most
severe for Parafield. Imposing a high soil moisture treatment of 120% of field capacity
induced more severe chlorosis symptoms than 100% or 80% of field capacity, and in all
three treatments Parafield was the most sensitive, Glenroy intermediate and Santi remained
green. Fe chelates in the forms of Fe-EDDHA and Fe-EDTA were applied as both foliar
and soil treatments to Parafield plants, grown in Millicent soil, that were exhibiting severe
chlorosis. All combinations of fertilizer type x method of application were effective in

vi
reducing shoot chlorosis of the top leaves at the time of application and also subsequent
growth, indicating that the leaf chlorosis was due to Fe deficiency.
The physiological mechanism controlling genetic variation in tolerance to Fe deficiency
chlorosis, between field pea cultivars Santi and Parafield, and derived backcross lines was
investigated. The major mechanism was not related to acquisition as Fe(III) reductase
activity of roots, and the concentration of total Fe in leaves, were not significantly different
between tolerant and sensitive genotypes. There was also little or no association with
distribution within the plant as the pattern of distribution of total Fe from shoot tips to
lower leaves was the same for both cultivars. However, the main variation between Santi
and Parafield was in maintaining active Fe in young leaves and stipules and active Fe in
young tissues of Santi was significantly greater than in Parafield. There was a highly
significant correlation between chlorosis and active Fe and the concentration of active Fe
increased from shoot tips which were chlorotic to lower leaves which maintained a high
concentration of chlorophyll. The association between active Fe and chlorosis was also
observed in backcross and F2 populations confirming that this is a direct relationship, and
not just a chance association between the two traits in two unrelated cultivars.
The genetic control of tolerance to Fe deficiency chlorosis in the cross between tolerant
Santi and sensitive Parafield was investigated. Reciprocal F1 hybrids, the F2, F3
generations, and BC1F1 plants were tested for responses to Fe deficiency using the
Millicent soil at 120% field capacity. There was no difference in response between the
reciprocal F1 hybrids and their response indicated that tolerance was a partially dominant
trait. Segregation of the F2, F3 and backcross generations revealed ratios, and population
variances, that were consistent with tolerance being conferred by two partially dominant
genes.
As tolerance to Fe deficiency chlorosis is under major gene control with high heritability,
and the trait is already present in adapted Australian cultivars, it could be introduced to
other breeding material either through bi-parental crosses or via backcrossing, depending
on other target traits in the populations. Selection could be undertaken effectively in early
generations, for example individual F2 plants with progeny testing in the F3, to identify
homozogyous tolerant selections. Although this project was not successful in identifying
molecular markers linked to tolerance to Fe deficiency chlorosis, as molecular maps for
field pea are further developed it is highly probable that linked markers could be idenfied.
vii
Tolerance to Fe deficiency chlorosis was inherited independently of major genes for seed
colour, plant height and leaf type, and could therefore be readily transferred to a range of
plant types.
The specific tolerance of Px-95-183-7-1 and Px-89-82-1 (tolerant), Px-96-83-1-1
(moderately tolerant) and Px-97-9-4 (sensitive), all of which are breeding lines of the
South Australia field pea breeding program, was compared with Santi and Parafield.
These lines were crossed to Parafield and Santi and F1 hybrids and the F2 of each cross was
grown in Millicent soil at 120% of field capacity and tested for reaction to the Fe
deficiency. Results indicated that the number of genes controlling tolerance to Fe
deficiency chlorosis varied, depending on the parental combinations. A cross between
sensitive and tolerant parents segregated at two genes, but crosses between sensitive and
intermediate-tolerant, or between intermediate-tolerant and tolerant parents segregated at a
single gene. Investigations of the pedigrees of all lines tested in the project also revealed
evidence of major gene control of tolerance. All tolerant lines included the breeding line
M150-1 in their pedigrees and one of the parents of M150-1 is likely to be the source of Fe
efficiency. Further investigations are required to identify the specific line.
The outcome of this project should assist in the breeding of Fe deficiency chlorosis tolerant
cultivars of not only field peas but also the other pulse crops grown in southern Australia.
The screening methods should be applicable to all crops, while it is likely that the genetic
control of tolerance would also be similar among the closely related cool season pulse
species.

viii

ix
DECLARATION I certify that this work contains no material which has been accepted for the award of any
other degree or diploma in any university or other tertiary institution and, to the best of my
knowledge and belief, contains no material previously published or written by another
person, except where due reference has been made in the text. In addition, I certify that no
part of this work will, in the future, be used in a submission for any other degree or
diploma in any university or other tertiary institution without the prior approval of the
University of Adelaide and where applicable, any partner institution responsible for the
joint-award of this degree.
I give consent to this copy of my thesis, when deposited in the University Library, being
made available for loan and photocopying, subject to the provisions of the Copyright Act
1968.
I also give permission for the digital version of my thesis to be made available on the web,
via the University’s digital research repository, the Library catalogue and also through web
search engines, unless permission has been granted by the University to restrict access for
a period of time.
……………………………….. Date ………………………..
Uyek Malik Yakop

x

xi
ACKNOWLEDGEMENTS
Praise be to God, the most gracious, the most merciful A special thank you to my wife, Eriani and my children, Alifia and Amira, whose support have been invaluable throughout the duration of this project. I especially also express my gratitude to my main supervisor Dr. Jeff G. Paull for his advice, encouragement and patient supervision throughout the years, in particular during preparing this thesis. I am also thankful to my other supervisors, Dr. James Stangoulis and Dr. Ken Chalmers for their supervision and allowing me use of their laboratory, materials and facilities. I am also thankful to Kevin James for his assistance throughout the project, especially for the supply of seed, soils and other materials. Thanks also to Eunyong, Lam and Yusuf for their friendship and support during studying at Waite Campus. Finally, I would like to thank my government, Indonesia, for funding to study at The University of Adelaide.
xii
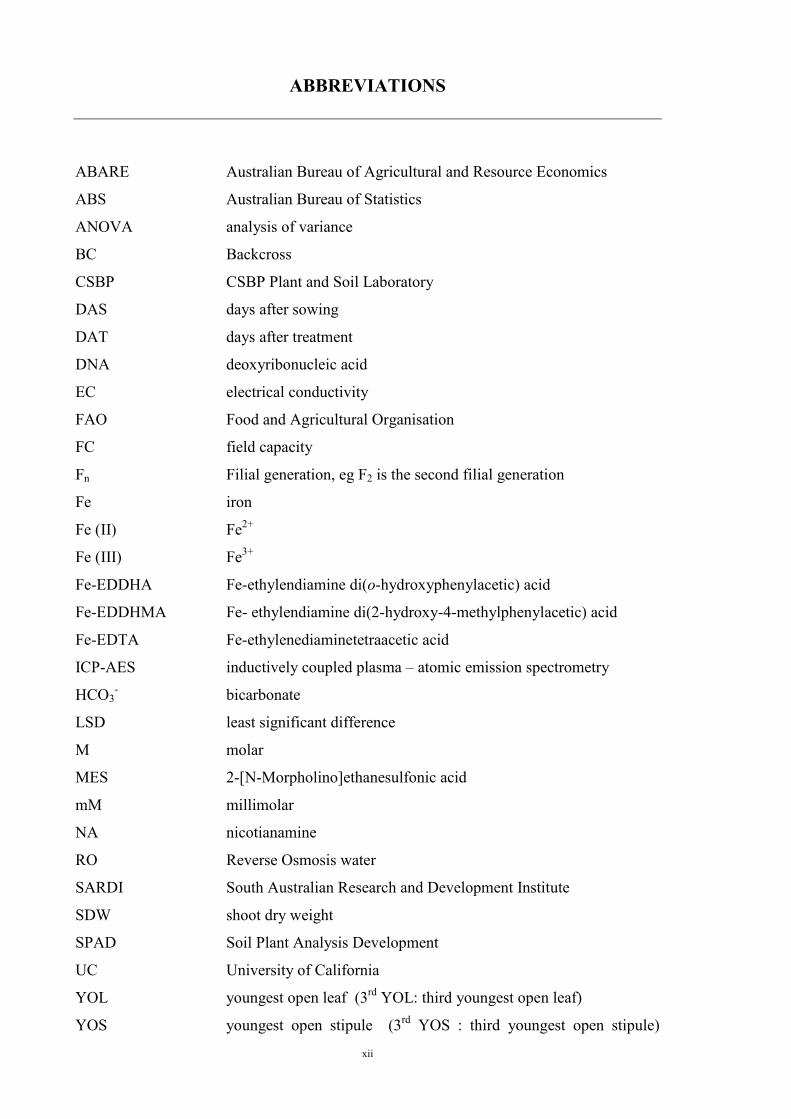
ABBREVIATIONS
ABARE Australian Bureau of Agricultural and Resource Economics
ABS Australian Bureau of Statistics
ANOVA analysis of variance
BC Backcross
CSBP CSBP Plant and Soil Laboratory
DAS days after sowing
DAT days after treatment
DNA deoxyribonucleic acid
EC electrical conductivity
FAO Food and Agricultural Organisation
FC field capacity
Fn Filial generation, eg F2 is the second filial generation
Fe iron
Fe (II) Fe2+
Fe (III) Fe3+
Fe-EDDHA Fe-ethylendiamine di(o-hydroxyphenylacetic) acid
Fe-EDDHMA Fe- ethylendiamine di(2-hydroxy-4-methylphenylacetic) acid
Fe-EDTA Fe-ethylenediaminetetraacetic acid
ICP-AES inductively coupled plasma – atomic emission spectrometry
HCO3- bicarbonate
LSD least significant difference
M molar
MES 2-[N-Morpholino]ethanesulfonic acid
mM millimolar
NA nicotianamine
RO Reverse Osmosis water
SARDI South Australian Research and Development Institute
SDW shoot dry weight
SPAD Soil Plant Analysis Development
UC University of California
YOL youngest open leaf (3rd YOL: third youngest open leaf)
YOS youngest open stipule (3rd YOS : third youngest open stipule)
1
CHAPTER 1
General Introduction
Iron (Fe) is an essential nutritional element for all living organisms and plays key roles in
numerous cellular functions (Lee et al., 2009). For human bodies, Fe is necessary for
haemoglobin synthesis, carrying Oxygen in blood and is an essential component of various
enzymes (Stein, 2010), while for plants, it is essential for fundamental cellular processes
such as electron transfer in photosynthesis, respiration, nitrogen fixation, DNA synthesis,
and redox reaction (Marschner, 1995; Alloway, 2008).
Many agricultural crops worldwide, particularly in semi-arid and arid regions, suffer from
Fe deficiencies (Mengel and Kirkby, 2001). Among these crops which are sensitive to Fe
deficiency are both perennial and annual crops. This problem occurs mainly on calcareous
or alkaline soils, which cover over 30% of the earth’s land surface (Chen and Barak, 1982;
Guerinot, 2010). Calcareous soils generally have high carbonate and bicarbonate content
and these types of soils are also characterised by high pH values and Fe availability for
plants is usually very low. In South Australia, approximately 70 – 80 % of cropping land is
classified as calcareous (Brand, 1999).
Fe deficiency in plants is usually recognized by chlorotic or yellowed symptoms on the
younger leaves of the shoots, with the veins remaining green. In severe symptoms, the
leaves may turn entirely yellow to bleached white (Bould et al., 1983). However, in other
cases, the leaves may not be chlorotic but plants might simply suffer a reduction in leaf and
root growth (Bertoni et al., 1992; Marschner, 1995).
Fe deficiency may significantly reduce growth and yield. If the youngest leaves and
growing point are damaged, growth will be stunted and yields will be reduced
substantially. In extreme cases, complete crop failure may occur (Mengel and Kirkby,
2001). Losses in yield of crops due to Fe deficiency will depend on the sensitivity of the
particular cultivar. It is reported that the yield losses of susceptible chickpea and lentil
cultivars could range from 22 to 50% (Saxena et al., 1994) and in wine grape yield
reduction might be more than 50% (Mengel and Gaurtzen, 1986).
2
Pulses provide an important opportunity to contribute to world food supplies. As many as
one billion poor people rely on pulses as a major source of protein and calories. Pulses
usually provide the cheapest source of protein to the poor, and for the rich are enjoying a
revival as a component of a balanced diet (Muehlbauer, 1993).
Pulses are important crops in South Australia and the average total area sown during the
last five years is more than 362,000 ha with average production more than 510,000 tonnes.
Field pea (Pisum sativum L.) is the major crop in terms of the area sown and production,
while there is also significant production of faba bean (Vicia faba L.), lentil (Lens culinaris
Medic.) and lupin (Lupinus angustifolius). Chickpea (Cicer arietinum L.) is undergoing a
phase of re-establishment following the devastating effect of an outbreak of Ascochyta
blight in the late 1990s (Table 1). Interest in growing pulses is increasing in Australia and
they are important not only as a source of cash income from export activity, but also as
break crops for cereals. Pulses have the potential to sustain agricultural systems through
rotational cropping where they can increase organic matter and nitrogen, reduce leaching
losses, and help control cereal diseases and pests and enable alternative herbicides to be
applied for control of grass weeds.
Pulses are capable of high yields but are sensitive to biotic and abiotic stresses, such as
pests and pathogens, climatic pressure and nutritional imbalances (Saxena et al., 1994).
Micronutrient deficiency, in particular Fe deficiency, has been reported in most crops and
the application of Fe fertilizer to correct the chlorosis, either by the use of soil application
or foliar sprays, is common (Abadia et al., 2011; Aciksoz et al., 2011). However, fertilizer
application has several disadvantages, as it is costly and does not always result in a
complete remedy of the deficiency due to rapid complexing of the applied Fe in calcareous
soils (Mortvedt, 1991). The use of genetic resistance to Fe chlorosis is generally more
acceptable as this solution is more reliable and economical in the long term (Graham,
2008).
Genetic variation has been identified in susceptibility/ tolerance to Fe deficiency chlorosis
among cultivars of crop legumes including pulses, particularly in chickpea, lentil and lupin
(Saxena et al., 1994), Vigna radiata (mungbeans), (Srivines et al., 2010), and in the oilseed
legumes, soybeans (Glycine max) (Fairbanks et al., 1987; Liesch et al., 2011). However
little information is available about other pulses of importance in South Australia,
including faba bean and field pea. Information on genetic variability is essential so it can
3
be utilised as a basis for breeding programs to improve tolerance of pulses to Fe deficiency
chlorosis.
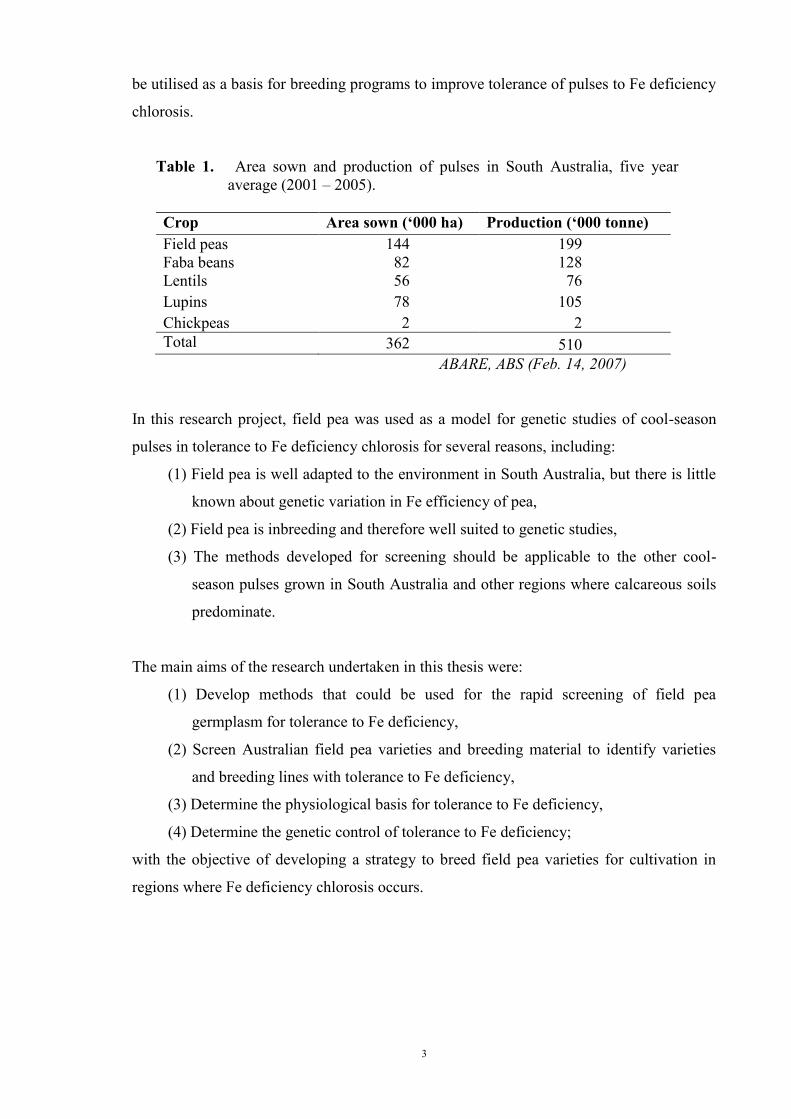
Table 1. Area sown and production of pulses in South Australia, five year average (2001 – 2005).
Crop Area sown (‘000 ha) Production (‘000 tonne) Field peas 144 199 Faba beans 82 128 Lentils 56 76 Lupins 78 105 Chickpeas 2 2 Total 362 510
ABARE, ABS (Feb. 14, 2007)
In this research project, field pea was used as a model for genetic studies of cool-season
pulses in tolerance to Fe deficiency chlorosis for several reasons, including:
(1) Field pea is well adapted to the environment in South Australia, but there is little
known about genetic variation in Fe efficiency of pea,
(2) Field pea is inbreeding and therefore well suited to genetic studies,
(3) The methods developed for screening should be applicable to the other cool-
season pulses grown in South Australia and other regions where calcareous soils
predominate.
The main aims of the research undertaken in this thesis were:
(1) Develop methods that could be used for the rapid screening of field pea
germplasm for tolerance to Fe deficiency,
(2) Screen Australian field pea varieties and breeding material to identify varieties
and breeding lines with tolerance to Fe deficiency,
(3) Determine the physiological basis for tolerance to Fe deficiency,
(4) Determine the genetic control of tolerance to Fe deficiency;
with the objective of developing a strategy to breed field pea varieties for cultivation in
regions where Fe deficiency chlorosis occurs.

5
CHAPTER 2
Literature Review
2.1 Introduction
Iron (Fe), one of the thirteen essential nutritional elements, is essential for all living
organisms and plays key roles in numerous cellular functions (Lanquar, et al., 2005; Lee
et al., 2009). In human bodies, Fe is necessary for haemoglobin synthesis, carrying Oxygen
in blood and is anessential component of various enzymes (Stein, 2010). The incidence of
Fe deficiency will lead to reduced oxygen carrying capacity, degraded forms of
haemoglobin in blood and myoglobin in muscles and in turn these can impact immunity
and result in limitations to physical growth, mental development, and learning capability
(Olivares, 1999; Black, 2003; Tolentino and Friedman, 2007). Iron deficiency is the most
common nutritional disorder world-wide and is prevalent in most of the developing
countries (UNICEF, 2007). It is estimated that there are between 4 and 5 billion or 60-80%
of the world’s population who are low in Fe status and this problem has been getting worse
(WHO, 2005). This prevalence of Fe deficiency is not entirely due to Fe deficiency in the
diet but it appears that about half of the total problem is dietary in origin (Graham, 2008).
Iron deficiency mainly occurs during times of rapid growth and nutritional demand,
especially in infancy, childhood and pregnancy (Olivares, 1999; Stoltzfus, 2001). It is
estimated that more than 47% of all preschool aged children in the world have been
affected (Mayer, 2008). In the developing world, the prevalence of Fe deficiency is high,
and this is mainly due to a low intake in bioavailable iron (Yip and Ramakrishnan, 2002).
Although plant-derived foods contain a wide variety of micronutrients, the levels of Fe are
commonly too low to meet daily needs (Lee et al., 2009). Improving Fe nutrition and
status of plants could contribute to improved Fe nutrition of many humns who are at
present deficient in Fe and have a predominantly plant based diet.
Iron is needed for plant growth as it is a constituent of cytochromes and metalloenzymes
(Alloway, 2008). Fe is also essential for fundamental cellular processes such as electron
transfer in photosynthesis, respiration, nitrogen fixation, DNA synthesis, and redox
reaction (Welch, 1995; Marschner, 1995). A decrease in the concentration of Fe in plants
causes a decrease in chlorophyll content and symptoms initially appear on the youngest
leaves which turn yellow with the veins remaining green, but the older leaves remain green
(Mengel and Kirkby, 2001). This pattern is termed interveinal chlorosis. Severe deficiency
6
causes impairment of cell division and leaves turn white and thus plant growth is stunted
(Brown, 1960; Abadia, 1992). In contrast, excessive Fe can damage cellular components
such as DNA, proteins, lipids, and sugars as this catalyzes the formation of highly reactive
hydroxyl radicals (Halliwell and Gutteridge, 1992). Thus, Fe metabolism in plants is
highly regulated to prevent excess accumulation (Guerinot, 2010).
Fe is normally found in abundant quantities in most soil, about 5% by weight of the earth’s
crust (Mengel and Kirkby, 2001; Lanquar, et al., 2005). However it is almost never found
in the free elemental state (free Fe (III)) that plants can use, but most Fe is in the form of
Fe (III) oxides and hydroxides, structures that are not readily available for plant use
(Masalha et al., 2000; Schulte, 2002; Lucena et al., 2007).
Fe availability is highly dependent on soil pH and redox status of soils (Schwertmann,
1991). Inorganic Fe exhibits higher solubility in acidic soil solution but solubility is very
low and Fe is tied up in alkaline or calcareous soils (Marschner, 1995). At a pH of about
4.5 the most abundant form of Fe in aqueous solution is as Fe (III) (Lindsay, 1991). Fe (III)
has minimal solubility in calcareous soils and in the pH range from 7.5 to 8.5 total soluble
Fe is near 10-10.4 M. This concentration is below 10-8 M which was indicated as the
adequate concentration for growth of soybeans (Glycine max) (Lindsay and Schwab,
1982). High levels of carbonate, bicarbonate, and phosphates in the soil can also lower the
availability of Fe as these ions reduce Fe solubility (Mengel and Geurtzen, 1986;
Marschner, 1995; Abadia, et al., 2002). Bicarbonate ions also reduce the mobility of Fe in
the plant’s vascular tissue (Kolesch et al., 1984; Mengel and Kirkby, 2001). Soils of arid
regions are often calcareous types that are high in carbonates and bicarbonates and these
soils also tend to have high pH values and thus limit Fe availability (Mengel et al., 1984;
Lucena et al., 2007).
Studies on Fe deficiency have demonstrated variation in susceptibility to Fe deficiency
chlorosis both among crop and plant species and also among cultivars within a species
(Ross, 1986; Rengel, 2001; Gao and Shi, 2007). A number of crops have been reported to
be sensitive to Fe deficiency chlorosis, namely: mungbean (Vigna radiate L.) (Srinives, et
al., 2010), soybean (G. max) (Dragonuk et al., 1989; Zocchi et al., 2007), lupin (Lupinus
spp.) (White and Robson, 1989; Santiago and Delgado, 2010), sunflower (Helianthus
annus L.) (Kolesch et al., 1984; Kosegarten et al., 2001), cucumber (Cucumis sativus L.)
(Agnolon et al., 2001), peach (Prunus persica L.) (Romera et al., 1991), chickpea (Cicer
7
arietinum) (Chaney et al., 1992), grapevine (Vitis vinifera) (Mengel et al., 1984; Russo et
al., 2010) and rice (Oryza sativa) (Kobayashi et al., 2008).
Genetic variation in tolerance to Fe deficiency within a species has been related to the
origin of germplasm. For example, a very low proportion of lentil lines originating from
Syria and Turkey (both countries where alkaline soils predominate) were sensitive to Fe
deficiency whereas a high proportion of landraces from India and Ethiopia were sensitive
(Erskine et al., 1993). The common methods to screen crops for Fe chlorosis tolerance
include growing in a glasshouse with an appropriate soil (Mengel et al., 1984; Santiago and
Delgado, 2010), or in nutrient solution (Chaney et al., 1992; Pestana et al., 2005), and also
in field experiments at sites where Fe deficiency chlorosis occurs (Lin et al., 1988;
Kobayashi et al., 2008; Russo et al., 2010).
Genetic variation in Fe chlorosis tolerance has been reported for a number of plant species
and has recently been identified in field pea (Pisum sativum L.) by screening in a nutrient
solution including bicarbonate to induce deficiency (Zribi and Gharsalli, 2002; Jelali et al.,
2010). This genetic variation could be used as a basis for breeding field pea cultivars with
tolerance to Fe chlorosis.
This review of the literature is written to build an understanding of Fe as an essential
nutrition element required by field pea, and related crops in general. Other factors related
to the topic will be discussed in relation to both the element and the crop, as well as the
properties of soil, as contributing factors to the interaction between Fe and field pea.
2.2 Fe in Soil
2.2.1 Content and Distribution of Fe in Soil
Fe is the fourth most-abundant element on earth and mostly found in the crystal lattices of
numerous minerals, particularly in ferromagnesium silicates, such as olivine, augite,
hornblende and biotite (Mengel and Kirkby, 2001; Schulte, 2002). The quantity of Fe in
most soil makes up about 5% by weight of the earth’s crust, or 20,000-100,000 lb/acre in a
plow layer (Marschner, 1995; Mengel and Kirkby 2001; Schulte, 2002), and the
concentration in soil ranges from 7,000 to 500,000 mg kg-1 (Fageria et al., 2002; Guerinot,
2010). In China, the total soil-Fe content in soils is relatively high varying from 1.05 to
4.84%, with an average of 2.94% (Zuo et al., 2007). Fe is almost never found in the free
8
elemental state but mostly in the form of Fe (III) oxides and hydroxides, structures that are
not readily available for plant use and cause reddish and yellowish colour in soil (Schulte,
2002).
Schwertmann (1991) described the properties of the Fe (III) oxides as follows. The range
of Fe (III) oxide concentration in various soils is from 0.1 to 50% and the Fe oxides
may be evenly distributed in the matrix or concentrated in various forms as horizons,
concretions, mottles, bands, etc. The crystal size of Fe oxides is usually very small,
between 5 – 150 nm due to high energy of crystallisation. The shape of the crystal is
commonly irregular. Fe (III) oxides exhibit a large specific surface area and may
effectively contribute to the overall surface area of soils (Lindsay and Schwab, 1982).
2.2.2 Solubility and Mobility of Fe in Soils
As plant roots absorb inorganic nutrients from the soil solution, the release of Fe from the
solid phase into the soil solution is the main factor contributing to the availability of Fe,
and Fe availability for plants is controlled by the precipitation and dissolution rate of Fe
oxides (Lindsay 1984; Schwertmann, 1991; Lucena, 2000). Fe salts that have low
solubility, such as Fe (III) oxides, Fe carbonates, Fe phosphates, Fe hydroxides and some
forms of insoluble chelates, are formed in certain soil types that make Fe not readily
available to plants (Marschner, 1995; Schulte, 2002). Low solubility and dissolution
kinetics of Fe bearing mineral phases are the main causes of Fe deficiency in most plants
rather than low total Feconcentration (Kraemer, 2004). The solubility of Fe oxides is
highly dependent on soil solution pH, and the redox status of the soils (Mengel and Kirkby,
2001: Kraemer, 2004).
In the common pH range of well-aerated soil, the solubilization of Fe (III) ions is a slow
process and would hardly be sufficient for meeting plant requirement (Lindsay and
Schwab, 1982). In aqueous solution, Fe (III) is more abundant at pH 4.5 (Lindsay, 1991),
while Fe (III) has minimum solubility in the range of pH 7.5 to 8.5 (Lindsay and Schwab,
1982; Kraemer, 2004; Pestana et al., 2005), which is commonly found in calcareous soils.
The concentration of total soluble Fe in this pH range is near 10-10.4 M, which is below the
10-8 M that was indicated as the concentration for normal growth of soybeans (Lindsay and
Schwab, 1982; Mortvedt, 1991). According to Lindsay (1991), high pH causes
precipitation of Fe(OH)3 and the activity of Fe (III) in solution decreases by up to 1000
fold for each unit increase in pH. The concentration of Fe (III) ions declines from 10-8 to
9
10-20 M with an increase in soil pH from 4 to 8 (Römheld and Marschner, 1986). The
concentration of Fe chelates in soil containing rich organic matter can be 10-4 to 10-3 M
Cesco et al., 2000), but in porous soils with low organic matter the Fe concentration can
reach as low as 10-8 to 10-7 M, lower than the concentration for adequate growth of most
plants (Römheld and Marschner, 1986).
High soil moisture results in reducing conditions where there is an increase in exchange of
Fe (III), which is an insoluble compound, to the soluble Fe (II) ion because of low redox
potentials (Ponnamperuma, 1972; Motrvedt, 1991; Marschner, 1995; Zuo and Zhang,
2011). The redox of the soil-root environment affects the supply of Fe (II) to plants and
this must not be lower than 12 for sufficient Fe to be available for most plants. In some
cases, Fe may be taken up in excess quantities and it is potentially toxic (Schmidt, 1999).
In the deeper layer of soil where there is less aeration than in the upper level, Fe (II) forms
a higher fraction of the total soluble Fe and consequently there is a reduction in redox
potential from the upper to the lower horizons in the same soil profiles (Mengel and
Kirkby, 2001).
Fe (III) oxides differ in solubility, decreasing in the order Fe (OH)3 (amorp) Fe2 (OH)3
(soil) Fe2O3 (maghemite) FeOOH (lepidocrocite) Fe2O3 (hematite) FeOOH
(geothite) (Chen and Barak, 1982). The most common Fe(III) oxides in soils are hematite
and goethite (Kraemer, 2004). Fe solubility is also controlled by the solubility of the
hydrous Fe (III) oxides, and the major solution species as inorganic Fe in the form of
Fe(OH)2+ and Fe (OH)3
0, but these Fe formations are too low to meet plant demand
(Lindsay, 1991). The soluble organic forms include Fe3+, Fe(OH)2+, Fe(OH)2+ and Fe2+
(Mengel and Kirkby, 2001).
Schwertmann (1991) and Kraemer (2004) described 4 major factors influencing the rate of
dissolution of Fe (III) oxides. These include (a) the species of oxides with the most soluble
being amorphous and the most tightly bound being geothite, (b) the size of crystal with the
smaller the size, the higher the solubility, and (c) the substitution or competition with other
elements. For example, geothite and hematite have an octahedral Fe3+ conformation and
Fe is commonly substituted by the Al3+ cation which is smaller and more widespread in
soils. Al substitution leads to an increase in the stability of geothite and hematite and this
causes low solubility of Fe.
10
There are three dissolution rate mechanisms by which solid Fe (III) oxides release Fe into
solution, namely (a) protonation (strong mineral acids) producing Fe (III) cations, (b)
reduction of Fe (III) to Fe (II), and (c) complexation to generate Fe (II) or Fe (III)
complexes. The respective reactions are as follows
(a) FeOOH + H + Fe (OH)2+
(b) FeOOH + e - + 3H + Fe 2+ + 2H2O
(c) FeOOH + nL- + 3H + [FeLn] 3-n + 2H2O (L = ligand)
The complexation reaction (c) in the soil and within the rhizosphere is much more
important than reactions (a) and (b) (Marschner et al., 1986; Schwertmann, 1991; Lucena,
2000).
The solubility of Fe (III) and Fe (II) ions decrease with an increase in pH associated with
calcareous soils that are rich in CaCO3 (Coulombe et al., 1984). According to Julian, et al.
(1983), the concentration of Fe (III) in calcareous soil solution at pH 8.3 is equal to 10-19
mM, the concentration at which most plants become Fe deficient. It has been estimated that
30% of the world’s arable land consists of calcareous and alkaline soils which causes
chlorosis symptoms and significant yield loss in various crops (Oki et al., 2004; Ma and Ling,
2009).
Availability of Fe in Plants
2.3.1 Fe Concentration in Plants
Fe in plants is mostly in Fe (III) and little in Fe (II) forms and stored abundantly (more
than 90%) in the chloroplasts of leaf cells, particularly in leaves undergoing rapid growth
(Terry and Abadia, 1986; Marschner, 1995; Shikanai et al; 2003). Of the Fe in the
chloroplast, 75% to 80% is located in the chloroplast stroma and the rest is distributed in
the thylakoid membranes (Bughio, et al., 1997). Phytoferritin is a protein containing Fe as
a hydrous Fe (III) oxide phosphate micelle and this is found in plastids (Bienfeit and van
der Mark, 1983), in xylem and phloem (Smith, 1984), and in seeds (Lobreaux and Briat,
1991).
Fe is found in large quantity in the apoplast of basal roots and older parts of root systems
and a smaller quantity in shoots (Strasser et al., 1999). Fe deficiency in plants is not always
indicated by lack of Fe in plant tissues, as in some cases the Fe concentration in chlorotic
11
leaves is similar, or even higher than healthy green leaves (Mengel and Geurtzen, 1988),
and this is called the “chlorosis paradox” (Morales et al., 1988; Römheld, 2000). Fe
requirement for growth of plants varies depending on plant species and cultivars. It is
estimated that the requirement for annual crops is of the order of 1 kg/ha and for peach
trees is between 1 and 2 g per tree per year (Abadia et al., 2004).
2.3.2 Fe Uptake and Mobilisation
Fe is transported to plant roots mostly by diffusion in the soil solution, and thus the
absorption is dependent on root activity, growth, and density (Chaney, 1984). The overall
processes of Fe acquisition by roots have been described in terms of different strategies to
cope with Fe deficiency, called Strategy I and Strategy II (Römheld, 1987; Chaney et al.,
1988; Bienfait et al, 1989; Marscher, 1995; Nozoye et al., 2011). The strategies can be
described as follows: Strategy I, which is found in all dicots and in monocots except
graminae, is characterised by three components, namely: (a) increased reducing capacity,
which is an increase in the activity of a plasma membrane-bound inducible reductase
(“Turbo”), leading to enhanced rates of Fe (III) reduction and corresponding reducing Fe
(III)-chelates at the plasma membrane; (b) increased proton extrusion, leading to increased
acidification of the rhizosphere. This low pH increases efficiency of reductase leading to
increased solubilization of Fe in the rhizosphere and better Fe uptake, and (c) increased
release of reducing chelating agents, such as phenolic compounds, from the Fe deficient
root in response to acidification (Lucena et al., 2007; Ma and Ling, 2009; Zuo and Zhang,
2011). This step is an additional mobilisation of sparingly soluble Fe in the rhizosphere.
Other responses of Strategy I plants to Fe deficiency include an enhanced growth of root
hairs (Schmidt, 2001; Zocchi, et.al., 2007; Guerinot, 2010) and the development of
structures in the rhizodermis associated with transfer cells (Marscher, 1995).
The strategy II mechanism occurs in graminae and is characterised by (a) the release of
non-proteogenic amino acids (phytosiderophores), leading to enhanced mobilisation of soil
Fe3+, and (b) a highly specific Fe-phytosiderophore transporter in the root plasma-
membrane (Römheld and Marschner 1986; Römheld 1991; Welch 1995). According to
Marschner et al. (1986), the implication of the difference between Strategy I and II is very
important in ecological aspects and this also needs systematic consideration in the
development of screening methods for resistance to Fe deficiency chlorosis. The Strategy
II mechanism for Fe uptake in the graminae leads to more resistance to Fe deficiency
12
chlorosis than in other plant species (Mengel and Kirkby, 2001; Nozoye et al., 2011). In
general, C4 plants have a higher requirement for Fe than C3 species (Marscher, 1995).
Dicotyledons are capable of releasing H+ into the outer soil solution to induce the
dissolution of the insoluble Fe compounds (Römheld, 1991). Protons released by roots into
calcareous soil are immediately neutralised by the high H+ buffer capacity of such soil
(Mengel and Kirkby, 2001). Hauters and Mengel (1988) found that H+ ions excreted from
red clover (Trifolium pratense) roots grown in calcareous soil were neutralised by soil
carbonate, and pH at the root surface did not differ from the bulk soil. In contrast, the pH
of the surface of root laterals of plants grown in soil free of carbonate was about 1 unit
lower than the bulk soil. However, in Brassica napus (Toulon et al. 1992) and sugar beet
(Beta vulgaris L.) (Susin et al., 1996), H+ pumped into the root apoplast by the
plasmalemma H+ pump was able to reduce the pH at the apoplast of root tips and thus
improve Fe reduction. Alloush et al. (1990) reported that anion uptake was reduced more
than cation uptake in chickpea under Fe stress, and this gives rise to excess cation uptake,
causing more H+ ions to be released.
The release of reductants increases the reduction of Fe3+ to Fe2
+ in the apoplast. This
reduction involves an Fe-chelate reductase (Marscher, 1995), and is the rate-limiting step
of Fe acquisition of Strategy I plants under Fe deficiency conditions (Yi and Guerinot,
1996; Connolly et al., 2003; Ishimaru et al. 2007 ). Under Fe deficiency, the expression of
constitutive Fe (III)-chelate reductase isoforms in the root plasmalemma increases (Holden
et al., 1991). Genes encoding for proteins in Fe (III)-chelate reductase have been identified
and named AtFRO2 (Robinson et al., 1999), and those involved in the uptake of Fe2+ are
named AtIRT1, a member of the ZIP family (Eide et al., 1996; Guerinot 2000).
2.3.3 Movement of Fe within Plants
The long distance movement of Fe in plant roots occurs both symplastically and
apoplastically. Fe is further transported to the shoot via the xylem as Fe(III), probably
chelated by citrate (Tiffin, 1966; Schmidt, 1999; Lopez-Millan et al., 2000; Grotz and
Guerinot, 2006; Yokosho et al., 2009). However, knowledge of the movement of Fe into
the chloroplast is not yet clear (Briat and Lobreaux, 1997; Römheld and Schaaf, 2002).
The transport of Fe into chloroplasts is stimulated by light (Bughio et al., 1997). It is
also possible that chloroplasts force Fe movement via mechanisms such as that described
for Stratey I plants; the chloroplast may require an H+-ATPase, an Fe3+ reductase, and an
13
Fe2+ transporter (Moog and Brϋggemann, 1995; Bhugio et al., 1997).
Before being distributed into leaf cells, Fe(III) in leaf apoplasts is reduced to the form of
Fe (II) (Brϋggemann et al., 1993; Nikolic and Römheld, 1999; Shingles et al., 2002). The
existence of ferric chelate-reductase in mesophyll cells related to Fe uptake and capable of
using Fe (III)-EDTA in leaves of Vigna unguiculata was demonstrated by Brϋggemann et
al., (1993) and was also reported to be present in sunflower leaves (de la Guardia and
Alcántara, 1996), and rice (Bashir et al., 2010). Reduction of Fe-chelates is mediated by a
plasma membrane-bound ferric-chelate reductase (Gonzales-Valenjo et al., 2000). Lopez-
Millan et al. (2001) stated that understanding the composition of the apoplast might lead to
an explanation of the mechanism of Fe uptake by leaves and provide an understanding
of the mechanism of Fe deficiency in plants. Several important functions related to Fe
transport and acquisition of Fe by leaf cells occur in the apoplast . These functions
include transport and storage of mineral nutrients (Zang et al., 1991), plant responses
to environmental stresses (Dietz, 1997), and transmissions of signals (Hartung et al.,
1992). According to Mengel (1995), apoplastic pH could be important in Fe
movement and affecting activity of a plasma membrane-bound ferric-chelate reductase
in leaves.
The accumulation of Fe in the rhizodermis and the endodermis of corn was higher with
Fe deficiency stress, and this probably reflected the role of an increased number of root
hairs under Fe deficiency (Römheld and Schaaf, 2002). Schmidt et al. (2000) suggested
that the root hairs induced by Fe deficiency may act as an enhancer for the reduction of
Fe3+, but this does not represent a prerequisite for physiological adaptation. In Plantago
lanceolata, stimulation of root hair growth increased the reduction capacity for ferric
chelates although the activity of the reduction is only on a small scale (Schmidt and
Bartels, 1996).
The nonproteinogenous amino acid Nicotianamine (NA), which occurs in all higher
plants (Rudolph et al., 1985; Klatte et al., 2009), seems to be involved in phloem loading
for retranslocation of Fe and possibly in phloem unloading and uptake of Fe into young
leaves and reproductive organs (Schmidke and Stephan, 1995; Herbik et al., 1999;
Hider et al., 2004; Currie et al., 2009). NA, which was found originally in tobacco
(Nicotiana tabacum) and produced in most tissues, is not secreted and chelates metal
cations, including Fe (III) and Fe (II) (Beněs et al., 1983; von Wirén et al., 1999; Briat
14
et al., 2007). This has been demonstrated by severe symptoms of Fe deficiency in the
tomato (Lycopersicon esculentum Mill) mutant chloronerva which lacks NA (Scholz et
al., 1988; Higuchi et al., 1996; Pich and Scholz, 1996; Stephan et al., 1996; Ling et al.,
1999). A similar case was reported in transgenic tobacco plants showing interveinal
chlorosis in young leaves due to Fe deficiency (Takahashi et al., 2003). NA was not
detected in the mutant plant but was present in control tobacco. Fe was present in both
the veins and interveinal area of young leaves of control tobacco, while only a very
small quantity of Fe was present in the veins and the interveinal area of mutant
tobacco. The authors concluded that chlorosis in young mutant tobacco leaves was
caused by insufficient Fe transport to the leaves (Takahashi et al., 2003).
2.3.4 Fe Deficiency in Plants
Fe deficiency is a worldwide problem and usually occurs in various fruit trees and crop
plants grown not only in arid or semi-arid regions and alkaline soils developed from
calcareous materials (Vose, 1982; Loeppert, 1986; Singh et al., 1986; Korcak, 1987;
Plessner et al., 1992; Mahmoudi et al., 2007;) but also in acid soils such as rice grown
under flooded conditions (Welch et al., 1991). Worldwide, Fe deficiency in Fe-inefficient
crops exists in large areas in United States (Vose, 1982; Mamidi et al., 2011), certain
regions of Europe (Welch et al., 1991; Donnini et al., 2008), various regions in Asia (India,
Sri Lanka, Bangladesh, China, Thailand and Indonesia) (Katyal and Vlek, 1985; Welch et
al., 1991; Zuo and Zhang, 2011), and Eastern and Western Africa (Vose, 1982; Kang and
Osiname, 1985). In Australia, Fe deficiency in crop plants is also prevalent in several
states, including South Australia, Victoria, New South Wales and Western Australia
(Donald and Prescott, 1975; Hodgson et al., 1992; Tang et al., 1996; Pierce and Morris,
2004; Holloway et al., 2008).
The typical symptoms of Fe deficiency in plants are chlorotic leaves characterized by
greenish-yellow to yellow laminae, with the veins remaining a darker green (Snowball and
Robson, 1991). In severe chlorosis, the leaves became pale yellow and develop brown
spots between the main veins and in extreme cases, leaf margins may also turn brown with
leaves later drying up and falling off (Bould et al., 1983). Fe deficiency results in changes
in ultra structure of chloroplasts with shrinking thylakoid granna and the chloroplast under
severe chlorosis, and this tends to affect younger leaves more than the older ones (Kirkby
and Römheld, 2004).
15
2.3.5 Factors Affecting Fe Deficiency
A high level of carbonate, bicarbonate, phosphate, and nitrate in the soil may lower the
availability of Fe and thus result in Fe deficiency chlorosis (Coulombe et al., 1984;
Mengel et al., 1984; Mengel and Geurtzen, 1986; Cornet and Johnson, 1991; Romera et al.,
1991; Bertoni et al., 1992; Chaney et al., 1992; Romera et al., 1992b; Manthey et al., 1996;
Zancan et al., 2008). Bicarbonate (HCO3-), which is abundant in calcareous soil, is the
most important anion inducing Fe chlorosis because it can increase the pH of the leaf
apoplast (Bertoni et al., 1992; Zribi and Gharsalli, 2002; Mahmoudi et al., 2007).
Bicarbonate ions also reduce the mobility of Fe in the plant vascular tissue and plant tissue
analysis has indicated that while there might be sufficient Fe in the stem and petioles,
deficiency occurs in the leaves (Chaney et al., 1992; Mengel et al., 1994; Lucena et al.
2007).
The effect of high HCO3- concentrations on the uptake, translocation and utilization of Fe in
plants were summarized by Marschner (1995) as follows, (a) high HCO3- concentrations in
soil solution both raises and buffers the pH and thus further lowers the concentrations of
soluble inorganic Fe, (b) Fe transport to the shoots is possibly impaired through
sequesteration of Fe in the vacuoles of the roots by organic acids. Organic acid synthesis has
been found to increase under high HCO3- concentrations, (c) the utilization of Fe in the leaves
may be inhibited. It has been noted that total Fe concentration remains similar or may increase in
plants susceptible to HCO3- induced Fe deficiency. A possible reason for this is that HCO3
-
inhibits shoot growth prior to the occurrence of Fe deficiency chlorosis (Shi et al.,1993), and
(d) high HCO3- concentrations may also inhibit root growth, root respiration, root pressure-
driven solute export into the xylem and the rate of cytokinin export (necessary for protein
synthesis and chloroplast development) to the shoot (Marschner,1995).
However, Nikolic and Römheld (2002) indicated that high HCO3- concentration did not
induce a significant increase in pH of the apoplast fluid of plants grown in either nutrient
solution or soil. Bicarbonate also did not appear to be the cause of physiological
inactivation of Fe in the leaf apoplast nor did it cause an inhibition of Fe uptake into the
leaf symplast. Bicarbonate induced Fe deficiency is generally only associated with plants
displaying the Strategy I response to Fe deficiency (Marschner,1995), but the effect of
HCO3- concentrations in soil solution on the Strategy II plants is not significant
(Chaney,1984). Legume crops, which belong to the Strategy I group, have been classified
as sensitive to Fe deficiency (Rashid and Ryan, 2008); these crops include soybean
16
(Coulombe et al., 1984), chickpea (Chaney et al., 1992), and lupin (Tang et al., 1996). A
high concentration of HCO3- in soil can also result in reduced nodulation in grain legumes,
particularly in intolerant genotypes (Tang and Robson, 1995).
A high level of CO2 in the soil, produced from microbes and plant root respiration,
increases bicarbonate levels in the soil. In addition, soils that are waterlogged or poorly
aerated tend to have increased levels of CO2 as the passage of CO2 out of the soil is
blocked and the concentration of HCO3- increases (Ao et al.,1987). Therefore, plants grown
in calcareous soils are especially susceptible to Fe deficiency when the soil is waterlogged
or poorly aerated (Lindsay and Schwab, 1982; Bloom and Inskeep,1986; White and
Robson, 1989). The active Fe concentration and chlorophyll concentration in young leaves
of peanut under higher soil-water content were lower than those of plants in lower soil
water content ( Zou et al., 2007). The presence of micro-organisms around growing roots
causes low redox potential in the rhizosphere due to microbial oxygen demand and this
would increase concentration of Fe2+ ions for plant uptake (Trolldenier, 1973).
There are varied reports on the effect of phosphate on Fe nutrition of plants grown in
calcareous soil. High phosphate has been shown to inhibit the root reducing capacity and
Fe absorption in some species (Chaney and Coulombe, 1982; Fageria and Stone, 2008).
However, Romera et al. (1992) found that high P at low pH does not cause inhibition of the
development of reducing capacity in the roots of sunflower and cucumber but can intensify
the negative effect of bicarbonate. Similarly, Mengel et al. (1984) found that phosphate is
not the primary cause for lime induced Fe chlorosis, but the high content of P frequently
found in chlorotic leaves is the result, and not the cause, of Fe chlorosis. Fe deficiency can
also arise in response to an excess of Mn and Cu (Troeh and Thomson, 2005). High
amounts of K in suitable soil conditions can inhibit the Fe uptake ability of plants and may
affect the degree of Fe chlorosis (Çelik et al., 2011). Some studies also identified that the K
content of the chlorotic plants was high when chlorosis symptoms occurred (Torres et al.,
2006; Çelik & Katkat, 2007).
Organic acid concentrations often increase with Fe deficiency in different plant parts such
as roots, leaves and stem exudates (Abadia et al., 2002). Organic matter improves Fe
availability by combining with Fe, thereby reducing chemical fixation or precipitation of
Fe as ferric hydroxide. This results in higher concentrations of Fe remaining in the soil
solution for root absorption (Lindsay, 1991).
17
Other micronutrient deficiencies in plants associated with calcareous soils are Mn
(Rashid et al.,1990), Zn (Plessner et al.,1992; Cakmak et al., 1997; Palmer and Guerinot,
2009), NO3- (Fageria and Stone, 2008) and Cu (Kausar et al.,1976; Gutser,1990; Palmer
and Guerinot, 2009). Similar to Fe, the solubility of Zn and Mn in calcareous soils is
decreased mainly due to high pH and the concentrations of these nutrients available for
plant uptake tend to be low (Jauregui and Reisenauer, 1982; Marschner,1995; Graham,
2008).
Kirkby and Römheld (2004) summarized the main chlorosis–inducing factors frequently
observed in the field, namely : (a) weather factors (i.e. high precipitation, high soil water
content and low soil temperature), (b) soil factors (i.e. high lime content, high bicarbonate
concentration, low O2 concentration, high ethylene concentration, high soil compaction,
and high heavy metal content), (c) management factors (i.e. soil compaction, high P
fertilization, high application of Cu-containing fungicides, and inadequate assimilate
delivery and late vintage/harvest) and (d) plant factors (i.e. low root growth, high
shoot/root dry matter ratio, and low Fe efficiency).
2.3.6 Correction of Fe Deficiency
Fe fertilization is a common method to control Fe deficiency and can be applied either
to soil or as a foliar spray (Wallace, 1991; Abadia et al., 2002; Álvarez-Fernández et
al., 2002; Fernández and Ebert, 2005). However, the methods of application and
sources of Fe to correct Fe deficiency vary considerably and there is not a single
application that is completely effective and economical (Mortvedt, 1991).
There are various inorganic and chelated forms of Fe fertilizers that are used and tested for
correction of Fe deficiency chlorosis in crop plants, such as FeSO4, FeEDTA, FeDTPA,
FeEDDHA, Fe-citrate and FeIDHA (iminodisuccinic acid) (Aciksoz et al., 2011).
However, the effectiveness of those Fe fertilizers in correcting Fe deficiency chlorosis
varies considerably depending on their stability, penetration ability through leaf cuticle
and mobility/translocation following diffusion into leaf tissue (Fernandez et al., 2009;
Aciksoz et al., 2011).
Soil application of inorganic Fe is not effective unless applied at very high rates, as Fe
18
in inorganic form will be rapidly converted to forms that are not readily available to
plants, especially in calcareous soil (Mortvedt, 1986; Troeh and Thomson, 2005).
Therefore, Fe chelates are generally recommended to use as these are more stable in
soils (Mengel and Kirkby, 2001). Álvarez-Fernández et al., (2002) tested the
effectiveness of several synthetic Fe chelates and found that Fe-EDDHA ― Fe-
ethylendiamine di(o-hydroxyphenylacetic) acid, and Fe-EDDHMA ― Fe-
ethylendiamine di(2-hydroxy-4-methylphenylacetic) acid were the most effective as Fe
soil fertilizer because of their highly stable ferric complexes in neutral and alkaline
solutions. Fe-EDTA ― Fe-ethylenediaminetetraacetic acid, which was the first
synthetic chelate used in agriculture, was effective in correcting Fe chlorosis in grape
when applied of high concentration (Sánchez-Andréu et al., 1991). Fe-EDDHA is the
most stable Fe-chelate over a range of pH values and this successfully corrected Fe
deficiency in soybeans (Ghasemi-Fasaei et al., 2003), peanut (Arachis hypogea)
(Shaviv and Hagin, 1987), peach (Reed et al., 1988), and grape (Sánchez-Andréu et al.,
1991).
Foliar application of Fe2SO4 or Fe-chelates was shown to be more efficient than soil
application because of the direct uptake of Fe by the plant through cuticular pores from the
leaf surface (Zuo and Zhang, 2011). However, foliar application of chelated Fe fertilizer
sources has produced inconsistent results. It has been successful in reducing symptoms of
chlorosis and increasing yield in soybean at some locations and has had no effect at other
locations (Liesch et al., 2011). Foliar application of Fe2SO4 has been used to correct Fe
deficiency and this Fe salt was effective to reduce Fe chlorosis symptoms in Kiwi fruit
(Actinidia delicosa) (Rombolà et al., 2000), pear (Pyrus cummunis L.) (Álvarez-
Fernández et al., 2004) and sunflower (Helianthus annus L.) (Kosergaten, 2001).
Chelated forms of Fe fertilizer such as Fe-EDTA Fe EDDHA and Fe-HEDTA often are
considered best because they are soluble and readily available to plants, and can be
translocated to the leaves better than inorganic forms (Mengel and Kirkby, 2001;
Lucena, 2006; Zuo and Zhang, 2011; ). However, the economic benefit is questionable in
field-scale production, especially when applied as foliar applications that often need to be
repeated (Abadia et al., 2011).
The penetration of foliar sprays and the subsequent translocation of Fe in the plants
remains unclear (Fernández et al., 2005). Some Fe-phytotoxicity which induces leaf
19
burn and defoliation frequently occurs after foliar application, particularly at high
concentration of Fe (Troeh and Thomson, 2005). Chelated Fe fertilizer (EDDHA) has
been applied to soybean seed and the response was significant, with increases in plant
height and grain yield (Liesch et al., 2011).
2.4 Mechanisms and Inheritance of Nutrient Efficiency
2.4.1 Mechanism of Tolerance to Nutrient Deficiency
Nutrient deficiency tolerance is defined as the ability to produce a high yield in a soil
that is limiting in a particular element for a standard genotype (Graham, 1984). The
tolerance of plants to micronutrient deficiencies is related to the efficiency of uptake,
utilisation and internal requirement of the nutrient. Graham (1984) also proposed five
possible mechanisms for nutrient efficiency, namely: (a) more extensive root geometry,
(b) faster specific rate of absorption from the soil solution at low nutrient concentrations,
(c) greater solubility of the root-soil interface by chemical modification, (d) improved
internal redistribution, and (e) superior internal utilisation or lower functional nutrient
requirement.
The mechanism of Fe deficiency tolerance, which has probably been the most investigated
amongst micro-nutrients, is related to an ability to overcome limitations on absorption of
Fe by the roots, translocation to the shoots, and distribution within the shoots
(Marschner,1995; Kirkby and Römheld, 2004). Details of the mechanisms in Fe deficiency
tolerance have been discussed in the previous section.
2.4.2 Inheritance of Nutrient Efficiency
The inheritance of nutrient efficiency has been investigated for a number of crops and
nutrients, including Fe deficiency. The knowledge of genetic control in nutrient efficiency of
plants should enable rapid gains in developing nutrient efficient varieties. When tolerance is
governed by a major gene it should be relatively simple to transfer the tolerance by the
technique of back-crossing with the possibility of utilizing marker assisted selection. If
tolerance is expressed as a quantitative character controlled by a number of genes, recurrent
selection might be used to increase the efficiency in breeding tolerant varieties.
The inheritance of tolerance to any particular nutrient deficiency, including Fe deficiency
chlorosis, could vary depending on the parents used in developing the populations and the test
20
conditions. Weiss (1943) investigated nutrient deficiency of soybeans grown in a calcareous
soil and in a synthetic nutrient medium with low availability of Fe. Some strains developed
chlorosis typical of severe Fe deficiency, other strains were without symptoms. Inheritance
studies demonstrated a single pair of alleles to be responsible for susceptibility to Fe
deficiency tolerance in soybean. However, Fehr (1982) challenged this finding as discrete
classes were not observed when a large number of soybean lines were grown on calcareous
soils in the field, thus tolerance overall did not appear to fit a single gene model. It has
been suggested that a major gene and several modifying genes, or several major genes, were
involved in controlling Fe deficiency tolerance, and the inheritance of tolerance to Fe
chlorosis in soybeans can vary depending on the parents used in developing the population
(Cianzio and Fehr, 1980; Fehr, 1982; Cianzio, 1999; Liesch et al., 2011; Mamidi et
al., 2011).
The number of genes reported to control tolerance to Fe deficiency in chickpea also
differed between populations. Gowda and Rao (1986) identified a single gene controlling
Fe efficiency on the basis of segregation of F2 and F3 generations. A similar conclusion
that Fe efficiency is governed by a single gene was based on segregation of F2 and BC
populations (Hamze et al., 1987; Saxena et al., 1990), but Gumber et al. (1997) reported
that there were two genes controlling Fe efficiency on the basis of segregation of F2 and
F3 generations for a different population.
In tomato, Wann and Hills (1973) identified that Fe inefficiency is controlled by a recessive
gene, while Brown and Wann (1982) reported that Fe deficiency tolerance is likely to be
conditioned by a single dominant gene after evaluating segregation of F2 plants. Dasgan et
al. (2002) stated that the inheritance of Fe deficiency tolerance in tomato was not a simple
dominant monogenic trait, but might be characterized by both nuclear and extranuclear
heredity after evaluating F1 hybrids between the Fe tolerant variety (Roza) and intolerant
genotype (227/1).
Fe deficiency tolerance in mung bean (Vigna radiata (L.) Wilczek), was controlled by a
major gene (IR) with dominant effect on the basis of segregation analysis of the F2
population Srivines et al., (2010). In dry beans (Phaseolus vulgaris L.), Fe deficiency
tolerance was reported to be controlled by two dominant major genes based on evaluation of
F3 segregation (Coyne et al., 1982; Zaiter et al.,1988). Fe deficiency tolerance in lentils
(Lens culinaris) is dominant with the F1 hybrids being tolerant (Ahmad et al., 1995), while
21
Ali et al. (1997) also identified that tolerance to Fe deficiency of lentils is dominant with a
single gene for efficiency. Fe deficiency tolerance in oats (Avena sativa) has been reported to
be controlled by a major dominant gene with modifiers (McDaniel and Brown, 1982), while
tolerance to Fe deficiency chlorosis in peppers (Capsicum annuum L.) is recessive (Shifriss
and Eidelman, 1983).
The inheritance of tolerance to other nutrients such as B, Mn and Zn in various plants has
been observed. Bagheri et al. (1996) reported that B toxicity tolerance of field pea was
governed by either a single or two genes depending on parental lines tested. Crosses
between intolerant and moderately tolerant parents, or between moderately tolerant and
tolerant parents segregated at a single gene, while crosses between intolerant and tolerant
parents segregated at two genes. This concurs with the result of the genetic control of B
tolerance in wheat (Triticum aestivum L.) (Paull et al., 1991). The genetic control of
tolerance to B deficiency in oilseed rape (Brassica napus) and wheat was reported to be a
single gene in both species (Xu et al., 2001; Jamjod et al., 2004).
Zn deficiency tolerance in common beans (P. vulgaris L.) was identified to be controlled by
a single dominant gene after evaluation of F2, BC1 and BC2 populations (Singh and
Westermann, 2002). Similarly, Cichy et al. (2005) reported that navy beans (P. vulgaris L.)
carry a single dominant gene for efficiency in Zn seed concentration after evaluating the
segregation of F2, BC1 and BC2 plants.
2.5 The Assessment of Nutrient Efficiency
2.5.1 Development of a Suitable Screening Technique
The success of a breeding program in selecting for nutrient efficiency will depend to a
large extent on utilising an appropriate screening method. Screening techniques for
determining plant responses to nutrient imbalances should (a) be based on simple selection
criteria, (b) provide accurate and rapid screening of a large number of plants, (c) provide
the maximum expression of genetic variation, and (d) be relevant to field performance
(Graham, 1984; Saxena, et al., 1994; Rengel, 1999). In addition, the assay is considered
more successful if it is capable of providing an understanding of the nutrient efficiency
mechanism (Rengel, 2001).
A number of methods for selecting nutrient tolerance can be divided into three major
categories: (a) field, (b) glasshouse (or growth chamber), and (c) laboratory.
22
Field Screening
Screening tests for nutrient efficiency conducted in the field are sometimes preferable
because large populations can be used and the process is under natural conditions (Lin et
al., 1998). However there are many practical limitations in the use of this method,
including (a) restriction to one crop season per year, (b) the inability to select some traits in
the field, e.g. root growth and root morphology, (c) possibly high costs as there might be a
large numbers of plots at a distant test field, and (d) the inability to modify the severity of
the conditions to which the genotypes are exposed (Graham, 1984; Vose, 1990; Saxena et
al., 1994). Measurements of grain yield are common in field tests, however other
parameters should be assessed to support the observation, such as efficiency at the seedling
stage and other subsequent growth stages (Graham, 1984).
Field screening has been used extensively for evaluation of nutrient efficiency in many
crops, including grain legumes. Ohwaki et al. (1997) evaluated 10 mungbean (Vigna
radiata L.) cultivars for tolerance to Fe deficiency in calcareous soil on the basis of
chlorosis symptoms, plant growth and seed yield, and they were able to discriminate the
cultivars into categories being susceptible, moderately susceptible, moderately tolerant,
tolerant and very tolerant. In dry beans (P. vulgaris), 40 cultivars/lines, which were grown
in a highly calcareous soil, differed in severity of Fe chlorosis and showed continuous
variation in symptoms ranging from highly tolerant to susceptible (Zaiter et al., 1988).
Field screening of soybeans on calcareous soil was conducted to evaluate Fe deficiency
tolerance and the correlation to yield (Fehr, 1982; Liesch et al., 2011). Hintz et al., (1987)
developed a soybean population for high yield with acceptable chlorosis tolerance derived
from a backcross between a tolerant cultivar and a high yielding cultivar. Fe deficiency
tolerance of other grain legumes, such as chickpea (Ali et al., 1988; Saxena et al., 1990;
Bejiga et al., 1996), mungbeans (Srivines et al., (2010), cowpea (Goenaga et al., 2010), and
lentils (Erskine et al., 1993) has also been screened successfully under field condition.
Field screening of food legumes for efficiency of other nutrients has also been carried out,
including B deficiency in lentils (Srivastava et al., 1999; 2000), Mn efficiency and
concentration in chickpea (Rashid et al., 1990), seed Zn concentration in P. vulgaris
(Moraghan and Grafton, 1999), and P in P. vulgaris (Beebe et al., 1997).
23
Potted Soil and Nutrient Solution Tests
A pot screening method, conducted in both the growth chamber and the glasshouse, has
been developed to screen for Fe deficiency tolerance in several crops as a supplement to
screening in the field. Among the advantages of potted soil tests are they provide a uniform
soil for each genotype (Graham, 1984) and nutrient efficiency can be measured in the
seedling stage as the artificial stress condition can easily be imposed (Coulombe et al.,
1984; Fairbanks et al., 1987). A significant correlation has been reported for Fe deficiency
symptoms between genotypes grown in the field and pots containing field soil (Inskep and
Bloom, 1986; Takkar et al., 1989; Saxena et al., 1994). It was suggested that to maximize
the screening pressure, mixing top soil and subsoil in certain proportions is frequently
necessary (Graham, 1984).
White and Robson (1989) evaluated two species of lupins (L. angustifolius and L.
cosentinii) and field pea in pots using fine textured alkaline soils. Fe deficiency was
induced by both high soil moisture and adding CaCO3 and a high degree of variation in Fe
deficiency tolerance was identified among the lupins ranking from tolerant to very
susceptible. A single field pea, cv Dundale, was included in the study and it was
significantly more tolerant than all lupins to Fe deficiency. Brand et al., (2000),
investigated the tolerance of rough seeded lupins (L. pilosus and L. atlanticus) to
calcareous soil grown in pots and maintained at 120% field capacity. The rough seeded
lupin lines could be classified into classes ranging from susceptible to tolerant on the basis
of visual chlorosis score. There was a significant correlation between chlorosis score and
chlorophyll meter reading, chlorophyll concentration, active and total Fe concentration and
Mn concentration (Brand et al., 2000).
Soybean has been screened for tolerance to Fe deficiency by growing in calcareous soil in
pots with high soil moisture and variation in deficiency tolerance was apparent when
screened in both a growth chamber (Inskept and Bloom, 1986), and in a glasshouse and
growth chamber (Fairbanks et al., 1987). Screening for Fe deficiency tolerance using
potted soil has been successfully utilised for other crops including grapevine rootstock
where Fe deficiency was induced by bicarbonate (Kolesh et al., 1987) and oats in a highly
alkaline soil (McDaniel and Brown, 1982). Food legume crops have been screened for
tolerance to deficiency or toxicity of other nutrients in soil/sand collected from the field or
with addition of nutrients. Tolerance of chickpea and pigeon pea (Cajanus cajan) to B
deficiency was evaluated in sand culture with assessment based on symptoms and yield
24
response (Takkar et al., 1989), while screening of field pea (Bagheri et al., 1994) and
lentils (Yau and Erskine, 2000) for tolerance to B toxicity was undertaken in a glasshouse
with soil containing a high level of applied B. Variation in Zn efficiency has been
investigated in glasshouses for chickpea where efficiency was assessed on the basis of
yield ratio, Zn concentration and root/shoot ratio (Khan et al., 1998), dry bean (P. vulgaris)
with assessment based on seed Zn concentration (Moraghan and Grafton, 1999), and P.
vulgaris grown in a screenhouse (Hacisalihoglu et al., 2004).
Another method that has been widely and successfully used in screening for tolerance to
both nutrient/mineral efficiency and toxicity is solution culture. According to Graham
(1984), solution screening is the preferred method to use particularly when this provides
information about the physiological mechanisms of tolerance/efficiency in order to aid in
development of a rapid screening test.
Grain legumes have been screened in solution culture for Fe efficiency with deficiency
induced either by bicarbonate or nil Fe in solution culture. Examples include field pea
induced by NaHCO3 with assessment of chlorosis score and root/shoot ratio (Zribi and
Gharzali, 2002), field pea induced by the absence of Fe : direct deficiency or the presence
of 30 μM Fe + bicarbonate: indirect deficiency (Jelali et al., 2010), and chickpea induced
by NaHCO3 with assessment of chlorosis score and yield (Chaney et al., 1992), chickpea
induced by nutrient solution free of Fe with assessment of chlorosis symptoms and Fe(III)
reduction rate (Ohwaki and Sugahara, 1993), white lupins induced by NaHCO3 with
assessment of chlorosis symptom, active Fe and nodulation (Bertoni, 1992), soybeans
induced by absence of Fe (Lin et al., 1998; Zocchi et al., 2007), soybeans induced by
bicarbonate with assessment of chlorosis score (Dragonuk, 1989), soybeans induced by
Mg(HCO3)2 with assessment of chlorophyll content and Fe concentration (Norvell and
Adams, 2006), and peanut induced by absence of Fe with assessment of Fe reductase
activity, chlorosis symptoms measured by SPAD meter and active Fe (Gao and Shi, 2007).
Genetic variation in Fe efficiency of several legume crops has been compared between
solution culture and the field and results for the two selection methods were significantly
correlated. These crops include soybean (Jessen et al., 1988; Dragonuk et al., 1989; Lin et
al., 1998), chickpea (Chaney et al., 1992), lentil (Hamze et al., 1987), mungbean (Srivines
et al., 2010), and peanut (Gao and Shi, 2007).
25
In vitro Screening Methods
In vitro screening methods such as cell suspension, tissue culture and detached leaf tests
have been used for screening various plants in nutrient and salt efficiency, including
Brassica juncea (Jain et al., 1991), alfalfa (Medicago sativa) (Wincov, 1991), Coteus
blumei (Ibrahim et al., 1992), sugar beet (Larbi et al., 2001), arabidopsis (Arabidopsis
thaliana) (Wu et al., 2002), grapevine (Charbaji and Ayyoubi, 2004), and pear (Pyrus
communis L.) and quince (Cydonia oblonga Mill.) rootstocks (Donnini et al., 2008). This
method has increasingly been utilized as there are some advantages, such as the ability to
screen many samples rapidly and the ability to alter the severity of the conditions to which
the genotypes are exposed, thus increasing heritability, and the possibility of coupling
selection with somatic embryogenesis systems and the generation of variation for somatic
tissues (Heines, 1993).
2.5.2 The Rating of Tolerance to Nutrient Efficiency
The expression of chlorosis symptoms of leaf tissues in response to Fe deficiency has been
quantified in a number of ways, including visual assessment using a numerical rating scale
ranging from 0 to 5 (Bertoni, 1992; Brand et al., 2000), 1 to 4 (Chaney et al., 1992), 1 to 5
(Zaiter et al., 1988; Dragonuk, 1989), and 1 to 9 (Saxena, 1990), concentration of total Fe
(Terry and Abadia, 1986; Kolesh et al., 1987), concentration of active Fe / Fe2+ (Kaur et
al., 1984; Zohlen, 2002), and chlorophyll content (Marquard and Tipton, 1987; Turner and
Jund, 1991; Reeves et al., 1993).
The conventional method to estimate the content of chlorophyll in leaf tissues involves
chlorophyll extraction, followed by spectrophotometric measurements in vitro, and this
method is both destructive and time consuming. A portable SPAD-502 (Minolta
Corporation, Ramsey, NJ) chlorophyll meter has been used as an alternative method to
estimate chlorophyll (a and total) contents as visualized by leaf greenness. This
apparatus enables leaf tissues to be non-destructively sampled and the rating can be
conducted rapidly (Madeira et al., 2003; Kashiwagi et al., 2010). There is a highly
significant correlation between SPAD readings and extractable chlorophyll content
for several plant species (Marquard and Tipton, 1987; Kapotis et al., 2003; Liesch et
al., 2011), and it has been applied on various plants including soybeans (Monje and
Bugbee, 1992), peanut (Ghao and Shi, 2006), green beans (P. vulgaris) (Madeira et al.,
2000), chickpea (Kashiwagi et al., 2010), tomato (Dasgan et al., 2004), maize (Zea mays
26
L.) (Bouranis et al., 2003; Rorie et al., 2011), muskmelon (Cucumis melo) (Azia and
Stewart, 2001), sugarcane (Jangpromma et al., 2010), sunflower (Nikolic and Römheld,
2002), and cucumber (Waters and Troupe, 2011).
2.6 Field pea (Pisum sativum L.)
Field pea, which is recognized as garden pea (Pisum sativum var. sativum) and protein pea
(P. sativum var. arvense) (FAO, 1994), is an important pulse crop as a food source for
humans and animals and also is cultivated as a rotation crop (UC Sarep, 2003), a disease
and weed break and for biological N fixation to maintain soil fertility (Ford, et al., 2002),
and the second most important food legume worldwide after common bean Santalla et al,
2011).
Pisum plants are annual, diploid (2n=14) and the classification of the species has
varied considerably. Makasheva (1973) listed eight species of Pisum, namely: (1) P.
abyssinicum A. Br. (The abyssinicum pea), (2) P. aucheri Jaub. & Spach (The Aucher
pea), (3) P. arvense L. (The field pea or maple pea), (4) P. elatius Bieb. (The
Mediterranean pea), (5) P. formosum (Stev.) Alef. (The ornamental pea), (6) P. fulvum
Sibth. & Sm ( The garden pea), (7) P. sativum L. (The garden pea), and (8) P. syriacum
(Berger) Lehm (The Syrian pea). According to Palmer, et al. (1985), a taxon of the
domesticated pea is very closely related to wild pea, Pisum sativum ssp elatius var.
pumilo based on cpDNA detection.
The garden pea (P. sativum L.) is classified into subspecies, and these subspecies,
which are cultivated, include: subsp. sativum, subsp. asiaticum; subsp. abyssinicum and
subsp. transcaucasium (Makasheva, 1973), while Gentry (1971) divided P. sativum L. into six
subspecies, as follows : subsp. abyssinicum, subsp. jomardi, subsp. syriacum Berger, subsp.
elatius (Stev.) Alef., subsp. arvense Poir., and subsp. hortense Asch. & Graeb. Davis (1970)
classified the genus into only two species and this is more accepted. These are P.
sativum L. and P. fulvum Sibth. & Sm., and these are classified into subspecies as
follows : subsp. elatius var. elatius, subsp. elatius var. pumilio, subsp. elatius var.
brevipedunculatum, subsp. sativum var. arvense, and subsp. sativum var. sativum.
The origin of field pea was from wild forms of this same species approximately 10,000
years ago (Weeden et al., 2002), and probably originated in South-West Asia based on
archaeological evidence (Zohary and Hopf, 1988). Populations of wild pea are scattered
27
over a great area of the Mediterranean although very small and restricted, and the plants
can still be found in Afghanistan, Iran and Ethiopia (Esposito et al; 2007). Some
populations are now represented only in germplasm collections (Kosterin and Bogdanova,
2008). Field pea which is a native species of Southwest Asia and was among the first
crops cultivated by man, is now cultivated in many temperate countries (Baranger et al.,
2004), and as a cool-season crop in the subtropics and at higher altitudes in the
tropics (Davies, 1970).
Morphological characters of field pea were described by Davies (1970) and
Makasheva, (1973), as follows: field pea is an annual herb, classified as dwarf if the
height is less than 50 cm, semi-dwarf - 51-80 cm, medium tall - 81-150 cm, and tall -
150-350 cm, if the crop is grown in fertile soil. The stipule is larger than the leaflet with
the shape of semicordate. The leaves are varied in form, including (a) common leaf
terminating with unpaired tendril, (b) multifoliate terminating with unpaired leaflet, (c)
tendril without leaflets (afila), and (d) multiple imparipinnate terminating with minute
unpaired leaflets. Seeds are round or wrinkled in shape and varying in colour.
P. sativum L. belongs to the family Fabaceae (Leguminosae). The Leguminosae (Fabaceae
or bean family) is an important family of Angiospermae and is the third largest family of
higher plants (Young et al., 2003). It is estimated that there are 19,325 species in 727
genera and constitutes nearly one twelfth of the world’s flowering plants ( Kew, 2011). In
comparison, the Graminae family has about 10,000 species (Morris, 1999) and Brassicacae
has only 3,500 species (Gepts et al., 2005). The legume family ranges from small herbs
that are widespread to big trees that grow in many tropical rain forests (Sato et al., 2007).
The legume family is of enormous significance because so many species play an important
role in agriculture, as well as as sources of food and medicine. Leguminous plants are
capable of establishing symbiotic relationships with mycorrhiza and nitrogen-fixing
rhizobial bacteria to improve a plant's ability to deal with droughts, to acquire mineral
nutrients and to store carbohydrates (Kondorosi, 1998; Smith and Read, 2008; Adams, et
al., 2010).). Rhizobia in root nodules and fungal associations assist leguminous plants to
scavenge essential elements from even the poorest soils to stabilise and improve soil
fertility (Brockwell et al., 1995), and to accumulate an enormous quantity of biological
nitrogen (Sprent, 2007).
28
Grain legumes are an important food supply to many millions of people around the world
and these crops are second only to grasses in economic importance and food supply (Gepts
et al., 2005). Legumes are rich sources of proteins, vitamins and some minerals, such as
iron, zinc, calcium, and magnesium (Iqbal et al., 2006; Wang et al., 2003). However, the
legumes also contain antinutritional factors, such as proteinase inhibitors, lectin, raffinose
oligosaccharides, saponins, polyphenols and phytate and these antinutritional factors
reduce the nutritional value of a food by lowering the digestibility or bioavailability of
nutrients (Sanberg, 2002).
Classically Leguminosae is divided into three subfamilies, namely : Caisalpinioideae,
Mimosoideae and Papilinodeae (Adams, et al. 2010; Hougaard et al., 2008; Sprent, 2007).
Most grain legumes are included in Papilinodeae, the subfamily which is economically
important food and feed legumes (Gept et al., 2005). Young et al., (2003) stated that there
are two main groups of cultivated species within Papilinodeae, namely : the tropical or
Phaseloid legumes (including the genera Phaseolus, Vigna, Glycine and Cajanus) and
temperate or Galegoid legumes (including Vicia, Lotus, Cicer and Lens). However Doyle
and Luckow (2003) included four clades within the Papilinodeae, namely (1) the
Geneistoid (including lupinus), (2) Aes (including peanut), (3) Naloga Legina (including
cool-season legumes, such as alfalfa, chickpea, faba bean, lentil and field pea), and (4) the
Phaseloid/Milletioid (including warm-season legumes, such as common bean, cowpea,
peageon pea, and soybean).
Similarity in certain traits among closely related species within the same genera has been
identified. This is related to synteny or colinearity which refers to a conservation of gene
content, order and orientation between chromosomes of different species or between non-
homologous chromosomes within a single species (Newbury and Paterson, 2003).
Comparative mapping has demonstrated the existence of synteny within the
Papilionoideae subfamily of Fabaceae. These species include soybean (G. max), peanut
(A. hypogea), mung bean (V. radiata), chickpea (C. arietinum), lentil (L. culinaris),
common bean (P. vulgaris), field pea (P. sativum) and alfalfa (M. sativa). For all of these
eight genera detailed genetic maps have been constructed and evidence for colinearity
between genomes is emerging (Newbury and Paterson, 2003). Weeden et al. (1992) were
able to establish conserved gene order across parts of the lentil and pea genomes.
Microsynteny between pea P. sativum and Medicago truncatula, which is becoming
established as a model legume species partly because of its small genome (Cook, 1999),
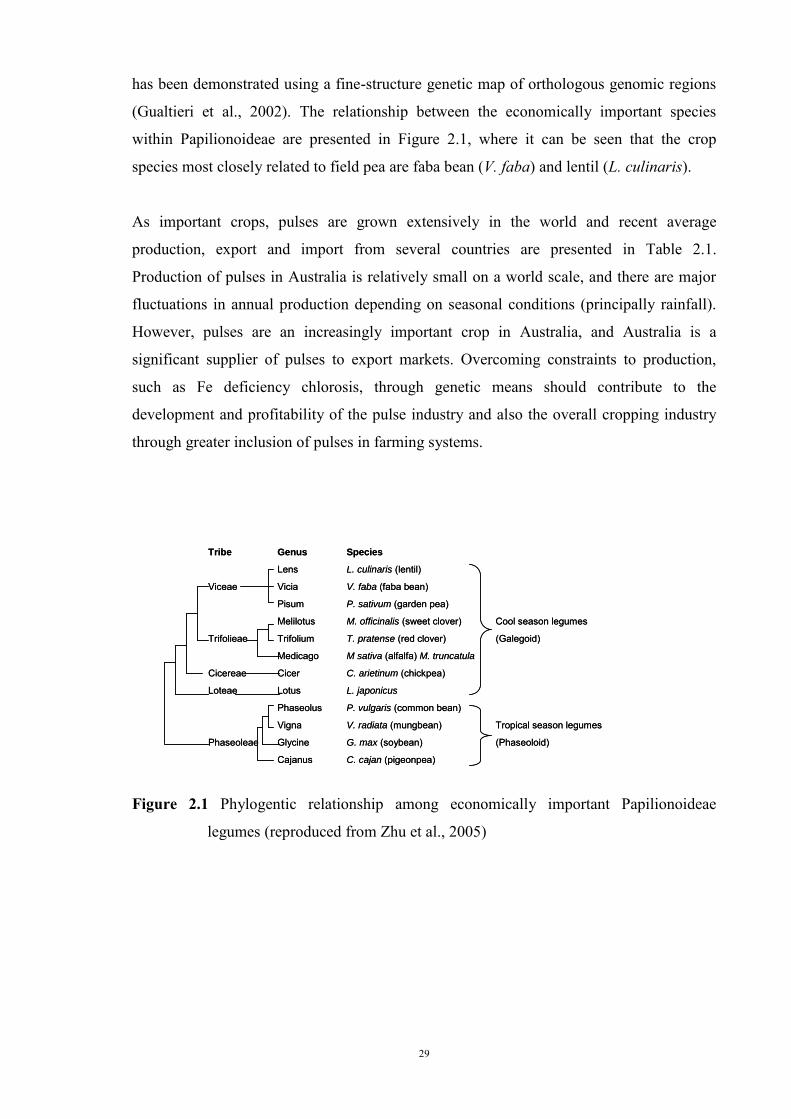
29
has been demonstrated using a fine-structure genetic map of orthologous genomic regions
(Gualtieri et al., 2002). The relationship between the economically important species
within Papilionoideae are presented in Figure 2.1, where it can be seen that the crop
species most closely related to field pea are faba bean (V. faba) and lentil (L. culinaris).
As important crops, pulses are grown extensively in the world and recent average
production, export and import from several countries are presented in Table 2.1.
Production of pulses in Australia is relatively small on a world scale, and there are major
fluctuations in annual production depending on seasonal conditions (principally rainfall).
However, pulses are an increasingly important crop in Australia, and Australia is a
significant supplier of pulses to export markets. Overcoming constraints to production,
such as Fe deficiency chlorosis, through genetic means should contribute to the
development and profitability of the pulse industry and also the overall cropping industry
through greater inclusion of pulses in farming systems.
Tribe Genus Species
Lens L. culinaris (lentil)
Viceae Vicia V. faba (faba bean)
Pisum P. sativum (garden pea)
Melilotus M. officinalis (sweet clover) Cool season legumes
Trifolieae Trifolium T. pratense (red clover) (Galegoid)
Medicago M sativa (alfalfa) M. truncatula
Cicereae Cicer C. arietinum (chickpea)
Loteae Lotus L. japonicus
Phaseolus P. vulgaris (common bean)
Vigna V. radiata (mungbean) Tropical season legumes
Phaseoleae Glycine G. max (soybean) (Phaseoloid)
Cajanus C. cajan (pigeonpea)
Figure 2.1 Phylogentic relationship among economically important Papilionoideae
legumes (reproduced from Zhu et al., 2005)
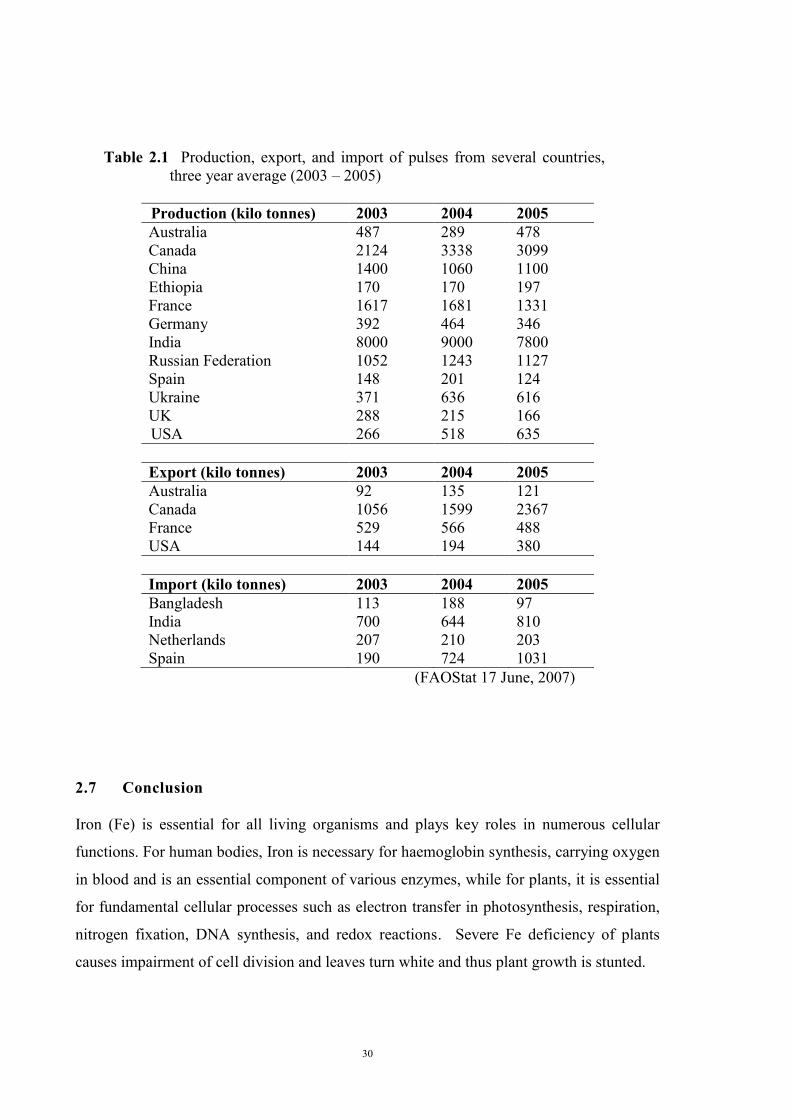
30
Table 2.1 Production, export, and import of pulses from several countries,
three year average (2003 – 2005)
Production (kilo tonnes) 2003 2004 2005 Australia 487 289 478 Canada 2124 3338 3099 China 1400 1060 1100 Ethiopia 170 170 197 France 1617 1681 1331 Germany 392 464 346 India 8000 9000 7800 Russian Federation 1052 1243 1127 Spain 148 201 124 Ukraine 371 636 616 UK 288 215 166 USA 266 518 635 Export (kilo tonnes) 2003 2004 2005 Australia 92 135 121 Canada 1056 1599 2367 France 529 566 488 USA 144 194 380 Import (kilo tonnes) 2003 2004 2005 Bangladesh 113 188 97 India 700 644 810 Netherlands 207 210 203 Spain 190 724 1031
(FAOStat 17 June, 2007)
2.7 Conclusion
Iron (Fe) is essential for all living organisms and plays key roles in numerous cellular
functions. For human bodies, Iron is necessary for haemoglobin synthesis, carrying oxygen
in blood and is an essential component of various enzymes, while for plants, it is essential
for fundamental cellular processes such as electron transfer in photosynthesis, respiration,
nitrogen fixation, DNA synthesis, and redox reactions. Severe Fe deficiency of plants
causes impairment of cell division and leaves turn white and thus plant growth is stunted.
31
The abundant Fe in soils is not always in line with the fraction that is easily
available for plant requirement. This is due to the fact that most Fe is in a form that
plants cannot use. The availability of Fe is dependent on the level of solubility and
the soluble rate of the soil structures, and Fe is much more available at low than at
high pH. Fe deficiency usually occurs on soils that have high pH or calcareous soils,
with a high content of carbonate or bicarbonate but poor in organic matter.
The way plant species mobilise and uptake Fe can be grouped into two categories,
namely the group of most species excluding Graminae that utilise Strategy I
(increased activity of reductase, proton extrusion, and release of reducing chelating
agents) and the other group (i.e. Graminae) which use Strategy II (release and
transport of phytosiderophores). These different mechanisms result in a different
impact in tolerance to Fe deficiency.
Evidence has been presented that there is a great variation in Fe tolerance among
various plants and even within a plant species. This variation has led some authors to
identify not only physiological mechanisms by which plants respond to Fe deficiency, but
also the genetic control of tolerance that might facilitate breeding plant varieties that
express enhanced tolerance to Fe deficiency. Screening methods to identify nutrient
deficiency tolerance have also been developed for a number of species, and this can be
carried out either in the field, a glasshouse, a screenhouse, or a laboratory. There is strong
evidence that the results of the screening by any of those methods are significantly
correlated. Fe correction through the application of Fe fertilizer can enable crops to
recover from Fe deficiency symptom to some extent and in the short term, but the
combination of cultivating Fe deficiency tolerant cultivars integrated with cultural methods
would improve the crop performace and significantly reduce cost of production. A better
understanding of the genetics of tolerance to Fe deficiency in grain legumes in particular is
necessary in order for Fe deficiency tolerance to be utilised as a long term strategy.

32
33
CHAPTER 3
Development of a screening method to identify peas tolerant to Fe deficiency
3.1 Introduction
The tolerance of peas to Fe-deficiency is generally evaluated by their growth on high pH
calcareous soils under field conditions. While field screening has the advantage of testing
plants in environments where commercial crops are grown, there are problems in using a
field environment. These include the limitation of (a) evaluating only one crop per year, (b)
the inability to alter the severity of the conditions to which the genotypes are exposed, (c)
soil and environmental conditions that result in poor differentiation of genotypes can
obstruct the development and evaluation of Fe efficient cultivars, and (d) the high cost of
screening, particularly if a field site is remote and with a large numbers of plots.
Although artificial screening systems can not replace field testing, as a supplement,
solution and pot soil based screening methods have been developed and have been
successful in identifying tolerant genotypes, including food legumes: chick pea (Chaney et
al., 1992), lupin (Bertoni et al., 1992), field pea (Zribi and Gharsalli, 2002) and mung bean
(Srinives et al., 2010). Field evaluation is required to confirm the results under controlled
conditions, and to identify lines with the full complement of other characteristics, such as
high yield potential, agronomic adaptation, disease resistance and quality, that are required
of commercial cultivars.
The potential advantages of the artificial screening procedures for plant breeding are that
they can be utilized throughout the year as they are usually conducted under controlled
conditions. As these methods are usually conducted in either a glasshouse or a growth
room it is possible to manipulate the environment to ensure maximum expression of
genetic variation. In addition, the systems are easily repeatable thus the evaluation will be
rapid and labour efficient and a number of cycles of selection can be undertaken in a year.
A screening system to identify Fe deficiency tolerance should be based on parameters that
are simple to record, non-destructive and capable of projecting the yield loss due to
34
intolerance. The rating should be conducted at the earliest stage of growth at which severe
symptoms occur (Graham, 1984).
The precision of screening methods is important for successful genetic studies and also to
minimise environmental effects and thus maximise heritability in a breeding program. One
of the common methods to screen for tolerance to Fe deficiency chlorosis includes
screening in nutrient solution. The efficiencies of the nutrient-solution procedure reduce
the effects of (a) unfavourable season effects, (b) maintenance of severe Fe deficiency to
better discriminate between genotypes, and (c) each cycle of genotypic evaluation can be
completed in only a few weeks (Coulombe et al., 1984; Dragonuk, et al., 1989; Chaney et
al., 1992).
Nutrient solution has been used to evaluate Fe deficiency chlorosis with results correlated
to field screening methods and has enabled efficient and accurate identification of tolerant
genotypes of soybean (Dragonuk et al., 1989; Norvell and Adams, 2006), white lupin
(Bertoni et al., 1992), chickpea (Chaney et al., 1992), lentil (Hamze et al., 1987), dry bean
(Zaiter et al., 1988), mung bean (Srinives et al., 2010) and peanut (Gao and Shi, 2007).
Bicarbonate is considered one of the most important factors for inducing Fe deficiency
chlorosis (Chaney et al., 1992; Jelali et al., 2010). Adding bicarbonate to nutrient solution
has been used to screen soybean cultivars for Fe deficiency chlorosis tolerance and a
significant correlation was found between the nutrient solution test and field results
(Coulombe et al., 1984). Genetic variation in Fe deficiency chlorosis tolerance of two
genotypes of field peas has been identified through the addition of 10 mM sodium
bicarbonate (NaHCO3) to nutrition solution (Zribi and Gharsalli, 2002). Bicarbonate in the
form of Mg(HCO3)2 has also been used to identify the tolerance of soybeans to Fe
deficiency chlorosis with assessment of chlorophyll content and Fe concentration (Norvell
and Adams, 2006). High concentration (10 mM) potassium bicarbonate (KHCO3) has
recently applied to identify pear and quince rootstocks for Fe deficiency chlorosis tolerance
(Donnini et al., 2008).
The major aims of experiments in this chapter were to evaluate both solution and soil
screening methods to identify the most appropriate method to use for the experiments
investigating genetic control of tolerance to Fe deficiency and the possible mechanisms of
tolerance in P. sativum.
35
3.2 Development of a solution screening method to identify peas tolerant to Fe
deficiency (Experiment 1)
3.2.1 Introduction
Investigations into developing a method of screening in solution culture contained two sub-
experiments which tested the effect of different kinds of bicarbonate, sodium (Na) and
potassium (K). As the overall procedure for both experiments was the same, and in order to
avoid unnecessary repetition in the description, the general materials and methods for the
two experiments were combined, as described below.
The aims of this experiment were (a) to examine the effect of HCO3- concentration in
solution on the growth and chlorosis symptoms of peas, (b) to compare the effect of Na
and K bicarbonate, and (c) to determine a suitable HCO3- concentration for selection of
tolerant genotypes
3.2.2 General Materials and Methods
Genetic Materials
Genetic materials were provided by Dr MM Ali, field pea breeding program, South
Australian Research and Development Institute (SARDI) and represented a broad range of
genetic diversity, based on pedigree information, for varieties and advanced lines in the
SARDI breeding program (Table 3.1) (Plate 3.1). The lines differed for a number of major
morphological traits including leaf type (conventional and semi-leafless/afila), flower
colour (coloured and white) and plant height (dwarf and normal).
Most of the genotypes had not been screened for tolerance to Fe deficiency chlorosis.
Field peas are self pollinated and therefore individual plants in the more advanced stages of
the breeding program generally have a low level of overall heterozygosity. However, some
degree of heterogeneity would be expected within lines, particularly if they were F2 or F3
derived. Extensive selfing and single plant selection to develop homozygous,
homogeneous lines prior to testing was not undertaken as part of this project due to time
constraints.
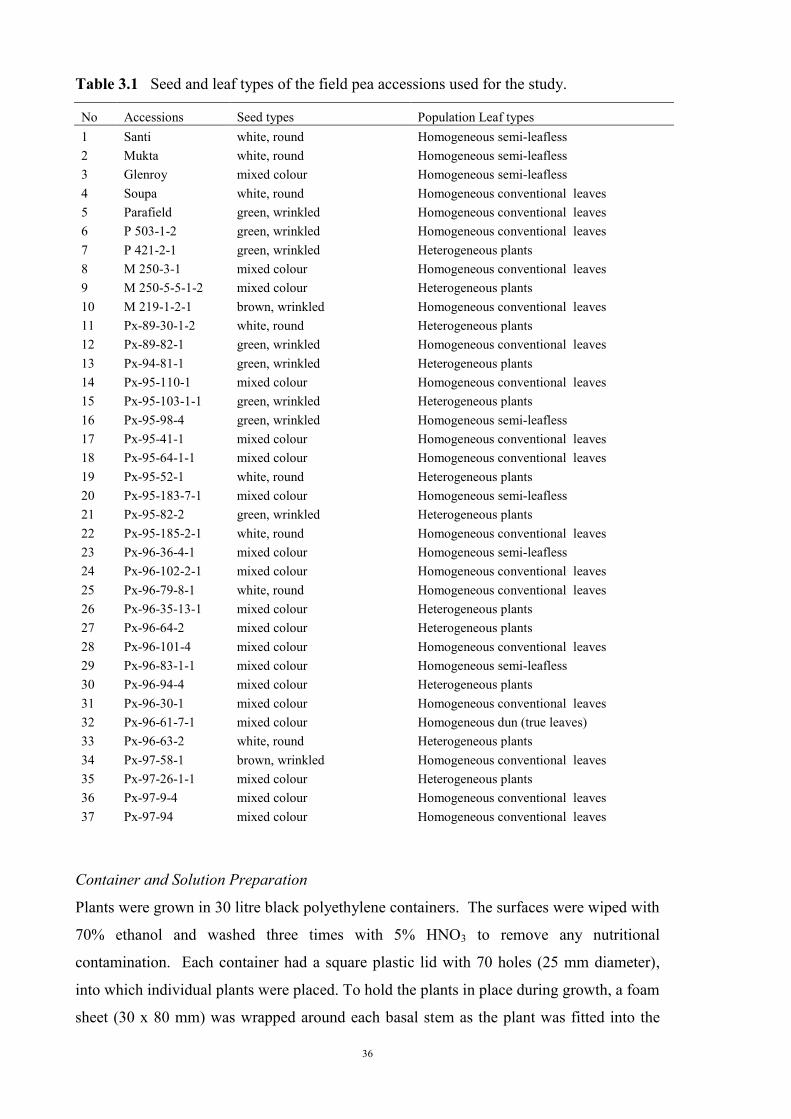
36
Table 3.1 Seed and leaf types of the field pea accessions used for the study.
No Accessions Seed types Population Leaf types 1 Santi white, round Homogeneous semi-leafless 2 Mukta white, round Homogeneous semi-leafless 3 Glenroy mixed colour Homogeneous semi-leafless 4 Soupa white, round Homogeneous conventional leaves 5 Parafield green, wrinkled Homogeneous conventional leaves 6 P 503-1-2 green, wrinkled Homogeneous conventional leaves 7 P 421-2-1 green, wrinkled Heterogeneous plants 8 M 250-3-1 mixed colour Homogeneous conventional leaves 9 M 250-5-5-1-2 mixed colour Heterogeneous plants 10 M 219-1-2-1 brown, wrinkled Homogeneous conventional leaves 11 Px-89-30-1-2 white, round Heterogeneous plants 12 Px-89-82-1 green, wrinkled Homogeneous conventional leaves 13 Px-94-81-1 green, wrinkled Heterogeneous plants 14 Px-95-110-1 mixed colour Homogeneous conventional leaves 15 Px-95-103-1-1 green, wrinkled Heterogeneous plants 16 Px-95-98-4 green, wrinkled Homogeneous semi-leafless 17 Px-95-41-1 mixed colour Homogeneous conventional leaves 18 Px-95-64-1-1 mixed colour Homogeneous conventional leaves 19 Px-95-52-1 white, round Heterogeneous plants 20 Px-95-183-7-1 mixed colour Homogeneous semi-leafless 21 Px-95-82-2 green, wrinkled Heterogeneous plants 22 Px-95-185-2-1 white, round Homogeneous conventional leaves 23 Px-96-36-4-1 mixed colour Homogeneous semi-leafless 24 Px-96-102-2-1 mixed colour Homogeneous conventional leaves 25 Px-96-79-8-1 white, round Homogeneous conventional leaves 26 Px-96-35-13-1 mixed colour Heterogeneous plants 27 Px-96-64-2 mixed colour Heterogeneous plants 28 Px-96-101-4 mixed colour Homogeneous conventional leaves 29 Px-96-83-1-1 mixed colour Homogeneous semi-leafless 30 Px-96-94-4 mixed colour Heterogeneous plants 31 Px-96-30-1 mixed colour Homogeneous conventional leaves 32 Px-96-61-7-1 mixed colour Homogeneous dun (true leaves) 33 Px-96-63-2 white, round Heterogeneous plants 34 Px-97-58-1 brown, wrinkled Homogeneous conventional leaves 35 Px-97-26-1-1 mixed colour Heterogeneous plants 36 Px-97-9-4 mixed colour Homogeneous conventional leaves 37 Px-97-94 mixed colour Homogeneous conventional leaves
Container and Solution Preparation
Plants were grown in 30 litre black polyethylene containers. The surfaces were wiped with
70% ethanol and washed three times with 5% HNO3 to remove any nutritional
contamination. Each container had a square plastic lid with 70 holes (25 mm diameter),
into which individual plants were placed. To hold the plants in place during growth, a foam
sheet (30 x 80 mm) was wrapped around each basal stem as the plant was fitted into the
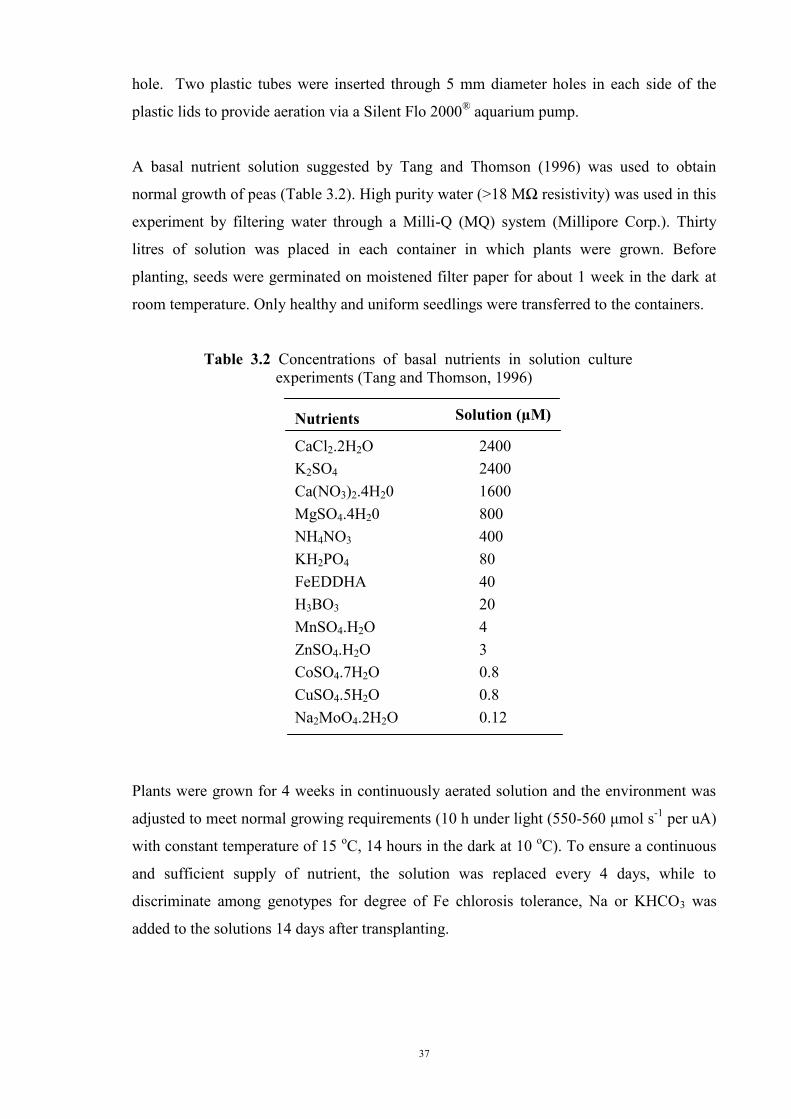
37
hole. Two plastic tubes were inserted through 5 mm diameter holes in each side of the
plastic lids to provide aeration via a Silent Flo 2000® aquarium pump.
A basal nutrient solution suggested by Tang and Thomson (1996) was used to obtain
normal growth of peas (Table 3.2). High purity water (>18 MΩ resistivity) was used in this
experiment by filtering water through a Milli-Q (MQ) system (Millipore Corp.). Thirty
litres of solution was placed in each container in which plants were grown. Before
planting, seeds were germinated on moistened filter paper for about 1 week in the dark at
room temperature. Only healthy and uniform seedlings were transferred to the containers.
Table 3.2 Concentrations of basal nutrients in solution culture experiments (Tang and Thomson, 1996)
Nutrients Solution (µM)
CaCl2.2H2O 2400 K2SO4 2400 Ca(NO3)2.4H20 1600 MgSO4.4H20 800 NH4NO3 400 KH2PO4 80 FeEDDHA 40 H3BO3 20 MnSO4.H2O 4 ZnSO4.H2O 3 CoSO4.7H2O 0.8 CuSO4.5H2O 0.8 Na2MoO4.2H2O 0.12
Plants were grown for 4 weeks in continuously aerated solution and the environment was
adjusted to meet normal growing requirements (10 h under light (550-560 μmol s-1 per uA)
with constant temperature of 15 oC, 14 hours in the dark at 10 oC). To ensure a continuous
and sufficient supply of nutrient, the solution was replaced every 4 days, while to
discriminate among genotypes for degree of Fe chlorosis tolerance, Na or KHCO3 was
added to the solutions 14 days after transplanting.
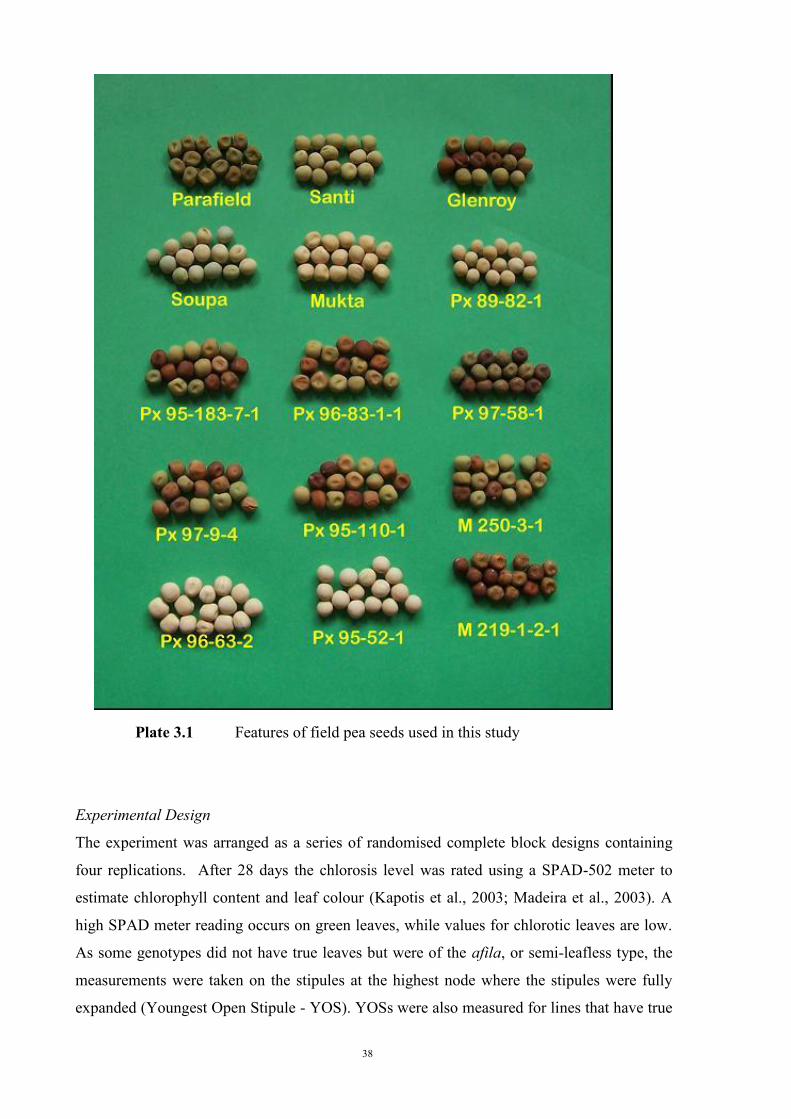
38
Plate 3.1 Features of field pea seeds used in this study
Experimental Design
The experiment was arranged as a series of randomised complete block designs containing
four replications. After 28 days the chlorosis level was rated using a SPAD-502 meter to
estimate chlorophyll content and leaf colour (Kapotis et al., 2003; Madeira et al., 2003). A
high SPAD meter reading occurs on green leaves, while values for chlorotic leaves are low.
As some genotypes did not have true leaves but were of the afila, or semi-leafless type, the
measurements were taken on the stipules at the highest node where the stipules were fully
expanded (Youngest Open Stipule - YOS). YOSs were also measured for lines that have true
39
leaves to enable direct comparisons across all lines. The rating was based on SPAD meter
measurements of leaves only in experiments when all plants had conventional leaves. The
plant growth was also determined by measuring dry matter of shoots and roots, and plant
tissues were analysed for nutrient concentration by ICP-OES analysis (Zarcinas et al., 1987).
Prior to the analysis, the tissues were washed three times with Milli-Q water to remove any
nutritional contamination and oven dried at 80 oC for 3 days.
3.2.3 Experiment 1.1 The effect of NaHCO3 on Fe deficiency chlorosis symptoms of field peas
3.2.3.1 Materials and Methods
The objective of this experiment was to identify an appropriate concentration of NaHCO3 to
discriminate between tolerant and sensitive genotypes. Nine field pea genotypes were tested
for response to a range of NaHCO3 concentrations. The genotypes were: Santi, Soupa,
Mukta, Parafield, Px-95-41-1, Px-95-103-1-1, Px-95-98-4, Px-89-30-1-2, and Px-95-110-1.
Three treatments, 5, 10, and 15 mM NaHCO3, and a control were applied. In the HCO3-
treatments, CaCO3 was added (for example, 0.5 g L-1 CaCO3 for the 5 mM NaHCO3
treatment, 1.0 g L-1 CaCO3 for the 10 mM NaHCO3 treatment) to buffer the solution (Tang
and Thomson, 1996). In the control treatment, 1 mM MES (2-[N-Morpholino]ethanesulfonic
acid) was added to buffer the solution to pH 5.1 (Tang and Thomson, 1996). The experiment
was set up as a factorial experiment using a randomised complete block design with four
replications. Each replication contained four plants. Details of the procedure are as described
above (Section 3.2.2). The experiment was analysed by ANOVA.
The pH of the solution was monitored everyday throughout the experiment. Chlorosis
levels of YOS and stipules at the 3rd top nodes (3rd YOS) were recorded at 28 DAT using a
SPAD meter. The plant growth was also determined by measuring dry matter of shoots and
roots. To test for significant differences in chlorosis score, a two-way analysis of variance
(ANOVA) between the concentration of NaHCO3 and genotypes was conducted using
GenStat Sixth Edition. ANOVA was also used to test significant differences for plant dry
weight and root/shoot ratio between NaHCO3 concentration and genotypes. The ratio of
lines grown in 10 mM NaHCO3 concentration to control treatment was calculated for YOS
chlorosis symptom (YOS 10/0), shoot dry weight (shoot 10/0), root dry weight (root 10/0)
and root/shoot ratio (root/shoot (10/0) ratio)
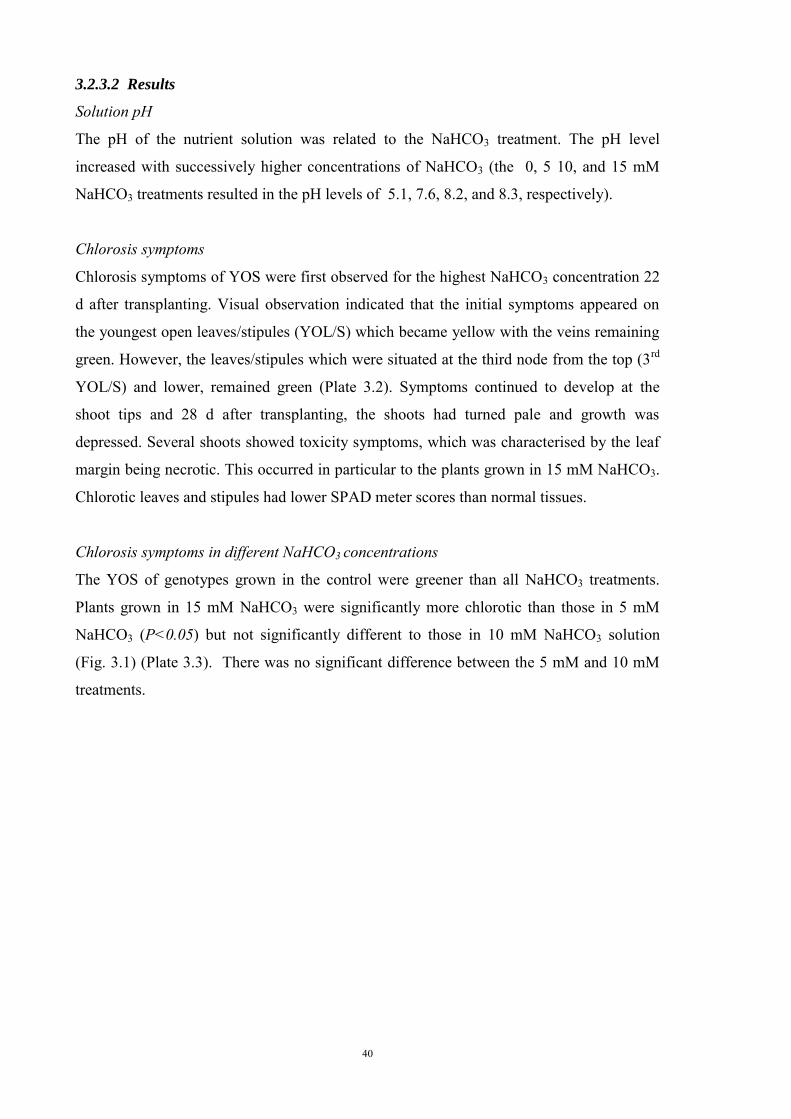
40
3.2.3.2 Results
Solution pH
The pH of the nutrient solution was related to the NaHCO3 treatment. The pH level
increased with successively higher concentrations of NaHCO3 (the 0, 5 10, and 15 mM
NaHCO3 treatments resulted in the pH levels of 5.1, 7.6, 8.2, and 8.3, respectively).
Chlorosis symptoms
Chlorosis symptoms of YOS were first observed for the highest NaHCO3 concentration 22
d after transplanting. Visual observation indicated that the initial symptoms appeared on
the youngest open leaves/stipules (YOL/S) which became yellow with the veins remaining
green. However, the leaves/stipules which were situated at the third node from the top (3rd
YOL/S) and lower, remained green (Plate 3.2). Symptoms continued to develop at the
shoot tips and 28 d after transplanting, the shoots had turned pale and growth was
depressed. Several shoots showed toxicity symptoms, which was characterised by the leaf
margin being necrotic. This occurred in particular to the plants grown in 15 mM NaHCO3.
Chlorotic leaves and stipules had lower SPAD meter scores than normal tissues.
Chlorosis symptoms in different NaHCO3 concentrations
The YOS of genotypes grown in the control were greener than all NaHCO3 treatments.
Plants grown in 15 mM NaHCO3 were significantly more chlorotic than those in 5 mM
NaHCO3 (P<0.05) but not significantly different to those in 10 mM NaHCO3 solution
(Fig. 3.1) (Plate 3.3). There was no significant difference between the 5 mM and 10 mM
treatments.
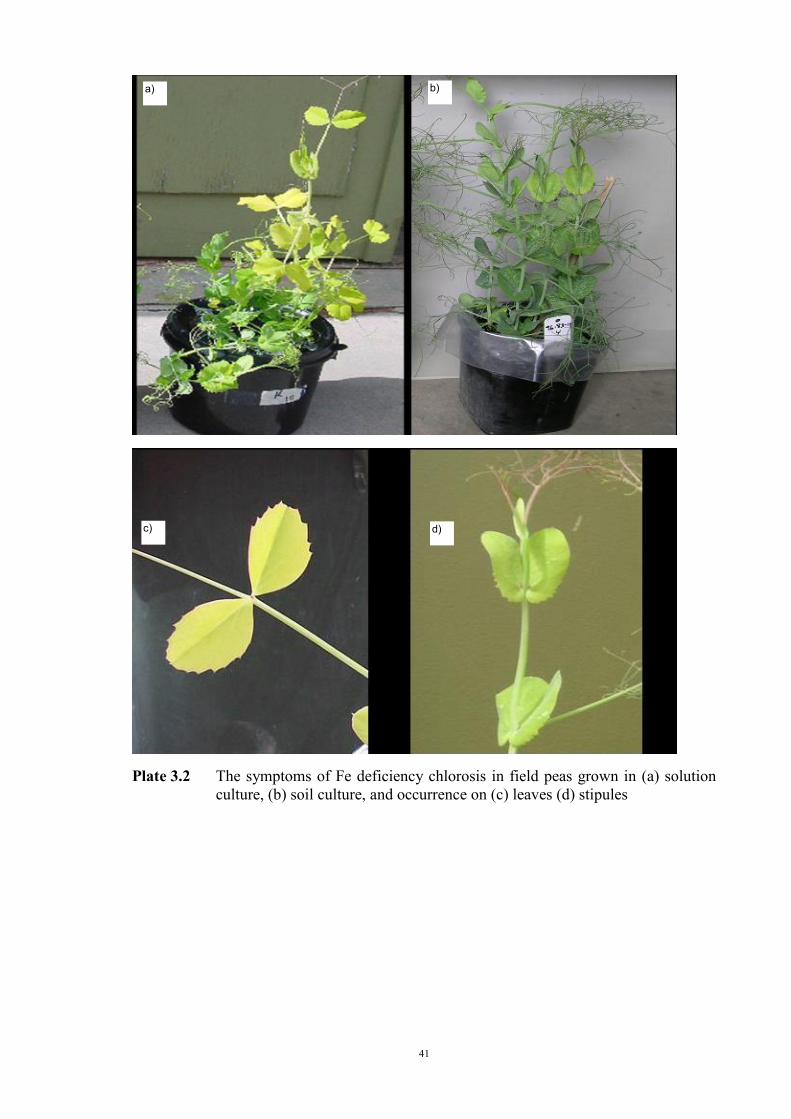
41
Plate 3.2 The symptoms of Fe deficiency chlorosis in field peas grown in (a) solution
culture, (b) soil culture, and occurrence on (c) leaves (d) stipules
a) b)
c) d)
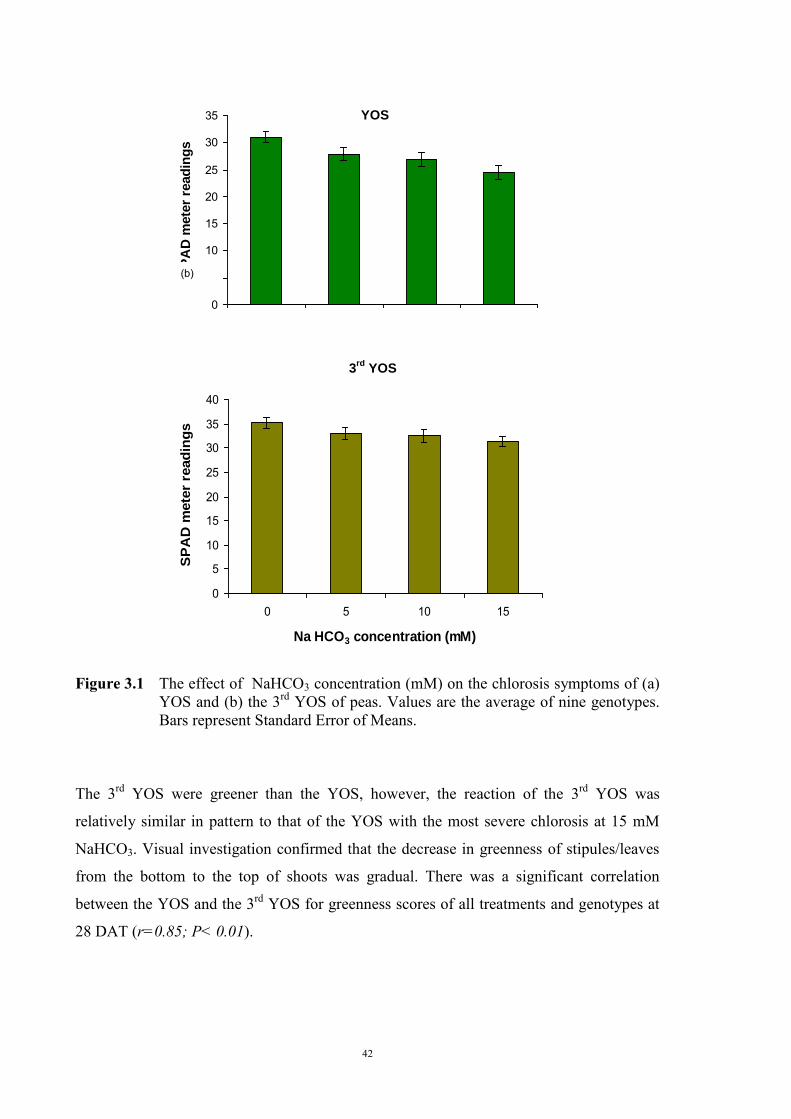
42
Figure 3.1 The effect of NaHCO3 concentration (mM) on the chlorosis symptoms of (a)
YOS and (b) the 3rd YOS of peas. Values are the average of nine genotypes. Bars represent Standard Error of Means.
The 3rd YOS were greener than the YOS, however, the reaction of the 3rd YOS was
relatively similar in pattern to that of the YOS with the most severe chlorosis at 15 mM
NaHCO3. Visual investigation confirmed that the decrease in greenness of stipules/leaves
from the bottom to the top of shoots was gradual. There was a significant correlation
between the YOS and the 3rd YOS for greenness scores of all treatments and genotypes at
28 DAT (r=0.85; P< 0.01).
0
5
10
15
20
25
30
35
SP
AD
mete
r re
ad
ing
s
0
5
10
15
20
25
30
35
40
0 5 10 15
Na HCO3 concentration (mM)
SP
AD
mete
r re
ad
ing
s
3rd
YOS
YOS
(b)
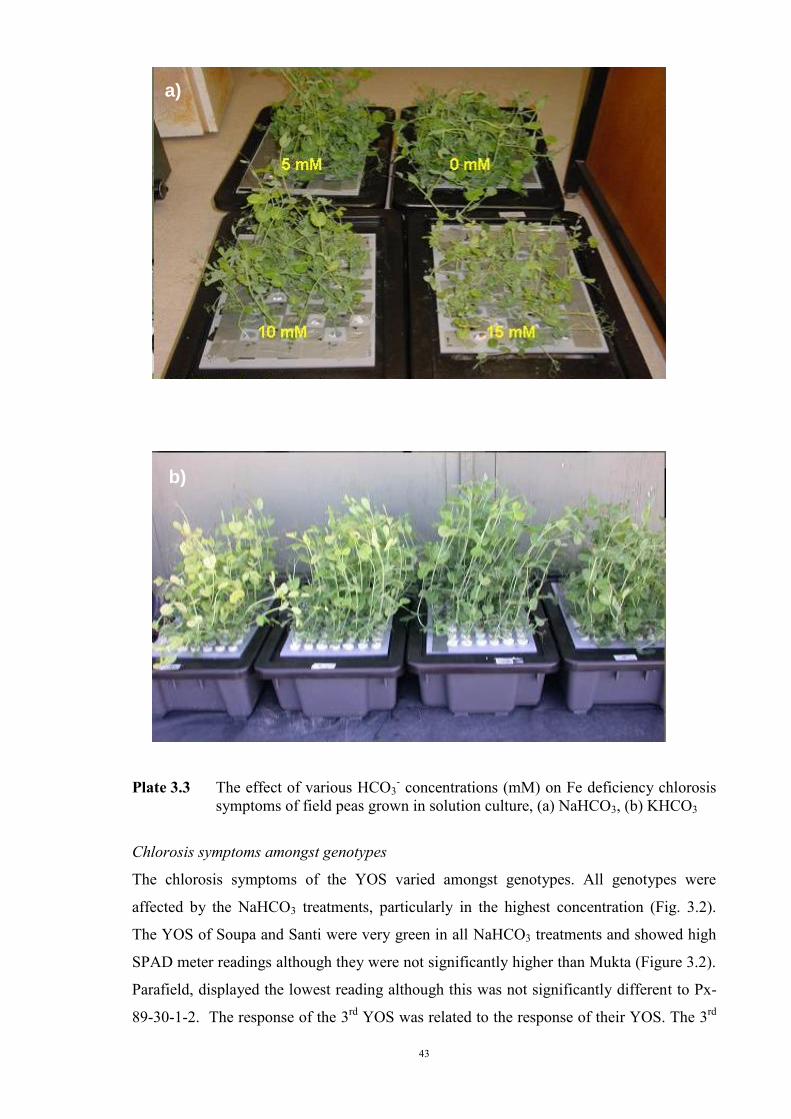
43
Plate 3.3 The effect of various HCO3
- concentrations (mM) on Fe deficiency chlorosis symptoms of field peas grown in solution culture, (a) NaHCO3, (b) KHCO3
Chlorosis symptoms amongst genotypes
The chlorosis symptoms of the YOS varied amongst genotypes. All genotypes were
affected by the NaHCO3 treatments, particularly in the highest concentration (Fig. 3.2).
The YOS of Soupa and Santi were very green in all NaHCO3 treatments and showed high
SPAD meter readings although they were not significantly higher than Mukta (Figure 3.2).
Parafield, displayed the lowest reading although this was not significantly different to Px-
89-30-1-2. The response of the 3rd YOS was related to the response of their YOS. The 3rd
b)
a)
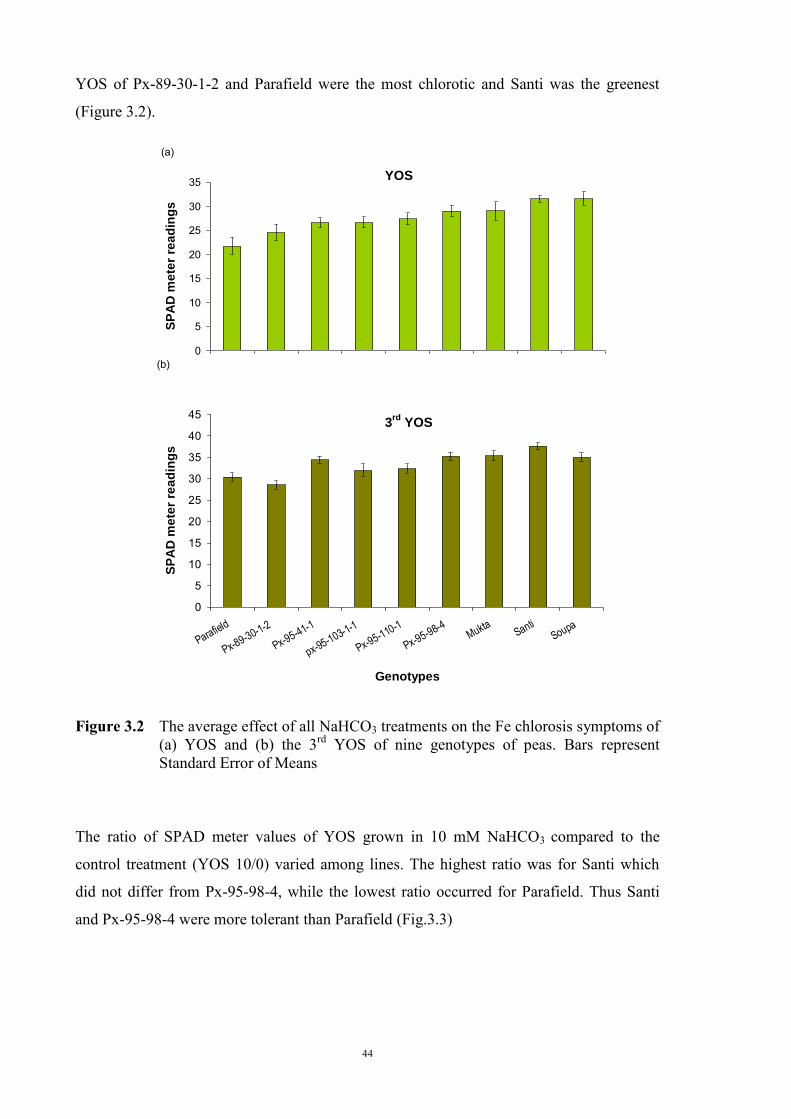
44
YOS of Px-89-30-1-2 and Parafield were the most chlorotic and Santi was the greenest
(Figure 3.2). Figure 3.2 The average effect of all NaHCO3 treatments on the Fe chlorosis symptoms of
(a) YOS and (b) the 3rd YOS of nine genotypes of peas. Bars represent Standard Error of Means
The ratio of SPAD meter values of YOS grown in 10 mM NaHCO3 compared to the
control treatment (YOS 10/0) varied among lines. The highest ratio was for Santi which
did not differ from Px-95-98-4, while the lowest ratio occurred for Parafield. Thus Santi
and Px-95-98-4 were more tolerant than Parafield (Fig.3.3)
0
5
10
15
20
25
30
35
40
45
Parafield
Px-89-30-1-2
Px-95-41-1
px-95-103-1-1
Px-95-110-1
Px-95-98-4Mukta
SantiSoupa
Genotypes
SP
AD
me
ter
rea
din
gs
0
5
10
15
20
25
30
35S
PA
D m
ete
r re
ad
ing
s
YOS
3rd
YOS
(b)
(a)
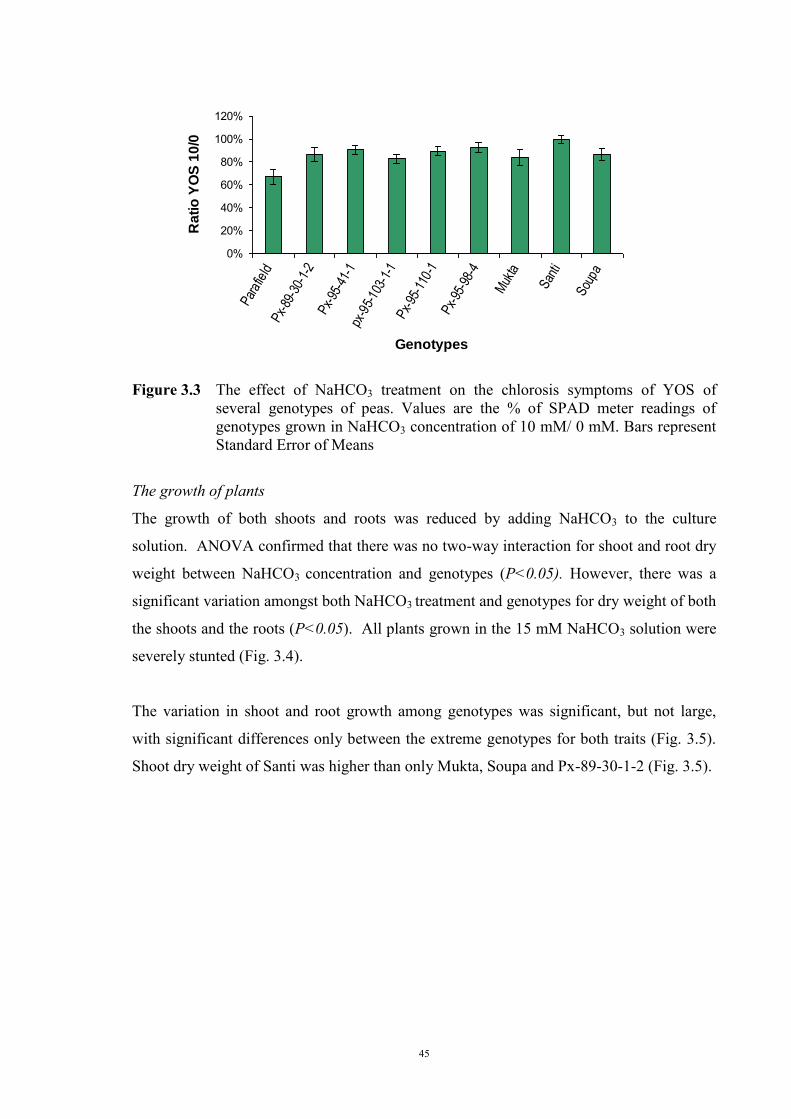
45
Figure 3.3 The effect of NaHCO3 treatment on the chlorosis symptoms of YOS of
several genotypes of peas. Values are the % of SPAD meter readings of genotypes grown in NaHCO3 concentration of 10 mM/ 0 mM. Bars represent Standard Error of Means
The growth of plants
The growth of both shoots and roots was reduced by adding NaHCO3 to the culture
solution. ANOVA confirmed that there was no two-way interaction for shoot and root dry
weight between NaHCO3 concentration and genotypes (P<0.05). However, there was a
significant variation amongst both NaHCO3 treatment and genotypes for dry weight of both
the shoots and the roots (P<0.05). All plants grown in the 15 mM NaHCO3 solution were
severely stunted (Fig. 3.4).
The variation in shoot and root growth among genotypes was significant, but not large,
with significant differences only between the extreme genotypes for both traits (Fig. 3.5).
Shoot dry weight of Santi was higher than only Mukta, Soupa and Px-89-30-1-2 (Fig. 3.5).
0%
20%
40%
60%
80%
100%
120%
Par
afie
ldP
x-89
-30-
1-2
Px-
95-4
1-1
px-9
5-10
3-1-
1P
x-95
-110
-1P
x-95
-98-
4
Muk
ta
San
ti
Sou
pa
Genotypes
Ra
tio
YO
S 1
0/0
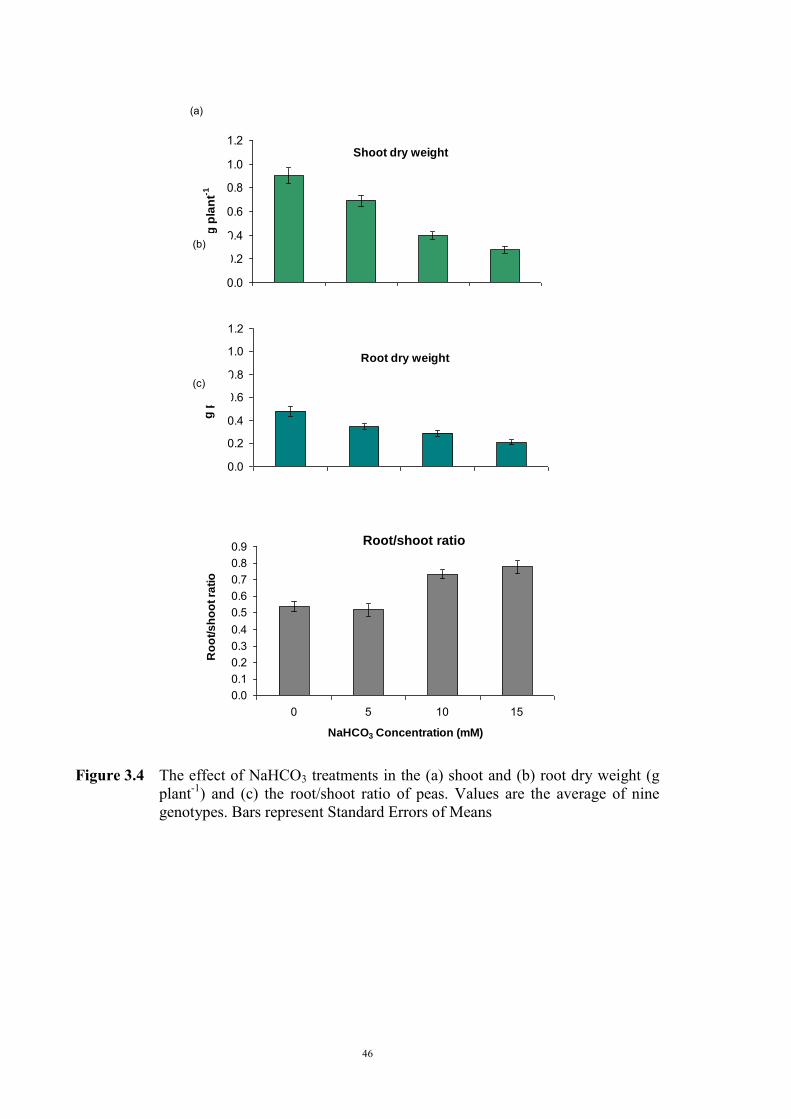
46
Figure 3.4 The effect of NaHCO3 treatments in the (a) shoot and (b) root dry weight (g
plant-1) and (c) the root/shoot ratio of peas. Values are the average of nine genotypes. Bars represent Standard Errors of Means
Shoot dry weight
0.0
0.2
0.4
0.6
0.8
1.0
1.2
g p
lan
t-1
Root dry weight
0.0
0.2
0.4
0.6
0.8
1.0
1.2
g p
lan
t-1
0.00.10.20.30.40.50.60.70.80.9
0 5 10 15
NaHCO3 Concentration (mM)
Ro
ot/
sh
oo
t ra
tio
Root/shoot ratio
(b)
(c)
(a)
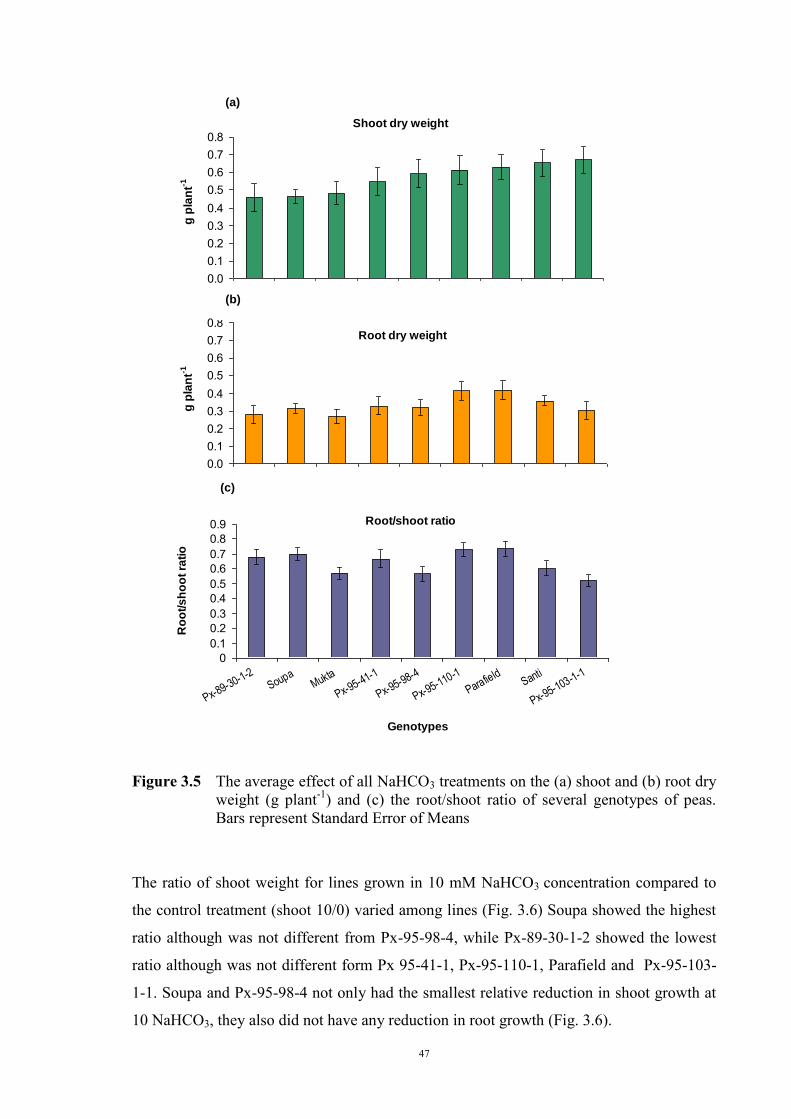
47
Figure 3.5 The average effect of all NaHCO3 treatments on the (a) shoot and (b) root dry
weight (g plant-1) and (c) the root/shoot ratio of several genotypes of peas. Bars represent Standard Error of Means
The ratio of shoot weight for lines grown in 10 mM NaHCO3 concentration compared to
the control treatment (shoot 10/0) varied among lines (Fig. 3.6) Soupa showed the highest
ratio although was not different from Px-95-98-4, while Px-89-30-1-2 showed the lowest
ratio although was not different form Px 95-41-1, Px-95-110-1, Parafield and Px-95-103-
1-1. Soupa and Px-95-98-4 not only had the smallest relative reduction in shoot growth at
10 NaHCO3, they also did not have any reduction in root growth (Fig. 3.6).
Shoot dry weight
0.00.10.20.30.40.50.60.70.8
g p
lan
t-1
Root dry weight
0.00.10.20.30.40.50.60.70.8
g p
lan
t-1
Root/shoot ratio
00.10.20.30.40.50.60.70.80.9
Px-89-30-1-2
SoupaMukta
Px-95-41-1
Px-95-98-4
Px-95-110-1
ParafieldSanti
Px-95-103-1-1
Genotypes
Ro
ot/
sh
oo
t ra
tio
(a)
(b)
(c)
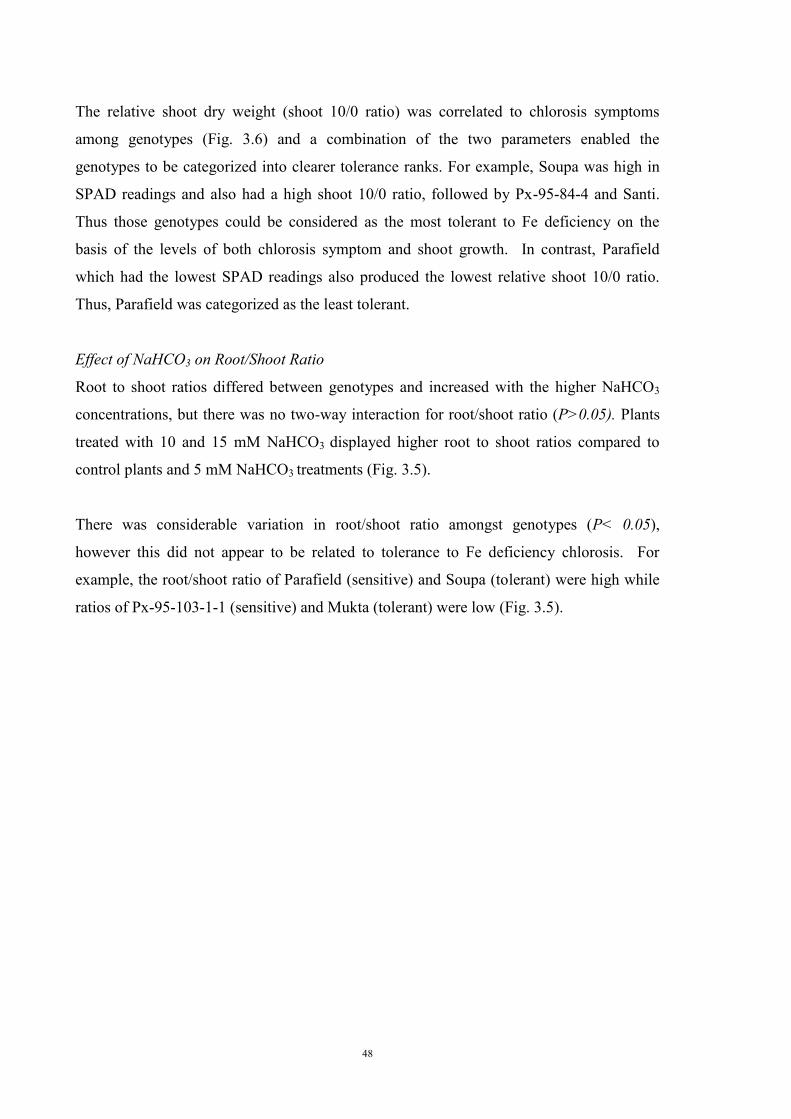
48
The relative shoot dry weight (shoot 10/0 ratio) was correlated to chlorosis symptoms
among genotypes (Fig. 3.6) and a combination of the two parameters enabled the
genotypes to be categorized into clearer tolerance ranks. For example, Soupa was high in
SPAD readings and also had a high shoot 10/0 ratio, followed by Px-95-84-4 and Santi.
Thus those genotypes could be considered as the most tolerant to Fe deficiency on the
basis of the levels of both chlorosis symptom and shoot growth. In contrast, Parafield
which had the lowest SPAD readings also produced the lowest relative shoot 10/0 ratio.
Thus, Parafield was categorized as the least tolerant.
Effect of NaHCO3 on Root/Shoot Ratio
Root to shoot ratios differed between genotypes and increased with the higher NaHCO3
concentrations, but there was no two-way interaction for root/shoot ratio (P>0.05). Plants
treated with 10 and 15 mM NaHCO3 displayed higher root to shoot ratios compared to
control plants and 5 mM NaHCO3 treatments (Fig. 3.5).
There was considerable variation in root/shoot ratio amongst genotypes (P< 0.05),
however this did not appear to be related to tolerance to Fe deficiency chlorosis. For
example, the root/shoot ratio of Parafield (sensitive) and Soupa (tolerant) were high while
ratios of Px-95-103-1-1 (sensitive) and Mukta (tolerant) were low (Fig. 3.5).
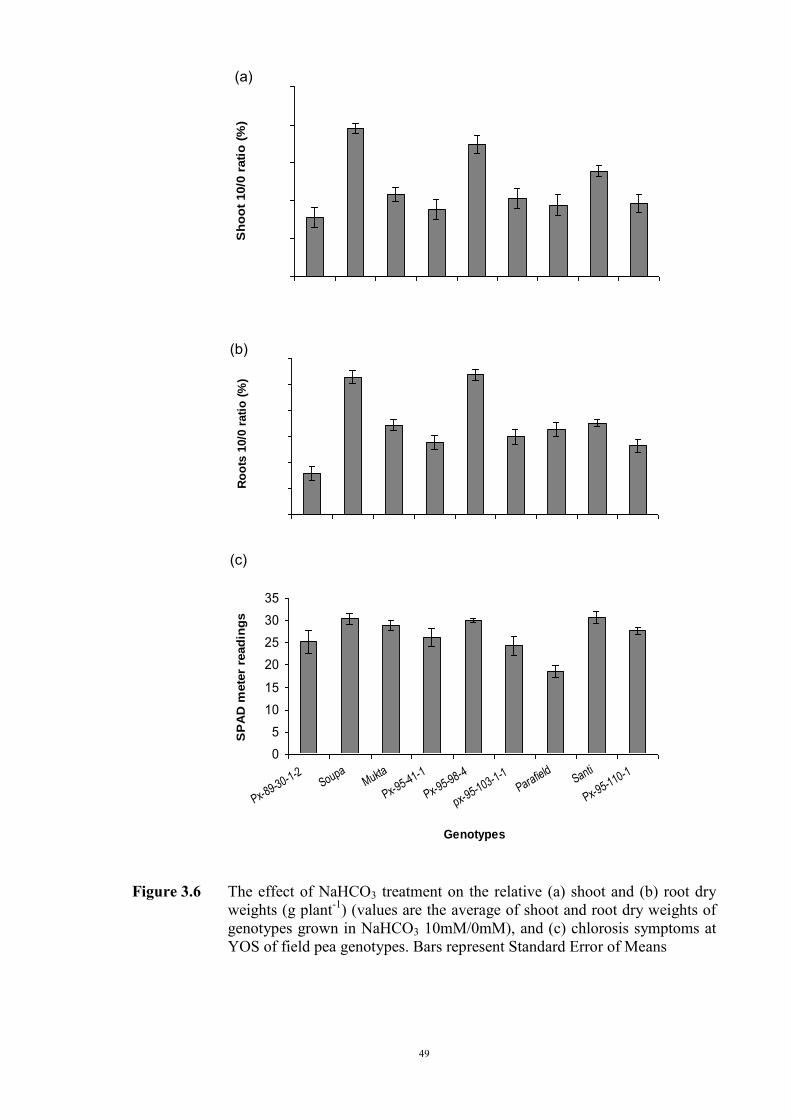
49
Figure 3.6 The effect of NaHCO3 treatment on the relative (a) shoot and (b) root dry
weights (g plant-1) (values are the average of shoot and root dry weights of genotypes grown in NaHCO3 10mM/0mM), and (c) chlorosis symptoms at YOS of field pea genotypes. Bars represent Standard Error of Means
Ro
ots
10/0
rati
o (
%)
05
1015
20253035
Px-89-30-1-2
SoupaMukta
Px-95-41-1
Px-95-98-4
px-95-103-1-1
ParafieldSanti
Px-95-110-1
Genotypes
SP
AD
mete
r re
ad
ing
s
Sh
oo
t 10/0
rati
o (
%)
(a)
(b)
(c)
50
3.2.4 Experiment 1.2. The effect of KHCO3 on Fe deficiency chlorosis symptoms of field peas
3.2.4.1 Introduction
The previous experiment demonstrated significant variation in response to Fe deficiency
chlorosis among a limited number of pea genotypes. An additional experiment was
undertaken to investigate the range of variation among a greater number of Australian
breeding lines and varieties, and to identify suitable lines to use for genetic and
physiological studies into Fe deficiency chlorosis, described in Chapters 4, 5 and 6.
In Experiment 1.1, a significant level of necrosis was observed on lower leaves of some
plants in the 15 mM NaHCO3 treatment and one possible explanation for this was Na
toxicity. An alternative source of bicarbonate, such as MgHCO3 (Norvell and Adams,
2006) and KHCO3 has been used in other investigations of Fe deficiency in soybeans and
rough-seeded lupins (Brand, 1999), maize (Çelik et al., 2010), and lime (Çelik and Katkat,
2007) . KHCO3 was included in the present experiment to determine if it also induced Fe
deficiency chlorosis but not necrosis in field peas and could therefore be used as an
alternative to NaHCO3.
Santi, which was the most tolerant semi-leafless type and Parafield representing the most
sensitive conventional leaf type, were included in this test as control genotypes. To avoid
development of necrotic symptoms, the initial screening of 37 genotypes utilised 10 mM
rather than 15 mM NaHCO3, as chlorosis symptoms did not differ significantly between
the two treatments in the previous experiment.
The aims of this experiment were: (1) to select genotypes that are suitable for investigations into genetic and physiological
control of tolerance to Fe deficiency chlorosis
(2) to compare the effects of KHCO3 and NaHCO3 on inducing Fe deficiency chlorosis in
peas.
(3) to determine a suitable KHCO3 concentration to develop a screening method for
selection of tolerant genotypes
51
3.2.4.2 Selecting sample genotypes
The aim of this experiment was to select the appropriate genotypes for the following
experiment which was an investigation of the effect of KHCO3 treatment in inducing Fe
deficiency chlorosis. A number of genotypes was screening in NaHCO3 to identify
genotypes that spanned the range in response to NaHCO3 and to subsequently compare in
KHCO3
3.2.4.2.1 Materials and Methods
37 lines (Table 3.1) were provided by the SARDI field pea breeding program and were
screened in 10 mM NaHCO3. The procedure used was the same as Experiment 1.1. The
experiment was set up as a randomised complete block design with four replications (four
separate containers). The degree of chlorotic symptoms of stipules was rated 28 d after
transplanting using a SPAD-502 meter.
A sub-sample of the seeds used to sow this experiment was obtained for several genotypes
which showed high, moderate, and low SPAD readings. The seed was analysed by ICP-
OES to determine the concentration of total Fe and thus identify if reserves of seed Fe
affected expression of chlorosis.
3.2.4.2.2 Results
There was significant variation in Fe deficiency tolerance amongst the 37 lines (Fig 3.7)
and solution culture containing 10 mM NaHCO3 induced chlorotic symptoms on a number
of lines. The response of several genotypes which were included in both this test and the
previous experiment were consistent between experiments. Santi and Soupa were among
the most tolerant genotypes, while Parafield developed severe chlorosis (Fig. 3.7).
Eight lines were selected as representative genotypes for further experiments and genetic
studies. The main criteria for selection included: a) the homogeneity of the lines, both with
chlorosis having a small standard deviation and the morphological features of plants
showing the same leaf and growth types and avoiding mixed populations, b) the response
of the lines to the treatment, with lines representing tolerant and sensitive types being
included, and c) the number of samples that could be accommodated in the growth
chamber.
Santi, which is a homogenous semi-leafless type, was tolerant in both screening
experiments; therefore it was selected as a control tolerant genotype. On the other hand,
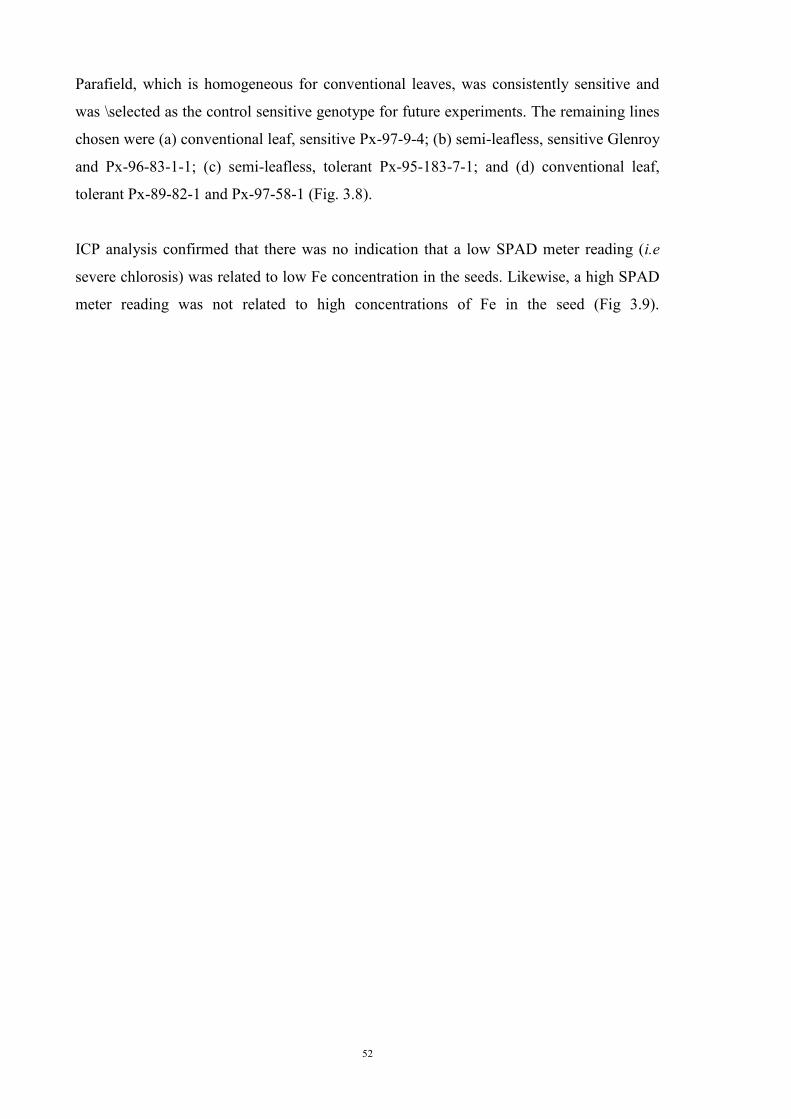
52
Parafield, which is homogeneous for conventional leaves, was consistently sensitive and
was \selected as the control sensitive genotype for future experiments. The remaining lines
chosen were (a) conventional leaf, sensitive Px-97-9-4; (b) semi-leafless, sensitive Glenroy
and Px-96-83-1-1; (c) semi-leafless, tolerant Px-95-183-7-1; and (d) conventional leaf,
tolerant Px-89-82-1 and Px-97-58-1 (Fig. 3.8).
ICP analysis confirmed that there was no indication that a low SPAD meter reading (i.e
severe chlorosis) was related to low Fe concentration in the seeds. Likewise, a high SPAD
meter reading was not related to high concentrations of Fe in the seed (Fig 3.9).
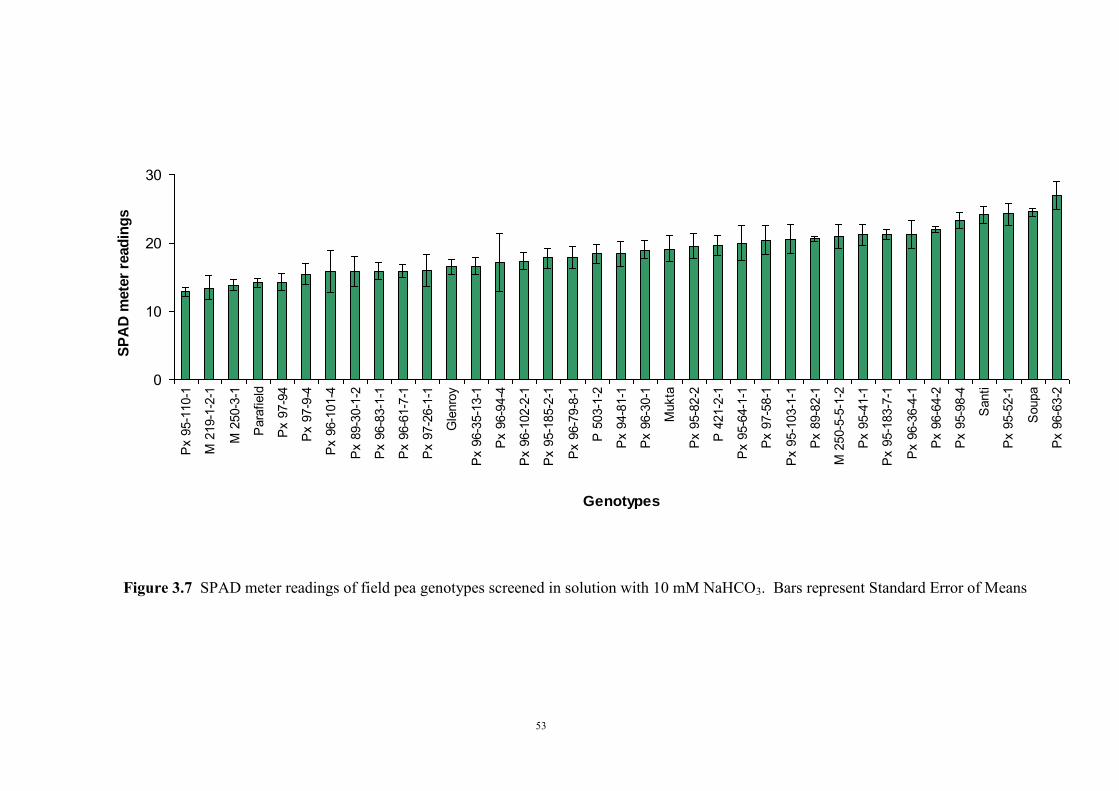
53
Figure 3.7 SPAD meter readings of field pea genotypes screened in solution with 10 mM NaHCO3. Bars represent Standard Error of Means
0
10
20
30P
x 95
-110
-1
M 2
19-1
-2-1
M 2
50-3
-1
Par
afie
ld
Px
97-9
4
Px
97-9
-4
Px
96-1
01-4
Px
89-3
0-1-
2
Px
96-8
3-1-
1
Px
96-6
1-7-
1
Px
97-2
6-1-
1
Gle
nroy
Px
96-3
5-13
-1
Px
96-9
4-4
Px
96-1
02-2
-1
Px
95-1
85-2
-1
Px
96-7
9-8-
1
P 5
03-1
-2
Px
94-8
1-1
Px
96-3
0-1
Muk
ta
Px
95-8
2-2
P 4
21-2
-1
Px
95-6
4-1-
1
Px
97-5
8-1
Px
95-1
03-1
-1
Px
89-8
2-1
M 2
50-5
-5-1
-2
Px
95-4
1-1
Px
95-1
83-7
-1
Px
96-3
6-4-
1
Px
96-6
4-2
Px
95-9
8-4
San
ti
Px
95-5
2-1
Sou
pa
Px
96-6
3-2
Genotypes
SP
AD
mete
r re
ad
ing
s
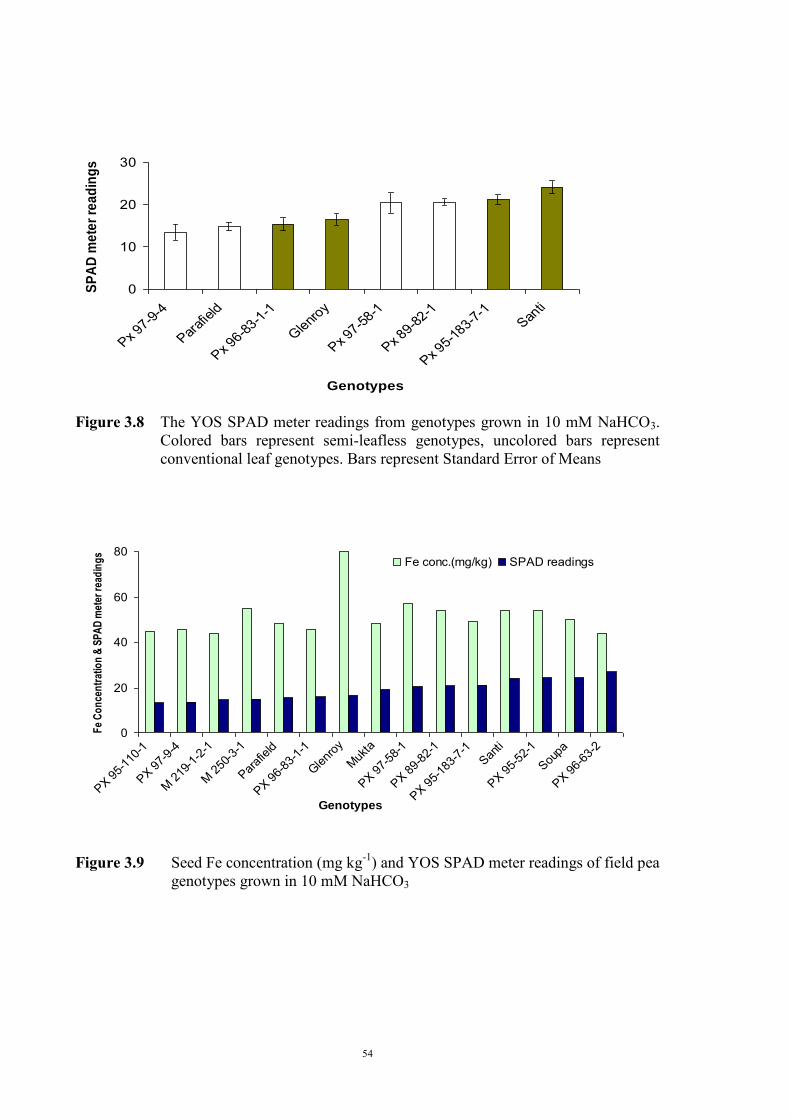
54
0
10
20
30
Px 97-9-
4
Parafie
ld
Px 96-83
-1-1
Glenroy
Px 97-58
-1
Px 89-82
-1
Px 95-18
3-7-1
Santi
Genotypes
SP
AD
me
ter
rea
din
gs
Figure 3.8 The YOS SPAD meter readings from genotypes grown in 10 mM NaHCO3.
Colored bars represent semi-leafless genotypes, uncolored bars represent conventional leaf genotypes. Bars represent Standard Error of Means
Figure 3.9 Seed Fe concentration (mg kg-1) and YOS SPAD meter readings of field pea
genotypes grown in 10 mM NaHCO3
0
20
40
60
80
PX 95-11
0-1
PX 97-9-
4
M 219-1
-2-1
M 250-3
-1
Parafie
ld
PX 96-83
-1-1
Glenroy
Mukta
PX 97-58
-1
PX 89-82
-1
PX 95-18
3-7-1
Santi
PX 95-52
-1Sou
pa
PX 96-63
-2
Genotypes
Fe
Co
nce
ntr
atio
n &
SP
AD
met
er r
ead
ing
s
Fe conc.(mg/kg) SPAD readings
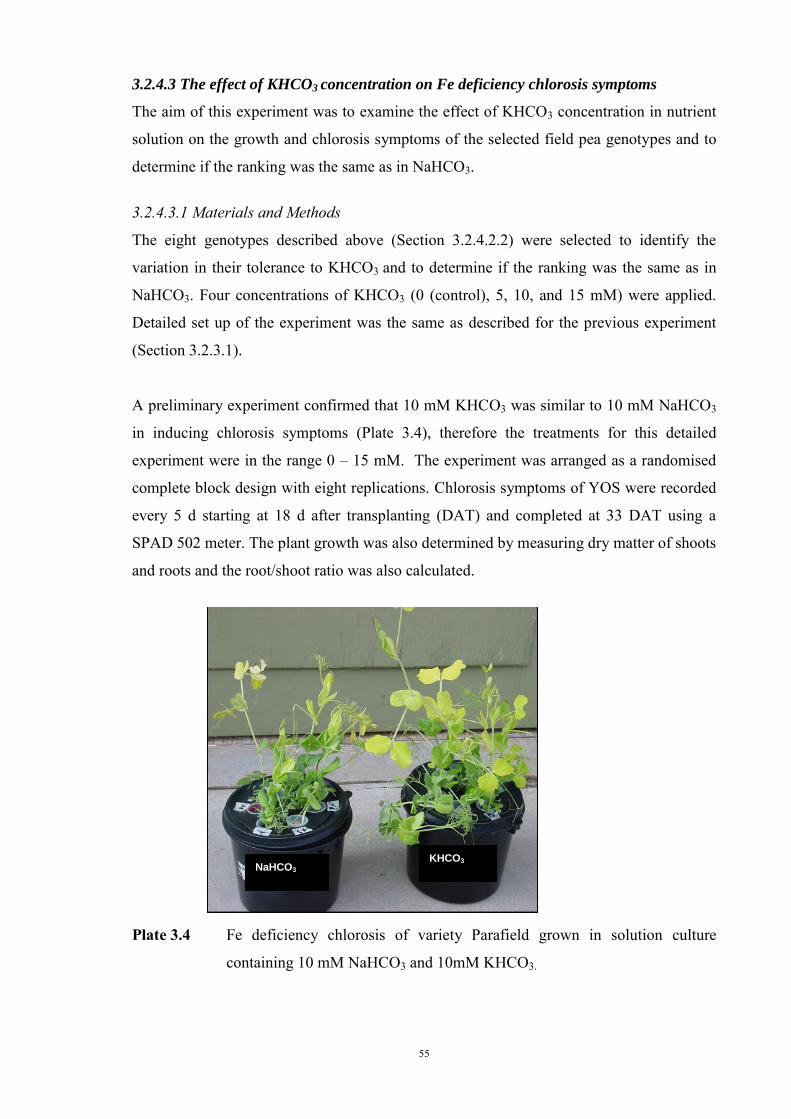
55
3.2.4.3 The effect of KHCO3 concentration on Fe deficiency chlorosis symptoms
The aim of this experiment was to examine the effect of KHCO3 concentration in nutrient
solution on the growth and chlorosis symptoms of the selected field pea genotypes and to
determine if the ranking was the same as in NaHCO3.
3.2.4.3.1 Materials and Methods
The eight genotypes described above (Section 3.2.4.2.2) were selected to identify the
variation in their tolerance to KHCO3 and to determine if the ranking was the same as in
NaHCO3. Four concentrations of KHCO3 (0 (control), 5, 10, and 15 mM) were applied.
Detailed set up of the experiment was the same as described for the previous experiment
(Section 3.2.3.1).
A preliminary experiment confirmed that 10 mM KHCO3 was similar to 10 mM NaHCO3
in inducing chlorosis symptoms (Plate 3.4), therefore the treatments for this detailed
experiment were in the range 0 – 15 mM. The experiment was arranged as a randomised
complete block design with eight replications. Chlorosis symptoms of YOS were recorded
every 5 d starting at 18 d after transplanting (DAT) and completed at 33 DAT using a
SPAD 502 meter. The plant growth was also determined by measuring dry matter of shoots
and roots and the root/shoot ratio was also calculated.
Plate 3.4 Fe deficiency chlorosis of variety Parafield grown in solution culture
containing 10 mM NaHCO3 and 10mM KHCO3.
NaHCO3 KHCO3
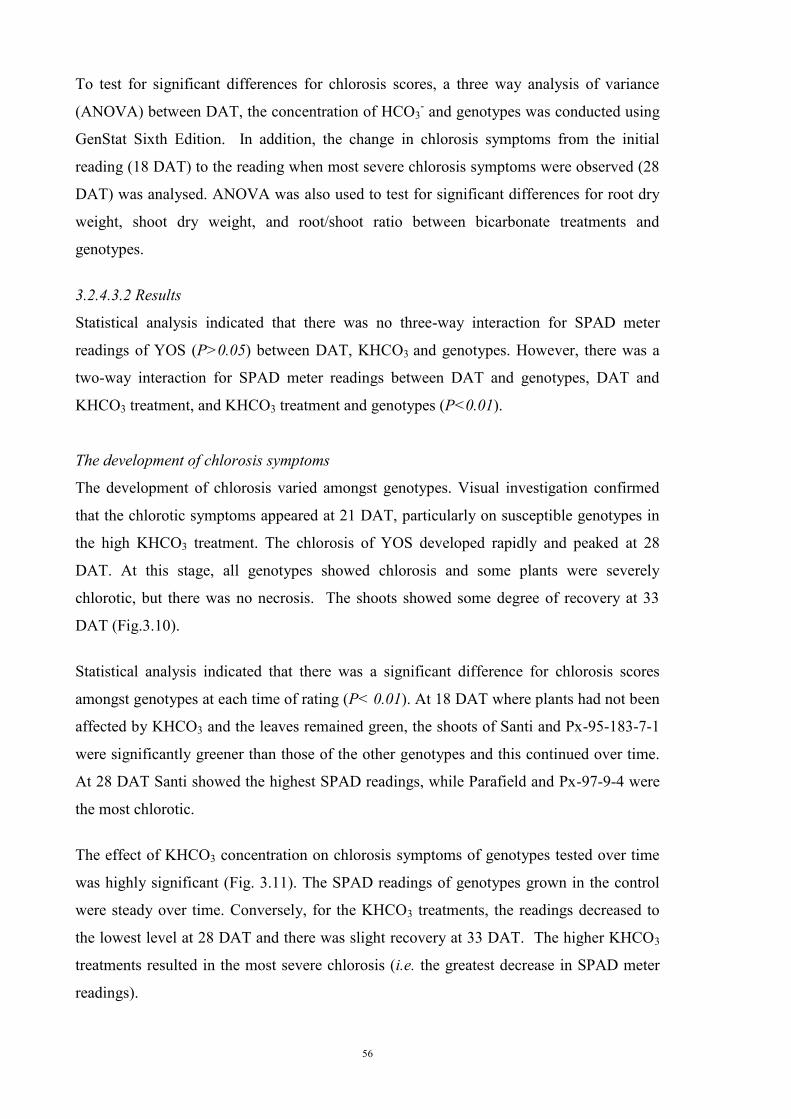
56
To test for significant differences for chlorosis scores, a three way analysis of variance
(ANOVA) between DAT, the concentration of HCO3- and genotypes was conducted using
GenStat Sixth Edition. In addition, the change in chlorosis symptoms from the initial
reading (18 DAT) to the reading when most severe chlorosis symptoms were observed (28
DAT) was analysed. ANOVA was also used to test for significant differences for root dry
weight, shoot dry weight, and root/shoot ratio between bicarbonate treatments and
genotypes.
3.2.4.3.2 Results
Statistical analysis indicated that there was no three-way interaction for SPAD meter
readings of YOS (P>0.05) between DAT, KHCO3 and genotypes. However, there was a
two-way interaction for SPAD meter readings between DAT and genotypes, DAT and
KHCO3 treatment, and KHCO3 treatment and genotypes (P<0.01).
The development of chlorosis symptoms
The development of chlorosis varied amongst genotypes. Visual investigation confirmed
that the chlorotic symptoms appeared at 21 DAT, particularly on susceptible genotypes in
the high KHCO3 treatment. The chlorosis of YOS developed rapidly and peaked at 28
DAT. At this stage, all genotypes showed chlorosis and some plants were severely
chlorotic, but there was no necrosis. The shoots showed some degree of recovery at 33
DAT (Fig.3.10).
Statistical analysis indicated that there was a significant difference for chlorosis scores
amongst genotypes at each time of rating (P< 0.01). At 18 DAT where plants had not been
affected by KHCO3 and the leaves remained green, the shoots of Santi and Px-95-183-7-1
were significantly greener than those of the other genotypes and this continued over time.
At 28 DAT Santi showed the highest SPAD readings, while Parafield and Px-97-9-4 were
the most chlorotic.
The effect of KHCO3 concentration on chlorosis symptoms of genotypes tested over time
was highly significant (Fig. 3.11). The SPAD readings of genotypes grown in the control
were steady over time. Conversely, for the KHCO3 treatments, the readings decreased to
the lowest level at 28 DAT and there was slight recovery at 33 DAT. The higher KHCO3
treatments resulted in the most severe chlorosis (i.e. the greatest decrease in SPAD meter
readings).
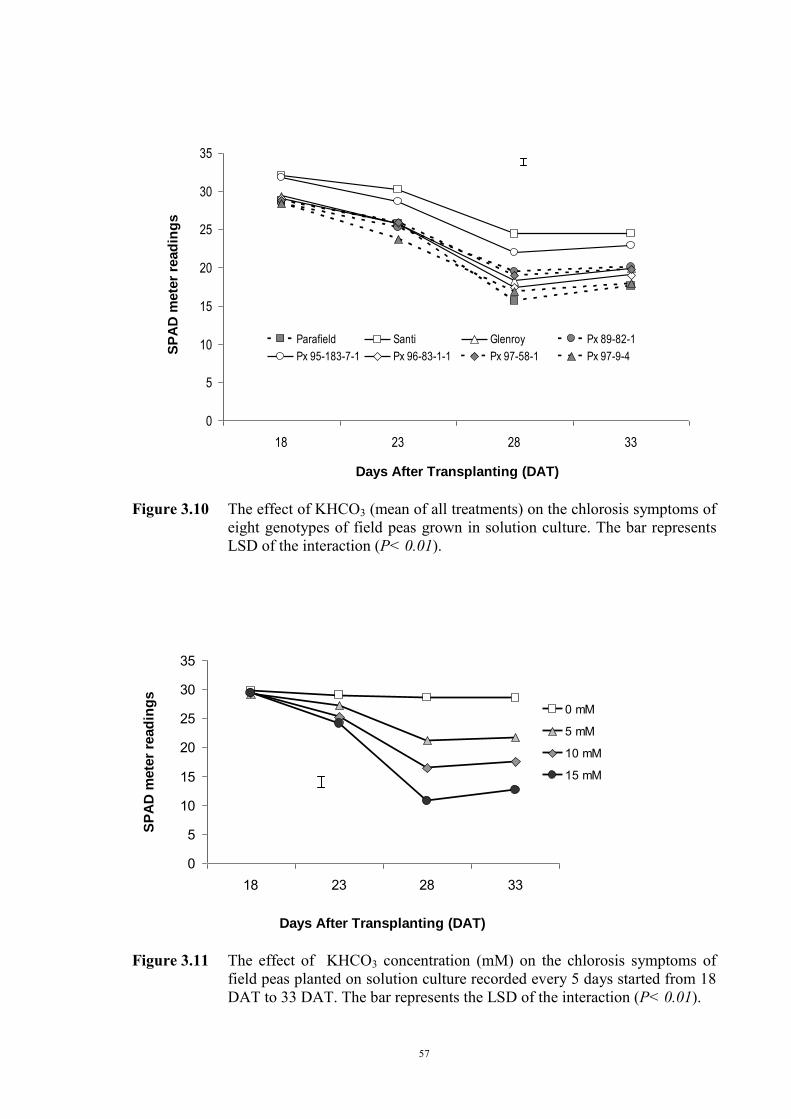
57
Figure 3.10 The effect of KHCO3 (mean of all treatments) on the chlorosis symptoms of
eight genotypes of field peas grown in solution culture. The bar represents LSD of the interaction (P< 0.01).
0
5
10
15
20
25
30
35
18 23 28 33
Days After Transplanting (DAT)
SP
AD
mete
r re
ad
ing
s
0 mM
5 mM
10 mM
15 mM
Figure 3.11 The effect of KHCO3 concentration (mM) on the chlorosis symptoms of
field peas planted on solution culture recorded every 5 days started from 18 DAT to 33 DAT. The bar represents the LSD of the interaction (P< 0.01).
0
5
10
15
20
25
30
35
18 23 28 33
Days After Transplanting (DAT)
SP
AD
mete
r re
ad
ing
s
Parafield Santi Glenroy Px 89-82-1
Px 95-183-7-1 Px 96-83-1-1 Px 97-58-1 Px 97-9-4
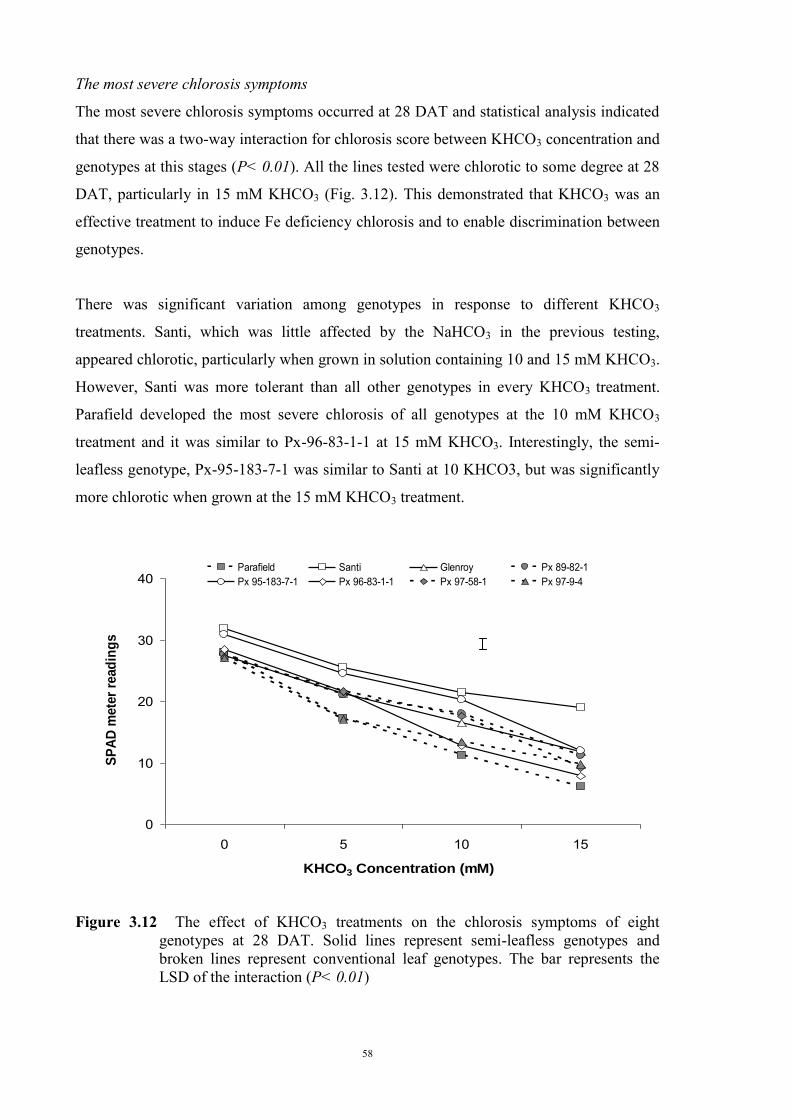
58
The most severe chlorosis symptoms
The most severe chlorosis symptoms occurred at 28 DAT and statistical analysis indicated
that there was a two-way interaction for chlorosis score between KHCO3 concentration and
genotypes at this stages (P< 0.01). All the lines tested were chlorotic to some degree at 28
DAT, particularly in 15 mM KHCO3 (Fig. 3.12). This demonstrated that KHCO3 was an
effective treatment to induce Fe deficiency chlorosis and to enable discrimination between
genotypes.
There was significant variation among genotypes in response to different KHCO3
treatments. Santi, which was little affected by the NaHCO3 in the previous testing,
appeared chlorotic, particularly when grown in solution containing 10 and 15 mM KHCO3.
However, Santi was more tolerant than all other genotypes in every KHCO3 treatment.
Parafield developed the most severe chlorosis of all genotypes at the 10 mM KHCO3
treatment and it was similar to Px-96-83-1-1 at 15 mM KHCO3. Interestingly, the semi-
leafless genotype, Px-95-183-7-1 was similar to Santi at 10 KHCO3, but was significantly
more chlorotic when grown at the 15 mM KHCO3 treatment.
0
10
20
30
40
0 5 10 15
KHCO3 Concentration (mM)
SP
AD
mete
r re
ad
ing
s
Parafield Santi Glenroy Px 89-82-1
Px 95-183-7-1 Px 96-83-1-1 Px 97-58-1 Px 97-9-4
Figure 3.12 The effect of KHCO3 treatments on the chlorosis symptoms of eight
genotypes at 28 DAT. Solid lines represent semi-leafless genotypes and broken lines represent conventional leaf genotypes. The bar represents the LSD of the interaction (P< 0.01)
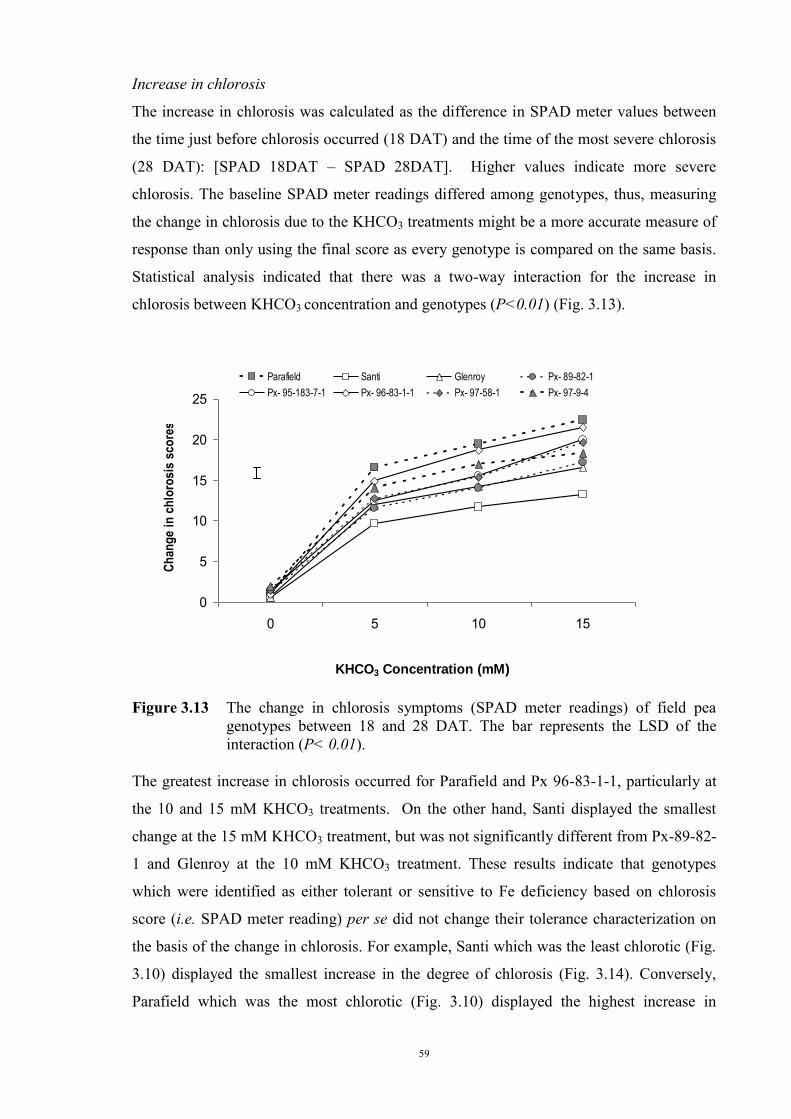
59
Increase in chlorosis
The increase in chlorosis was calculated as the difference in SPAD meter values between
the time just before chlorosis occurred (18 DAT) and the time of the most severe chlorosis
(28 DAT): [SPAD 18DAT – SPAD 28DAT]. Higher values indicate more severe
chlorosis. The baseline SPAD meter readings differed among genotypes, thus, measuring
the change in chlorosis due to the KHCO3 treatments might be a more accurate measure of
response than only using the final score as every genotype is compared on the same basis.
Statistical analysis indicated that there was a two-way interaction for the increase in
chlorosis between KHCO3 concentration and genotypes (P<0.01) (Fig. 3.13).
0
5
10
15
20
25
0 5 10 15
KHCO3 Concentration (mM)
Ch
an
ge i
n c
hlo
rosis
sco
res
Parafield Santi Glenroy Px- 89-82-1
Px- 95-183-7-1 Px- 96-83-1-1 Px- 97-58-1 Px- 97-9-4
Figure 3.13 The change in chlorosis symptoms (SPAD meter readings) of field pea
genotypes between 18 and 28 DAT. The bar represents the LSD of the interaction (P< 0.01).
The greatest increase in chlorosis occurred for Parafield and Px 96-83-1-1, particularly at
the 10 and 15 mM KHCO3 treatments. On the other hand, Santi displayed the smallest
change at the 15 mM KHCO3 treatment, but was not significantly different from Px-89-82-
1 and Glenroy at the 10 mM KHCO3 treatment. These results indicate that genotypes
which were identified as either tolerant or sensitive to Fe deficiency based on chlorosis
score (i.e. SPAD meter reading) per se did not change their tolerance characterization on
the basis of the change in chlorosis. For example, Santi which was the least chlorotic (Fig.
3.10) displayed the smallest increase in the degree of chlorosis (Fig. 3.14). Conversely,
Parafield which was the most chlorotic (Fig. 3.10) displayed the highest increase in
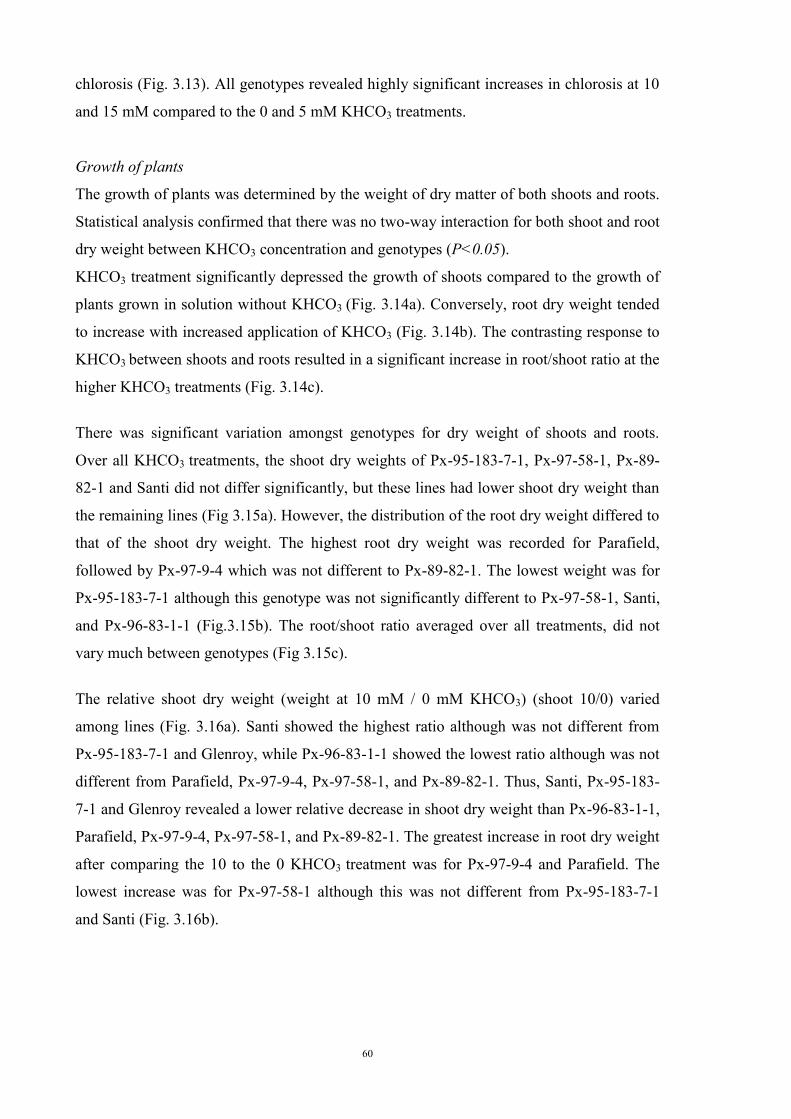
60
chlorosis (Fig. 3.13). All genotypes revealed highly significant increases in chlorosis at 10
and 15 mM compared to the 0 and 5 mM KHCO3 treatments.
Growth of plants
The growth of plants was determined by the weight of dry matter of both shoots and roots.
Statistical analysis confirmed that there was no two-way interaction for both shoot and root
dry weight between KHCO3 concentration and genotypes (P<0.05).
KHCO3 treatment significantly depressed the growth of shoots compared to the growth of
plants grown in solution without KHCO3 (Fig. 3.14a). Conversely, root dry weight tended
to increase with increased application of KHCO3 (Fig. 3.14b). The contrasting response to
KHCO3 between shoots and roots resulted in a significant increase in root/shoot ratio at the
higher KHCO3 treatments (Fig. 3.14c).
There was significant variation amongst genotypes for dry weight of shoots and roots.
Over all KHCO3 treatments, the shoot dry weights of Px-95-183-7-1, Px-97-58-1, Px-89-
82-1 and Santi did not differ significantly, but these lines had lower shoot dry weight than
the remaining lines (Fig 3.15a). However, the distribution of the root dry weight differed to
that of the shoot dry weight. The highest root dry weight was recorded for Parafield,
followed by Px-97-9-4 which was not different to Px-89-82-1. The lowest weight was for
Px-95-183-7-1 although this genotype was not significantly different to Px-97-58-1, Santi,
and Px-96-83-1-1 (Fig.3.15b). The root/shoot ratio averaged over all treatments, did not
vary much between genotypes (Fig 3.15c).
The relative shoot dry weight (weight at 10 mM / 0 mM KHCO3) (shoot 10/0) varied
among lines (Fig. 3.16a). Santi showed the highest ratio although was not different from
Px-95-183-7-1 and Glenroy, while Px-96-83-1-1 showed the lowest ratio although was not
different from Parafield, Px-97-9-4, Px-97-58-1, and Px-89-82-1. Thus, Santi, Px-95-183-
7-1 and Glenroy revealed a lower relative decrease in shoot dry weight than Px-96-83-1-1,
Parafield, Px-97-9-4, Px-97-58-1, and Px-89-82-1. The greatest increase in root dry weight
after comparing the 10 to the 0 KHCO3 treatment was for Px-97-9-4 and Parafield. The
lowest increase was for Px-97-58-1 although this was not different from Px-95-183-7-1
and Santi (Fig. 3.16b).
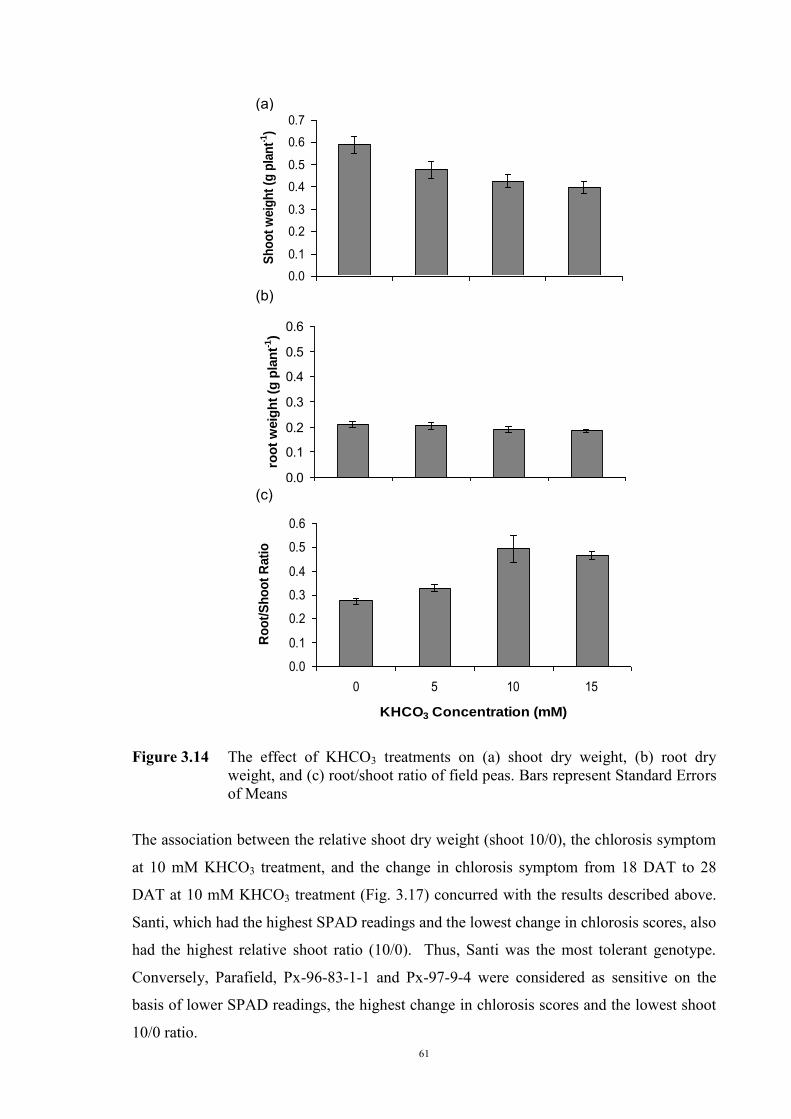
61
Figure 3.14 The effect of KHCO3 treatments on (a) shoot dry weight, (b) root dry
weight, and (c) root/shoot ratio of field peas. Bars represent Standard Errors of Means
The association between the relative shoot dry weight (shoot 10/0), the chlorosis symptom
at 10 mM KHCO3 treatment, and the change in chlorosis symptom from 18 DAT to 28
DAT at 10 mM KHCO3 treatment (Fig. 3.17) concurred with the results described above.
Santi, which had the highest SPAD readings and the lowest change in chlorosis scores, also
had the highest relative shoot ratio (10/0). Thus, Santi was the most tolerant genotype.
Conversely, Parafield, Px-96-83-1-1 and Px-97-9-4 were considered as sensitive on the
basis of lower SPAD readings, the highest change in chlorosis scores and the lowest shoot
10/0 ratio.
0.0
0.1
0.2
0.3
0.4
0.5
0.6
0.7
Sh
oo
t w
eig
ht
(g p
lan
t-1)
0.0
0.1
0.2
0.3
0.4
0.5
0.6
roo
t w
eig
ht
(g p
lan
t-1)
0.0
0.1
0.2
0.3
0.4
0.5
0.6
0 5 10 15
KHCO3 Concentration (mM)
Ro
ot/
Sh
oo
t R
ati
o
(a)
(b)
(c)
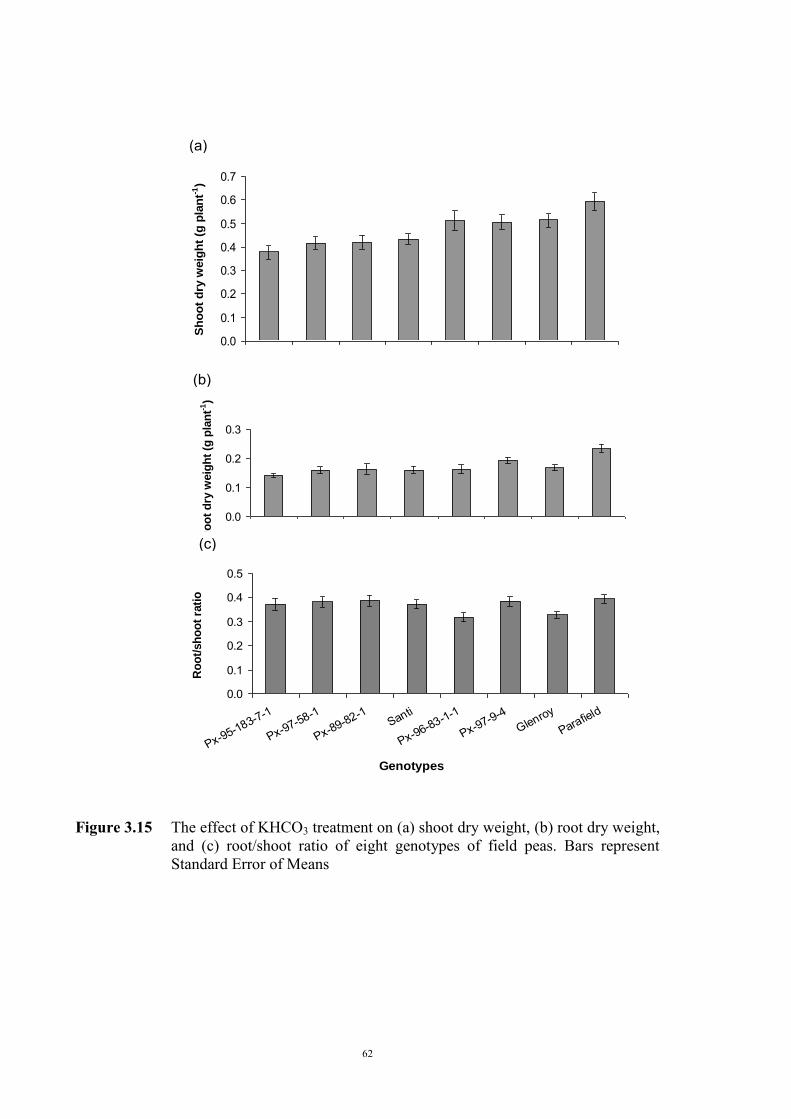
62
Figure 3.15 The effect of KHCO3 treatment on (a) shoot dry weight, (b) root dry weight,
and (c) root/shoot ratio of eight genotypes of field peas. Bars represent Standard Error of Means
(a)
0.0
0.1
0.2
0.3
0.4
0.5
0.6
0.7
Sh
oo
t d
ry w
eig
ht
(g p
lan
t-1)
0.0
0.1
0.2
0.3
Ro
ot
dry
weig
ht
(g p
lan
t-1)
0.0
0.1
0.2
0.3
0.4
0.5
Px-95-183-7-1
Px-97-58-1
Px-89-82-1Santi
Px-96-83-1-1
Px-97-9-4Glenroy
Parafield
Genotypes
Ro
ot/
sh
oo
t ra
tio
(b)
(c)
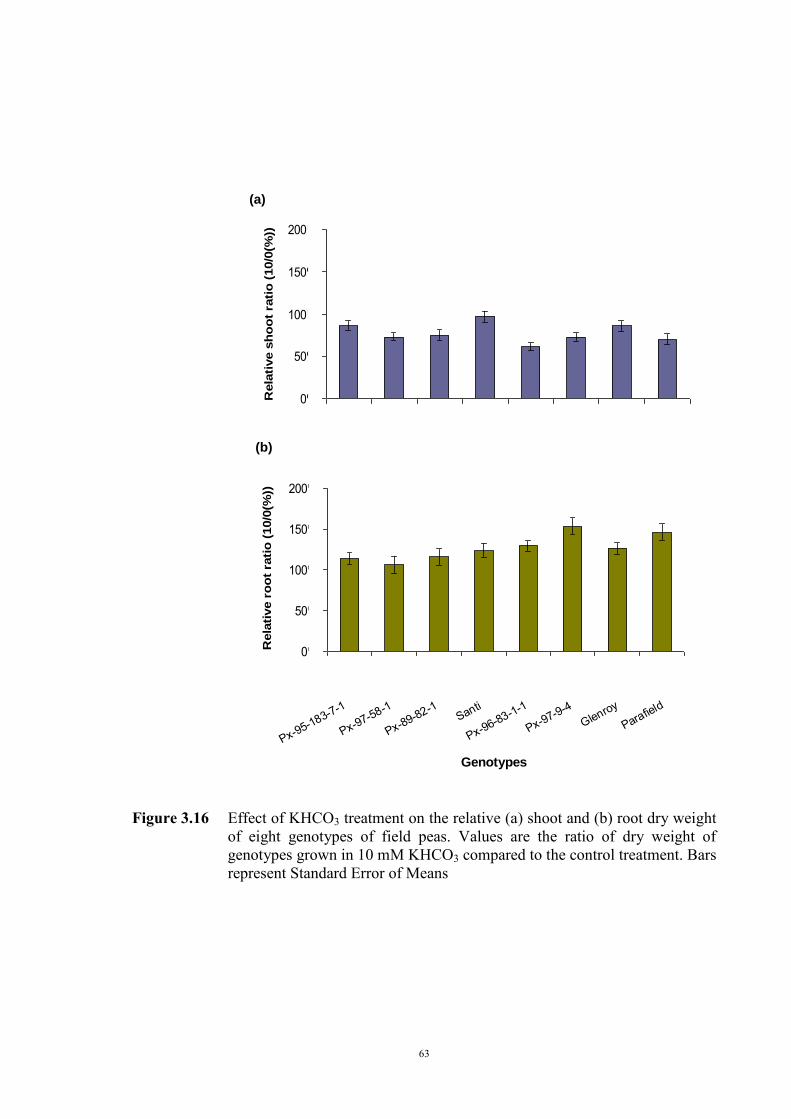
63
Figure 3.16 Effect of KHCO3 treatment on the relative (a) shoot and (b) root dry weight
of eight genotypes of field peas. Values are the ratio of dry weight of genotypes grown in 10 mM KHCO3 compared to the control treatment. Bars represent Standard Error of Means
0%
50%
100%
150%
200%
Rela
tive s
ho
ot
rati
o (
10/0
(%))
Root/shoot ratio
0.0
0.5
1.0
1.5
2.0
2.5
Px-95-183-7-1
Px-97-58-1
Px-89-82-1Santi
Px-96-83-1-1
Px-97-9-4Glenroy
Parafield
Genotypes
Ro
ot/
sh
oo
t ra
tio
0%
50%
100%
150%
200%
Rela
tive r
oo
t ra
tio
(10/0
(%))
(b)
(a)
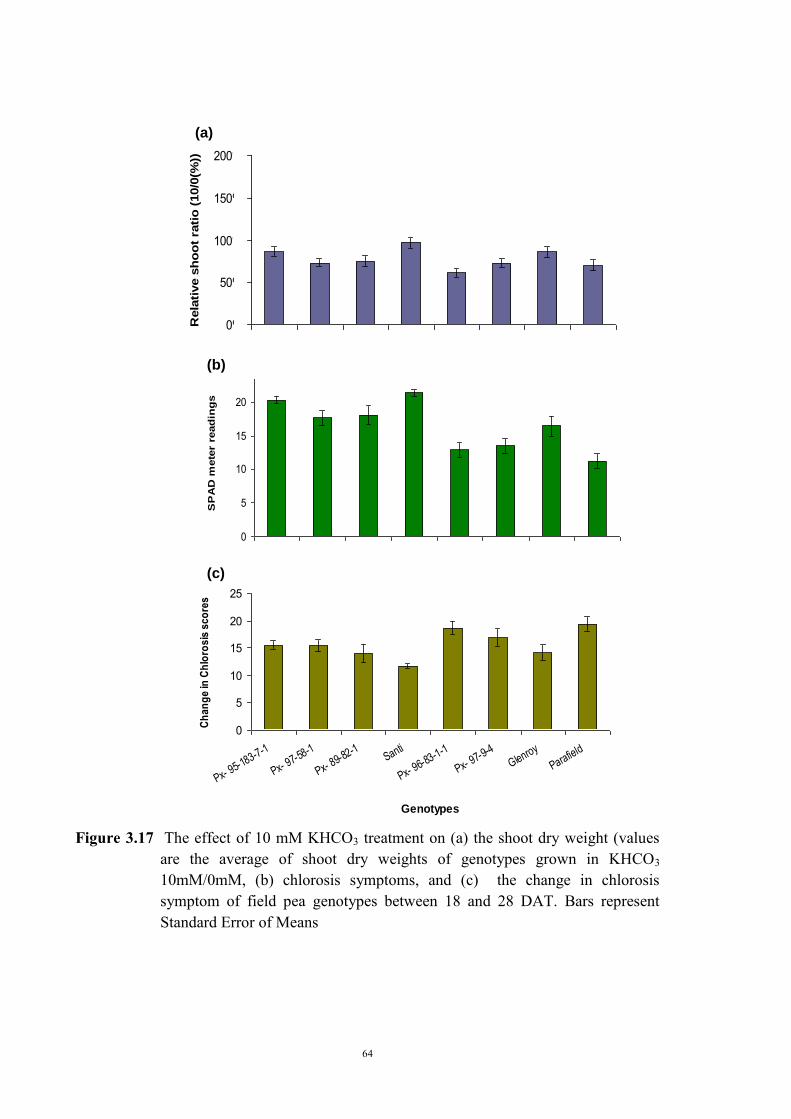
64
Figure 3.17 The effect of 10 mM KHCO3 treatment on (a) the shoot dry weight (values are the average of shoot dry weights of genotypes grown in KHCO3 10mM/0mM, (b) chlorosis symptoms, and (c) the change in chlorosis symptom of field pea genotypes between 18 and 28 DAT. Bars represent Standard Error of Means
0
5
10
15
20
25
SP
AD
mete
r re
ad
ing
s
0
5
10
15
20
25
Px- 95-1
83-7-1
Px- 97-5
8-1
Px- 89-8
2-1Santi
Px- 96-8
3-1-1
Px- 97-9
-4
Glenroy
Parafield
Genotypes
Ch
an
ge
in C
hlo
ros
is s
co
res
0%
50%
100%
150%
200%
Rela
tive s
ho
ot
rati
o (
10/0
(%))
(a)
(b)
(c)
65
3.3 Development of a soil screening method to identify peas tolerant to Fe
deficiency (Experiment 2)
3.3.1 Introduction
In Section 3.2, a solution culture procedure for screening was developed and was
successful in discriminating between genotypes that covered a wide range of tolerance to
Fe deficiency. An additional experiment was undertaken to compare results in solution
culture with plants grown in a soil in which symptoms indicative of Fe deficiency had
previously been observed. Although much progress has been made with nutrient solution
culture and this method seems reliable, the method may be limited in application due to the
high cost of materials and labour and requirement for regular changing of solutions.
A soil based pot screening method has been developed to screen soybean cultivars for
differences in Fe deficiency chlorosis using appropriate combinations of HCO3-, a high soil
moisture regime (above field capacity) and low temperature (Coulombe et al., 1984;
Fairbanks et al., 1987). There was a significant correlation for chlorosis scores of soybean
between pot screening conducted in both the growth chamber and the glasshouse and field
results, particularly when the soil used in pots was collected from the site where the field
test was conducted (Fairbanks et al., 1987). This screening method was also considered to
be worth exploring with other cool season food legumes (Saxena et al., 1994).
Chlorosis symptoms indicative of Fe deficiency have been observed on cool-season
legume crops grown on alkaline soils in Southern Australia, particularly after heavy
rainfall during the winter season (Hawthorne; Paull, pers. comm.) Some summer crops
including pigeon pea, cotton, cowpea and mung bean were sensitive to the waterlogging
associated with furrow irrigation on high pH Vertisol soils of northern New South Wales
which are moderately calcareous, and the crops showed chlorosis of young leaves that
gradually turned green several days after the soil recovered from waterlogging (Hodgson et
al., 1992). Field peas grown in the South East of South Australia have also developed
chlorosis during wet seasons (Hawthorne, pers. comm.) Therefore, in this pot experiment,
soils obtained from regions where sensitive genotypes have developed chlorosis were used
as the growth media. In order to maintain conditions similar to the field, HCO3- was not
added. A soil sample that was effective in inducing peas to express Fe deficiency chlorosis
could be used in the future experiments for screening germplasm and studying the genetics
and physiology of tolerance.
66
The aim of the experiment was to identify a suitable soil which could be utilised as a
medium for developing a soil screening method for genetic studies on Fe efficiency of field
peas. 3.3.2 Materials and Methods
Soils and pots
Four types of soils were used in this experiment. They were (a) Wangary sandy loam
(Wangary soil) collected from a field site at Wangary on the Eyre Peninsula of South
Australia, (and used in experiments by Brand (1999) and Brand et al (2000) on rough
seeded lupins), (b) a black cracking clay (Glenroy soil) collected from a field site known as
“Glenroy” in the SARDI Field Crop Evaluation Program trial system. This site is located
near Naracoorte in the South East of South Australia, (c) peat soil (Millicent soil) collected
from Millicent, South Australia, at a field site used by the University of Adelaide faba bean
breeding program and a region where many faba bean lines display symptoms indicative of
Fe deficiency, and (d) UC modified potting mix (UC soil) provided by SARDI (properties
of this soil are presented in Appendix 1). The UC soil could be considered as a control
treatment with a composition and nutrient balance optimal for plant growth. All field soils
were collected from the plough layer. Limited details of the soil properties are shown in the
Table 3.3, while full element analysis is presented in Appendix 2. Soil analysis was
conducted by CSBP Ltd. Kwinana, WA, with duplicate samples of each soil.
A bulk sample of each field soil was air dried and sieved through a 5 mm screen. The Field
capacity (FC; Ψm = -10 Kpa) of the soils was determined by using sintered glass funnels
and ceramic pressure plates. The air-dried soils were poured into 3 cm diameter plastic
PVC tubing placed on the ceramic plates. The soils were saturated with RO water, mixed
to allow even surface contact with the ceramic plate and covered to prevent moisture loss
via evaporation. The samples were allowed to drain for 48 h, before being removed and
moist weights recorded. The moist soil was placed in a plastic container and oven dried at
105 oC for 48 hours and the dry weight was recorded.
Field capacity was calculated as follows :
(g moist soil – g dry soil) FC(%) = x 100 (g dry soil)
67
Pots (100 mm diam) were lined with transparent plastic bags to prevent drainage and
leaching of nutrients, and each pot was filled with 800 g of air dried soil and the pots were
watered to 70% of field capacity for optimal germination of peas. Milli-Q water was used
throughout the experiment and no nutrients were added to any soil.
Table 3.3 Soil name, pHw, pHs, electrical conductivity (EC), CaCO3 content, Fe content and field capacity of soils used in this study.
Soil name
pHH2O
pHCaCl2
EC (dS/m)
CaCO3 content (%)
Fe content (mg/kg)
DTPA Fe (mg/kg)
FC (%)
Millicent
7.6
7.2
0.38
33.6
711
37.4
63.6
Wangary 8.1 7.7 0.38 57.3 360 19.7 16.7 Glenroy 8.1 7.7 0.52 76.6 349 30.5 61.3 UC 7.4 6.8 0.28 0.4 173 19.6 18.1
Genetic Materials
Three field pea genotypes were selected on the basis of results of the nutrient solution
experiment. These genotypes were (a) Parafield which was susceptible to Fe deficiency,
(b) Glenroy which was moderately tolerant and (c) Santi which was tolerant to Fe
deficiency.
Experimental Design
The plants were grown for 42 days in a controlled environment growth chamber with the
same temperature, light intensity, and day-length as the environment for the nutrient
solution experiment (Section 3.2.2). The experiment was set up as a randomised complete
block design with four replications of four treatments (soils) and three genotypes. Five
seeds were sown in each pot. One week after emergence, seedlings in each pot were
thinned to four plants. The moisture was maintained between 90 and 100% of field
capacity, by adding Milli-Q water to weight every 1 – 2 days as necessary.
The degree of chlorosis of plants was measured at 28, 35 and 42 days after sowing (DAS)
using a SPAD-502 meter. Measurements were made on youngest open stipules of all
genotypes because Santi and Glenroy are semi-leafless types, thus the same plant tissue
could be compared directly.
Older stipules (the 3rd and 5th YOS) were also rated at 42 DAS. Following the
measurement at 42 DAS, whole shoots were harvested at ground level, the youngest and
68
third youngest stipules (and leaves for Parafield) were sub-sampled, and all fractions were
oven dried. Dry weights of whole shoots were determined. The stipules and leaves were
analysed by ICP-AES to determine the concentrations of nutrients. Critical concentration
of nutrients in the leaves for field peas are summarised in Table 3.4.
Table 3.4 Critical concentration (mg/kg) of nutrients in the youngest mature leaves for field pea (P. sativum) (Reuter and Robinson, 1997).
To test for significant differences in chlorosis scores, a three-way analysis of variance
(ANOVA) between DAS, soils and genotypes was conducted using GenStat Sixth Edition,
whilst a two way ANOVA was used to test significance of differences for shoot dry weight
and nutrient concentration between soils and genotypes.
3.3.3 Results
There was little difference in the emergence of genotypes in the four soils, with the earliest
being in the UC soil. Glenroy emerged sooner than both Parafield and Santi. As a general
observation, plants grown in Wangary soil looked unhealthy from an early stage and had
the slowest growth (Plate 3.5)
Chlorosis symptoms
The first chlorosis symptom appeared at 26 DAS and this occurred particularly on the
youngest leaves of Parafield grown in both the Millicent soil and the Wangary soil.
Statistical analysis indicated that there was no three-way interaction for chlorosis score of
YOS (P<0.05) between DAS, soils and genotypes. However, there was a two-way
A NOTE:
This figure/table/image has been removed to comply with copyright regulations. It is included in the print copy of the thesis held by the University of Adelaide Library.
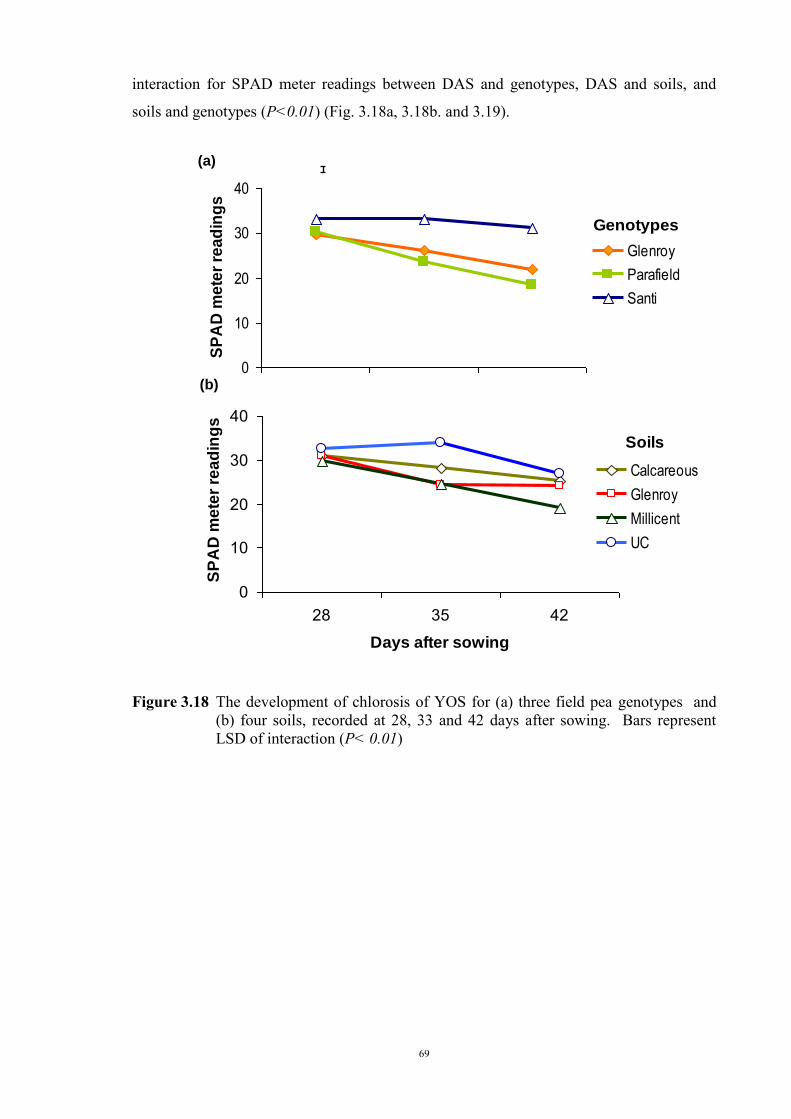
69
interaction for SPAD meter readings between DAS and genotypes, DAS and soils, and
soils and genotypes (P<0.01) (Fig. 3.18a, 3.18b. and 3.19).
Figure 3.18 The development of chlorosis of YOS for (a) three field pea genotypes and
(b) four soils, recorded at 28, 33 and 42 days after sowing. Bars represent LSD of interaction (P< 0.01)
Genotypes
0
10
20
30
40
SP
AD
me
ter
rea
din
gs
Glenroy
Parafield
Santi
(a)
Soils
0
10
20
30
40
28 35 42
Days after sowing
SP
AD
me
ter
rea
din
gs
Calcareous
Glenroy
Millicent
UC
(b)
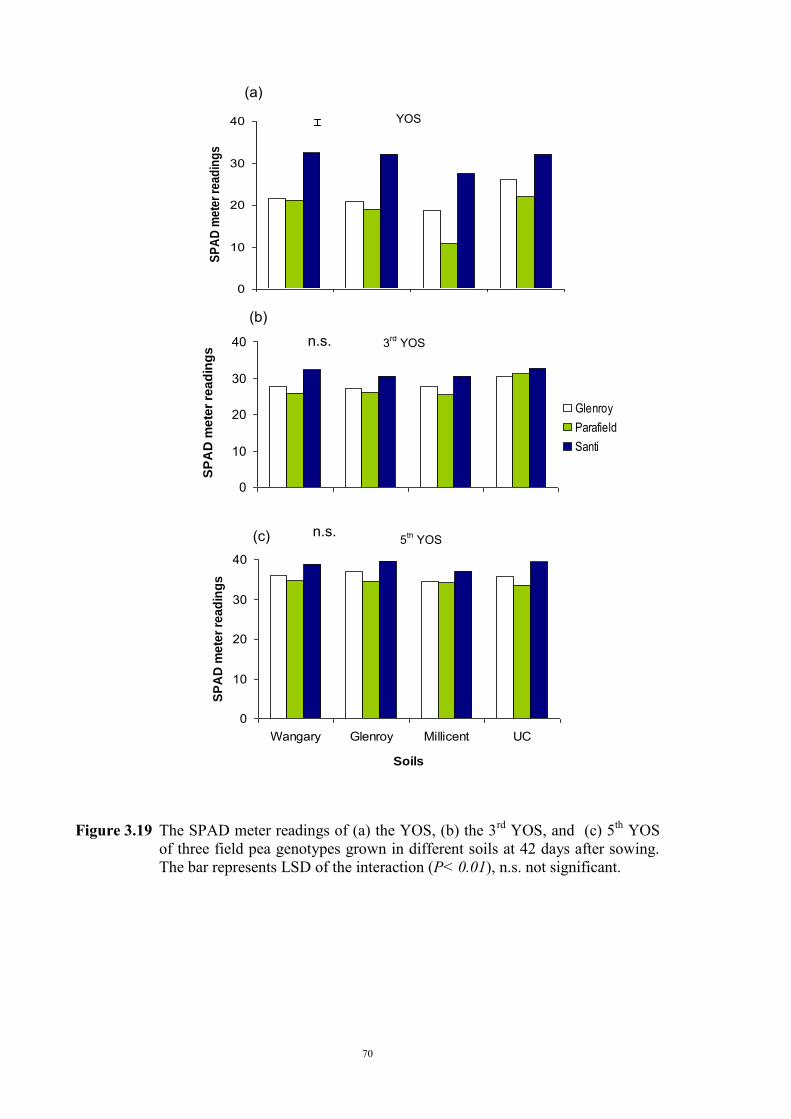
70
Figure 3.19 The SPAD meter readings of (a) the YOS, (b) the 3rd YOS, and (c) 5th YOS
of three field pea genotypes grown in different soils at 42 days after sowing. The bar represents LSD of the interaction (P< 0.01), n.s. not significant.
0
10
20
30
40
SP
AD
me
ter
rea
din
gs
(a)
YOS
0
10
20
30
40
SP
AD
me
ter
rea
din
gs
Glenroy
Parafield
Santi
n.s. (b)
3rd YOS
0
10
20
30
40
Wangary Glenroy Millicent UC
Soils
SP
AD
me
ter
rea
din
gs
n.s. (c) 5th YOS
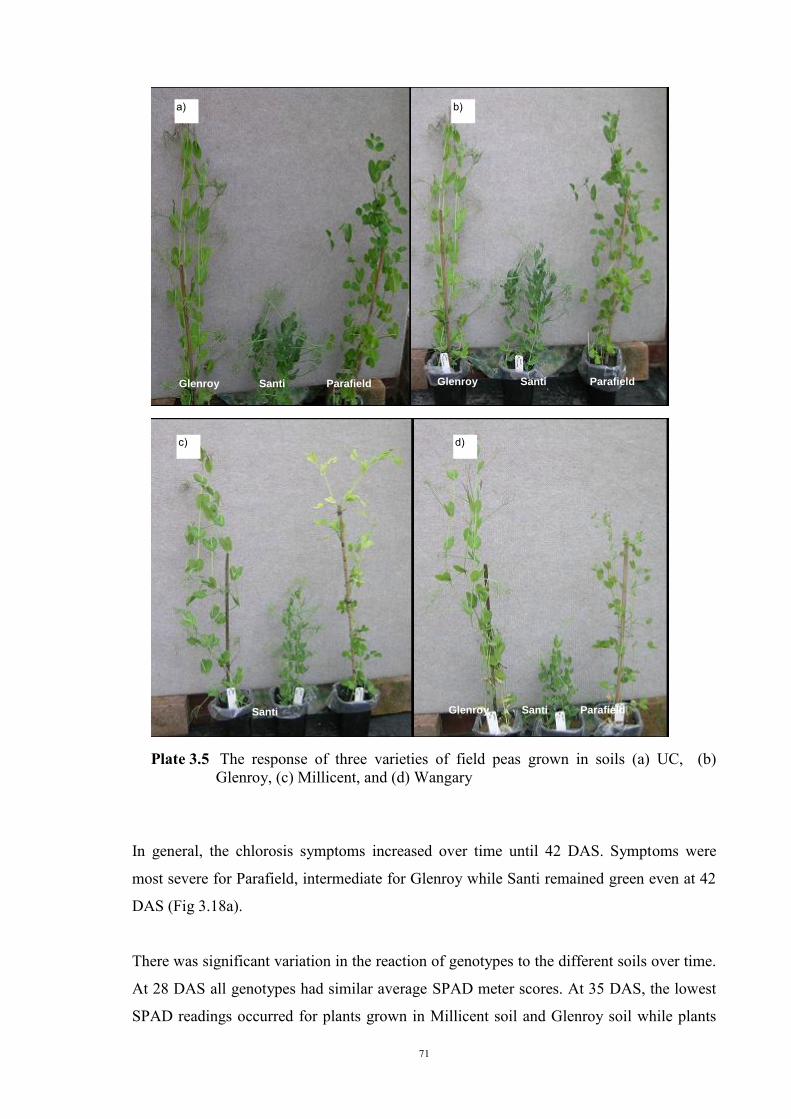
71
Plate 3.5 The response of three varieties of field peas grown in soils (a) UC, (b) Glenroy, (c) Millicent, and (d) Wangary
In general, the chlorosis symptoms increased over time until 42 DAS. Symptoms were
most severe for Parafield, intermediate for Glenroy while Santi remained green even at 42
DAS (Fig 3.18a).
There was significant variation in the reaction of genotypes to the different soils over time.
At 28 DAS all genotypes had similar average SPAD meter scores. At 35 DAS, the lowest
SPAD readings occurred for plants grown in Millicent soil and Glenroy soil while plants
Glenroy Santi Parafield Glenroy Santi Parafield
Parafield Glenroy
Santi Glenroy Santi Parafield
c) d)
a) b)
72
grown in UC soil were greenest. At 42 DAS plants grown in Millicent soil were the most
chlorotic. Interestingly, the SPAD readings of the plants grown in Glenroy soil slightly
increased and at this stage plants began to recover to some extent from the symptoms of
chlorosis (Fig. 3.18b).
The chlorosis scores of YOS, 3rd stipules from YOS (3rd YOS) and the 5th stipules from
YOS (5th YOS) of the plants at 42 DAS are presented in Fig. 3.19. Statistical analysis
indicated that there was no two-way interaction for chlorosis score between soils and
genotypes on both the 5th YOS and the 3rd YOS. However, the interaction between soils
and genotypes was significant on the YOS (P<0.01) (Fig. 3.19a).
Santi consistently displayed tolerance to all soils although it was affected to some extent
when grown in the Millicent soil. Glenroy exhibited approximately the same degree of
chlorosis as Parafield in the Wangary soil and Glenroy soil, but was greener in Millicent
and UC soils. The chlorosis scores of the YOS of all the genotypes were lowest in the
Millicent soil while Parafield suffered the most severe chlorosis over all soil treatments.
Shoot Dry Weight
There was highly significant variation in the shoot dry weight of plants grown in different
soils. There was also a significant interaction for the dry weight between genotypes and
soils (P<0.01) (Fig. 3.20). There was no significant difference between the three genotypes
when grown in the nutritionally adequate UC soil. The genotypes grown on the Wangary
soil produced the lowest shoot dry weight. This was expected as the growth of the plants
had been poor. Parafield was the most affected by the Wangary soil, although it was not
significantly different to Santi, while Glenroy produced the highest dry weight. Parafield
also had the lowest dry weight in the Millicent soil and was significantly less than Santi.
The growth of all genotypes in the Millicent soil was visually normal, the same as that on
Glenroy soil and UC soil.
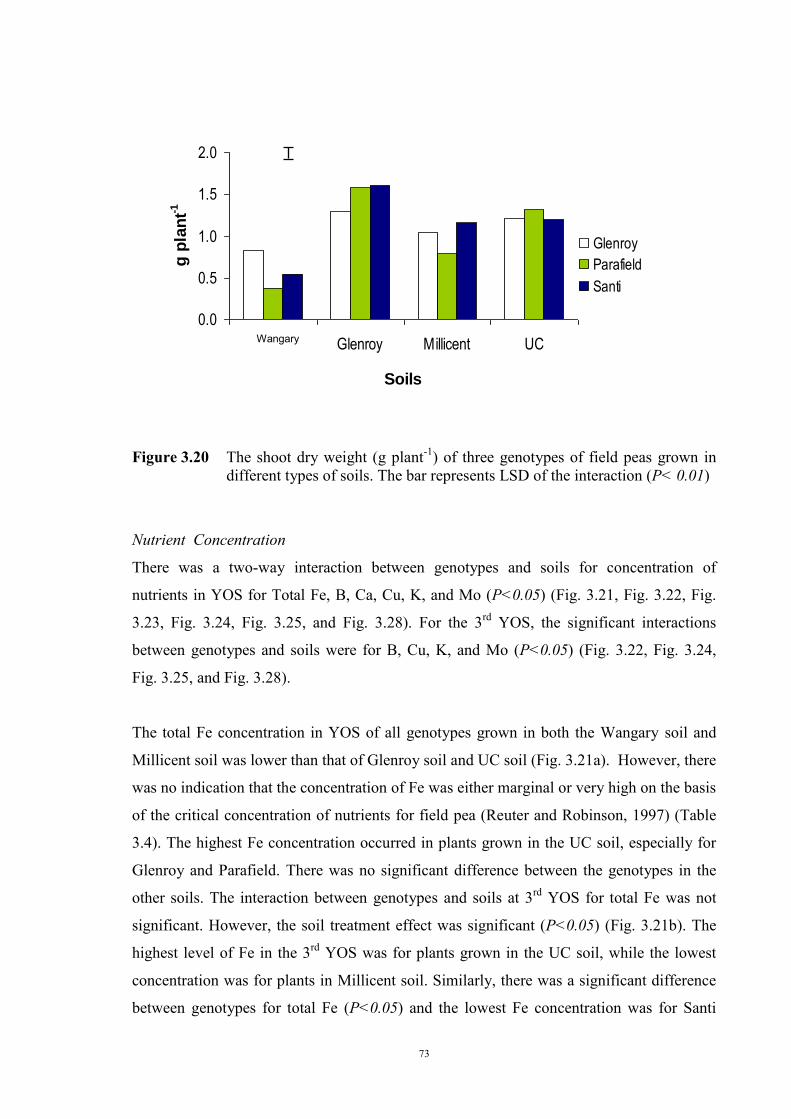
73
Figure 3.20 The shoot dry weight (g plant-1) of three genotypes of field peas grown in
different types of soils. The bar represents LSD of the interaction (P< 0.01)
Nutrient Concentration
There was a two-way interaction between genotypes and soils for concentration of
nutrients in YOS for Total Fe, B, Ca, Cu, K, and Mo (P<0.05) (Fig. 3.21, Fig. 3.22, Fig.
3.23, Fig. 3.24, Fig. 3.25, and Fig. 3.28). For the 3rd YOS, the significant interactions
between genotypes and soils were for B, Cu, K, and Mo (P<0.05) (Fig. 3.22, Fig. 3.24,
Fig. 3.25, and Fig. 3.28).
The total Fe concentration in YOS of all genotypes grown in both the Wangary soil and
Millicent soil was lower than that of Glenroy soil and UC soil (Fig. 3.21a). However, there
was no indication that the concentration of Fe was either marginal or very high on the basis
of the critical concentration of nutrients for field pea (Reuter and Robinson, 1997) (Table
3.4). The highest Fe concentration occurred in plants grown in the UC soil, especially for
Glenroy and Parafield. There was no significant difference between the genotypes in the
other soils. The interaction between genotypes and soils at 3rd YOS for total Fe was not
significant. However, the soil treatment effect was significant (P<0.05) (Fig. 3.21b). The
highest level of Fe in the 3rd YOS was for plants grown in the UC soil, while the lowest
concentration was for plants in Millicent soil. Similarly, there was a significant difference
between genotypes for total Fe (P<0.05) and the lowest Fe concentration was for Santi
0.0
0.5
1.0
1.5
2.0
Calcareous Glenroy Millicent UC
Soils
g p
lan
t-1
Glenroy
Parafield
Santi
Wangary
74
(Fig. 3.21c). The Fe concentration in YOS of all genotypes was greater than concentration
in the 3rd YOS on all soils (Fig. 3.21a and b).
These results demonstrated that the chlorosis symptoms were unlikely to be due to a lack
of total Fe, as the total Fe in the lower stipules, which were greener, was lower than in
shoot tips which were more chlorotic. In addition, the total Fe of all genotypes was
adequate according to Table 3.4 and the Fe concentration of the tolerant Santi was not
higher than that of the sensitive Parafield. However, the concentration of total Fe in plants
might contribute to the degree of overall Fe deficiency, as plants grown on both Wangary
soil and Millicent soil contained lower total Fe concentration and were more stressed than
plants grown in the Glenroy and UC soils.
Similar trends to the Fe concentration also occurred for K, P and S. The concentration of
these nutrients tended to be higher in shoot tips than in the 3rd YOS, and also plants grown
in Wangary soil and Millicent soil were lower than in Glenroy and UC soils (Fig. 3.25, Fig.
3.30, and Fig. 3.31). There were significant correlations amongst these nutrient
concentration (P>0.05) (Table 3.5). The K concentration in YOS was adequate on all soil
types with the highest concentration for plants grown in Glenroy soil. Glenroy showed the
highest concentration on the Wangary soil and Parafield on the Millicent soil (Fig. 3.25).
Although there was no interaction between genotypes and soil treatments, the variation of
P concentration in YOS was large. All genotypes were deficient in P on the Wangary soil
and Santi in particular was very low. The concentration of P in YOS was high for all
genotypes on the Glenroy and UC soils. The interaction was statistically significant for the
3rd YOS and the P concentration pattern among genotypes and soils was similar to YOS
(Fig. 3.30).
Although the interaction was not significant, the S concentration differed between
genotypes on all soil types. The S concentration of the YOS of all genotypes on the
Wangary soil was low (below the adequate level), but all other soils were adequate.
Interestingly, the S concentration in the lower stipules on the UC soil was higher than in
the YOS but the opposite occurred for the other soils (Fig. 3.31).
The concentration of B, Cu and Mo in both the YOS and the 3rd YOS had similar trends.
All genotypes showed higher concentration in the YOS than that in the 3rd YOS (Fig. 3.22,
Fig. 3.24, and Fig. 3.28) and there were significant correlations for concentrations of these
75
nutrients (P>0.05) (Table 3.5). All genotypes showed adequate or even high
concentrations of the three elements on all soils tested. Parafield showed the greatest
concentration of B, Cu and Mo on both Wangary and Millicent soils, and in the Wangary
soil in particular, the concentrations of B, Cu and Mo were in the high range according to
critical values presented in Table 3.4. Santi and Glenroy showed the same concentration of
Cu and Mo on all types of soils, while the B concentration of Santi was higher than
Glenroy on the Wangary and Millicent soil treatments.
The concentration of all essential elements was analysed in both the YOL and the YOS of
Parafield grown on the Millicent soil. In general, the concentrations of most elements were
the same in the two tissues, the major exceptions being Mn concentration in leaves was
higher than in stipules, while Zn concentration was higher in stipules than in leaves (Fig.
3.33). The concentration of Mn in stipules was suggestive of deficiency, however, the
YOL Mn concentration was well within the adequate range indicated in Table 3.4. The
concentration of Fe was lower in stipules than leaves; however the difference was not
statistically significant. This demonstrates that either YOS or YOL could be used as an
indicator of Fe deficiency, a factor that is of importance when comparing plants having
different types of leaves.
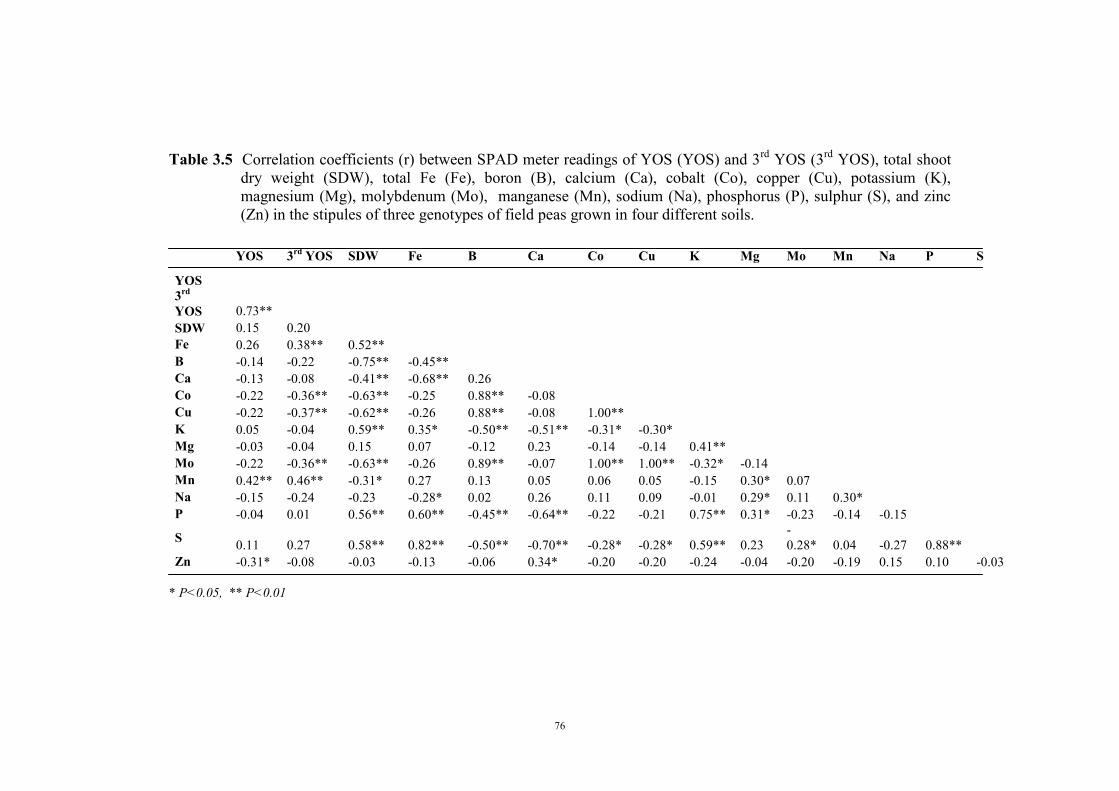
76
Table 3.5 Correlation coefficients (r) between SPAD meter readings of YOS (YOS) and 3rd YOS (3rd YOS), total shoot dry weight (SDW), total Fe (Fe), boron (B), calcium (Ca), cobalt (Co), copper (Cu), potassium (K), magnesium (Mg), molybdenum (Mo), manganese (Mn), sodium (Na), phosphorus (P), sulphur (S), and zinc (Zn) in the stipules of three genotypes of field peas grown in four different soils.
YOS 3rd YOS SDW Fe B Ca Co Cu K Mg Mo Mn Na P S
YOS 3rd YOS 0.73** SDW 0.15 0.20 Fe 0.26 0.38** 0.52** B -0.14 -0.22 -0.75** -0.45** Ca -0.13 -0.08 -0.41** -0.68** 0.26 Co -0.22 -0.36** -0.63** -0.25 0.88** -0.08 Cu -0.22 -0.37** -0.62** -0.26 0.88** -0.08 1.00** K 0.05 -0.04 0.59** 0.35* -0.50** -0.51** -0.31* -0.30* Mg -0.03 -0.04 0.15 0.07 -0.12 0.23 -0.14 -0.14 0.41** Mo -0.22 -0.36** -0.63** -0.26 0.89** -0.07 1.00** 1.00** -0.32* -0.14 Mn 0.42** 0.46** -0.31* 0.27 0.13 0.05 0.06 0.05 -0.15 0.30* 0.07 Na -0.15 -0.24 -0.23 -0.28* 0.02 0.26 0.11 0.09 -0.01 0.29* 0.11 0.30* P -0.04 0.01 0.56** 0.60** -0.45** -0.64** -0.22 -0.21 0.75** 0.31* -0.23 -0.14 -0.15
S 0.11 0.27 0.58** 0.82** -0.50** -0.70** -0.28* -0.28* 0.59** 0.23 -0.28* 0.04 -0.27 0.88**
Zn -0.31* -0.08 -0.03 -0.13 -0.06 0.34* -0.20 -0.20 -0.24 -0.04 -0.20 -0.19 0.15 0.10 -0.03 * P<0.05, ** P<0.01
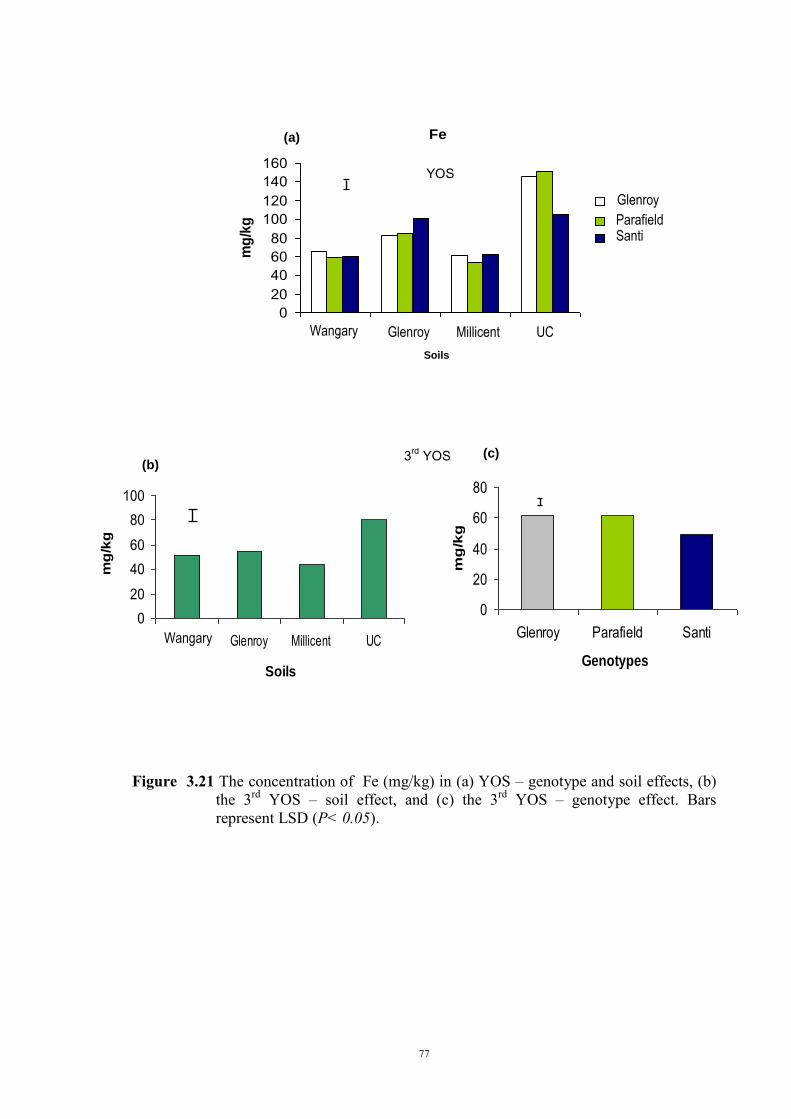
77
Figure 3.21 The concentration of Fe (mg/kg) in (a) YOS – genotype and soil effects, (b)
the 3rd YOS – soil effect, and (c) the 3rd YOS – genotype effect. Bars represent LSD (P< 0.05).
0
20
40
60
80
Glenroy Parafield Santi
Genotypes
mg
/kg
3rd YOS
020
4060
80100
Calcareous Glenroy Millicent UC
Soils
mg
/kg
(b) (c)
Fe
020406080
100120140160
mg
/kg
YOS
Calcareous Glenroy Millicent UC
Soils
(a)
Glenroy
Parafield Santi
Wangary
Wangary
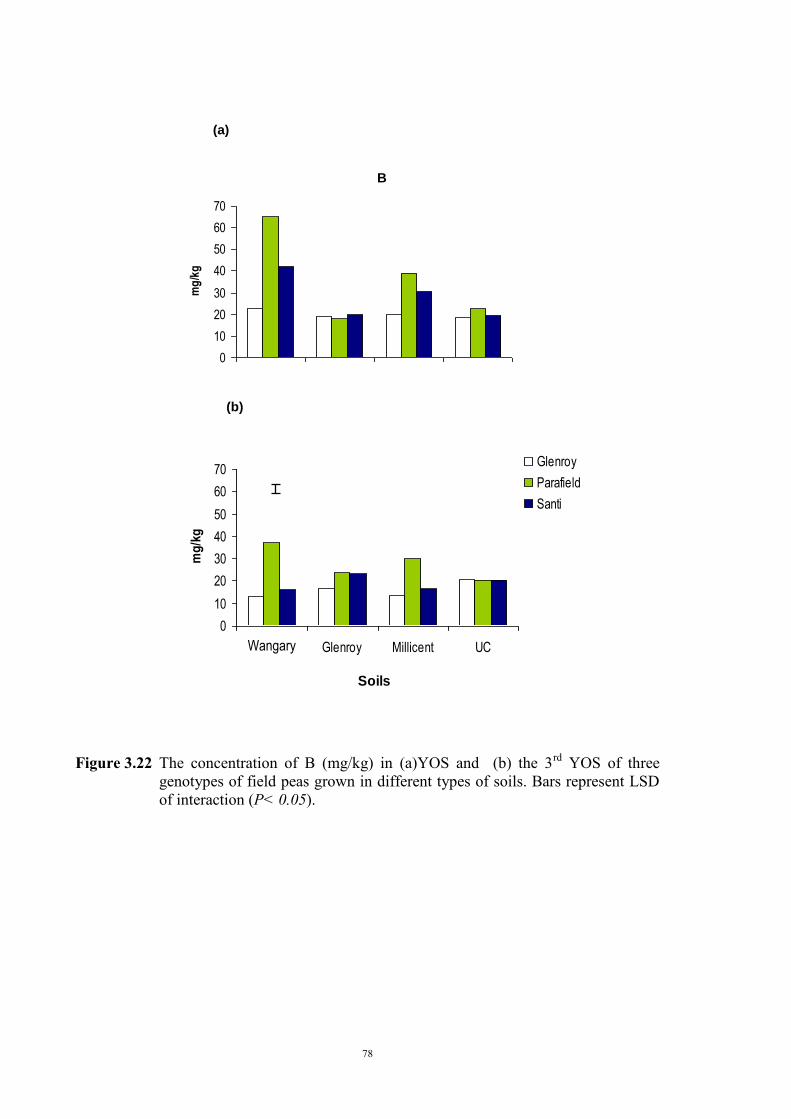
78
Figure 3.22 The concentration of B (mg/kg) in (a)YOS and (b) the 3rd YOS of three
genotypes of field peas grown in different types of soils. Bars represent LSD of interaction (P< 0.05).
(a)
B
0
10
20
30
40
50
60
70m
g/k
g
0
10
20
30
40
50
60
70
Calcareous Glenroy Millicent UC
Soils
mg
/kg
Glenroy
Parafield
Santi
Wangary
(b)
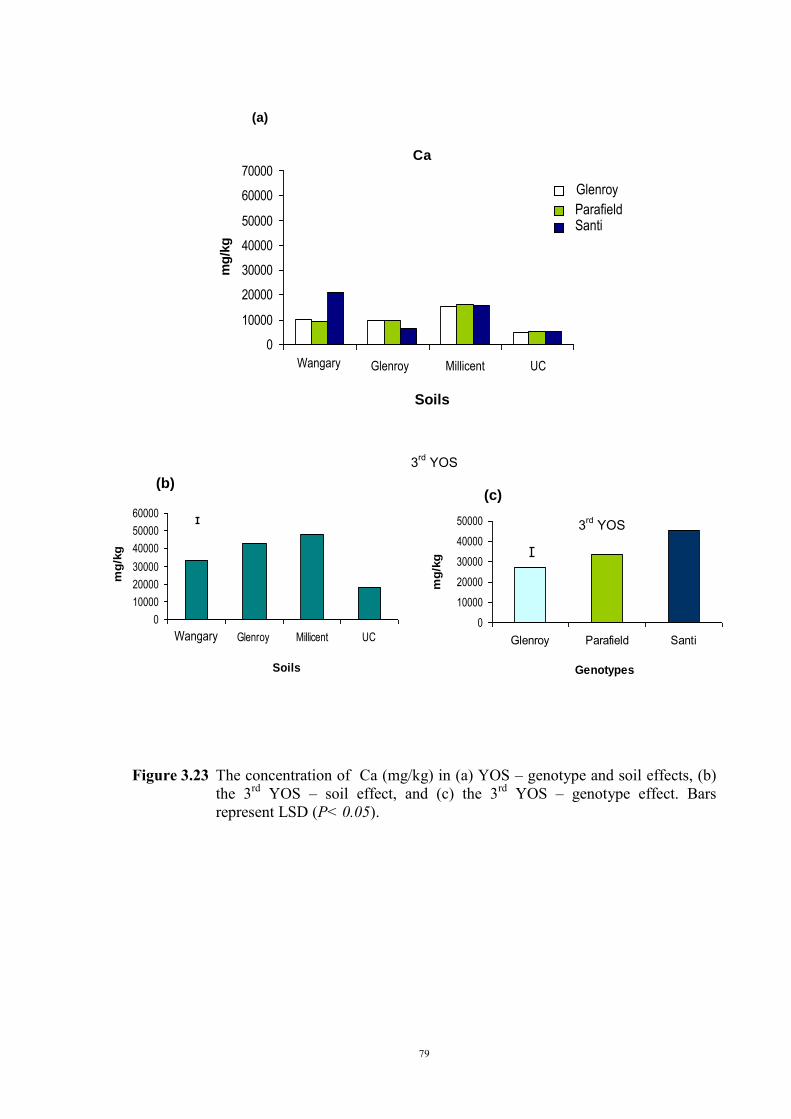
79
Figure 3.23 The concentration of Ca (mg/kg) in (a) YOS – genotype and soil effects, (b)
the 3rd YOS – soil effect, and (c) the 3rd YOS – genotype effect. Bars represent LSD (P< 0.05).
Ca
0
10000
20000
30000
40000
50000
60000
70000
mg
/kg
Calcareous Glenroy Millicent UC
Soils
Glenroy
Parafield Santi
3rd YOS
Ca
0
10000
20000
30000
40000
50000
60000
Calcareous Glenroy Millicent UC
Soils
mg
/kg
(b)
Ca
0
10000
20000
30000
40000
50000
Glenroy Parafield Santi
Genotypes
mg
/kg
(c)
3rd YOS
Wangary
Wangary
(a)
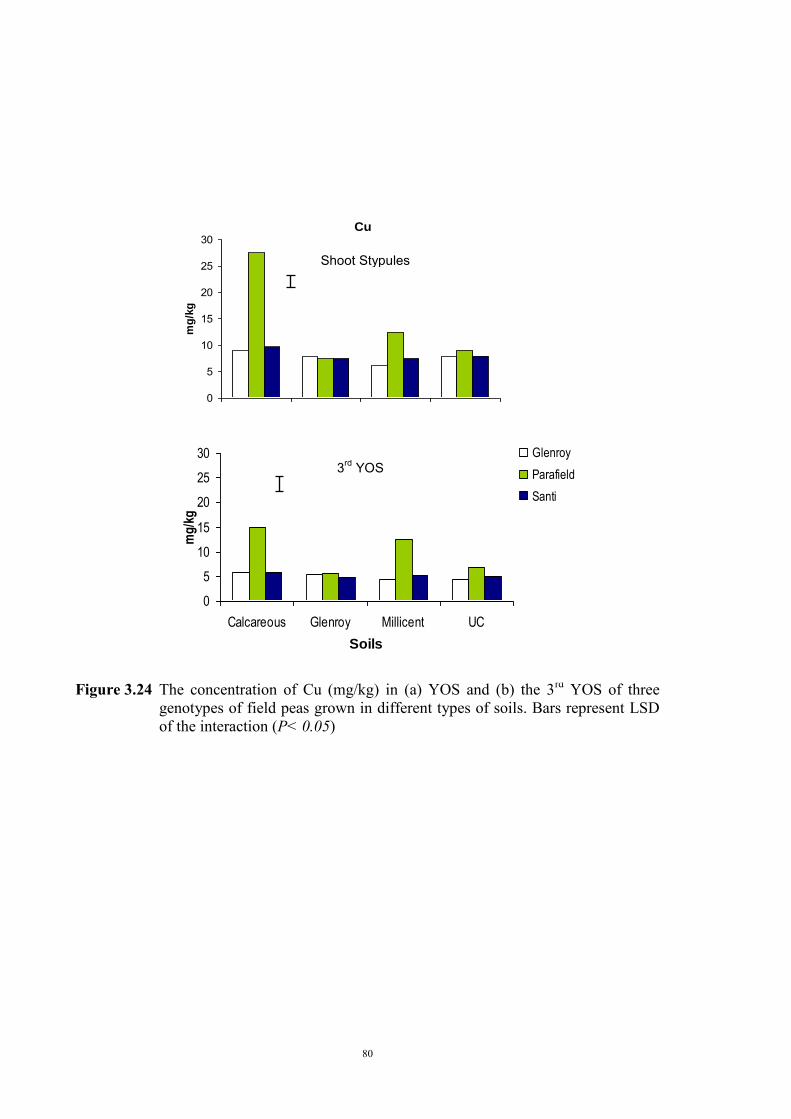
80
Figure 3.24 The concentration of Cu (mg/kg) in (a) YOS and (b) the 3rd YOS of three
genotypes of field peas grown in different types of soils. Bars represent LSD of the interaction (P< 0.05)
Cu
0
5
10
15
20
25
30
mg
/kg
Shoot Stypules
0
5
10
15
20
25
30
Calcareous Glenroy Millicent UC
Soils
mg
/kg
Glenroy
Parafield
Santi
3rd YOS
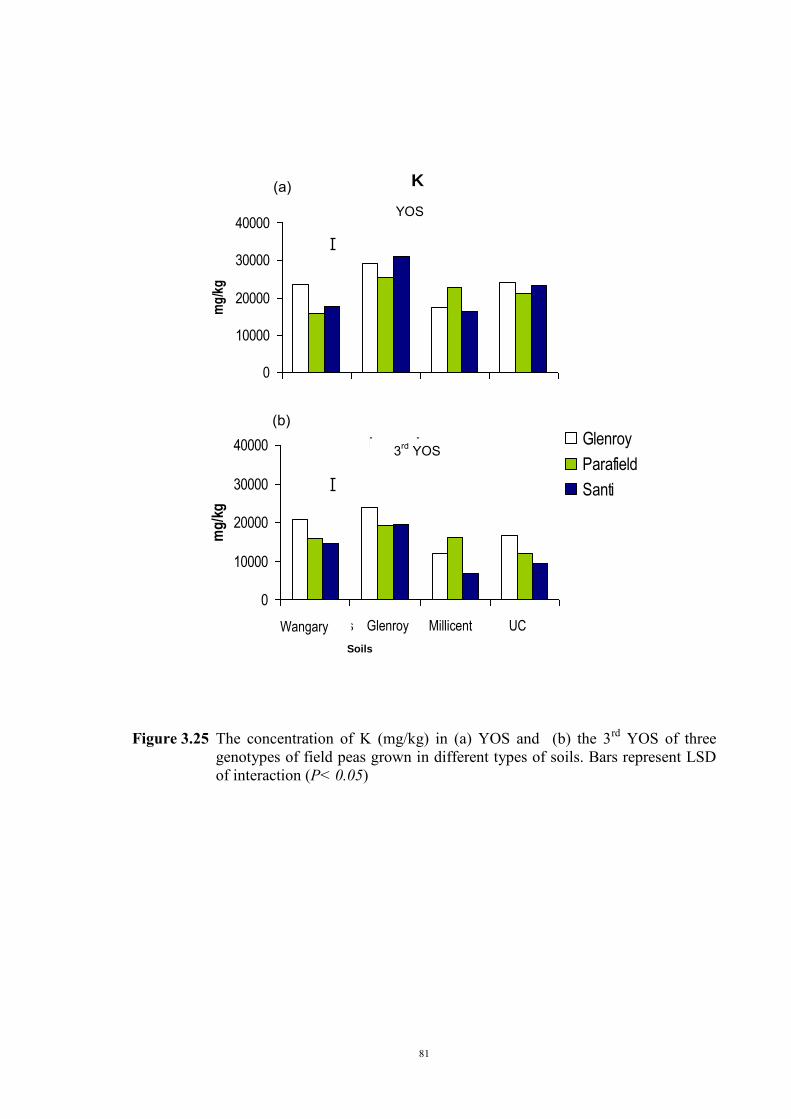
81
Figure 3.25 The concentration of K (mg/kg) in (a) YOS and (b) the 3rd YOS of three
genotypes of field peas grown in different types of soils. Bars represent LSD of interaction (P< 0.05)
K
0
10000
20000
30000
40000m
g/k
g
Lower Leaves
0
10000
20000
30000
40000
CS GS MS US
Soils
mg
/kg
Glenroy
Parafield
Santi
3rd YOS
YOS
Calcareous Glenroy Millicent UC
Soils
(b)
(a)
Wangary
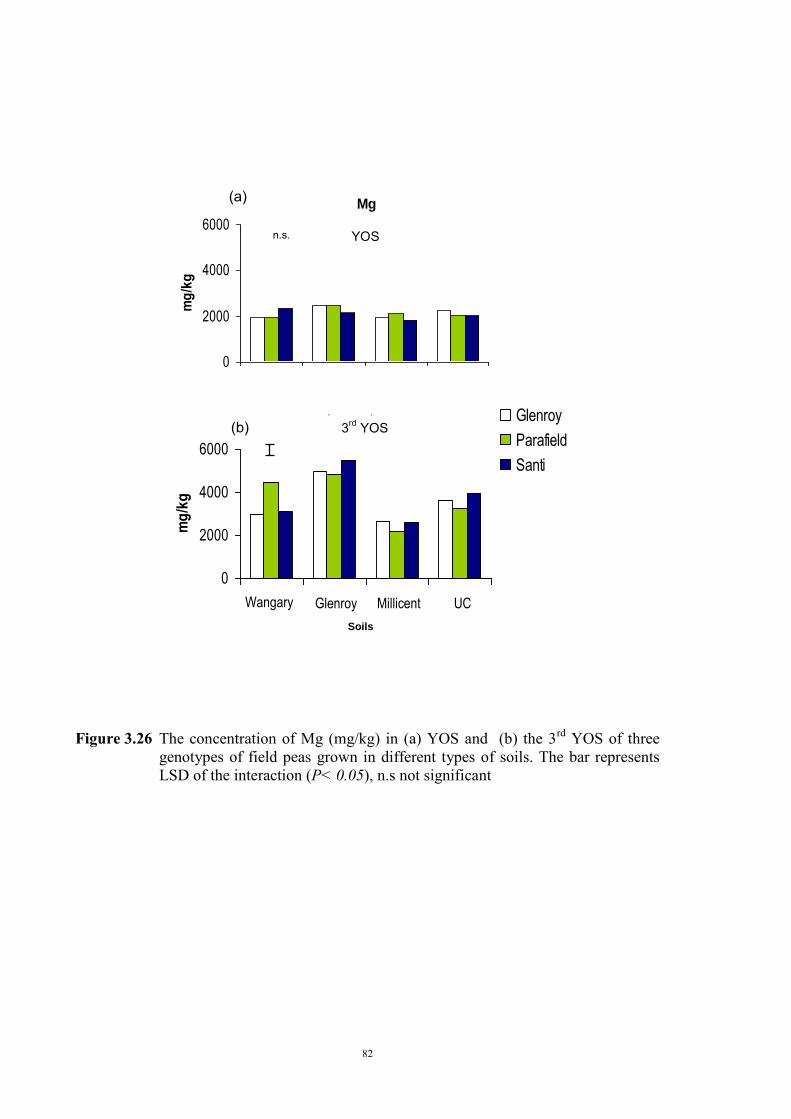
82
Figure 3.26 The concentration of Mg (mg/kg) in (a) YOS and (b) the 3rd YOS of three
genotypes of field peas grown in different types of soils. The bar represents LSD of the interaction (P< 0.05), n.s not significant
Mg
0
2000
4000
6000
mg
/kg
Lower Leaves
0
2000
4000
6000
CS GS MS USSoils
mg
/kg
Glenroy
Parafield
Santi
3rd YOS
YOS
Calcareous Glenroy Millicent UC
Soils
(b)
(a)
n.s.
Wangary
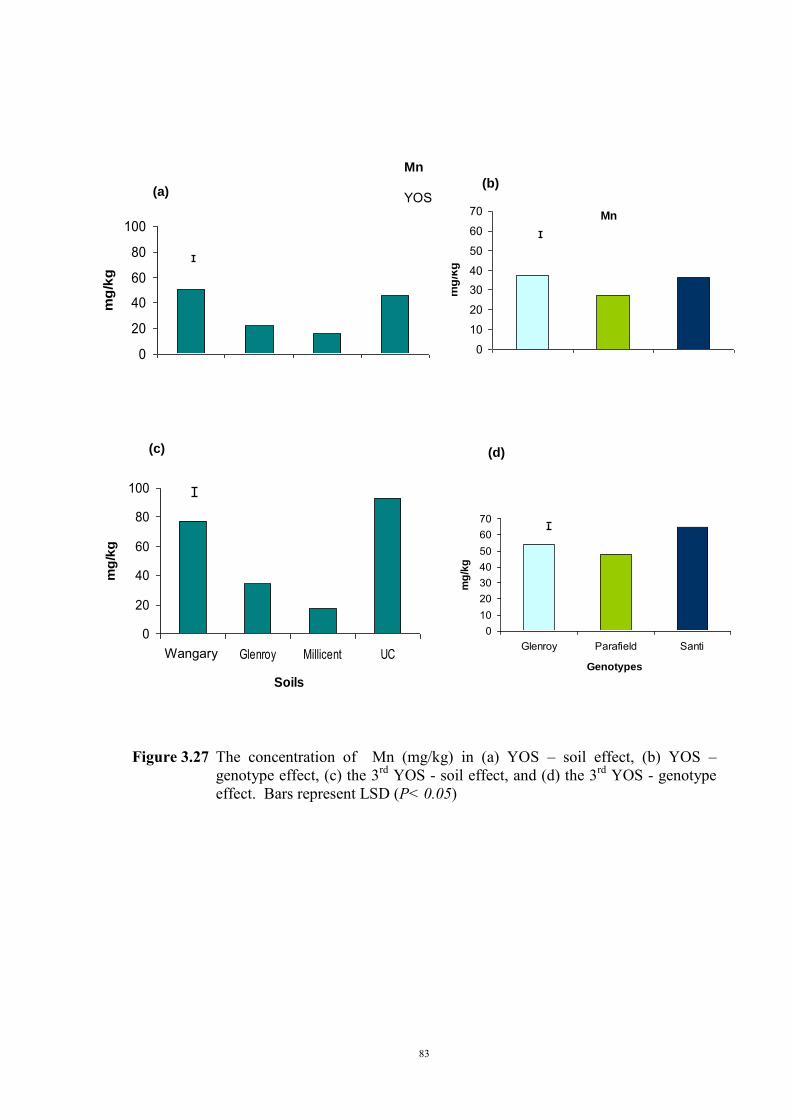
83
Figure 3.27 The concentration of Mn (mg/kg) in (a) YOS – soil effect, (b) YOS –
genotype effect, (c) the 3rd YOS - soil effect, and (d) the 3rd YOS - genotype effect. Bars represent LSD (P< 0.05)
(b)
Mn
0
10
20
3040
50
60
70
mg
/kg
0
20
40
60
80
100
mg
/kg
(a)
Mn YOS
3rd YOS
010203040506070
Glenroy Parafield Santi
Genotypes
mg
/kg
3rd YOS
0
20
40
60
80
100
Calcareous Glenroy Millicent UC
Soils
mg
/kg
(c) (d)
Wangary
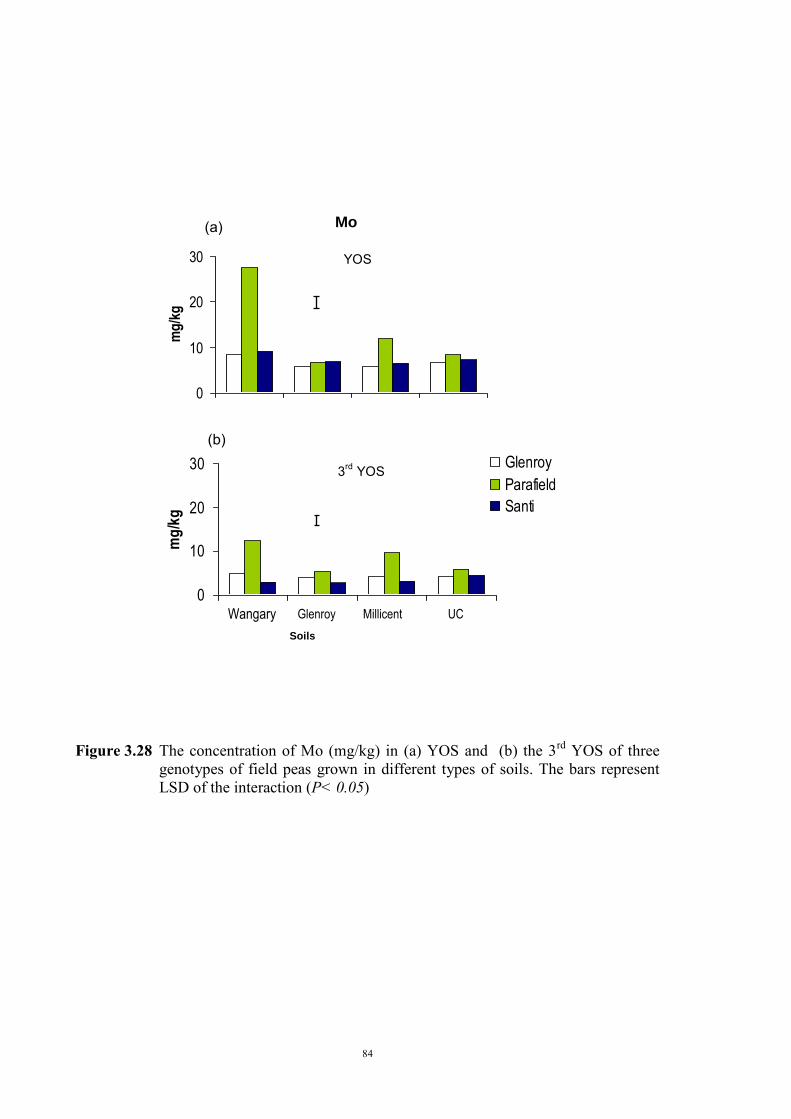
84
Figure 3.28 The concentration of Mo (mg/kg) in (a) YOS and (b) the 3rd YOS of three
genotypes of field peas grown in different types of soils. The bars represent LSD of the interaction (P< 0.05)
Mo
0
10
20
30
mg
/kg
Lower Leaves
0
10
20
30
CS GS MS US
Soils
mg
/kg
Glenroy
Parafield
Santi
3rd YOS
YOS
Glenroy Millicent UC
Soils
(a)
(b)
Wangary
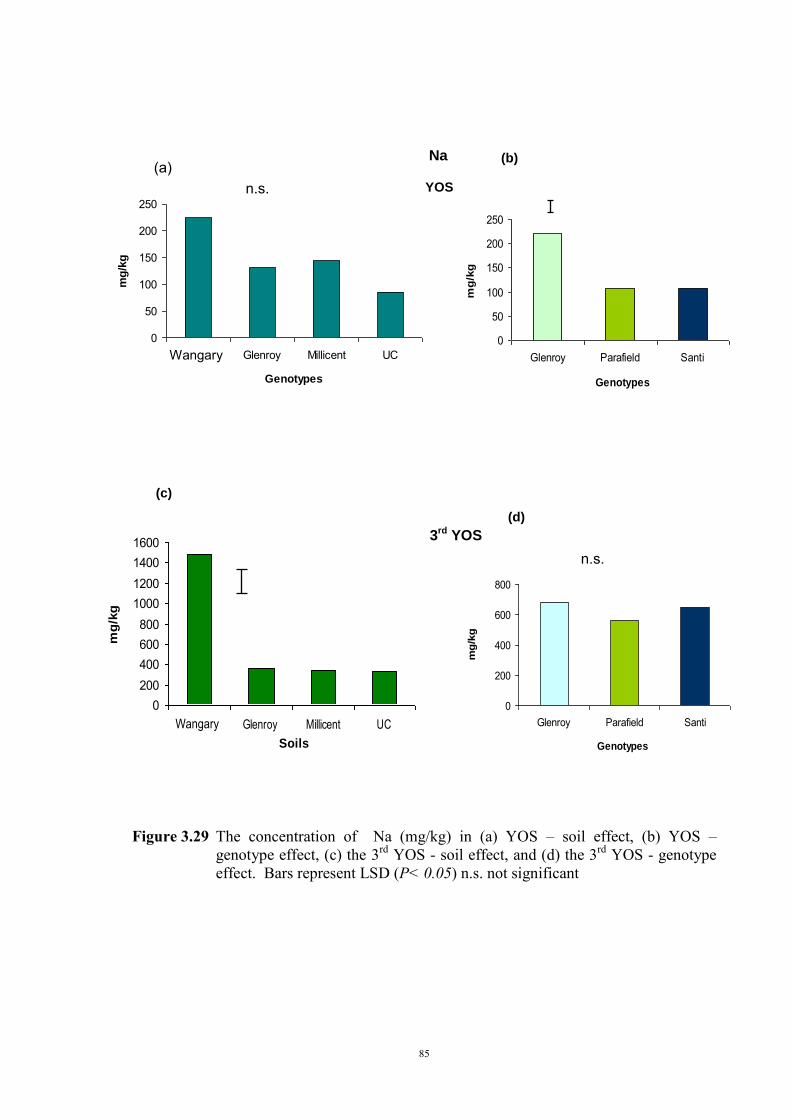
85
Figure 3.29 The concentration of Na (mg/kg) in (a) YOS – soil effect, (b) YOS –
genotype effect, (c) the 3rd YOS - soil effect, and (d) the 3rd YOS - genotype effect. Bars represent LSD (P< 0.05) n.s. not significant
(b)
0
200
400
600
800
Glenroy Parafield Santi
Genotypes
mg
/kg
3rd YOS
0200400600800
1000120014001600
Calcareous Glenroy Millicent UC
Soils
mg
/kg
3rd YOS
n.s.
(d)
(c)
Na
0
50
100
150
200
250
Glenroy Parafield Santi
Genotypes
mg
/kg
(a)
0
50
100
150
200
250
Calcareous Glenroy Millicent UC
Genotypes
mg
/kg
Na
YOS
n.s.
(b)
Wangary
Wangary
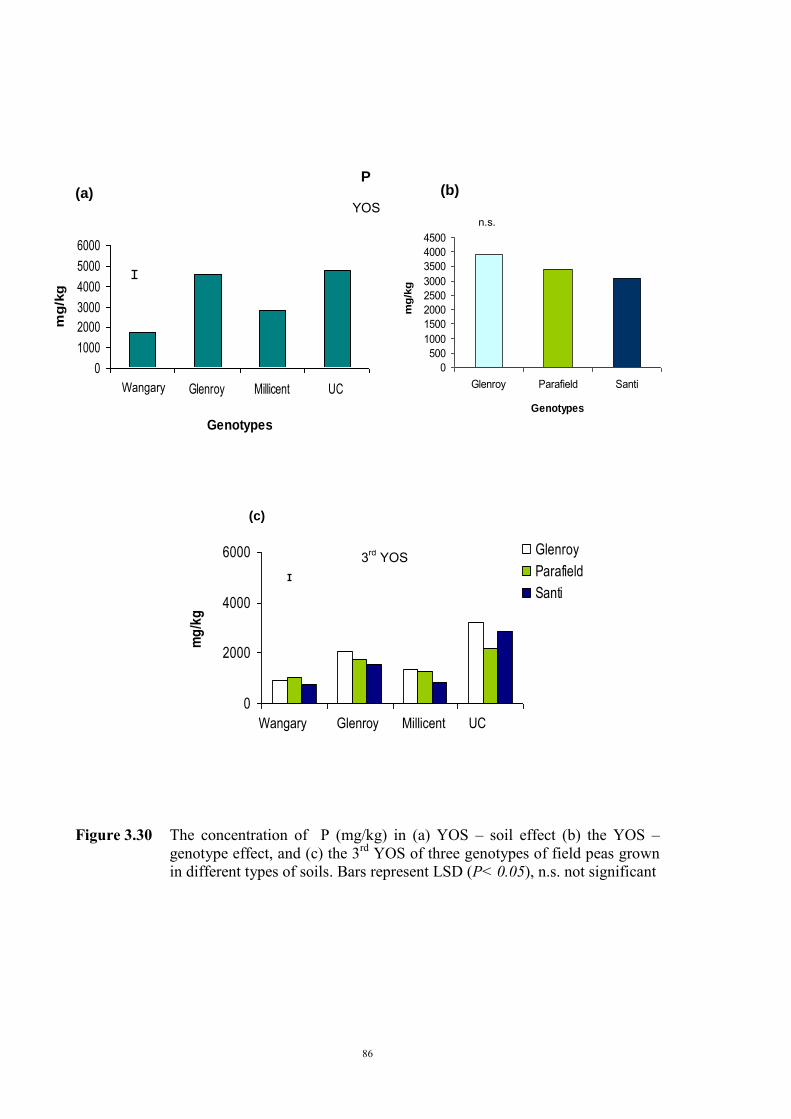
86
(a)
Figure 3.30 The concentration of P (mg/kg) in (a) YOS – soil effect (b) the YOS –
genotype effect, and (c) the 3rd YOS of three genotypes of field peas grown in different types of soils. Bars represent LSD (P< 0.05), n.s. not significant
P
0
1000
2000
3000
4000
5000
6000
Calcareous Glenroy Millicent UC
Genotypes
mg
/kg
P
YOS
0500
10001500200025003000350040004500
Glenroy Parafield Santi
Genotypesm
g/k
g
n.s.
(b)
Wangary
Lower Leaves
0
2000
4000
6000
CS GS MS US
Soils
mg
/kg
Glenroy
Parafield
Santi
3rd YOS
WWang
(c)
Wangary Glenroy Millicent UC
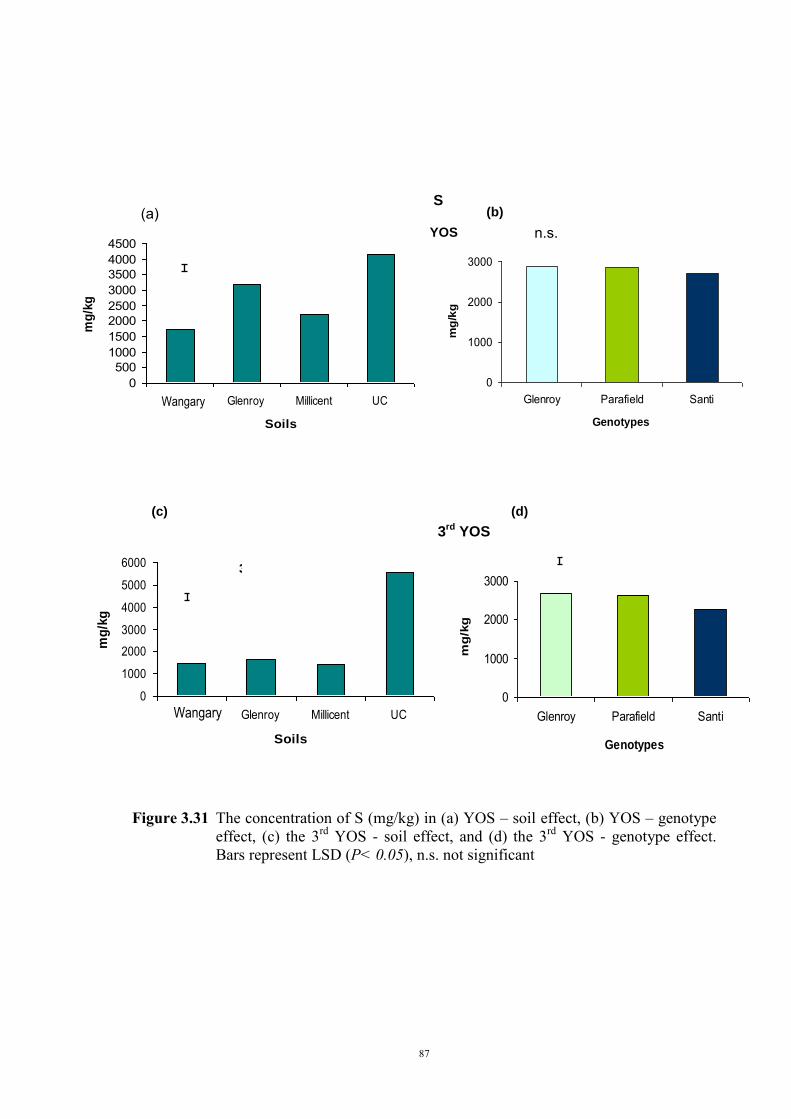
87
Figure 3.31 The concentration of S (mg/kg) in (a) YOS – soil effect, (b) YOS – genotype
effect, (c) the 3rd YOS - soil effect, and (d) the 3rd YOS - genotype effect. Bars represent LSD (P< 0.05), n.s. not significant
3rd YOS
0
1000
2000
3000
4000
5000
6000
Calcareous Glenroy Millicent UC
Soils
mg
/kg
3rd YOS
0
1000
2000
3000
Glenroy Parafield Santi
Genotypes
mg
/kg
3rd YOS (b)
(c) (d)
S
0500
10001500200025003000350040004500
Calcareous Glenroy Millicent UC
Soils
mg
/kg
(a)
0
1000
2000
3000
Glenroy Parafield Santi
Genotypes
mg
/kg
S
YOS n.s.
(b)
Wangary
Wangary
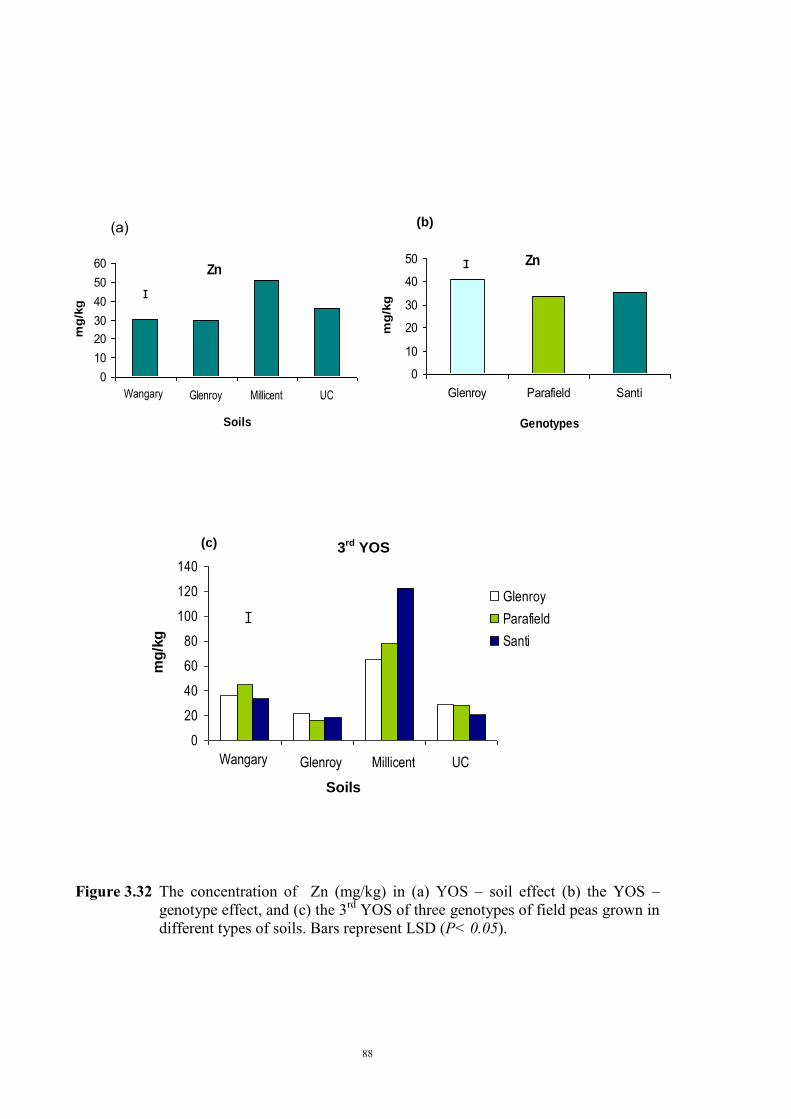
88
Figure 3.32 The concentration of Zn (mg/kg) in (a) YOS – soil effect (b) the YOS –
genotype effect, and (c) the 3rd YOS of three genotypes of field peas grown in different types of soils. Bars represent LSD (P< 0.05).
Zn
0
10
20
30
40
50
Glenroy Parafield Santi
Genotypes
mg
/kg
Zn
0102030405060
Calcareous Glenroy Millicent UC
Soils
mg
/kg
(a) (b)
Lower Leaves
0
20
40
60
80
100
120
140
CS GS MS US
Soils
mg
/kg
Glenroy
Parafield
Santi
(c)
Calcareous Glenroy Millicent UC
Soils
3rd YOS
Wangary
Wangary
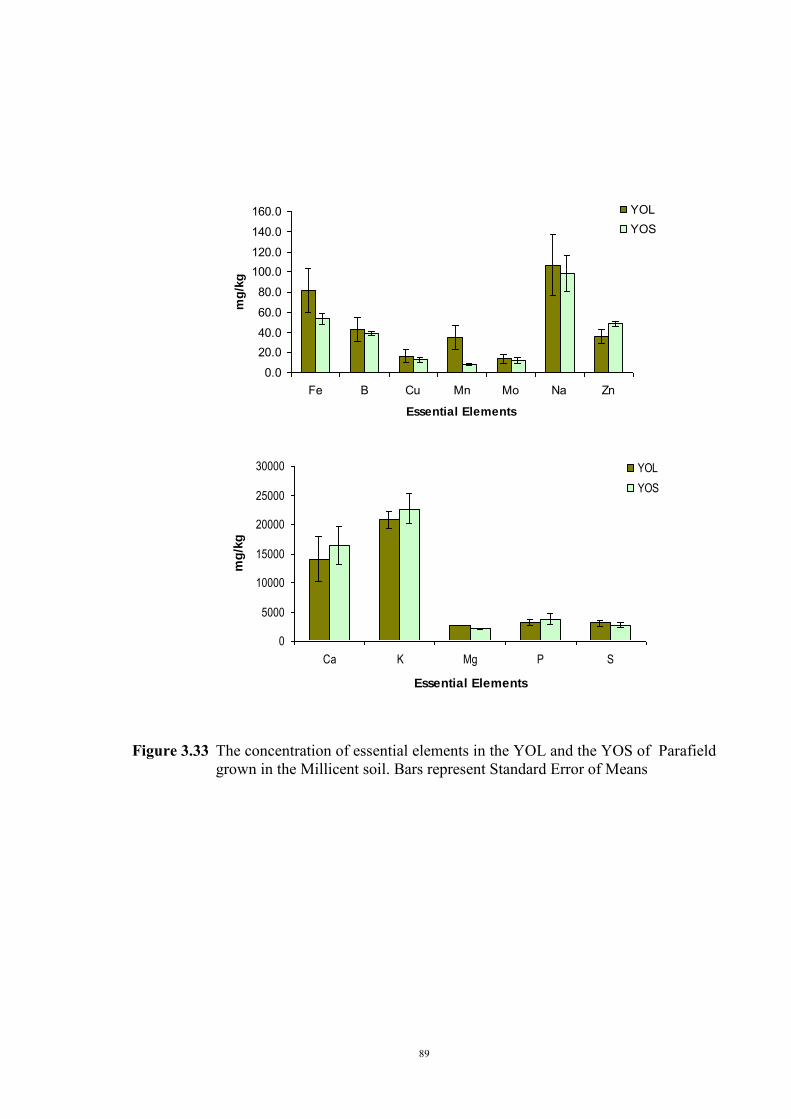
89
Figure 3.33 The concentration of essential elements in the YOL and the YOS of Parafield
grown in the Millicent soil. Bars represent Standard Error of Means
0.0
20.040.0
60.0
80.0
100.0120.0
140.0
160.0
Fe B Cu Mn Mo Na Zn
Essential Elements
mg
/kg
YOLYOS
0
5000
10000
15000
20000
25000
30000
Ca K Mg P S
Essential Elements
mg
/kg
YOL
YOS
90
3.4 The effect of soil moisture on expression of Fe deficiency chlorosis
(Experiment 3)
3.4.1 Introduction
In Australia, cool season food legumes, including field peas are grown during the winter
season. A combination of factors, including high rainfall, low temperature and poorly
drained soils can lead to waterlogging and in some soil types symptoms of chlorosis due to
Fe deficiency develop. The chlorosis can be induced if soils are kept excessively wet, and
soil water content appeared to be a much more important factor than that of temperature
and bulk density of the soil (Lindsay and Scwab, 1982; Fairbanks et al., 1987).
In the previous pot experiment (Section 3.3), field pea genotypes expressed chlorotic
symptoms consistent with Fe deficiency when the soil was maintained at moisture content
of 100% field capacity. This effect was more severe for plants grown in Wangary and
Millicent soils. In view of previous reports on the effect of soil moisture on Fe deficiency
e.g. pigeon pea (Hodgson et al., 1992), soybeans (Coulombe et al., 1984; Fairbanks et al.,
1987), and apples (Ao et al., 1987), a more detailed investigation was undertaken to
identify the optimum soil moisture treatment to discriminate between genotypes. The
Millicent soil was selected because it resulted in the greatest difference between genotypes
when screened at 100% of field capacity, and the overall growth of plants and tissue
analyses did not indicate other major nutritional imbalances.
3.4.2 Materials and Methods
Genetic Materials
The genotypes sown in this experiment were the same as the previous investigation,
namely: Parafield, Glenroy and Santi, representing sensitive, moderately tolerant and
tolerant to Fe deficiency, respectively.
Soils and pots
Peat soil or Millicent soil was used. The soil was air-dried, sieved and mixed, and 800 g
placed in 10 cm diameter pots lined with transparent polythene bag to prevent leaching of
nutrients and to enable >100% field capacity to be maintained.
91
Experimental Design
The experiment consisted of three moisture levels (80%, 100% and 120% of field
capacity). No supplementary nutrient was added in this experiment, because tissue analysis
in Section 3.3 indicated adequate concentrations off all elements for plants grown in the
Millicent soil. Five seeds were sown in each pot and the soil was watered to 70% of field
capacity to achieve optimum soil moisture for germination. Fourteen days after sowing
seedlings were thinned to four plants per pot and the moisture treatments were imposed.
The pots were weighed and watered daily during the experiment to maintain the
appropriate moisture content.
The experiment was arranged as a Factorial Randomised Complete Block Design with four
replicates. The measurements of chlorosis symptoms of young stipules (YOS) and older
stipules (2nd and 3rd YOS) were recorded at 21, 28, 35 and 42 DAS using a SPAD-502
meter. Shoot dry matter was determined after plants had been harvested (42 DAS).
Analysis of variance was conducted on interactions of genotypes, treatments and DAS to
test for significance of all measurements using GenStat Sixth Edition.
3.4.3 Results Chlorosis symptoms
There was no significant three-way interaction between soil moisture content, genotype
and DAS for SPAD meter readings of YOS, 2nd YOS and 3rd YOS. However, there was a
significant two-way interaction between DAS and moisture content for SPAD meter
readings of YOS, 2nd YOS, and 3rd YOS (P<0.01)(Fig. 3.34).
The trends of chlorosis symptoms in YOS, 2nd YOS and 3rd YOS were similar at all
moisture treatments. The symptoms was first observed at 28 DAS (14 days after imposing
the treatments) and increased with higher soil moisture and with time. All genotypes also
showed an increasing trend in shoot chlorosis over time. This trend was more obvious on
both the YOS and the 2nd YOS and the correlation for the SPAD meter readings between
the two stipules was significant (r=0.93; P<0.01). This demonstrated that the chlorosis
symptoms of peas affected by Fe deficiency mainly occurred at the shoot tips and
decreased on the lower leaves. Visually, the 3rd YOS was clearly greener than the top YOS.
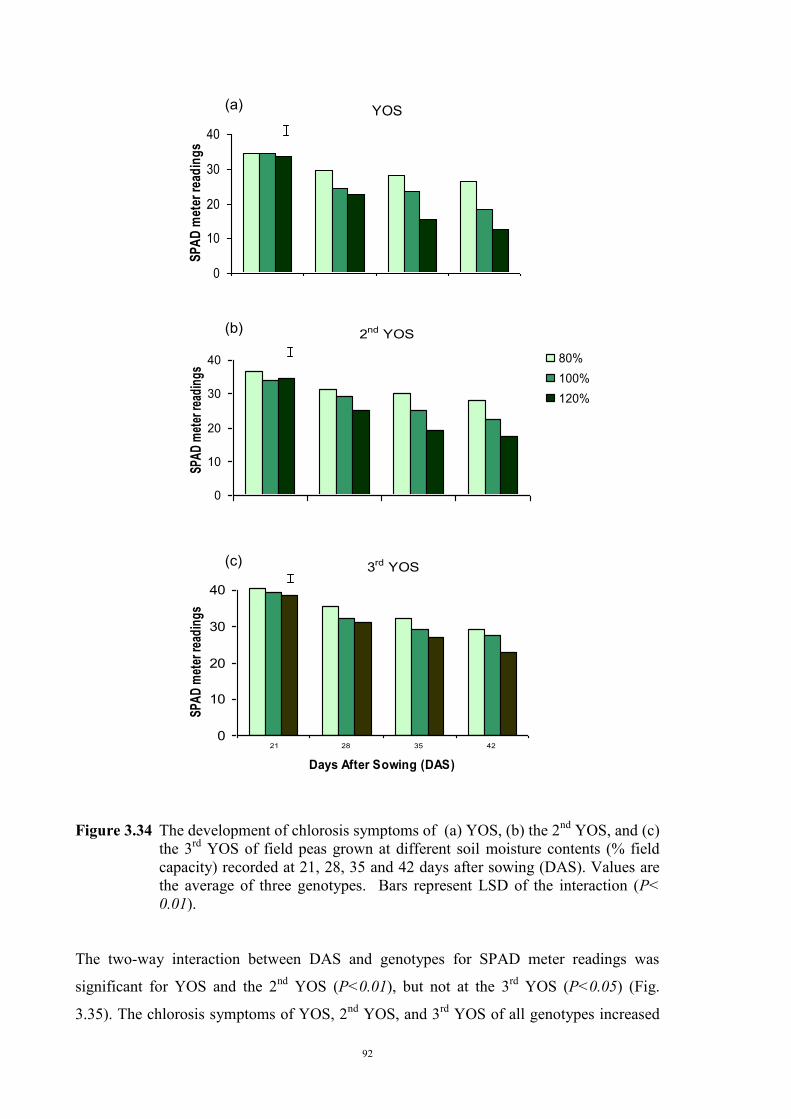
92
Figure 3.34 The development of chlorosis symptoms of (a) YOS, (b) the 2nd YOS, and (c)
the 3rd YOS of field peas grown at different soil moisture contents (% field capacity) recorded at 21, 28, 35 and 42 days after sowing (DAS). Values are the average of three genotypes. Bars represent LSD of the interaction (P< 0.01).
The two-way interaction between DAS and genotypes for SPAD meter readings was
significant for YOS and the 2nd YOS (P<0.01), but not at the 3rd YOS (P<0.05) (Fig.
3.35). The chlorosis symptoms of YOS, 2nd YOS, and 3rd YOS of all genotypes increased
YOS
0
10
20
30
40
SP
AD
met
er r
ead
ing
s
(a)
2nd YOS
0
10
20
30
40
SPA
D m
eter
read
ings
80%
100%
120%
(b)
3rd YOS
0
10
20
30
40
21 28 35 42
Days After Sowing (DAS)
SP
AD
met
er r
ead
ing
s
(c)
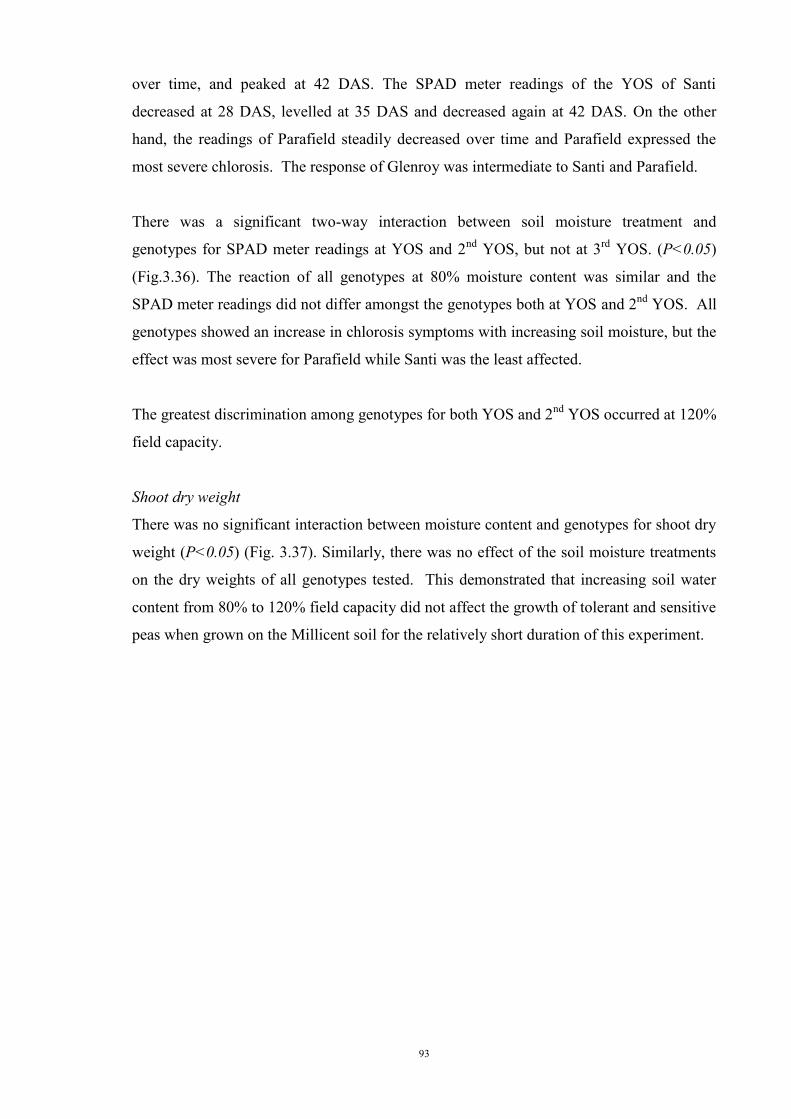
93
over time, and peaked at 42 DAS. The SPAD meter readings of the YOS of Santi
decreased at 28 DAS, levelled at 35 DAS and decreased again at 42 DAS. On the other
hand, the readings of Parafield steadily decreased over time and Parafield expressed the
most severe chlorosis. The response of Glenroy was intermediate to Santi and Parafield.
There was a significant two-way interaction between soil moisture treatment and
genotypes for SPAD meter readings at YOS and 2nd YOS, but not at 3rd YOS. (P<0.05)
(Fig.3.36). The reaction of all genotypes at 80% moisture content was similar and the
SPAD meter readings did not differ amongst the genotypes both at YOS and 2nd YOS. All
genotypes showed an increase in chlorosis symptoms with increasing soil moisture, but the
effect was most severe for Parafield while Santi was the least affected.
The greatest discrimination among genotypes for both YOS and 2nd YOS occurred at 120%
field capacity.
Shoot dry weight
There was no significant interaction between moisture content and genotypes for shoot dry
weight (P<0.05) (Fig. 3.37). Similarly, there was no effect of the soil moisture treatments
on the dry weights of all genotypes tested. This demonstrated that increasing soil water
content from 80% to 120% field capacity did not affect the growth of tolerant and sensitive
peas when grown on the Millicent soil for the relatively short duration of this experiment.
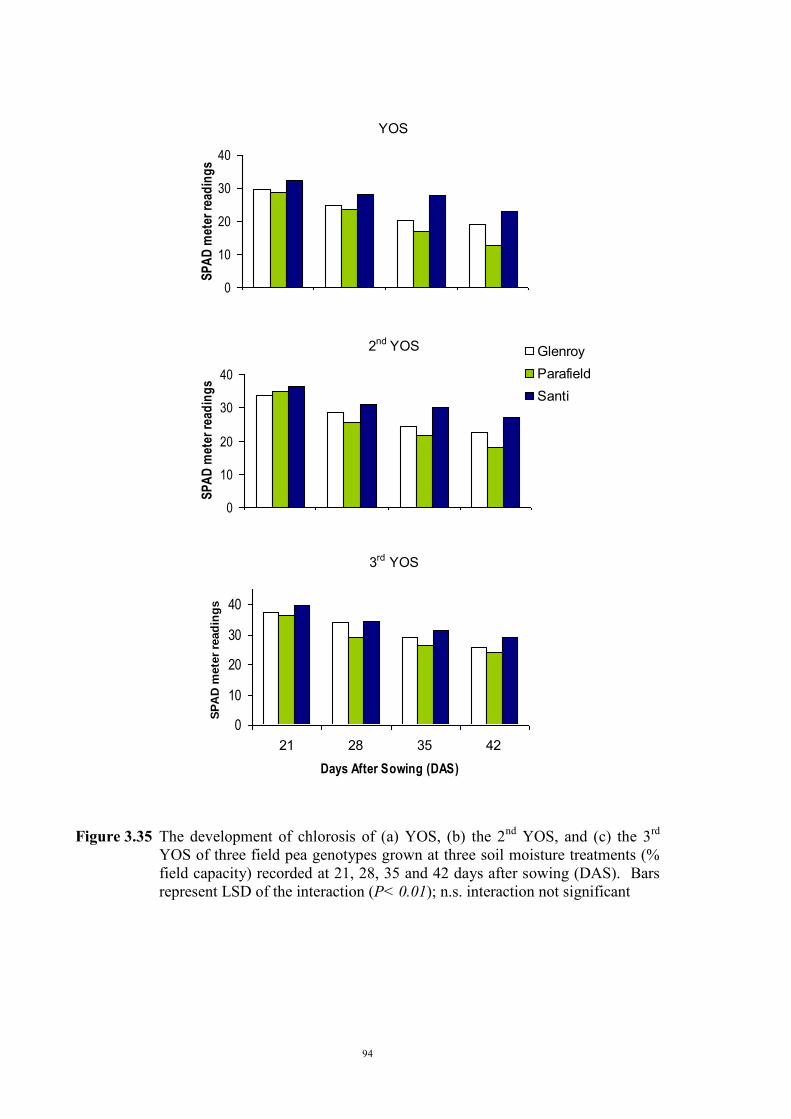
94
Figure 3.35 The development of chlorosis of (a) YOS, (b) the 2nd YOS, and (c) the 3rd
YOS of three field pea genotypes grown at three soil moisture treatments (% field capacity) recorded at 21, 28, 35 and 42 days after sowing (DAS). Bars represent LSD of the interaction (P< 0.01); n.s. interaction not significant
YOS
0
10
20
30
40
SP
AD
met
er r
ead
ing
s
2nd YOS
0
10
20
30
40
SP
AD
met
er r
ead
ing
s
GlenroyParafieldSanti
3rd YOS
0
10
20
30
40
21 28 35 42
Days After Sowing (DAS)
SP
AD
mete
r re
ad
ing
s
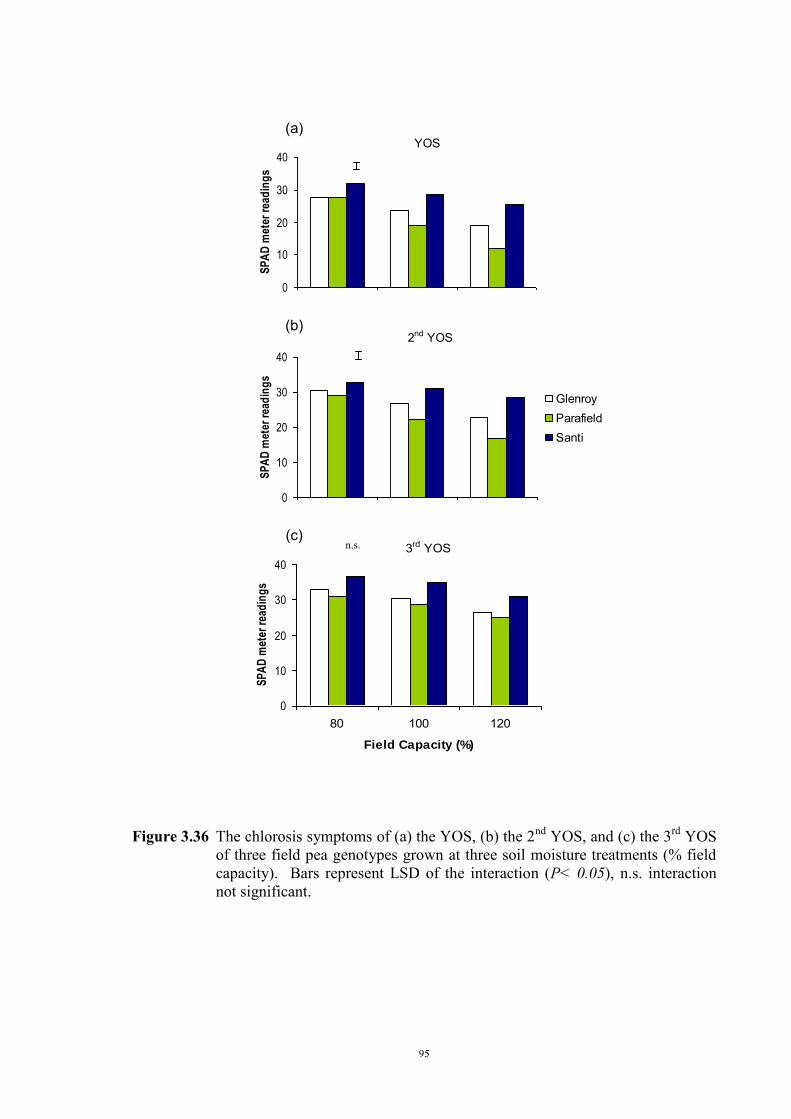
95
Figure 3.36 The chlorosis symptoms of (a) the YOS, (b) the 2nd YOS, and (c) the 3rd YOS
of three field pea genotypes grown at three soil moisture treatments (% field capacity). Bars represent LSD of the interaction (P< 0.05), n.s. interaction not significant.
YOS
0
10
20
30
40
SP
AD
met
er r
ead
ing
s
(a)
3rd YOS
0
10
20
30
40
80 100 120
Field Capacity (%)
SP
AD
met
er r
ead
ing
s
n.s. (c)
2nd YOS
0
10
20
30
40
SP
AD
met
er r
ead
ing
s
GlenroyParafieldSanti
(b)
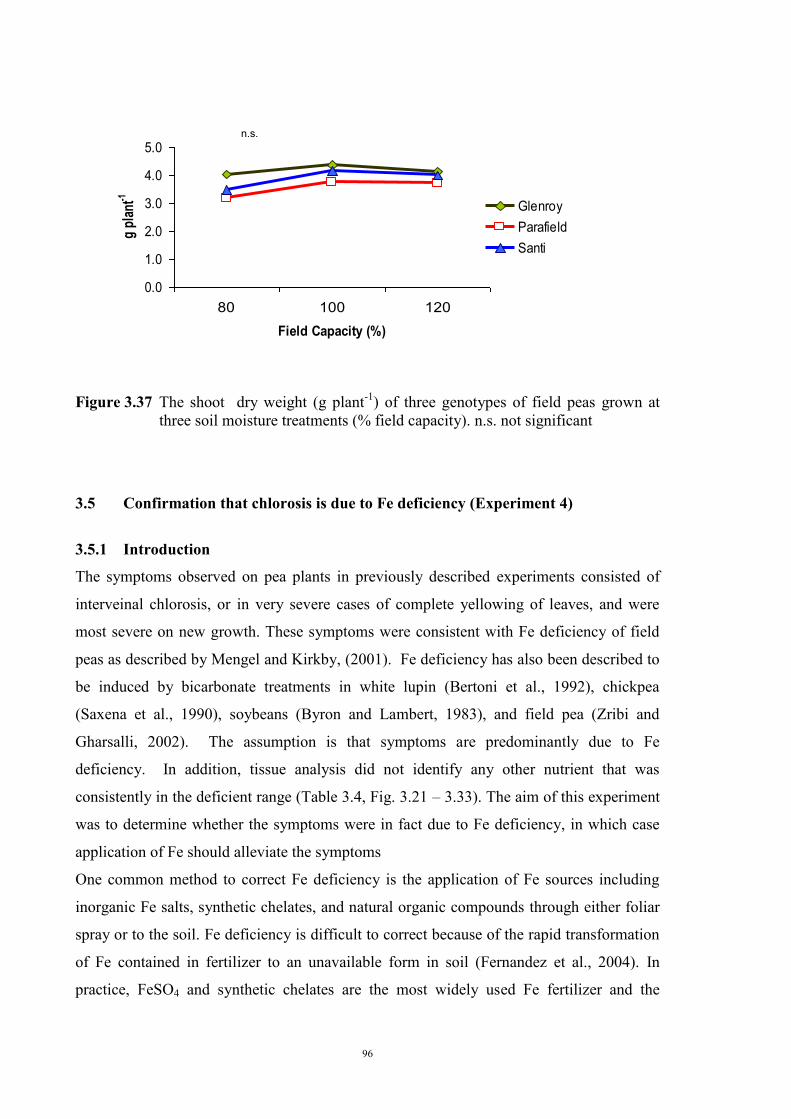
96
Figure 3.37 The shoot dry weight (g plant-1) of three genotypes of field peas grown at
three soil moisture treatments (% field capacity). n.s. not significant 3.5 Confirmation that chlorosis is due to Fe deficiency (Experiment 4)
3.5.1 Introduction
The symptoms observed on pea plants in previously described experiments consisted of
interveinal chlorosis, or in very severe cases of complete yellowing of leaves, and were
most severe on new growth. These symptoms were consistent with Fe deficiency of field
peas as described by Mengel and Kirkby, (2001). Fe deficiency has also been described to
be induced by bicarbonate treatments in white lupin (Bertoni et al., 1992), chickpea
(Saxena et al., 1990), soybeans (Byron and Lambert, 1983), and field pea (Zribi and
Gharsalli, 2002). The assumption is that symptoms are predominantly due to Fe
deficiency. In addition, tissue analysis did not identify any other nutrient that was
consistently in the deficient range (Table 3.4, Fig. 3.21 – 3.33). The aim of this experiment
was to determine whether the symptoms were in fact due to Fe deficiency, in which case
application of Fe should alleviate the symptoms
One common method to correct Fe deficiency is the application of Fe sources including
inorganic Fe salts, synthetic chelates, and natural organic compounds through either foliar
spray or to the soil. Fe deficiency is difficult to correct because of the rapid transformation
of Fe contained in fertilizer to an unavailable form in soil (Fernandez et al., 2004). In
practice, FeSO4 and synthetic chelates are the most widely used Fe fertilizer and the
0.0
1.0
2.0
3.0
4.0
5.0
80 100 120
Field Capacity (%)
g pl
ant-1
Glenroy
Parafield
Santi
n.s.
97
addition of Fe fertilization can help overcome Fe deficiency induced by a calcareous soil
and waterlogging (Jessop et al., 1990).
3.5.2 Material and Methods
Parafield, the most sensitive genotype to chlorosis, was tested in the Millicent peat soil
which induced the most severe chlorosis in the previous set of experiments. Sowing
methods were the same as the previous experiments and the 120% field capacity treatment
was selected to induce chlorosis.
At 35 DAS the chlorosis symptoms were severe and the symptoms were recorded. Fe
EDTA and Fe EDDHA were applied either as foliar spray or in solution to the soil at the
concentrations shown in Table 3.6 while control plants receive no Fe treatment. The three
top leaf positions were tagged at the time of the treatment. The chlorosis symptoms were
recorded twice, at 5 and 10 days after applying the treatments, on the tagged leaves and
new leaves that developed after the treatment.
A three way analysis of variance was applied to test for significant differences in chlorosis
symptoms between Days After Treatment (DAT), type of fertilizer and the method of
application using GenStat Sixth Edition.
Table 3.6 Fe fertilizer sources, method of application and concentration applied. Fertilizer Application Concentration
Fe EDDHA Foliar Spray 5% Fe
Soil Appl. 10 mg chelated Fe/ kg of soil
Fe EDTA Foliar Spray 5% Fe
Soil Appl. 10 mg chelated Fe/ kg of soil
Control Nil Nil
3.5.3 Results
Chlorosis symptoms on both YOL and YOS of Parafield were very severe at 35 DAS and
it was considered a suitable time to apply the fertilizers. In previous experiments chlorosis
was more severe at 42 DAS than 35 DAS. However, there was often a reduction in
chlorosis after 42 DAS and it was considered that if imposing Fe treatments was delayed
until 42 DAS any natural recovery from chlorosis would have a confounding effect on the
Fe treatments.
98
Three days after applying the treatments, several plants treated with both fertilizers, either
as foliar spray or via soil application, expressed phytotoxicity with some leaves dried and
curled. In severe cases, leaves dried, turned brown and senesced. This occurred on the 3rd
node from the top and below and mainly affected smaller plants that emerged relatively
late. The chlorosis score of leaves and stipules below YOL and YOS was not recorded for
affected plants. For most plants, the toxicity did not develop further and all the new leaves
emerged normally. Visual investigation confirmed that three days after applying foliar
fertilizer all chlorotic leaves showed some recovery and the following day this also
occurred for plants with the soil treatment.
Statistical analysis confirmed that there was no three-way interaction between Days After
Treatment (DAT), type of fertilizers and the method of application for chlorosis score
(P<0.05). However, there was a two-way interaction between DAT and fertilizer
treatments for chlorosis score both at YOL and YOS (P<0.01) (Fig. 3.38). Both the YOL
and YOS (at the time of treatment) of the plants that received Fe fertilizer treatment (both
Fe EDDHA and Fe EDTA) showed reduced chlorosis 5 DAT and further improvement at
10 DAT. On the contrary, the control plants remained chlorotic at 5 and 10 DAT.
The chlorosis scores of new shoots of treated plants were significantly greater than those of
untreated plants but the increase did not change over time (Fig. 3.38b). However, there was
no interaction between DAT and fertilizers for chlorosis score in new leaves (both at YOL
and YOS) (P>0.05) (Fig.3.38b).
There was no significant difference between the methods of application of Fe (Fig. 3.39a)
and both foliar and soil application produced the same reduction in chlorosis. Similarly, the
method of application did not affect the change in SPAD values over time for new shoots
of treated plants as statistically there was no significant difference between foliar spray and
soil application at 5 and 10 DAT (Fig. 3.39b). In addition, SPAD values did not change
when plants were treated with different kinds of fertilizer either using foliar spray or soil
application (Fig. 3.40).
In summary, the chlorotic symptoms expressed by Parafield and induced by high soil
moisture in the Millicent soil, were alleviated by the application of Fe fertilizer, whereas
symptoms on untreated plants became progressively more severe. Both forms of Fe
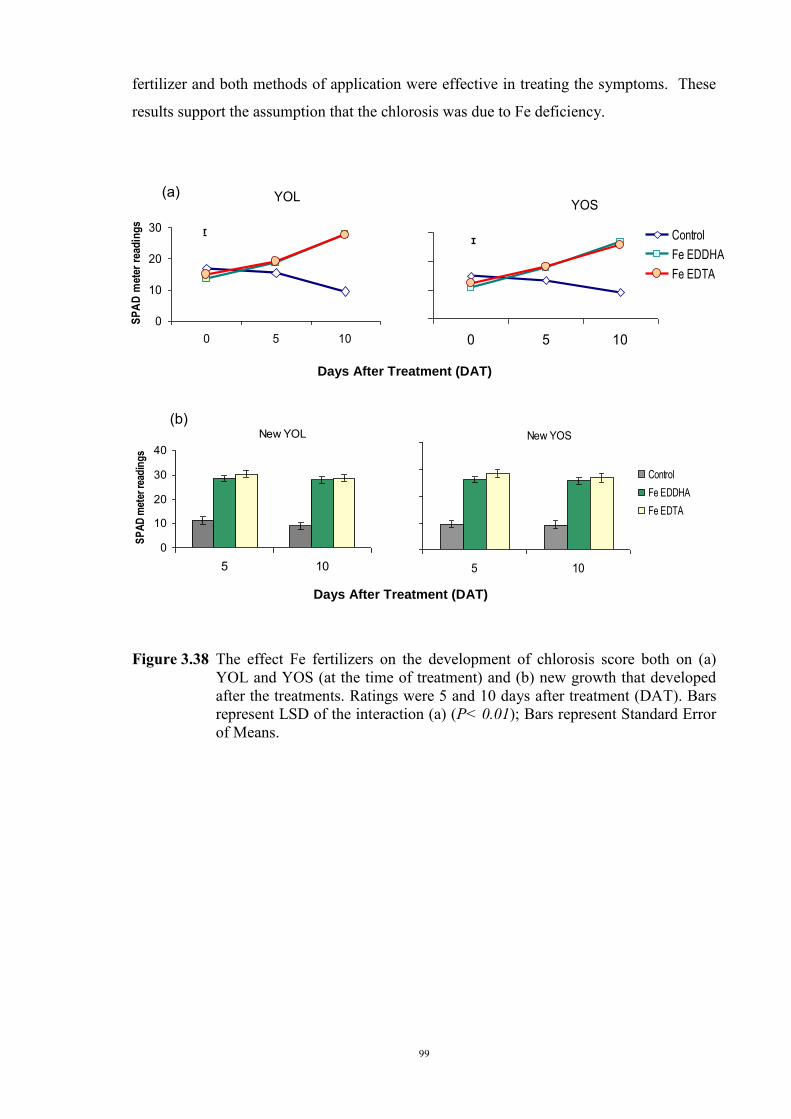
99
fertilizer and both methods of application were effective in treating the symptoms. These
results support the assumption that the chlorosis was due to Fe deficiency.
Figure 3.38 The effect Fe fertilizers on the development of chlorosis score both on (a)
YOL and YOS (at the time of treatment) and (b) new growth that developed after the treatments. Ratings were 5 and 10 days after treatment (DAT). Bars represent LSD of the interaction (a) (P< 0.01); Bars represent Standard Error of Means.
New YOL
0
10
20
30
40
5 10
SP
AD
met
er r
ead
ing
s
New YOS
5 10
Control
Fe EDDHA
Fe EDTA
Days After Treatment (DAT)
(b)
YOL
0
10
20
30
0 5 10
SP
AD
met
er r
ead
ing
s
YOS
0 5 10
Control
Fe EDDHA
Fe EDTA
Days After Treatment (DAT)
(a)
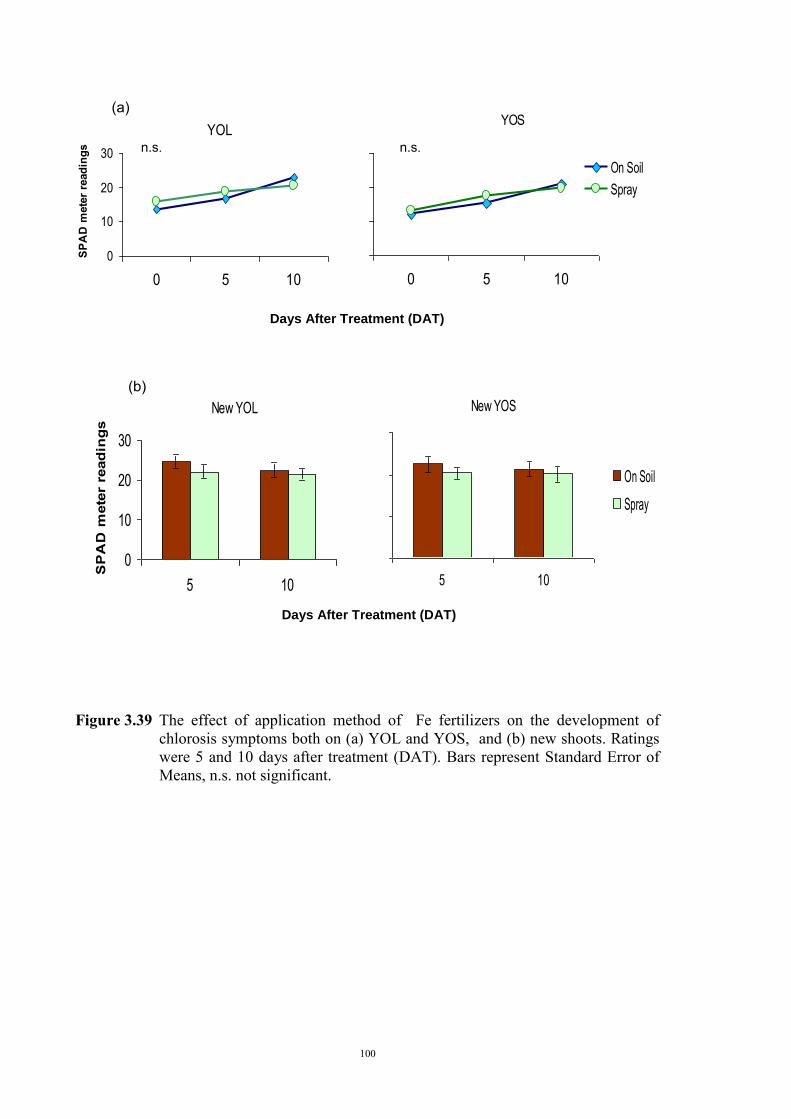
100
Figure 3.39 The effect of application method of Fe fertilizers on the development of
chlorosis symptoms both on (a) YOL and YOS, and (b) new shoots. Ratings were 5 and 10 days after treatment (DAT). Bars represent Standard Error of Means, n.s. not significant.
YOL
0
10
20
30
0 5 10
SP
AD
mete
r re
ad
ing
s
YOS
0 5 10
On Soil
Spray
Days After Treatment (DAT)
n.s. n.s.
(a)
New YOL
0
10
20
30
5 10
SP
AD
mete
r re
ad
ing
s
New YOS
5 10
On Soil
Spray
Days After Treatment (DAT)
(b)
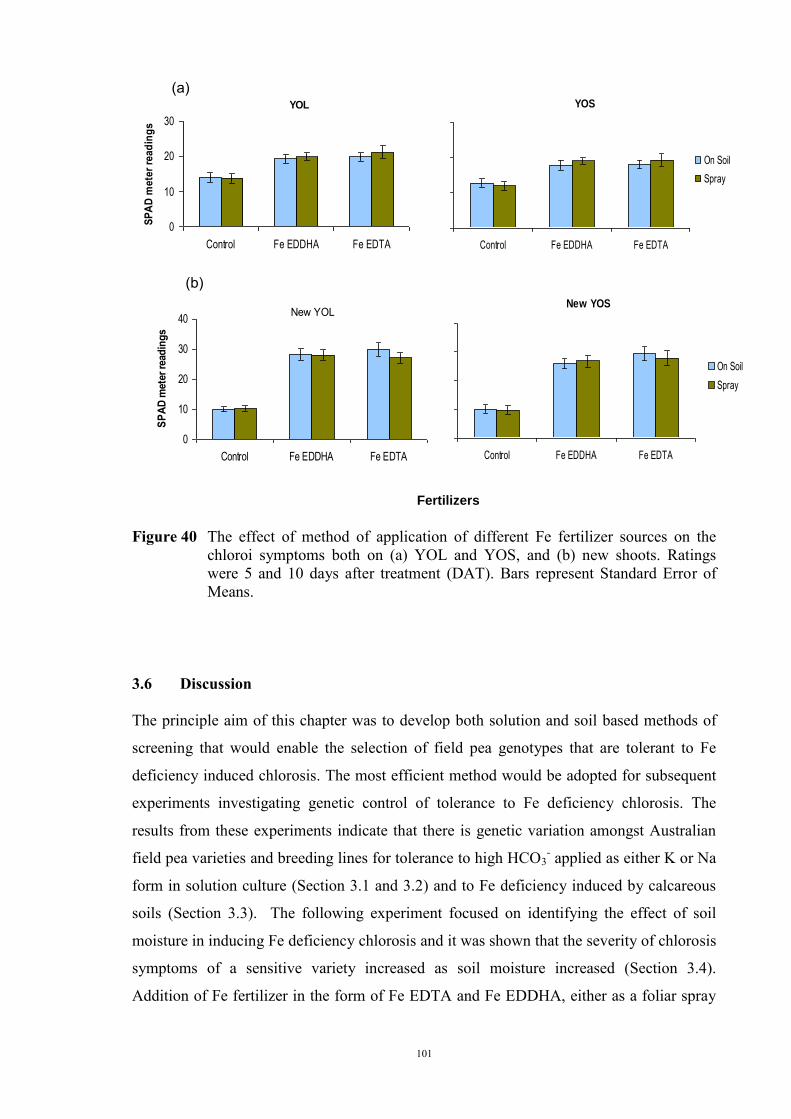
101
Figure 3.40 The effect of method of application of different Fe fertilizer sources on the chlorosis symptoms both on (a) YOL and
YOS, and (b) new shoots. Ratings were 5 and 10 days after treatment (DAT). Bars represent Standard Error of Means, n.s. not significant.
Figure 40 The effect of method of application of different Fe fertilizer sources on the
chloroi symptoms both on (a) YOL and YOS, and (b) new shoots. Ratings were 5 and 10 days after treatment (DAT). Bars represent Standard Error of Means.
3.6 Discussion
The principle aim of this chapter was to develop both solution and soil based methods of
screening that would enable the selection of field pea genotypes that are tolerant to Fe
deficiency induced chlorosis. The most efficient method would be adopted for subsequent
experiments investigating genetic control of tolerance to Fe deficiency chlorosis. The
results from these experiments indicate that there is genetic variation amongst Australian
field pea varieties and breeding lines for tolerance to high HCO3- applied as either K or Na
form in solution culture (Section 3.1 and 3.2) and to Fe deficiency induced by calcareous
soils (Section 3.3). The following experiment focused on identifying the effect of soil
moisture in inducing Fe deficiency chlorosis and it was shown that the severity of chlorosis
symptoms of a sensitive variety increased as soil moisture increased (Section 3.4).
Addition of Fe fertilizer in the form of Fe EDTA and Fe EDDHA, either as a foliar spray
YOL
0
10
20
30
Control Fe EDDHA Fe EDTA
SP
AD
me
ter
rea
din
gs
YOS
Control Fe EDDHA Fe EDTA
On Soil
Spray
Fertilizers
(a)
New YOL
0
10
20
30
40
Control Fe EDDHA Fe EDTA
SP
AD
met
er r
ead
ing
s
New YOS
Control Fe EDDHA Fe EDTA
On Soil
Spray
Fertilizers
(b)
102
or applied to soil, alleviated the chlorosis symptom and thus confirmed that the chlorosis
was due to Fe deficiency (Section 3.5).
The experiments utilised a SPAD-502 meter to estimate chlorophyll content as an indicator
of Fe deficiency chlorosis rather than visual assessment of leaf greenness or in-vitro
chlorophyll estimation. Estimating chlorosis scores using visual assessment is more
subjective and less accurately quantified. Similarly, the use of in-vitro measurement by
extracting the chlorophyll, followed by spectrophotometric measurement, is destructive
and time consuming and would not be suitable for the number of plants that would need to
be assessed in later genetic studies, or for selection for Fe efficiency in a breeding
program. A SPAD meter has been widely used to measure the leaf greenness of many plant
species, including corn (Dwyer et al., 1991), wheat (Reeves et al., 1993) and sweet pepper
(Madeira et al., 2003). In legumes, SPAD values have been positively correlated with
extractable chlorophyll content of green bean (P. vulgaris) (Mazza and Oomah, 1994,
Madeira et al., 2000) and soybean (G. max) (Monje and Bugbee, 1992), mungbean
(Srivines et al., 2010) and peanut (Gao and Shi, 2007). These reports of a correlation
between extractable chlorophyll and SPAD values for a number of crops indicates that a
SPAD meter is appropriate to score Fe deficiency chlorosis of field pea.
The responses of genotypes to both NaHCO3 and KHCO3 treatments with respect to
chlorosis symptoms or growth were similar (Section 3.2 and 3.3). However, the degree of
severity differed between treatments. Peas grown in solution culture containing NaHCO3
were less chlorotic (Fig. 3.1-3.3) but growth was more depressed (Fig. 3.4-3.6) than for
peas in the KHCO3 (Fig. 3.10-3.16). The root/shoot ratio was higher when peas were
grown in NaHCO3 treatment than in KHCO3 treatment (Fig. 3.4-3.6; Fig. 3.14-3.15). A
response similar to that observed in NaHCO3, where plants might not express chlorotic
symptoms but simply a reduction of leaf and root growth has been reported for other plant
species (Kosergaten, 1998; Bertoni et al., 1992). Some degree of necrosis was observed in
plants grown in high concentration of NaHCO3, possibly due to Na toxicity. Norvell and
Adams (2006) proposed using Mg(HCO3)2, rather than NaHCO3, for screening for
resistance to the deficiency chlorosis to prevent the possibility of specific Na toxicity in
sensitive plants. They reported identical rankings of three soybean cultivars in both
NaHCO3 and Mg(HCO3)2. It would therefore appear that a number of HCO3- solutions are
suitable for screening for Fe chlorosis tolerance. On the basis of the results reported in this
chapter, it might be proposed that the use of KHCO3 to induce chlorosis of peas is more
103
reliable than NaHCO3, as a screening method, as this form of HCO3- produced greater
chlorosis symptoms but no necrosis and this is more practical to use as an indicator of
tolerance than that of depressed growth, particularly when selecting single plants as in an
F2 population. Some studies showed that high amounts of K can inhibit the Fe uptake
ability of plants, and therefore KHCO3 has been used in some studies for screening Fe
chlorosis tolerance in order to induce Fe deficiency chlorosis (Çelik et al., 2011; Çelik &
Katkat, 2007).
The application of 5 mM of both NaHCO3 and KHCO3 to solution culture was able to
discriminate between Fe deficiency tolerant and sensitive genotypes, however, a 10 mM
treatment resulted in greater separation between groups (Fig. 3.11). The use of 15 mM
severely affected some genotypes and even produced necrosis, especially the NaHCO3
treatment. However, statistical analysis indicated that application of 15 mM and 10 mM of
both forms of HCO3- were not significantly different for chlorosis scores and root/shoot
ratio (Fig. 3.1, Fig. 3.4, Fig. 3.13). Therefore, for screening Fe deficiency tolerance of peas
in a breeding program, 10 mM HCO3- concentration would be better than 15 mM,
particularly if tolerant plants were to be retained. It should be recognized that this set of
experiments tested a relatively limited range of germplasm and 10 mM was the most
appropriate treatment to maximise discrimination among this material. If additional
screening identified higher levels of tolerance than observed in Santi, a higher HCO3-
treatment might be appropriate to identify breeding lines carrying this level of tolerance.
Genotypes which had low SPAD meter readings (i.e. a high level of chlorosis) tended to
have a high root/shoot ratio, particularly under NaHCO3 treatments. A similar response
was reported by Zribi and Gharsalli (2002) in a comparison of two field pea cultivars. The
use of 10 mM NaHCO3 as a treatment to study the effect of HCO3- on root growth might be
preferable to 15 mM because there was no difference in the root/shoot ratios between the
two treatments but plants grown in 10 mM NaHCO3 were less affected by Fe deficiency
chlorosis that those at 15 mM. As the correlation between chlorosis scores and root/shoot
ratio was significant, root/shoot ratio might be a suitable parameter to measure to support
identification of Fe deficiency of peas.
The reactions of Parafield and Santi were consistent in every test. Parafield, which has
conventional leaves, was susceptible in both HCO3- treatments, while Santi, which is semi-
leafless, was tolerant (Fig. 3.2-3.3; Fig. 3.11-3.12). Therefore, these two genotypes were
104
selected to be controls to be included in every experiment, and as the major parents for
genetic studies (Chapter 5). The response of a number of other genotypes was also
consistent between tests (Fig. 3.7, Fig. 3.11, and Fig. 3.12). Px-89-82-1, which is a
conventional-leaf type, was tolerant in 10 mM HCO3- treatment and was not significantly
different to Santi. Px-96-83-1-1, which is semi-leafless, and Px-97-9-4 which is a
conventional leaf type were sensitive to the KHCO3 treatment. This finding indicated that
the difference in reaction observed between Santi and Parafield was unlikely due to leaf
type. However, the general nature of semi-leafless peas was to have greener stipules than
the conventional leaf peas in the absence of HCO3-, therefore the final SPAD meter
readings in the presence of HCO3- might be higher as the baseline score was higher (Fig.
3.12). This could lead to the assumption that semi-leafless types were more tolerant.
Calculating the differences of the SPAD meter reading from the baseline (i.e. before
chlorosis is initially expressed) to the peak of the chlorosis symptoms would give a clearer
indication of the degree of tolerances amongst genotypes without the confounding effect of
leaf type. The relationship between tolerance to Fe deficiency chlorosis and plant
morphology is investigated further in the genetic studies reported in Chapter 5.
The concentration of some nutrients in seeds has been shown to affect subsequent plant
growth and also to influence the ranking of genotypes when tested for nutrient efficiency,
eg. Zn in navy bean (Cichy et al., 2005), Zn in dry beans (House et al., 2002), Mn in barley
(Longnecker et al., 1991) and B in mung bean (Bell, 1991). The Fe concentration in seeds
that were sown for Experiment 3 was similar amongst 15 accessions that varied
significantly for tolerance to Fe deficiency (Fig. 3.8). Thus seed Fe status was not
correlated to the expression of Fe deficiency chlorosis when grown in a high concentration
of HCO3- and the variation in expression of Fe chlorosis could not be attributed to seed
reserves of Fe. The same result was reported by Saxena et al. (1971), who concluded that
Fe in the seeds, which is generally sufficient to produce healthy green seedlings, can be
immobilised by the high pH of the surrounding medium and thereby induce deficiency
symptoms.
Genotypes responded similarly in soil and solution culture (Section 3.3). Chlorosis
symptoms indicative of Fe deficiency, were induced in plants grown in Wangary and
Millicent soils and were most severe for the variety Parafield (Fig. 3.19). The reaction of
genotypes tested on the soils was consistent to the results on the solution screening
methods; where Parafield, Glenroy, and Santi showed susceptible, moderately tolerant and
105
tolerant reactions, respectively (Fig. 3.2, Fig. 3.11, and Fig. 3.17). The only major
difference between the two growth systems was that chlorosis symptoms were expressed 1-
2 weeks earlier in solution culture (Fig. 3.9 and Fig. 3.17). This might be because the
overall nutrient supply was better and plants grew faster. As a result, the sensitive stage of
the plants appeared earlier.
The Millicent soil was adopted for further screening, instead of the Wangary soil, due to
the contrast in reaction of genotypes when grown on the two soils. Rating plants on the
basis of chlorosis symptom would be easier and more practical than that of measuring plant
growth, as was the case for nutrient solution screening. The major symptom of plants
grown on the Wangary soil was stunned growth, while plants grown in the Millicent soil
were chlorotic but otherwise well grown (Fig. 3.17 and Fig. 3.19). Field peas vary in plant
height with tall and dwarf types with the difference due to the length of the internode and
controlled by a single gene (recognized by Mendel). Both types were included in the
germplasm tested, eg. Parafield is tall, while Santi is a dwarf (see Plate 3.5). With such
major differences in plant growth under optimal conditions, plant vigour or biomass would
not be an appropriate trait to use for classifying tolerance to Fe deficiency chlorosis,
particularly in populations that segregate for this trait. Tissue analysis of plants grown in
all soils indicated that there was likely to be a number of nutritional toxicities and
deficiencies associated with the Wangary soil (eg. B toxicity, salinity, P and Zn deficiency)
and these could all have a confounding effect on expression of Fe deficiency and may in
fact be the major contributors to the stunted growth of plants in this soil. The
concentrations of all micronutrients in leaves and/or stipules of plants grown in Millicent
soil were in the adequate range.
The total Fe concentration of YOS of plants grown in Wangary and Millicent soils was
lower than that for plants grown in the other soils. In addition, the Fe deficiency symptoms
of plants occurred on plants grown in the Millicent and Wangary soils, therefore these soils
could be considered as a contributing factor to the plants having a low total Fe (Fig. 3.19).
However, the total Fe concentration of plants grown in all soils was not in the critical range
as reported by Reuter and Robinson (1997). On the basis of this result, Santi, which had
the same Fe concentration as that of Parafield, was more efficient as this genotype showed
less chlorosis.
106
The concentration of Fe in YOS of Santi (efficient) was the same as Parafield (inefficient)
(Fig. 3.19) and this indicates that the variation in reaction between the two genotypes is not
due to the concentration of Total Fe in shoots. In addition, the concentration of total Fe was
slightly higher in the YOS than the 3rd YOS (Fig. 3.21) but chlorosis symptoms were more
severe on the YOS than 3rd YOS (Fig. 3.19). This suggests that the chlorosis symptoms
are not due to lack of Fe in the young leaves and stipules. The physiological basis of Fe
efficiency is investigated further in Chapter 4.
The higher level of soil water content induced more severe chlorosis symptoms of
Parafield on Millicent soil (Fig. 3.36). Waterlogging is one of the main causes of chlorosis
symptoms of most crops, including Fe deficiency chlorosis on cool food legumes,
including chickpea (Saxena et al., 1990) and lentils (Erskine et al., 1993) and also for
soybeans (Coulombe et al., 1984). The effect of waterlogging on Fe nutrition of plants has
been attributed by some researchers to the passage of CO2 out of the soil being physically
blocked, and the build up of CO2 in the soil solution leads to the formation of bicarbonate
ions. This increases soil pH, which in turn increases the concentration of bicarbonate and
alkalinity in the leaf tissues. Under these conditions, Fe becomes unavailable, and active
Fe is converted to the inactive forms (Brown et al., 1960; Mengel et al; 1984; and Lucena,
2000).
Fe chelates, both as foliar spray and soil application, were able to correct chlorosis
symptoms of field peas. Shoots of treated plants, and in particular new growth of treated
plants, recovered whereas leaves of untreated plants remained chlorotic and severe
symptoms developed on new growth (Fig. 3.38 - 3.40). This demonstrated that the
chlorosis symptoms were likely due to Fe deficiency. Fe EDTA and Fe EDDHA applied
to rye grass (Lolium perenne, L) grown in pots containing Wangary soil, produced similar
increases in total Fe of leaves (Andreu et al., 1991). Application of Fe fertilizer was also
successful in reducing Fe deficiency symptoms and increasing chlorophyll concentration
on soybeans (Heitholt et al., 2003) and sunflower (Fernandez et al., 2004). In this
experiment, some Fe-phytotoxicity of several plants treated with both fertilizers, either as
spray or in soil, occurred three days after the treatments. This might be due to the
concentration of Fe being too high. Leaf burn and defoliation induced by Fe-
phytotoxicity has frequently been reported, particularly when the concentration of Fe is
high (Troeh and Thomson, 2005). Further experimentation would be required to identify
the most appropriate method of application, type and concentration of product, and timing
107
of application if the objective of the project was to overcome the Fe deficiency chlorosis
through fertilization. However, the major objective of this fertilizer experiment was to
confirm that the chlorosis symptoms were due to Fe deficiency, while the remainder of the
project undertakes studies that will contribute to a genetic solution to the problem.
In conclusion, the experiments described in this chapter have clearly identified genetic
variation in tolerance to Fe deficiency induced chlorosis of field peas. The variety Parafield
was consistently sensitive while Santi was tolerant in both soil and solution culture with
added HCO3-. Optimal conditions have been identified for screening further germplasm,
for investigation of the physiological basis of tolerance and also for genetic studies.
The Millicent soil is considered most appropriate for soil based screening due to severity of
symptoms expressed by Parafield and the generally well balanced profile with respect to
other nutrients. Maintaining high soil moisture content resulted in maximum expression of
symptoms and differentiation between genotypes and this is consistent with many other
reports, and also with field observation in the Millicent district (W. Hawthorne; J. Paull
pers comm.). Both HCO3- treatments in solution culture were able to induce chlorosis and
differentiate between genotypes but KHCO3 was considered more appropriate to use for
screening due to less necrosis than observed with NaHCO3.
There was no difference among genotypes in the concentration of total Fe in the youngest
stipules, and the variation in response was not attributable to variation in seed reserves of
Fe. The mechanism(s) and genetic control of tolerance are reported in Chapter 4 and 5,
respectively.

108
109
CHAPTER 4
Investigations into the physiological basis for Fe efficiency in field peas 4.1 Introduction
The most obvious symptom of Fe deficiency in plants is chlorosis on shoot tips and is most
prevalent on high pH and calcareous soils in arid regions (Abadia et al., 1989; Lindsay,
1995; Lucena et al., 2007). One analytical technique which is commonly used to observe
Fe deficiency of plants is measuring Fe concentration in leaves. It is well known that
leaves from Fe deficient plants frequently have a concentration of total Fe similar to those
of Fe sufficient leaves when those were collected from the field (Abadia, 1992). In many
cases total Fe in chlorotic plants is even higher than that in normal, green plants (Terry and
Abadia, 1986; Mengel and Geurtzen, 1988), and this is called the chlorosis paradox
(Abadia and Morales, 1998). Therefore, it has been proposed that the concentration of
active Fe in leaves might be a better indicator of Fe nutrition than total Fe because of the
positive correlation between active Fe and chlorophyll concentration (Bavaresko et al.,
1992; Nicolic and Kastori, 2000).
In the previous chapter (Chapter 3), the concentration of total Fe in YOS of Parafield
(sensitive cultivar) was not different from that of Santi (tolerant cultivar) although the YOS
of Parafield was severely chlorotic whereas Santi was relatively unaffected when grown in
both Millicent peat and Wangary calcareous soils. In addition, the effect of bicarbonate in
solution culture on chlorosis symptoms of several field pea genotypes was also significant
and sensitive genotypes expressed severe chlorosis. Whilst the experiments in Chapter 3
demonstrated significant and repeatable differences in tolerance to Fe deficiency chlorosis
between genotypes, in both calcareous soil and solution culture, they did not provide
information on the mechanism(s) of tolerance.
A high concentration of bicarbonate in the soil solution is a major factor inducing Fe
deficiency chlorosis in dicotyledoneous species (Römheld, 1987; Zuo and Zhang, 2011).
Field pea, which belongs to Strategy I plants, obtains Fe from the rhizosphere by first
reducing Fe(III) to Fe(II) through the action of membrane-bound Fe(III)-chelate
reductases. Fe reduction is then followed by uptake of Fe(II) into root cells by metal ion
transporters. Reductase and transporter activities are inducible in roots under Fe
deficiency. Furthermore, the roots of Strategy I plants release more protons when Fe
110
deficient, thereby lowering the rhizosphere pH and increasing Fe solubility (Marschner, et
al; 1986; Römheld and Marschner et al., 1986; Lucena et al., 2007). Thus, in this present
study, active Fe and Fe(III) reducing activity induced by bicarbonate were measured to
provide a better understanding of the mechanisms controlling genetic variation in Fe
efficiency as expressed by leaf symptoms.
It can be hypothesised that Fe deficiency chlorosis tolerant field pea genotypes are able to
maintain a higher concentration of active Fe and Fe(III) reducing activity than sensitive
genotypes when subjected to a high concentration of bicarbonate in the growth medium.
The major aims of the experiments undertaken in this chapter were to investigate the
relationship between chlorosis symptoms in field pea and total and active Fe concentration
and the activities of Fe(III) reductase, under Fe deficiency induced by bicarbonate.
4.2 Materials and Methods
4.2.1 Relationship between total and active Fe concentration and chlorosis (Experiment1)
Soils and solution experiments
The growth media in this experiment comprised both soil and solution culture. The
solution culture component adopted the method described in Section 2, Chapter 3, and 10
mM KHCO3 was used to induce Fe deficiency chlorosis. In the soil component, Millicent
peat soil, which induced the most severe chlorosis in soil culture experiments in Chapter 3,
was used and UC soil was included as a control. Pots were watered to 120 % of field
capacity to induce Fe deficiency chlorosis. Both solution and soil preparations, sowing
methods and maintenance of plants were the same as experiments described in Sections 2
and 3 in Chapter 3.
Genetic Materials
Genotypes used were tolerant, intermediate and sensitive selections from the BC1F1 of
Santi/Parafield//Parafield population used in Genetics experiments (Chapter 5). All of
these genotypes had the conventional leaf type, similar to Parafield. In Chapter 5, 220
BC1F1 plants were tested and assigned to three categories (tolerant, intermediate, and
sensitive) based on their expression of Fe deficiency tolerance (SPAD values). Four plants
were randomly selected within each category and transplanted to UC soil to produce seed
to sow in this test. The BC1F1 plants were BC-3, BC-140, BC-91, BC-11 (tolerant), BC-
111
183, BC-14, BC-131, BC-158 (intermediate), and BC-130, BC-17, BC-75, BC-175,
(sensitive), and BC1F2 lines (referred to as BC1 lines) were tested in experiments described
in this Chapter. Parafield and Santi were included as control genotypes.
Experimental Design
Three experiments were undertaken in successive plantings. The experiments aimed to (1)
identify the relationship between active Fe concentration in YOS of the 12 BC1 families
listed above and chlorosis symptoms, (2) identify the concentration of total Fe and other
essential elements in YOS of four BC1 lines (representing two tolerant and two sensitive
BC1 lines) and the relationship to chlorosis symptoms when grown in solution and soil
culture, and (3) identify the relationship between chlorosis symptoms, total Fe, and active
Fe concentration in YOS, 3rd YOS and 5th YOS of four BC1 lines grown in Millicent soil.
a) Identifying active Fe concentration
Twelve BC1 families, Parafield and Santi were grown in pots filled with Millicent soil. The
experiment was arranged as a randomised complete block design with four replications and
three plants in each pot. The degree of chlorosis of the YOS was measured at 42 DAS
using a SPAD-502 meter. Following the measurement, the YOS were harvested and put in
2 ml microcentrifuge tubes and placed in a cooled ice-box to maintain leaf freshness prior
to active Fe extraction.
Active Fe concentration was measured colorimetrically in fresh samples according to Kaur
et al. (1984), with modifications. Approximately 200 mg of the YOS of each sample was
washed three times with Milli-Q water and finely cut with stainless steel scissors, then
allowed to react with 2 ml of 1M HCl in 5 ml vials for 24 hours, with occasional shaking
at room temperature (28 oC). The solutions were pipetted using a 5 ml syringe and filtered
through a 0.45 µm membrane filter, and 750 µl of filtrate was pipetted into a 2 ml tube in
duplicate in separate tests and was buffered with 500 µl of 0.5 M sodium citrate solution to
pH 3. 250 µl of 1.5% O−Phenanthroline solution (O Ph, pH 3) was added to one of the
tubes while 250 µl of distilled water was added to the other to serve as a tissue blank. The
optical density of the sample solution was read against its respective tissue blank at 510 nm
in a photocolorimeter. In the absence of reducing agents, O Ph gives colour only with Fe2+
and not with Fe3+. The concentration of active Fe in the sample was calculated by reading
from a plot of a series of standards from 0 to 100 mM Fe2SO4.7H20.
112
To test for significance of differences for chlorosis symptoms and active Fe concentrations,
analysis of variance (ANOVA) amongst BC1 families was conducted using GenStat Sixth
Edition. The correlation between chlorosis symptom and active Fe concentration was also
calculated.
b) Identifying the concentration of total Fe
BC-175 and BC-17 were used as sensitive, and BC-140 and BC-91 as tolerant BC1
families based on the first cycle of this experiment. These selections were grown in both
solution and soil at the same time in the growth chamber with details of experimental
preparation being as described above. To induce Fe deficiency chlorosis, 10 mM KHCO3
was used in solution culture, and watering to 120 % of field capacity was applied in soil
culture.
The two experiments were arranged as randomised complete block designs with four
replications, four plants in each pot (soil culture) and container (solution culture). The
degree of chlorosis of YOS was measured at 42 DAS (soil culture) and 28 DAT (solution
culture) using a SPAD-502 meter. Following the measurement, the YOS were harvested,
washed three times with Milli-Q water, and oven dried for 48 h. The tissues were analysed
by ICP-AES to determine the concentration of total Fe and other nutrients.
c) Relationship between active Fe and concentration of total Fe
The BC1 families used were the same as the previous experiment, namely BC-175, BC-17,
BC-140 and BC-91. All plants were grown in pots filled with Millicent soil. The
experiment was arranged as a randomised complete block design with four replications and
four plants in each pot.
The degree of chlorosis on YOL, 3rd YOL and 5th YOL was measured at 42 DAS using a
SPAD-502 meter. Following the measurement, the YOL, 3rd YOL and 5th YOL of the four
plants in each pot were harvested and divided into two. One sample was used to determine
active Fe samples, and the other for determining the concentration of total Fe. Both the
active Fe and the concentration of total Fe were measured with the methods described
above and significance of differences was determined by ANOVA (GenStat Sixth
eEdition) .
113
4.2.2 Relationship between Fe(III) reduction and chlorosis (Experiment 2) A solution culture with 10 mM KHCO3, as described above, was used to grow the plants
and induce Fe deficiency chlorosis. Two BC1 families that were consistently tolerant (BC-
140) and sensitive (BC-175) in the previous experiment were used.
Seeds were germinated on germination papers wetted with R.O. water for about 1 week in
the dark to obtain seedlings. The seedlings were transplanted into two 30 L containers
filled with nutrient solution without HCO3- and placed in the growth chamber with day
length and temperature control as detailed in Chapter 3. Plants of each BC1 family were
transplanted into each container.
Seven days after transplanting (DAT) the YOL of five plants of each BC1 family were
measured using a SPAD meter, after which the whole plant was harvested to measure the
rate of Fe(III) reduction in the root. The shoot and root dry weight was also determined.
Following the measurements, the solution was changed and 10 mM KHCO3 was applied to
one container to induce Fe deficiency chlorosis while the other container was untreated as
a control. Further plant measurements and changing of the solutions were undertaken every
4 days until 35 DAT.
The activities of root-associated Fe(III) chelate were quantified using a method modified
from Waters et al. (2002) by the use of spectrophotometric measurement of the purple-
coloured Fe(III)-BPDS complex. The assay solution at pH 6.0 consisted of 0.2 mM CaSO4,
5 mM MES at pH 5.5, 0.1 mM Fe (III)-EDTA and 0.2 mM BPDS (-4,7-diphenyl-1,10-
phenanthroline disulfonic acid (Sigma Chemical Co., St Louis, MO) in distilled water for
measuring Fe(III) reduction. The assay stock solution (50 ml) was dispensed into 100 ml
plastic vessels covered with aluminium foil to ensure a dark environment. After harvesting,
the roots were rinsed quickly (3 s) in Millipore water (>18 MΩ resistivity), and blotted-dry
with tissue towels prior to being submerged individually in the assay solution.
After 60 mins incubation in the dark, at room temperature, the roots were removed from
the assay solution and weighed. An aliquot of the assay solution was filtered through a
0.45 µm membrane filter and absorbance was determined at A535 against blank controls (an
aliquot of identical assay solution containing no roots). The rate of ferric reduction was
calculated as mol Fe (II)-BPDS per gram fresh weight per minute. The molar extinction
coefficient for Fe (II)-BPDS at 535 nm was taken as 22.14 mM-1 cm-1 (Cohen et al., 1997).
114
4.3 Results
4.3.1 Relationship between total and active Fe concentration and chlorosis
(Experiment 1) a) Concentration of active Fe
There was highly significant variation (P<0.01) amongst genotypes in the degree of
chlorosis of the YOS when grown in Millicent soil. The most severe symptoms were
observed in BC-175 while the least severe was observed in BC-3 (Fig, 4.1a). Parafield
developed severe chlorosis, consistent with results in Chapter 3, while Santi was tolerant,
and similar to BC-3. In the UC soil control, there was no difference between Parafield and
Santi for leaf greenness.
There was also significant variation amongst BC1 families for active Fe (P<0.01). The
pattern of active Fe in the YOS of all families was related to their degree of chlorosis
symptoms (Fig. 4.1b). The correlation between chlorosis symptom and active Fe
concentration of YOS was highly significant with r = 0.81 (P<0.01). The lowest
concentration of active Fe was for BC-175 and Parafield, while the highest concentration
occurred for Santi and BC-3. There was no difference in the concentration of active Fe
between Parafield and Santi when grown in the control soil. This finding clearly
demonstrated that there was a strong association between chlorosis symptoms on shoot tips
and low concentration of active Fe.
b) Concentration of total Fe
The reaction with respect to chlorosis symptoms of BC1 families grown in both solution
and soil treatments was similar and consistent with the previous results; BC-17 and 175
were significantly (P<0.01) more chlorotic than BC-91 and 140 (Fig. 4.2a,b). The
relationship between concentration of total Fe and SPAD meter readings was not as clear
as the relationship for active Fe and SPAD readings. BC-17 developed severe chlorosis,
but the concentration of total Fe in YOL was not different to BC-91 and BC-140 in both
soil and solution treatments.

115
Figure 4.1 The responses of BC1F2 lines and parents for (a) SPAD meter readings and
(b) active Fe (mg kg-1), when grown in Millicent soil. The control plants (Parafield and Santi) were grown in nutritionally sufficient UC soil. Bars represent Standard Error of Means
0
10
20
30
40
SP
AD
mete
r re
ad
ing
s
(a)
(b)
0
10
20
30
40
BC
-175
Par
afie
ld
BC
-75
BC
-14
BC
-183
BC
-130
BC
-17
BC
-131
BC
-158
BC
-91
BC
-140
BC
-11
San
ti
BC
-3
Con
trol
(P
)
Con
trol
(S
)
Genotypes
Acti
ve F
e (
mg
kg
-1)
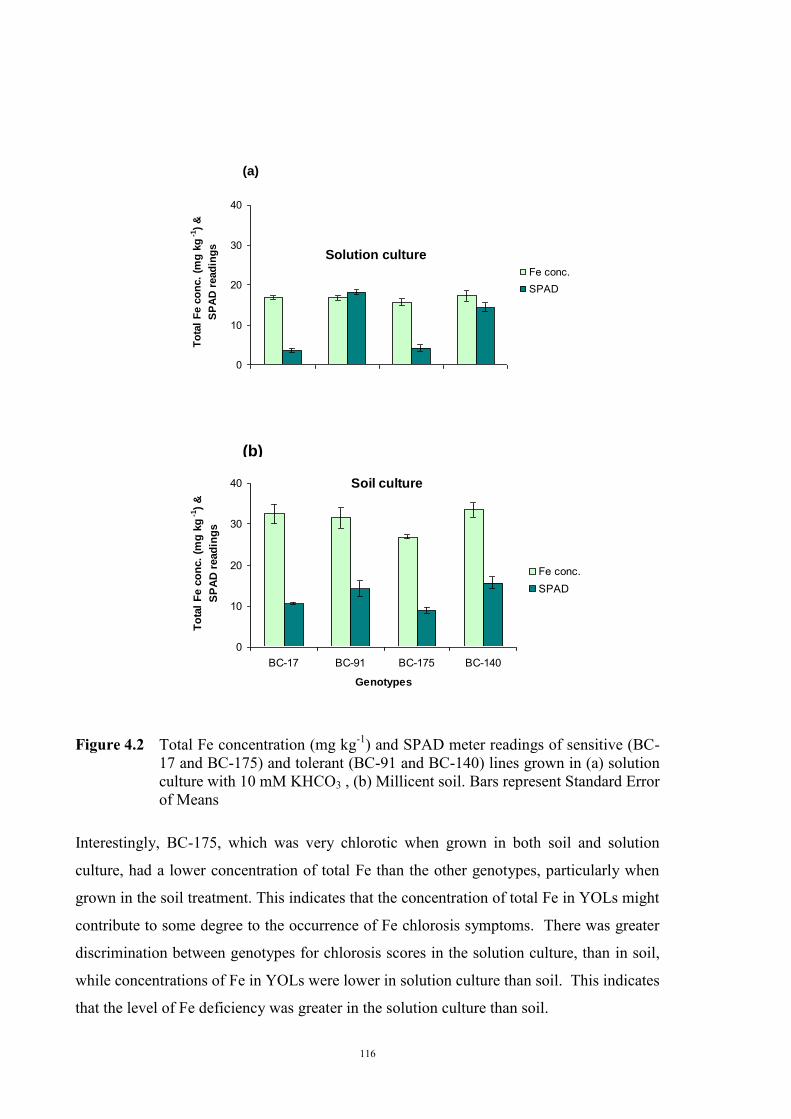
116
Figure 4.2 Total Fe concentration (mg kg-1) and SPAD meter readings of sensitive (BC-
17 and BC-175) and tolerant (BC-91 and BC-140) lines grown in (a) solution culture with 10 mM KHCO3 , (b) Millicent soil. Bars represent Standard Error of Means
Interestingly, BC-175, which was very chlorotic when grown in both soil and solution
culture, had a lower concentration of total Fe than the other genotypes, particularly when
grown in the soil treatment. This indicates that the concentration of total Fe in YOLs might
contribute to some degree to the occurrence of Fe chlorosis symptoms. There was greater
discrimination between genotypes for chlorosis scores in the solution culture, than in soil,
while concentrations of Fe in YOLs were lower in solution culture than soil. This indicates
that the level of Fe deficiency was greater in the solution culture than soil.
(b)
Soil culture
0
10
20
30
40
BC-17 BC-91 BC-175 BC-140
Genotypes
To
tal
Fe c
on
c.
(mg
kg
-1)
&
SP
AD
read
ing
s
Fe conc.SPAD
0
10
20
30
40T
ota
l F
e c
on
c.
(mg
kg
-1)
&
SP
AD
read
ing
s
Fe conc.SPAD
(a)
Solution culture
117
c) Relationship between active Fe and concentration of total Fe
The variation in degree of chlorosis of YOL amongst genotypes confirmed the previous
observation with chlorosis of BC-175 being most severe, followed by BC-17, while BC-91
and BC-140 were less chlorotic (Fig. 4.3a) The pattern of chlorosis of the 3rd YOL was
similar to that of YOL, but there was no variation in level of the greenness in 5th YOL
amongst all families and all leaves remained green. There was no interaction between BC1
families and leaf position for SPAD meter readings (P>0.05).
The concentration of active Fe was related to the greenness of leaves (Fig. 4.3b) and there
was a highly significant correlation between chlorosis symptom and active Fe
concentration across genotypes and leaves with r = 0.86 (P<0.01). The higher SPAD meter
values were associated with higher active Fe concentrations although there was also no
interaction between genotypes and leaf position for active Fe concentration (P>0.05).
Consistent with the result in Section 4.3.1(a), BC-175, which showed the most severe
chlorosis, had the lowest active Fe concentration in its YOL and 3rd YOL, followed by BC-
17, BC-140 and BC-91, respectively. The active Fe concentration in 5th YOL of BC-175
was the highest of the four genotypes, although the difference was not statistically
significant.
There was an inverse relationship between leaf greenness (or chlorosis) and concentration
of total Fe from the tip towards the base of plants (Fig. 4.3a,c). Chlorosis was most severe
in the shoot tip for all genotypes, but the concentration of total Fe was greatest in YOL and
decreased to 3rd YOL and 5th YOL. This demonstrates that Fe deficiency chlorosis was not
due to plants having a lack of total Fe in their shoot tips. The response of BC-175 to this Fe
deficiency treatment was similar to the previous test (Section 4.3.1b), in that this genotype
showed a lower concentration of total Fe in YOL than the other genotypes.
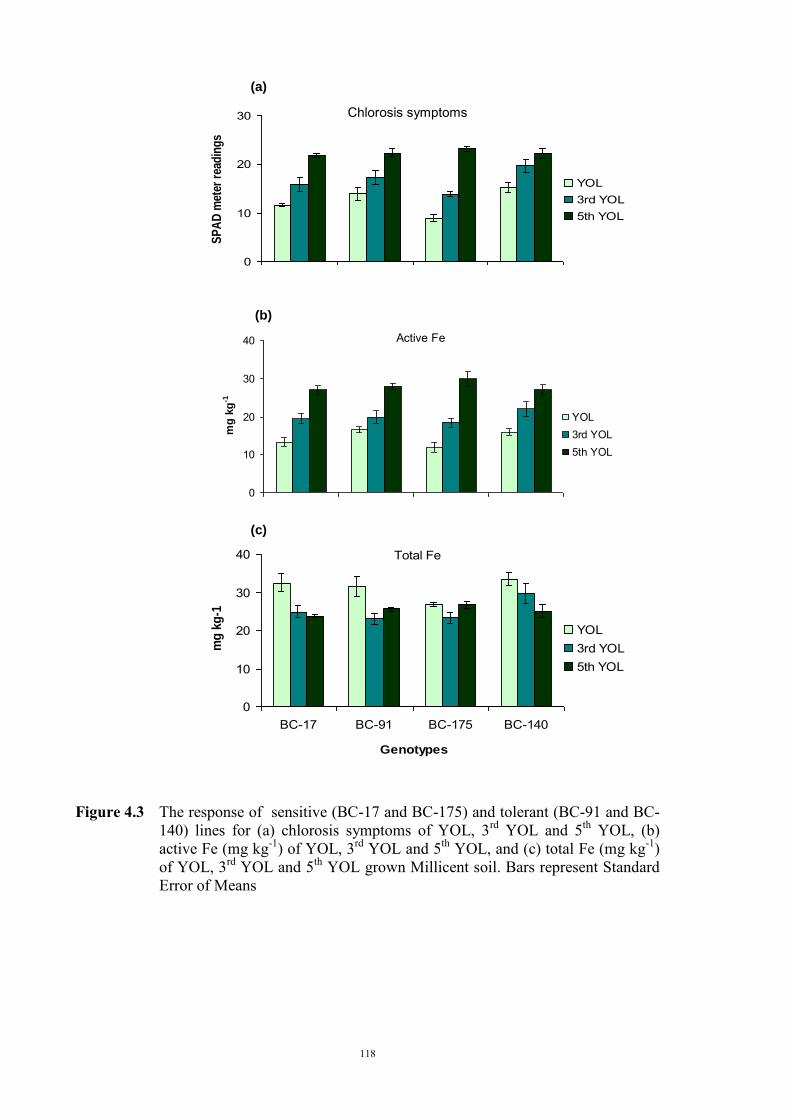
118
Figure 4.3 The response of sensitive (BC-17 and BC-175) and tolerant (BC-91 and BC-
140) lines for (a) chlorosis symptoms of YOL, 3rd YOL and 5th YOL, (b) active Fe (mg kg-1) of YOL, 3rd YOL and 5th YOL, and (c) total Fe (mg kg-1) of YOL, 3rd YOL and 5th YOL grown Millicent soil. Bars represent Standard Error of Means
Active Fe
0
10
20
30
40
mg
kg
-1
YOL3rd YOL5th YOL
(b)
Total Fe
0
10
20
30
40
BC-17 BC-91 BC-175 BC-140
Genotypes
mg
kg
-1
YOL3rd YOL5th YOL
(c)
0
10
20
30
SP
AD
met
er r
ead
ing
s
YOL3rd YOL5th YOL
(a)
Chlorosis symptoms
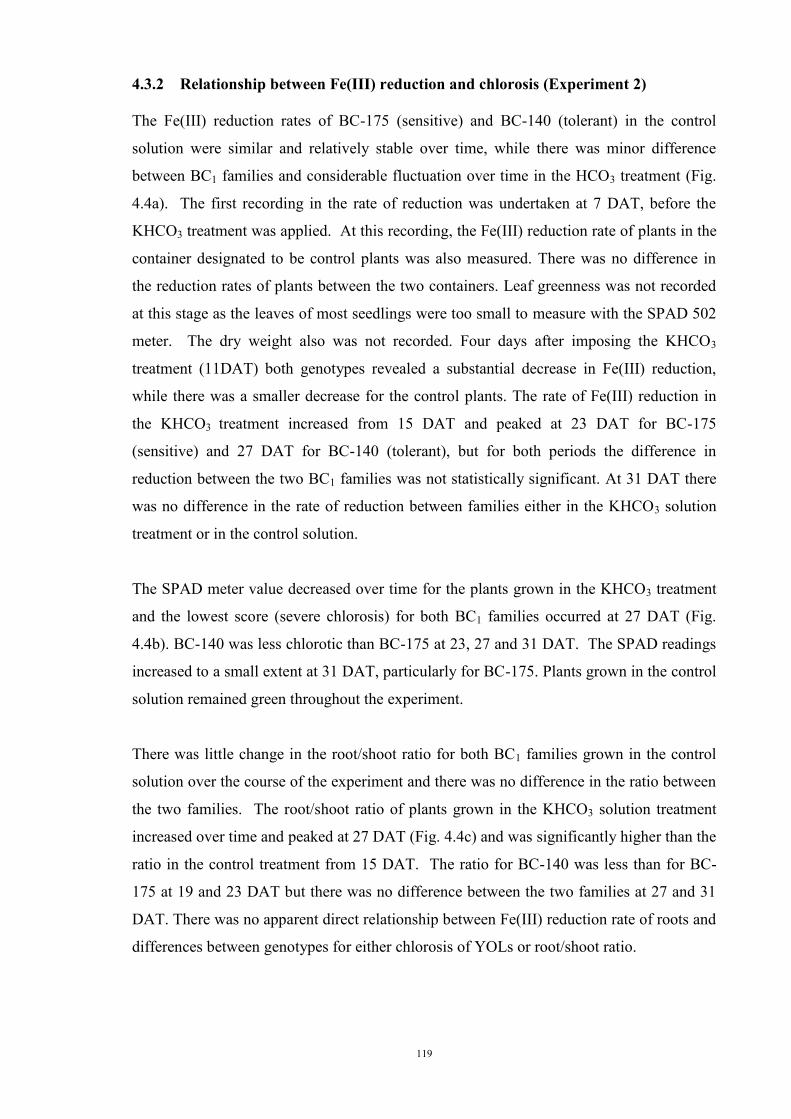
119
4.3.2 Relationship between Fe(III) reduction and chlorosis (Experiment 2) The Fe(III) reduction rates of BC-175 (sensitive) and BC-140 (tolerant) in the control
solution were similar and relatively stable over time, while there was minor difference
between BC1 families and considerable fluctuation over time in the HCO3 treatment (Fig.
4.4a). The first recording in the rate of reduction was undertaken at 7 DAT, before the
KHCO3 treatment was applied. At this recording, the Fe(III) reduction rate of plants in the
container designated to be control plants was also measured. There was no difference in
the reduction rates of plants between the two containers. Leaf greenness was not recorded
at this stage as the leaves of most seedlings were too small to measure with the SPAD 502
meter. The dry weight also was not recorded. Four days after imposing the KHCO3
treatment (11DAT) both genotypes revealed a substantial decrease in Fe(III) reduction,
while there was a smaller decrease for the control plants. The rate of Fe(III) reduction in
the KHCO3 treatment increased from 15 DAT and peaked at 23 DAT for BC-175
(sensitive) and 27 DAT for BC-140 (tolerant), but for both periods the difference in
reduction between the two BC1 families was not statistically significant. At 31 DAT there
was no difference in the rate of reduction between families either in the KHCO3 solution
treatment or in the control solution.
The SPAD meter value decreased over time for the plants grown in the KHCO3 treatment
and the lowest score (severe chlorosis) for both BC1 families occurred at 27 DAT (Fig.
4.4b). BC-140 was less chlorotic than BC-175 at 23, 27 and 31 DAT. The SPAD readings
increased to a small extent at 31 DAT, particularly for BC-175. Plants grown in the control
solution remained green throughout the experiment.
There was little change in the root/shoot ratio for both BC1 families grown in the control
solution over the course of the experiment and there was no difference in the ratio between
the two families. The root/shoot ratio of plants grown in the KHCO3 solution treatment
increased over time and peaked at 27 DAT (Fig. 4.4c) and was significantly higher than the
ratio in the control treatment from 15 DAT. The ratio for BC-140 was less than for BC-
175 at 19 and 23 DAT but there was no difference between the two families at 27 and 31
DAT. There was no apparent direct relationship between Fe(III) reduction rate of roots and
differences between genotypes for either chlorosis of YOLs or root/shoot ratio.
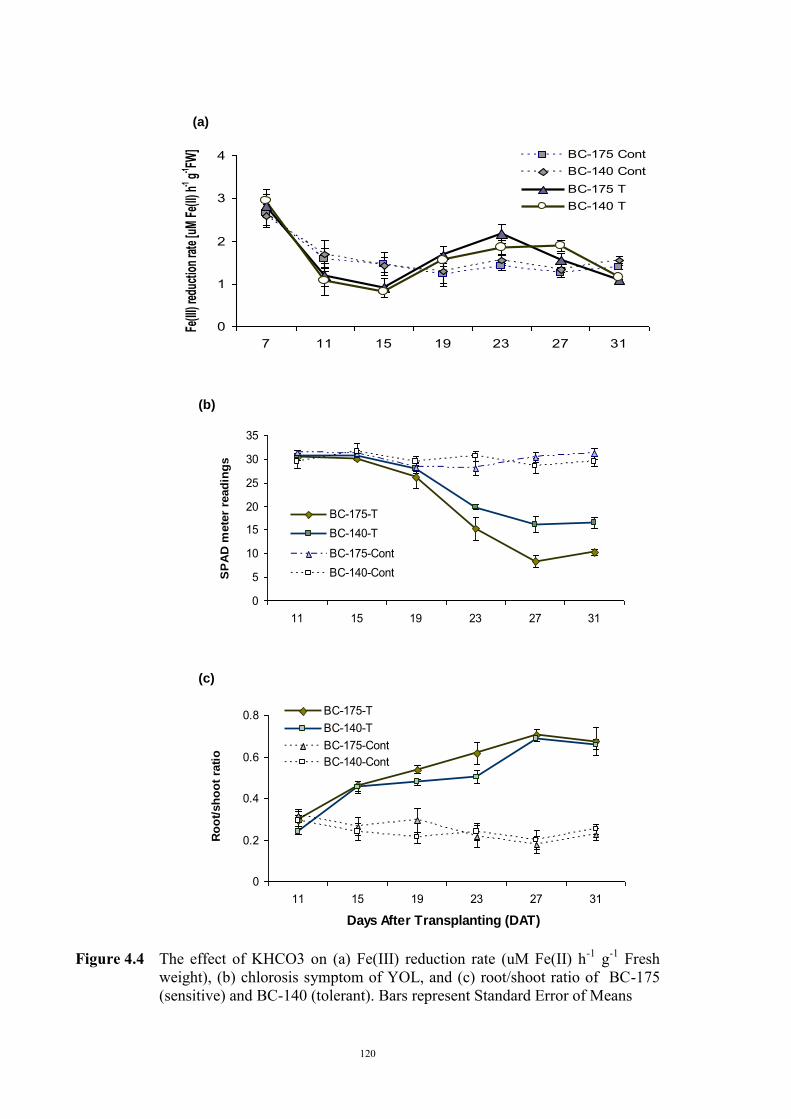
120
Figure 4.4 The effect of KHCO3 on (a) Fe(III) reduction rate (uM Fe(II) h-1 g-1 Fresh
weight), (b) chlorosis symptom of YOL, and (c) root/shoot ratio of BC-175 (sensitive) and BC-140 (tolerant). Bars represent Standard Error of Means
b)
0
5
10
15
20
25
30
35
11 15 19 23 27 31
SP
AD
mete
r re
ad
ing
s
BC-175-TBC-140-T
BC-175-ContBC-140-Cont
0
0.2
0.4
0.6
0.8
11 15 19 23 27 31
Days After Transplanting (DAT)
Ro
ot/
sh
oo
t ra
tio
BC-175-TBC-140-TBC-175-ContBC-140-Cont
0
1
2
3
4
7 11 15 19 23 27 31
Fe(II
I) re
duct
ion
rate
[uM
Fe(
II) h
-1 g
-1FW
] BC-175 ContBC-140 ContBC-175 TBC-140 T
(a)
(b)
(c)
121
4.4 Discussion
The aim of the experiments undertaken in this chapter was to understand the mechanism of
tolerance to Fe deficiency induced chlorosis and in particular variation between tolerant
and sensitive lines. The genetic material used in this investigation consisted of backcross
derived lines that contrasted in tolerance to Fe deficiency chlorosis, but all lines were the
conventional leaf type (See Chapter 5). Using all plants with the same leaf morphology
eliminated the possibility of confounding effects of comparing a young leaf or a stipule
from a plant with conventional leaves (e.g. Parafield) with a young stipule from a semi-
leafless plant (e.g. Santi), although preliminary results obtained in Chapter 3 indicated this
was not likely to be major factor.
A number of mechanisms have been reported to control genetic variation in tolerance to Fe
deficiency chlorosis and in general terms, these include acquisition from soil, transport and
distribution through the plant, and storage and utilization. The most critical process
contributing to genetic variation in tolerance varies between species and also differs
between specific investigations. In the series of experiments undertaken in this study,
there was a highly significant association between active Fe in young shoots and tolerance
to Fe deficiency chlorosis, but there was little or no association between root Fe(III)
reduction or total Fe in young shoots and tolerance.
The Fe concentration in plant parts and seeds was not significantly different in sensitive
lines compared with tolerant lines (as shown in Chapter 3 and in this chapter, Fig, 4.2),
suggesting that variation in uptake of Fe was not a significant factor in contributing to
genotypic variation in tolerance to Fe deficiency. This contrasted to the case of lupins
where var Erregulla (L. cosentinii) was more tolerant, and maintained a higher
concentration of Fe in young leaves, than two sensitive lines of L. angustifolius when
subjected to high soil moisture and CaCO3 treatments (White and Robson, 1989).
There was no difference in the effect of bicarbonate on the root Fe reductase activity
between BC-175 (sensitive) and BC-140 (tolerant), as both lines had similar patterns in the
fluctuation of Fe (III) reduction (Fig. 4.4a). This indicates that the reductase activity did
not appear to be a major factor controlling the efficiency in utilization of Fe in field pea.
However, the effect of bicarbonate on the Fe reduction rate of field pea, compared to the
control treatment, was significant. Reductase appeared to be induced by a period of about 5
– 8 days of KHCO3 treatment. Reductase was initially depressed by the imposition of the
122
KHCO3 treatment, and then increased from about 8 days after treating (i.e. 15 DAT),
peaked at about 16 days after treatment (ie 23 DAT) then decreased (Fig. 4.4a). A similar
effect has been observed for several other species. In peanut, reductase activity was
significantly induced by a period of about 6 days of Fe deficiency stress, and particularly
for Fe deficiency tolerant lines (Gao and Shi 2007). In contrast to the observation with
field pea, variation in reductase activity was the major mechanism controlling variation in
Fe efficiency in peanuts and 9 lines could be classified as either tolerant (5 lines) or
sensitive (4 lines) (Gao and Shi 2007). It is possible that testing a larger number of
genetically diverse field pea lines might also reveal significant variation in reductase
activity related to Fe efficiency, but this was not the case for Santi and Parafield.
Fluctuation of Fe(III) reducing rate was also reported in peach rootstock after seven days
of bicarbonate treatment (Alcántara et al., 2000). The plants were transplanted from 0 mM
to 10 mM bicarbonate with 2.5 uM Fe and the reduction rate dropped dramatically.
However, a week later the reduction rate increased and the chlorosis symptom recovered
when the level of Fe in the same solution treatment was increased to 100 uM. This might
explain why the chlorosis symptoms of most plants recover at a certain stage of growth
(Alcántara, et al., 2000). In field pea cv. Sparkle, the cyclical responses of reductase
activity induced by an absence of Fe throughout the growth was reported by Grusak et al.,
(1995). The reduction rate of seedlings at the age of 2 weeks was high, reduced during
weeks 2 – 4, increased and peaked at weeks 6 -7, and reduced sharply from weeks 7 – 9,
and dramatically decreased during the seed filling period. The effect of bicarbonate in
inhibition of root reducing capacity has also been reported by several other authors.
Alhendawi (2011) reported that Fe(III) reductase activity of maize seedlings was very low
on the high bicarbonate treatment, while the Fe-reducing activity in root segments of two
cultivars of field pea increased significantly in a low bicarbonate treatment ( Jelali et al.,
2010), however, the mechanism of this inhibition is not totally understood.
The root reduction rate of BC-140 and BC-175 at 23 and 27 DAT was relatively high while
the SPAD value decreased and root/shoot ratio increased (Fig. 4.4 a, b, c). It has been
hypothesised that the relationship between chlorosis and reductase activity involves shoot
to root communication in the regulation of root Fe(III) reductase activity, whereby a signal
from the shoot apex in response to Fe deficiency as expressed by chlorosis is transmitted to
the root where the response of enhanced Fe reductase activity was initiated (Lansberg,
123
1984; Grusak and Pezeshgi, 1996; Li et al., 2000), although the regulation mechanism is
not well understood (Zheng et al., 2003).
Another mechanism that would not seem to be a major factor controlling the difference in
tolerance of pea to Fe deficiency is the rate of excretion of protons in order to lower the pH
of the rhizosphere thereby increasing Fe solubility, although this potential mechanism was
not specifically investigated. As the Fe reductase activity was not significantly different
between tolerant and sensitive BC1 lines and the uptake of Fe and its total concentration in
young tissue was also not different between lines, it would therefore appear that the major
factor controlling genetic variation was not related to acquisition of Fe. Other reasons to
suggest that variation in the release of protons was not a significant factor include: both
lines were grown in the same container which was continuously aerated and therefore
mixed, thus it was not likely that any effect on pH could occur other than in the immediate
root zone. In addition, the container held a large volume, the pH of the solution was
monitored daily to ensure no significant change in pH and the solution was changed every
4 days. In contrast, Fe tolerant genotypes of subterranean clover exuded 3-fold more
protons than sensitive genotypes under conditions of Fe deficiency although there was no
significant difference between these genotypes in Fe(III) reduction (Wei et al., 1997).
The concentration of total Fe did not consistently describe the nutritional condition of
plants in relation to Fe chlorosis symptoms. BC1 lines having low SPAD meter readings
(BC-17 and BC-175) did not necessarily have a lower concentration of total Fe (Fig. 4.2)
when compared to the tolerant lines, BC-91 and BC-140. The observation that there is a
poor correlation between total Fe and leaf chlorophyll content has been reported for a
range of crops, e.g. cotton (Olsen and Brown, 1981), peach (Abadia et al., 1985; Rashid et
al., 1990), and pear (Abadia et al., 1989).
The phenomenon that chlorotic plants have similar, or even higher total Fe than normal
green plants was described as the chlorosis paradox (Abadia, 1992; Morales et al., 1998).
Morales et al., (1988) reported under conditions of Fe deficiency, part of the Fe acquired
from the soil by Ferric chelate reductase is immobilised and accumulated in an inactive
form somewhere in the leaves of Fe deficient plants. This was supported by the fact that
treatments acidifying the leaf apoplast with acid spray in some cases reduce the chlorosis
symptom associated with Fe deficiency (Tagliavini et al., 1995). Although it was stated
that the reasons for the immobilization of Fe are still unknown (Gonzales-Vallejo et al.,
124
2000), it was hypothesized that it could be because of a strong effect of Fe deficiency on
leaf growth, causing nutrient accumulation in the inactive form (Romheld, 2000).
Measuring the active Fe in shoot tips of a range of Fe deficiency tolerant and sensitive
genotypes (Fig, 4.1) clearly demonstrated that there was a strong correlation between
plants showing chlorosis and a low level of active Fe. For example, BC-175 which was
severely chlorotic when grown on Millicent soil contained the lowest active Fe in its YOS,
the same concentration as the sensitive Parafield, whereas active Fe of the tolerant Santi
was high. A low concentration of active Fe in chlorotic tissues has been reported for a
number of plant species, including peach (Koseoglu and Acikgoz, 1995; Rashid et al.,
1990), chickpea (Kaur, et al., 1984), and pear (Abadia et al., 1989). In addition, there was a
clear relationship between chlorosis and active Fe within a plant. Chlorosis was most
severe on youngest leaves and stipules, but leaves and/or stipules at the 5th node from the
top were unaffected. The active Fe followed a similar pattern in sensitive genotypes (Fig.
4.3). On the other hand, the concentration of total Fe was greatest in youngest
leaves/stipules, thus reinforcing the lack of relationship between total Fe and Fe deficiency
chlorosis.
As this observation demonstrated that the mechanism in Fe uptake and its concentration of
field peas in different range of tolerance was not apparently different, it could be another
physiological mechanism that governs the expression of the Fe deficiency response.
Nicotianamine (NA) is thought to have a role in the internal transport of Fe and other
metals (Stephan et al., 1996) and there is evidence that the concentration of NA in the
phloem correlate with internal transport of Fe and other metals (Pich and Scholz, 1996). In
order to advance understanding in the Fe-deficiency response in plants and the role of NA
related to tolerant genotypes, further studies should include quantifying the NA in young
leaf tissues of both tolerant and sensitive genotypes.
This series of experiments has demonstrated that the major mechanism controlling genetic
variation in tolerance to Fe deficiency chlorosis, between field pea cvs. Santi and Parafield,
and derived backcross lines, was not related to acquisition (no difference in root Fe
reductase activity or total Fe concentration in tissues) or distribution (same pattern of
distribution of total Fe from YOL to 5th YOL), but rather the main variation could be
attributed to the tolerant lines being able to maintain a high concentration of active Fe in
young leaves and stipules. It should be recognized that this finding is specific to the
125
germplasm tested (i.e. cvs. Parafield and Santi and backcross derived lines). It is likely that
more detailed studies into the mechanism of Fe tolerance of a diverse set of germplasm
would reveal additional mechanisms, possibly including those associated with acquisition,
that contribute to the Fe efficiency in the field pea genepool. Identification and combining
of alternative mechanisms, for example maintaining high active Fe in leaves and increased
acquisition of Fe, could lead to the development of varieties with a greater level of
tolerance than presently available in field pea varieties.

126
127
CHAPTER 5
Genetics of tolerance to Fe deficiency in the field pea cultivar Santi
5.1 Introduction
In the previous chapter, the Australia field pea cultivar, Santi, consistently showed
tolerance to Fe deficiency chlorosis when tested in both solution culture and calcareous
soil while cv. Parafield was consistently sensitive. The inheritance of Fe deficiency
tolerance of Santi might be able to be used as a model for other pea genotypes, and
possibly for other legumes, especially those in the galegoid clade. There is little
information on the genetic control of Fe tolerance in field peas, although genetic studies
have been undertaken for other food legumes such as chickpea: a single dominant gene
controlling Fe efficiency (Saxena et al., 1990), lentil: a single dominant gene (Ali et al.,
1997), dry bean: dominant gene(s) (Coyne et al., 1982), and soybean: a quantitative
character (Fehr, 1982; Mamidi et al., 2011), mungbean (Vigna radiata (L.) : a major gene
(IR) with dominant effect (Srivines et al., 2010), and also for other non-legume species,
such as oats: a single dominant gene (McDaniel and Brown, 1982), and tomato: nuclear
and extranuclear heredity (Dasgen et al., 2002). Most reports of the genetic control of
tolerance to Fe deficiency are based on F2 phenotypes and only few include testing at the
F3 to identify the genotype of F2 plants. Examples of the latter include two genes
controlling tolerance in dry bean (Coyne et al., 1982) and chickpea (Gumber et al., 1997).
Santi contrasts with Parafield in leaf type (Santi semi-leafless/afila type, Parafield
conventional leaf - dominant), internode length/plant height (Santi short, Parafield tall -
dominant), and flower colour (Santi white, Parafield coloured - dominant). As all of these
plant morphological traits are targets within the Australian field pea breeding program,
information on association with Fe efficiency is important. Observations in Chapter 3
suggested no relationship between leaf type and Fe efficiency, however the definitive test
for independence of traits is to observe segregation in F2 and F3 populations. The backcross
between the F1 hybrid of Parafield x Santi and the sensitive parent Parafield was evaluated
to confirm the results of the F2 and F3 populations.
The backcross between the F1 hybrid of Parafield x Santi and the sensitive parent Parafield
was evaluated to confirm the results of the F2 and F3 populations. Development and
128
evaluation of the backcross population was initially undertaken with the aim of
constructing a genetic map to identify markers linked to genes controlling tolerance to Fe
deficiency chlorosis by utilizing Microsatellite markers-SSRs (simple sequence repeats).
However, very little genetic variation was identified and only three out of 45 primer pairs
produced polymorphisms between the parents. As a consequence, this component of the
project was discontinued. Details of primers tested, and those that revealed
polymorphisms, are presented in Appendix 3.
The aim of the experiments described in this Chapter was to determine the genetic control
of tolerance to Fe deficiency expressed by Santi relative to Parafield. The first experiment
examined the response of the F1 hybrid, in comparison to the parents, in order to provide
information of degree of dominance of the genes conferring tolerance to Fe deficiency. The
segregation patterns of F2, F3, and BC1F1 populations were examined to estimate the
number of genes conferring tolerance to Fe deficiency.
5.2 Materials and Methods
5.2.1 Evaluation of F1 hybrids
Santi and Parafield were crossed, including reciprocal combinations, by hand in a
glasshouse. The reaction of F1 hybrid plants to Fe deficiency chlorosis was compared with
the two parents using a Randomised Complete Block Design with five replicates. Twenty
seeds of each parent and of reciprocal F1 hybrids (four seeds per replicate) were sown in
pots filled with Millicent soil which were placed on benches in a growth chamber. The
day-length and temperature were the same as experiments described in Chapter 3. Soil
was watered to 120% field capacity to induce chlorosis using the same procedure and scale
for rating the chlorosis of stipules as described in Chapter 3. The nutrient concentration of
YOS of the two parents and F1 hybrid of Parafield x Santi was also analysed using ICP
analysis. The reciprocal F1 hybrid (Santi x Parafield) was not included in the nutrient
analysis as there was no difference in the chlorosis scores of the reciprocal hybrids.
The data for response of the F1 hybrid relative to the parents were subjected to analysis of
variance. In addition, an unpaired t-test was used to test the significance of the difference
between reciprocal F1 hybrids and both parents.
129
5.2.2 Evaluation of the F2 population and F2 derived F3 families
120 F2 plants of Parafield x Santi and 96 F2 derived F3 families (10 seeds each) were tested
using the same procedure as above. The F1 hybrid plants were transplanted to UC potting
mix after testing for tolerance to Fe deficiency (Fig. 5.2) and placed in a glasshouse to
produce seed. The F2 derived F3 families were obtained by transplanting F2 plants to UC soil
and placing in a screen house (50% mesh) following screening for Fe deficiency tolerance.
The F3 families were tested to confirm the genotype of F2 plants. The number of F2 and F3
plants/pot in each test was five and there were two pots per F3 family. The parents were
included for both the F2 and F3 evaluation with twenty plants of each parent (4 pots x 5 plants
per pot) in each test. F1 hybrid plants were included in the F2 testing with ten plants of the F1
hybrid of Parafield x Santi. Although all 120 F2 plants were transplanted following
screening, only 96 plants produced sufficient seeds to be tested at the F3. 24 F3 families
produced either unhealthy seeds or less than 10 seeds; therefore these F3 families were
omitted from further testing.
Evaluation of the F2 population
As Santi and Parafield differ in leaf type, plant height and flower colour (Santi: semi-
leafless/afila, short, white flower; Parafield: conventional leaf, tall, coloured flower), the F2
segregation of these traits was analyzed to identify whether tolerance to Fe deficiency
chlorosis was related, genetically or physiologically, to these morphological traits. An
unpaired t-test was used to test the significance of the difference in chlorosis scores between
the two phenotypes of the three morphological traits in the F2 (conventional leaves vs afila,
tall vs short, and colored flower vs white flower). The number of genes controlling these
characteristics was also estimated using Chi-square analysis for testing the goodness of fit of
the observed segregation ratios of the F2 population to the frequencies expected for
monogenic (3 : 1) or digenic (15 : 1) segregation to ensure the population was not skewed.
Two methods were used to estimate the number of genes responsible for Fe deficiency
tolerance in Santi, namely (1) chi-square analysis of observed segregation patterns compared
to the expected ratio for segregation at one and two loci, and (2) comparison of the observed
variance of the F2 population with the variance expected for segregation at one and two loci
(Mather and Jinks, 1977). The first method used arbitrary cut-off points based on the
130
response of the parents and F1 hybrids. The second method was also used because there was
continuous distribution of the F2 population rather than a clear separation into discrete
categories for chi-square analysis. It was recognized that chi-square analysis was strictly not
an appropriate means of statistical analysis for the continuous data and the results should
only be used as a general guide to the probable genetic control.
The expected variance was calculated from the average of the variance components of the
parents and the F1 hybrids. The variance components of the F2 population were partitioned
based on an additive dominance model which was described by Mather and Jinks (1977) as
follows :
VF2 = 1/2 D + 1/4 H + E
Where VF2 is the expected variance of the F2 population
D is the additive component of the variance, defined as d2 for a single locus and (da2 + db
2)
for two loci,
d is the departure of AA from the mid-point (m) of AA and aa for a single locus (Fig. 5.1),
da is the departure of AA from the mid-point of AA and aa, and db is the departure of BB
from the mid-point of BB and bb, for two loci,
H is the dominance component of the variance, defined as h2 for a single locus and (ha2 +
hb2) for two loci,
h is the departure of Aa from the mid point of the homozygotes AA and aa (Fig. 5.1),
ha and hb are the departures from the mid point of the heterozygous genotypes AaBb, AaBB,
AABb and aaBb and the homozygous intermediate aaBB and AAbb.
E is the environmental variance, calculated as :
E = 1/4 VP1 + 1/4 VP2 + 1/2 VF1
Where VP1 and VP2 are the variances of the parents, and
VF1 is the variance of the F1 hybrid
With the assumptions of no linkage and no epistasis, the equation for estimating the expected
variance of an F2 population in the case of one gene segregating is
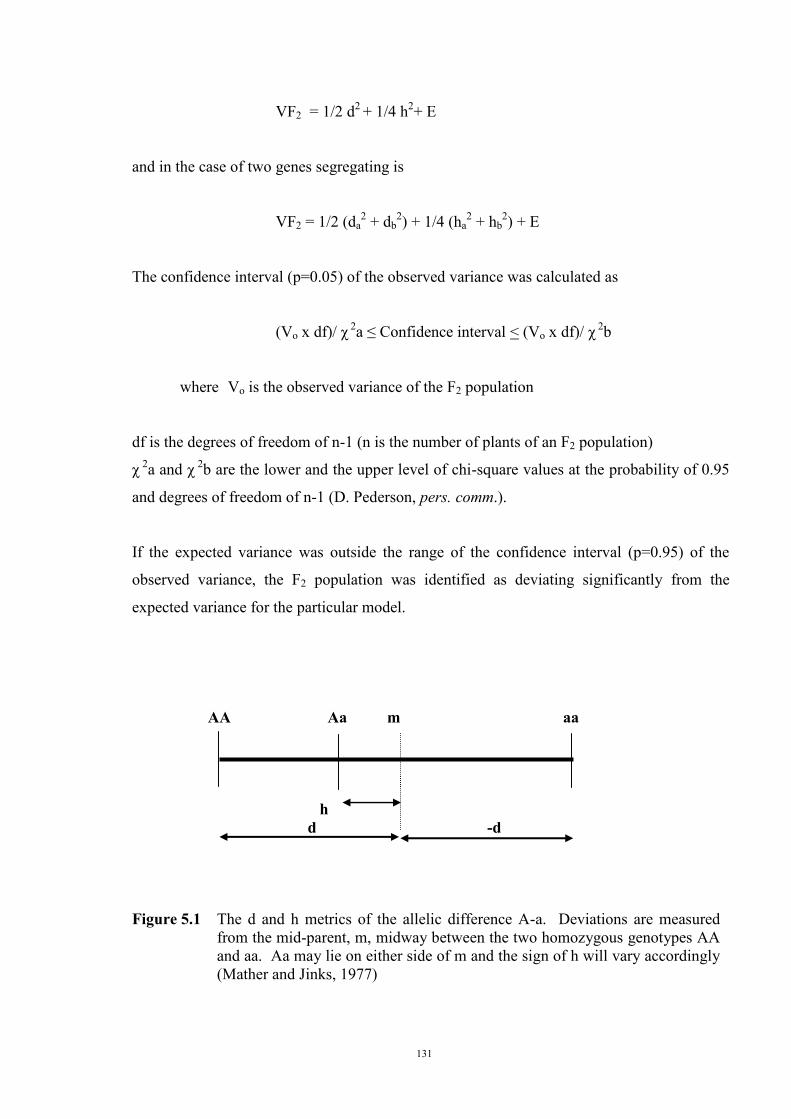
131
VF2 = 1/2 d2 + 1/4 h2+ E
and in the case of two genes segregating is
VF2 = 1/2 (da2 + db
2) + 1/4 (ha2 + hb
2) + E
The confidence interval (p=0.05) of the observed variance was calculated as
(Vo x df)/ χ 2a ≤ Confidence interval < (Vo x df)/ χ 2b
where Vo is the observed variance of the F2 population
df is the degrees of freedom of n-1 (n is the number of plants of an F2 population)
χ 2a and χ 2b are the lower and the upper level of chi-square values at the probability of 0.95
and degrees of freedom of n-1 (D. Pederson, pers. comm.).
If the expected variance was outside the range of the confidence interval (p=0.95) of the
observed variance, the F2 population was identified as deviating significantly from the
expected variance for the particular model.
AA Aa m aa h d -d
Figure 5.1 The d and h metrics of the allelic difference A-a. Deviations are measured from the mid-parent, m, midway between the two homozygous genotypes AA and aa. Aa may lie on either side of m and the sign of h will vary accordingly (Mather and Jinks, 1977)
132
F2 derived F3 population
An alternative method to estimate the number of genes conferring tolerance to Fe deficiency
was by progeny testing at the F3 generation to determine the genotypes of F2 plants. 96 F2
derived families, with 10 plants per family, were tested together with the parents. As there
was a limitation of space, the test was divided into two series, each containing 48 F3 families
and 10 plants of each parent. Five seeds were sown per pot of Millicent soil which was
maintained at 120% field capacity as described in Chapter 3. Therefore, there were 100 pots
in each series. An unpaired t-test was used to test the significance of the difference between
data of the two series of tests, both amongst F3 families and amongst parents. As the test
results were not significantly different, the data of both series were pooled.
The mean and variance of the chlorosis score of each family was compared to those of the
parents. A family was classified as either homozygous sensitive or homozygous tolerant
when the mean and variance of the family were not significantly different from those of the
sensitive or tolerant parent, respectively. The mean of a family was not significantly
different from that of the parent when the mean was within the confidence interval of the
mean of the parent. The confidence interval of the mean of a parent was calculated as
Confidence interval = m ± tα1 x √(Vp x(1/n1 + 1/n2))
where n1 = number of plants within the family,
n2 = number of plants of the parent,
m = mean of the parent,
t α1= t test value at the probability of 0.05/n2 and degree of freedom of (n1 - 1)
+ (n2 - 1).
Vp = variance of the parent (D. Pederson, pers. Com).
When the variance of a family was the same as, or close to the variance of the parents but the
mean of the family was between the sensitive and tolerant parents, the family was classified
as homozygous intermediate, whereas a family with a variance greater than the variance of
the parents was classified as a segregating family. The variance of a family was significantly
different from the two parents when the variance of the family was greater than the LSD of
the parental variances.
The LSD of the parental variances was calculated as :
133
LSD of the parental variances = Vp x F α1
Where Vp = variance of a parent,
Fα1 = F-value at the probability of 0.05/n3 and degrees of freedom of (n1-1),
(n2-1)+(n3-1), where :
n1= number of plants within a family,
n2 and n3 = number of plants within each of the two parents.
(D. Pederson, pers. Com).
Chi-square analysis was used for testing the goodness of fit of the observed segregation
ratios of the F3 families to the frequencies expected for monogenic (1 sensitive : 3
segregating-tolerant, and 1 sensitive : 2 segregating : 1 tolerant) or digenic (1 sensitive : 15
intermediate-tolerant, and 1 homozygous sensitive : 2 homozygous intermediate : 1
homozygous tolerant : 12 segregating) segregation based on the above classification of
families. Narrow sense heritability, h2, was estimated from the F2, F3 regression, with
correction for inbreeding such that h2 = 2/3 b (Smith and Kinman, 1965).
5.2.3 Evaluation of the BC1F1 population
F1 hybrids and the sensitive parent Parafield were crossed, including reciprocal
combinations, by hand in a glasshouse to produce a back-cross (BC1F1) population. All
BC1F1 plants were similar in plant morphology to Parafield (conventional leaf, tall, coloured
flower). The reactions of BC1F1 plants to Fe deficiency chlorosis were compared with those
of the two parents (i.e. F1 hybrids and Parafield) and also Santi. 220 BC1F1 seeds, 15 seeds
of Parafield, 10 seeds of the F1 hybrid and 10 seeds of Santi were sown in pots (five seeds
per pot) filled with Millicent soil which were placed on benches in a growth chamber. Soil
was watered to 120% field capacity to induce chlorosis and rating of chlorosis was conducted
on YOS using a SPAD-meter at 35 DAS. Details of the procedure were the same as
described in Chapter 3. Chi-square analysis was used for testing the goodness of fit of the
observed segregation ratios of the BC1F1 population to the frequencies expected for
monogenic (1 sensitive : 1 intermediate-tolerant) or digenic (1 sensitive : 3 intermediate-
tolerant) segregation. Parafield was the standard for comparison of sensitive plants, while
the F1 hybrid was the standard for the intermediate-tolerant category.
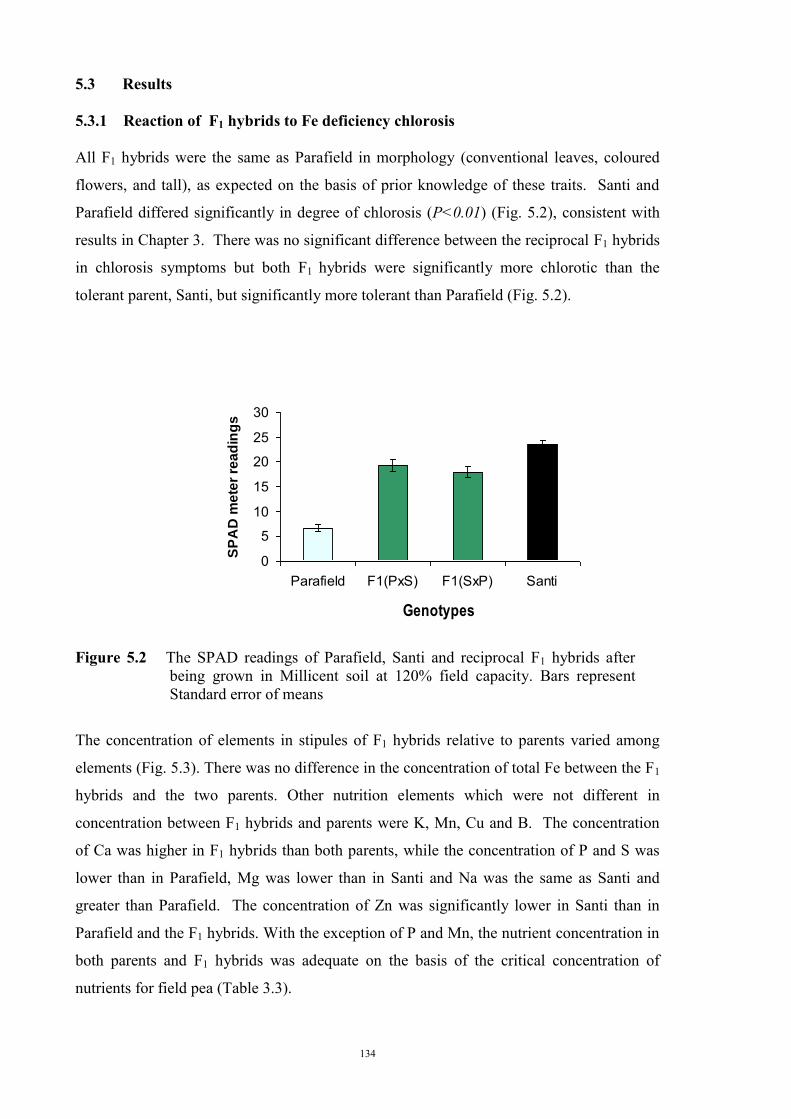
134
5.3 Results
5.3.1 Reaction of F1 hybrids to Fe deficiency chlorosis
All F1 hybrids were the same as Parafield in morphology (conventional leaves, coloured
flowers, and tall), as expected on the basis of prior knowledge of these traits. Santi and
Parafield differed significantly in degree of chlorosis (P<0.01) (Fig. 5.2), consistent with
results in Chapter 3. There was no significant difference between the reciprocal F1 hybrids
in chlorosis symptoms but both F1 hybrids were significantly more chlorotic than the
tolerant parent, Santi, but significantly more tolerant than Parafield (Fig. 5.2).
Figure 5.2 The SPAD readings of Parafield, Santi and reciprocal F1 hybrids after
being grown in Millicent soil at 120% field capacity. Bars represent Standard error of means
The concentration of elements in stipules of F1 hybrids relative to parents varied among
elements (Fig. 5.3). There was no difference in the concentration of total Fe between the F1
hybrids and the two parents. Other nutrition elements which were not different in
concentration between F1 hybrids and parents were K, Mn, Cu and B. The concentration
of Ca was higher in F1 hybrids than both parents, while the concentration of P and S was
lower than in Parafield, Mg was lower than in Santi and Na was the same as Santi and
greater than Parafield. The concentration of Zn was significantly lower in Santi than in
Parafield and the F1 hybrids. With the exception of P and Mn, the nutrient concentration in
both parents and F1 hybrids was adequate on the basis of the critical concentration of
nutrients for field pea (Table 3.3).
0
5
10
15
20
25
30
Parafield F1(PxS) F1(SxP) Santi
Genotypes
SP
AD
me
ter
rea
din
gs
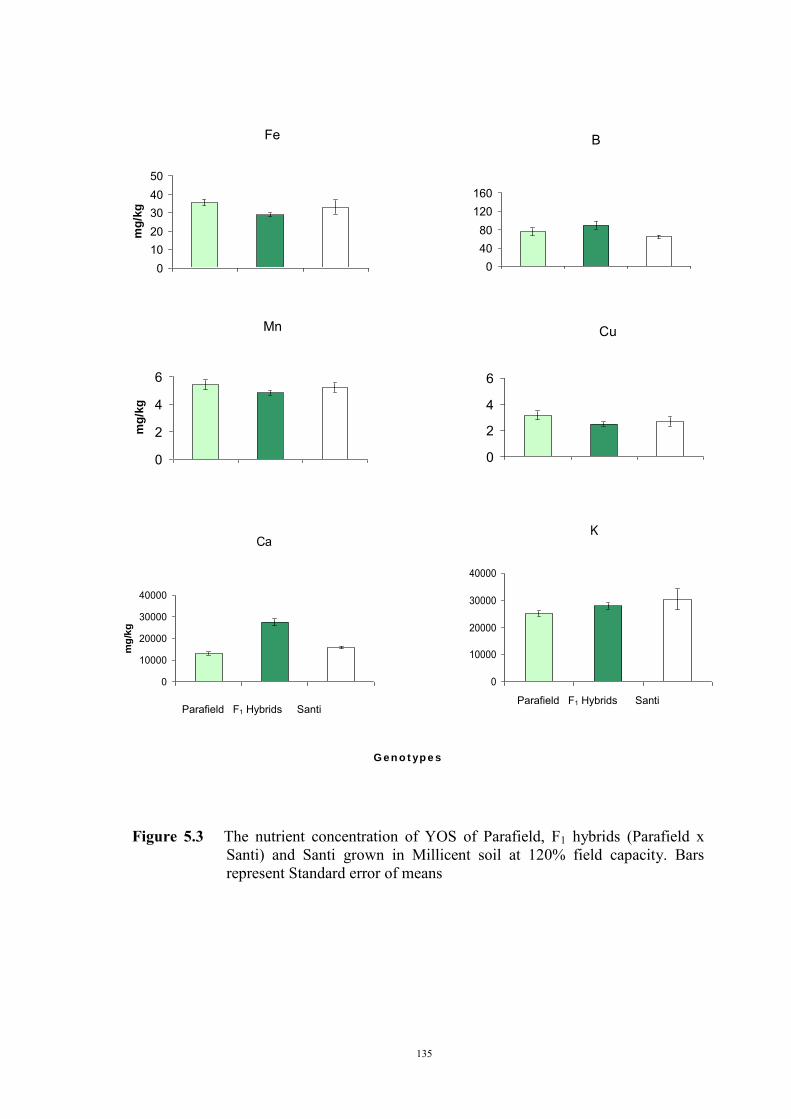
135
Figure 5.3 The nutrient concentration of YOS of Parafield, F1 hybrids (Parafield x
Santi) and Santi grown in Millicent soil at 120% field capacity. Bars represent Standard error of means
G e n o t yp e s
Fe
01020304050
mg
/kg
B
04080
120160
Mn
0
2
4
6
mg
/kg
Cu
0
2
4
6
Ca
0
10000
20000
30000
40000
mg
/kg
K
0
10000
20000
30000
40000
Parafield F1 Hybrids Santi
Parafield F1 Hybrids Santi
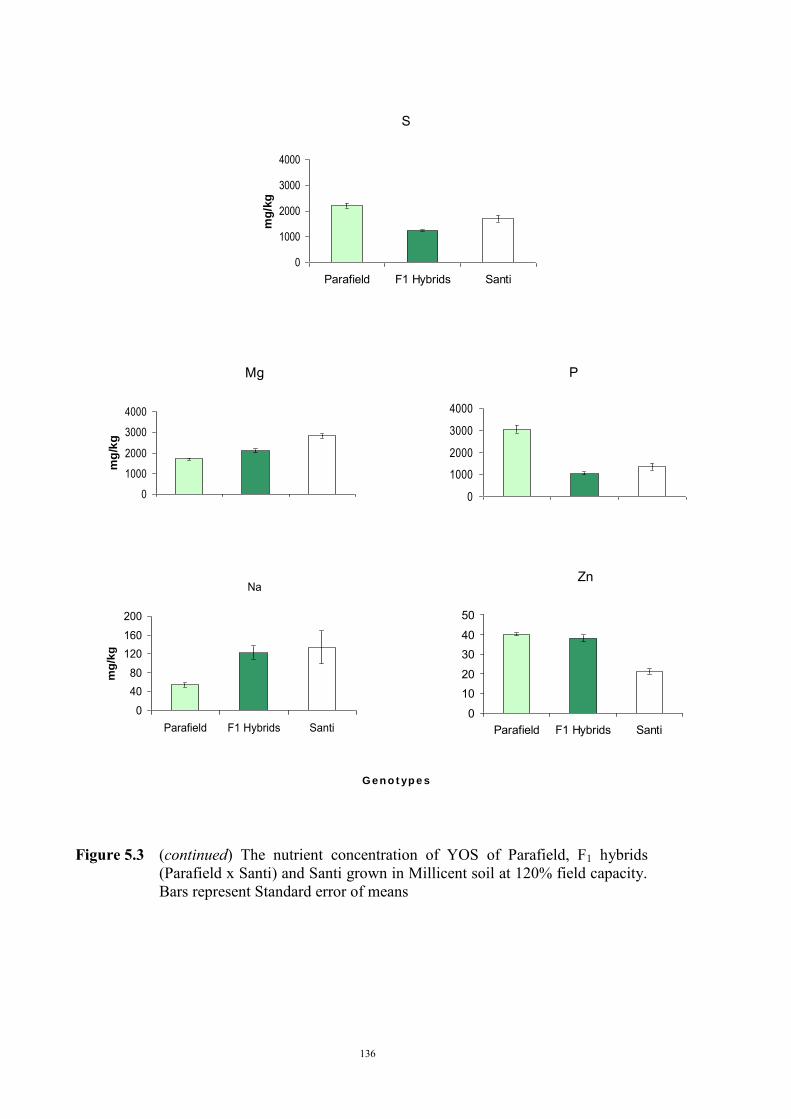
136
Figure 5.3 (continued) The nutrient concentration of YOS of Parafield, F1 hybrids
(Parafield x Santi) and Santi grown in Millicent soil at 120% field capacity. Bars represent Standard error of means
G e n o t yp e s
S
0
1000
2000
3000
4000
Parafield F1 Hybrids Santim
g/k
g
Mg
0
1000
2000
3000
4000
mg
/kg
P
0
1000
2000
3000
4000
Na
0
4080
120160200
Parafield F1 Hybrids Santi
mg
/kg
Zn
0
1020
3040
50
Parafield F1 Hybrids Santi
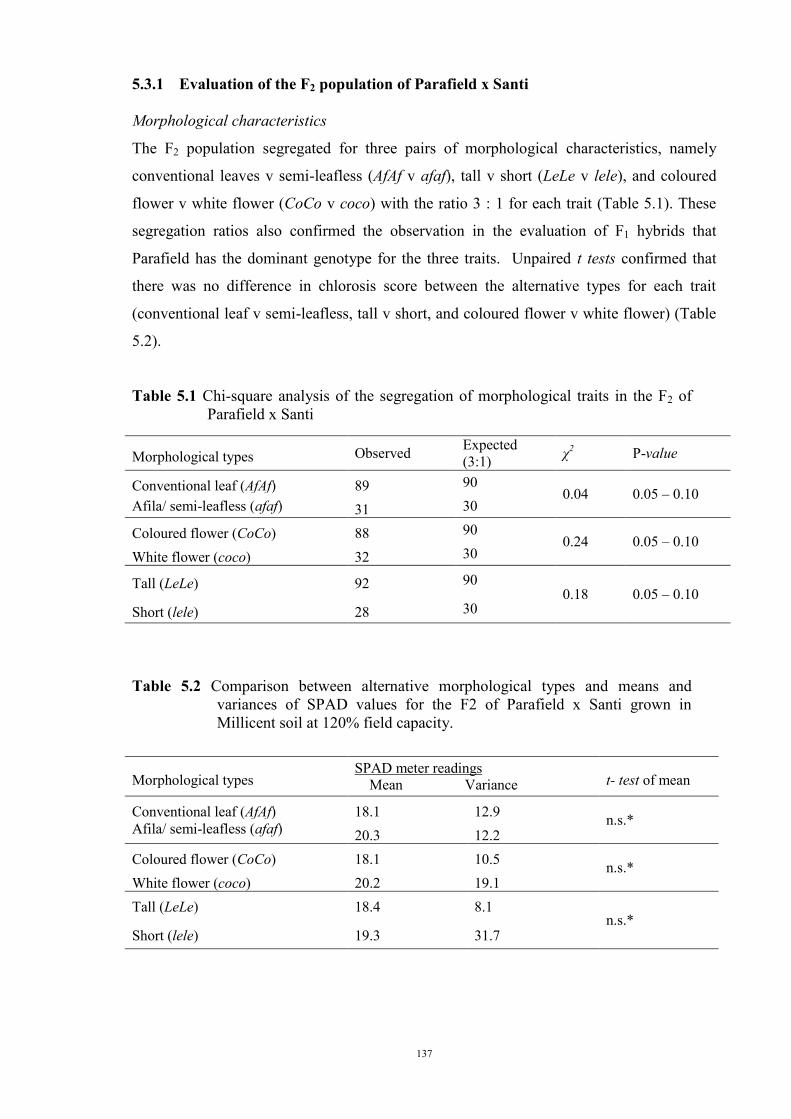
137
5.3.1 Evaluation of the F2 population of Parafield x Santi
Morphological characteristics
The F2 population segregated for three pairs of morphological characteristics, namely
conventional leaves v semi-leafless (AfAf v afaf), tall v short (LeLe v lele), and coloured
flower v white flower (CoCo v coco) with the ratio 3 : 1 for each trait (Table 5.1). These
segregation ratios also confirmed the observation in the evaluation of F1 hybrids that
Parafield has the dominant genotype for the three traits. Unpaired t tests confirmed that
there was no difference in chlorosis score between the alternative types for each trait
(conventional leaf v semi-leafless, tall v short, and coloured flower v white flower) (Table
5.2).
Table 5.1 Chi-square analysis of the segregation of morphological traits in the F2 of Parafield x Santi
Morphological types Observed Expected (3:1) χ2 P-value
Conventional leaf (AfAf) 89
90 0.04 0.05 – 0.10
Afila/ semi-leafless (afaf)
31
30
Coloured flower (CoCo) 88
90 0.24 0.05 – 0.10
White flower (coco) 32
30
Tall (LeLe) 92
90 0.18 0.05 – 0.10
Short (lele) 28
30
Table 5.2 Comparison between alternative morphological types and means and
variances of SPAD values for the F2 of Parafield x Santi grown in Millicent soil at 120% field capacity.
Morphological types SPAD meter readings Mean Variance t- test of mean
Conventional leaf (AfAf) 18.1
12.9
n.s.* Afila/ semi-leafless (afaf)
20.3
12.2
Coloured flower (CoCo) 18.1
10.5
n.s.* White flower (coco) 20.2
19.1
Tall (LeLe) 18.4
8.1
n.s.* Short (lele) 19.3
31.7
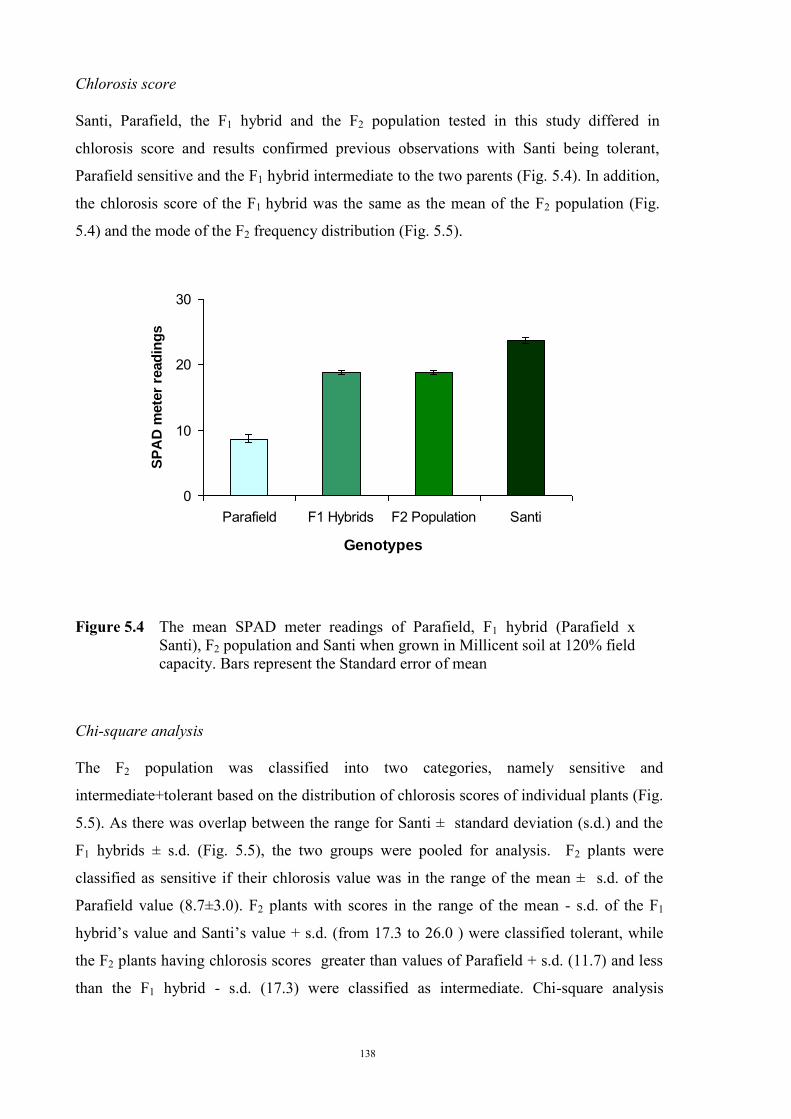
138
Chlorosis score
Santi, Parafield, the F1 hybrid and the F2 population tested in this study differed in
chlorosis score and results confirmed previous observations with Santi being tolerant,
Parafield sensitive and the F1 hybrid intermediate to the two parents (Fig. 5.4). In addition,
the chlorosis score of the F1 hybrid was the same as the mean of the F2 population (Fig.
5.4) and the mode of the F2 frequency distribution (Fig. 5.5).
Figure 5.4 The mean SPAD meter readings of Parafield, F1 hybrid (Parafield x
Santi), F2 population and Santi when grown in Millicent soil at 120% field capacity. Bars represent the Standard error of mean
Chi-square analysis
The F2 population was classified into two categories, namely sensitive and
intermediate+tolerant based on the distribution of chlorosis scores of individual plants (Fig.
5.5). As there was overlap between the range for Santi ± standard deviation (s.d.) and the
F1 hybrids ± s.d. (Fig. 5.5), the two groups were pooled for analysis. F2 plants were
classified as sensitive if their chlorosis value was in the range of the mean ± s.d. of the
Parafield value (8.7±3.0). F2 plants with scores in the range of the mean - s.d. of the F1
hybrid’s value and Santi’s value + s.d. (from 17.3 to 26.0 ) were classified tolerant, while
the F2 plants having chlorosis scores greater than values of Parafield + s.d. (11.7) and less
than the F1 hybrid - s.d. (17.3) were classified as intermediate. Chi-square analysis
0
10
20
30
Parafield F1 Hybrids F2 Population Santi
Genotypes
SP
AD
mete
r re
ad
ing
s
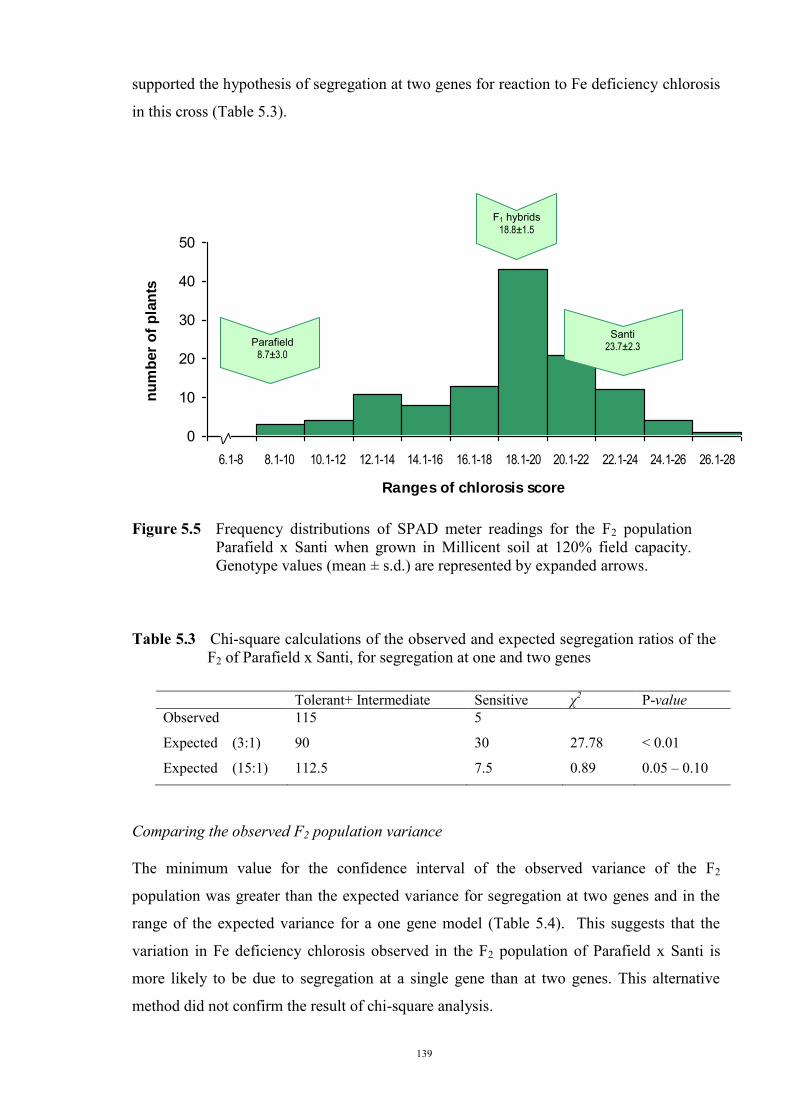
139
supported the hypothesis of segregation at two genes for reaction to Fe deficiency chlorosis
in this cross (Table 5.3).
0
10
20
30
40
50
6.1-8 8.1-10 10.1-12 12.1-14 14.1-16 16.1-18 18.1-20 20.1-22 22.1-24 24.1-26 26.1-28
Ranges of chlorosis score
nu
mb
er
of
pla
nts
Figure 5.5 Frequency distributions of SPAD meter readings for the F2 population
Parafield x Santi when grown in Millicent soil at 120% field capacity. Genotype values (mean ± s.d.) are represented by expanded arrows.
Table 5.3 Chi-square calculations of the observed and expected segregation ratios of the
F2 of Parafield x Santi, for segregation at one and two genes
Tolerant+ Intermediate Sensitive χ2 P-value Observed 115 5
Expected (3:1) 90 30 27.78 < 0.01
Expected (15:1) 112.5 7.5 0.89 0.05 – 0.10
Comparing the observed F2 population variance
The minimum value for the confidence interval of the observed variance of the F2
population was greater than the expected variance for segregation at two genes and in the
range of the expected variance for a one gene model (Table 5.4). This suggests that the
variation in Fe deficiency chlorosis observed in the F2 population of Parafield x Santi is
more likely to be due to segregation at a single gene than at two genes. This alternative
method did not confirm the result of chi-square analysis.
Santi 23.7±2.3
F1 hybrids 18.8±1.5
Parafield 8.7±3.0
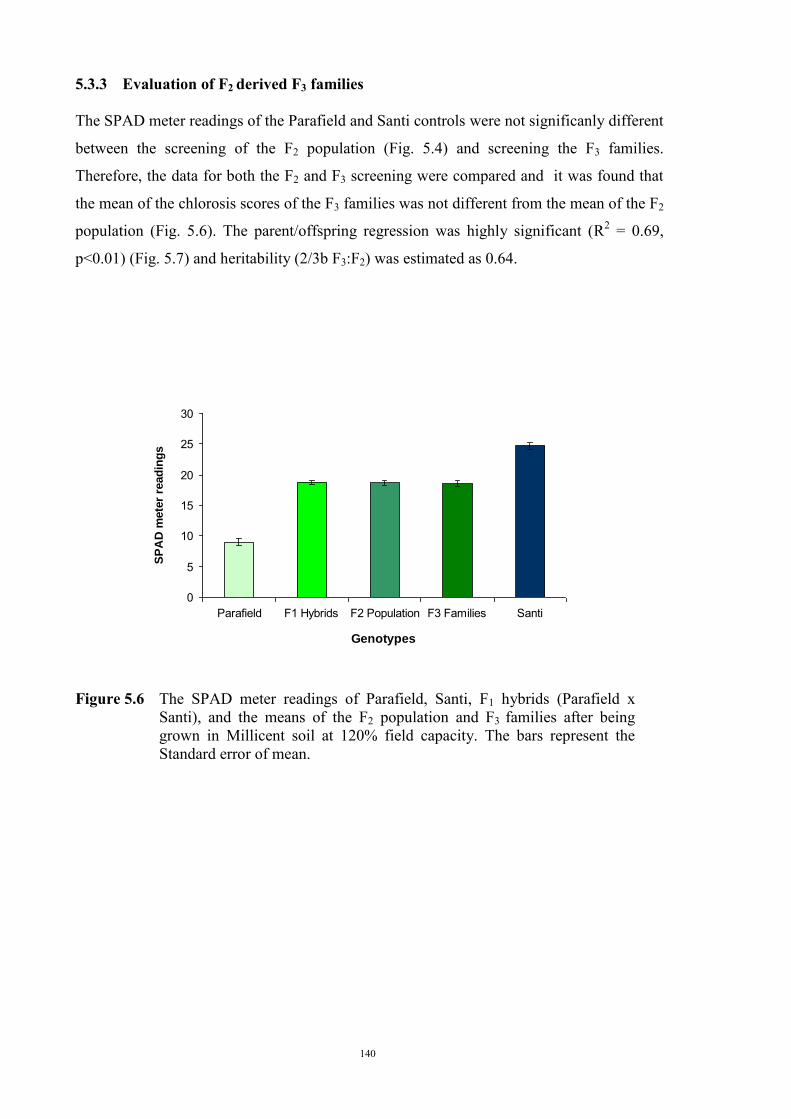
140
5.3.3 Evaluation of F2 derived F3 families
The SPAD meter readings of the Parafield and Santi controls were not significanly different
between the screening of the F2 population (Fig. 5.4) and screening the F3 families.
Therefore, the data for both the F2 and F3 screening were compared and it was found that
the mean of the chlorosis scores of the F3 families was not different from the mean of the F2
population (Fig. 5.6). The parent/offspring regression was highly significant (R2 = 0.69,
p<0.01) (Fig. 5.7) and heritability (2/3b F3:F2) was estimated as 0.64.
Figure 5.6 The SPAD meter readings of Parafield, Santi, F1 hybrids (Parafield x
Santi), and the means of the F2 population and F3 families after being grown in Millicent soil at 120% field capacity. The bars represent the Standard error of mean.
0
5
10
15
20
25
30
Parafield F1 Hybrids F2 Population F3 Families Santi
Genotypes
SP
AD
mete
r re
ad
ing
s
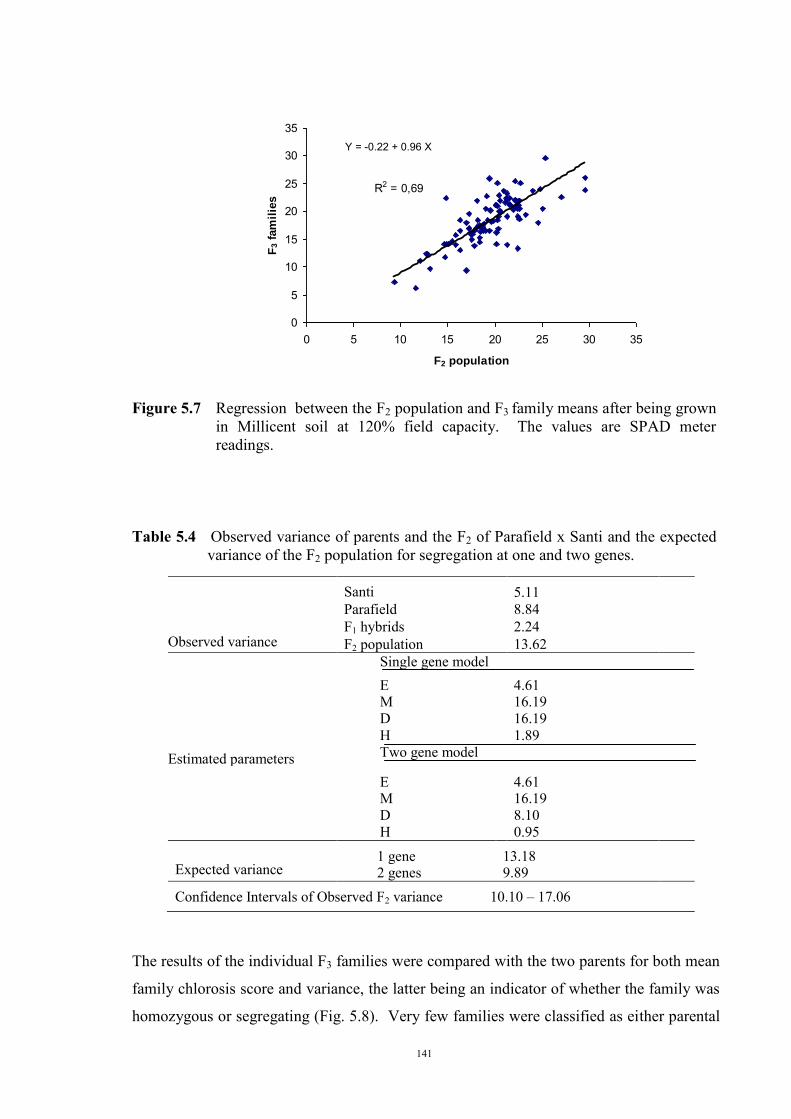
141
Figure 5.7 Regression between the F2 population and F3 family means after being grown
in Millicent soil at 120% field capacity. The values are SPAD meter readings.
Table 5.4 Observed variance of parents and the F2 of Parafield x Santi and the expected
variance of the F2 population for segregation at one and two genes.
Observed variance
Santi 5.11
Parafield 8.84 F1 hybrids 2.24 F2 population 13.62
Single gene model E 4.61
M 16.19 D 16.19 H 1.89
Estimated parameters Two gene model E 4.61
M 16.19 D 8.10 H 0.95
Expected variance 1 gene 13.18
2 genes 9.89 Confidence Intervals of Observed F2 variance 10.10 – 17.06
The results of the individual F3 families were compared with the two parents for both mean
family chlorosis score and variance, the latter being an indicator of whether the family was
homozygous or segregating (Fig. 5.8). Very few families were classified as either parental
R2 = 0,69
0
5
10
15
20
25
30
35
0 5 10 15 20 25 30 35
F2 population
F3 f
am
ilie
s
Y = -0.22 + 0.96 X
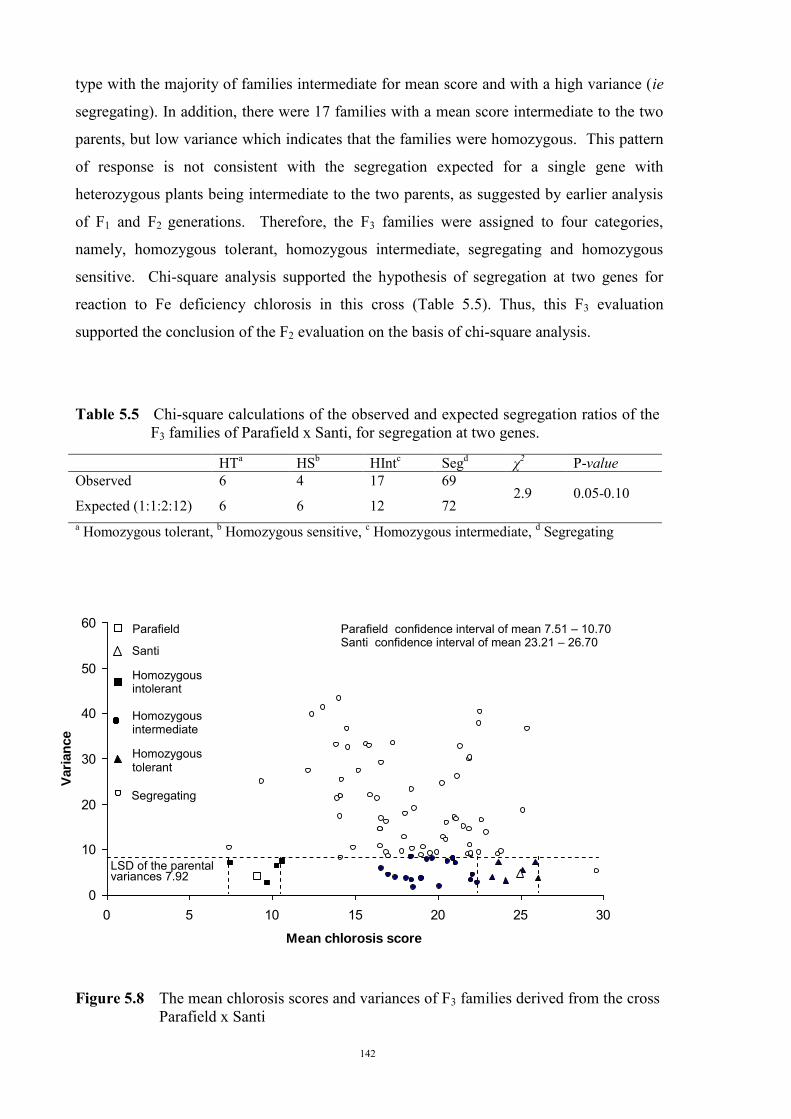
142
type with the majority of families intermediate for mean score and with a high variance (ie
segregating). In addition, there were 17 families with a mean score intermediate to the two
parents, but low variance which indicates that the families were homozygous. This pattern
of response is not consistent with the segregation expected for a single gene with
heterozygous plants being intermediate to the two parents, as suggested by earlier analysis
of F1 and F2 generations. Therefore, the F3 families were assigned to four categories,
namely, homozygous tolerant, homozygous intermediate, segregating and homozygous
sensitive. Chi-square analysis supported the hypothesis of segregation at two genes for
reaction to Fe deficiency chlorosis in this cross (Table 5.5). Thus, this F3 evaluation
supported the conclusion of the F2 evaluation on the basis of chi-square analysis.
Table 5.5 Chi-square calculations of the observed and expected segregation ratios of the F3 families of Parafield x Santi, for segregation at two genes.
HTa HSb HIntc Segd χ2 P-value Observed 6 4 17 69
2.9 0.05-0.10 Expected (1:1:2:12) 6 6 12 72 a Homozygous tolerant, b Homozygous sensitive, c Homozygous intermediate, d Segregating
Figure 5.8 The mean chlorosis scores and variances of F3 families derived from the cross Parafield x Santi
0
10
20
30
40
50
60
0 5 10 15 20 25 30
Mean chlorosis score
Vari
an
ce
Parafield confidence interval of mean 7.51 – 10.70 Santi confidence interval of mean 23.21 – 26.70
LSD of the parental variances 7.92
Santi
Parafield
Homozygous intermediate
Segregating
Homozygous intolerant
Homozygous tolerant
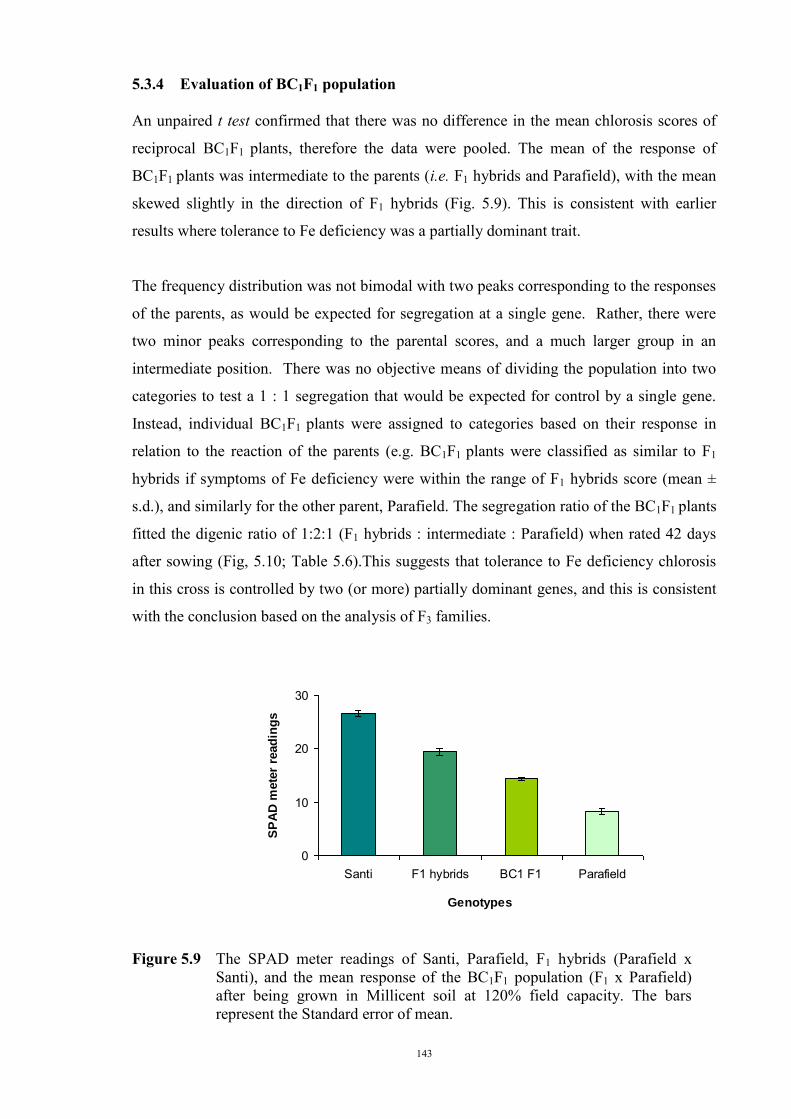
143
5.3.4 Evaluation of BC1F1 population
An unpaired t test confirmed that there was no difference in the mean chlorosis scores of
reciprocal BC1F1 plants, therefore the data were pooled. The mean of the response of
BC1F1 plants was intermediate to the parents (i.e. F1 hybrids and Parafield), with the mean
skewed slightly in the direction of F1 hybrids (Fig. 5.9). This is consistent with earlier
results where tolerance to Fe deficiency was a partially dominant trait.
The frequency distribution was not bimodal with two peaks corresponding to the responses
of the parents, as would be expected for segregation at a single gene. Rather, there were
two minor peaks corresponding to the parental scores, and a much larger group in an
intermediate position. There was no objective means of dividing the population into two
categories to test a 1 : 1 segregation that would be expected for control by a single gene.
Instead, individual BC1F1 plants were assigned to categories based on their response in
relation to the reaction of the parents (e.g. BC1F1 plants were classified as similar to F1
hybrids if symptoms of Fe deficiency were within the range of F1 hybrids score (mean ±
s.d.), and similarly for the other parent, Parafield. The segregation ratio of the BC1F1 plants
fitted the digenic ratio of 1:2:1 (F1 hybrids : intermediate : Parafield) when rated 42 days
after sowing (Fig, 5.10; Table 5.6).This suggests that tolerance to Fe deficiency chlorosis
in this cross is controlled by two (or more) partially dominant genes, and this is consistent
with the conclusion based on the analysis of F3 families.
Figure 5.9 The SPAD meter readings of Santi, Parafield, F1 hybrids (Parafield x
Santi), and the mean response of the BC1F1 population (F1 x Parafield) after being grown in Millicent soil at 120% field capacity. The bars represent the Standard error of mean.
0
10
20
30
Santi F1 hybrids BC1 F1 Parafield
Genotypes
SP
AD
mete
r re
ad
ing
s
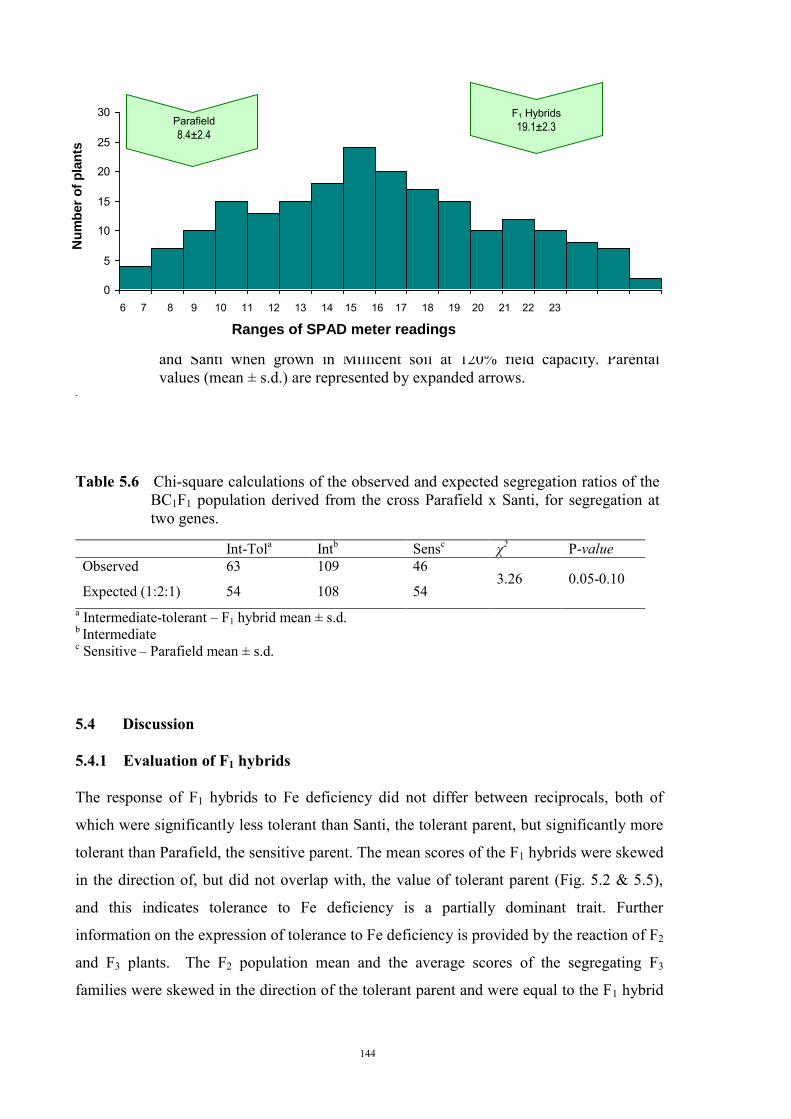
144
Figure 5.10 Frequency distribution of the BC1F1 population of a cross between Parafield
and Santi when grown in Millicent soil at 120% field capacity. Parental values (mean ± s.d.) are represented by expanded arrows.
. Table 5.6 Chi-square calculations of the observed and expected segregation ratios of the
BC1F1 population derived from the cross Parafield x Santi, for segregation at two genes.
Int-Tola Intb Sensc χ2 P-value Observed 63 109 46
3.26 0.05-0.10 Expected (1:2:1) 54 108 54
a Intermediate-tolerant – F1 hybrid mean ± s.d. b Intermediate c Sensitive – Parafield mean ± s.d.
5.4 Discussion
5.4.1 Evaluation of F1 hybrids
The response of F1 hybrids to Fe deficiency did not differ between reciprocals, both of
which were significantly less tolerant than Santi, the tolerant parent, but significantly more
tolerant than Parafield, the sensitive parent. The mean scores of the F1 hybrids were skewed
in the direction of, but did not overlap with, the value of tolerant parent (Fig. 5.2 & 5.5),
and this indicates tolerance to Fe deficiency is a partially dominant trait. Further
information on the expression of tolerance to Fe deficiency is provided by the reaction of F2
and F3 plants. The F2 population mean and the average scores of the segregating F3
families were skewed in the direction of the tolerant parent and were equal to the F1 hybrid
0
5
10
15
20
25
30
6.1-7 7.1-8 8.1-9 9.1-10 10.1-11 11.1-12 12.1-13 13.1-14 14.1-15 15.1-16 16.1-17 17.1-18 18.1-19 19.1-20 20.1-21 21.1-22 22.1-23
Ranges of chlorosis score
Nu
mb
er
of
pla
nts
Parafield 8.4±2.4
F1 Hybrids 19.1±2.3
6 7 8 9 10 11 12 13 14 15 16 17 18 19 20 21 22 23
Ranges of SPAD meter readings
145
scores. Both of these observations support the hypothesis that tolerance is a partially
dominant trait.
The concentration of nutrients in F1 hybrids relative to the parents differed among nutrients.
For example, of the nutrients where the variation was significant, the F1 hybrid was similar
to Parafield for Zn, intermediate to the parents for Mg and similar to Santi for P and Na. Of
particular interest, total Fe concentration in young stipules of F1 hybrids did not differ from
either parent. This is consistent with results reported in Chapter 4 and also other findings
that have shown that Fe deficiency symptoms are much more correlated with the
availability of active Fe (Fe2+) rather than the total Fe (Fe2+ + Fe3+) concentration of the
shoot tissue (Sakal et al., 1988; Romera et al., 1991; Mengel and Kirkby, 2001).
Tolerance to Fe deficiency has been described as dominant or partially dominant for several
other crops. For example, Saxena et al. (1990) found that the Fe deficiency tolerance of
chickpea was governed by a dominant gene on the basis of the response of F1 hybrids, the
F2 and BC1F1 generations between a tolerant parent and two sensitive parents when grown
on calcareous soil in the field and rated for chlorosis. Similarly, tolerance to Fe deficiency
chlorosis was controlled by a dominant gene with modifiers in oats on the basis of the
evaluation on F1 and F2 plants grown in nutrient solution culture (McDaniel and Brown,
1982). It was also reported that Fe deficiency tolerance is controlled by dominant genes in
dry beans (Zaiter et al., 1987).
The identification of dominant or partially dominant genetic control for other nutrients has
been reported for a number of crops. Paull et al. (1991) reported that boron tolerance in
wheat is controlled by an incompletely dominant gene(s) and F1 hybrids were
intermediate to the two parents with respect to both growth response and concentration
of boron in tissues. Bagheri et al. (1994) also reported that boron tolerance in field pea is
controlled by an incompletely dominant gene(s). In Mn, crosses between efficient
(Weeah) and moderately inefficient (Clipper) barley cultivars showed overdominance
(many F2 plants surpassed the efficient parent) on the basis of evaluation on total Mn in the
tops of seedlings grown in deficient soil in cups (Graham, 1984).
The response of an F1 hybrid, relative to the parents might differ for a quantitative trait,
such as nutrient efficiency, depending on the level of stress (Knight, 1979). For example,
Paull (1992) reported that tolerance to B toxicity of wheat was expressed as a dominant
146
trait (i.e. F1 hybrid equivalent to the tolerant parent) at low to intermediate levels of B
stress, but the F1 hybrid was intermediate to the two parents at higher levels of B. Thus the
conclusion that tolerance of peas to Fe deficiency chlorosis is a partially dominant trait is
specific to the screening conditions and the genetic combination tested and a different
result might be observed under different conditions.
5.4.2 Number of genes conferring tolerance to Fe deficiency
Two methods were used to determine the number of genes conferring tolerance to Fe
deficiency in the F2 of Parafield x Santi. Initially χ2 analysis was conducted and this lead to
the conclusion that the trait was under the control of more than one gene. However, it was
recognized that this method of analysis had limitations because tolerant plants did not
display a distinct tolerant reaction, rather there was a continuum in response and it was not
possible to objectively separate plants into discrete categories. Therefore, the observed
variance of the F2 population was compared with the variance expected for segregation at
one and two loci. This evaluation indicated a greater probability of one, than two genes in
Santi controlling tolerance relative to Parafield.
Evaluation of F2 derived F3 families enabled the genotypes of the parent F2 plants to be
identified within limits imposed by the size of each F3 family. Thus χ2 analysis was based
on the genotypes of the F2 plants, whereas most other reports of the genetic control of
tolerance to Fe deficiency are based on F2 phenotypes. The within family segregation
patterns indicated four grouping, namely homozygous tolerant, homozygous intermediate,
segregating and homozygous sensitive (Fig. 5.6). The presence of the homozygous
intermediate families, with an intermediate mean score and low variance, would not be
expected with single gene control. In addition, the very low proportion of homozygous
parental-type families is not consistent with a single gene model.
χ2 analysis on the basis of four categories was consistent with segregation at two loci. If the
gene symbols Fe1 and Fe2 are assigned to the two genes, it can be hypothesised that the
genotypes of the various categories of F3 families described above were:
147
Santi Homozygous tolerant Fe1Fe1Fe2Fe2
Homozygous intermediate Fe1Fe1fe2fe2
fe1fe1Fe2Fe2
Segregating Fe1Fe1Fe2fe2
Fe1fe1Fe2Fe2
Fe1fe1Fe2fe2
Fe1fe1fe2fe2
fe1fe1Fe2fe2
Parafield Homozygous sensitive fe1fe1fe2fe2
The BC1F1 plants were assigned to three categories, intermediate-tolerant (similar to F1
hybrids), intermediate and sensitive (similar to Parafield). The large number of BC1F1
plants with reaction intermediate to the parents is not expected for a backcross population
segregating for a single gene. χ2 analysis of the BC1F1 supported the hypothesis of two
genes controlling Fe deficiency.
The proposed genotypes of the BC1F1 plants are:
F1 hybrid Intermediate-tolerant Fe1fe1Fe2fe2
Intermediate Fe1fe1fe2fe2
fe1fe1Fe2fe2
Parafield Sensitive fe1fe1fe2fe2
Other authors have reported either one or two genes controlling tolerance to Fe deficiency
in other crops. In tomato, Brown and Wann (1982) reported that Fe deficiency tolerance is
likely to be conditioned by a single dominant gene after evaluating segregation of F2
plants. However, Dasgen et al (2002) argued that the inheritance of Fe deficiency tolerance
in tomato was not a simple dominant monogenic trait, but might be characterized by both
nuclear and extranuclear heredity after evaluating F1 hybrids between the Fe tolerant line
(Roza) and sensitive genotype (227/1). In soybean, Fehr (1982) challenged Weiss (1943)
who reported that one dominant major gene was involved in Fe deficiency tolerance in
soybean. Discrete classes were not observed when a large number of soybean lines were
grown on calcareous soils in the field, thus tolerance over all lines did not appear to fit a
single gene model. Fehr (1982) suggested that additional genes were involved in the
inheritance of tolerance to Fe deficiency chlorosis in soybeans and this inheritance can
vary depending on the parents used in developing the population, and for breeding
148
purposes, tolerance to Fe deficiency chlorosis can be considered a quantitative character.
Similar result was reported that a number of genes involved in association with soybean
Fe deficiency tolerance (Mamidi et al., 2011).
The population of Santi x Parafield segregated for three morphological traits and all were
independent of response to Fe deficiency. Therefore there should not be any impediment to
developing Fe efficient varieties with any combination of these traits, all of which are
significant objectives in the Australian field pea breeding program.
In conclusion, the experiments reported in this chapter demonstrated that the tolerance to Fe
deficiency chlorosis is a partially dominant trait with no reciprocal effects for the cross
Santi x Parafield. Investigations into the number of genes controlling Fe deficiency
indicated that it is most likely to be two genes in this cross. The F2 generation which was
based on phenotypic data with a continuous distribution indicated two genes for χ2 analysis
based on arbitrary cut-off point, and a single gene based on the population variance
compared to variance of parents and F1 hybrid. Analysis of the F3, which was based on
genotypic data, indicated two genes and included a significant number of homozygous
intermediate families which would not occur for segregation of a single gene. The
distribution of the BC1F1 population also fitted a two gene model with a large proportion of
plants intermediate to the parents.
A number of other tolerant and sensitive lines were identified in Chapter 3. It is not possible
to assume that these lines have the same genetic control as Santi or Parafield, although
analysis of pedigrees would give some indication of the likelihood of being the same.
Further genetic studies are reported in Chapter 6 to establish the relationship with respect to
tolerance to Fe deficiency chlorosis between Santi and Parafield and representatives of
these other lines.
149
CHAPTER 6
Genetics of tolerance of field pea accessions to Fe deficiency chlorosis
6.1 Introduction
Knowledge of the inheritance of tolerance to Fe deficiency chlorosis in field pea is
necessary to increase the efficiency in breeding tolerant varieties. Understanding the
amount and distribution of genetic variability present in the gene pool is needed in
breeding for deficiency tolerance, as this information may be used to select appropriate
genotypes to intercross in order to transfer Fe deficiency tolerance into sensitive
commercial varieties.
A number of lines in the SARDI field pea breeding program were identified as tolerant to
Fe deficiency chlorosis (Chapter 3). The tolerance of Santi, relative to Parafield, was
determined to be partially dominant and most likely controlled by two genes (Chapter 5).
However, the relationship of the tolerance of the other lines to Santi has not been
characterised, and it is not known whether the tolerance genes in the various accessions are
the same as Santi, or different. Two methods may be used to compare tolerant lines,
namely (1) a study of the pedigree of tolerant lines to identify a common ancestor that
might be the source of tolerance, and (2) crossing between tolerant lines and screening the
F2 progeny. Where there is segregation in the F2 of a cross between two homozygous
tolerant lines, it can be hypothesised that the parents carry different tolerance genes.
Additional information on the genetic control of tolerance can be obtained by crossing to a
sensitive line, such as Parafield, and observing the segregation ratios, or patterns, in F2 and
F3 generations.
The aim of the experiments reported in this chapter was to investigate the genetic
relationship of Fe deficiency tolerance in several field pea genotypes relative to Santi and
Parafield
150
6.2 Materials and Methods
Three Fe deficiency tolerant and three sensitive lines identified on the basis of solution
screening in Chapter 3, were used as parents. The tolerant accessions included Santi (semi-
leafless), Px-95-183-7-1 (semi-leafless) and Px-89-82-1 (conventional leaves), while the
sensitive lines were Parafield (conventional leaves), Px-97-9-4 (conventional leaves) and
Px-96-83-1-1 (semi-leafless). These breeding lines were selected to provide not only a
contrast in plant morphology, but also variation in the degree of relatedness to the control
parents (Table 6.1).
Table 6.1 Pedigree, SPAD values (in Chapter 3), leaf type, plant height, and flower colour of lines used in this study
Line Pedigree SPAD
Leaf type Plant
height Flower colour
Santi M150-1/Progreta 24.1 semi-leafless dwarf white
Px-95-183-7-1 Bohatyr// M150-1/Progreta 21.3 semi-leafless dwarf coloured
Px-89-82-1 Alma/SA944//Alma/Wirrega 20.7 conventional tall white
Px-97-9-4 Mukta/Parafield 15.5 conventional tall coloured
Px-96-83-1-1 M150-1/Progreta//Baroness/3/WT11145 15.9 semi-leafless dwarf coloured
Parafield Solara/Early Dun 14.2 conventional tall coloured
M150-1 = Early Dun/SA916//SA966 SA944 = accession ex Denmark WT11145 = variety ex China
Parafield and Santi were used as control parents in this inheritance study and both cultivars
were crossed with the other lines (e.g. Santi x Px-95-183-7-1, Santi x Px-89-82-1, Santi x
Px-97-9-4, Santi x Px-96-83-1-1, and Parafield x Px-95-183-1, Parafield x Px-89-82-1,
Parafield x Px-97-9-4, Parafield x Px-96-83-1-1). Parafield x Santi was not included as this
combination was investigated in detail in Chapter 5.
Hybridization was conducted in a glasshouse and F1 hybrids were also multiplied in a
glasshouse to produce F2 seeds. The reactions of the F2 populations from all crosses were
compared with those of the two parents and the F1 hybrids. Experiments were conducted in
a growth chamber, with the same environmental conditions as for experiments in Chapters
3, 4, and 5. The number of seeds sown for F1 hybrids, each parent and the F2 populations
depended on the availability of seeds (Table 6.2), but the minimum requirement of seeds
for identifying F2 segregation as suggested by Graybill and Kneebone (1959) was
151
observed. Plants were sown in pots filled with Millicent soil which was watered to 120%
field capacity to induce chlorosis and a SPAD meter was used to rate the chlorosis of the
YOS, as described in Chapter 3. The populations were tested in two batches, namely those
with Parafield as a parent and those with Santi as a parent. Parafield was included as a
sensitive control when testing the F2 populations derived from crosses with Santi as a
parent. As an unpaired t-test confirmed that the response of Parafield in both batches was
not significantly different in regards to Fe deficiency chlorosis, results of all the F2
populations were compared.
The number of genes controlling tolerance to Fe deficiency chlorosis was estimated by two
methods, namely (1) Chi-square analysis for testing the goodness of fit of the observed
segregation ratios of the F2 populations to the frequencies expected for monogenic (3 : 1)
and (1 : 2 : 1) or digenic (15 : 1) segregation, and (2) comparison of the observed variance
of the F2 population with the variance expected for segregation at one and two loci as
described in Chapter 5.
The concentration of active Fe was highly significantly correlated to tolerance to chlorosis
of breeding lines in Chapter 4 and this association was also measured for a limited number
of BC1F2 families of Parafield//Santi/Parafield (Chapter 4). To further test for co-
segregation of the two traits, the F2 population, together with F1 hybrids and parents of
Santi x Px-97-9-4 was tested for active Fe according to the method described in Chapter 4,
in addition to determining SPAD meter chlorosis scores. The number of genes controlling
tolerance to Fe deficiency chlorosis as measured by active Fe concentration, was estimated
using Chi-square analysis for testing the goodness of fit of the observed segregation ratios
of the F2 population to the frequencies expected for monogenic (3 : 1) and (1 : 2 : 1) or
digenic (15 : 1) segregation.
The limitations of time prevented F2 populations being multiplied to produce F3 families in
order to determine the genotypes of individual F2 plants. Thus evaluation of inheritance for
the experiments described in this chapter was based on the segregation of F2 populations
only.
The full pedigrees of all lines tested in Chapter 3, together with SPAD meter readings were
analyzed following the genetic studies to identify any parent(s) that were common to all
tolerant lines and thus might be the source of Fe efficiency.
152
6.3 Results
The germination of F2 seeds of Px-89-82-1 x Santi was poor, and of 100 seeds sown only
17 produced seedlings. Thus results of this population are not reported.
The responses of F1 hybrids of all combinations were either intermediate to the parents, or
skewed to the tolerant parent (Fig. 6.1 – 6.4), indicating that tolerance is expressed as a
dominant or partially dominant trait. This result is consistent with results in Chapter 5
where Fe deficiency tolerance was also partially dominant. The reaction in chlorosis
symptoms of most parental lines, when tested with their F1 hybrids and F2 progeny, were
consistent with previous results in solution culture (Chapter 3). Santi and Px-95-183-7-1
were tolerant, Px-89-82-1 was intermediate, and Parafield and Px-97-9-4 were sensitive.
Px-96-83-1-1, which was severely chlorotic in solution culture was intermediate in this
test, more tolerant than Parafield and Px-97-9-4, but less tolerant than Santi, Px-95-183-7-1
and Px-89-82-1 (Fig. 6.1 and 6.2).
F2 generation
The crosses included a number of morphological traits (Table 6.1), and segregation of
these traits, and also segregation in response to Fe deficiency in the F2 plants confirmed the
hybrid status of the F1 plants. In particular for cross combinations between tolerant and
sensitive parents, the average scores over all F2 plants were similar to the average scores of
their F1 hybrids (Fig. 6.1 and 6.2). Individual F2 plants were assigned to categories
delineated by the reaction of the parents (the values of the parents were calculated as their
mean ± standard
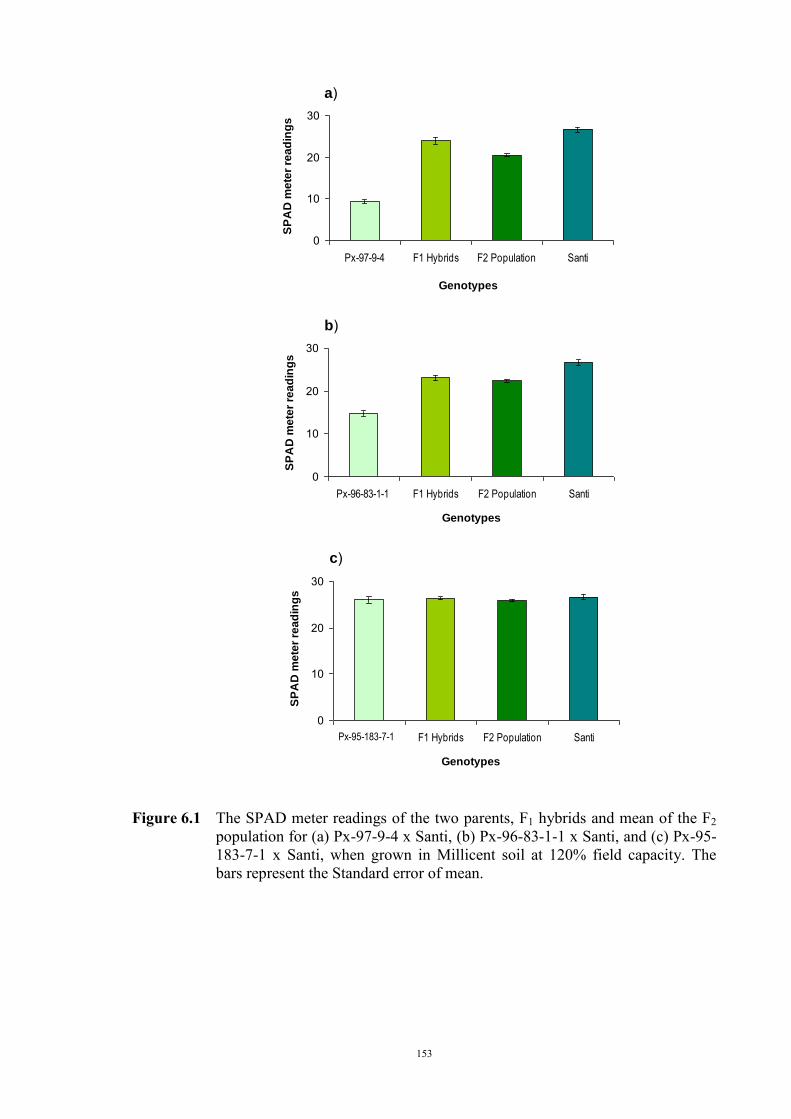
153
Figure 6.1 The SPAD meter readings of the two parents, F1 hybrids and mean of the F2
population for (a) Px-97-9-4 x Santi, (b) Px-96-83-1-1 x Santi, and (c) Px-95-183-7-1 x Santi, when grown in Millicent soil at 120% field capacity. The bars represent the Standard error of mean.
0
10
20
30
Px-96-83-1-1 F1 Hybrids F2 Population Santi
Genotypes
SP
AD
me
ter
rea
din
gs
b)
0
10
20
30
Px-97-9-4 F1 Hybrids F2 Population Santi
GenotypesS
PA
D m
ete
r re
ad
ing
s
a)
0
10
20
30
Px 95-183-1-1 F1 Hybrids F2 Population Santi
Genotypes
SP
AD
me
ter
rea
din
gs
c)
Px-95-183-7-1
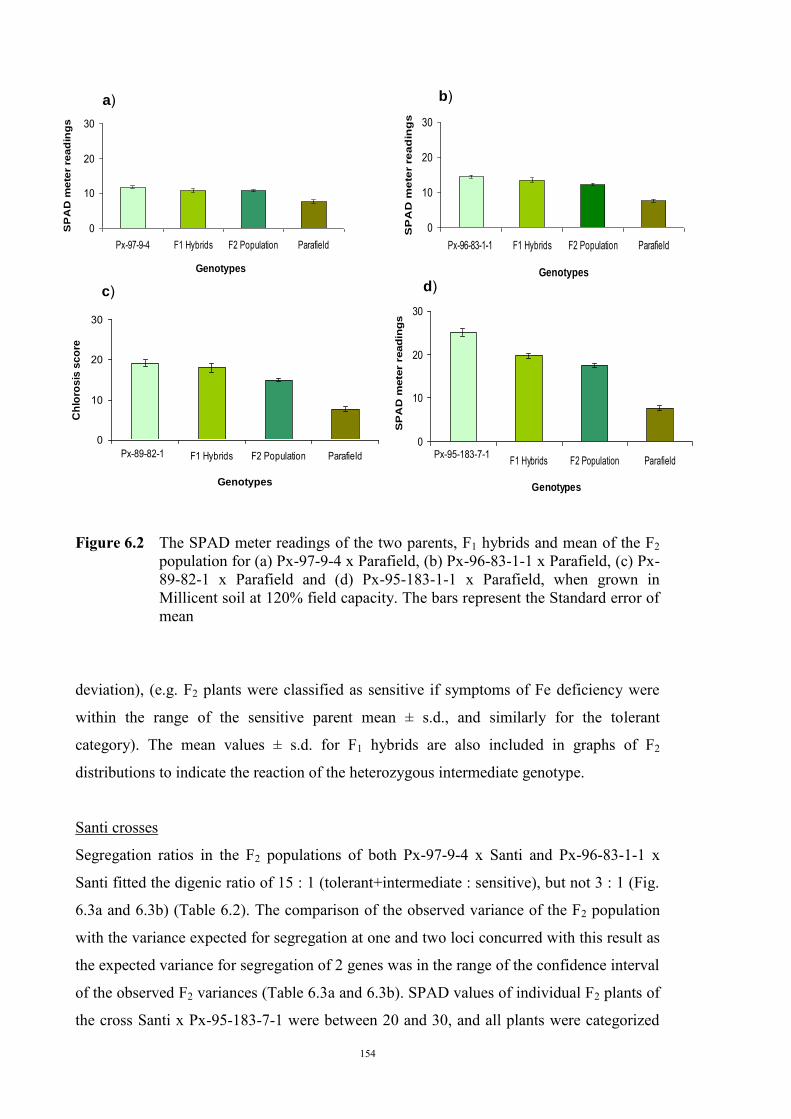
154
Figure 6.2 The SPAD meter readings of the two parents, F1 hybrids and mean of the F2
population for (a) Px-97-9-4 x Parafield, (b) Px-96-83-1-1 x Parafield, (c) Px-89-82-1 x Parafield and (d) Px-95-183-1-1 x Parafield, when grown in Millicent soil at 120% field capacity. The bars represent the Standard error of mean
deviation), (e.g. F2 plants were classified as sensitive if symptoms of Fe deficiency were
within the range of the sensitive parent mean ± s.d., and similarly for the tolerant
category). The mean values ± s.d. for F1 hybrids are also included in graphs of F2
distributions to indicate the reaction of the heterozygous intermediate genotype.
Santi crosses
Segregation ratios in the F2 populations of both Px-97-9-4 x Santi and Px-96-83-1-1 x
Santi fitted the digenic ratio of 15 : 1 (tolerant+intermediate : sensitive), but not 3 : 1 (Fig.
6.3a and 6.3b) (Table 6.2). The comparison of the observed variance of the F2 population
with the variance expected for segregation at one and two loci concurred with this result as
the expected variance for segregation of 2 genes was in the range of the confidence interval
of the observed F2 variances (Table 6.3a and 6.3b). SPAD values of individual F2 plants of
the cross Santi x Px-95-183-7-1 were between 20 and 30, and all plants were categorized
0
10
20
30
Px-97-9-4 F1 Hybrids F2 Population Parafield
Genotypes
SP
AD
me
ter
rea
din
gs
0
10
20
30
Px-96-83-1-1 F1 Hybrids F2 Population Parafield
Genotypes
SP
AD
me
ter
rea
din
gs
a) b)
0
10
20
30
Px-95-183-1-1 F1 Hybrids F2 Population Parafield
Genotypes
SP
AD
mete
r r
ead
ing
s
d)
0
10
20
30
Px-89-83-1 F1 Hybrids F2 Population Parafield
Genotypes
Ch
loro
sis
sc
ore
c)
Px-95-183-7-1 Px-89-82-1
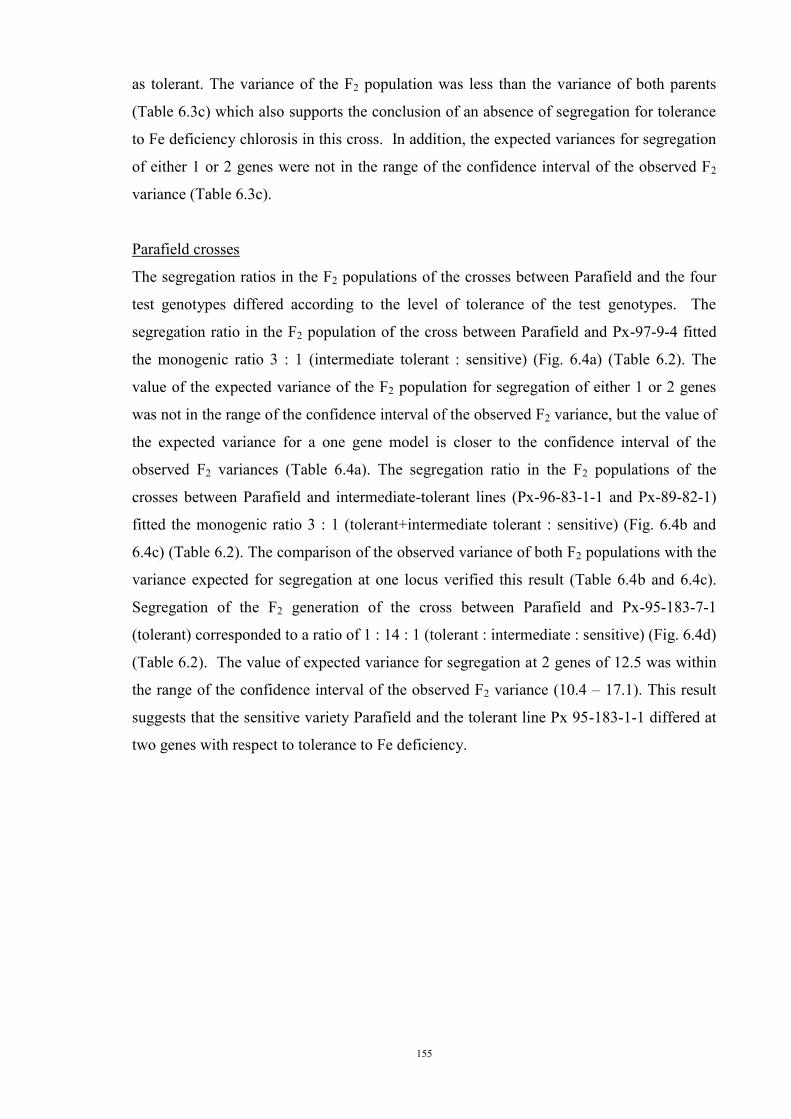
155
as tolerant. The variance of the F2 population was less than the variance of both parents
(Table 6.3c) which also supports the conclusion of an absence of segregation for tolerance
to Fe deficiency chlorosis in this cross. In addition, the expected variances for segregation
of either 1 or 2 genes were not in the range of the confidence interval of the observed F2
variance (Table 6.3c).
Parafield crosses
The segregation ratios in the F2 populations of the crosses between Parafield and the four
test genotypes differed according to the level of tolerance of the test genotypes. The
segregation ratio in the F2 population of the cross between Parafield and Px-97-9-4 fitted
the monogenic ratio 3 : 1 (intermediate tolerant : sensitive) (Fig. 6.4a) (Table 6.2). The
value of the expected variance of the F2 population for segregation of either 1 or 2 genes
was not in the range of the confidence interval of the observed F2 variance, but the value of
the expected variance for a one gene model is closer to the confidence interval of the
observed F2 variances (Table 6.4a). The segregation ratio in the F2 populations of the
crosses between Parafield and intermediate-tolerant lines (Px-96-83-1-1 and Px-89-82-1)
fitted the monogenic ratio 3 : 1 (tolerant+intermediate tolerant : sensitive) (Fig. 6.4b and
6.4c) (Table 6.2). The comparison of the observed variance of both F2 populations with the
variance expected for segregation at one locus verified this result (Table 6.4b and 6.4c).
Segregation of the F2 generation of the cross between Parafield and Px-95-183-7-1
(tolerant) corresponded to a ratio of 1 : 14 : 1 (tolerant : intermediate : sensitive) (Fig. 6.4d)
(Table 6.2). The value of expected variance for segregation at 2 genes of 12.5 was within
the range of the confidence interval of the observed F2 variance (10.4 – 17.1). This result
suggests that the sensitive variety Parafield and the tolerant line Px 95-183-1-1 differed at
two genes with respect to tolerance to Fe deficiency.
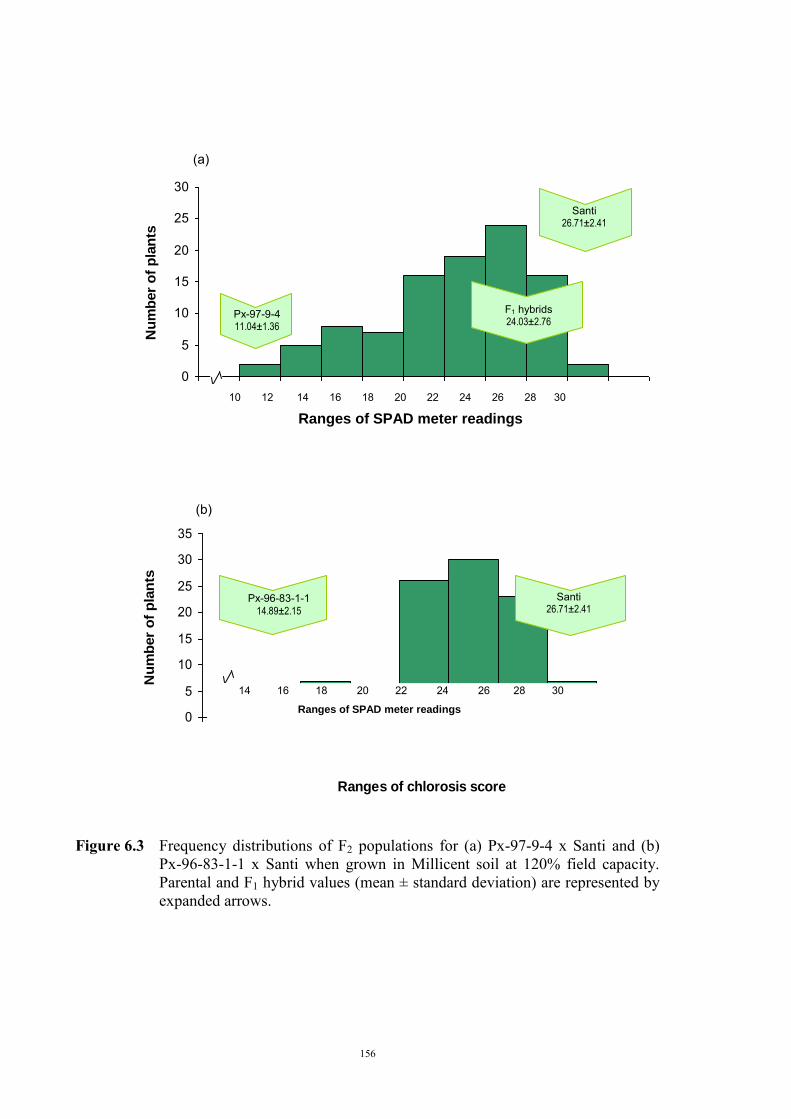
156
Figure 6.3 Frequency distributions of F2 populations for (a) Px-97-9-4 x Santi and (b)
Px-96-83-1-1 x Santi when grown in Millicent soil at 120% field capacity. Parental and F1 hybrid values (mean ± standard deviation) are represented by expanded arrows.
0
5
10
15
20
25
30
Ranges of chlorosis score
Nu
mb
er
of
pla
nts
10 12 14 16 18 20 22 24 26 28 30
Ranges of SPAD meter readings
Santi 26.71±2.41
Px-97-9-4 11.04±1.36
F1 hybrids 24.03±2.76
(a)
0
5
10
15
20
25
30
35
Ranges of chlorosis score
Nu
mb
er
of
pla
nts
14 16 18 20 22 24 26 28 30
Ranges of SPAD meter readings
Santi 26.71±2.41
Px-96-83-1-1 14.89±2.15
(b)
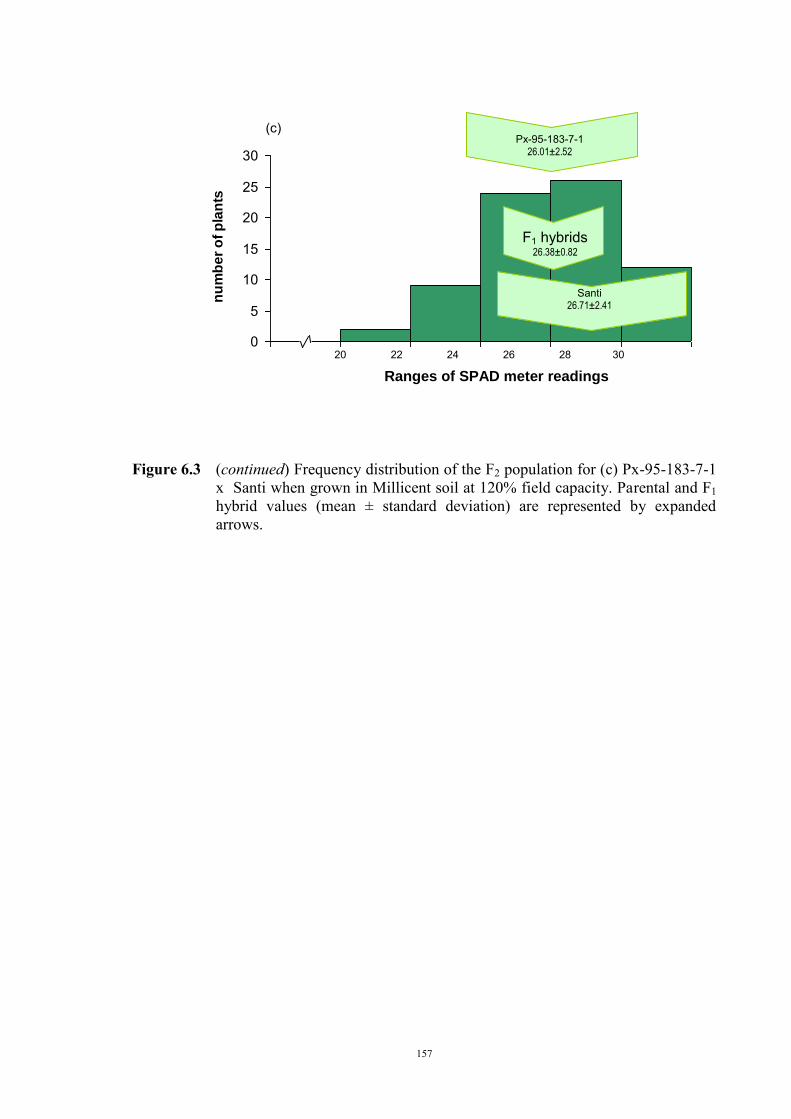
157
Figure 6.3 (continued) Frequency distribution of the F2 population for (c) Px-95-183-7-1
x Santi when grown in Millicent soil at 120% field capacity. Parental and F1 hybrid values (mean ± standard deviation) are represented by expanded arrows.
0
5
10
15
20
25
30
Ranges of chlorosis score
nu
mb
er
of
pla
nts
20 22 24 26 28 30
Ranges of SPAD meter readings
Santi 26.71±2.41
Px-95-183-7-1 26.01±2.52
F1 hybrids 26.38±0.82
(c)
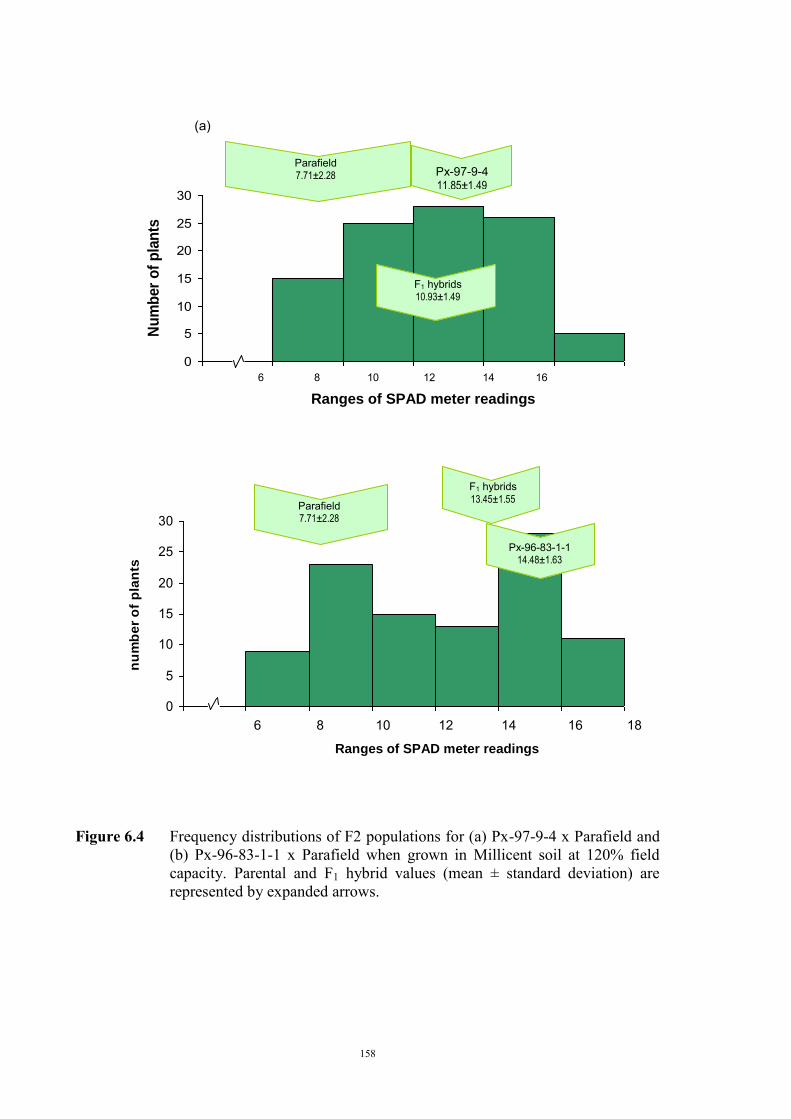
158
Figure 6.4 Frequency distributions of F2 populations for (a) Px-97-9-4 x Parafield and
(b) Px-96-83-1-1 x Parafield when grown in Millicent soil at 120% field capacity. Parental and F1 hybrid values (mean ± standard deviation) are represented by expanded arrows.
0
5
10
15
20
25
30
Ranges of chlorosis score
nu
mb
er
of
pla
nts
Parafield 7.71±2.28
F1 hybrids 13.45±1.55
Px-96-83-1-1 14.48±1.63
6 8 10 12 14 16 18
Ranges of SPAD meter readings
b)
0
5
10
15
20
25
30
Ranges chlorosis score
Nu
mb
er
of
pla
nts
Parafield 7.71±2.28 Px-97-9-4
11.85±1.49
6 8 10 12 14 16
Ranges of SPAD meter readings
F1 hybrids 10.93±1.49
(a)
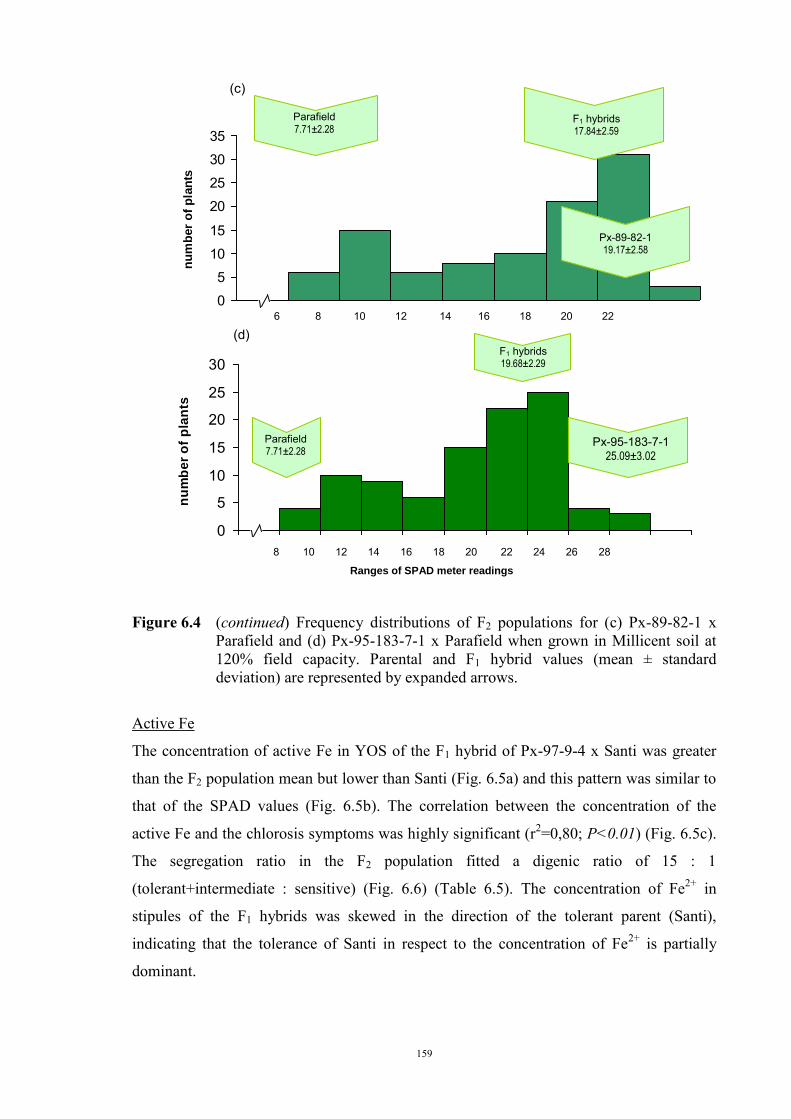
159
Figure 6.4 (continued) Frequency distributions of F2 populations for (c) Px-89-82-1 x
Parafield and (d) Px-95-183-7-1 x Parafield when grown in Millicent soil at 120% field capacity. Parental and F1 hybrid values (mean ± standard deviation) are represented by expanded arrows.
Active Fe
The concentration of active Fe in YOS of the F1 hybrid of Px-97-9-4 x Santi was greater
than the F2 population mean but lower than Santi (Fig. 6.5a) and this pattern was similar to
that of the SPAD values (Fig. 6.5b). The correlation between the concentration of the
active Fe and the chlorosis symptoms was highly significant (r2=0,80; P<0.01) (Fig. 6.5c).
The segregation ratio in the F2 population fitted a digenic ratio of 15 : 1
(tolerant+intermediate : sensitive) (Fig. 6.6) (Table 6.5). The concentration of Fe2+ in
stipules of the F1 hybrids was skewed in the direction of the tolerant parent (Santi),
indicating that the tolerance of Santi in respect to the concentration of Fe2+ is partially
dominant.
05
1015
20253035
8-1.6 01-1.8 21-1.01 41-1.21 61-1.41 81-1.61 02-1.81 22-1.02
Ranges of chlorosis score
nu
mb
er
of
pla
nts
Parafield 7.71±2.28
F1 hybrids 17.84±2.59
Px-89-82-1 19.17±2.58
6 8 10 12 14 16 18 20 22
Ranges of SPAD meter readings
(c)
F2 (Px 95-183-1 x Parafield)
0
5
10
15
20
25
30
Ranges of chlorosis score
nu
mb
er
of
pla
nts
Px-95-183-7-1 25.09±3.02
Parafield 7.71±2.28
8 10 12 14 16 18 20 22 24 26 28
Ranges of SPAD meter readings
(d) F1 hybrids 19.68±2.29
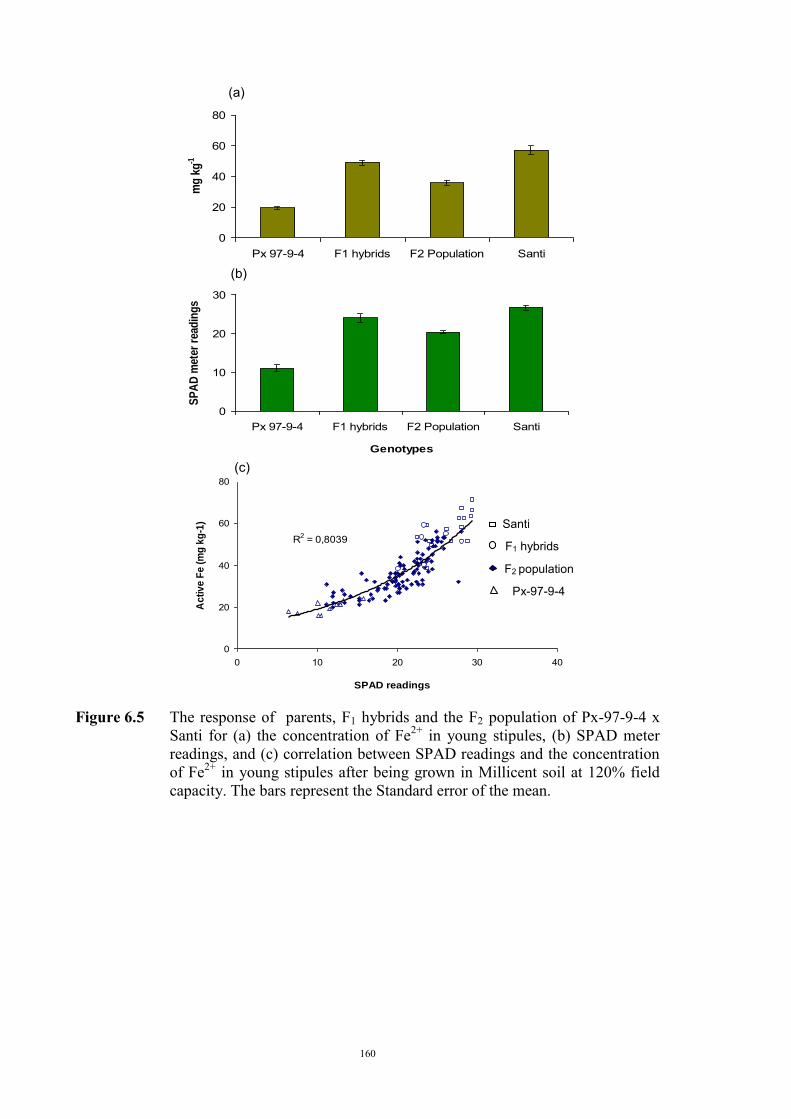
160
Figure 6.5 The response of parents, F1 hybrids and the F2 population of Px-97-9-4 x Santi for (a) the concentration of Fe2+ in young stipules, (b) SPAD meter readings, and (c) correlation between SPAD readings and the concentration of Fe2+ in young stipules after being grown in Millicent soil at 120% field capacity. The bars represent the Standard error of the mean.
0
20
40
60
80
Px 97-9-4 F1 hybrids F2 Population Santi
mg
kg-1
(a)
0
10
20
30
Px 97-9-4 F1 hybrids F2 Population Santi
Genotypes
SP
AD
met
er r
ead
ing
s
(b)
R2 = 0,8039
0
20
40
60
80
0 10 20 30 40
SPAD readings
Ac
tiv
e F
e (
mg
kg
-1)
Santi
F1 hybrids
Px-97-9-4
F2 population
(c)
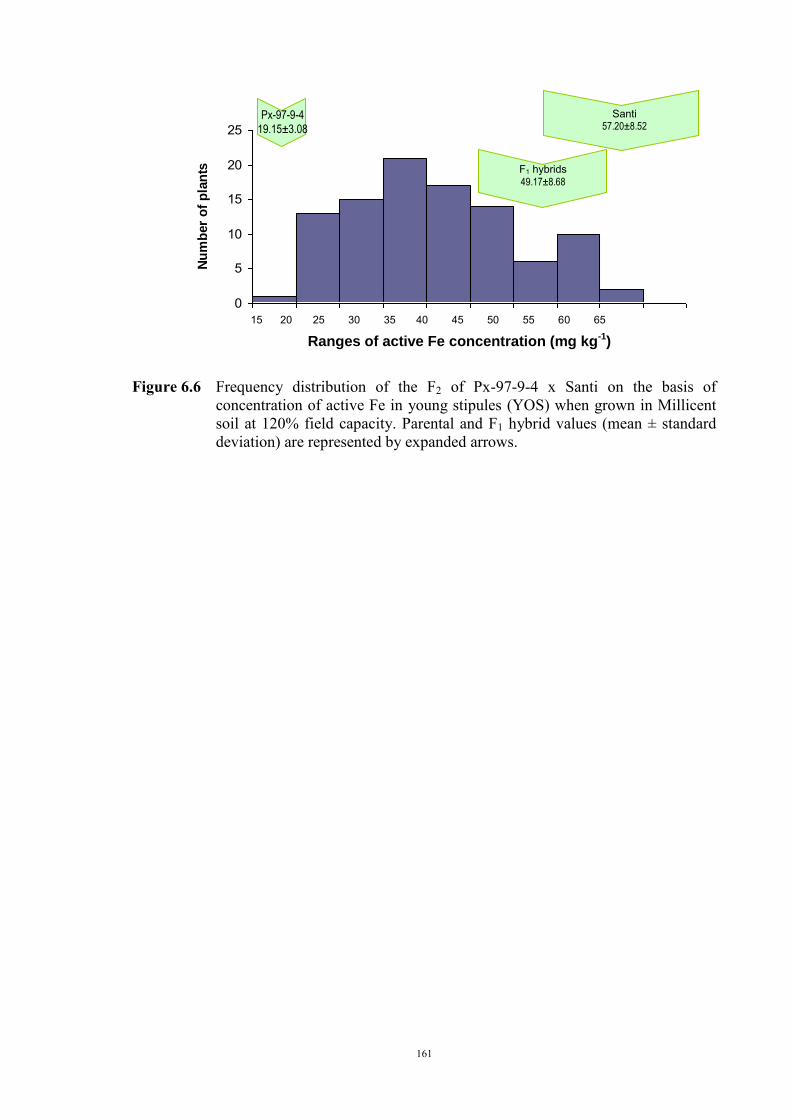
161
Figure 6.6 Frequency distribution of the F2 of Px-97-9-4 x Santi on the basis of concentration of active Fe in young stipules (YOS) when grown in Millicent soil at 120% field capacity. Parental and F1 hybrid values (mean ± standard deviation) are represented by expanded arrows.
0
5
10
15
20
25
16-20 21-25 26-30 31-35 36-40 41-45 46-50 51-55 56-60
Ranges of active Fe concentration
Nu
mb
er
of
pla
nts
15 20 25 30 35 40 45 50 55 60 65
Ranges of active Fe concentration (mg kg-1)
Px-97-9-4
19.15±3.08
F1 hybrids 49.17±8.68
Santi 57.20±8.52
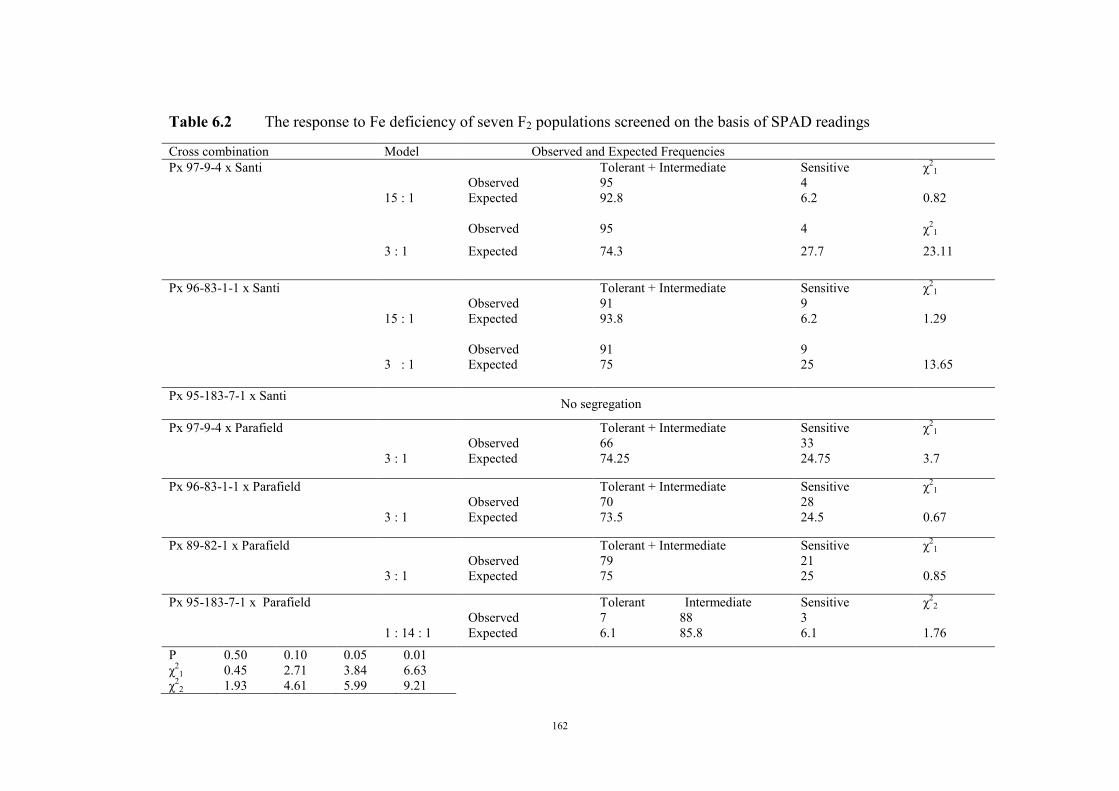
162
Table 6.2 The response to Fe deficiency of seven F2 populations screened on the basis of SPAD readings Cross combination Model Observed and Expected Frequencies Px 97-9-4 x Santi
15 : 1 Observed
Tolerant + Intermediate Sensitive χ21
95 4 Expected 92.8 6.2 0.82
Observed 95 4 χ2
1
3 : 1 Expected 74.3 27.7 23.11
Px 96-83-1-1 x Santi Tolerant + Intermediate Sensitive χ21
Observed 91 9 15 : 1 3 : 1
Expected Observed Expected
93.8 91 75
6.2 9 25
1.29 13.65
Px 95-183-7-1 x Santi No segregation
Px 97-9-4 x Parafield Tolerant + Intermediate Sensitive χ21
Observed 66 33 3 : 1 Expected 74.25 24.75 3.7
Px 96-83-1-1 x Parafield Tolerant + Intermediate Sensitive χ21
Observed 70 28 3 : 1 Expected 73.5 24.5 0.67
Px 89-82-1 x Parafield Tolerant + Intermediate Sensitive χ21
Observed 79 21 3 : 1 Expected 75 25 0.85
Px 95-183-7-1 x Parafield Tolerant Intermediate Sensitive χ22
Observed 7 88 3 1 : 14 : 1 Expected 6.1 85.8 6.1 1.76
P 0.50 0.10 0.05 0.01 χ2
1 0.45 2.71 3.84 6.63 χ2
2 1.93 4.61 5.99 9.21
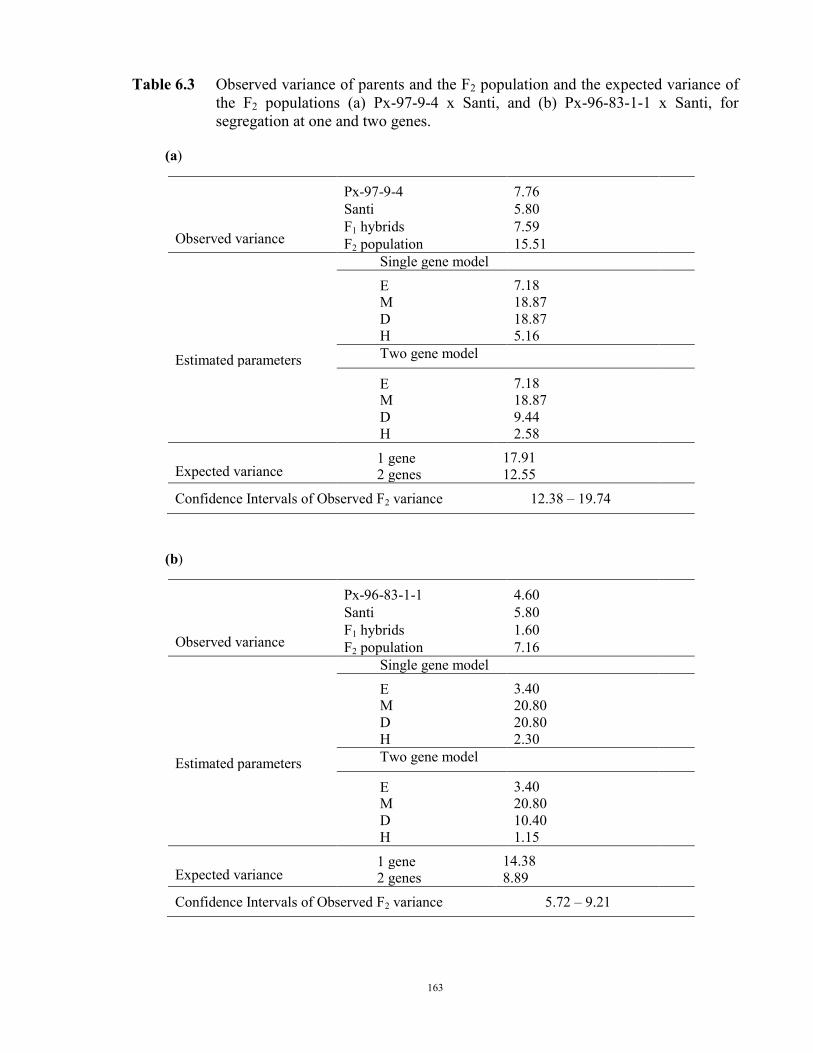
163
Table 6.3 Observed variance of parents and the F2 population and the expected variance of the F2 populations (a) Px-97-9-4 x Santi, and (b) Px-96-83-1-1 x Santi, for segregation at one and two genes.
(a)
Observed variance
Px-97-9-4 7.76 Santi 5.80 F1 hybrids 7.59 F2 population 15.51
Single gene model E 7.18 M 18.87 D 18.87 H 5.16
Estimated parameters Two gene model E 7.18
M 18.87 D 9.44 H 2.58
Expected variance 1 gene 17.91 2 genes 12.55
Confidence Intervals of Observed F2 variance 12.38 – 19.74 (b)
Observed variance
Px-96-83-1-1 4.60 Santi 5.80 F1 hybrids 1.60 F2 population 7.16
Single gene model
E 3.40 M 20.80 D 20.80 H 2.30
Estimated parameters Two gene model E 3.40
M 20.80 D 10.40 H 1.15
Expected variance 1 gene 14.38 2 genes 8.89
Confidence Intervals of Observed F2 variance 5.72 – 9.21
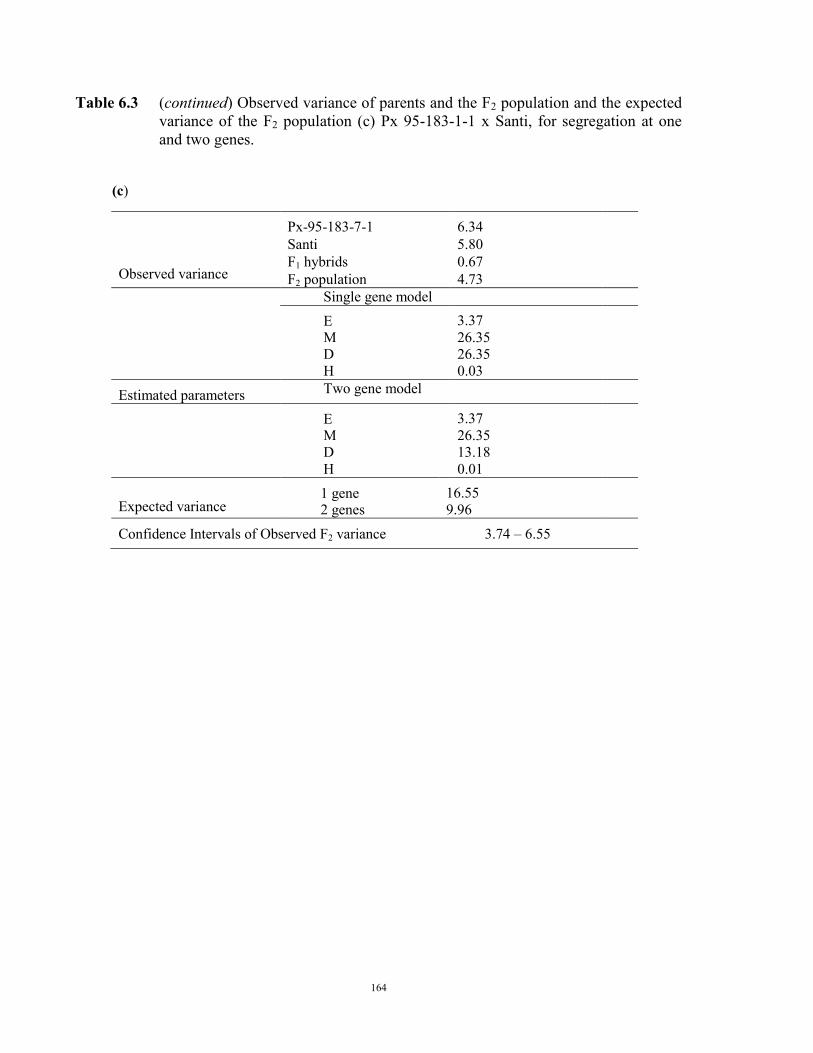
164
Table 6.3 (continued) Observed variance of parents and the F2 population and the expected
variance of the F2 population (c) Px 95-183-1-1 x Santi, for segregation at one and two genes.
(c)
Observed variance
Px-95-183-7-1 6.34 Santi 5.80 F1 hybrids 0.67 F2 population 4.73
Single gene model
E 3.37 M 26.35 D 26.35 H 0.03
Estimated parameters Two gene model E 3.37
M 26.35 D 13.18 H 0.01
Expected variance 1 gene 16.55 2 genes 9.96
Confidence Intervals of Observed F2 variance 3.74 – 6.55
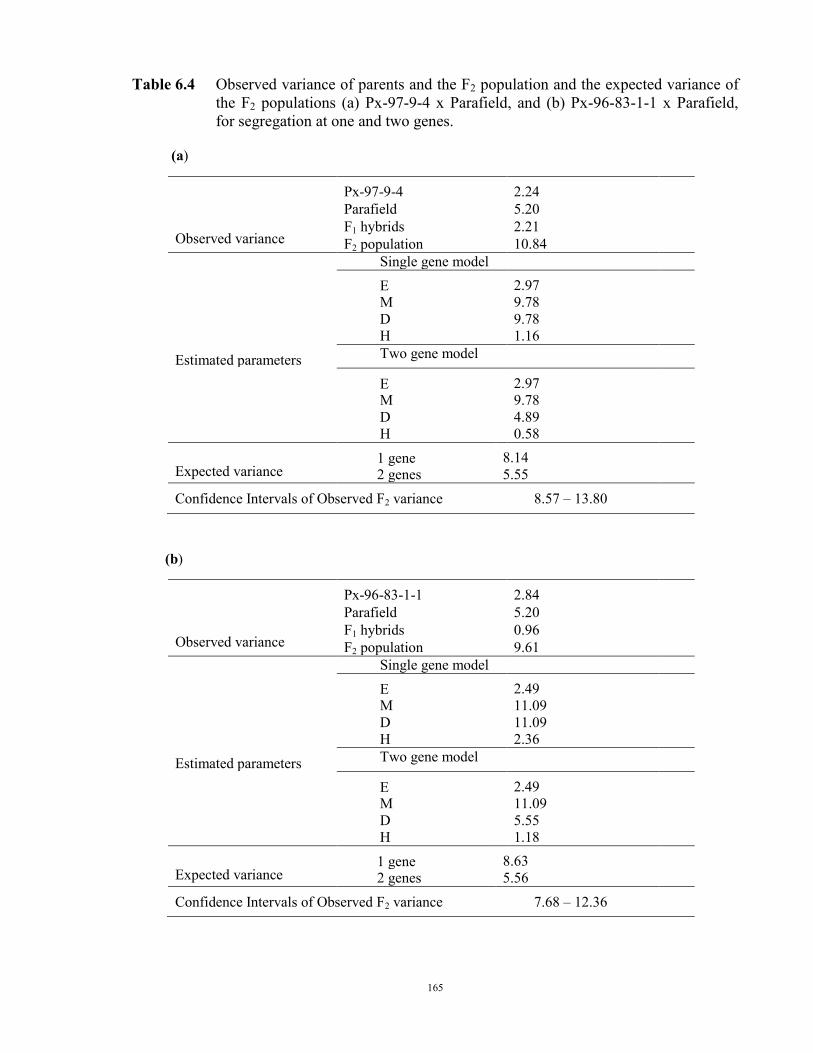
165
Table 6.4 Observed variance of parents and the F2 population and the expected variance of the F2 populations (a) Px-97-9-4 x Parafield, and (b) Px-96-83-1-1 x Parafield, for segregation at one and two genes.
(a)
Observed variance
Px-97-9-4 2.24 Parafield 5.20 F1 hybrids 2.21 F2 population 10.84
Single gene model E 2.97 M 9.78 D 9.78 H 1.16
Estimated parameters Two gene model E 2.97
M 9.78 D 4.89 H 0.58
Expected variance 1 gene 8.14 2 genes 5.55
Confidence Intervals of Observed F2 variance 8.57 – 13.80
(b)
Observed variance
Px-96-83-1-1 2.84 Parafield 5.20 F1 hybrids 0.96 F2 population 9.61
Single gene model
E 2.49 M 11.09 D 11.09 H 2.36
Estimated parameters Two gene model E 2.49
M 11.09 D 5.55 H 1.18
Expected variance 1 gene 8.63 2 genes 5.56
Confidence Intervals of Observed F2 variance 7.68 – 12.36
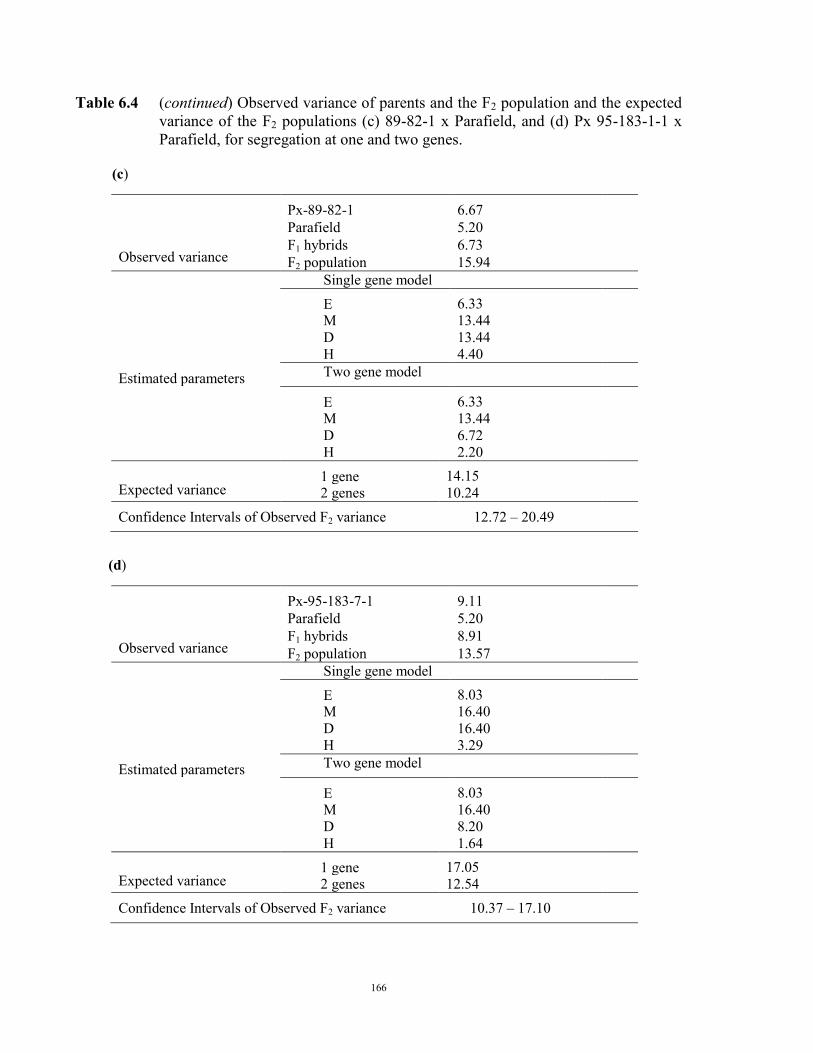
166
Table 6.4 (continued) Observed variance of parents and the F2 population and the expected
variance of the F2 populations (c) 89-82-1 x Parafield, and (d) Px 95-183-1-1 x Parafield, for segregation at one and two genes.
(c)
Observed variance
Px-89-82-1 6.67 Parafield 5.20 F1 hybrids 6.73 F2 population 15.94
Single gene model
E 6.33 M 13.44 D 13.44 H 4.40
Estimated parameters Two gene model E 6.33
M 13.44 D 6.72 H 2.20
Expected variance 1 gene 14.15 2 genes 10.24
Confidence Intervals of Observed F2 variance 12.72 – 20.49
(d)
Observed variance
Px-95-183-7-1 9.11 Parafield 5.20 F1 hybrids 8.91 F2 population 13.57
Single gene model
E 8.03 M 16.40 D 16.40 H 3.29
Estimated parameters Two gene model E 8.03
M 16.40 D 8.20 H 1.64
Expected variance 1 gene 17.05 2 genes 12.54
Confidence Intervals of Observed F2 variance 10.37 – 17.10
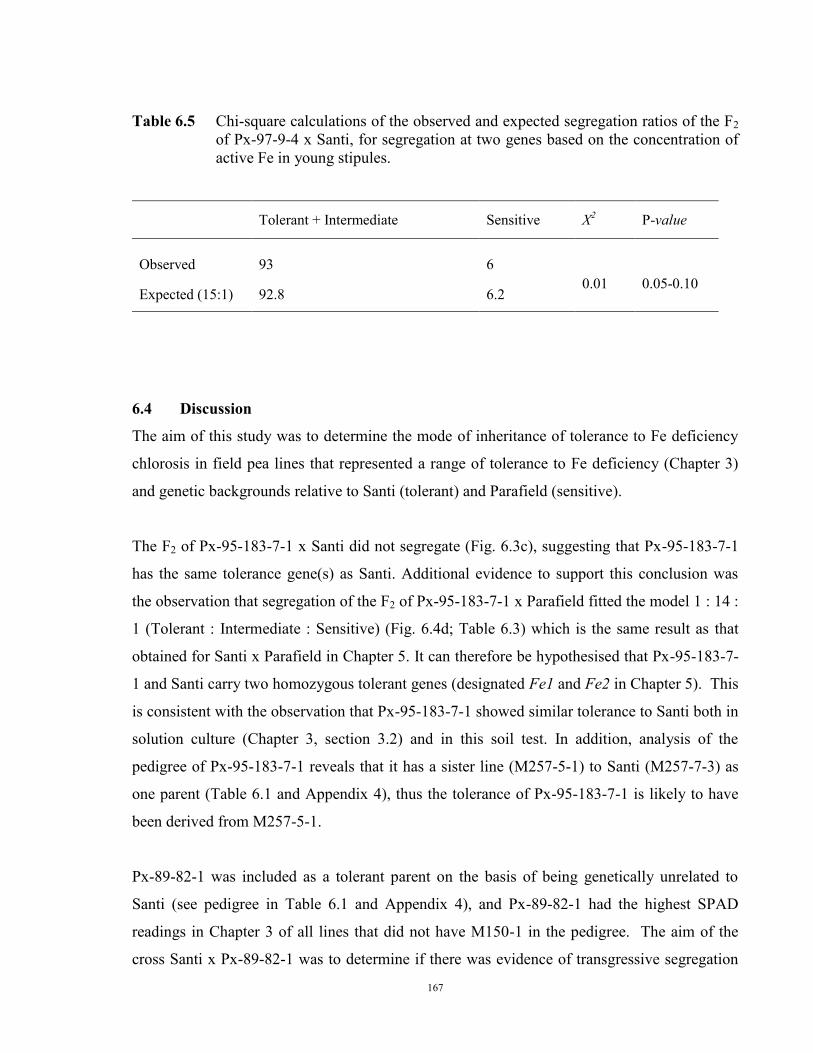
167
Table 6.5 Chi-square calculations of the observed and expected segregation ratios of the F2
of Px-97-9-4 x Santi, for segregation at two genes based on the concentration of active Fe in young stipules.
Tolerant + Intermediate Sensitive X2 P-value
Observed
93
6
0.01
0.05-0.10 Expected (15:1) 92.8 6.2
6.4 Discussion
The aim of this study was to determine the mode of inheritance of tolerance to Fe deficiency
chlorosis in field pea lines that represented a range of tolerance to Fe deficiency (Chapter 3)
and genetic backgrounds relative to Santi (tolerant) and Parafield (sensitive).
The F2 of Px-95-183-7-1 x Santi did not segregate (Fig. 6.3c), suggesting that Px-95-183-7-1
has the same tolerance gene(s) as Santi. Additional evidence to support this conclusion was
the observation that segregation of the F2 of Px-95-183-7-1 x Parafield fitted the model 1 : 14 :
1 (Tolerant : Intermediate : Sensitive) (Fig. 6.4d; Table 6.3) which is the same result as that
obtained for Santi x Parafield in Chapter 5. It can therefore be hypothesised that Px-95-183-7-
1 and Santi carry two homozygous tolerant genes (designated Fe1 and Fe2 in Chapter 5). This
is consistent with the observation that Px-95-183-7-1 showed similar tolerance to Santi both in
solution culture (Chapter 3, section 3.2) and in this soil test. In addition, analysis of the
pedigree of Px-95-183-7-1 reveals that it has a sister line (M257-5-1) to Santi (M257-7-3) as
one parent (Table 6.1 and Appendix 4), thus the tolerance of Px-95-183-7-1 is likely to have
been derived from M257-5-1.
Px-89-82-1 was included as a tolerant parent on the basis of being genetically unrelated to
Santi (see pedigree in Table 6.1 and Appendix 4), and Px-89-82-1 had the highest SPAD
readings in Chapter 3 of all lines that did not have M150-1 in the pedigree. The aim of the
cross Santi x Px-89-82-1 was to determine if there was evidence of transgressive segregation
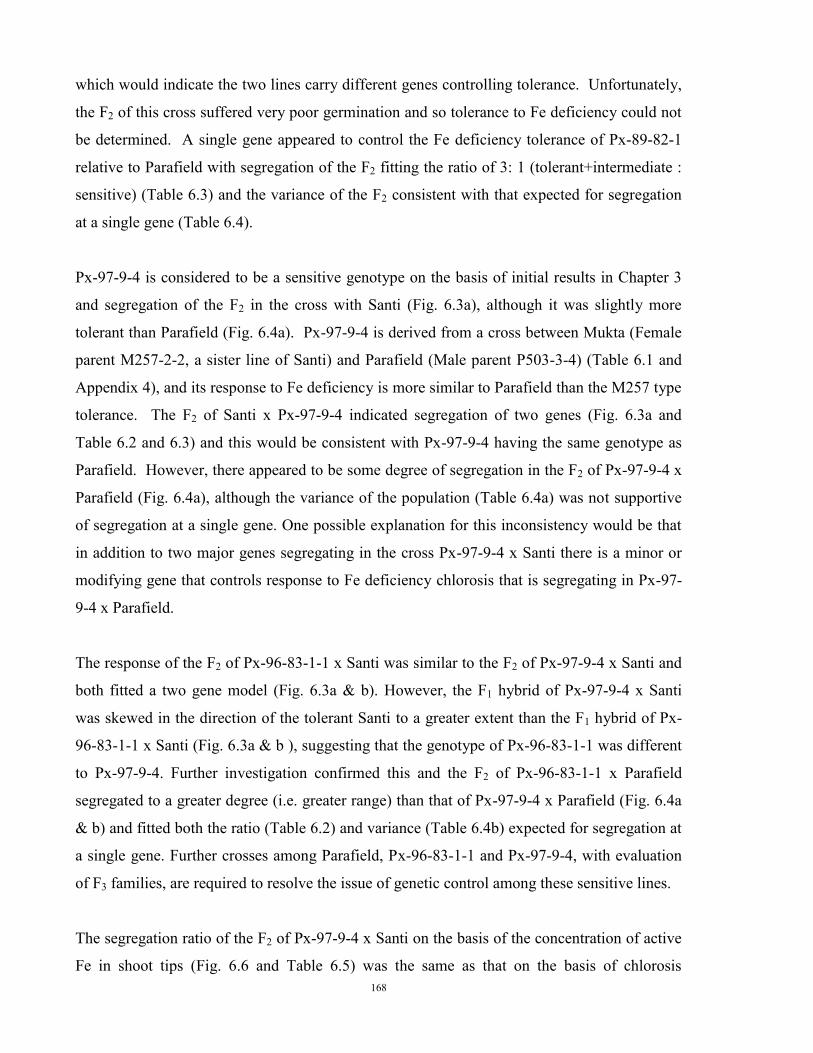
168
which would indicate the two lines carry different genes controlling tolerance. Unfortunately,
the F2 of this cross suffered very poor germination and so tolerance to Fe deficiency could not
be determined. A single gene appeared to control the Fe deficiency tolerance of Px-89-82-1
relative to Parafield with segregation of the F2 fitting the ratio of 3: 1 (tolerant+intermediate :
sensitive) (Table 6.3) and the variance of the F2 consistent with that expected for segregation
at a single gene (Table 6.4).
Px-97-9-4 is considered to be a sensitive genotype on the basis of initial results in Chapter 3
and segregation of the F2 in the cross with Santi (Fig. 6.3a), although it was slightly more
tolerant than Parafield (Fig. 6.4a). Px-97-9-4 is derived from a cross between Mukta (Female
parent M257-2-2, a sister line of Santi) and Parafield (Male parent P503-3-4) (Table 6.1 and
Appendix 4), and its response to Fe deficiency is more similar to Parafield than the M257 type
tolerance. The F2 of Santi x Px-97-9-4 indicated segregation of two genes (Fig. 6.3a and
Table 6.2 and 6.3) and this would be consistent with Px-97-9-4 having the same genotype as
Parafield. However, there appeared to be some degree of segregation in the F2 of Px-97-9-4 x
Parafield (Fig. 6.4a), although the variance of the population (Table 6.4a) was not supportive
of segregation at a single gene. One possible explanation for this inconsistency would be that
in addition to two major genes segregating in the cross Px-97-9-4 x Santi there is a minor or
modifying gene that controls response to Fe deficiency chlorosis that is segregating in Px-97-
9-4 x Parafield.
The response of the F2 of Px-96-83-1-1 x Santi was similar to the F2 of Px-97-9-4 x Santi and
both fitted a two gene model (Fig. 6.3a & b). However, the F1 hybrid of Px-97-9-4 x Santi
was skewed in the direction of the tolerant Santi to a greater extent than the F1 hybrid of Px-
96-83-1-1 x Santi (Fig. 6.3a & b ), suggesting that the genotype of Px-96-83-1-1 was different
to Px-97-9-4. Further investigation confirmed this and the F2 of Px-96-83-1-1 x Parafield
segregated to a greater degree (i.e. greater range) than that of Px-97-9-4 x Parafield (Fig. 6.4a
& b) and fitted both the ratio (Table 6.2) and variance (Table 6.4b) expected for segregation at
a single gene. Further crosses among Parafield, Px-96-83-1-1 and Px-97-9-4, with evaluation
of F3 families, are required to resolve the issue of genetic control among these sensitive lines.
The segregation ratio of the F2 of Px-97-9-4 x Santi on the basis of the concentration of active
Fe in shoot tips (Fig. 6.6 and Table 6.5) was the same as that on the basis of chlorosis
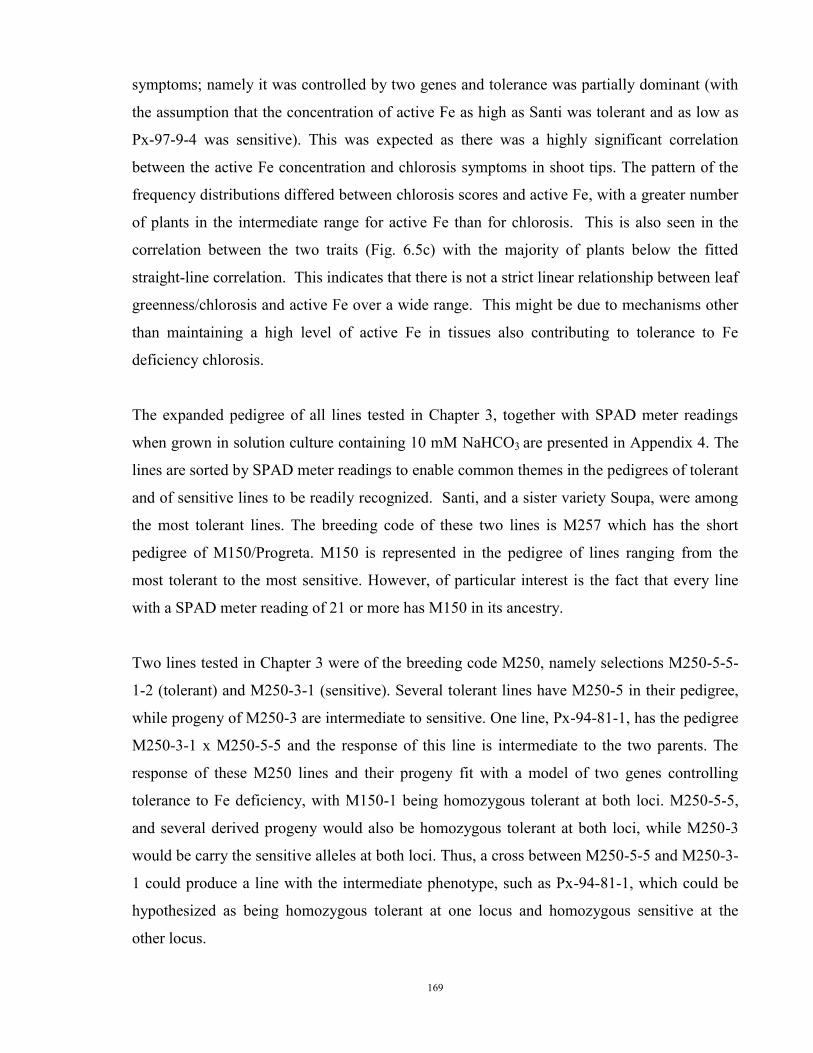
169
symptoms; namely it was controlled by two genes and tolerance was partially dominant (with
the assumption that the concentration of active Fe as high as Santi was tolerant and as low as
Px-97-9-4 was sensitive). This was expected as there was a highly significant correlation
between the active Fe concentration and chlorosis symptoms in shoot tips. The pattern of the
frequency distributions differed between chlorosis scores and active Fe, with a greater number
of plants in the intermediate range for active Fe than for chlorosis. This is also seen in the
correlation between the two traits (Fig. 6.5c) with the majority of plants below the fitted
straight-line correlation. This indicates that there is not a strict linear relationship between leaf
greenness/chlorosis and active Fe over a wide range. This might be due to mechanisms other
than maintaining a high level of active Fe in tissues also contributing to tolerance to Fe
deficiency chlorosis.
The expanded pedigree of all lines tested in Chapter 3, together with SPAD meter readings
when grown in solution culture containing 10 mM NaHCO3 are presented in Appendix 4. The
lines are sorted by SPAD meter readings to enable common themes in the pedigrees of tolerant
and of sensitive lines to be readily recognized. Santi, and a sister variety Soupa, were among
the most tolerant lines. The breeding code of these two lines is M257 which has the short
pedigree of M150/Progreta. M150 is represented in the pedigree of lines ranging from the
most tolerant to the most sensitive. However, of particular interest is the fact that every line
with a SPAD meter reading of 21 or more has M150 in its ancestry.
Two lines tested in Chapter 3 were of the breeding code M250, namely selections M250-5-5-
1-2 (tolerant) and M250-3-1 (sensitive). Several tolerant lines have M250-5 in their pedigree,
while progeny of M250-3 are intermediate to sensitive. One line, Px-94-81-1, has the pedigree
M250-3-1 x M250-5-5 and the response of this line is intermediate to the two parents. The
response of these M250 lines and their progeny fit with a model of two genes controlling
tolerance to Fe deficiency, with M150-1 being homozygous tolerant at both loci. M250-5-5,
and several derived progeny would also be homozygous tolerant at both loci, while M250-3
would be carry the sensitive alleles at both loci. Thus, a cross between M250-5-5 and M250-3-
1 could produce a line with the intermediate phenotype, such as Px-94-81-1, which could be
hypothesized as being homozygous tolerant at one locus and homozygous sensitive at the
other locus.
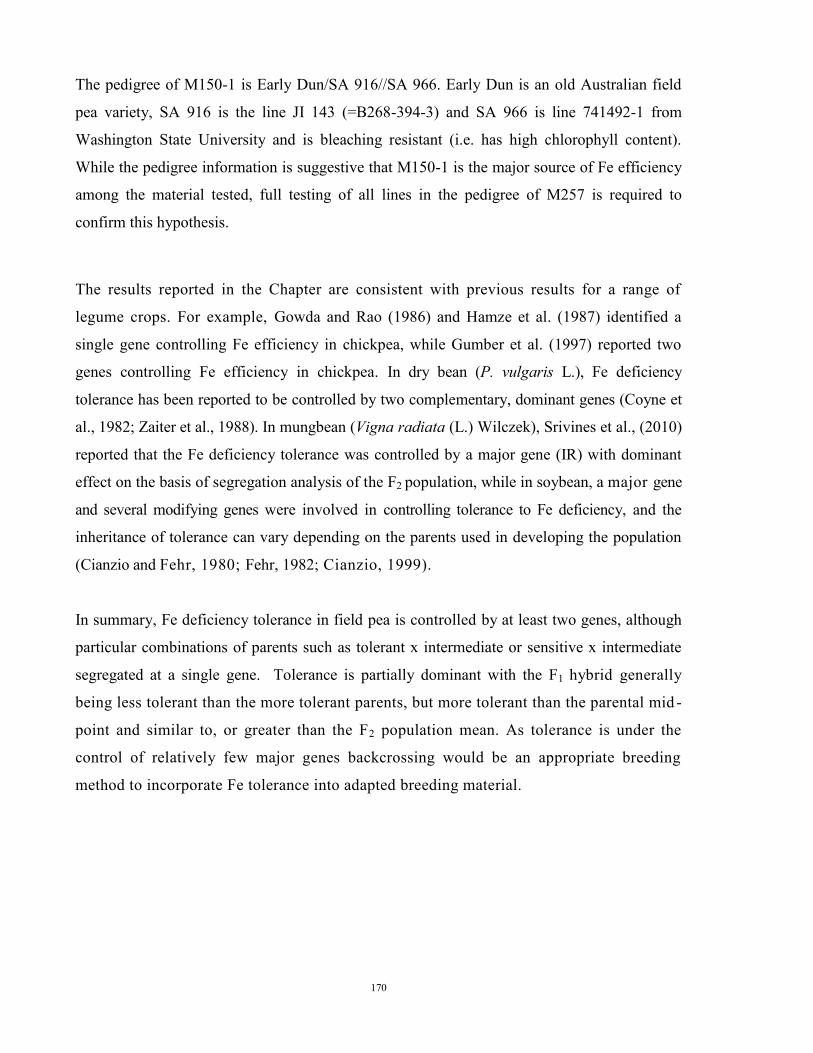
170
The pedigree of M150-1 is Early Dun/SA 916//SA 966. Early Dun is an old Australian field
pea variety, SA 916 is the line JI 143 (=B268-394-3) and SA 966 is line 741492-1 from
Washington State University and is bleaching resistant (i.e. has high chlorophyll content).
While the pedigree information is suggestive that M150-1 is the major source of Fe efficiency
among the material tested, full testing of all lines in the pedigree of M257 is required to
confirm this hypothesis.
The results reported in the Chapter are consistent with previous results for a range of
legume crops. For example, Gowda and Rao (1986) and Hamze et al. (1987) identified a
single gene controlling Fe efficiency in chickpea, while Gumber et al. (1997) reported two
genes controlling Fe efficiency in chickpea. In dry bean (P. vulgaris L.), Fe deficiency
tolerance has been reported to be controlled by two complementary, dominant genes (Coyne et
al., 1982; Zaiter et al., 1988). In mungbean (Vigna radiata (L.) Wilczek), Srivines et al., (2010)
reported that the Fe deficiency tolerance was controlled by a major gene (IR) with dominant
effect on the basis of segregation analysis of the F2 population, while in soybean, a major gene
and several modifying genes were involved in controlling tolerance to Fe deficiency, and the
inheritance of tolerance can vary depending on the parents used in developing the population
(Cianzio and Fehr, 1980; Fehr, 1982; Cianzio, 1999).
In summary, Fe deficiency tolerance in field pea is controlled by at least two genes, although
particular combinations of parents such as tolerant x intermediate or sensitive x intermediate
segregated at a single gene. Tolerance is partially dominant with the F1 hybrid generally
being less tolerant than the more tolerant parents, but more tolerant than the parental mid -
point and similar to, or greater than the F2 population mean. As tolerance is under the
control of relatively few major genes backcrossing would be an appropriate breeding
method to incorporate Fe tolerance into adapted breeding material.
171
CHAPTER 7
General discussion
Several aspects related to Fe deficiency tolerance of field pea have been studied in this thesis.
These included (1) development of an appropriate screening method for Fe deficiency
tolerance, (2) identification of genotypic variation for Fe deficiency tolerance, and (3)
investigations into the physiological mechanisms and genetic control of Fe deficiency
tolerance. The results should contribute to both the efficiency and long-term effectiveness of
breeding Fe deficiency tolerant cultivars.
Developing appropriate screening methods is important to enable identification of, and
subsequently utilize, intraspecific variation for traits that will improve the adaptation of a crop
to the environments in which it will be grown. In this study, solution and soil based methods
of screening were developed and the results indicate that there is genetic variation amongst
Australian field pea varieties and breeding lines for tolerance to Fe deficiency (Chapter 3).
Application of high (> 10 mM) HCO3-, as either the K or Na form in solution culture, and a
high soil moisture content (120% of field capacity) for calcareous soil in pots, produced severe
chlorosis on sensitive genotypes and some chlorosis on tolerant plants. The degree of chlorosis
was determined by the use of a Minolta SPAD 502 meter to provide a measure of leaf
greenness and thus a correlated measure of leaf chlorophyll content. The chlorotic symptoms
were alleviated by the application of Fe fertilizers to either soil or plants, thus confirming the
chlorosis was a symptom of Fe deficiency (Chapter 3).
Screening on the basis of chlorosis scores in pots containing calcareous soil collected from the
Millicent district, South Australia, and in solution culture amended with HCO3-, produced
consistent results for Santi (tolerant) and Parafield (sensitive). As both solution and soil based
methods of screening were able to induce chlorosis and differentiate between genotypes, both
methods are considered to be appropriate to use for screening for Fe deficiency tolerance of
field pea in particular, and for other grain legumes in general. Solution based methods have
been used extensively to screen for Fe deficiency tolerance of several crop legume species,
including field pea (Zribi and Gharzali, 2002; Jelali et al., 2010), chickpea (Chaney et al.,
1992; Gharsalli et al., 2001; Ohwaki and Sugahara, 1993), white lupin (Bertoni, 1992;
172
Santiago and Delgado, 2010), soybean (Lin et al., 1998; Norvell and Adams, 2006; Liesch et
al., 2011)), and peanut (Gao and Shi, 2007). Similarly, calcareous soil in pots was also used
to identify Fe deficiency tolerance in grain legumes, such as lupin (White and Robson, 1989;
Santiago and Delgado, 2010) and soybean (Inskeep and Bloom, 1986). The experiments
undertaken in this thesis did not extend to field validation of results obtained under controlled
conditions and this is a critical aspect of the research that should be undertaken in the next
stage of investigations. However, a significant correlation has been reported between results of
screening for tolerance to Fe deficiency chlorosis in solution culture and response in field
trials in a calcareous soil for soybean (Jessen et al., 1988; Dragonuk et al., 1989; Lin et al.,
1998; Zocchi et al., 2007), chickpea (Chaney et al., 1992), lentil (Hamze et al., 1987), and
peanut (Gao and Shi, 2007) and it would therefore appear likely that the responses for field
pea in controlled conditions would also be observed in the field.
A high level of variation in response to Fe deficiency was identified among field pea cultivars
and breeding lines in this study (Fig 3.2). Several Australian cultivars (eg Santi and Soupa)
were tolerant to Fe deficiency chlorosis and developed a minor level of chlorosis when grown
in the Millicent soil and in solution culture with 10 mM HCO3-. Because a good level of
tolerance was identified among well adapted Australian cultivars there was not greater
exploration of the P. sativum genepool to identify new sources of tolerance. Germplasm
collections of lentil (Erskine et al., 1993) and chickpea (Saxena et al., 1996) have been
screened for tolerance to Fe deficiency chlorosis and the level of tolerance could be related to
the soil types in the region of origin. In particular, lentil lines originating from Syria and
Turkey, where alkaline soils predominate, were generally tolerant while many lines from India
and Ethiopia were sensitive. Targetted screening of field pea germplasm from regions with
alkaline soils should maximize the likelihood of identifying new sources of tolerance to Fe
deficiency chlorosis. The Millicent soil at 120% field capacity would be an appropriate
treatment for screening germplasm with the objective of identifying additional lines with a
level of tolerance equivalent to Santi, however this treatment might not impose a sufficient
level of stress to differentiate between Santi and lines with a greater level of tolerance.
Screening in solution culture with 10 or 15 mM HCO3- might be more appropriate to identify
very tolerant lines.
173
A number of physiological mechanisms, including acquisition from solution, distribution in
the plant and form of Fe, were investigated to determine the basis for variation in tolerance to
Fe deficiency. Understanding the mechanism(s) of tolerance would enable selection for the
primary response rather than a secondary effect that might be subject to environmental and
temporal interactions. These studies were undertaken for a limited number of lines and were
generally based on comparisons of Santi and Parafield or BC1F2 progeny of
Santi/Parafield//Parafield. Santi and Parafield are both derived from the South Australian field
pea breeding program and have Early Dun as a common ancestor. They therefore represent a
very specific set of germplasm and any negative results of these investigations should not be
extrapolated to the P. sativum genepool, but rather are specific to these Australian cultivars.
Acquisition of Fe The major mechanism controlling tolerance to Fe deficiency chlorosis did
not appear to be related to acquisition. This conclusion is based on two observations. (1) Fe
deficiency has been reported to induce root membrane-bound reductase activity for Strategy I
plants (see Marschner and Römheld, 1994; Lucena et al., 2007), including field pea (Welch et
al., 1993; Jelali et al., 2010). This response was measured in experiments conducted in
Chapter 4 and the level of root Fe(III) reductase increased approximately 8 days after
imposing the HCO3- treatment. However, there was no difference in reduction rate between
tolerant and sensitive genotypes (Fig. 4.4). (2) The concentration of total Fe in the stipules
was not significantly different between tolerant and sensitive lines (Fig. 3.21; Fig. 4.2). A poor
correlation between total Fe and leaf chlorophyll content has been reported for a range of
crops, e.g. cotton (Olsen and Brown, 1981), pear (Abadia et al., 1989), and peach (Rashid et
al., 1990). Another mechanism that can increase acquisition of Fe, namely reducing the pH of
the rhizosphere through the extrusion of H+, and has been reported as a significant factor in
genetic variation in tolerance to Fe deficiency for mung bean (Ohwaki et al., 1997), soybean
(Zocchi et al., 2007) and peanut (Gao and Shi, 2007) was not specifically tested in these
experiments. In the solution culture experiments described in this thesis, tolerant and sensitive
lines were grown together in solution culture in large containers with continuous aeration and
root systems of all plants were intertwined. It would therefore appear unlikely that the tolerant
lines were able to modify the solution pH and acquire a greater amount of Fe than the sensitive
lines, however further experimentation is required to confirm this conclusion.
174
Distribution of Fe The distribution of Fe throughout the shoot was unlikely to be a major
factor determining genetic variation in tolerance to Fe deficiency as there was a similar pattern
of distribution of total Fe, from shoot tips to older leaves, of tolerant and sensitive lines (Fig.
4.3c). The concentration of total Fe was greatest in the YOS or YOL of all lines and this
coincided with the leaf or stipule with the most severe chlorosis.
Form of Fe In the series of experiments undertaken in this study, there was a highly
significant association between active Fe in young shoots and tolerance to Fe deficiency
chlorosis (Fig. 4.1; Fig. 6.5). Chlorosis was most severe on youngest leaves and/or stipules,
but leaves/stipules at the 5th node from the top were unaffected. The concentration of active Fe
followed this same pattern with the concentration being lowest in the YOL and increasing to
the lower nodes. On the other hand, the concentration of total Fe was generally greatest in the
YOL, where chlorosis was most severe, and decreased at the lower nodes (Fig. 4.3). There
was also a highly significant correlation between SPAD readings and active Fe of young
tissues of the F2 of Santi x Px 97-9-4 with the coefficient correlation (r) = 0.81 (P<0.01) (Fig
6.5). A similar response, with low HCl-extractable Fe2+ but high total Fe in leaves of chickpea
genotypes that exhibited a high level of chlorosis was reported by Kuar et al. (1984), while
there was no difference in concentration of total Fe in apical leaves between two chickpea
genotypes that contrasted in tolerance to Fe deficiency (Ohwaki and Sugahara,1993). On the
other hand, the concentrations of both active and total Fe were lower in chlorotic young leaves
of the rough-seeded lupin, Lupinus pilosus (Brand et al., 2000). The association between
active Fe and tolerance to Fe deficiency chlorosis in a segregating population provides much
greater confidence that this is a direct effect, compared to a chance association that might
occur when comparing a limited number of unrelated fixed lines that contrast for several
characteristics.
The physiological studies indicated that the mechanism that could account for the greatest
effect in comparisons of Santi, Parafield and derived progeny was maintenance of a high
concentration of active Fe in young tissues of tolerant lines. Further studies are required to
determine how this is achieved. Increased endogenous Fe-chelators may improve Fe mobility
and retranslocation and therefore act as a tolerance mechanism. Nicotianamine is one such
chelator which is thought to have a role in the internal transport of Fe and other metals
(Stephan, et al., 1994) and severe Fe-deficiency has been reported when nicotianamine ia not
175
present. (Pich, et al., 1997). Alternatively, the reductase activity in the leaf tissue may also be
different between the tolerant and intolerant genotypes and this needs measuring.
The material tested in these studies varied for three plant morphological traits, namely plant
height (tall LeLe v short lele), flower colour (coloured CoCo v white coco), and leaf type
(conventional AfAf v semileafless or afila afaf). As all of these traits are major breeding
objectives within the Australian field pea breeding program information on any association
between these traits and Fe efficiency is important in developing breeding strategies to
combine any of these morphological traits with Fe efficiency. The potential association
between these morphological traits and tolerance to Fe deficiency chlorosis was tested in two
ways (1) comparison of eight lines that contrasted for various combinations of traits (Chapter
3, Section 3.2.4.2) and (2) observation of segregation of the morphological traits and tolerance
to Fe deficiency (Chapter 5, Tables 5.1 & 5.2). Tolerance to Fe deficiency was found to be
independent of the three morphological traits, with any combination of traits observed among
tolerant and sensitive genotypes in Chapter 3, and no evidence of linkage between individual
traits and tolerance to Fe deficiency in Chapter 5. In addition, all plants in the BC1F1
population Santi/Parafield//Parafield were morphologically the same as Parafield (tall,
coloured flower, conventional leaf) but there was a large range in tolerance to Fe deficiency
chlorosis, from similar to Parafield to similar to the F1 hybrid Santi/Parafield (Fig 5.9 & 5.10).
These results indicate that it should be possible to develop Fe deficiency tolerant lines with
any combination of morphological traits.
Determining the genetic control of tolerance to Fe chlorosis deficiency would enable
appropriate breeding strategies to be implemented to incorporate tolerance into future
Australian pea varieties that are targeted for production in regions where alkaline soils
predominate, and transient water logging occurs. The results of inheritance studies for peas
should also add to the overall body of knowledge for the closely related cool season legumes
in the Galegoid clade. The experiments reported in this study demonstrated that tolerance to
Fe deficiency chlorosis is a partially dominant trait with no reciprocal effects for the crosses
between tolerant and sensitive genotypes (Chapter 5 and Chapter 6). The outcome of
investigations into the number of genes controlling Fe deficiency in the cross Parafield x Santi
indicated that two genes are more likely than a single gene. The F2 generation, which was
based on phenotypic data with a continuous distribution, indicated two genes when subjected
176
to χ2 analysis based on arbitrary cut-off points (related to response of the parents), and a single
gene based on the population variance compared to variance of parents and F1 hybrid. On the
other hand, the F3 generation which was based on genotypic data indicated two genes and
included a significant number of homozygous intermediate families which would not occur for
segregation of a single gene. The distribution of the BC1F1 population also fitted a two gene
model, with a large proportion of plants with an intermediate response and this would not be
expected for segregation at a single gene.
Further investigations in F2 segregation of the crosses between Santi or Parafield with
identified lines indicated that the number of genes controlling Fe deficiency tolerance varied,
depending on the parental lines used. For example, the crosses Santi (tolerant) x Px-97-9-4
(sensitive) and Px-95-183-7-1 (tolerant) x Parafield (sensitive) segregated at two genes, but
crosses between Parafield (sensitive) and Px-89-82-1, Px-96-83-1-1 (intermediate tolerant),
and Px-97-9-4 (sensitive), segregated at a single gene. Examination of the pedigrees of the 37
lines screened in Chapter 3 also revealed a pattern of inheritance of Fe deficiency tolerance that
was consistent with few major additive genes. Variation in the number of genes identified to
control tolerance to iron deficiency has also been observed in other food legumes, for example
chickpea. Gowda and Rao (1986) and Hamze et al. (1987) identified a single gene
controlling Fe efficiency, but Gumber et al. (1997) reported that there were two genes
controlling Fe efficiency. These contrasting results were probably due to different parental
lines in the various studies. In B toxicity of field pea, Bagheri et al. (1996) reported that a cross
between sensitive and tolerant parents segregated at two genes, but crosses between sensitive
and intermediate tolerant, or between intermediate tolerant and tolerant parents segregated at a
single gene.
Conclusion
Artificial screening methods including both a solution and soil based culture were developed
and variation for tolerance to Fe deficiency of field peas was observed within and between
several accessions. Tolerant genotypes were able to maintain a high concentration of active
Fe in young shoots, whereas active Fe in young chlorotic leaves of sensitive genotypes was
low. Based on the segregation of F1 hybrids, F2 progeny, F3 families and a backcross
population, Santi was identified to carry two dominant genes relative to the sensitive cultivar,
Parafield. One gene carrying tolerance was also identified when Parafield was crossed with

177
intermediate tolerant genotypes. These results should contribute to a long-term strategy in
breeding for tolerance to Fe deficiency chlorosis in optimizing field pea production in
Australia.

178
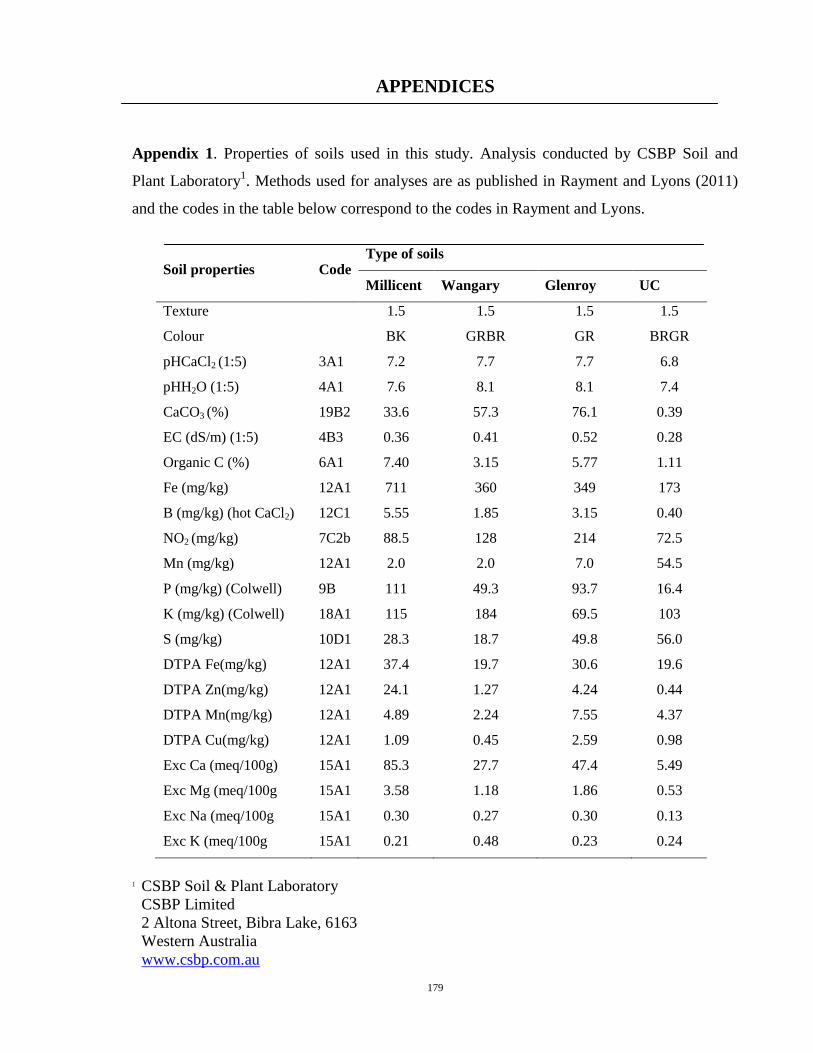
179
APPENDICES
Appendix 1. Properties of soils used in this study. Analysis conducted by CSBP Soil and
Plant Laboratory1. Methods used for analyses are as published in Rayment and Lyons (2011)
and the codes in the table below correspond to the codes in Rayment and Lyons.
Soil properties Code Type of soils
Millicent Wangary Glenroy UC
Texture 1.5 1.5 1.5 1.5
Colour BK GRBR GR BRGR
pHCaCl2 (1:5) 3A1 7.2 7.7 7.7 6.8
pHH2O (1:5) 4A1 7.6 8.1 8.1 7.4
CaCO3 (%) 19B2 33.6 57.3 76.1 0.39
EC (dS/m) (1:5) 4B3 0.36 0.41 0.52 0.28
Organic C (%) 6A1 7.40 3.15 5.77 1.11
Fe (mg/kg) 12A1 711 360 349 173
B (mg/kg) (hot CaCl2) 12C1 5.55 1.85 3.15 0.40
NO2 (mg/kg) 7C2b 88.5 128 214 72.5
Mn (mg/kg) 12A1 2.0 2.0 7.0 54.5
P (mg/kg) (Colwell) 9B 111 49.3 93.7 16.4
K (mg/kg) (Colwell) 18A1 115 184 69.5 103
S (mg/kg) 10D1 28.3 18.7 49.8 56.0
DTPA Fe(mg/kg) 12A1 37.4 19.7 30.6 19.6
DTPA Zn(mg/kg) 12A1 24.1 1.27 4.24 0.44
DTPA Mn(mg/kg) 12A1 4.89 2.24 7.55 4.37
DTPA Cu(mg/kg) 12A1 1.09 0.45 2.59 0.98
Exc Ca (meq/100g) 15A1 85.3 27.7 47.4 5.49
Exc Mg (meq/100g 15A1 3.58 1.18 1.86 0.53
Exc Na (meq/100g 15A1 0.30 0.27 0.30 0.13
Exc K (meq/100g 15A1 0.21 0.48 0.23 0.24
1 CSBP Soil & Plant Laboratory
CSBP Limited
2 Altona Street, Bibra Lake, 6163
Western Australia
www.csbp.com.au

180
Appendix 2. University of California (UC) modified potting mix
The UC soil was prepared as follows: 350 mL of course washed sand was steam sterilized at
100oC for 30 minutes, before being mixed with 250 L of Euroturf® peatmoss. After cooling for
10 minutes 450 g calcium hydroxide, 400 g calcium carbonate and 500 g Nitrophoska (N-P-K,
15-4-12) were mixed in for 20 seconds, resulting in a pH of 6.8. The soil was passed through a
10 mm sieve to remove stones and agglomerations of peat.
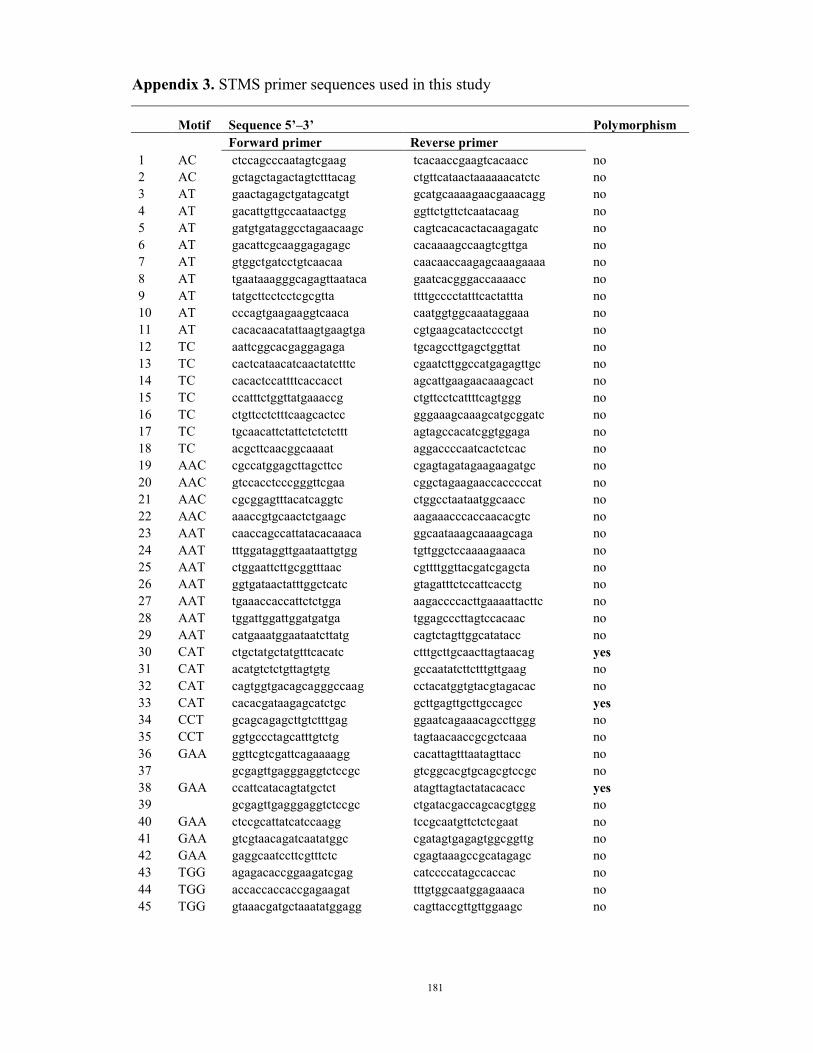
181
Appendix 3. STMS primer sequences used in this study
Motif Sequence 5’–3’ Polymorphism Forward primer Reverse primer 1 AC ctccagcccaatagtcgaag tcacaaccgaagtcacaacc no 2 AC gctagctagactagtctttacag ctgttcataactaaaaaacatctc no 3 AT gaactagagctgatagcatgt gcatgcaaaagaacgaaacagg no 4 AT gacattgttgccaataactgg ggttctgttctcaatacaag no 5 AT gatgtgataggcctagaacaagc cagtcacacactacaagagatc no 6 AT gacattcgcaaggagagagc cacaaaagccaagtcgttga no 7 AT gtggctgatcctgtcaacaa caacaaccaagagcaaagaaaa no 8 AT tgaataaagggcagagttaataca gaatcacgggaccaaaacc no 9 AT tatgcttcctcctcgcgtta ttttgcccctatttcactattta no 10 AT cccagtgaagaaggtcaaca caatggtggcaaataggaaa no 11 AT cacacaacatattaagtgaagtga cgtgaagcatactcccctgt no 12 TC aattcggcacgaggagaga tgcagccttgagctggttat no 13 TC cactcataacatcaactatctttc cgaatcttggccatgagagttgc no 14 TC cacactccattttcaccacct agcattgaagaacaaagcact no 15 TC ccatttctggttatgaaaccg ctgttcctcattttcagtggg no 16 TC ctgttcctctttcaagcactcc gggaaagcaaagcatgcggatc no 17 TC tgcaacattctattctctctcttt agtagccacatcggtggaga no 18 TC acgcttcaacggcaaaat aggaccccaatcactctcac no 19 AAC cgccatggagcttagcttcc cgagtagatagaagaagatgc no 20 AAC gtccacctcccgggttcgaa cggctagaagaaccacccccat no 21 AAC cgcggagtttacatcaggtc ctggcctaataatggcaacc no 22 AAC aaaccgtgcaactctgaagc aagaaacccaccaacacgtc no 23 AAT caaccagccattatacacaaaca ggcaataaagcaaaagcaga no 24 AAT tttggataggttgaataattgtgg tgttggctccaaaagaaaca no 25 AAT ctggaattcttgcggtttaac cgttttggttacgatcgagcta no 26 AAT ggtgataactatttggctcatc gtagatttctccattcacctg no 27 AAT tgaaaccaccattctctgga aagaccccacttgaaaattacttc no 28 AAT tggattggattggatgatga tggagcccttagtccacaac no 29 AAT catgaaatggaataatcttatg cagtctagttggcatatacc no 30 CAT ctgctatgctatgtttcacatc ctttgcttgcaacttagtaacag yes 31 CAT acatgtctctgttagtgtg gccaatatcttctttgttgaag no 32 CAT cagtggtgacagcagggccaag cctacatggtgtacgtagacac no 33 CAT cacacgataagagcatctgc gcttgagttgcttgccagcc yes 34 CCT gcagcagagcttgtctttgag ggaatcagaaacagccttggg no 35 CCT ggtgccctagcatttgtctg tagtaacaaccgcgctcaaa no 36 GAA ggttcgtcgattcagaaaagg cacattagtttaatagttacc no 37 gcgagttgagggaggtctccgc gtcggcacgtgcagcgtccgc no 38 GAA ccattcatacagtatgctct atagttagtactatacacacc yes 39 gcgagttgagggaggtctccgc ctgatacgaccagcacgtggg no 40 GAA ctccgcattatcatccaagg tccgcaatgttctctcgaat no 41 GAA gtcgtaacagatcaatatggc cgatagtgagagtggcggttg no 42 GAA gaggcaatccttcgtttctc cgagtaaagccgcatagagc no 43 TGG agagacaccggaagatcgag catccccatagccaccac no 44 TGG accaccaccaccgagaagat tttgtggcaatggagaaaca no 45 TGG gtaaacgatgctaaatatggagg cagttaccgttgttggaagc no
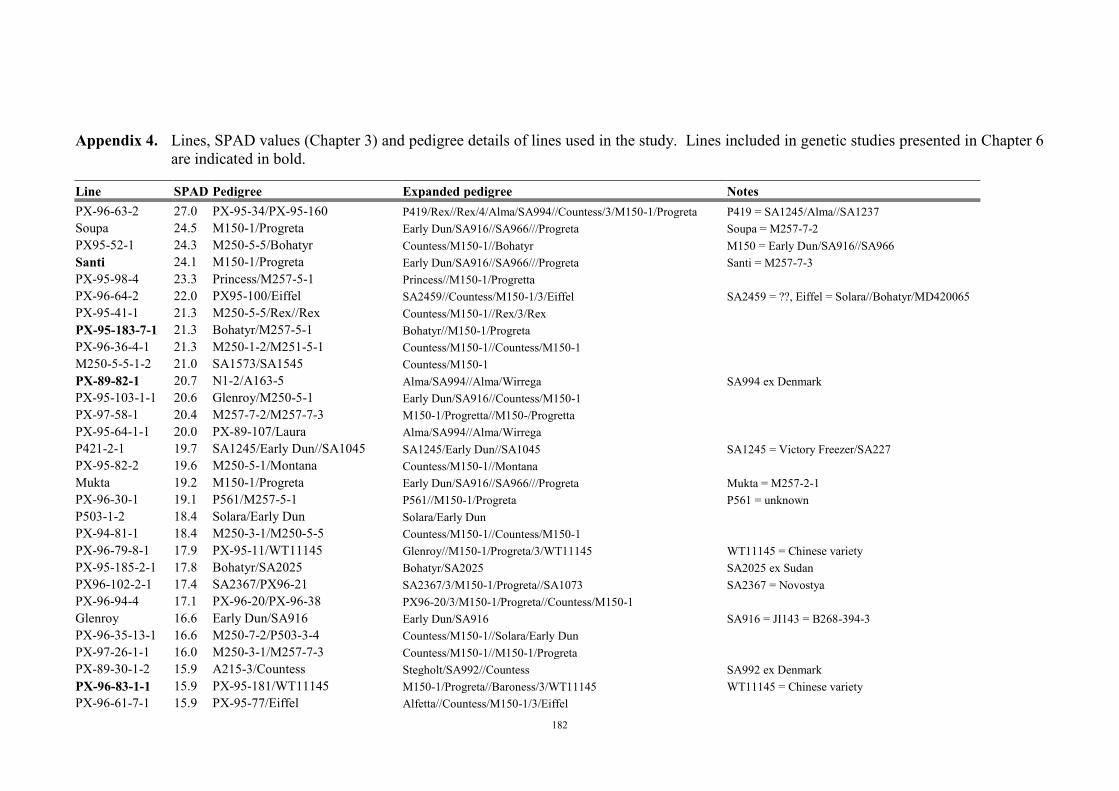
182
Appendix 4. Lines, SPAD values (Chapter 3) and pedigree details of lines used in the study. Lines included in genetic studies presented in Chapter 6 are indicated in bold.
Line SPAD Pedigree Expanded pedigree Notes PX-96-63-2 27.0 PX-95-34/PX-95-160 P419/Rex//Rex/4/Alma/SA994//Countess/3/M150-1/Progreta P419 = SA1245/Alma//SA1237 Soupa 24.5 M150-1/Progreta Early Dun/SA916//SA966///Progreta Soupa = M257-7-2 PX95-52-1 24.3 M250-5-5/Bohatyr Countess/M150-1//Bohatyr M150 = Early Dun/SA916//SA966 Santi 24.1 M150-1/Progreta Early Dun/SA916//SA966///Progreta Santi = M257-7-3 PX-95-98-4 23.3 Princess/M257-5-1 Princess//M150-1/Progretta PX-96-64-2 22.0 PX95-100/Eiffel SA2459//Countess/M150-1/3/Eiffel SA2459 = ??, Eiffel = Solara//Bohatyr/MD420065 PX-95-41-1 21.3 M250-5-5/Rex//Rex Countess/M150-1//Rex/3/Rex PX-95-183-7-1 21.3 Bohatyr/M257-5-1 Bohatyr//M150-1/Progreta PX-96-36-4-1 21.3 M250-1-2/M251-5-1 Countess/M150-1//Countess/M150-1 M250-5-5-1-2 21.0 SA1573/SA1545 Countess/M150-1 PX-89-82-1 20.7 N1-2/A163-5 Alma/SA994//Alma/Wirrega SA994 ex Denmark PX-95-103-1-1 20.6 Glenroy/M250-5-1 Early Dun/SA916//Countess/M150-1 PX-97-58-1 20.4 M257-7-2/M257-7-3 M150-1/Progretta//M150-/Progretta PX-95-64-1-1 20.0 PX-89-107/Laura Alma/SA994//Alma/Wirrega P421-2-1 19.7 SA1245/Early Dun//SA1045 SA1245/Early Dun//SA1045 SA1245 = Victory Freezer/SA227 PX-95-82-2 19.6 M250-5-1/Montana Countess/M150-1//Montana Mukta 19.2 M150-1/Progreta Early Dun/SA916//SA966///Progreta Mukta = M257-2-1 PX-96-30-1 19.1 P561/M257-5-1 P561//M150-1/Progreta P561 = unknown P503-1-2 18.4 Solara/Early Dun Solara/Early Dun PX-94-81-1 18.4 M250-3-1/M250-5-5 Countess/M150-1//Countess/M150-1 PX-96-79-8-1 17.9 PX-95-11/WT11145 Glenroy//M150-1/Progreta/3/WT11145 WT11145 = Chinese variety PX-95-185-2-1 17.8 Bohatyr/SA2025 Bohatyr/SA2025 SA2025 ex Sudan PX96-102-2-1 17.4 SA2367/PX96-21 SA2367/3/M150-1/Progreta//SA1073 SA2367 = Novostya PX-96-94-4 17.1 PX-96-20/PX-96-38 PX96-20/3/M150-1/Progreta//Countess/M150-1 Glenroy 16.6 Early Dun/SA916 Early Dun/SA916 SA916 = JI143 = B268-394-3 PX-96-35-13-1 16.6 M250-7-2/P503-3-4 Countess/M150-1//Solara/Early Dun PX-97-26-1-1 16.0 M250-3-1/M257-7-3 Countess/M150-1//M150-1/Progreta PX-89-30-1-2 15.9 A215-3/Countess Stegholt/SA992//Countess SA992 ex Denmark PX-96-83-1-1 15.9 PX-95-181/WT11145 M150-1/Progreta//Baroness/3/WT11145 WT11145 = Chinese variety PX-96-61-7-1 15.9 PX-95-77/Eiffel Alfetta//Countess/M150-1/3/Eiffel
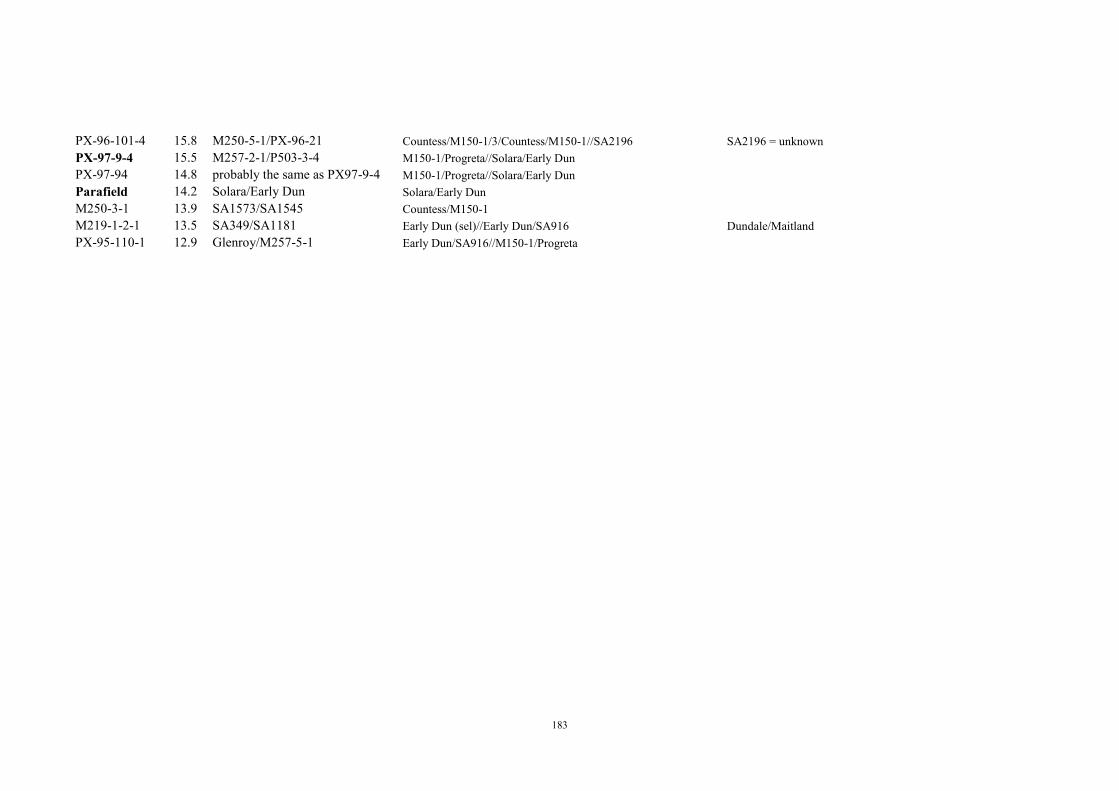
183
PX-96-101-4 15.8 M250-5-1/PX-96-21 Countess/M150-1/3/Countess/M150-1//SA2196 SA2196 = unknown PX-97-9-4 15.5 M257-2-1/P503-3-4 M150-1/Progreta//Solara/Early Dun PX-97-94 14.8 probably the same as PX97-9-4 M150-1/Progreta//Solara/Early Dun Parafield 14.2 Solara/Early Dun Solara/Early Dun M250-3-1 13.9 SA1573/SA1545 Countess/M150-1 M219-1-2-1 13.5 SA349/SA1181 Early Dun (sel)//Early Dun/SA916 Dundale/Maitland PX-95-110-1 12.9 Glenroy/M257-5-1 Early Dun/SA916//M150-1/Progreta

184
185
REFERENCES
Abadía A, M Sanz, J de las Rivas and J Abadía. 1989. Pear yellowness: an atypical iron chlorosis? Acta Hortic. 256:177-181.
Abadía J. 1992. Leaf responses to Fe deficiency: A review. J. Plant Nutr. 15:1699-1713.
Abadía J, A Álvarez-Fernández, AD Rombolà, M Sanz, M Tagliavini and A Abadia. 2004. Technologies for the diagnosis and remediation of Fe deficiency. Soil Sci. Plant Nutr. 50:965-971.
Abadía J, AFL Millan, A Rombolà and A Abadía. 2002. Organic acids and Fe deficiency: a review. Plant Soil 241:75-86.
Abadía J, A Álvarez-Fernández, F Morales, M Sanz and A Abadia. 2002.
Correction of iron chlorosis by foliar sprays. Acta Hortic.594:115121.
Abadía J, JN Nishio, E Monge, L Montanes and L Heras. 1985. Mineral composition of peach tree leaves affected by iron chlorosis. J. Plant Nutr. 8:697-708.
ABARE. 2007. Australian Crop Report, February 2007. Australian Bureau of Agricultural and Resource Economics. Canberra.
Aciksoz SB, A Yazici, L Ozturk and I Cakmak. 2011. Biofortification of wheat with iron through soil and foliar application of nitrogen and iron fertilizers. Plant Soil 349:215–225.
Adams MA, J Simon and S Pfautsch. 2010. Woody Legumes: A(re)view from The South. Tree Physiology 30:1072-1082.
Agnolon F, S Santi, Z Varanini and R Pinton. 2001. Enzymatic responses of cucumber roots to different levels of Fe supply. Plant Soil 241:35-41.
Ahmad M, A Ali, K Mahmood and M Tufail. 1995. Chlorosis in lentil. III. Preliminary studies on genetics of iron-deficiency chlorosis. Lens Newsletter 22:32-33.
Alcántara E, FJ Romera, M Canete and MD de la Guardia. 2000. Effect of bicarbonate and iron supply on Fe(III) reducing capacity of roots and leaf chlorosis of susceptible peach rootstock “Nemaguard”. J. Plant Nutr. 23:1607-1617.
Alhendawi RA. 2011. Comparisons between effects of bicarbonate and high pH on iron uptake, Fe III reducing capacity of the roots, PEP carboxylase activity, organic acid composition, and cation-anion balance of the xylem sap of maize seedlings. Am. J. Plant Nutr. Fert. Technol. 1(1):36-47.
Ali A, CM Yousaf and M Tufail. 1988. Screening of desi and kabuli chickpea types for iron-deficiency chlorosis. International Chickpea Newsletter 18:5-6.
Ali A, M Riaz-ul-Haque and MS Bhatti. 1997. Inheritance of resistance to iron-deficiency chlorosis in lentil. Lens Newsletter 24:28-29.
186
Alloush GA, J Le Bot, FE Sanders and EA Kirkby. 1990. Mineral nutrition of chickpea plants supplied with NO3
- or NH4- N. I. Ionic in relation to iron stress. J. Plant Nutr.
13:1575-1590.
Alloway BJ. 2008. Micronutrient and crop production: An Introduction. BJ Alloway (ed.). Micronutrient Deficiencies in Global Crop Production. Springer Science+Business Media. 1-35.
Álvarez-Fernàndez A, MA Sierra and JJ Lucena. 2002. Reactivity of synthetic Fe chelates with soils and soil components. Plant Soil 241:129-137.
Álvarez-Fernández A, P Garcia-Lavina, J Fidalgo, J Abadía and A Abadía. 2004.
Foliar fertilization to control iron chlorosis in pear (Pyrus communis L.) trees.
Plant Soil 262:5-15.
Ao TY, RL Chaney, RF Korcak, F Fan and M Faust. 1987. Influence of soil moisture on apple iron chlorosis development in a calcareous soil. Plant Soil 104:85-92.
Azia E and KA Stewart. 2001. Relationships between extractable chlorophyll and SPAD values in muskmelon leaves. J. Plant Nutr. 24:961-966.
BagheriA , JG Paull and AJ Rathjen. 1994. The response of Pisum sativum L. germplasm to high concentrations of soil boron. Euphytica 75:9-17.
Bagheri A, JG Paull and AJ Rathjen. 1996. Genetics of tolerance to high concentrations of soil boron in peas (Pisum sativum L.). Euphytica 87:69-75.
Baranger A, G Aubert, G Arnau, AL Lain, G Deniot, J Potier, C Weinachter, I Lejeune-Henaut, J Lallemand and J Burstin. 2004. Genetic diversity within Pisum sativum using proteinand PCR-based markers. Theor. Appl. Genet. 108:1309–1321.
Bavaresco L, M Fregoni and P Fraschini. 1991. Investigations on iron uptake and reduction by excised roots of different grapevine rootstocks and a V. vinifera cultivar. In Y Chen and Y Hadar (Eds.). Iron Nutrition and Interactions in Plants. Kluwer Academic, The Netherlands. pp. 139-143.
Beebe S, J Lynch, N Galwey, J Tohme and I Ochoa. 1997. A geographical approach to identify phosphorus-efficient genotypes among landraces and wild ancestors of common bean. Euphytica 95:325-336.
Bejiga G, KB Singh and MC Saxena. 1996. Evaluation of world collection of kabuli chickpea for resistance to iron-deficiency chlorosis. Genet. Resour. Crop Ev. 43:257-259.
Beněs I, K Schreiber, H Ripperger and A Kircheiss. 1983. Metal complex formation by nicotianamine, possible phytosiderophore. Experientia 39:261-262.
Bergmann W. 1992. Nutritional Disorders of Plants. Visual and Analytical Diagnosis. Jena: Gustav Fischer Verlag. p.15.
Bertoni GM, A Pissaloux, P Morard and DR Sayag. 1992. Bicarbonate-pH relationship with iron chlorosis in white lupine. J. Plant Nutr. 15:1509-1518.
187
Bienfait HF, HJ Lubberding, P Heutink, L Lindner, J Visser, R Kaptein and K Dijkstra. 1989. Rhizosphere acidification by iron deficient bean plants: the role of trace amounts of divalent metal ions. Plant Physiol. 90:359-364.
Bienfait HF and F van der Mark. 1983. Phytoferritin and its role in iron
metabolism. In: DA Robb and WS Pierpoint. (Eds.). Metals and
Micronutrients, Uptake and Utilization by Plants. Academic Press. London.
pp. 111-123.
Black MM 2003. Micronutrient Deficiencies and Cognitive Functioning.
Supplement. J. Nutr. 133: 3927S–3931S
Bloom PR and WP Inskeep. 1986. Factors affecting bicarbonate chemistry and iron chlorosis in soils. J. Plant Nutr. 9:215-228.
Bould C, EJ Hewitt and P Needham. 1983. Diagnosis of Nutritional Disorders in Higher Plants. Vol. 1. Principles. Her Majesty's Stationery Office. London
Bouranis DL, SN Chorianopoulou, VE Protonotarios, VF Siyiannis, L Hopkins and MJ Hawkesford. 2003. Leaf responses of young iron-inefficient maize plants to sulfur deprivation. J. Plant Nutr. 26:1189-1202.
Brand JD 1999. Genetic variation in rough-seeded lupins (Lupinus pilosus Murr. And L. atlanticus Glads.) for tolerance to calcareous soils. PhD Thesis. The University of Adelaide, Adelaide, South Australia.
Brand JD, C Tang and RD Graham. 2000. The effect of soil moisture on the tolerance of Lupinus pilosus genotypes to a calcareous soil. Plant Soil 219:263-267.
Briat JF and S Lobréaux. 1997. Iron transport and storage in plants. Trends Plant Sci. 2:187-193.
Briat J-F, C Curie and F Gaymard. 2007. Iron utilization and metabolism in plants. Current Opinion in Plant Biology 10:276–282.
Brockwell J, PJ Bottomley and JE Thies. 1995. Manipulation of rhizobia microflora for improving legume productivity and soil fertility: A Critical Assessment. Plant Soil 174: 143-180.
Brown JC. 1960. An evaluation of bicarbonate induced iron chlorosis. Soil Sci. 89:246-247.
Brown JC. 1978. Mechanism of iron uptake by plants. Plant Cell Environ. 1:249-
257.
Brown JC and V Wann. 1982. Breeding for Fe efficiency: use of indicator plants. J. Plant Nutr. 5:623-635.
188
Brüggemann W, K Maas-Kantel and PR Moog. 1993. Iron uptake by leaf mesophyll cells: the role of the plasma membrane-bound ferric-chelate reductase. Planta 190:151-155.
Bughio N, M Takahashi, E Yoshimura, NK Nishizawa and S Mori. 1997. Light-dependent iron transport into isolated barley chloroplast. Plant Cell Physiol. 38:101-105.
Byron DF and JW Lambert. 1983. Screening soybeans for iron efficiency in the growth chamber. Crop Sci. 23:885-888.
Cakmak I, H Ekiz, A Yilmaz, B Torun, N Köleli, I Gültekin, A Alkan and S Eker. 1997. Differential response of rye, triticale, bread and durum wheats to zinc deficiency in calcareous soils. Plant Soil 188:1-10.
Çelik H and AV Katkat. 2007. Some physical soil properties and potassium as an intensified factor on iron chlorosis. Int. J. Soil Sci. 2:294–300.
Çelik H, BB Aşik, S Gürel and AV Katkat. 2010. Potassium as an intensifying factor for iron chlorosis. Int. J. Agric. Biol. 12:359–364.
Cesco S, V Römheld, Z Varanini and R Pinton. 2000. Solubilization of iron by water-extractable humic substances. J. Soil Sci. Plant Nutr. 163:285-290.
Chaney RL. 1984. Diagnostic practises to identify iron deficiency in higher plants. J. Plant Nutr. 7:47-67.
Chaney RL. 1988. Recent progress and needed research in plant Fe nutrition. J. Plant Nutr. 11:1589-1603.
Chaney RL and BA Coulombe. 1982. Effect of phosphate on regulation of Fe-stress response in soybean and peanut J. Plant Nutr. 5:469-487.
Chaney RL, HM Hamze and PF Bell. 1992. Screening chickpea for iron chlorosis resistance using bicarbonate in nutrient solution to simulate calcareous soils. J. Plant Nutr. 15:2045-2062.
Charbaji T and Z Ayyoubi. 2004. Differential growth of some grapevine varieties in Syria in response to salt in vitro. In Vitro Cellular and Developmental Biology – Plant 40:221–224.
Chen Y and P Barak. 1982. Iron nutrition in calcareous soils. Adv. Agron. 35:217-240.
Cianzio SR. 1999. Breeding crops for improved nutrient efficiency: Soybean and
wheat as case studies. In Z Rengel (Ed.). Mineral Nutrition of Crops:
Fundamental Mechanisms and Implications. Food Products Press. The
Haworth Press, New York, USA. pp. 267-287.
Cianzio SR and WR Fehr. 1980. Genetic control of iron deficiency chlorosis in soybeans. Iowa State Jour. of Res. 54:367-375.
189
Cichy KA, S Forster, KF Grafton and GL Hosfield. 2005. Inheritance of seed zinc accumulation in navy bean. Crop Sci. 45:864-870.
Clark RB and RR Duncan. 1991. Improvement of plant mineral nutrition through breeding. Field Crops Res. 27:219-240.
Connolly EL, NH Campbell, N Grotz, CL Pritchard and ML Guerinot. 2003. Over expression of the FRO2 ferric chelate reductase confers tolerance to growth on low iron and uncovers post transcriptional control. Plant Physiol. 133:1102-1110.
Cook DR. 1999. Medicago truncatula – a model in the making! Curr. Opin. Plant Biol. 2:637-646.
Cornett JD and GV Johnson. 1991. Ferric chelate reduction by suspension culture cells and roots of soybean: a kinetic comparison. In Y Chen and Y Hadar (Eds.). Iron Nutrition and Interactions in Plants. Kluwer Academic, The Netherlands. pp. 95-100.
Coulombe BA, RL Chaney and WJ Wiebold. 1984. Use of bicarbonate in screening soybeans for resistance to iron chlorosis. J. Plant Nutr. 7:411-425.
Coyne DP, SS Korban, D Knudsen and RB Clark.1982. Inheritance of iron deficiency in crosses of dry beans (Phaseolus vulgaris L.). J. Plant Nutr. 5:575-585.
Curie C, G Cassin, D Counch, F Divol, K Higuchi, M Le Jean, J Misson, A Schikora, P Czernic and S Mari. 2009. Metal movement within the plant: contribution of nictotianamine and yellow stripe 1-like transporters. Ann Bot. 103:1–11.
Dasgan HY, K Abak, I Cakmak, V Romheld and S Sensoy. 2004. Inheritance of
tolerance to leaf iron deficiency chlorosis in tomato. Euphytica 139:51-57.
Dasgan HY, V Romheld, I Cakmak and K Abak. 2002. Physiological root
responses of the Fe deficiency tolerant and susceptible genotypes and their
reciprocal F1 hybrids. Plant Soil 241:97-103.
Davis PH and U Plitmann. 1970. Lens Miller. In PH Davis (Ed). Flora of Turkey-3. Edinburgh University Press, Edinburgh. pp. 325-328.
de la Guardia MD and E Alcàntara. 1996. Ferric chelate reduction by sunflower (Helianthus annuus L.) leaves: influence of light, oxygen, iron deficiency and leaf age. J. Exp. Bot. 47:669-675.
Dietz KJ. 1997. Functions and responses of the leaf apoplast under stress. In HD Behnke, U Lühtje, K Esser, JW Kaderit, and M Runge (Eds.). Progress in Botany, Structural Botany, Physiology, Genetics, Taxonomy, Geobotany. Springer Verlag, Berlin. pp. 221-254.
Donald CM and JA Prescott. 1975. Trace elements in Australian crop and pasture production, 1924-1974. In DJD Nicholas and AR Egan (Eds.) Trace Elements in Soil-Plant-Animal Systems. Academic Press. New York. pp. 7-37.
Donnini S, G Zocchi1, A Castagna, C Abdelly and A Ranieri. 2008. Identification of morphological, biochemical and physiological parameters for characterizing
190
nutritional stress status in arboreous species differently tolerant to chlorosis. In C Abdelly, M Öztürk, M Ashraf and C Grignon (Eds.). Biosaline Agriculture and High Salinity Tolerance. Birkhäuser Verlag/Switzerland
Doyle J J and MA Luckow. 2003. The rest of the iceberg. Legume diversity and evolution in a phylogenetic context. Plant Physiol. 131: 900–910.
Dragonuk MB, WR Fehr and HJ Jessen. 1989. Effectiveness of nutrient-solution evaluation for recurrent selection for Fe deficiency of soybean. Crop Sci. 29:952-955.
Dwyer LM, M Tollenaar and L Houwing. 1991. A non destructive method to monitor leaf greenness in corn. Can. J. Plant Sci. 71:505-509.
Eide D, M Broderius, J Fett and ML Guerinot. 1996. A novel iron-regulated metal transporter from plants identified by functional expression in yeast. Proc. Natl. Acad. Sci. USA. 93:5624-5628.
Erskine W, NP Saxena and MC Saxena. 1993. Iron deficiency in lentil: yield loss and geographic distribution in a germplasm collection. Plant Soil 151:249-254.
Esposito MM, L Milanesi, E Martin, V Cravero, FS Lopez Anido and E Cointry. 2007. Augmenting the genetic base in pea (Pisum sativum L.). Biotechnology 6(4):573-577.
Fageria NK, VC Baligar and RB Clark. 2002. Micronutrients in crop production. In: DL Sparks (Ed.). Advances in Agronomy. Academic Press, San Diego. pp. 185-268.
Fageria NK and LF Stone. 2008. Micronutrient Deficiency Problems in South America. BJ Alloway (Ed.). Micronutrient Deficiencies in Global Crop Production. Springer Science+Business Media 245-266
Fairbanks DJ, JH Orf, WP Inskeep and PR Bloom. 1987. Evaluation of soybean genotypes for iron-deficiency chlorosis in potted calcareous soil. Crop Sci. 27:953-957.
Fehr WR. 1982. Control of iron-deficiency chlorosis in soybeans by plant breeding. J. Plant Nutr. 5:611-621.
Fernandez V, I Orera, J Abadia and A Abadia. 2009. Foliar iron fertilization of fruit trees: present knowledge and future perspectives: review. J Hort Sci Biotech. 84:1–6.
Fernández V and G Ebert. 2005. Foliar iron fertilization: A critical review. J. Plant Nutr. 28:2113-2124.
Fernández V, G Ebert and G Winkelmann. 2005. The use of microbial
siderophores for foliar iron application studies. Plant Soil 272:245-252.
Fernández V, G Winkelmann and G Ebert. 2004. Iron supply to tobacco plants through foliar application of iron citrate and ferric dimerum acid. Physiol. Plantarum 122:380-385.
191
Food and Agricultural Organization of the United Nations (FAO). 1994. Definition and classification of commodities, 4. Pulses and derived products. http://www.Absoluteastronomy.com/encyclopedia/P/PU/Pulse-(legume).htm
Food and Agricultural Organization of the United Nations (FAO). 17 June 2007. FAOSTAT Online Statistical Service. Rome:FAO. http://faostat.fao.org
Ford R, KL Roux, C Itman, JB Brouwer and PWJ. Taylor. 2002. Diversity analysis and genotyping in Pisum with sequence tagged microsatellite site (STMS) primers. Euphytica 124:397-405.
Gao L and Y Shi. 2007. Genetic differences in resistance to iron deficiency chlorosis in peanut. J. Plant Nutr. 30:37-52.
Gentry HS. 1971. Pisum resources, a preliminary survey. In AC Zeven and JMJ de Wet, 1982. Dictionary of Cultivated Plants and Their Regions of Diversity. Pl. Genetic Resources Newsl. 25:3-13. Pudoc, Wageningen.
Gepts P, WD Beavis, EC Brummer, RC Shoemaker, HT Stalker, NF Weeden and ND Young. 2005. Legumes as a Model Plant Family. Genomics for Food and Feed Report of the Cross-Legume Advances through Genomics Conference. Plant Physiol. 137:1228–1235.
Gharsalli M, K Zribi, M Lachaâl and A Soltani. 2001. Responses of chickpea cultivars to iron deficiency. International Chickpea Newsletter 8:15-17.
Ghasemi-Fasaei R, A Ronaghi, M Maftoun, M Karimian and PN Soltanpour. 2003. Influence of FeEDDHA on iron-manganese interaction in soybean genotypes in calcareous soil. J. Plant Nutr. 26:1815-1823.
Goenaga R, AG Gillaspie Jr and A Quiles. 2010. Field screening of cowpea genotypes for alkaline soil tolerance. HortScience 45:1639-1642.
González-Vallejo EB, F Morales, L Cistué, A Abadía and J Abadía. 2000. Iron deficiency decreases the Fe(III)-chelate reducing activity of leaf protoplasts. Plant Physiol. 122:337-344.
Gowda CLL and JB Rao. 1986. Inheritance of susceptibility to iron chlorosis in chickpea. International Chickpea Newsletter 15:7-8.
Graham RD. 1984. Breeding for nutritional characteristics in cereals. In PB Tinker and A Läuchli (Eds.). Advances in Plant Nutrition. Praeger Scientific, New York. pp. 57-102.
Graham RD. 2008. Micronutrient deficiencies in crops and their global significance. BJ Alloway (Ed.). Micronutrient Deficiencies in Global Crop Production. Springer Science+Business Media. pp. 41-61.
Grotz N and ML Guerinot. 2006. Molecular aspects of Cu, Fe and Zn homeostasis in plants. Biochim Biophys Acta. 1763:595–608.
Grusak MA. 1995. Whole-root iron(III)-reductase activity throughout the life cycle of iron-grown Pisum sativum L. (Fabaceae): relevance to the iron nutrition of developing seeds. Planta 197:111-117.
192
Grusak MA and S Pezeshgi. 1996. Shoot-to-root signal transmission regulates root Fe(III) reductase activity in the dgl mutant of pea. Plant Physiol. 110:329-334.
Gualtieri G, O Kulikova and E Limpens. 2002. Microsynteny between pea and Medicago truncatula in the SYM2 region. Plant Mol. Biol. 50:225-235.
Guerinot ML. 2000. The ZIP family of metal transporters. Biochim Biophys Acta. 1465:190–198.
Guerinot ML and Y Yi. 1994. Iron: nutritious, noxious, and not readily available. Plant Physiol. 104:815-820.
Guerinot ML. 2010. Iron. Plant Cell Monographs 17:75-94.
Gumber RK, S Singh, JS Gill and PK Rathore. 1997. Genetics of irrigation-induced iron chlorosis in chickpea. International Chickpea Newsletter 4:10-11.
Gutser R. 1990. Copper deficiency on organic soils in southern Bavaria. Bayerisches Landwirtschaftliches Jahrbuch 67:69-83.
Hacisalihoglu G, JJ Hart, CE Vallejos and LV Kochin. 2004. The role of shoot- localized processes in the mechanism of Zn efficiency in common bean. Planta 218:704-711.
Haines RJ. 1993. In vitro selection in plant breeding. In BC Imrie and JB Hacker (Eds.). Proc. 10th Aust. Plant Breeding Conf. Gold Coast, Queensland. Vol. 1. pp. 210-219.
Halliwell B and JMC Gutteridge. 1992. Biologically relevant metal ion-dependent hydroxyl radical generation. FEBS Lett. 307:108–112.
Hamze M, J Ryan, R Mikdashi and M Sohl. 1987. Evaluation of chickpea (Cicer arietinum L.) genotypes for resistance of lime-induced chlorosis. J. Plant Nutr. 10:1031-1039.
Hansen N C, MA Schmitt, JE Anderson and JS Strock. 2003. Iron deficiency of soybean in the upper midwest and associated soil properties. Agron. J. 95:1595–1601.
Hartung W, EW Weiler and JW Radin. 1992. Auxin and cytokinins in the apoplasmic solution of dehydrated cotton leaves. J. Plant Physiol. 140:324-327.
Hauter R and K Mengel. 1988. Measurement of pH at the root surface of red clover (Trifolium pratense) grown in soils differing in proton buffer capacity. Biol. Fert. Soils 5:295-298.
Herbik A, G Koch, H-P Mock, D Dushkov, A Czihal, J Thielmann, UW Stephan and H Bäumlein. 1999. Isolation, characterization and cDNA cloning of nicotianamine synthase from barley. Eur. J. Biochem. 265:231-239.
Hider RC, E Yoshimura, H Khodr and N von Wiren. 2004. Competition or complementation: the iron-chelating abilities of nicotianamine and phytosiderphores. New Phytol. 164:204-208.
Higuchi K, N Nishizawa, V Römheld, H Marschner and S Mori. 1996. Absence of nicotianamine synthase activity in the tomato mutant ‘chloronerva’. J. Plant Nutr. 19:1235-1239.
193
Hintz RW, WR Fehr and SR Cianzio. 1987. Population development for the selection of high-yielding soybean cultivars with resistance to iron-deficiency chlorosis. Crop Sci. 27:707-710.
Holden MJ, DG Luster, RL Chaney, TJ Buckhout and C Robinson. 1991. Fe3+-chelate reductase activity of plasma membranes isolated from tomato (Lycopersicon esculentum Mill.) roots: comparison of enzymes from Fe-deficient and Fe-sufficient roots. Plant Physiol. 97:537-544.
Holloway RE, RD Graham and SP Stacey. 2008. Micronutrient Deficiencies in Australian Field Crops. BJ Alloway (Ed.). Micronutrient Deficiencies in Global Crop Production. Springer Science+Business Media. pp. 63-92.
Hougaard BK, LH Madsen, N Sandal, M de C Moretzsohn, J Fredslund, L Schauser, AM Nielsen, T Rohde, S Sato, S Tabata, DJ Bertioli and J Stougaard. 2008. Legume anchor markers link syntenic regions between Phaseolus vulgaris, Lotus japonicus, Medicago truncatula and Arachis. Genetics 179: 2299–2312.
Ibrahim KM, JC Collins and HA Collin. 1992. Characterisation of progeny of Coleus blumei following an in vitro selection for salt tolerance. Plant Cell Tiss. Org. 28:139-145.
Inskeep WP and PR Bloom. 1986. Effects of soil moisture on soil pCO2, soil solution bicarbonate, and iron chlorosis in soyabeans. Soil Sci. Soc. Am. J. 50:946-952.
Iqbal A, IA Khalil, N Ateeq and MS Khan. 2006. Nutritional quality of important food legumes. Food Chemistry 97:331–335.
Ishimaru Y, SA Kim, T Tsukamoto, H Oki, T Kobayashi, S Watanabe, S Matsuhashi, M Takahashi, H Nakanishi, S Mori and NK Nishizawa. 2007. Mutational reconstructed ferric chelate reductase confers enhanced tolerance in rice to iron deficiency in calcareous soil. Proc. Natl. Acad. Sci. USA. 104:7373–7378.
Jain S, HS Nainawatee, RK Jain and JB Chowdhury. 1991. Proline status of genetically stable salt-tolerant Brassica juncea L. somaclones and their parent cv. Prakash. Plant Cell Reports 9:684-687.
Jamjod S, S Niruntrayagul and B Rerkasem. 2004. Genetic control of boron efficiency in wheat (Triticum aestivum L.). Euphytica 135:21-27.
Jangpromma N, P Songsri, S Thammasirirak and P Jaisil. 2010. Rapid assessment of chlorophyll content in sugarcane using a SPAD chlorophyll meter across different water stress conditions. Asian Journal of Plant Sciences 9(6): 368-374
Jauregui MA and HM Reisenauer. 1982. Dissolution of oxides of manganese and iron by root exudate components. Soil Sci. Soc. Am. J. 46:314-317.
Javier Abadía J, S Vázquez, R Rellán-Álvarez, H El-Jendoubi, A Abadía, A Álvarez-Fernández and AF López-Millán. 2011. Towards a knowledge-based correction of iron chlorosis: Review. Plant Physiology and Biochemistry 49:471-482.
Jelali N, M Wissala, M Dell’orto, C Abdellya, M Gharsallia and G Zocchib. 2010. Changes of metabolic responses to direct and induced Fe deficiency of two Pisum sativum cultivars. Environ Exp Bot. 68: 238–246.
194
Jessen HJ, MB Dragonuk, RW Hintz and WR Fehr. 1988. Alternative breeding strategies for the improvement of iron efficiency in soybeans. J. Plant Nutr. 11:717-726.
Jessop RS, G Roth and P Sale. 1990. Effects of increased levels of soil CaCO3 on lupin (Lupinus angustifolius) growth and nodulation. Aust. J. Soil Res. 28:955-962.
Jolley VD, KA Cook, NC Hansen and WB Stevens. 1996. Plant physiological
responses for genotypic evaluation of iron efficiency in strategy I and
strategy II plants - a review. J. Plant Nutr. 19:1241-1255.
Julian G, HJ Cameron and RA Olsen. 1983. Role of chelation by ortho dihydroxy phenols in iron absorption by plant roots. J. Plant Nutr. 6:163-175.
Kang BT and OA Osiname. 1985. Micronutrient problems in tropical Africa. Fert. Res. 7:131:150.
Kapotis G, G Zervoudakis, T Veltsistas and G Salahas. 2003. Comparison of chlorophyll meter readings with leaf chlorophyll concentration in Amaranthus vlitus: correlation with physiological processes. Russ. J. Plant Physl. 50(3):395-397.
Kashiwagi J, H Upadhyaya and L Krishnamurthy. 2010. Significance and genetic diversity of SPAD chlorophyll meter reading in chickpea germplasm in the semi-arid environments. Journal of Food Legumes. 23(2): 99-105.
Katyal JC and PLG Vlek. 1985. Micronutrient problems in tropical Asia. Fert. Res. 7:69-94.
Kaur NP, VK Nayyar and PN Takkar. 1984. Relationship of total and ferrous iron with the incidence of chlorosis in some genetic lines of Cicer arietinum. Field Crops Res. 8:237-280.
Kausar MA, FM Chaudhry, A Rashid, A Latif and SM Alam. 1976. Micronutrient availability to cereals from calcareous soil. I. Comparative Zn and Cu deficiency and their mutual interaction in rice and wheat. Plant Soil. 45:397-410.
Kew – Royal Botanic Gardens. 2011. Leguminosae. http://www.kew.org/science/directory/teams/Leguminosae/index.html
Khurram Bashir K, Y Ishimaru and NK Nishizawa. 2010. Iron uptake and loading into rice grains. Rice. 3:122–130.
Kirkby EA and V Römheld. 2004. Micronutrients in Plant Physiology: Functions, Uptake and Mobility. Proceedings No. 543, International Fertiliser Society. Cambridge UK. pp. 1-54.
Klatte M, M Schuler, M Wirtz, C Fink-Straube, R Hell and P Bauer. 2009. The analysis of Arabidopsis nicotianamine synthase mutants reveals functions for nicotianamine in seed iron loading and iron deficiency responses. Plant Physiol. 150:257–271.
Knight R. 1979. Quantitative genetics, statistics and plant breeding. In GM Halloran, R Knight, KS McWhirter and DHB Sparow (Eds.). A Course Manual in Plant
195
Breeding. Australian Vice-Chancellors’ Committee, Brisbane, Australia. pp. 41-72.
Kobayashi T, H Nakanishi, M Takahashi, S Mori and NK Nishizawa. 2008. Generation and field trials of transgenic rice tolerant to iron deficiency. Rice 1:144–153.
Kolesch H, M Oktay and W Höfner. 1984. Effect of iron chlorosis-inducing factors on the pH of the cytoplasm of sunflower (Helianthus annus L.). Plant Soil 82:215-221.
Kolesch H, W Höfner and K Schaller. 1987. Effect of bicarbonate and phosphate on iron chlorosis of grape vines with special regard to the susceptibility of two rootstocks. Part II: Pot experiments. J. Plant Nutr. 10:231-249.
Korcak RF. 1987. Iron deficiency chlorosis. Hortic. Rev. 9:133-185.
Kosegarten HU, F Grolig, B Hoffmann and K Mengel. 1999. Apoplastic pH and Fe3+ reduction in intact sunflower leaves. Plant Physiol. 121:1069-4079.
Koseoglu AT and Acikgov. 1995. Determination of iron chlorosis with extractable iron analysis in peach leaves. J. Plant Nutr. 18:153-161.
Kosergaten H, B Hoffmann and K Mengel. 2001. The paramount influence of nitrate in increasing apoplastic pH of young sunflower leaves to induce Fe deficiency chlorosis, and the re-greening effect brought about by acidic foliar spray. J. Plant Nutr. Soil Sci. 164:155-163.
Kosterin OE and VS Bogdanova. 2008. Relationship of wild and cultivated forms of Pisum L. as inferred from an analysis of three markers, of the plastid, mitochondrial and nuclear genomes. Genet. Resour. Crop Evol. 55:735–755.
Kraemer SM. 2004. Iron oxide dissolution and solubility in the presence of siderophores. Aquat. Sci. 66:3–18.
Landsberg EC. 1984. Regulation of iron-stress-response by whole-plant capacity. J. Plant Nutr. 7:609-621.
Lanquar V, F Lelievre, S Bolte, C Hames, C Alcon, D Neumann, G Vansuyt, C Curie, A Schroder, U Kramer, HB Brygoo and S Thomine. 2005. Mobilization of vacuolar iron by AtNRAMP3 and AtNRAMP4 is essential for seed germination on low iron. The EMBO Journal 24(23):4041–4051.
Larbi A, F Morales, AF López-Millán, Y Gogorcena, A Abadia, PR Moog and J Abadia. 2001. Technical advance: reduction of Fe(III)-chelates by mesophyll leaf discs of sugar beet. Multi-component origin and effects of Fe deficiency. Plant Cell Physiol. 42:94-105.
Lee S, US Jeona, SJ Lee, Y Kima, DP Perssonb, S Hustedb, JK Schjørringb, Y Kakeic, H Masudac, NK Nishizawac and G Ana. 2009. Iron fortification of rice seeds through activation of the nicotianamine synthase gene. PNAS. 106(51):22014–22019.
Li CJ, XP Zhu and FS Zhang. 2000. Role of shoot in regulation of iron deficiency responses in cucumber and bean plants. J. Plant Nutr. 23:1809-1818.
196
Liesch AM, DA Ruiz Diaz, KL Martin, BL Olson, DB Mengel and KL Roozeboom. 2011. Management Strategies for Increasing Soybean Yield on Soils Susceptible to Iron Deficiency. Agron J. 103(6):1870-1877.
Lin S-F, JS Baumer, D Ivers, SR Cianzio and RC Shoemaker. 1998. Field and nutrient solution tests measure similar mechanisms controlling iron-deficiency chlorosis in soybean. Crop Sci. 38:254-259.
Lindsay WL. 1991. Iron oxide solubilization by organic matter and its effect on iron availability. In Y Chen and Y Hadar (Eds.). Iron Nutrition and Interaction in Plants. Kluwer Academic Publisher. pp. 29-36.
Lindsay WL and AP Schwab. 1982. The chemistry of iron in soils and its availability to plants. J. Plant Nutr. 5:821-840.
Lindsay WL. 1984. Soil and plant relationship associated with iron deficiency with emphasis on nutrient interactions. J. Plant Nutr. 7:489-500.
Ling H-Q, G Koch, H Baumlein and MW Ganal. 1999. Map-based cloning of
chloronerva, a gene involved in iron uptake of higher plants encoding
nicotianamine synthase. P. Natl. Acad. Sci. USA. 96:7098-7103.
Liu X, X Piao, J Wang and S Zhu. 2010. Model study on transesterification of soybean oil to biodisel with methanol using solid base catalyst. The Journal of Physiology Chemistry A. 114(11):3750-3755.
Lobreaux S and JF Briat. 1991. Ferritin accumulation and degradation in different organs of pea (Pisum sativum) during development. Biochem. J. 274:601-605.
Loeppert RH. 1986. Reactions of iron and carbonates in calcareous soils. J. Plant Nutr. 9:195-214.
López-Millàn AF, F Morales, A Abadia and J Abadia. 2000. Effects of iron-deficiency on the composition of the leaf apoplastic fluid and xylem sap in sugar beet. Implications for iron and carbon transport. Plant Physiol. 124:873-884.
López-Millàn AF, F Morales, A Abadia and J Abadia. 2001. Iron deficiency-associated changes in the composition of the leaf apoplastic fluid from field-grown pear (Pyrus communis L.) trees. J. Exp. Bot. 360:1489-1498.
Lucena C, FJ Romera, CL Rojas, MJ Garcia, E Alcantara and R Perez-Vicente. 2007. Bicarbonate blocks the expression of several genes involved in the physiological responses to Fe deficiency of Strategy I plants. Funct Plant Biol. 34:1002–1009.
Lucena JJ. 2000. Effects of bicarbonate, nitrate and other environmental factors on iron deficiency chlorosis. A review. J. Plant Nutr. 23(11-12):1591-1606
Lucena JJ. 2006. Synthetic Iron Chelates to Correct Iron Deficiency in Plants. In LL Barton and J Abadía (Eds.). Iron Nurition in Plants and Rhizospheric Microorganisms. Springer. pp. 103–128.
Ma JF and H-Q Ling. 2009. Iron for plants and humans. Plant Soil 325:1–3.
197
Madeira AC, A Ferreira, A de Varennes and MI Vieira. 2003. SPAD meter versus Tristimulus Colorimeter to estimate chlorophyll content and leaf color in sweet pepper. Commun. Soil Sci. Plant Anal. 34:2461-2470.
Madeira AC, A Mendonca, ME Ferreira and ML Taborda. 2000. Relationship between spectroradiometric and chlorophyll measurements in green beans. Commun. Soil Sci. Plant Anal. 31:631-643.
Mahmoudi H, N Labidi, R Ksouri, M Gharsalli and C Abdelly. 2007. Differential tolerance to iron deficiency of chickpea varieties and Fe resupply effects. C. R. Biol. 330:237–246.
Makasheva RKH. 1973. The Pea-Russian Translations Series 16 (1984). A.A. Balkema, Rotterdam. pp. 37-43.
Mamidi S, S Chikara, RJ Goos, DL Hyten, D Annam, SM Moghaddam, RK Lee, PB Cregan and PE McClean. 2011. Genome-wide association analysis identifies candidate genes associated with iron deficiency chlorosis in soybean. The Plant Genome 4:154–164.
Manthey JA, B Tisserat and DE Crowley. 1996. Root responses of sterile-grown onion plants to iron deficiency. J. Plant Nutr. 19:145-161.
Maribela Pestanaa M, A de Varennesb, J Abadı´ac and EA Faria. 2005. Differential tolerance to iron deficiency of citrus rootstocks grown in nutrient solution. Scientia Horticulturae 104:25–36.
Marquard RD and JL Tipton. 1987. Relationship between extractable chlorophyll and an in situ method to estimate leaf greenness. Hort Sci. 22:1327.
Marschner H. 1995. Mineral Nutrition of Higher Plants. 2nd Edt. Academic Press Limited. 889 p.
Marschner H, V Römheld and M Kissel. 1986. Different strategies in higher plants in mobilization and uptake of iron. J. Plant. Nutr. 9:695-317.
Masalha J, H Kosergaten, O Elmaci and K Mengel. 2000. The central role of microbial activity for iron acquisition in maize and sunflower. Biol. Fertil. Soils 30:433-439.
Mather K and JL Jinks. 1977. Introduction to biometrical genetics. Chapman and Hall, London. p.231.
Mayer JE, WH Pfeiffer and P Beyer. 2008. Biofortified crops to alleviate micronutrient malnutrition. Curr. Opin. Plant Biol. 11:166–170.
Mazza G and BD Oomah. 1994. Color evaluation and chlorophyll content in dry green peas. J. Food Qual. 17:381-392.
McDaniel ME and JC Brown. 1982. Differential iron chlorosis of oat cultivars: A Review. J. Plant Nutr. 5:545-552.
Mengel K. 1995. Iron availability in plant tissues-iron chlorosis on calcareous soils. In J Abadia (Ed.). Iron Nutrition in Soils and Plants. Kluwer Academic Publishers, The Netherlands. pp. 398-397.
198
Mengel K and EA Kirkby. 2001. Principles of Plant Nutrition. 5th Edt. Kluwer Academic Publishers. 894p.
Mengel K and G Geurtzen. 1986. Iron chlorosis on calcareous soils. Alkaline nutritional condition as the cause for the chlorosis. J. Pant Nutr. 9:161-173
Mengel K, M Th Breininger and W Bulb. 1984. Bicarbonate, the most important factor inducing iron chlorosis in vine grapes on calcareous soil. Plant Soil 81:333-344.
Mengel K, R Planker and B Hoffmann. 1994. Relationship between leaf apoplast pH and iron chlorosis of sunflower (Helianthus annus L.). J. Plant. Nutr. 17:1053-1065.
Mills HA and JB Jones, Jr. 1996. Plant Analysis Handbook II. MicroMacro Publishing, Inc. Athens, GA.
Monje A and B Bugbee. 1992. Inherent limitations of non destructive chlorophyll meters: A comparison of two types of meters. Hort Science 27:69-71.
Moog PR and W Brüggemann. 1995. Iron reducatase systems on the plant plasma membrane-Review. In J Abadia (Ed.). Iron Nutrition in Soil and Plants. Kluwer Academic Publisher, Boston. pp. 343-362.
Moraghan JT and K Grafton. 1999. Seed-zinc concentration and the zinc-efficiency trait in navy bean. Soil Sci. Soc. Am. J. 63:918-922.
Morales F, R Grasa, A Abadia and J Abadia. 1998. Iron chlorosis paradox in fruit trees. J. Plant Nutr. 21:815-825.
Morris JB. 1999. Legume Genetic Resources with Novel “Value Added” Industrial and Pharmaceutical Use. Perspectives on new crops and new uses. J Janick (ed.), ASHS Press, Alexandria, VA. 196-201.
Mortvedt JJ. 1991. Correcting iron deficiencies in annual and perennial plants: present technologies and future prospects. In Y Chen and Y Hadar (Eds.). Iron nutrition and interaction in plants. Kluwer Academic Publisher. pp. 315-321.
Mortvedt JJ. 1986. Grain sorghum response to banded acid-type fertilizers in iron-deficienct soil. J. Plant Nutr. 11:1297-1310.
Muehlbauer FF. 1993. Food and grain legumes. In J Janick and JE Simon (Eds.). New Crops. Wiley, New York. pp. 256-265.
Newbury HJ and AH Paterson. 2003. Genomic colinearity and its application in crop improvement. In HJ Newbury (Ed.). Plant Molecular Breeding. Blackwell Publishing, Birmingham. UK. pp. 61-79.
Nikolic M and V Römheld. 1999. Mechanism of Fe uptake by the leaf symplast: Is Fe inactivation in leaf a cause of Fe deficiency chlorosis? Plant Soil 215:229-237.
Nikolic M and V Römheld. 2002. Does high carbonate supply to roots change availability of iron in the leaf apoplast? Plant Soil 241:67-74.

199
Norvell WA and ML Adams. 2006. Screening soybean cultivars for resistance to iron-deficiency chlorosis in culture solutions containing magnesium or sodium bicarbonate. J. Plant Nutr. 29:1855-1867.
Nozoye T, S Nagasaka, T Kobayashi, M Takahashi, Y Sato, N Uozumi, H Nakanishi and NK Nishizawa. 2011. Phytosiderophore efflux transporters are crucial for iron acquisition in graminaceous plants. J. Biological Chemistry 286(7):5446–5454
O’Hara GW. 2001. Nutritional constraints on root nodule bacteria affecting symbiotic nitrogen fixation: a review. Aust. J. Exp. Agric. 41:417-433.
Ohwaki Y and K Sugahara. 1993. Genotypical differences in iron deficiency between sensitive and resistant cultivars of chickpea (Cicer arietinum). Plant Soil 155/156:473-476.
Ohwaki Y, S Kraokow, S Chotechuen, Y Egawa and K Sugahara. 1997. Differences in responses to iron deficiency among various cultivars of mungbean (Vigna radiata L.) to high concentrations of soil boron. Euphytica 55:217-228.
Oki H, K SuYeon, H Nakanishi, M Takahashi, H Yamaguchi, S Mori and NK Nishizawa. 2004. Directed evolution of yeast ferric reductase to produce plants with tolerance to iron deficiency in alkaline soils. Soil Sci. Plant Nutr. 50:1159-1165.
Olivares M, T Walter, E Hertrampf and F Pizarro. 1999. Anaemia and iron deficiency disease in children. British Medical Bulletin 55(3):534-543.
Olsen RA and JC Brown. 1980. Factors related to iron uptake by dicotyledonous and monocotyledonous plants. II. The reduction of Fe3+ as influenced by roots and inhibitors. J. Plant Nutr. 2:647-660.
Olsen RA and JC Brown. 1981. Light-induced reduction of Fe3+ as related to causes of chlorosis in cotton. J. Plant Nutr. 3:767-787.
Palmer CM and ML Guerinot. 2009. Facing the challenges of Cu, Fe and Zn homeostasis in plants. Nature Chemical Biology. 5(5):333-340.
Palmer JD, RA Jorgensen and WF Thompson. 1985. Chloroplast DNA variation and evolution in Pisum: patterns of change and phylogenteic analysis. Genetics 109:195-213
Paull JG, RO Nable and AJ Rathjen. 1992. Physiological and genetic control of the tolerance of wheat to high concentration of boron and implications for plant breeding. Plant Soil 146:251-260.
Paull JG, AJ Rathjen and B Cartwright. 1991. Major gene control of tolerance of bread wheat (Triticum aestivum L.) to high concentrations of soil boron. Euphytica 55:217-228.
Pestanaa M, A de Varennesb, J Abadı´ac and EA Fariaa. 2005. Differential tolerance to iron deficiency of citrus rootstocks grown in nutrient solution. Scientia Horticulturae 104:25–36.
200
Pich A and G Scholz. 1996. Translocation of copper and other micronutrients in tomato plants (Lycopersicon esculentum Mill.): Nicotianamine-stimulated copper transport in the xylem. J. Exp. Bot. 294:41-47.
Pich A, S Hillmer, R Manteuffel and G Scholz. 1997. First immunohisto-chemical localization of the endogenous Fe2+-chelator nicotianamine. J. Exp. Bot. 48:759-767.
Pierce CG and S Morris. 2004. Comparison of extraction techniques for measuring exchangeable cations in calcareous soils. Aust. J. Soil Res. 42:301-311.
Plessner O, A Dovrat and Y Chen. 1992. Tolerance to iron deficiency of lupins grown on calcareous soils. Aust. J. Agric. Res. 43:1187-1195.
Polhill RM, PH Raven and CH Stirton. 1981. Evolution and systematics of the leguminosae. In RM Polhill and PH Raven (Eds.). Advances in Legume Systematics (I). Proc. International Legume Conference, Kew, Royal Botanic Gardens, England. pp.1-26.
Ponnamperuma FN. 1972. The chemistry of submerged soils. Adv. Agron. 24:29-96.
Rashid A and J Ryan. 2008. Micronutrient constraints to crop production in the Near East: Potential significance and management strategies. In BJ Alloway (Ed.). Micronutrient Deficiencies in Global Crop Production. Springer Science+Business Media. pp. 149-180.
Rashid A, UD Jalal and M Bashir. 1990. Manganese deficiency in chickpea grown on a calcareous soil of Pakistan. International Chickpea Newsletter 22:21-22.
Rayment GE and D Lyons. 2011. Soil Chemical Methods – Australasia. CSIRO Publishing. Melbourne, Australia.
Reed DW, CA Jr Lyons and GR McEachern. 1988. Field evaluation of inorganic and chelated iron fertilizers as foliar sprays and soil application. J. Plant Nutr. 11:1369-1378.
Reeves DW, PL Mask, CW Wood and DP Delano. 1993. Determination of wheat nitrogen status with hand-held chlorophyll meter: influence of management practices. J. Plant Nutr. 16:781-789.
Rengel Z. 1999. Physiological mechanisms underlying differential nutrient efficiency of crop genotypes. In Z Rengel (ed). Mineral Nutrition of Crops: Mechanisms and Implications. The Haworth Press, New York. pp. 227-265.
Rengel Z. 2001. Genotypic differences in micronutrient use efficiency in crops. Commun. Soil Sci. Plant Anal. 32:1163-1186.
Rerkasem B, R Netsangtip, RW Bell, JF Loneragan and N Hiranburana. 1998. Comparative species responses to boron on a Typic Tropaqualf in northern Thailand. Plant Soil 106:15-21.
Reuter DJ and JB Robinson. 1997. Plant Analysis: an interpretation manual. CSIRO Publishing, Collingwood, Victoria. Australia. pp. 140-146.
201
Robinson NJ, CM Procter, EL Connolly and ML Guerinot. 1999. A ferric-chelate reductase for iron uptake from soils. Nature 397:694-696.
Rombolà AD, W Brüggemann, M Tagliavini, B Marangoni and PR Moog. 2000. Iron source affects Fe reduction and re-greening of kiwifruit (Actinidia deliciosa) leaves. J. Plant Nutr. 23:1751-1765.
Romera FJ, E Alcantara and MD de la Guardia. 1992a. Role of roots and shoots in the regulation of the Fe efficiency responses in sunflower and cucumber. Physiol Plant. 85:141-146.
Romera FJ, E Alcantara and MD de la Guardia. 1992b. Effect of bicarbonate, phosphate and high pH on the reducing capacity of Fe-deficient sunflower and cucumber plants. J. Plant Nutr. 15:1519-1530.
Romera FJ, E Alcantára and MD de la Guardia. 1991. Charcterization of the tolerance to iron chlorosis in different peach rootstocks grown in nutrient solution. I. Effect of bicarbonate and phosphate. Plant Soil 130:115-119.
Römheld V and H Marschner. 1986. Evidence for a specific uptake system for iron phytosiderophores in roots of grasses. Plant Physiol. 80:175–180
Römheld V. 1991. The role of phytosiderophores in acquisition of iron and other micronutrients in graminaceous species: an ecological approach. Plant Soil 130:127–134.
Römheld V. 1987. Different strategies for iron acquisition in higher plants. Physiol. Plant. 70:231-234.
Römheld V. 1991. The role of phytosiderophores in acquisition of iron and other micronutrients in graminaceous species: An ecological approach. In Y Chen and Y Hadar (Eds.). Iron Nutrition and Interaction in Plants. Kluwer Academic Publisher. pp. 3-27.
Römheld V. 2000. The chlorosis paradox: Fe inactivation as a secondary event in
chlorotic leaves of grapevine. J. Plant Nutr. 23:1629-1643.
Römheld V and H Marschner. 1986. Mobilization of iron in the rhizosphere of different plant species. In: B Tinker and A Läuchli, Eds. Advances in Plant Nutrition. Vol. 2, New York: Praeger. pp. 155-204.
Römheld V and G Schaaf. 2004. Iron transport in plants: future research in view of a plant nutritionist and a molecular biologist. Soil Sci. Plant Nutr. 50:1003-1012.
Römheld V, H Marschner and D Kramer. 1982. Responses of Fe deficiency in roots of Fe-efficienct plant species. J. Plant Nutr. 5:489-498.
Rorie RL, LC Purcell, DE Karcher and CA King. 2011. The assessment of leaf nitrogen in corn from digital images. Crop Sci. 51:2174–2180.
Ross WM. 1986. Improving plants for tolerance to iron deficiency and other mineral nutrition problems: breeding and genetic points of view. J. Plant Nutr. 9:309-333.
202
Rudolph A, R Becker, G Scholz, Z Procházka, J Toman, T Macek and V Herout. 1985. The occurrence of the amino acid nicotianamine in plants and microorganisms. A reinvestigation. Biochem. Physiol. Pflanzen. 180:557-563.
Russo MA, F Sambuco and A Belligno. 2010. The response to iron deficiency of two sensitive grapevine cultivars grafted on a tolerant rootstock. Afr. J. Biochem. Res. 4(1):33-42
Sakal R, AP Singh and RB Sinha.1988. Differential reaction of lentil varieties to boron application in calcareous soil. Lens Newsletter 15:27-29.
Sánchez-Andréu J, J Jorda and M Juarez. 1991. Reaction af FeEDTA and FeEDDHA applied to calcareous soils. In Y Chen and Y Hadar (Eds.). Iron Nutrition and Interaction in Plants. Kluwer Academic Publisher. pp. 315-321.
Sandberg A. 2002. Bioavailability of minerals in legumes. British Journal of Nutrition 88 (3):281-285.
Santalla M, J Ammurio and A De Ron. 2011. Food and feed potential breeding value of green, dry and vegetal pea germplasm. Can. J. Plant Sci. 81:601-610.
Santiago A and A Delgado. 2010. Interaction between beet vinasse and iron fertilisers in the prevention of iron deficiency in lupins. J Sci Food Agric. 90:2188–2194.
Santiago-Blay JA and JB Lambert. 2010. Legumes and Their Exudates. Aridus 22(1):1-8.
Sato S, Y Nakamura, E Asamizu, S Isobe and S Tabata. 2007. Genome sequencing and genome resources in model legumes. Plant Physiology 144: 588–593.
Saxena MC, KB Singh and RS Malhotra. 1990. Iron deficiency in chickpea in the Mediterranean region and its control through resistant genotypes and nutrient application. Plant Soil 123:251-254.
Saxena NP and AR Sheldrake. 1980. Iron chlorosis in chickpea (Cicer arietinum L.) grown on high pH calcareous vertisol. Field Crops Res. 3:211-214.
Saxena NP, M Jaganmohan Rao and H Sakai. 1971. Soil amendments to prevent and correct iron chlorosis in upland rice nurseries. In Proc. Int. Symp. Soil Fert. Evaln. New Delhi. 1:797-804.
Saxena NP, MC Saxena, P Ruckenbauer, RS Rana, MM El-Fouly and R Shabana. 1994. Screening techniques and sources of tolerance to salinity and mineral nutrient imbalances in cool season food legumes. Euphytica 73:85-93.
Schmidke I and UW Stephan. 1995. Transport of metal micronutrients in the phloem of castor bean (Ricinus communis) seedlings. Physiol. Plantarum 95:147-153.
Schmidt W. 1999. Mechanisms and regulation of reduction-based iron uptake in plants. New Phytol. 141:1-26.
Schmidt W. 2001. From faith to fate: ethylene signalling in morphogenic responses to P and Fe deficiency. J. Plant Nutr. Soil Sci. 164:147-154.
203
Schmidt W and M Bartels. 1996. Formation of root epidermal transfer cells in Plantago. Plant Physiol. 110:217-225.
Schmidt W, B Boomgaarden and V Ahrens. 1996. Reduction of root iron in Plantago lanceolata during recovery from Fe deficiency. Physiol. Plantarum 98: 587-593.
Schmidt W, J Tittel and A Schikora. 2000. Role of hormones in the induction of iron deficiency responses in Arabidopsis roots. Plant Physiol. 122:1109-1118.
Schmidt W, J Tittel and A Schikora. 2000. Role of hormones in the induction of iron deficiency responses in Arabidopsis roots. Plant Physiol. 122:1109-1118.
Scholz G, R Becker, A Pich and UW Stephan. 1988. The regulation of iron uptake and possible functions of nicotianamine in higher plants. Biochem. Physiol. Pflanzen. 183:257-169.
Schulte EE. 2002. Soil and applied iron. In Understanding Plant Nutrition. Cooperative Extension Publications. University of Wisconsin-Extension. 2p.
Schultze M and A Kondorosi. 1998. Regulation of symbiotic root nodule development. Annu. Rev. Genet. 32:33-57.
Schwertmann U. 1991. Solubility and dissolution of iron oxides. In Y Chen and Y Hadar (Eds.). Iron Nutrition and Interaction in Plants. Kluwer Academic Publisher. pp. 159-166.
Shaviv A and J Hagin. 1987. Correction of lime-induced chlorosis by application of iron and potassium sulfates. Fert. Res. 13:161-167.
Shi Y, DH Byrne, DW Reed and RH Loeppert. 1993. Influence of bicarbonate level on iron-chlorosis development and nutrient uptake of the peach rootstock Montclar. J. Plant Nutr. 16:1675-1689.
Shifriss C and E Eidelman, 1983. Iron deficiency chlorosis in peppers. J. Plant Nutr. 6: 699-704.
Shikanai T, P Muller-Moule, Y Munekage, KK Niyogi and M Pilon. 2003. PAA1, a P-type ATPase of Arabidopsis, functions in copper transport in chloroplasts. Plant Cell 15:1333–1346.
Shingles R, M North and RE McCarty. 2002. Ferrous ion transport across chloroplast inner envelope membranes. Plant Physiol. 128:1022-1030.
Singh RA, NP Sinha, BP Singh and SG Sharma. 1986. Reaction of chickpea genotypes to iron deficiency in a calcareous soil. J. Plant Nutr. 9:417-422.
Singh SP and DT Westermann. 2002. A single dominant gene controlling resistance to soil zinc deficiency in common bean. Crop Sci. 42:1071-1074.
Smith BN. 1984. Iron in higher plants: storage and metabolic rate. J. Plant Nutr. 7:759-766.
Smith FW and JF Loneragan. 1997. Interpretation of plant analysis: concepts and
principles. In DJ Reuter and JB Robinson (Eds.). Plant Analysis: An
204
Interpretation Manual, 2nd Ed. Commonwealth Scientific & Industrial Research
Organization (CSIRO) Publishing. Australia. pp. 3-33.
Smith JD and ML Kinman. 1965. The use of parent-offspring regression as an
estimator of heritability. Crop Sci. 5: 595-596.
Smith SE and DJ Read. 2008. Mycorrhizal symbiosis. 3rd Ed. Elsevier Ltd. Oxford. UK. 769p.
Snowball K and AD Robson. 1991. Symptoms of nutrient deficiencies and toxicities: faba beans and field peas. University of Western Australia. pp. 72-75.
Sprent JI. 2007. Evolving ideas of legume evolution and diversity: a taxonomic perspective on the occurrence of nodulation. New Phytol. 174:11–25.
Srinives P, R Kitsanachandee, T Chalee, W Sommanas and S Chanprame. 2010. Inheritance of resistance to iron deficiency and identification of AFLP markers associated with the resistance in mungbean (Vigna radiata (L.) Wilczek). Plant Soil 335:423-437.
Srivastava SP, M Joshi, C Johansen and TJ Rego. 1999. Boron deficiency of lentil in Nepal. Lens Newsletter 26:22-24.
Srivastava SP, TMS Bhandari, CR Yadav, M Joshi and W Erskine. 2000. Boron deficiency in lentil: Yield loss and geographic distribution in a germplasm collection. Plant Soil 219:147-151.
Stark A and Z Madar. 2002. Phytoestrogens: a review of recent findings. J Ped Endocrin Metab. 15:561-572.
Stein AJ. 2010. Global impacts of human mineral malnutrition. Plant Soil 335:133-154.
Stephan UW, I Schmidke, VW Stephan and G Scholz. 1996. The nicotianamine molecule is made-to-measure for complexation of metal micronutrients in plants. Biometals 9:84-90.
Stoltzfus R J. 2001. Defining iron-deficiency anemia in public heath terms: a time for reflection. J. Nutr. 131:565–567.
Strasser O, K Köhl and V Römheld. 1999. Overestimation of apoplastic Fe in roots of soil grown plants. Plant Soil 210:179-187.
Susin S, A Abadia, JA Gonzales-Reyes, JS Lucena and J Abadia. 1996. The pH requirement for in vivo activity of the iron deficiency-induced “turbo” ferric chelate reductase. Plant Physiol. 110:111-123.
Tagliavini M, D Scudellari, B Marangoni and M Tosselli. 1995. Acid-spray regreening of kiwifruit leaves affected by lime-induced iron chlorosis. In J Abadia (Ed.). Iron Nutrition of Soils and Plants. Kluwer Academic Publisher, Dordrecht, The Netherlands. pp. 191-195.
205
Takahashi M, Y Terada, I Nakai, H Nakanishi, E Yoshimura, S Mori and NK Nishizawa. 2003. Role of nicotianamine in the intracellular delivery of metals and reproductive development. Plant Cell 15:1263-1280.
Takkar PN, IM Chhibba and SK Mehta. 1989. Twenty years of coordinated research on micronutrients in soils and plants 1967-1987. Indian Institute of Soil Science.
Tang C and AD Robson. 1995. Nodulation failure is important in the poor growth of two lupin species on an alkaline soil. Aust. J. Exp. Agric. 35:87-91.
Tang C and BD Thomson. 1996. Effects of solution pH and bicarbonate on the growth and nodulation of a range of grain legume species. Plant Soil 186:321-330.
Terry N and J Abadia.1986. Function of iron in chloroplasts. J. Plant Nutr. 9:609-646.
Tiffin LO. 1996. Iron translocation: plant culture, exudates sampling, iron citrate analysis. Plant Physiol. 45:280-283.
Tolentino K and JF Friedman. 2007. An update on anemia in less developed countries. Am. J. Trop. Med. Hyg. 77(1):44–51.
Torres RM, JDE Barra, GA Gonzales, JR Alcaraz and MTC Leon. 2006. Morphological changes in leaves of Mexican lime affected by iron chlorosis. J. Plant Nutr. 29:615–628.
Toulon V, H Sentenac, J Thibaud, J Davidian, C Maulinean and C Grigoon. 1992. Role of apoplast acidification by the H+ pump. Planta 186:212-218.
Troeh FR and LM Thompson. 2005. Soils and Soil Fertility. 6th Ed. Ames, Iowa: Blackwell. p. 293.
Trolldenier G. 1973. Secondary effects of potassium and nitrogen nutrition of rice: change in microbial activity and iron reduction in the rhizosphere. Plant Soil 38:267-279.
Trowbridge F and R Martorell. 2002. Forging effective strategies to combat iron deficiency. Summary and recommendations. J. Nutr. 132: 875–879.
Turner FT and MF Jund. 1991. Chlorophyll meter to predict nitrogen topdress requirement for semidwarf rice. Agron. J. 83:926-928.
UC Sarep online. 2003. Cover crop database: complete crop summary of field pea. http://www.sarep.ucdavis.edu/cgi-bin/CCrop.exe/show_crop_17.
UNICEF. 2006. The state of the world’s children 2007. New York, NY: UNICEF
von Wirén N, S Klair, S Bansal, JF Briat, H Khodr, T Shioiri, RA Leigh and RC Hider. 1999. Nicotianamine chelates both FeIII and FeII: Implications for metal transport in plants. Plant Physiol. 119:1107-1114.
Vose PB 1982. Iron nutrition in plants: A world overview. J. Plant Nutr. 5:233-249.
Vose PB. 1990. Screening techniques for plant nutrient efficiency: physiology and methods. In N El Bassam, M Dambroth and BC Loughman (Eds.). Genetic Aspects
206
of Plant Mineral Nutrition. Kluwer Academic Publishers, Dordrecht, The Netherlands. pp. 283-289.
Wallace A. 1991. Rational approahes to control iron deficiency other than plant breeding and choice of resistant cultivars. In Y Chen and Y Hadar (Eds.). Iron Nutrition and Interaction in Plants. Kluwer Academic Publisher. pp. 323-330.
Wann EV and WA Hills. 1973. The genetics of boron and iron transport in tomato. J. Hered. 64:370-371.
Waters BM and GC Troupe. 2011. Natural variation in iron use efficiency and mineral remobilization in cucumber (Cucumis sativus). Plant Soil 1-13.
Waters BM, DG Blevis and DJ Eide. 2002. Characterization of FRO1, a pea ferric-chelate reductase involved in root iron acquisition. Plant Physiol. 129:85-94.
Weeden MF, S Brauner and JA Przyborowski. 2002. Genetic analysis of pod dehiscence in pea (Pisum sativum L.). Cell. Mol. Biol. Lett. 7:657-663.
Wei LC, RH Loeppert and WR Ocumpaugh. 1997. Fe-deficiency stress responses in Fe-deficiency resistant and susceptible subterranean clover: importance of induced H+ release. J. Exp. Bot. 48:239-246.
Weiss MG. 1943. Inheritance and physiology of efficiency in iron utilization in soybean. Genetics 28:253-268.
Welch RM. 1995. Micronutrient nutrition of plants: Crit. Rev. Plant Sci. 14:49-82.
Welch RM, WA Norvell, SC Schaefer, JE Shaff and LV Kochian. 1993. Induction of iron(III) and copper(II) reduction in pea (Pisum sativum L.) by Fe and Cu status: Does the root-cell plasmalemma Fe(III)-chelate reductase perform a general role in regulating cation uptake? Planta 190:555-561.
Welch RM, WH Allaway, WA House and J Kubota. 1991. Geographic distribution of trace element problems. In JJ Mortvedt, FR Cox, LM Shuman, and RM Welch (Eds.). Micronutrients in Agriculture. 2nd Edition. Soil Science Society of America. pp. 31-57.
White PF and AD Robson. 1989. Lupin species and peas vary widely in their sensivity to Fe deficiency. Aust. J. Agric. Res. 40:539-547.
WHO - World Health Organization. 2005. http://www.who.int/nut.
Wong LW, C Domoney, CL Hedley, R Casey and MA Grusak. 2003. Can we improve the nutritional quality of legume seeds? Plant Physiol. 131:886-891.
Wu Z, F Liang, B Hong, JC Young, MR Sussman, JF Harper and H Sze. 2002. An
endoplasmic reticulum-bound Ca2+/Mn2+ pump, ECA1, supports plant growth
and confers tolerance to Mn2+ stress. Plant Physiol. 130:128-137.
Xu FS, YH Wang and J Meng. 2001. Mapping boron efficiency gene(s) in Brassica napus using RFLP and AFLP markers. Plant Breeding 120:319-324.
207
Yau SK and W Erskine. 2000. Diversity of boron-toxicity tolerance in lentil growth and yield. Genet. Resour. Crop Ev. 47:55-61.
Yi Y and ML Guerinot. 1996. Genetic evidence that induction of root FeIII chelate reductase activity is necessary for iron-uptake under iron deficiency. Plant J. 10:835-844.
Yip R and U Ramakrishnan. 2002. Experiences and challenges in developing countries. J Nutr. 132: 827–830.
Yokosho K, N Yamaji, D Ueno, N Mitani and JF Ma. 2009. OsFRDL1 is a citrate transporter required for efficient translocation of iron in rice. Plant Physiol. 149:297–305.
Young ND, J Mudge and THN Ellis. 2003. Legume genomes: more than peas in a pod. Current Opinion in Plant Biology 6:199–204.
Zaiter HZ, CP Coyne and RB. Clark 1988. Genetic variation, heritability, and selection response to iron deficiency in dry beans. J. Plant Nutr. 11:739-746.
Zancan S, I Sugliaa, LN Roccab and R Ghisia. 2008. Effects of UV-B radiation on antioxidant parameters of iron-deficient barley plants. Environ. Exp. Bot. 63:71–79.
Zhang FS, V Römheld and H Marschner. 1991. Diurnal rhythm of release of phytosiderophores and uptake rate of zinc in iron-deficient wheat. Soil Sci. Plant Nutr. 37:671-678.
Zheng Y, FS Zhang and L Li. 2003. Iron availability as affected by soil moisture in intercropped peanut and maize. J. Plant Nutr. 12:2425-2437.
Zhu H, H-K Choi, DR Cook and RC Shoemaker. 2005. Bridging model and crop legumes through comparative genomics. Plant Physiol. 137:1189-1196.
Zocchi G, P De Nisi, M Dell’Orto, L Espen and PM Gallina. 2007. Iron deficiency differently affects metabolic responses in soybean roots. J. Exp. Bot. 58(5):993–1000.
Zohary D and M Hopf. 1988. Domestication of Plants in the Old World. Clarendon Press, Oxford. p. 249.
Zohlen A. 2002. Chlorosis in wild plants: is it a sign of iron deficiency? J. Plant Nutr. 25:2205-2228.
Zribi K and M Gharsalli. 2002. Effect of bicarbonate on growth and iron nutrition of pea. J. Plant Nutr. 25:2143-2149.
Zuo YM and FS Zhang. 2011. Soil and crop management strategies to prevent iron deficiency in crops. Plant Soil 339:83–95.
Zuo YM, LX Ren, FS Zhang and RF Jiang. 2007. Bicarbonate variation from adjustable soil water content regulates and controls iron nutrition of peanut in calcareous soil. Plant Physiol Bioch. 45:357–364.

208


![Second Revision No. 1-NFPA 80-2014 [ Section No. 2.3.2 ] · PDF fileSecond Revision No. 2-NFPA 80-2014 [ Section No. 2.3.6 ] 2.3.6 UL Publications. Underwriters Laboratories Inc.,](https://img.pdfslide.us/doc/110x75/5a7a70d17f8b9a05348ba127/second-revision-no-1-nfpa-80-2014-section-no-232-revision-no-2-nfpa-80-2014.jpg)