Embed Size (px)
Citation preview

European Journal of Agriculture and Forestry Research
Vol.3, No.3, pp.1-16, September 2015
___Published by European Centre for Research Training and Development UK (www.eajournals.org)
1 ISSN 2054-6319 (Print) ISSN 2054-6327(online)
CHARACTERIZATION OF SPATIAL VARIABILITY OF SOME
PHYSIOCHEMICAL SOIL PROPERTIES OF MESOPOTAMIAN PLAIN SOILS
Rahal, N. Shamkhi
Kut Technical Institute-Middle Technical University/ Iraq
ABSTRACT: The present study is conducted to characterize the spatial variability of some
soil physio-chemical properties (sand, silt, clay, pH ,ECe ,CEC ,Esp ,O.M and CaCO3) for
selected soil series from Mid-Mesopotamian plain. Five soil series were
recognized(MM5,MP5.Dw45,DF97,and DP45).Descriptive statistics were used
including(Min., Max., Mean, Standard deviation , coefficient of variation, Skewness and
kurtosis) .The results showed that, soils was differing significantly (ρ≤ 0.05) in all studied
physio- chemical properties except for and CaCO3.In addition, soils exhibited moderate to high
spatial variability in the horizontal scale (cv=21.528-78.327%) in sand and OM respectively
except in pH and O.M was of low spatial variability(CV=2.840-8.402%) respectively .Also,
soils showed moderate to high vertical spatial variability in their physio-chemical properties
( cv=16.949-88.337%) in sand and clay particles in MP5 and DW45 soil series respectively
.On the other hand they showed low and high vertical spatial variability (CV=1.223-
102.415%) in pH and O.M of DP45 and MP5 soil series respectively .Accordingly we see that,
soil spatial variability must be studied thoroughly for precise soil management and accurate
soil sampling system for taking effective management decisions that leads to sustainable
agricultural production.
KEYWORDS: Spatial Variability, Coefficient of Variation, Standard Deviation ,
Geomorphic Processes, Pedogenic Process, Skewness, Alluvial Soils.
توصيف التغايرات المكانية لبعض الصفات الفيزيوكيمياوية لبعض سالسل الترب من وسط السهل الرسوبي العراقي
ناظم شمخي رهل
الجامعة التقنية الوسطى –المعهد التقني / كوت
المستخلص
غايرات المكانية في بعض من الصفات الفيزيوكيمياوية لسالسل ترب من وسط السهل هذه الدراسة بهدف تقويم الت أجريت
ي العراقي.تم تشخيص خمسة سالسل تربة) الحي الرسوب MM5 ، عمارة MP 5 ، اعتدال DW45 ، خفاجة DF97
DP45، غسان
قيمة، أعلىالتوضيحي )أقل قيمة، أإلحصاءالبيانات الى أخضعتوكذلك للبيانات واقل فرق معنوي . تم إجراء تحليل تباين
.بينت النتائج وجود فروقات معنويةومعامل التفرطح( أاللتواء،معامل أالختالفالمعياري ،معامل أالنحرافالمتوسط، (ρ≤
0.05) تراوحت أفقيةة في صفات الترب الفيزيوكيمياوية موضوع الدراسة عدا كاربونات الكالسيوم.كما توجد تغايرات مكاني
مفصول الرمل والمادة العضويةفي (cv=21.528-78.327%) بين المعتدلة الى العالية في صفات التربة وكذلك
(cv=16.949-88.337% تغايرات مكانية عمودية MP5 ( في مفصول الرمل والطين في تربتي عمارة و
عمودية تراوحت بين المنخفضة الى عالية كانت هنالك تغايرات مكانية أخرى.من ناحية DW45اعتدال (CV=1.223-
و المادة العضوية pHفي صفتي تفاعل التربة(102.415% OM غسانلتربتي DP45 و عمارة MP5 وتأسيسا على .
ذلك يجب دراسة تغايرات التربة بشكل معمق من اجل تحقيق نظام زراعة دقيق ونظام معاينة مضبوط ألغراض اتخاذ
تربة فعال من اجل تحقيق إنتاج زراعي مستدام.قرارات إدارة

European Journal of Agriculture and Forestry Research
Vol.3, No.3, pp.1-16, September 2015
___Published by European Centre for Research Training and Development UK (www.eajournals.org)
2 ISSN 2054-6319 (Print) ISSN 2054-6327(online)
عامل التفرطح، الترب الرسوبية مكلمات مفتاحيه: تغايرات التربة ، معامل أالختالف، أالنحراف المعياري، معامل أاللتواء،
، العمليات الجيومورفية، العمليات البيدوجينية
Introduction: Soils as a natural bodies are inherently heterogeneous in nature because of the
many factors that, contribute to their formation and the complex interactions of these factors,
Maniyunda et al 2013[ 1 ].Soils are diverse, and dynamic system, Kavipoor 2012[2].Soil
heterogeneities may arise from management activities ]Sivarajan et al 2013[3] and can occur
from land use and management strategies[4 Yasrebi et al 2008].Heterogeneity of soil properties
is a general characteristics in semi arid and semi arid ecosystem Schlesinger et al 1996[5], Liu
et al 2007 [6].Soils characterized by high degree of variability due to the interplay of physical
,chemical, biological and anthropogenic processes that operate with different intensities and at
different scales and acting simultaneously ,Ghanty et al 2012[7], Serrano et al 2014[8].The
differences in their characteristics associated with landscape position are usually contributed
to the differences in the runoff ,erosion and deposition which effect soil gneisses
Akhatanzzaman et al 2014[9].These characteristics can be a direct result of soil forming factors
and their interactions ,Mann et al 2010 , Mzuku,2005[11].
Soil spatial variability is an important determinant of efficiency of farm inputs and
yield,Sağlam,2011[12] as well as crop management and design and effectiveness of field
research trials, Khan et al 2014[13].These variations differed among soil properties , and may
reflect the impacts of plant, soil fauna, precipitation ,and management practices adopted in the
area ,Jafari et al 2011[14].Consequently, soils can exhibit marked spatial variability at the
macro-scale and micro-scale, Fathi ,et al 2014[15].High variability of soil properties might be
related to variability of properties of flood sediments ,Rabi et al2014[16],and controlled by
primarily the depositional environment where high energy systems deposit materials with high
spatial variability ,Moss et al 2010[17].These processes and causes create pattern of nested
variability or heterogeneity, this means that, soil properties may display spatial /or temporal
patterns only over certain distances and not others Douaik.2011[18].
The characterization of spatial variability of soil attributes is essential to achieve a better
understanding of the complex relations between soil properties and environmental factors,
Gooverts ,1998[19].And, knowledge of spatial variability and relationships among properties
is important for the evaluation of agricultural management practices ,Huang et al ,1999 [20]
and the variability of physical and chemical properties of soil is unavoidable Fathi et al
2014[15].And, understanding the
distribution of soil properties in the field is essential in refining agricultural management
practices , Akbas,2014[21].Information about soil variability is necessary for precision
agriculture ,Biswas et al 2012[22].And ,farm inputs can be adjusted and applied to the fields
precisely and management decisions can be made accordingly, Sivarajan et al 2013[3],and
interpretation of them is a key element in site specific farming, Tuncay et al 2013
[23].Therefore it is important to study not only the extent of the surface spatial variability of
soil properties but also the distribution of subsurface and deep soil horizons, Iqbal et al
2005[24] . Knowledge about soil physical and chemical properties can save time and money in
planning and management spatial variations of soil that, influence soil and crop management
efficiencies as well as the effectiveness of soil research Wasiullah [25].precision agriculture
applies principles of farming according to field variability, Emadi et al,2008[26].It is noted
that, spatial characterization is necessary to locate areas to be carefully managed for
agricultural sustainable development Ghanty et al 2012 [7] and studying physiochemical

European Journal of Agriculture and Forestry Research
Vol.3, No.3, pp.1-16, September 2015
___Published by European Centre for Research Training and Development UK (www.eajournals.org)
3 ISSN 2054-6319 (Print) ISSN 2054-6327(online)
properties provide basic information of better plant growth and management of the
recourses[9]and provide insight into understanding ecosystem processes, Nkheloane et al,2012
[27].Understanding the magnitude and pattern in spatial variability of soil properties is
necessary for improved management options application and strategies for sampling and design
for field research trials, Khan, et al 2014 [13], such information is needed for enhancing
agricultural production and provide as a base for further research by scientists.
Estimating spatial variability of soil properties is significant for evaluating environment and
prerequisite for soil and crop specific management ,Iňgo et al 2012[28] ,and provides the
factors and processes controlling potential in agriculture production , Akbas,2014 [21].Spatial
variability should be studied in every field and understanding this variability has important
application in agriculture ,environment ,hydrology and earth sciences ,Biswas, et al 2012 [22].
Alluvial soils are formed by rivers as accumulated sediments deposited at different times show
large variations in their properties over short distances and stratification is particular
characteristics of it,Gerrard.1987[29] ,and exhibit variations characteristics reflecting the
composition of materials transported, Dengiz,2010[30] .For seeing the importance of spatial
variability ,and because of limited or little information available for description of spatial
variability of soil physiochemical properties of Mesopotamian plain ,this study was directed to
characterize and evaluate the spatial variability of soil physiochemical properties of some soils
in Mesopotamian plain .
MATERIALS AND METHODS
Study area: A strip transect of (350m*3000m),and(105 hectares) was used as study area .The
study area is part of silted basin physiographical sub unit of lower Mesopotamian plain ,which
is located about 17 km south of Kut town -Wasit province/Iraq [ E 45 ̊ 54ˉ 29.54˭ - 45̊ 53ˉ
2.79˭to 45 ̊ 54 ˉ 36.70˭- 45 ̊ 53ˉ9.47˭ and N 32 ̊ 25ˉ 36.77˭ - 32 ̊ 25ˉ28.68˭ to 32 ̊ 26ˉ41.59˭- 32̊
26ˉ 33.83˭],fig (1 ). Soils are alluvial formed from sediments of Tigris and Euphrates in
addition to irrigation sediments of old and modern irrigation systems in the area. And, are
characterized by stratification and vary with short distances, Buringh 1960[31]. The climate of
study area is semi-arid with average annual precipitation( 144 mm ) and average monthly
temperature ( 24 ̊ C ) .The hottest and coldest months are(May to October ;December to
February respectively ).The soil moisture and temperature regimes are Aridic-Torric and
hyperthermic respectively. The land is nearly flat with gentle slopes ranged 11-15 m above
mean sea level and resulted from the old and recent irrigation levees, this characterizes the land
with a distinct and unique soil-landscape pattern. The land use is cereal cultivation ,fallow or
left for grazing. The natural vegetation in the area are, Agool (Alhagi maurorum), Shoke
(Lagonychium fractum), Tarfah (Tamarix ramossima), Tertaia (Schanginiaa egytaca) and,
Shuwail ( Creassa cretiea L.). Field works : a semi-detailed soil survey was carried out using a
free lance survey, for recognizing soil series in the study area. Soils were classified according
to the soil classification system of Iraqi alluvial soil proposed by, Al-aqidi 1976,[32] and Five
main soil series were recognized accordingly (Hai MM5, Amarah MP5, Itdal DW45, Khfajah
DF97,and Ghassan DP45). Locations of representative pedons were chosen according to the
central concept of each soil series recognized in the area of study. Soil profiles were dug and
described systematically according to the specification listed in soil survey manual1993[33].
Soil samples were collected and prepared according to the systematic procedures recommended
for the chemical and physical laboratory analyses.

European Journal of Agriculture and Forestry Research
Vol.3, No.3, pp.1-16, September 2015
___Published by European Centre for Research Training and Development UK (www.eajournals.org)
4 ISSN 2054-6319 (Print) ISSN 2054-6327(online)
Laboratory analyses: Soil samples were subjected to physical and chemical analysis where
required in this study using methods documented in Black,1965[34] particle size distribution
was measured according to Black 1965 [34 ] methods: ,pH ; ECe,CEC,OM,ESp,CaCO3 were
measured using,21a,23b,,Walkelly and methods respectively ,USDA handbook No 60[35].
Statistical analysis: Analysis of variance and Lsd test were used at (ρ<0.05)to measure the
variability among soils using SPSS 10 package[36]. Descriptive statistics including (Minimum
,Maximum ,Mean , standard deviation, ,coefficient of variation ,Skewness and kurtosis ) were
calculated with[SPSS10] to characterize the horizontal and vertical spatial variability of some
soil physio-chemical properties among and within soils.
DISCUSSION AND RESULTS
Soil variability is an inherited characteristic reflecting soil forming factors ,the intensity of
processes responsible for soil formation, and pedogeomorphic processes acting in the soil-
landscape system. This variability is unavoidable phenomena in soil management tasks. The
results showed that, studied soils revealed high spatial variability in their physio-chemical
properties. Table(1 ) presents the analysis of variance of physio- chemical soil properties of
examined soils. Soil content of sand ranged from 30 gm.kg-1 to 780 gm.kg-1 in C2 and A
horizons of DF97 (Khfajah) and DP45 (Ghasan) soil series respectively. Silt particles ranged
from 100 gm.kg-1 to 780 gm.kg-1 in C2 and A horizons of DF97 (Khfajah) and DP45 (Ghasan)
soil series respectively. And, clay particles ranged from 90 gm.kg-1 to 470 gm.kg-1 respectively
in C1 Horizon C2 and A horizons of DF97 (Khfajah) and DP45 (Ghasan) soil series
respectively. Silt particles ranged from 100 gm.kg-1 to 780 gm.kg-1 in C2 and A horizons of
DF97 (Khfajah) and DP45 (Ghasan) soil series respectively. And, clay particles ranged from
90 gm.kg-1 to 470 gm.kg-1 respectively in C1 Horizon of DW45(Itidal) and DF97(Khfajah) soil
series respectively. The least significant differences were ( ρ≤0.05) 245.06, 202.765 and
113.529 respectively . These differences may be attributed to geomorphic and physiographic
setting and positions of these soils in the soil- landscape , the location of the source of material
deposited and its sediment type and quantity and not as a result of pedogenetic processes, Moss
et al 2010[17], Buringh 1960[31]. Soil electrical conductivity also showed significant
differences ,it ranged between 12.30 dS.m-1 to 60.7 dS.m-1 in C2 and A horizons of
DW45(Itidal).
Table (1): soil physiochemical properties of soil series in studied area and least significant
difference.
CaCO3
mg.Kgˉ1
Organic
matter
mg.Kg ̄1
Esp% CEC
Cmol
.
Kgˉ1
pH Electrical
conductivit
y
ds.mˉ1
Clay
mg.Kgˉ1
Silt
mg.Kgˉ1
Sand
mg.Kgˉ1
Property
Horizon .
Soil
series
23.00 1.50 34.00 14.30 7.60 35.50 120.00 730.00 150.00 A
MM5
Hai
21.00 1.10 21.00 10.90 7.60 16.40 110.00 440.00 450.00 C1
20.00 1.40 21.00 13.60 7.30 15.80 140.00 650.00 210.00 C2
18.00 1.10 24.00 22.10 7.70 19.80 250.00 650.00 100.00 C3
20.00 1.90 35.00 22.50 7.10 51.00 180.00 720.00 100.00 A

European Journal of Agriculture and Forestry Research
Vol.3, No.3, pp.1-16, September 2015
___Published by European Centre for Research Training and Development UK (www.eajournals.org)
5 ISSN 2054-6319 (Print) ISSN 2054-6327(online)
17.00 0.40 28.00 16.30 7.40 32.10 150.00 710.00 140.00 C1
MP5
Amarah
18.00 0.40 29.00 22.90 7.80 19.20 140.00 570.00 290.00 C2
19.00 0.30 27.00 11.60 7.90 17.10 120.00 460.00 420.00 C3
24.00 1.50 14.00 19.20 7.20 52.10 150.00 720.00 130.00 A DW45
Itidal 25.00 1.10 11.00 14.10 7.40 15.40 090.00 580.00 330.00 C1
25.00 1.00 09.00 21.20 7.50 12.30 170.00 780.00 50.00 C2
18.00 0.80 12.00 16.30 7.30 14.20 130.00 270.00 600.00 C3
18.00 1.40 22.00 40.10 7.10 60.70 150.00 780.00 70.00 A DF97
Khfajah 20.00 1.00 17.50 31.20 7.30 30.30 470.00 480.00 50.00 C1
21.00 0.80 18.10 39.50 7.20 35.10 300.00 670.00 30.00 C2
23.00 0.70 16.50 21.10 7.50 27.10 330.00 620.00 50.00 C3
17.00 1.60 24.00 07.40 7.90 20.40 110.00 110.00 780.00 A DP45
Ghasan 21.00 1.10 18.00 06.80 7.80 17.6 0 120.00 120.00 760.00 C1
21.00 1.60 21.00 11.50 7.70 19.10 200.00 400.00 400.00 C2
20.00 1.00 13.00 09.30 7.90 16.20 150.00 100.00 750.00 C3
Ns 0.432 4.036 7.639 0.29
4
11.794 113.529 202.765 245.06 Lsd ( ρ
<
O.O5)
E 45̊ 54́ 29.54̋
N 32̊ 26́ 41.59̋ E 45̊ 54́ 36.70̋
N 32̊ 26́ 33.83̋

European Journal of Agriculture and Forestry Research
Vol.3, No.3, pp.1-16, September 2015
___Published by European Centre for Research Training and Development UK (www.eajournals.org)
6 ISSN 2054-6319 (Print) ISSN 2054-6327(online)
DF97(Khfajah) respectively. These differences are due to the soil management practices
applied and practiced in the area , the close interface of ground water level, and the rule of river
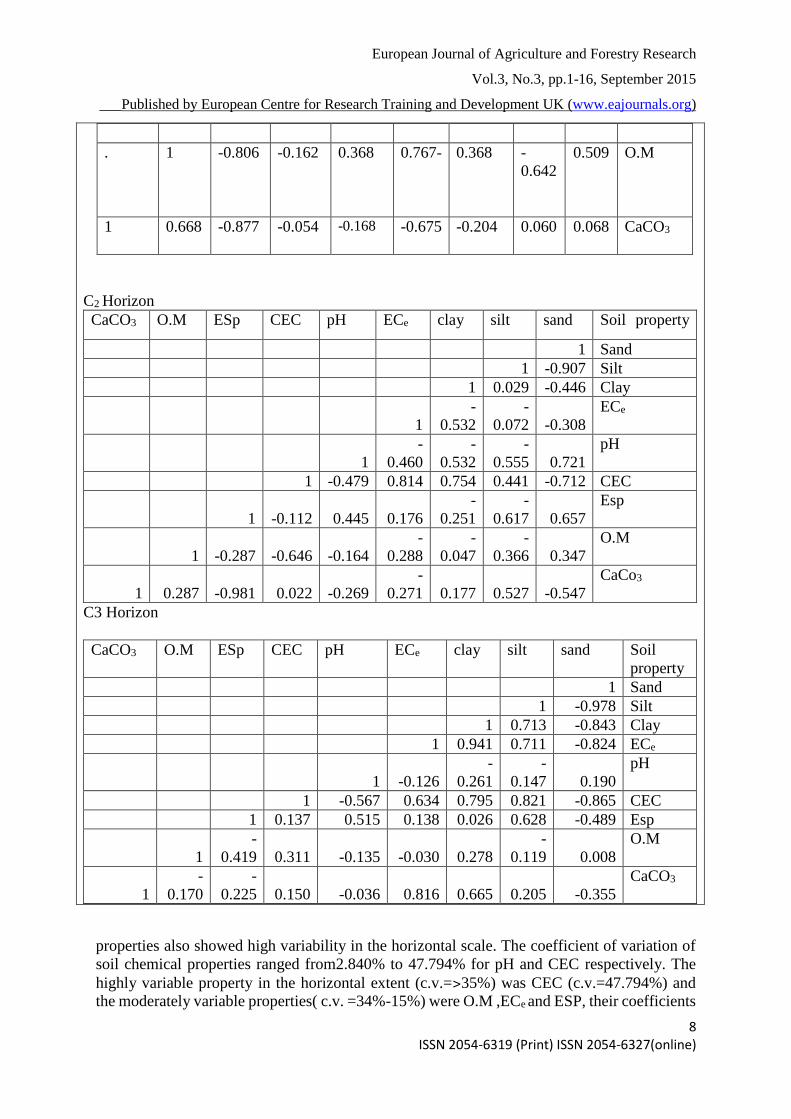
which is adjacent to DW45(Itidal) which acts as a natural drain for these soils. Table(2) presents
the correlations between soil physio-chemical properties of the studied soils. The highest
positive correlations were 0.965 and 0.941 between clay particles and electrical conductivity,
and between sand particles and pH in C1 and C3 horizons respectively. . And, the highest
inversely correlations were -0.997 and -0.981 between sand and silt particles ,and between
CaCO3 and ESp in A and C2 in horizons respectively. Whereas, the lowest positive correlation
Fig . 1 Location and soil map of study area
E 45̊ 53́ 9. 47̋
N 32̊ 25́ 28.68̋
E 45̊ 53́ 2.79̋
N 32̊ 25́ 36.77̋

European Journal of Agriculture and Forestry Research
Vol.3, No.3, pp.1-16, September 2015
___Published by European Centre for Research Training and Development UK (www.eajournals.org)
7 ISSN 2054-6319 (Print) ISSN 2054-6327(online)
was 0.008 between sand and organic matter in C3 horizon , whilst, the lowest inversely
correlation was -0.017 between ESP and clay particles in C1 horizon.
The studied soils exhibited high horizontal variability in their content of sand ,silt and clay.
Table (3) represent the extent of horizontal spatial variability of soil physio-chemical properties
among soils in studied area .It shows ,that, sand, silt and clay were highly variable(˃35%), and
their coefficient of variation were 78.327%, 49.062% and 36.734% respectively. Sand and clay
particles were positively highly skew (1.373) And (2.184 )respectively and of platykurtic and
leptokurtic shape of distribution (2.929) and (3.73 9) respectively. Whilst, Silt particles were
negatively highly skew (-2.189) and of leptokurtic (4.830) distribution . The pattern of the
horizontal variability of these particles in studied soils was taking the form of sand ˃ clay ˃
silt ,this is may be due to the location of these soils in respect to the location of the source of
deposition, in addition to the type of the sediments carried by it, Al Mohaimeed 1999 [37 ].
Chemical
Table 2 spearman correlation matrix for soil properties variables A Horizon
Soil
property
S Si C ECe pH CEC ESP OM CaCO3
Sand 1 0
Silt -0.997 1
Clay -0.686 0.632 1
EC e 0.869- -0.848 0.792 1
pH 0.914 0.887- 0.881- -0.973 1
CEC -0.679 0.667 0.572 0.884 -0.793 1
ESP -0.099 0.096 0.104 -0.216 0.054 -0.158 1
O.M 0.054 -0.109 0.524 -0.098 -0.090 -0.270 0.573 1
CaCO3 -0.546 0.569 0.135 0.227 -0.315 -0.161 -0.089 -0.110 1
C1 Horizon
Soil
property
S Si C ECe pH CEC ESP OM CaCO3
Sand 1
Silt -
0.822
1
Clay -
0.620
0.064
1
ECe -
0.751
0.414
0.645
1
pH 0.965
0.824 -0.557
-0.597 1
CEC -
0.853
0.414
0.927
0.698 0.827
1
ESP -
0.215
0.287
-0.017
0.020
0.619
-0.025
1
European Journal of Agriculture and Forestry Research
Vol.3, No.3, pp.1-16, September 2015
___Published by European Centre for Research Training and Development UK (www.eajournals.org)
8 ISSN 2054-6319 (Print) ISSN 2054-6327(online)
properties also showed high variability in the horizontal scale. The coefficient of variation of
soil chemical properties ranged from2.840% to 47.794% for pH and CEC respectively. The
highly variable property in the horizontal extent (c.v.=˃35%) was CEC (c.v.=47.794%) and
the moderately variable properties( c.v. =34%-15%) were O.M ,ECe and ESP, their coefficients
O.M 0.509
-
0.642
0.368
0.767-
0.368
-0.162
-0.806
1
.
CaCO3 0.068
0.060
-0.204
-0.675 -0.168
-0.054
-0.877
0.668
1
C2 Horizon
Soil property sand silt clay ECe pH CEC ESp O.M CaCO3
Sand 1
Silt -0.907 1
Clay -0.446 0.029 1
ECe
-0.308
-
0.072
-
0.532 1
pH
0.721
-
0.555
-
0.532
-
0.460 1
CEC -0.712 0.441 0.754 0.814 -0.479 1
Esp
0.657
-
0.617
-
0.251 0.176 0.445 -0.112 1
O.M
0.347
-
0.366
-
0.047
-
0.288 -0.164 -0.646 -0.287 1
CaCo3
-0.547 0.527 0.177
-
0.271 -0.269 0.022 -0.981 0.287 1
C3 Horizon
Soil
property
sand silt clay ECe pH CEC ESp O.M CaCO3
Sand 1
Silt -0.978 1
Clay -0.843 0.713 1
ECe -0.824 0.711 0.941 1
pH
0.190
-
0.147
-
0.261 -0.126 1
CEC -0.865 0.821 0.795 0.634 -0.567 1
Esp -0.489 0.628 0.026 0.138 0.515 0.137 1
O.M
0.008
-
0.119 0.278 -0.030 -0.135 0.311
-
0.419 1
CaCO3
-0.355 0.205 0.665 0.816 -0.036 0.150
-
0.225
-
0.170 1

European Journal of Agriculture and Forestry Research
Vol.3, No.3, pp.1-16, September 2015
___Published by European Centre for Research Training and Development UK (www.eajournals.org)
9 ISSN 2054-6319 (Print) ISSN 2054-6327(online)
of variations were 21.528%,29.835% and 33.434% respectively .The low variable properties
(c.v.˂15%) were pH and CaCO3 their coefficients of variation were 2.840% and 8.402%
respectively. Most chemical properties were highly positively skew (0.730,0.912,0.945 and
1.1750) for pH,CaCO3,ECe and CEC respectively, except for Esp was symmetrical (-0.006)
and they were of leptokurtic to platy kurtic shape of distribution 0.178,7.275,2.475,-0.710 and
1.130 for ECe, pH ,CEC, O.M, and CaCO3 respectively. These variation in chemical properties
are mostly related to the type of soil management practiced and applied in the area of study
,the nature of soil parent material ,quality of irrigation water used and the role of the depth of
ground water ,Al agidi 1990 [38],Almohammed,199 [37], Al-Aatab, 2008[39], Aldolaimi,2009
[40] , Abel Chemura ,et al 2014 [41] ; Ally-Said Matano,
Table (3): Descriptive statistics of the horizontal spatial variability of some physio-
chemical properties of some soil series in Mesopotamian plain.
St.d= standard deviation ; C.V = Coefficient of variation ,CEC= Cation of exchangeable
capacity ; Esp =Exchangeable sodium percentage ;OM=Organic matter; ECe=Electrical
conductivity, [42] the pattern of spatial variability of chemical properties was taking the form
CEC˃ESP˃EC˃O.M˃CaCO3˃pH.And the shape of spatial variability pattern of physio-chemical
properties was S˃c˃CEC˃silt˃ESp˃Ec˃O.M˃CaCO3˃pH. Moreover, soils exhibited High(cv=˃35%)
to moderately(cv=15-35%) vertical spatial variability in their content of sand ,silt and clay (table 4).The
coefficient of variation of sand particles ranged between 27.077% to 88.337% in DP45(Ghasan) and
DW54(Itidal) soil series respectively .Sand particles were moderately(0.570) to highly skew (1.516) in
MP5 (Amarah) and MM5 (Hai) soil series respectively, and of platy Kurtic to leptokurtic distribution
except for DF97 (Khfajah) was symmetrical (1.5) . The pattern of vertical spatial variability of sand
particles having the form of DP45 < DF97 <MP5<MM5<DW45.
The coefficient of variation in silt particles ranged between 19.524% to 79.577% in DF97 and
DP45 respectively. And, the particles were highly skew (-1.426) to approximately symmetrical
(-0.34) in MM5 (Hai) and DF97 (Khfajah) soil series respectively ,and, were of platy kurtic
distribution except for DP45 (Ghasan) was of leptokurtic (3.936) distribution. The vertical
CaCO3
mg.
Kgˉ1
OM
mg.
Kgˉ1
ESP% CEC
Cmol.
Kgˉ1
pH ECe
Ds.mˉ1
clay
mg.Kgˉ1
silt
mg.Kgˉ1
sand
mg.Kgˉ1
Property
series
soil
20.500 1.275 75.000 15.225 7.525 21.878 155.000 617.500 227.500 MM5
18.500 0.750 29.750 18.325 7.550 29.850 147.500 615.000 237.500 MP5
23.000 0.975 11.500 17.700 7.350 23.500 135.000 587.500 277.500 Dw45
23.000 0.975 18.525 32.975 7.237 38.300 312.500 637.500 50.000 DF97
19.250 1.325 19.000 8.750 7.825 18.325 145.000 182.500 672.500 DP45
17.000 0.300 9.000 6.800 7.100 12.300 90.000 100.000 30.000 Min.
25.000 1.900 35.000 40.100 7.900 60.700 470.000 780.000 780.000 Max.
20.350 1.085 20.755 18.595 7.505 26.370 254.000 528.000 293.000 Mean
1.710 0.235 6.939 8.887 0.213 7.867 124.619 193.598 229.499 St.d
8.402 21.528 33.434 47.794 2.840 29.835 49.062 36.734 78.327 C.V%
0.912 -0.596 -0.006 1.175 0.730 0.945 2.184 -2.189 1.373 Skewnes
s
1.130 -0.710 -0.324 2.475 7.275 0.178 3.739 4.830 2.929 Kurtosis

European Journal of Agriculture and Forestry Research
Vol.3, No.3, pp.1-16, September 2015
___Published by European Centre for Research Training and Development UK (www.eajournals.org)
10 ISSN 2054-6319 (Print) ISSN 2054-6327(online)
variation pattern of silt particles was taking the form of DP45 ˃ DW45 ˃ MP5 ˃ MM5 ˃ DF97.
Clay particles showed vertical spatial variability as well .The coefficient of variation of clay
particles ranged from 16.949% to 41.998% in MP5 (Amarah) and DF97 (Khfajah) soil series
respectively. Clay particles were mostly moderately skewed( -0.752 to 0.56) for MP5,DW54
and DP45 ,though, they were highly skewed (1.784) in MM5 and approximately symmetrical
in DF97(-0.112).Clay particles were of platy kurtic distribution in all soil series except in MM5
was of leptokurtic distribution(3.223) .The pattern of vertical spatial variability of clay particles
was taking the form of DF97 ˃ MM5 ˃ DP45 ˃ DW45 ˃ MP5 . Sand particles were the most
variable parameter in the vertical direction and clay was the lowest one, and the pattern of their
variability took the form of (Sand˃ Silt ˃ clay) in studied soils . These variations may be
attributed to different cycles of deposition that soils of the area which was subjected to ,and
the different types of sediments deposited in each cycle ,al agidi 1994[ 43], Muhaimeed and
Salih Alani,2013 [44].
Table 4:Descriptive statistics for the vertical spatial variability of physiochemical
properties of soils of the study area.
CaCO
3
mg.K
g-1
O.M
mg.K
g-1
Esp
%
CEC
Cmol.
Kgˉ1
pH ECe
Ds.mˉ1
clay
mg.K
g-1
Silt
mg.K
g-1
Sand
mg.K
g-1
Statistic
al
paramet
er
Soil
series
20.50
0
1.275 25.0
00
15.22
5
7.52
5
21.87
5
155.0
00
617.5
00
227.5
00
Mean MM5
2.081 0.206 6.16
4
4.812 0.17
0
9.252 64.54
9
124.1
97
155.0
00
St.d
10.15
4
16.16
9
24.6
57
31.61
6
2.26
9
42.29
7
41.64
5
20.11
2
68.13
1
C.V %
0.000 0.199 1.70
7
1.429 -
0.75
2
1.794 1.784 -1.426 1.516 Skewne
ss
0.390 -4.858 2.82
9
2.611 0.34
2
3.210 3.223 2.681 2.388 Kurtosi
s
18.50
0
0.750 29.7
5
18.32
5
7.55
0
29.85
0
147.5
00
615.0
00
237.5
00
Mean MP5
1.290 0.768 3.59
3
5.406 0.36
9
15.58
1
25.00
0
123.9
62
146.6
00
St.d
6.978 102.4
15
12.0
80
29.50
2
4.89
6
52.20
0
16.94
9
20.15
6
61.72
6
.V % C
0.000 1.977 1.69
6
-0.607 -
0.47
5
1.091 0.560 -0.629 0.570 Skewne
ss
-1.2 3.928 3.01
4
-2.168 -
2.71
6
0.038 0.928 -2.422 -2.207 Kurtosi
s
23.00
0
0.975 11.5
00
17.70
0
7.35
0
23.50
0
135.0
00
587.5
00
277.5
00
Mean DW45

European Journal of Agriculture and Forestry Research
Vol.3, No.3, pp.1-16, September 2015
___Published by European Centre for Research Training and Development UK (www.eajournals.org)
11 ISSN 2054-6319 (Print) ISSN 2054-6327(online)
3.366 0.309 2.08
1
3.131 0.12
9
19.10
9
34.15
6
227.6
51
245.1
36
St.d
14.63
7
26.76
1
18.1
01
17.69
2
1.75
6
81.31
6
25.30
1
38.74
9
88.33
7
C.V %
-1.887 1.137 0.00
0
-0.068 0.00
0
1.973 -0.752 -1.274 0.846 Skewne
ss
3.576 0.757 0.39
0
-2.168 -
1.20
0
3.912 0.342 1.198 -0.597 Kurtosi
s
20.50
0
0.975 18.5
25
32.97
5
7.27
5
38.30
00
312.5
00
637.5
00
50.00
0
Mean DF97
2.081 0.309 2.40
8
8.897 0.17
0
15.29
0
131.2
44
124.4
65
16.32
9
St.d
10.15
4
31.75
0
13.0
03
26.98
3
2.34
7
39.92
4
41.99
8
19.52
4
32.65
9
C.V %
0.000 1.137 1.55
0
-0.984 0.75
2
1.732 -0.112 -0.340 0.000 Skewne
ss
0.390 0.757 2.71
3
-0.584 0.34
2
3.066 1.248 0.790 1.500 Kurtosi
s
19.23
0
1.325 19.0
00
8.750 7.82
5
18.32
5
145.0
00
182.5
00
0672.
50
Mean DP45
1.707 0.320 4.69
0
2.120 0.09
5
1.820 34.15
6
145.2
29
182.0
94
St.d
8.871 24.16
2
24.6
86
24.23
4
1.22
3
9.936 25.30
1
79.57
7
27.07
7
C.V%
0.752 -.083 -
0.54
2
0.775 0.85
4
1.973 -0.752 -1.033 -1.971 Skewne
ss
0.342 0.757 -
0.15
2
-1.125 -
1.28
9
3.912 0.342 3.936 3.909 Kurtosi
s
Soils also showed a vertical spatial variability in their chemical properties . MM5 (Hai) , DW45
(Itidal) , DF97(Khfajah) soil series exhibited high variability (CV˃35%) in EC values. . Their
coefficients of variation were 42.297% ,52.200% and 41.998 respectively.
Whilst, MP5 (Amarah) soil series showed high vertical spatial variability (CV˃35%) in OM
and EC values and their coefficients of variation were 102.41% and 52.2 % respectively.MM5
(Hai), DW45 (Itidal), ,and DP45 (Ghassan) soil series showed moderate variability (CV=35%-
15%) in CEC, Esp and OM only ,their coefficients of variation were 31.606%, 24.297% and
16.169% for MM5(Hai) ;17.692%,18.101%,and 26.762% forDW45 (Itidal) Soil series and
24.234 , 24.686 , 24.162 for DP45 (Ghassan) soil series respectively.However.DF97 (Khfajah)
soil series showed moderate vertical variability in CEC and OM with coefficient of variation
26.983% and 31.75% respectively. All soil series showed low vertical spatial variability in pH
and CaCO3 except for Dp45 soil series was in EC ,pH and CaCO3 with coefficient of variation
9.936%,1.223% and 8.871% respectively .These variation are attributed to different soil
managements , the local environment revealed in the area , quality of irrigation water used

European Journal of Agriculture and Forestry Research
Vol.3, No.3, pp.1-16, September 2015
___Published by European Centre for Research Training and Development UK (www.eajournals.org)
12 ISSN 2054-6319 (Print) ISSN 2054-6327(online)
,few and sparse natural vegetation, the calcareous nature of parent material and tillage
effects[4,14,38,39,40,44,].
Soil Horizons showed high(CV=˃35%) to moderate (CV=35%-15%) horizontal spatial
variability in terms of the amount of sand, silt and clay particles (table 5). Sand was the
highest variable parameter ( CV%=121.971%) in A horizon and was the lowest in C3
(CV=79.642%) . And A horizon was the most variable horizon in sand content and, the
pattern of spatial variability was A ˃ C1 ˃ C2 ˃ C3 soil horizons. Silt particles also vary
horizontally in soil horizons , their highest coefficient of variation was in A horizon (
CV=64.037%) and the lowest were in C2 horizon (CV=22.992%) . The pattern of horizontal
spatial variability of soil horizons in terms of coefficient of variation in silt particles content
was taking the form A ˃ C3 ˃ C1 ˃ C2 . Soil Horizons vary considerably in terms of their
content of clay particles as well. Their coefficients of variation ranged from 19.549% to
84.633% in A and C1 horizons respectively .The pattern of clay particles spatial variability
was taking the shape C1 ˃ C3 ˃ C2 ˃ A. In this respect sand showed the highest variability in
A (CV=121.971%) ,C2 (CV=80.785%) and C3 (CV=79.642%) horizons and the lowest
variable were clay particles in A (CV=19.540%) and C3 (cv=46.426%) horizons. Whereas, silt
was the lowest variable in C1 (CV=47.447%) and C2 (CV=22.992%) horizons .These variation
are not as a result of pedogenic processes, but they are attributed to the geomorphic aspects and
to the different cycles of flooding and sedimentations processes that, the area was subjected to,
and to the quantity and type of the load which was carried with flooding water and its velocity
at time of sedimentation[9;16 Al Mohaimeed17; 37,39,40,38 Al agidi1990;44 ]. In addition,
soil horizons showed horizontal spatial variability in their chemical properties. The horizontal
variability of soil chemical properties of soil horizons ranged between low (˂15%) and high
(˃35%) .A,C1 and C2 horizons showed horizontal variability ranged from CV=(4.667% ,
2.66%), ( 59.151%,58.581%) and (3.304%,50.815%%) in pH and CEC respectively .But , C3
Horizon showed horizontal spatial variability ranged between (CV=3.304%-39.334%) in pH
and O.M respectively. A horizon showed high ,moderate and low spatial variability in EC
(36.390%) and CEC(59.151%) ; Esp(34.050); and pH ,O.M and CaCO3 respectively. C1
horizon Show high horizontal variability in Ec (36.396%( and CEC (58.581%) and moderate
horizontal variability in Esp(32.295% ) and OM(32.442%),though low horizontal variability in
pH(2.66%) and CaCO3) was found .C2 horizon showed high variability in
Cec(50.815%),OM(45.91%),EC(43.081%) and Esp(36.655%).But showed low variability in
pH(3.399%) and CaCO3(12.1%). C3 horizon ,have horizontal variability as well in
O.M(39.334%),Esp(36.159%) and CEC (35.114%).And moderate horizontal variability in ECe
(26.571%) .And has low variability in pH(3.304%) and CaCO3(10.500%). The form of their
spatial horizontal variability pattern was taking the form of (CEC˃Ece˃ESp˃CaCO3˃˃O.M
˃pH) , (CEC˃Ece˃O.M˃ESp˃CaCO3˃ ˃pH),( CEC˃ ˃O.M˃ ECe ˃ESp˃CaCO3˃ ˃pH) and
(O.M˃ ESp˃ CEC ˃ ECe CaCO3˃˃ pH) in A,C1,C2 and C3 horizons respectively. These
horizontal variations of chemical properties are due to different soil management practices used
in the area and other factors mentioned above.[4;14;37,38;39;40].

European Journal of Agriculture and Forestry Research
Vol.3, No.3, pp.1-16, September 2015
___Published by European Centre for Research Training and Development UK (www.eajournals.org)
13 ISSN 2054-6319 (Print) ISSN 2054-6327(online)
Table (5) descriptive statistics for the horizontal variability of some physio-chemical
properties of soil horizon.
C3 C2 C1 A Horizon
Soil
property
C.V
%
St.d mea
n
C.V
%
St.d mea
n
C.V
%
St.d mea
n
C.V
%
St.d mean
79.6
42
305.
826
384.
000
80.4
76
157.
734
169.
000
80.7
85
279.
510
346.
000
121.
971
300.
050
246.0
00
Sand
mg.Kg-1
55.7
62
234.
201
420.
000
22.9
92
141.
173
614.
000
47.4
47
219.
705
466.
000
64.0
37
281.
726
612.0
00
Silt
mg.Kg-1
46.4
26
90.9
94
196.
000
34.9
11
66.3
32
190.
000
84.6
33
159.
122
188.
000
19.5
40
27.7
48
142.0
00
Clay
mg.Kg-1
26.5
71
05.0
16
18.8
80
43.0
81
08.7
45
20.3
00
36.3
96
08.1
32
22.3
60
36.3
90
15.9
89
43.94
0
ECe
ds.mˉ1
03.3
04
00.2
60
07.6
60
03.3
99
00.2
54
07.5
00
02.6
66
00.2
00
07.5
00
04.6
67
00.3
43
07.36
0
pH
35.1
14
05.6
46
16.0
80
50.8
15
11.0
47
21.7
40
58.5
81
09.2
91
15.8
60
59.1
51
12.2
44
20.70
0
CEC
Cmol.
Kgˉ1
36.1
59
06.6
89
18.5
00
36.6
55
07.1
91
19.6
20
32.2
95
06.1
86
19.1
00
34.0
55
08.7
86
25.80
0
ESP%
39.3
34
00.3
11
00.7
80
45.9
1
0.47
7
01.0
40
32.4
42
00.3
04
00.9
40
12.1
74
00.1
92
01.58
0
O.M
mg.Kg-1
10.5
00
02.0
73
19.5
00
12.1
00
02.5
49
21.0
00
14.5
41
02.9
66
20.4
00
14.4
49
03.4
90
20.40
0
CaCO3
mg.Kg-1
St.d= standard deviation C.V= Coefficient of variation
CONCLUSIONS AND RECOMMENDATIONS
Estimating spatial variability of soil physio-chemical attributes is significant issues for
evaluating environments and prerequisite for soil and crop management and sustainable
agriculture in addition to identifying zones of degradation. Studied soils have pronounced a
horizontal and vertical spatial variability in their physio-chemical characteristics .These
variations was within and among pedons of the studied soil series . Pedogeomorphic processes
and soil management practices were the main participant aspects, that caused these
variations. CEC, and EC were the most variable parameters and showed high variability in
most soils. In contrary, pH and CaCO3 were the least variable properties and show low spatial
variability in most studied soils as well. Type ,load and the location of sedimentation source
(agent) was effective in producing these variations in both horizontals and vertical extents.
Hence, deep study and evaluation of soil spatial variability is crucial for best and effective soil
sampling scheme, correct allocation of experimental stations ,better soil management practices,

European Journal of Agriculture and Forestry Research
Vol.3, No.3, pp.1-16, September 2015
___Published by European Centre for Research Training and Development UK (www.eajournals.org)
14 ISSN 2054-6319 (Print) ISSN 2054-6327(online)
delineating a site specific management units and sustainable
agriculture.
REFERENCES
1- Maniyunda1, B. A. Raji,and M. G. Gwari 2013 .Variability of Some Soil
Physicochemical Properties on Lithosequence in Funtua, North –Western Nigeria
International Journal of Science and Research (IJSR), India Online ISSN: 2319-7064
2- Kavianpoor, H. A. Esmali Ouri1 , Z. Jafarian Jeloudar, and A. Kavian ,2012. American
Journal of Environmental Engineering 2(1): 34-44 DOI: 10.5923/j.ajee.20120201.06
3- Sivarajan,S. ;M.Nagarajan and R.Sivasamy ,2013 .Spatial Variability analysis of Soil
Properties using raster based GIS Techniques, Asian Journal of Applied Science 6(2):68-
78
4 – Yasrebi ,J.; M.Saffari ; H.Fathi ; N.Kaimian ; M . Emadi and M. Baghemejad,
2008.Spatial Variability of Soil Fertility Properties for Precision Agriculture in Southern
Iran.Journal of Applied Sciences 8(9):1642-1650.
5- Schlesinger, W.H, Raikes J.A., Hartley A.E., and Cross, A.F., 1996, on the spatial pattern
of soil nutrients in desert eco-systems, Ecology, 77,364–374
6- Liu,X.;C.Shi;W.Liang; Y.Jiang;D.Jiang and Y.Steinberger 2007. Spatial Variability of
Soil Properties Related to Salinity and Alkalinity in Meliorated Grasslands of Horqin
Sand Land,Northeast China. Agricultural journal 2(5):564-
569.
7- Ghartey, E.O.; G. N. N. Dowuona; E. K. Nartey; T. A. Adjadeh;Y.D.I. Lawson 2012.
Assessment of Variability in the Quality of an Acrisol under Different Land Use Systems
in. Open Journal of Soil Science, , 2, 33-43
8- Serrano. S. Shahidian and J. Marques da Silva 2014 Spatial and Temporal Patterns of
Apparent Electrical Conductivity: DUALEM vs. Veris Sensors for Monitoring Soil
Properties Sensors, 14, 10024-10041; doi:10.3390/s14061002.
9- Akhtaruzzaman Md., Haque Md. E ,and K. T. Osman 2014. Morphological, Physical
and Chemical Characteristics of Hill Forest Soils at Chittagong University, Bangladesh,
Open Journal of Soil Science, 2014, 4, 26-35
10- Mann ,K. K.; A. W. Schumann; T. A. Obreza; W. G. Harris, and S. Shukla (2010) , Spatial
Variability of Soil Physical Properties Affecting Florida Citrus Production Soil Science
& Volume 175, Number 10, October 2010,487-499.
11- , R. Reich, D. Inman, F. Smith, and L. MacDonald,2005. Spatial Variability of Measured
Soil Properties across Site-Specific Management Zones, Soil Sci. Soc. Am. J.69:1572-
1579. 12- Saglam, M., M. H. S.
O¨ ztu¨ rk; S. Ers¸ahin ahin3, and A. ˙I. O¨ zkan, 2011. Spatial variation of soil physical
properties in adjacent alluvial and colluvial soils under Ustic moisture regime, Hydrol.
Earth Syst. Sci. Discuss., 8, 4261–4280.
13- Khan,M.J., M. Rashid, S. Ali, I. Khattak, S. Naveed, and Z. Hanif, 2014. Mapping of
Variability in Major and Micro Nutrients for Site-Specific Nutrient Management,
International Journal of Plant & Soil Science3(3): 303-329, 2014; Article no.
IJPSS.2014.008.
14-. Jafari,M., H. Mohammad Asgari, M. Tahmoures, and M.Biniaz, 2011. Assessment of soil
property spatial variation based on the Geostatistical simulation.Desert 16 87-101.
15 Fathi H., H. Fathi and H. Moradi (2014 ). Spatial variability of soil characteristic for
evaluation of agricultural potential in Iran Merit Research Journal of Agricultural
Science and Soil Sciences (ISSN: 2350-2274) Vol. 2(2) pp. 024-031.

European Journal of Agriculture and Forestry Research
Vol.3, No.3, pp.1-16, September 2015
___Published by European Centre for Research Training and Development UK (www.eajournals.org)
15 ISSN 2054-6319 (Print) ISSN 2054-6327(online)
16- Some’e B. S. ; F. Hassanpour ; A. Ezani ; S. R. Miremadi and H. Tabari,( 2014) .
Investigation of spatial variability and pattern analysis of soil properties in the northwest
of Iran, Environ Earth Sci DOI 10.1007/s12665-011-0993.
17- Moss , R.E.S.; J. C. Hollenback , and J. Ng,( 2010 ). Spatial Variability of Levees as
Measured Using the CPT, 2nd International Symposium on Cone Penetration Testing,
Huntington Beach, CA, USA.
18- Douaik,A..(2011). Application of Statistical Methods and GIS for Downscaling and
Mapping Crop Statistics using Hypertemporal Remote Sensing . Research Unit on
Environment and Conservation of Natural Resources, National Institute of Agricultural
Research (INRA), Rabat, Morocco .
19- Goovaerts P.,(1998). Geostatistical tools for characterizing the spatial variability of
microbiological and physico-chemical soil properties ,1998 Biol Fertile Soils 27 :315–
334 20- Xuewen Huang, E.L. Skidmore* and G. Tibhz ,(1999) . Spatial Variability of
Soil Properties along a Transect of CRP and Continuously Cropped Land, Pages 641.647
In D E Stoti, R H Mohtar and G C Steinhardt (eds) 2001 Sustaining the Global Farm
Selected papers from the 10th international Sod Conservation Organization Meeting held
Mw 24-29, 1999 at Ptirdire University and the USDA-ARS National Soil Erosion
Research Laboratory .
21- Akbas, F.,(2014) .Spatial Variability of soil color parameters and soil properties in an
alluvial soil .African journal of Agriculture Research,vol.9(12),pp.1025-1035.
22- Biswas, A. and A. K. Paul, (2012 ). Physico-chemical analysis of saline soils of
solarsalterns and isolation of moderately halophilic bacteria for poly (3-hydroxybutyric
acid) production, International Research Journal of Microbiology (IRJM) (ISSN: 2141-
5463) Vol. 2(6) pp. 227-236 . .
23 TUNÇAY,T.; İ. BAYRAMIN; A.E. TERCAN; and İ. ÜNVER,(2013) . Spatial
variability of some soil properties: a case study of the Lower Seyhan river basin in
Turkey, Zemdirbyste-Agriculture, vol. 100, No. 2 (2013), p. 213–
219.
24- Iqbal,J.; J. A. Thomasson; J. N. Jenkins; P. R. Owens; and F. D. Whisler,2005 . Spatial
Variability Analysis of Soil Physical Properties of Alluvial Soils, SOIL SCI. SOC. AM.
J., VOL. 69:1338-1350
25- Wasiullah*, A.U; A.U. Bhatti;F. Khan
and M. Akmal 2010. Spatial variability and geo-
statistics application for mapping of soil properties and nutrients in semi arid district
Kohat of Khyber Pakhtunkhwa (Pakistan Soil & Environ. 29(2): 159-166.
26 - Emadi,E.; M. Baghernejad; M.Pakparvar and S. Hashemi,2008 . ASSESSMENT OF
SPATIAL VARIABILITY OF SOME SOIL PROPERTIES IN SALT AND SODIC
AFFECTED SOILS IN ARSANJAN PLAIN, FARS PROVINCE, SOUTHERN IRAN .
27- Nkheloane, T.;A. O. Olaleye, and R. Mating,2012 . Spatial heterogeneity of soil physico-
chemical properties in contrasting wetland soils in two agro-ecological zones of Lesotho.
Soil Research, 2012, 50, 579–587.
28 – Iňigo,Andrades; J.I.1 Alonso- Martirena; A.Marín and R. Jiménez-Ballesta,2012.Soil
property variability in a humid natural Mediterranean environment:La Rioja,Spain ,
SPANISH JOURNAL OF SOIL SCIENCE YEAR 2012 VOLUME 2 ISSUE 1 pp38-54.
29- Gerrard A.F.1987 .Alluvial soils .Hutchinson Ross, New York .
30- DENGĐZ,O. 2010. Morphology, Physico-Chemical Properties and Classification of
Soils on Terraces of the Tigris River in the South-east Anatolia Region of Turkey. Journal
of Agricultural Sciences 16 206 (2010) 205-212
31- Buringh 1960 ,Soil and soil condition of Iraq .Min of agric .Baghdad ,Iraq.

European Journal of Agriculture and Forestry Research
Vol.3, No.3, pp.1-16, September 2015
___Published by European Centre for Research Training and Development UK (www.eajournals.org)
16 ISSN 2054-6319 (Print) ISSN 2054-6327(online)
32 - Al-Aqidi,W.K. (1976) ,Proposed soil classification at the series level for Iraqi soils
;1.Alluvial soil. Baghdad Univ.Tech.bull.No.1 . .
33- Soil Survey Division Staff. 1993. Soil survey manual. Soil Conservation Service. U.S.
Department of Agriculture Handbook18 . .
34- Black,C.A.(1965).Methods of soil analysis American soc.of Agronomy No.9.
35- Richards,L.A.,1954.Diagnosis and improvement of Saline and Alkaline Soils .USDA
Hand bookNo.60U.S.Govt.Print.Office,Washington,DC.PP 89-106 .
36- SPSS 10.. Statistical Package for Social Sciences, SPSS statistics(http://www.spss.com.).
37- Al Mhimed , A. S. (2999).Time and spatial variability of salinity and temperature in soils
of Iraqi-Mid Mesopotamian plain. PhD. Thesis ,college of Agriculture ,University of
Baghdad ,Iraq.
38- Al-Juboory,S.R. ,Alaqid,W.K. Alaqidi, and S.M.Al-Issawi, (1990).Effect of Soil
Management Practices On Chemical and Physical Properties Of A soil From great
Mussayb Project. Iraqi journal of Agriculture Sciences ,21(1) 107-116.
39- Al-Atab,S.M.S.(2008).Variations of soil properties and classification in some area of
Basrah Governorate PhD. Thesis ,college of agriculture ,University of Basrah ,Iraq.
40- Al Dulaimi ,F.M.(2009).Pedological study of some alluvial soils utilized by grain-non
cultivated system, west of Iraq. Al Anbar journal of Agricultural sciences .Vol.7 No(3)pp
41- Abel,C. , D. Kutywayo ,T.,M. Chagwesha , P. Chidoko (2014).Assessment Of Irrigation
water quality and selected Soil Parameters at Mutema irrigation scheme, Zimbabwe
.Journal of water resources and Protection, 6,132-140.
42- Ally-said,M ,C.K. Kanagire ,D.N. Anyona ,P. O .Abuuom. F.B .Gelder
,G.O.Dida,P.O.Owur,and A.V.O.Ofulla.(2015).
43- Al-aqidi ,W .k.(1994).Applicability of geomorphic interpretations of Tigris-Euphrates
rivers pedostratographic system in soil survey practices .Iraqi journal of Agric science
.25(2):24-32. 44-Muhaimeed,A.S. and A.M Saleh (2013).Spatial variability
analysis of selected soil properties at Musayab ,Babil, Iraq.IOSR Journal Of Agriculture
and Veterinary science (JORS-JAV)vol.6.Issu 3 pp72-79.