Embed Size (px)
Citation preview
Biochemistry 4000Lecture 1 Slide 1
Physiochemical PropertiesPhysiochemical Propertiesof Amino Acidsof Amino Acids
Various SourcesVarious SourcesCα RN
C
Biochemistry 4000Lecture 1 Slide 2
Classification (Polarity)
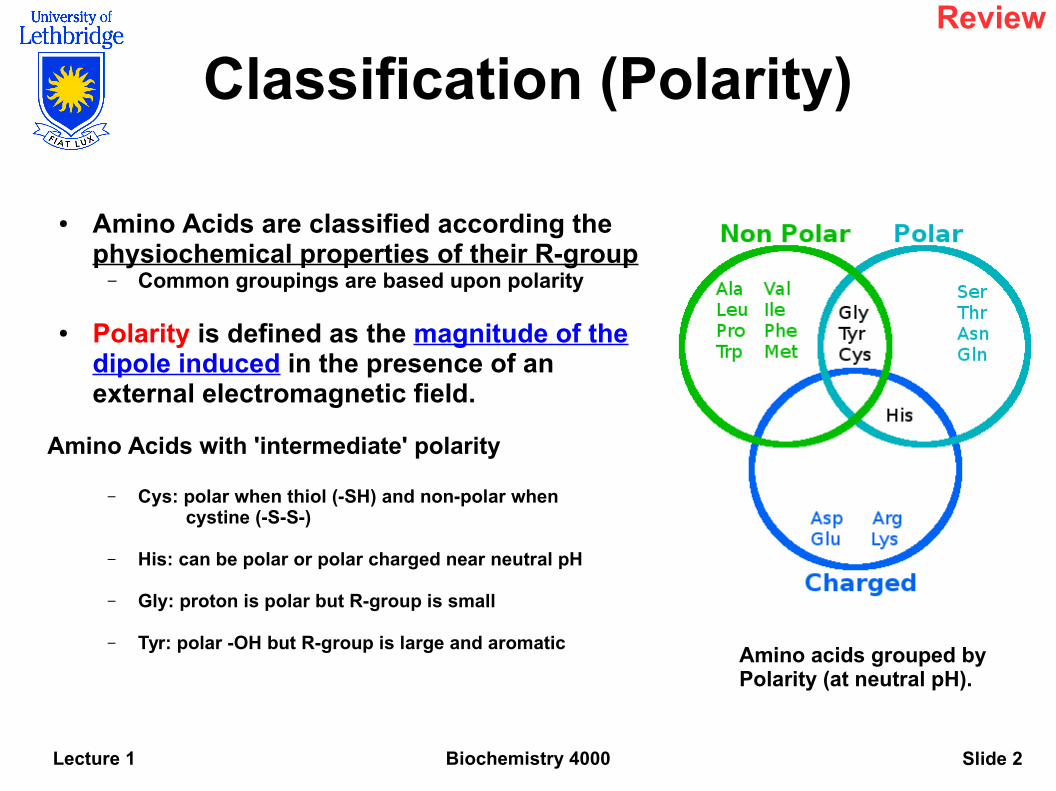
● Amino Acids are classified according the physiochemical properties of their R-group
– Common groupings are based upon polarity
● Polarity is defined as the magnitude of the dipole induced in the presence of an external electromagnetic field.
Amino Acids with 'intermediate' polarity
– Cys: polar when thiol (-SH) and non-polar when cystine (-S-S-)
– His: can be polar or polar charged near neutral pH
– Gly: proton is polar but R-group is small
– Tyr: polar -OH but R-group is large and aromaticAmino acids grouped by Polarity (at neutral pH).
Review
Biochemistry 4000Lecture 1 Slide 3
Classification (Hydropathy)
● Another common amino acid classification is based upon 'Hydrophobicity'
– Hydrophobicity simply translates as 'water fearing' and is the opposite of Hydrophilicity
– Hydrophobicity and Polarity are interrelated concepts – hydrophobic compounds are non-polar
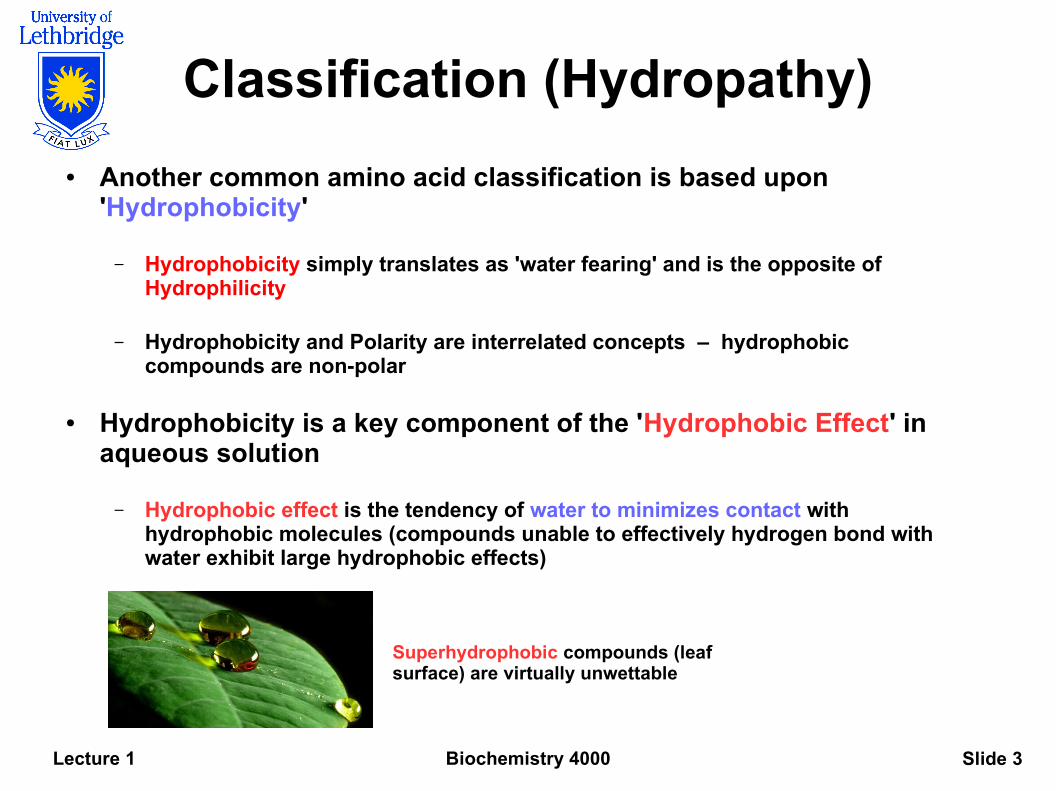
● Hydrophobicity is a key component of the 'Hydrophobic Effect' in aqueous solution
– Hydrophobic effect is the tendency of water to minimizes contact with hydrophobic molecules (compounds unable to effectively hydrogen bond with water exhibit large hydrophobic effects)
Superhydrophobic compounds (leaf surface) are virtually unwettable
Biochemistry 4000Lecture 1 Slide 4
Hydropathy Scales(solute partitioning)
Quantifying the hydropathy of amino acids
Hydrophobicity is defined as the tendency not to dissolve in water
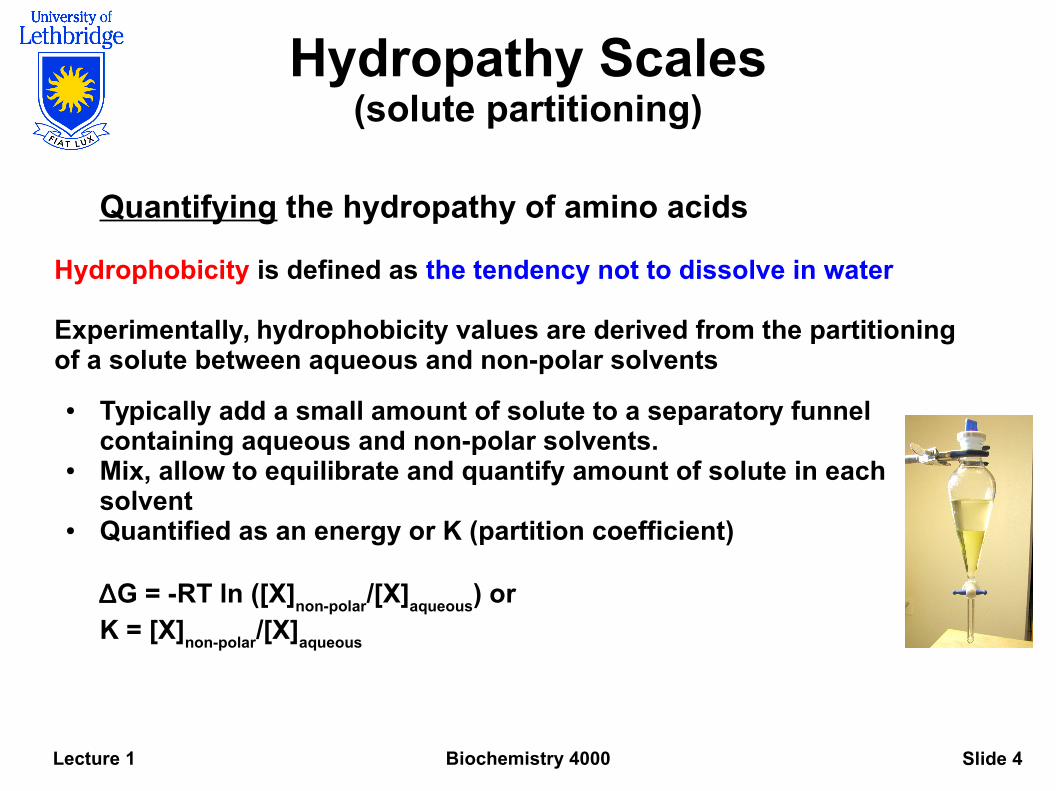
Experimentally, hydrophobicity values are derived from the partitioning of a solute between aqueous and non-polar solvents
● Typically add a small amount of solute to a separatory funnel containing aqueous and non-polar solvents.
● Mix, allow to equilibrate and quantify amount of solute in each solvent
● Quantified as an energy or K (partition coefficient)
∆G = -RT ln ([X]non-polar
/[X]aqueous
) orK = [X]
non-polar/[X]
aqueous
Biochemistry 4000Lecture 1 Slide 5
Hydropathy Scales(solute partitioning)
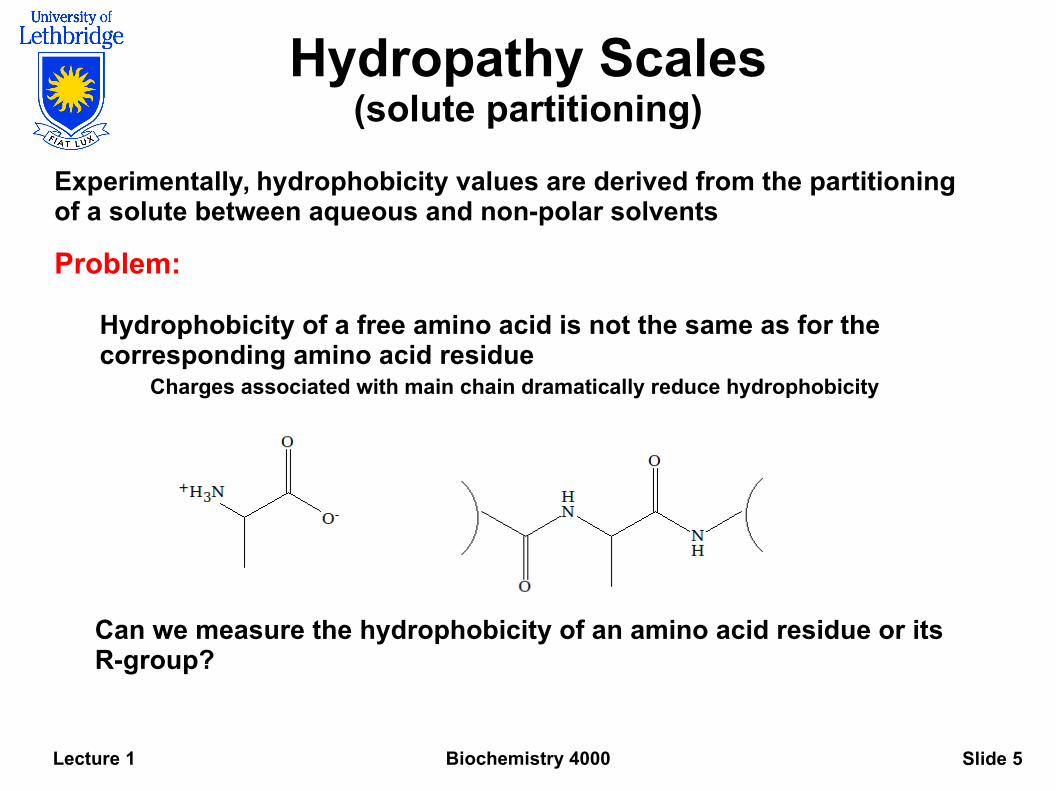
Experimentally, hydrophobicity values are derived from the partitioning of a solute between aqueous and non-polar solvents
Problem:
Hydrophobicity of a free amino acid is not the same as for the corresponding amino acid residue
Charges associated with main chain dramatically reduce hydrophobicity
Can we measure the hydrophobicity of an amino acid residue or its R-group?
Biochemistry 4000Lecture 1 Slide 6
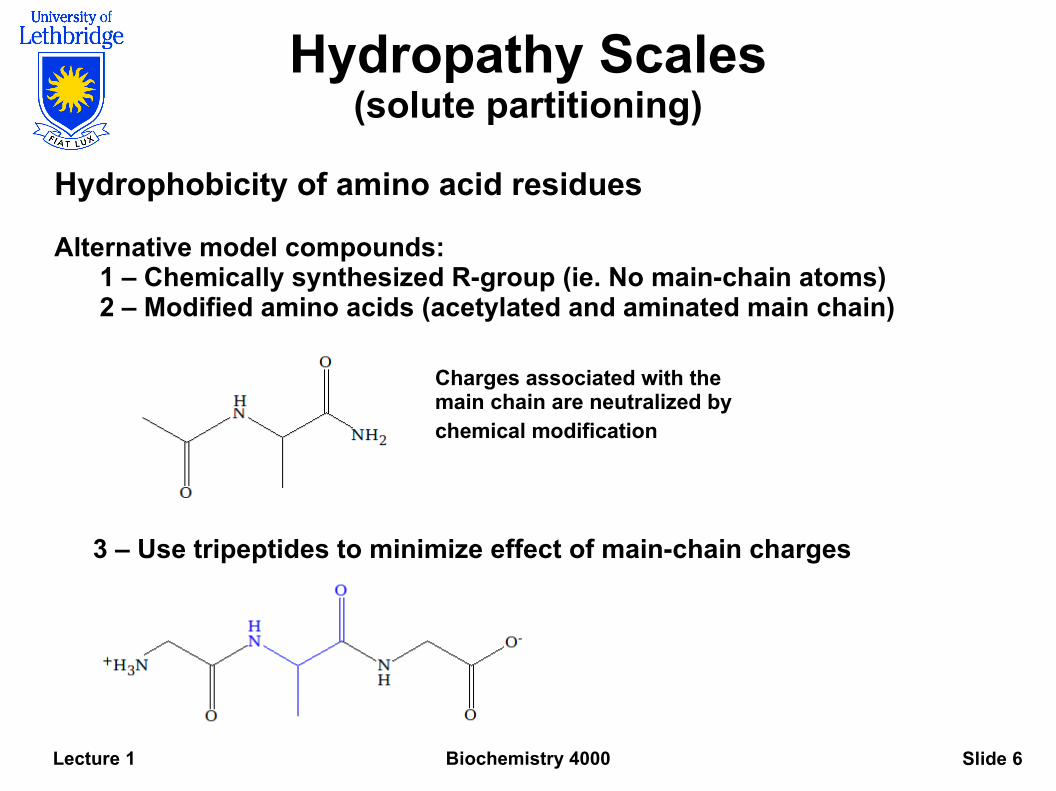
Hydrophobicity of amino acid residues
Alternative model compounds:1 – Chemically synthesized R-group (ie. No main-chain atoms)2 – Modified amino acids (acetylated and aminated main chain)
3 – Use tripeptides to minimize effect of main-chain charges
Charges associated with the main chain are neutralized by chemical modification
Hydropathy Scales(solute partitioning)
Biochemistry 4000Lecture 1 Slide 7
Hydropathy Scales(structure-based accessibility)
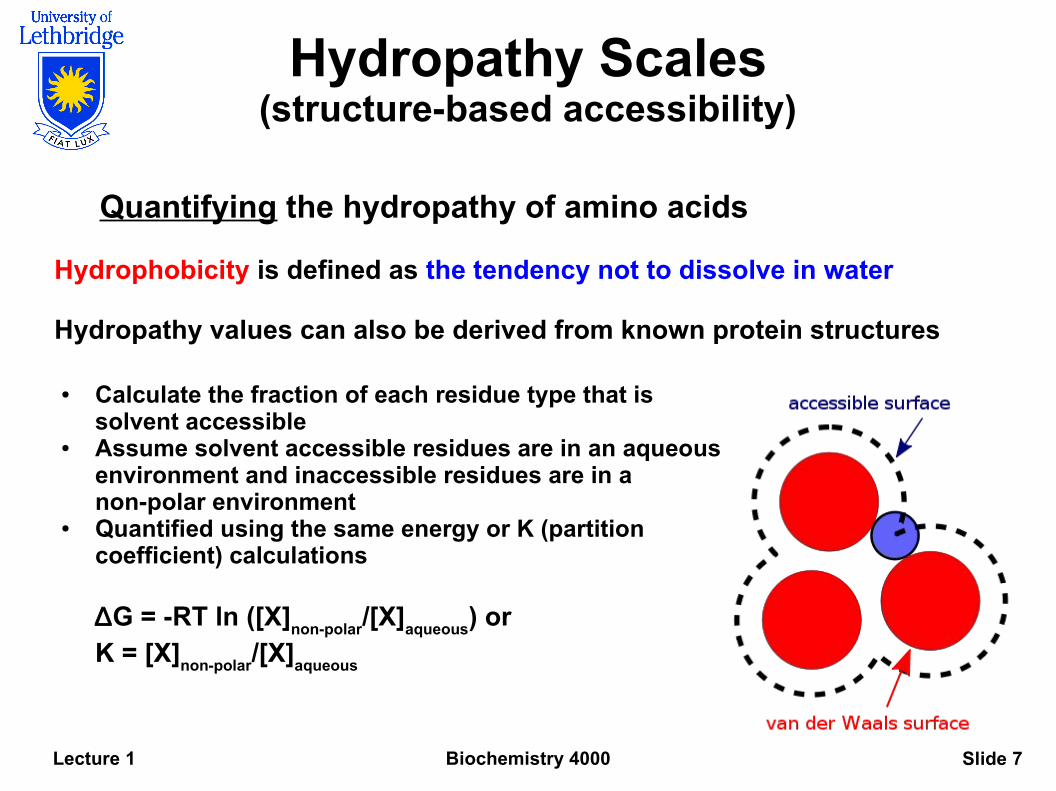
Quantifying the hydropathy of amino acids
Hydrophobicity is defined as the tendency not to dissolve in water
Hydropathy values can also be derived from known protein structures
● Calculate the fraction of each residue type that is solvent accessible
● Assume solvent accessible residues are in an aqueous environment and inaccessible residues are in a non-polar environment
● Quantified using the same energy or K (partition coefficient) calculations
∆G = -RT ln ([X]non-polar
/[X]aqueous
) orK = [X]
non-polar/[X]
aqueous
Biochemistry 4000Lecture 1 Slide 8
Hydropathy Scales(structure-based accessibility)
Quantifying the hydropathy of amino acids
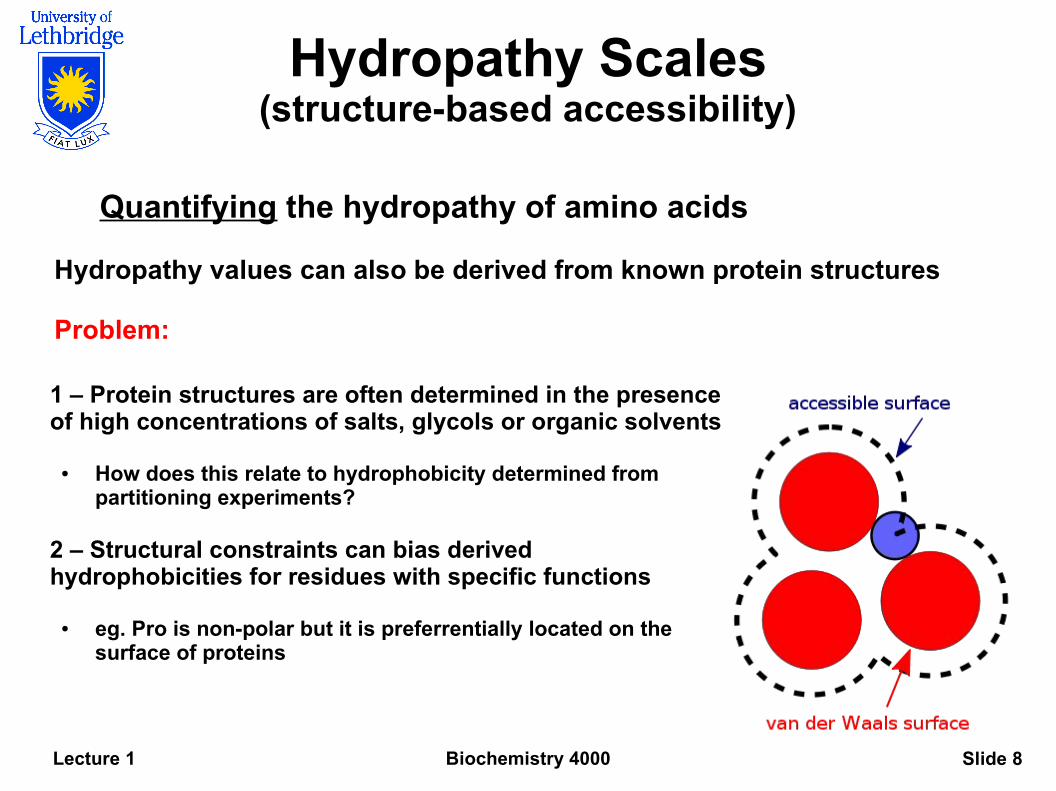
Hydropathy values can also be derived from known protein structures
Problem:
1 – Protein structures are often determined in the presence of high concentrations of salts, glycols or organic solvents
● How does this relate to hydrophobicity determined from partitioning experiments?
2 – Structural constraints can bias derived hydrophobicities for residues with specific functions
● eg. Pro is non-polar but it is preferrentially located on the surface of proteins
Biochemistry 4000Lecture 1 Slide 9
Hydropathy Scales (examples)
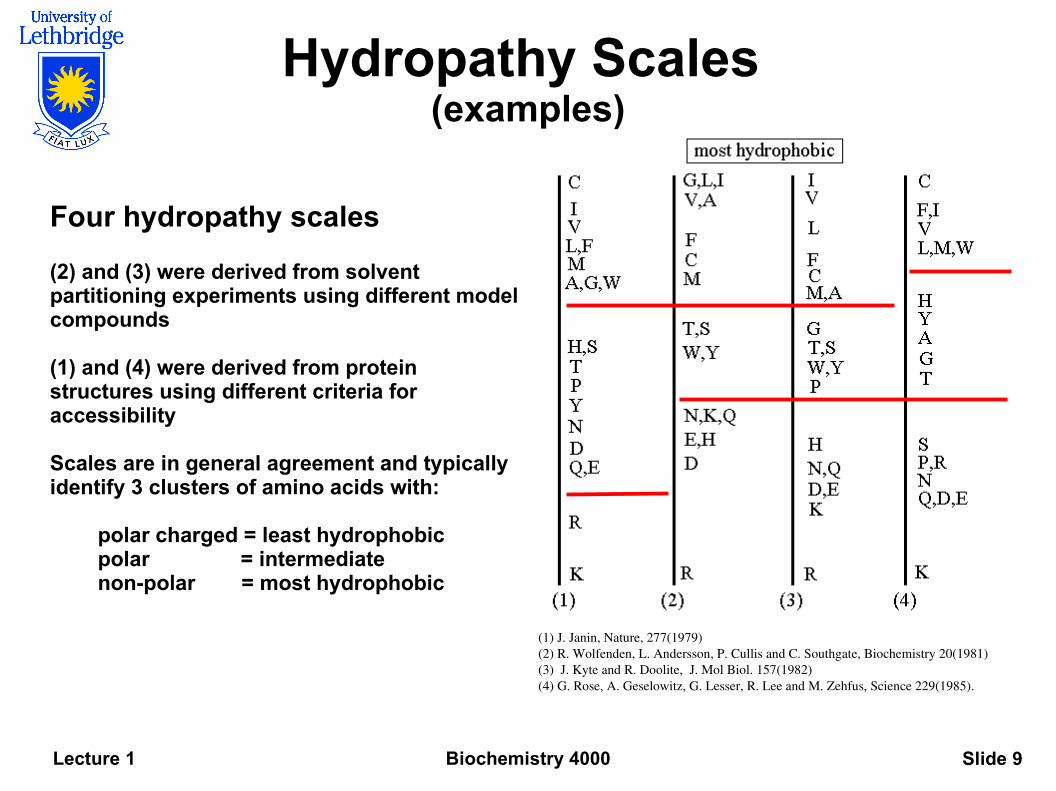
Four hydropathy scales
(2) and (3) were derived from solvent partitioning experiments using different model compounds
(1) and (4) were derived from protein structures using different criteria for accessibility
Scales are in general agreement and typically identify 3 clusters of amino acids with:
polar charged = least hydrophobicpolar = intermediate non-polar = most hydrophobic
(1) J. Janin, Nature, 277(1979) (2) R. Wolfenden, L. Andersson, P. Cullis and C. Southgate, Biochemistry 20(1981) (3) J. Kyte and R. Doolite, J. Mol Biol. 157(1982) (4) G. Rose, A. Geselowitz, G. Lesser, R. Lee and M. Zehfus, Science 229(1985).
Biochemistry 4000Lecture 1 Slide 10
Hydropathy Scales(differences between methods)
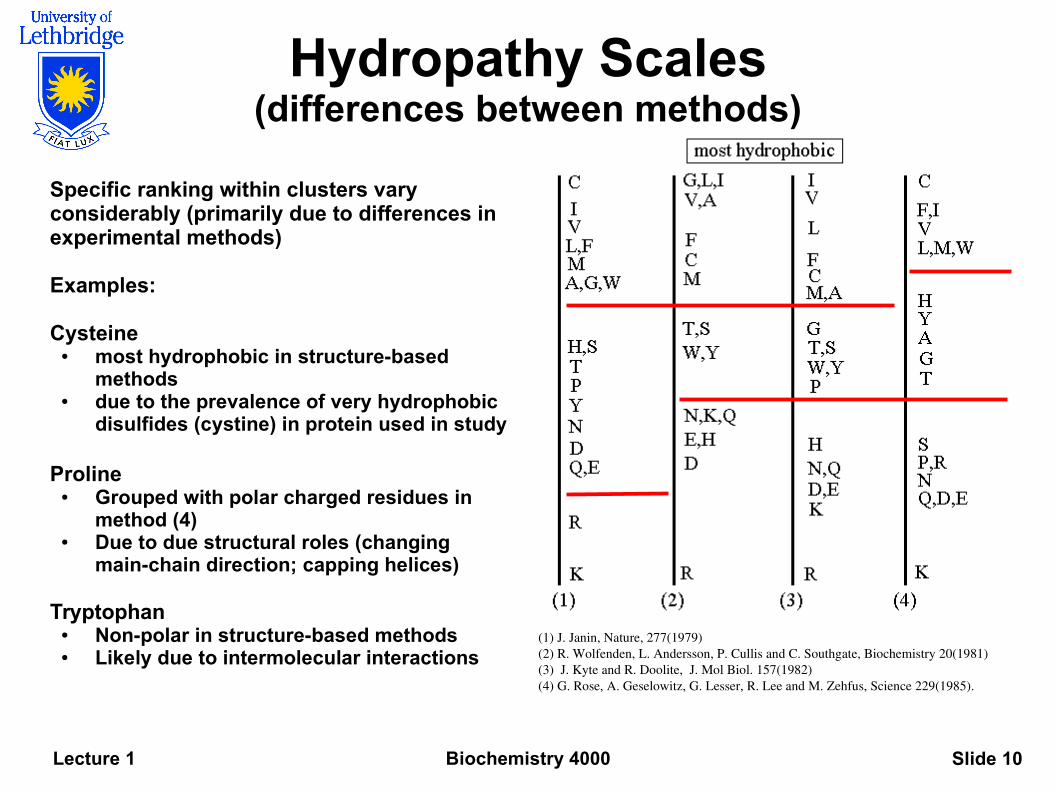
Specific ranking within clusters vary considerably (primarily due to differences in experimental methods)
Examples:
Cysteine ● most hydrophobic in structure-based
methods ● due to the prevalence of very hydrophobic
disulfides (cystine) in protein used in study
Proline● Grouped with polar charged residues in
method (4) ● Due to due structural roles (changing
main-chain direction; capping helices)
Tryptophan ● Non-polar in structure-based methods● Likely due to intermolecular interactions
(1) J. Janin, Nature, 277(1979) (2) R. Wolfenden, L. Andersson, P. Cullis and C. Southgate, Biochemistry 20(1981) (3) J. Kyte and R. Doolite, J. Mol Biol. 157(1982) (4) G. Rose, A. Geselowitz, G. Lesser, R. Lee and M. Zehfus, Science 229(1985).
Biochemistry 4000Lecture 1 Slide 11
Hydropathy Scales(example)
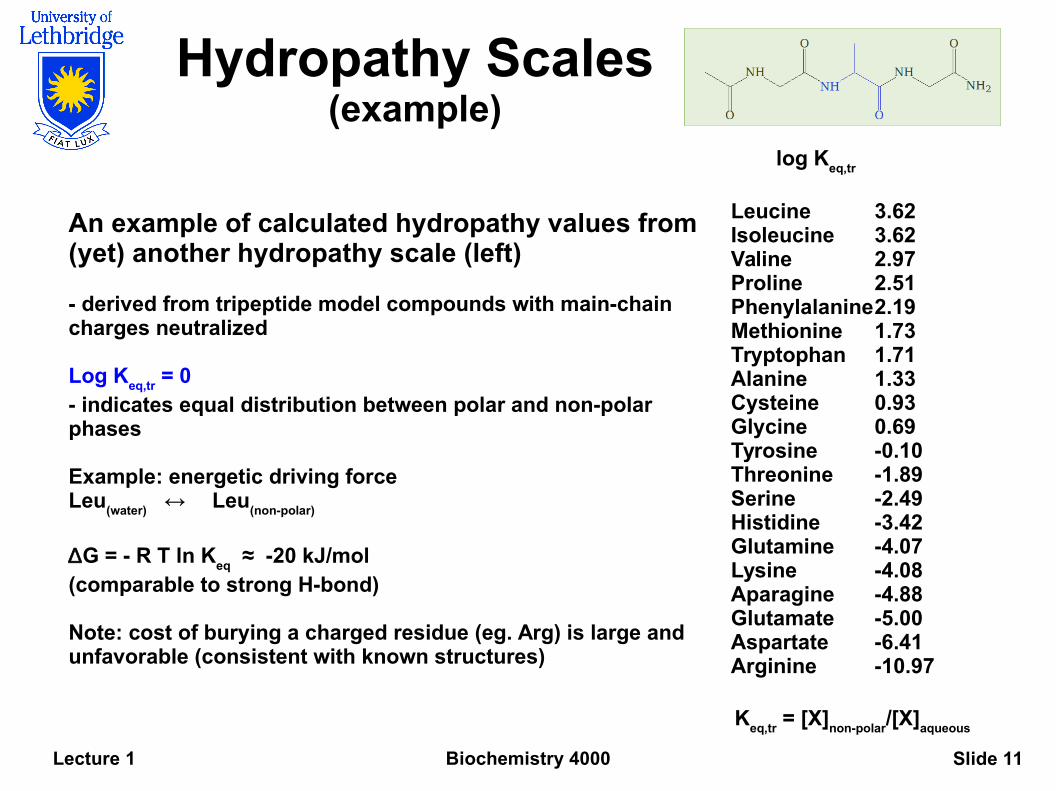
log Keq,tr
Leucine 3.62Isoleucine 3.62Valine 2.97Proline 2.51Phenylalanine2.19Methionine 1.73Tryptophan 1.71Alanine 1.33Cysteine 0.93Glycine 0.69Tyrosine -0.10Threonine -1.89Serine -2.49Histidine -3.42Glutamine -4.07Lysine -4.08Aparagine -4.88Glutamate -5.00Aspartate -6.41Arginine -10.97
An example of calculated hydropathy values from (yet) another hydropathy scale (left)
- derived from tripeptide model compounds with main-chain charges neutralized
Log Keq,tr
= 0 - indicates equal distribution between polar and non-polar phases
Example: energetic driving forceLeu
(water) ↔ Leu
(non-polar)
∆G = - R T ln Keq
≈ -20 kJ/mol (comparable to strong H-bond)
Note: cost of burying a charged residue (eg. Arg) is large and unfavorable (consistent with known structures)
Keq,tr
= [X]non-polar
/[X]aqueous
Biochemistry 4000Lecture 1 Slide 12
Hydropathy Scales(uses)
log Keq,tr
Leucine 3.62Isoleucine 3.62Valine 2.97Proline 2.51Phenylalanine2.19Methionine 1.73Tryptophan 1.71Alanine 1.33Cysteine 0.93Glycine 0.69Tyrosine -0.10Threonine -1.89Serine -2.49Histidine -3.42Glutamine -4.07Lysine -4.08Aparagine -4.88Glutamate -5.00Aspartate -6.41Arginine -10.97
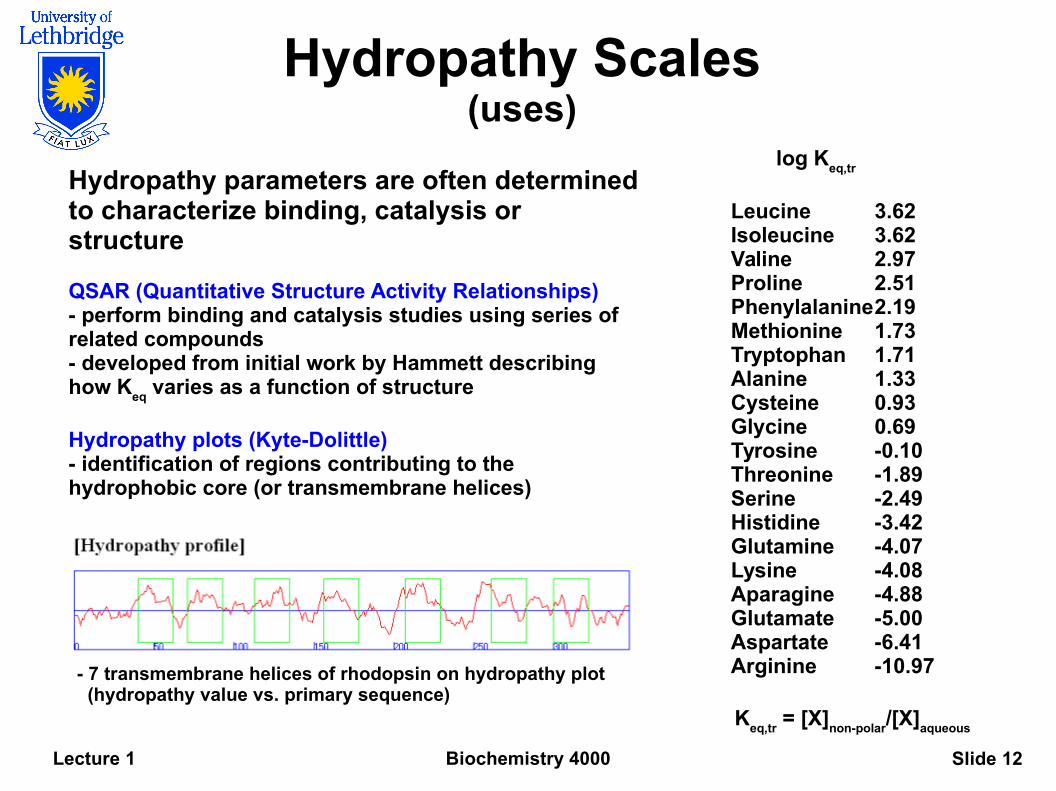
Hydropathy parameters are often determined to characterize binding, catalysis or structure
QSAR (Quantitative Structure Activity Relationships)- perform binding and catalysis studies using series of related compounds- developed from initial work by Hammett describing how K
eq varies as a function of structure
Hydropathy plots (Kyte-Dolittle)- identification of regions contributing to the hydrophobic core (or transmembrane helices)
Keq,tr
= [X]non-polar
/[X]aqueous
- 7 transmembrane helices of rhodopsin on hydropathy plot (hydropathy value vs. primary sequence)
Biochemistry 4000Lecture 1 Slide 13
Hydropathy Scales(more physical methods)
Many indirect physical methods have been developed to measure hydropathy:
Reverse Phase Chromatography
Site-directed mutation and Protein thermal stability
Molar Heat Capacity
Transition temperature
Surface Tension
In broad terms, each of the methods yield similar hydropathy scales.
Specific differences between hydropathy scales are typically due to differences in experimental methods.

Biochemistry 4000Lecture 1 Slide 14
Hydropathy Scales(uses)
log Keq,tr
Leucine 3.62Isoleucine 3.62Valine 2.97Proline 2.51Phenylalanine2.19Methionine 1.73Tryptophan 1.71Alanine 1.33Cysteine 0.93Glycine 0.69Tyrosine -0.10Threonine -1.89Serine -2.49Histidine -3.42Glutamine -4.07Lysine -4.08Aparagine -4.88Glutamate -5.00Aspartate -6.41Arginine -10.97
Hydropathy parameters are often determined to characterize binding, catalysis or structure
QSAR (Quantitative Structure Activity Relationships)- perform binding and catalysis studies using series of related compounds- developed from initial work by Hammett describing how K
eq varies as a function of structure
Hydropathy plots (Kyte-Dolittle)- identification of regions contributing to the hydrophobic core (or transmembrane helices)
Keq,tr
= [X]non-polar
/[X]aqueous
- 7 transmembrane helices of rhodopsin on hydropathy plot (hydropathy value vs. primary sequence)
Biochemistry 4000Lecture 1 Slide 15
Sequence SimilaritySequence Similarity(hydropathy and similarity)(hydropathy and similarity)
All bioinformatic approaches require some quantitative measure to objectively evaluate agreement between a 'query' and a 'database' item
In the case of sequence searches, the quantitative measure is sequence similarity
Similarity (definition) – The common physiochemical properties necessary to maintain the structural and functional properties of a biological macromolecule.
Note: this implies that sequence searches are often detecting homology (eg. divergent evolution)
Biochemistry 4000Lecture 1 Slide 16
Example (simple)Example (simple)
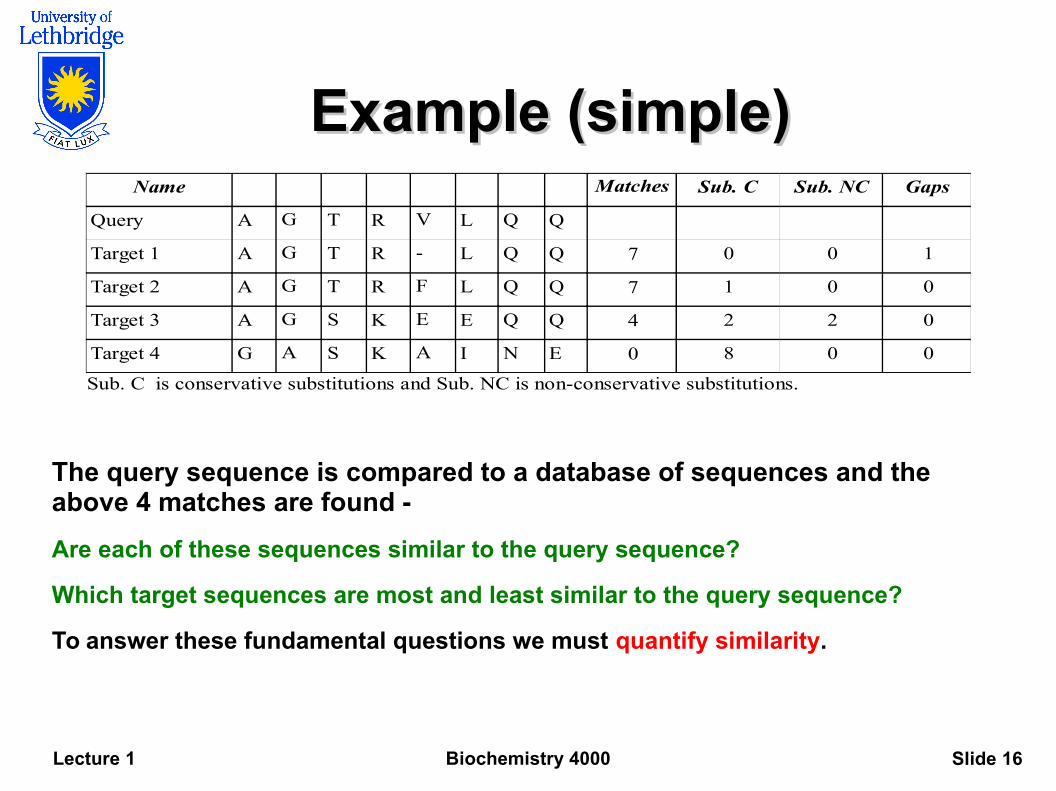
The query sequence is compared to a database of sequences and the above 4 matches are found -
Are each of these sequences similar to the query sequence?
Which target sequences are most and least similar to the query sequence?
To answer these fundamental questions we must quantify similarity.
Name Matches Sub. C Sub. NC Gaps
Query A G T R V L Q Q
Target 1 A G T R - L Q Q 7 0 0 1
Target 2 A G T R F L Q Q 7 1 0 0
Target 3 A G S K E E Q Q 4 2 2 0
Target 4 G A S K A I N E 0 8 0 0
Sub. C is conservative substitutions and Sub. NC is non-conservative substitutions.
Biochemistry 4000Lecture 1 Slide 17
Quantification of SimilarityQuantification of Similarity
Similarity is a non-SI unit that does not have a universally accepted quantitative definition.
At least three quantitative (or semi-quantitative) methods have been utilized to quantify similarity
(1) observed mutational frequencies in homologous proteins
(2) amino acid hydropathy scales
(3) accessible surface area using known protein structures
In each case, the quantitative method calculates a value that represents the similarity between any two amino acids
For simplicity, the similarity values between residues is stored in a table (Similarity Table or Similarity Matrix)
Using a Similarity Table, a similarity score can be calculated for any aligned sequences.
Biochemistry 4000Lecture 1 Slide 18
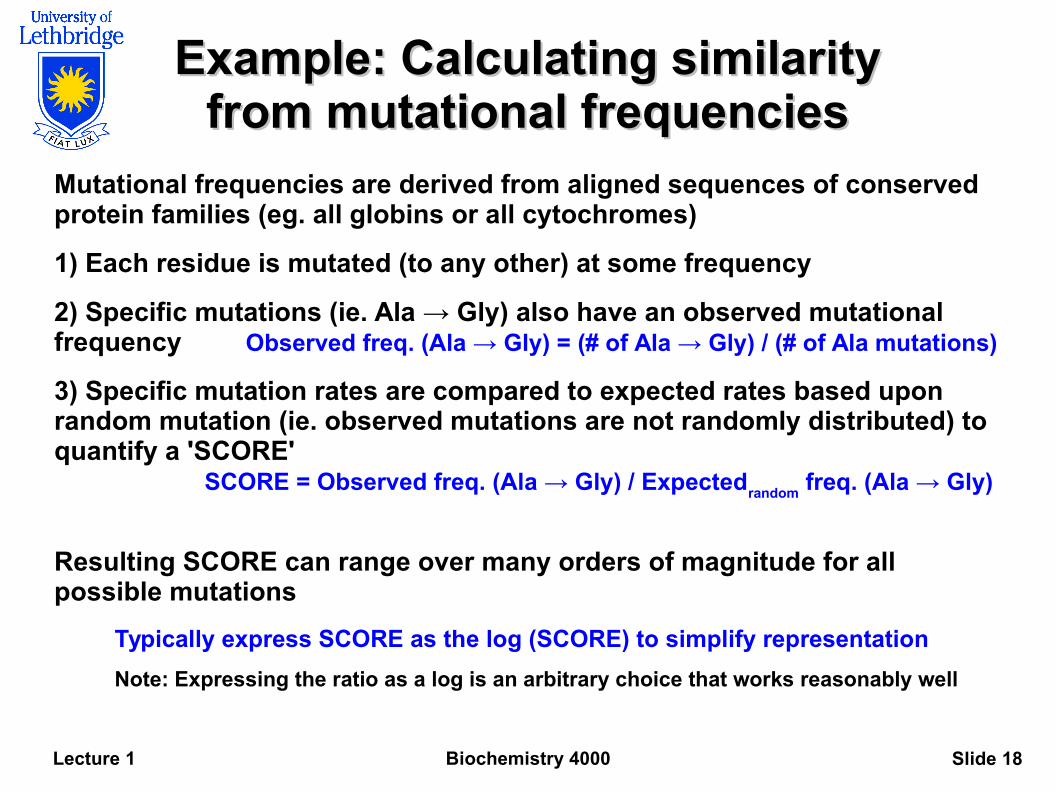
Example: Calculating similarity Example: Calculating similarity from mutational frequenciesfrom mutational frequencies
Mutational frequencies are derived from aligned sequences of conserved protein families (eg. all globins or all cytochromes)
1) Each residue is mutated (to any other) at some frequency
2) Specific mutations (ie. Ala → Gly) also have an observed mutational frequency Observed freq. (Ala → Gly) = (# of Ala → Gly) / (# of Ala mutations)
3) Specific mutation rates are compared to expected rates based upon random mutation (ie. observed mutations are not randomly distributed) to quantify a 'SCORE'
SCORE = Observed freq. (Ala → Gly) / Expectedrandom
freq. (Ala → Gly)
Resulting SCORE can range over many orders of magnitude for all possible mutations
Typically express SCORE as the log (SCORE) to simplify representation
Note: Expressing the ratio as a log is an arbitrary choice that works reasonably well
Biochemistry 4000Lecture 1 Slide 19
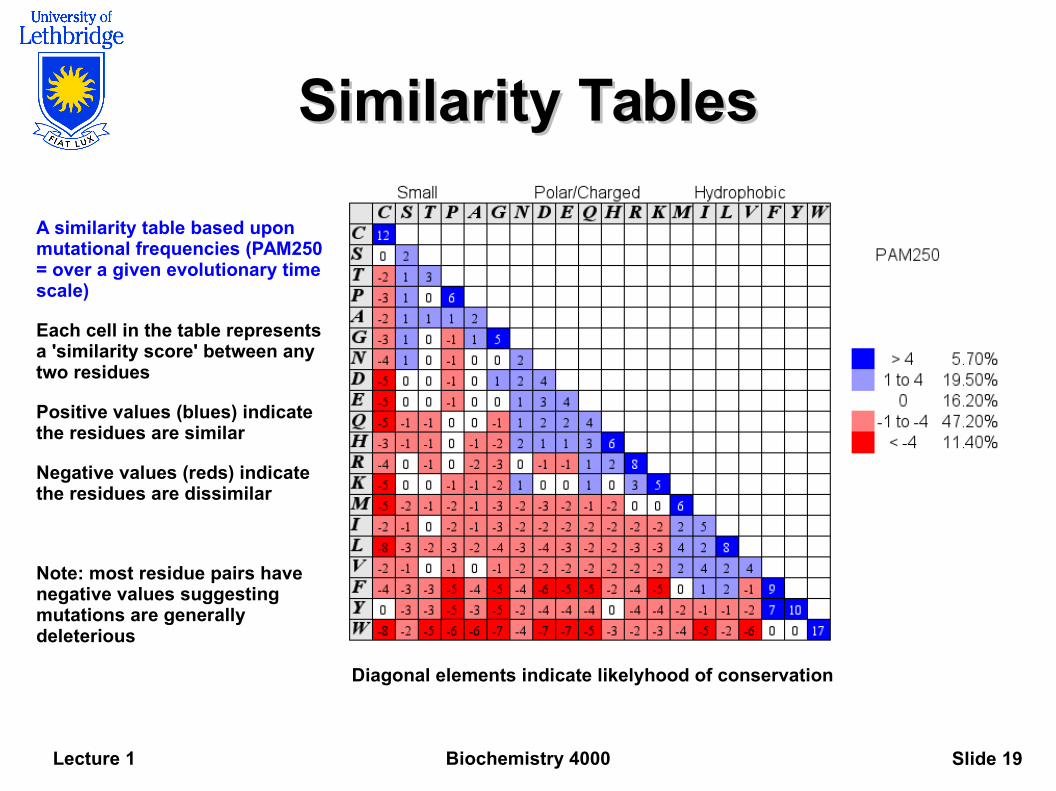
Similarity TablesSimilarity Tables
A similarity table based upon mutational frequencies (PAM250 = over a given evolutionary time scale)
Each cell in the table represents a 'similarity score' between any two residues
Positive values (blues) indicate the residues are similar
Negative values (reds) indicate the residues are dissimilar
Note: most residue pairs have negative values suggesting mutations are generally deleterious
Diagonal elements indicate likelyhood of conservation
Biochemistry 4000Lecture 1 Slide 20
More Similarity TablesMore Similarity TablesEvolutionary models for calculating sequence similarity typically outperform all other
PAM and BLOSUM similarity tables are the most widely used
PAM or point accepted mutation (developed by Dayhoff) tables
Utilize mutational frequencies within a small set of closely related proteins
Consider all mutations and phylogenetic branches
BLOSUM or block summation tables are a slight improvement to PAM
Does not consider all mutation or use phylogenetic branches
Not all mutations are treated equally
In either case, the sequence identity within the set of closely related proteins used to calculate mutational frequencies is a variable.
Sequence similarity searches always perform best when the sequence identity used to calculate mutational frequencies matches that of the target
Biochemistry 4000Lecture 1 Slide 21
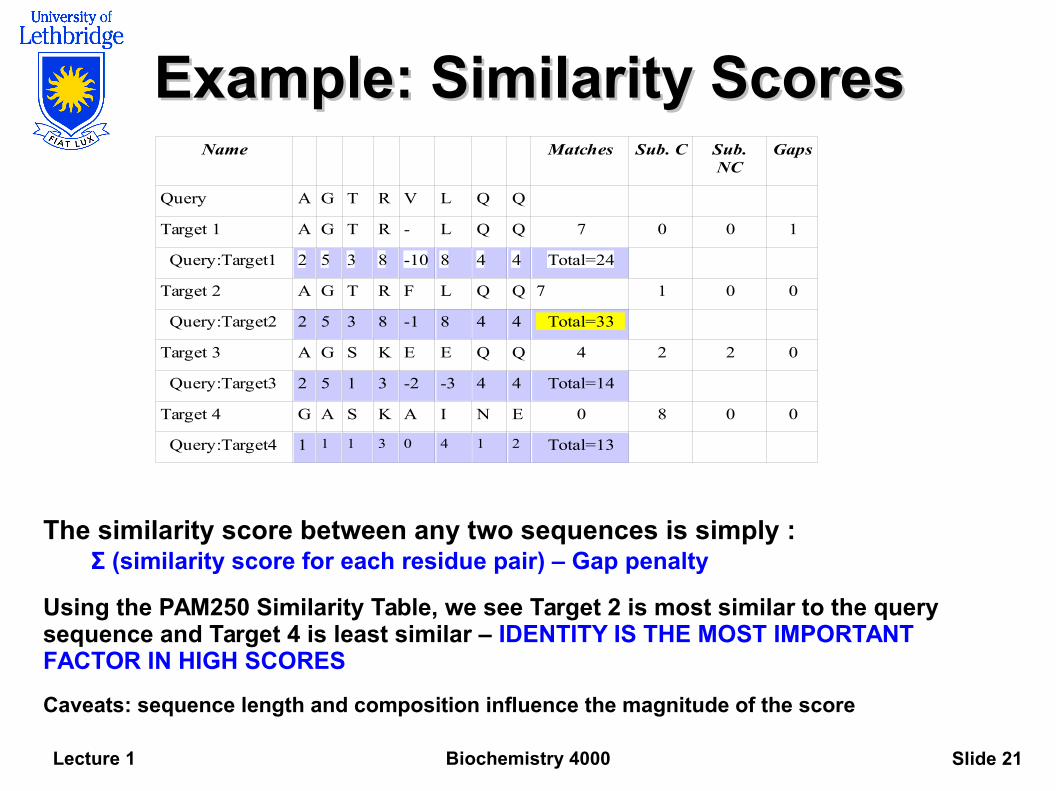
Example: Similarity ScoresExample: Similarity Scores
The similarity score between any two sequences is simply :Σ (similarity score for each residue pair) – Gap penalty
Using the PAM250 Similarity Table, we see Target 2 is most similar to the query sequence and Target 4 is least similar – IDENTITY IS THE MOST IMPORTANT FACTOR IN HIGH SCORES
Caveats: sequence length and composition influence the magnitude of the score
Name Matches Sub. C Sub.NC
Gaps
Query A G T R V L Q Q
Target 1 A G T R - L Q Q 7 0 0 1
Query:Target1 2 5 3 8 -10 8 4 4 Total=24
Target 2 A G T R F L Q Q 7 1 0 0
Query:Target2 2 5 3 8 -1 8 4 4 Total=33
Target 3 A G S K E E Q Q 4 2 2 0
Query:Target3 2 5 1 3 -2 -3 4 4 Total=14
Target 4 G A S K A I N E 0 8 0 0
Query:Target4 1 1 1 3 0 4 1 2 Total=13
Biochemistry 4000Lecture 1 Slide 22
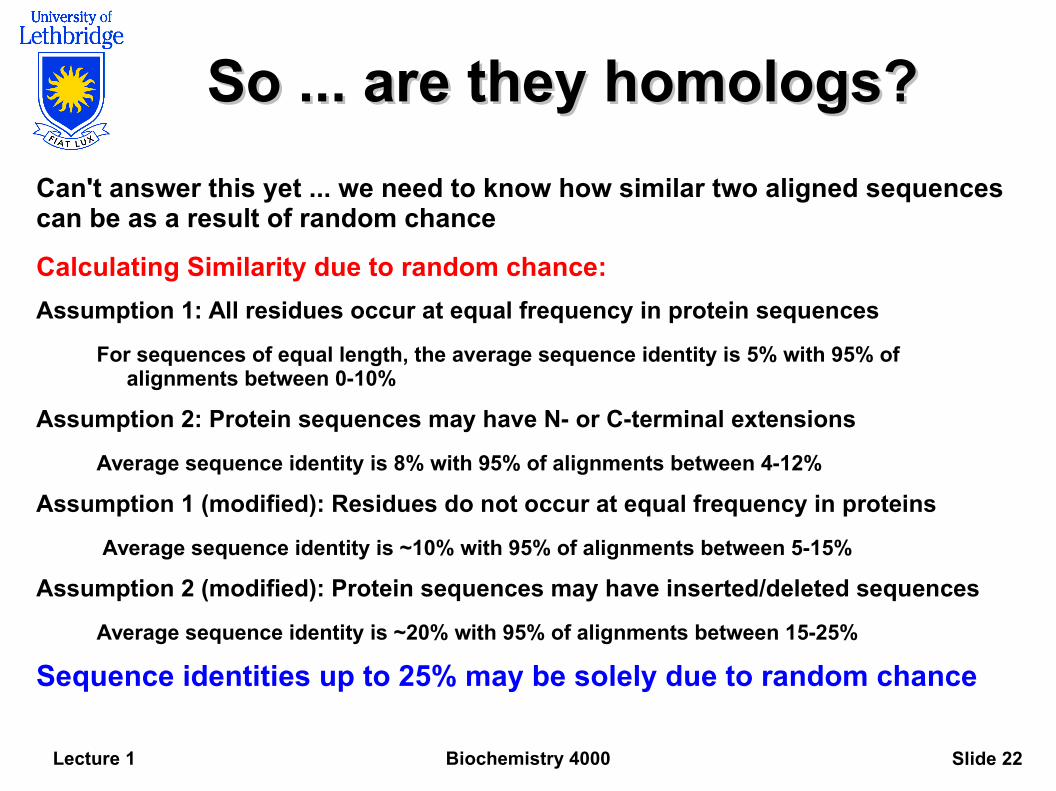
So ... are they homologs?So ... are they homologs?
Can't answer this yet ... we need to know how similar two aligned sequences can be as a result of random chance
Calculating Similarity due to random chance:
Assumption 1: All residues occur at equal frequency in protein sequences
For sequences of equal length, the average sequence identity is 5% with 95% of alignments between 0-10%
Assumption 2: Protein sequences may have N- or C-terminal extensions
Average sequence identity is 8% with 95% of alignments between 4-12%
Assumption 1 (modified): Residues do not occur at equal frequency in proteins
Average sequence identity is ~10% with 95% of alignments between 5-15%
Assumption 2 (modified): Protein sequences may have inserted/deleted sequences
Average sequence identity is ~20% with 95% of alignments between 15-25%
Sequence identities up to 25% may be solely due to random chance
Biochemistry 4000Lecture 1 Slide 23
Where are we now?Where are we now?
Summary
(1) We have a method for calculating/quantifying residue similarity
Similarity tables calculated using mutation, physiochemical or structural properties of amino acids
(2) We have a method for calculating sequence similarity
Simply sum the similarity table scores for the aligned sequence including 'gap' and 'gap extension' penalties
(3) We have calculated the point at which sequence similarity is significant
While we used identities in the example calculation, sequences with aligned identities greater than 25% are likely homologs
Caveat: For very short sequences (<30 residues) the point at which sequence similarity is statistically significant rises sharply