Embed Size (px)
Citation preview
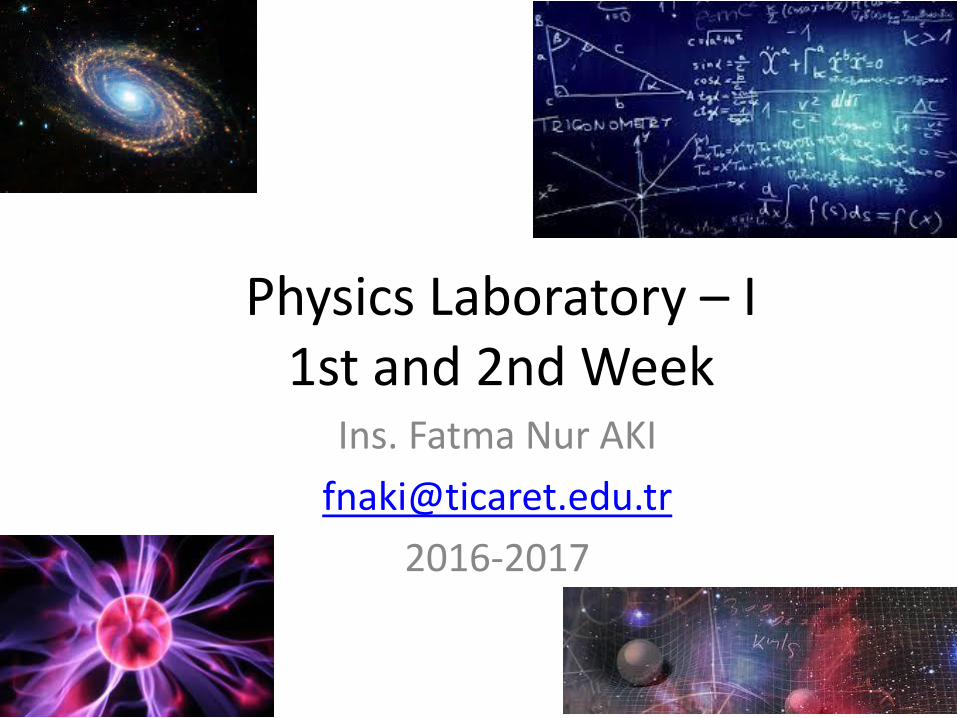
Physics Laboratory – I 1st and 2nd Week
Ins. Fatma Nur AKI
2016-2017

Contact Information (see also in lab manual/on website)
Ins. Fatma Nur AKI
444 0 413 (#3218)
See course website
http://ww3.ticaret.edu.tr/fnaki/

September 4, 2008
Course Information
• Visa Exam ( 30 %)
• Reports ( 20 %)
• Final Exam ( 50 %)

REPORT FORMAT The laboratory report must include the following:
1. Title Page: This page should show only the student’s name, ID number, the name of the experiment, and the names of the student’s partners.
2. Objective: This is a statement giving the purpose of the experiment.
3. Theory: You should summarize the equations used in the calculations to arrive at the results for each part of the experiment.
4. Apparatus: List the equipment used to do the experiment.
5. Procedure: Describe how the experiment was carried out.
6. Calculations and Results: Provide one sample calculation to show the use of the equations. Present your results in tabular form that is understandable and can be easily followed by the grader. Use graphs and diagrams, whenever they are required.
7. Conclusions: Relate the results of your experiment to the stated objective.
8. Data Sheet: Attach the data sheet for the experiment that has been signed by your instructor.

Resources
• Physics Lab I manual (İstanbul Commerce Un.)
• Fiziksel Ölçmeler ve Değerlendirilmesi (İ. Eşme)
• Physics (Halliday Resnick)
• Physics for Scientist and Engineers (Serway) Physics I, Frederick J.Keller, W.Edward Gettys, Malcolm J. Skove.
• Physics I, Giancoli,
• Sears ve Zemansky´nin Üniversite Fiziği, Cilt 1, 12. Baskı, Pearson Education Yayıncılık, 2009

Lesson I
• Concept of Measurement
• SI Unit System
• Units and dimensions
• Mathematical operations
• Graphical Analysis
• Errors and Uncertainty
• Basic Instruments

Physics is everywhere !!!

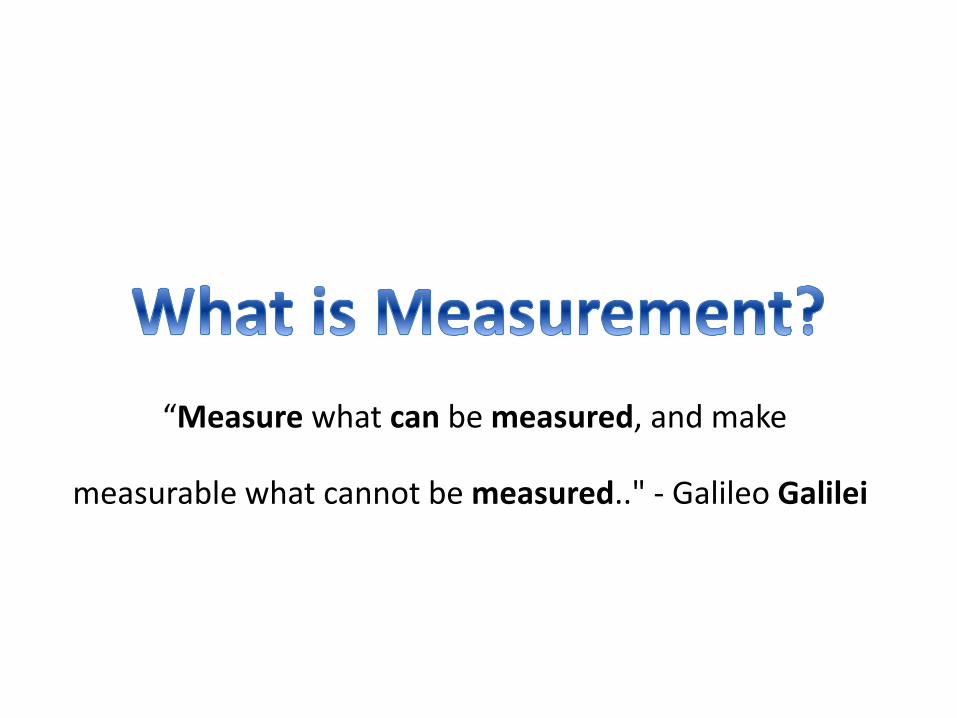
“Measure what can be measured, and make
measurable what cannot be measured.." - Galileo Galilei

• The basis of science and technology is meauserement.
• Scientiests and technicians must be able to measure physical objects and events.
• Measurement is especially important in the laboratory. Experiments involve measuring mass, length, time, temperature, pressure, or other quantities.

Spring balance
stopwatch
Vernier calipers

• Measurement (from Old French, mesurement)
is the assignment of numbers to objects or events.
• It is a cornerstone of most natural sciences, technology, economics, and quantitative research in other social sciences.
• A measurement is made by comparing a quantity with a standard unit.

What is Measurement ?
• Scientific measurement has been defined as “rules for assigning numbers to objects in such a way as to represent quantities of attributes”.
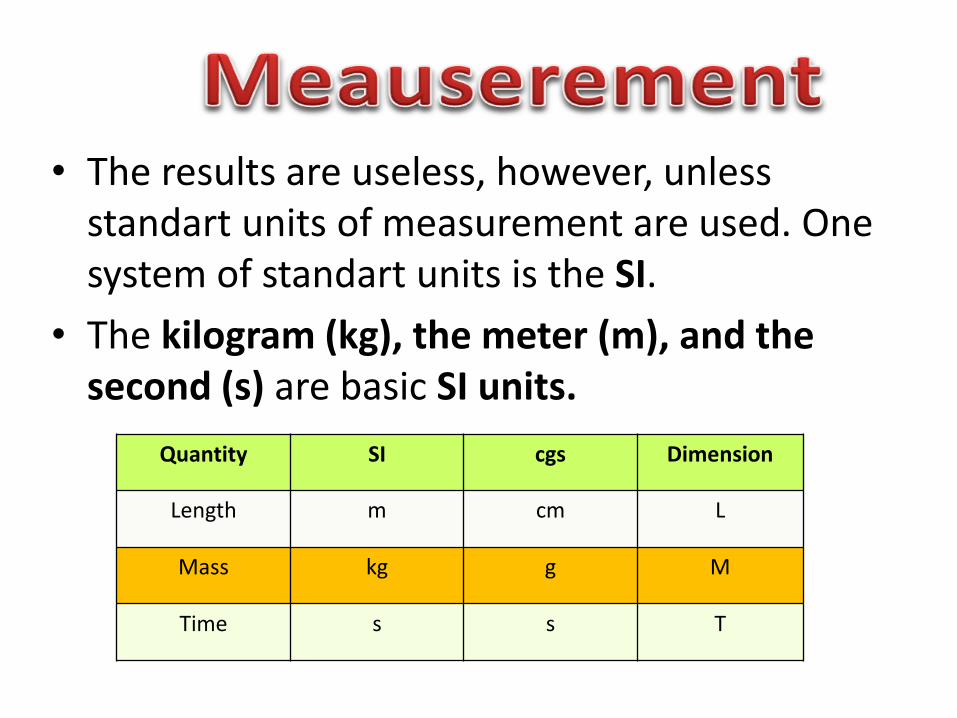
• The results are useless, however, unless standart units of measurement are used. One system of standart units is the SI.
• The kilogram (kg), the meter (m), and the second (s) are basic SI units.
Quantity SI cgs Dimension
Length m cm L
Mass kg g M
Time s s T

SI Unit for 3 Basic Quantities
• Many possible choices for units of Length, Mass, Time
• In 1960, standards bodies control and define Système Internationale (SI) unit as,
– LENGTH: Meter
– MASS: Kilogram
– TIME: Second

Fundamental Quantities and SI Units
Length meter m
Mass kilogram kg
Time second s
Electric Current ampere A
Thermodynamic
Temperature
kelvin K
Luminous Intensity candela cd
Amount of Substance mole mol
Why should we care about SI units? Mars Climate Orbiter: http://mars.jpl.nasa.gov/msp98/orbiter

SI Length Unit: Meter
• French Revolution Definition, 1792
• 1 Meter = XY/10,000,000
• 1 Meter = about 3.28 ft
• 1 km = 1000 m, 1 cm = 1/100 m, 1 mm = 1/1000 m
• Current Definition of 1 Meter: the distance traveled by light in vacuum during a time of 1/299,792,458 second.

September 4, 2008
SI Time Unit: Second • 1 Second is defined as “atomic clock”– time taken
9,192,631,700 oscillations of the light emitted by a 133Cs atom.
• Defining unit precisely is a science (important for, for example, GPS): – This clock will neither gain nor lose a second in 20 million years.

September 4, 2008
SI Mass Unit: Kilogram
• 1 Kilogram – the mass of a specific platinum-iridium alloy kept at International Bureau of Weights and Measures near Paris.
• Copies are kept in all other countries.

September 4, 2008
Derived Quantities and Units
• Multiply and divide units just like numbers
• Derived quantities: area, speed, volume, density ……
– Area = Length Length SI unit for area = m2
– Volume = Length Length Length SI unit for volume = m3
– Speed = Length / time SI unit for speed = m/s
– Density = Mass / Volume SI unit for density = kg/m3
• In 2008 Olympic Game, Usain Bolt sets world record at 9.69 s in Men’s 100 m Final. What is his average speed in km/h?

Other Unit System • U.S. customary system: foot, slug, second
• Cgs system: cm, gram, second
• We will use SI units in this course, but it is useful to know conversions between systems.
– 1 mile = 1609 m = 1.609 km 1 ft = 0.3048 m = 30.48 cm
– 1 m = 39.37 in. = 3.281 ft 1 in. = 0.0254 m = 2.54 cm
– 1 lb = 0.465 kg 1 oz = 28.35 , 1 slug = 14.59 kg
– 1 day = 24 hours = 24 * 60 minutes = 24 * 60 * 60 seconds
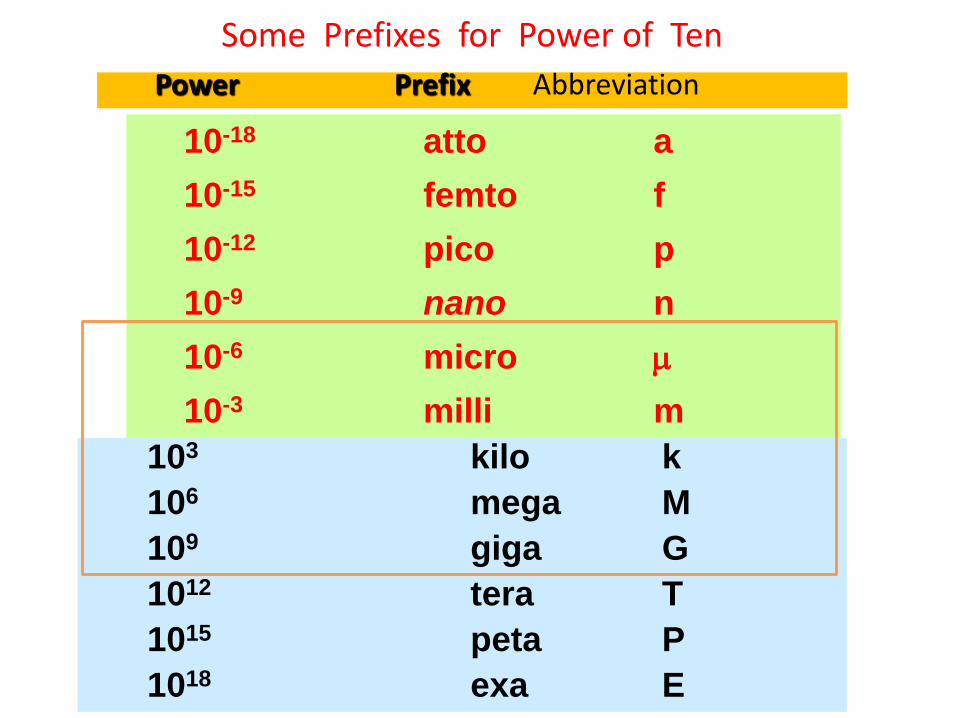
Some Prefixes for Power of Ten
Power Prefix Abbreviation
103 kilo k
106 mega M
109 giga G
1012 tera T
1015 peta P
1018 exa E
10-18 atto a
10-15 femto f
10-12 pico p
10-9 nano n
10-6 micro m
10-3 milli m


Dimensional Analysis
• Physical laws must be independent of arbitrarily chosen units of measure. Nature does not care if we measure lengths in centimeters or inches or light-years or …
• Check your units! All natural/physical relations must be dimensionally correct.

Dimensional Analysis Dimensional Analysis refers to the physical nature of the quantity and the type of unit (Dimension) used to specify it.
•Distance has dimension L.
•Area has dimension L2.
•Volume has dimension L3.
•Time has dimension T.
•Speed has dimension L/T

September 4, 2008
• Quantities have dimensions:
• [Length]: L, [Mass] : M, [Time]: T
• Quantities have units: Length: m, Mass: kg, Time: s
Dimensions, Units and Equations
Quantity Area Volume Speed Acceleration
Dimension [A] = L2 [V] = L3 [v] = L/T
[a] = L/T2
SI Units m2 m3 m/s m/s2
January 7, 2013 Physics 114A - Lecture 1 28/21
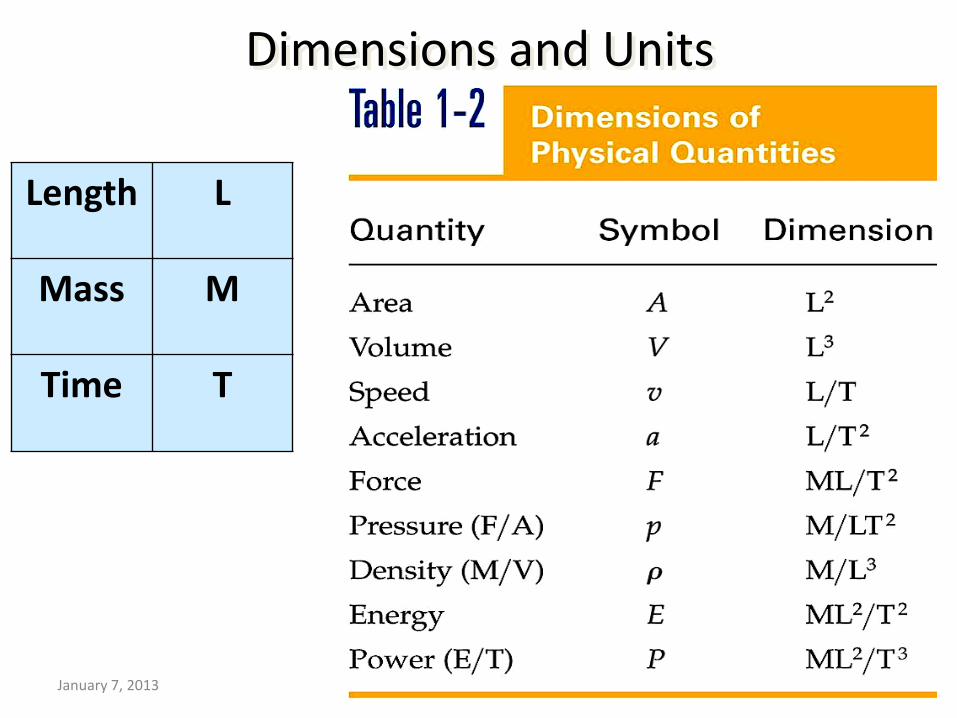
Dimensions and Units
Length L
Mass M
Time T

September 4, 2008
Dimensional Analysis
• Necessary either to derive a math expression, or equation or to check its correctness.
• Quantities can be added/subtracted only if they have the same dimensions.
• The terms of both sides of an equation must have the same dimensions.
– a, b, and c have units of meters, s = a, what is [s] ?
– a, b, and c have units of meters, s = a + b, what is [s] ?
– a, b, and c have units of meters, s = (2a + b)b, what is [s] ?
– a, b, and c have units of meters, s = (a + b)3/c, what is [s] ?
– a, b, and c have units of meters, s = (3a + 4b)1/2/9c2, what is [s] ?

Dimensions of Some Common Physical Quantities
[x], Length : L
[m], Mass : M
[t], Time : T
[v], Velocity : LT-1
[a], Acceleration : LT-2
[F], Force : MLT-2
[r], Mass Density : ML-3
[P], Pressure : ML-1T-2
[E], Energy : ML2T-2
[I], Electric Current : QT-1
[q], Electric Change : Q
[E], Electric Field : MLQT-2
All are powers of the fundamental dimensions:
[Any Physical Quantity] = MaLbTcQd
January 7, 2013 Physics 114A - Lecture 1 31/21
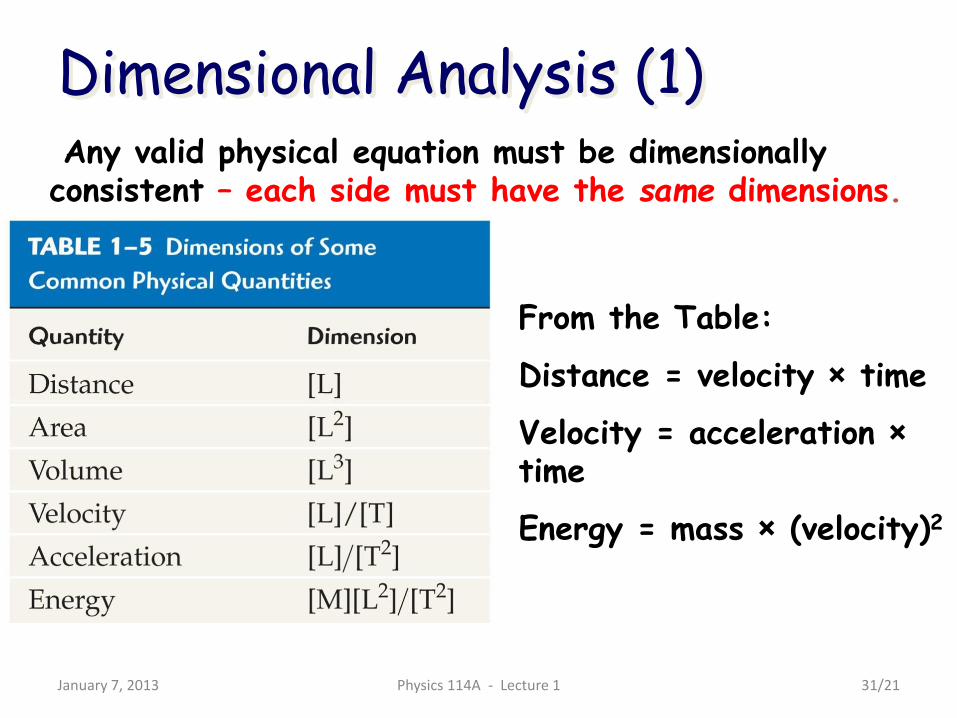
Any valid physical equation must be dimensionally consistent – each side must have the same dimensions.
From the Table:
Distance = velocity × time
Velocity = acceleration × time
Energy = mass × (velocity)2
Dimensional Analysis (1)
January 7, 2013 Physics 114A - Lecture 1 32/21
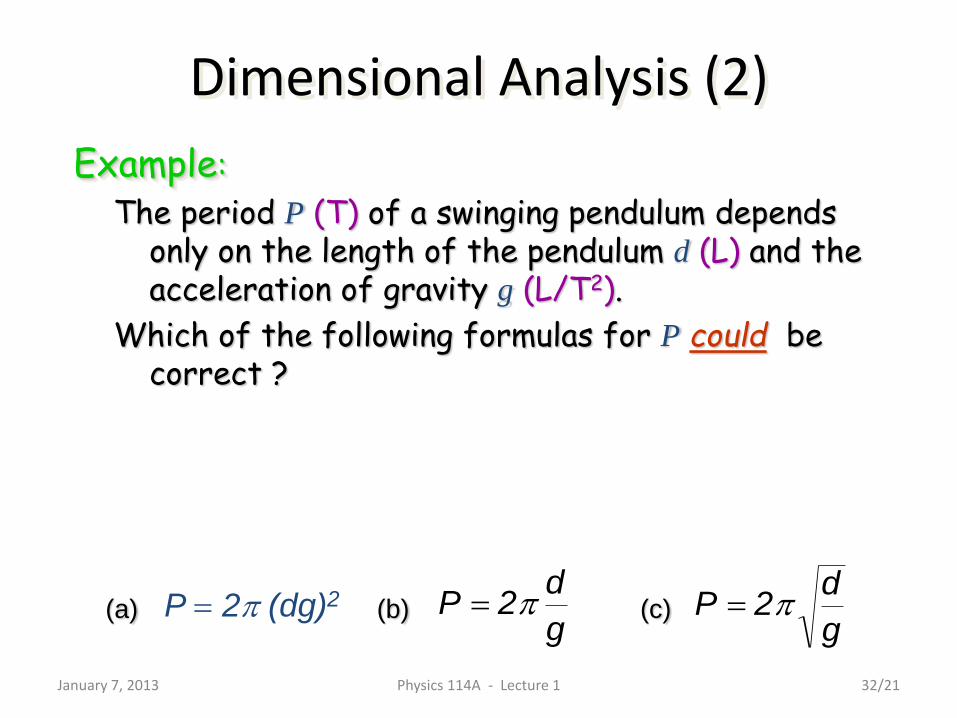
Dimensional Analysis (2)
The period P (T) of a swinging pendulum depends only on the length of the pendulum d (L) and the acceleration of gravity g (L/T2).
Which of the following formulas for P could be correct ?
Pd
g 2P
d
g 2(a) (b) (c) P 2 (dg)2
Example:

January 7, 2013 Physics 114A - Lecture 1 33/21
LL
T
L
TT
2
2 4
4
Dimensional Analysis (3)
L
L
T
T T
2
2
Remember that P is in units of time (T), d is length (L) and g is acceleration (L/T2).
The both sides must have the same units
P dg 22
(a) (b) (c) Pd
g 2
Try equation (a). Try equation (b). Try equation (c).
TT
T
L
L 2
2
Pd
g 2

Dimensional Analysis
• The force (F) to keep an object moving in a circle can be described in terms of:
– velocity (v, dimension L / T) of the object
– mass (m, dimension M)
– radius of the circle (R, dimension L)
Which of the following formulas for F could be correct ?
Note: Force has dimensions of ML/T2
R
mvF
2
2
R
vmF
(a) (b) (c) F = mvR

Dimensional Analysis Which of the following formulas for F
could be correct ?
A.
B.
C.
R
mvF
2
2
R
vmF
F = mvR
Note: Force has dimensions of ML/T2
Velocity (n, dimension L / T)
Mass (m, dimension M)
Radius of the circle (R,
dimension L)

September 4, 2008
Summary • The three fundamental physical quantities of mechanics are
length, mass and time, which in the SI system have the units meter (m), kilogram (kg), and second (s), respectively
• The method of dimensional analysis is very powerful in solving physics problems.
• Units in physics equations must always be consistent. Converting units is a matter of multiplying the given quantity by a fraction, with one unit in the numerator and its equivalent in the other units in the denominator, arrange so the unwanted units in the given quantity are cancelled out in favor of the desired units.

Graphical Analysis
• Drawing of best fit straight line graph:
• To draw the best fit straight line graph through a set of scattered experimental data points we will follow a standard statistical method, known as least squares fit method.

Scientific graphs • A graph is a visual representation of a
relationship between two variables, x (independent variable) and y (dependent variable).
• The graphs make it easy to identify trends in data that we have collected.


Linear Graphics • Let us consider a set of N experimental data
points (x1,y1), (x2,y2), …….(xN,yN).
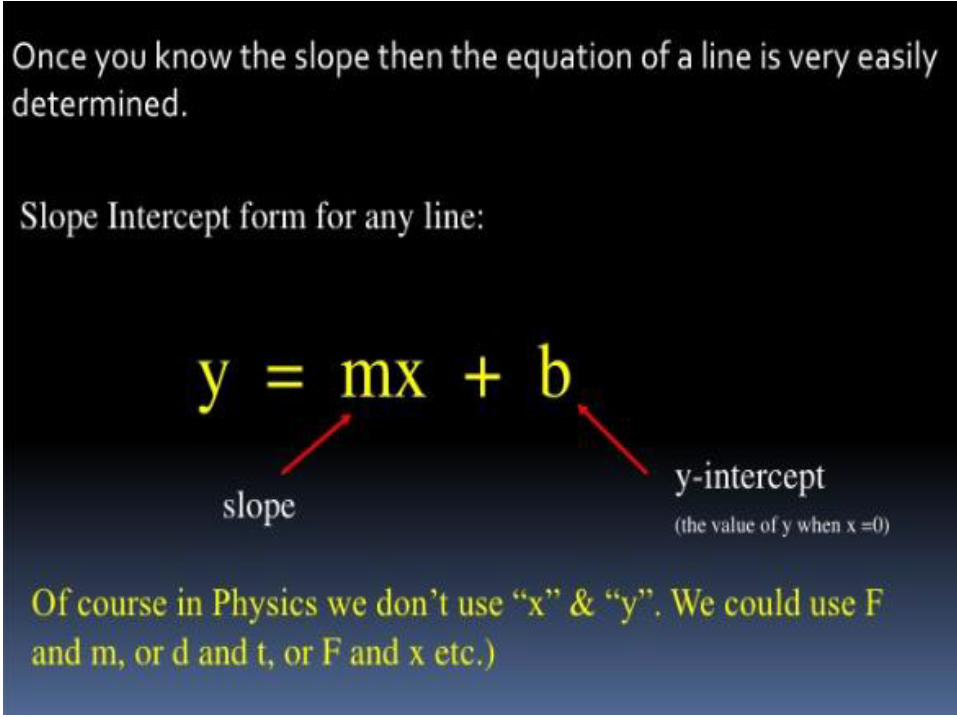
• It is well known that a straight-line graph is described by the equation
y = mx + C
m: slope
x y
x
y


Vernier Calipers • There are special devices for taking measurements.
• For example Vernier calipers are used to meausere small widths and diameter while a travelling
microscope is used to measure small lengths.

How Does a Vernier Caliper Work?
• To use a venier calliper close the jaws lightly over the object to be measured and if measuring something with a round cross section ensure the axis of the object is perpendicular to the calliper.
• Use the bottom scale which is in metric units ignoring the top. The tick mark found on the left on the sliding scale will allow you to read from the fixed scale the number of whole millimetres when the jaws are opened and check to see that one of the tick marks aligns with a tick mark on the fixed scale.
• The number of aligned tick marks on the sliding scale will tell you the number of tenths of millimetres.
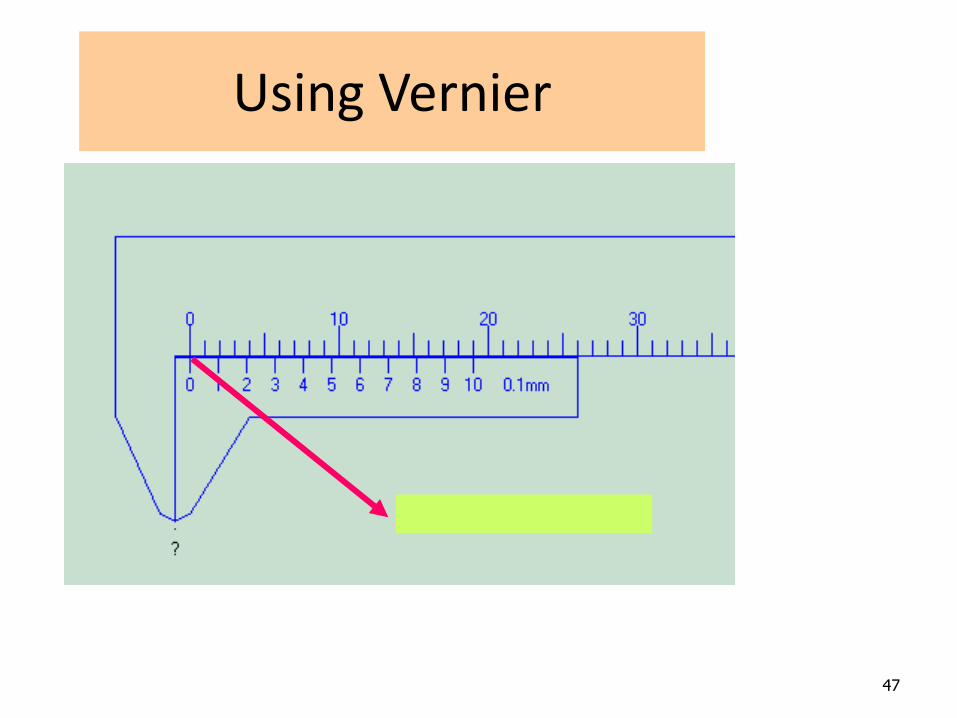
47
Using Vernier

48
Vernier


Mathematics and Physics


Probabilistic Uncertainty, Least Squares Fitting, and Graphical Analysis
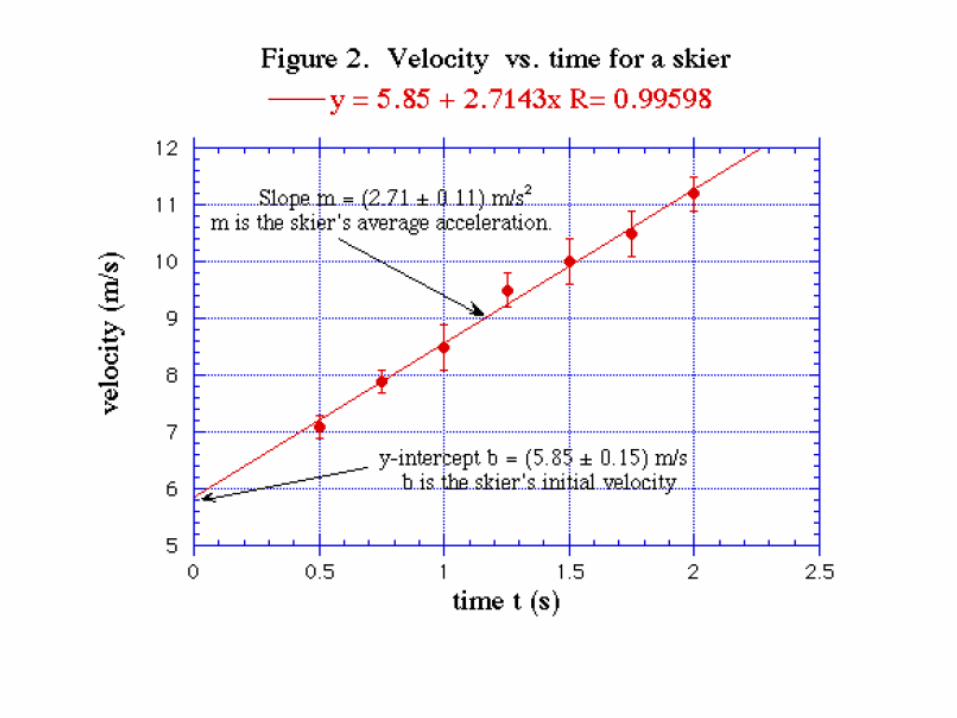

Graphing Standards • All laboratory graphs must follow the guidelines listed below.
1. Titles and labels. All graphs should be clearly labeled with both a figure number and/or an explanatory title directly above the graph. The title text should briefly explain the graph independently of other text elsewhere.
2. Axes. Both the horizontal and vertical axes of graphs should be clearly labeled with variable names and units, and numerical values at major tickmarks should be given.
The conventional way of deciding what quantity goes with which axis is to plot the dependent or measured value is on the upright axis and the independent or controlling variable on the horizontal axis. For example, a plot of velocity vs. time (i.e., v(t)) would show velocity on the vertical axis and time on the horizontal axis.
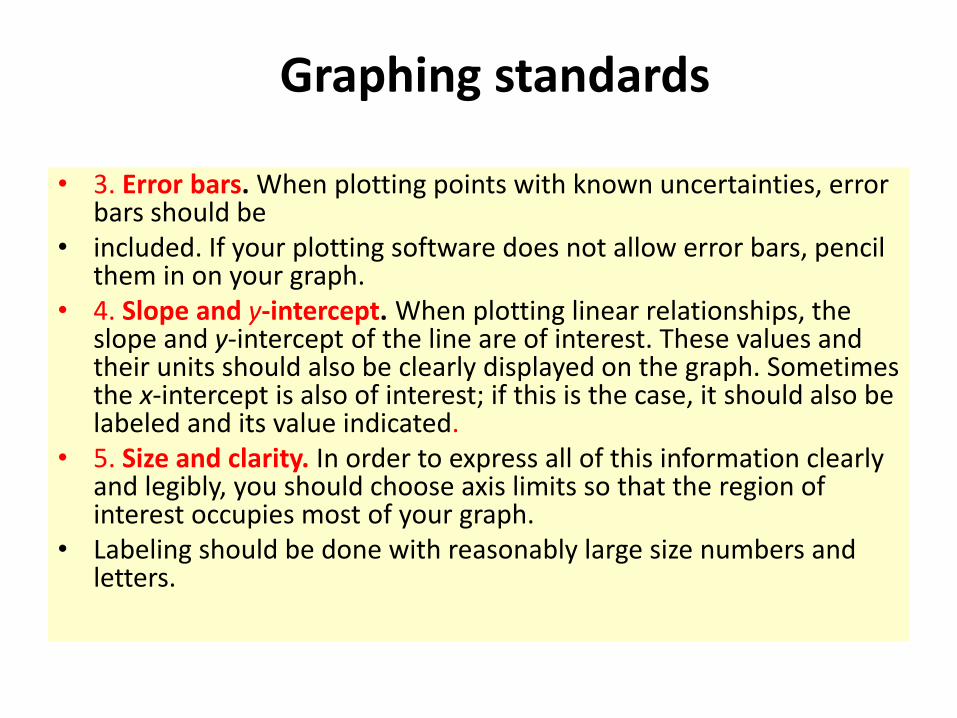
• 3. Error bars. When plotting points with known uncertainties, error bars should be
• included. If your plotting software does not allow error bars, pencil them in on your graph.
• 4. Slope and y-intercept. When plotting linear relationships, the slope and y-intercept of the line are of interest. These values and their units should also be clearly displayed on the graph. Sometimes the x-intercept is also of interest; if this is the case, it should also be labeled and its value indicated.
• 5. Size and clarity. In order to express all of this information clearly and legibly, you should choose axis limits so that the region of interest occupies most of your graph.
• Labeling should be done with reasonably large size numbers and letters.
Graphing standards


ERROR ANALYSE
• http://phys.columbia.edu/~tutorial/


• http://ocw.metu.edu.tr/course/view.php?id=167
• Measurements, Errors and Graphs File • Experiment 1: Uniform Motion with Constant Velocity
File • Experiment 2: Linear Motion with Constant
Acceleration and Motion in a Plane File • Experiment 3: Atwood's Machine File • Experiment 4: Collisions and Conservation of Linear
Momentum File • Experiment 5: Rotational Motion File