Embed Size (px)
Citation preview

Physics II
Attachments

356
Attachment A
CLE: 1.1.D.a
Page 1
Particle Theory of Matter
Objectives
Students will
understand the particulate (kinetic) theory of matter;
differentiate the behavior of particles in the solid, liquid, and gas phases;
use the following skills: observing and inferring from observations.
Motivation for Learning
Materials
Approximately 25-30 mL of
margarine Hot mitts
Approximately 100 mL of popcorn
kernels Hot air corn popper (optional)
Two 250 mL beakers Additional popcorn for snacking
(optional)
One 1500 mL or 2000 mL beaker Salt (optional)
Hot plate Paper napkins (optional)
Preparation
1. Melt 25-30 mL of margarine in a 250 mL beaker. It is a good idea to measure the melted margarine in
a graduated cylinder. Too much or too little margarine will ruin the experiment.
2. Add 100 mL of popcorn kernels to the margarine in the beaker.
3. Place the beaker with the popcorn-margarine mixture in a freezer to harden.
4. After the popcorn-margarine mixture has hardened, warm the outside of the beaker in a hot water bath
to loosen the solid and remove it from the beaker.
5. Put your popcorn margarine mixture on a piece of wax paper. Replace any stray kernels. At this point,
sometimes the popcorn-margarine mixture falls apart. Just put it all back together the same way that
you would make hamburger patties from ground beef. Wrap the popcorn-margarine mix in the wax
paper.
6. Place the popcorn-margarine mixture back in the freezer.

357
Attachment A
CLE: 1.1.D.a
Page 2
Procedure
1. Discuss with students the states of matter and relate it to the particulate or kinetic theory of matter.
2. When you are finished, show the students the popcorn-margarine solid mixture and explain that the
corn kernels are the molecules in a solid being held by the forces that are represented by the margarine.
3. Review the properties of a solid using the popcorn-margarine solid mixture as an example.
4. Place the solid in a 250 mL beaker on a hot plate and warm it until the margarine melts.
5. Pour the "liquid" back and forth between two 250 mL beakers.
6. Talk about the properties of a liquid, etc.
7. Heat the "liquid" in a 1500 mL or 2000 mL beaker over the hot plate until the "molecules" (popcorn
kernels) begin to pop. The large beaker allows the popcorn to spread out for better popping. It also
minimizes the spattering of hot margarine, unpopped popcorn, and popped popcorn. Watch splattering
hot margarine, but don't cover the beaker.
8. As the popcorn leaves the beaker, talk about the properties of a gas.
9. The kids will want to eat the popcorn. As they write up what they saw and explain it, make another
batch in the hot air popper and pass around.
Background Information
The object of this demonstration is to use popcorn kernels to represent molecules and the margarine to
represent the bonding forces between molecules. Heating results in physical changes in the popcorn-margarine
mixture that are analogous to the melting and boiling of matter.
Extensions
Have students develop their own analogous models that describe the particulate theory of matter and the
phases of matter. This is a great "writing to learn" activity for science!
358
Attachment B
CLE: 1.1.D.a
Name __________________________________
Assessment
1. What was added to the solid to cause it to melt? What would you take away from the system to make it
re-solidify?
2. How is a liquid transformed into a gas?
3. How is a gas transformed into a liquid?
4. In the popcorn and margarine model, what does the margarine represent? What do the popcorn kernels
represent?
5. What do you consider to be the strengths of this popcorn and margarine model? The weaknesses?

359
Attachment B
CLE: 1.1.D.a
Answers to Assessment
1. Heat (thermal energy) was added to the solid to cause it to melt, and if the heat were taken away then
the liquid would re-solidify
2. Thermal energy (heat) is transferred to the particles of the liquid causing them to bombard one another
and recoil to larger and larger distances, thus phase changing into a gas.
3. As a gas loses the high amounts of energy causing the individual particles of the gas to collide and
ricochet at relatively large distances, the particles calm down so-to-speak and the intra-atomic or intra-
molecular forces of attraction overcome the forces of repulsion so that the particles are able to come in
very close proximity and slide against one another in liquid form.
4. The margarine represents the intra-molecular forces that hold the molecules of a solid in vibrating
stasis. The individual kernels represent the particles, or in this case molecules within a sample of a
compound.
5. Strengths might include: Macro examples of particles and forces otherwise invisible to the human
eye (both naked and with most microscopic equipment; ability to show more than one phase using the
same materials; ability to eat model.
Weaknesses might include: The force is represented by something tangible when in reality it is not;
the kernels in the solid are not vibrating; the popping of the kernels relates more to sublimation than
evaporation, and sublimation is a topic not covered.
360
Attachment C
CLE: 1.2.A.a
Energy from Chemical Fuels

361
Attachment C
CLE: 1.2.A.

362
Attachment C
CLE: 1.2.A

363
NAME ________________________________________
Attachment C
CLE: 1.2.A

364
NAME: __________________________________________________
Attachment C
CLE: 1.2.A

365
Attachment D
CLE: 1.2.A.g
Experiments with States of Matter: Mpemba Effect - Freezing Hot Water Faster than Cold Water
The Mpemba Effect states that hot water changes its state from liquid to solid--or freezes--faster than
cold water. This does not seem to make sense, but it has been discovered to be true.
Goal of experiment
The goal is to compare the time is takes to freeze a container of water at various starting temperatures
of the water, under the same conditions.
Conditions
In any good experiment, you want to change only one variable and keep everything else to the same.
You must also be able to determine when you achieved the outcome of the experiment.
Factors
Factors that must remain the same are:
The temperature of the freezer
The amount of water in the container
The size, shape and material of the container Any type of air motion over the water
The only thing you vary is the initial temperature of the water.
When frozen
Possible ways to determine when the water is frozen include:
Use a thermometer or temperature probe in the water to see when the temperature near the
bottom levels off at the freezing point.
Visibly check to determine when the water in the container is frozen; perhaps a clear container would help.

366
Attachment D
CLE: 1.2.A.g
Experiment
You can do the experiment using one or even several containers that you place in a freezer
compartment.
One container in freezer
If you use one container, fill it with hot water, put it in a freezer and measure the time it takes the water
to freeze. Then repeat the experiment with exactly the same amount of water in the same container at a cooler temperature. Do this a number of times, reducing the initial temperature of the water.
Two or more containers in freezer
Or, you could take two or more containers of the same size, shape and material and put exactly the
same amount of water--but different temperatures-- into each. Then you put them both in the freezer
and see which freezes first. The reason the containers must be exactly the same is because the shape and material of the container affects the rate of heat loss.
Outside in winter
In either of the above cases, you would have to periodically open the freezer to see if the water is
freezing. An alternative would be to place the containers outside during the winter when the temperature was below freezing. You could then easily watch the freezing process from a window in your house.
Data
By comparing the time it takes to freeze for the various starting water temperatures, you should be able
to find a situation where warmer water freezes faster than water at a colder temperature.

367
Attachment E
CLE: 5.2.B.a-b

368
Attachment F
CLE: 5.2.B.a-b

369
Attachment F
CLE: 5.2.B.a-b

370
Earthquakes and Plate Tectonics
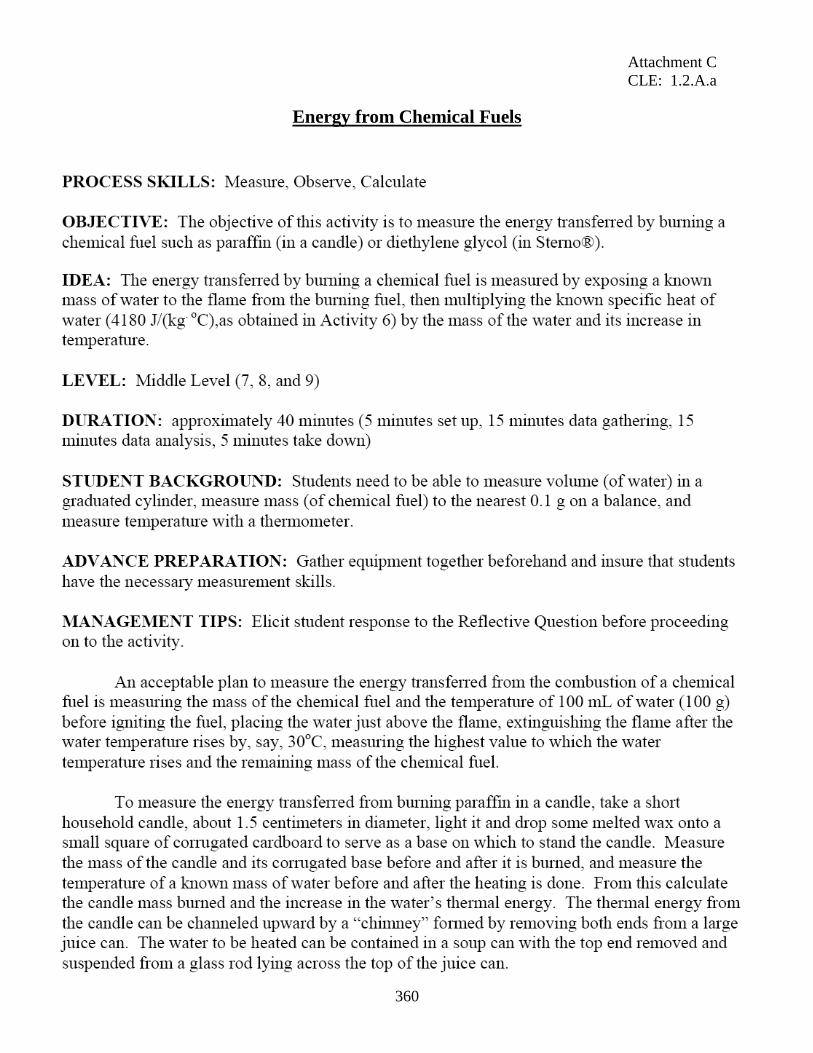
Introduction The tectonic plates of the world are constantly moving in relation to each other. The boundaries between
plates are zones of active faulting and earthquakes. There are 3 types of plate boundaries and 3 types of faults.
Remember, there are two types of crust which can be involved in this faulting, oceanic crust and continental
crust.
Review questions about type of crust.
Which type of crust floats higher?
Which type of crust subducts?
What happens when dense crust runs into buoyant crust?
PUSH and PULL 1) Where plates push together we call it a convergent boundary. Convergent boundaries are where
subduction zones and collision zones are located. The type of faults that form along convergent boundaries
are reverse faults, also called thrust faults. Convergence involving oceanic crust results in a subduction
zone, where the oceanic crust dives back into the mantle. Along subduction zones, a trench forms on the
ocean floor adjacent to a strato-volcano mountain range which is built on the overriding plate. When a
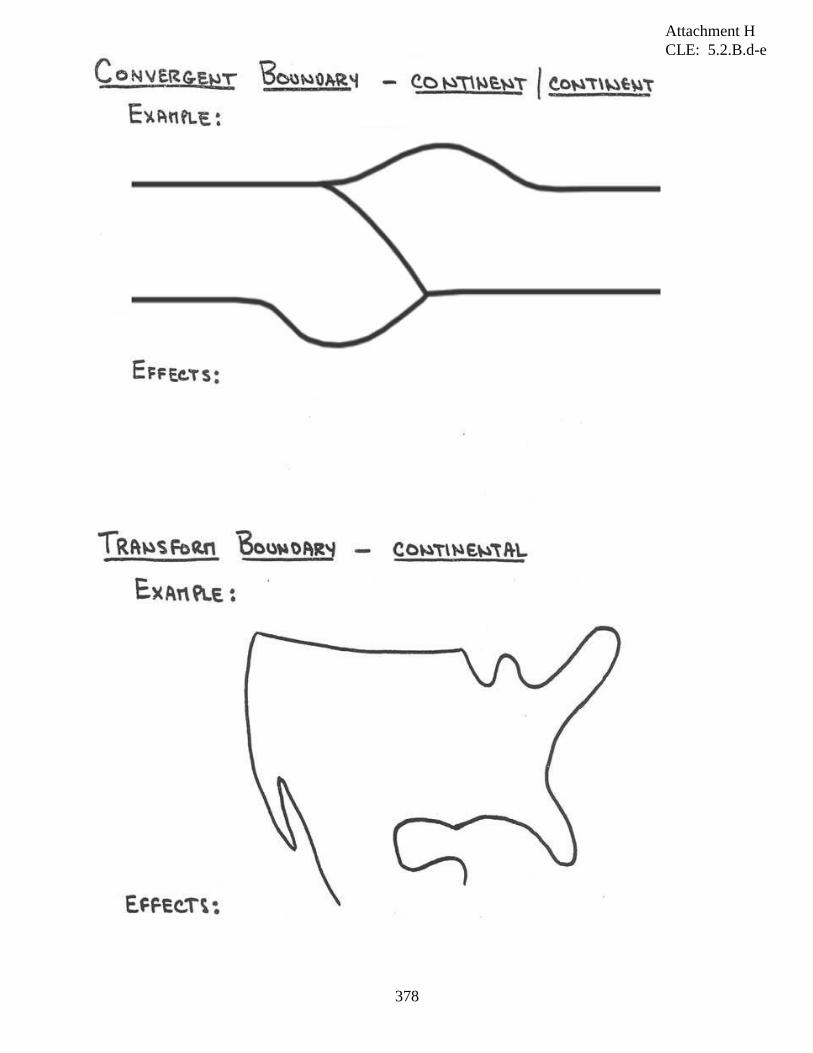
convergent boundary involves 2 pieces of continental crust, a collision zone develops as the plates push
mountains up into the sky.
Task 1 On a world map, identify the convergent boundaries or the zones of thrust faults. (Color the subduction
zones blue and the collision zones green. Remember that you must first determine if oceanic crust is
involved)
Questions
1a Can you name 5 countries located along 5 different convergent boundaries?
1b. Can you locate any convergent boundaries in your space shuttle photographs?
1c. Is the direction of motion of the portion of the convection cell in the mantle below a convergent zone
UP? or DOWN?
2) Where plates pull apart we call it a divergent boundary. Along divergent boundaries we see rifting or
fracture along normal faults. Spreading centers form along ocean ridges as oceanic crust is pulled or torn
apart. Under all the worlds oceans new volcanic material erupts in rift valleys in the form of pillow basalt. A
shield volcano can form as the lava builds up the ocean floor above sea level. Divergent boundaries can occur
under continental crust and pull pieces apart to form parallel basins and ranges. (When you pull apart a "Fig
Newton" which way to the little faults form? Draw a picture).
Attachment G
CLE: 5.2.B.d-e

371
Task 2
On a world map, identify the divergent boundaries or the zones of rifting and normal faults. (Color the
ocean spreading centers red and rift zones orange.)
Questions
2a Can you name 5 places that spreading or rifting is taking place?
2b. Can you locate any divergent boundaries on your shuttle photographs?
2c. Is the direction of motion of the portion of the convection cell in the mantle below a divergent zone UP?
or DOWN?
3) Transform faults are associated with convergent and divergent boundaries. A transform fault moves
pieces of crust past each other forming a strike-slip fault. This lateral motion can be described as either left-
lateral or right-lateral. The way to determine whether a transform fault is left-lateral or right-lateral is to
picture yourself standing and looking across the fault. If the land on the other side of the fault moves to your
left, it's a left-lateral fault. If the land on the other side of the fault moves to your right, it's a right-lateral fault.
Transform faults in continental crust can commonly involve aspects of divergence and convergence, when the
fault is not straight. Where there is divergence, the land pulls apart forming a basin. Where there is
convergence, the land collides, forming mountains.
Attachment G
CLE: 5.2.B.d-e

372
Task 3 Circle the correct answer (You are now looking down on the Earth.)
3a. Left-lateral or right-lateral?
3b. Left-lateral or right-lateral?
3c. Left-lateral or right-lateral?
3d. Left-lateral or right-lateral?
Draw where you would expect mountains and valleys
3e. Left-lateral.
3f.
Attachment G
CLE: 5.2.B.d-e

373
Teaching Plate Tectonics
with Easy-to-Draw Illustrations
Next time you teach plate tectonics, consider a draw-with-me presentation that
will engage your students and help them understand the spatial and movement
aspects of plate boundary environments.
The process of drawing a picture involves students much more deeply than reading or
discussion. This is because drawings give students an opportunity to visualize sizes, shapes,
motions, and spatial relationships. Important facts can be added through annotations and
captions.
Many students find a draw-with-me presentation an enjoyable experience.
Drawing enhances their learning, understanding, and retention processes. And,
at the end of the class session, they have a set of illustrations that can be used for
study, reference, and communication purposes.
I have used the illustrations in this booklet, with only minor modifications, to lead
students from primary grades through graduate school in lessons about plate
movements, volcanoes, earthquakes, and the rock cycle. When time allows, I
always opt to draw these illustrations step-by-step with my students. It’s fun that
way!
When time is short, presenting the illustrations on an overhead projector can be a
good alternative, especially if your students have photocopies of the illustrations
to which they can add important details and annotations.
Please feel free to use the illustrations here in any way that will enhance your
teaching. And, if you have time, draw them once for me.
Hobart M. King
http://geology.com
Attachment H
CLE: 5.2.B.d-e

374
Attachment H
CLE: 5.2.B.d-e
375
Attachment H
CLE: 5.2.B.d-e

376
Attachment H
CLE: 5.2.B.d-e

377
Attachment H
CLE: 5.2.B.d-e
378
Attachment H
CLE: 5.2.B.d-e

379
Attachment I
CLE: 7.1.A
Page 1
Scoring Rubric: Student Laboratory Reports
Problem Statement
The student is to clearly identify the problem under investigation as accurately and completely as possible
from background information. The students’ explanation should strive to be precise and thorough.
Experimental Hypothesis
The student should predict what will happen based on proper use and interpretation of background
information, not merely on what he or she thinks will happen.
Experimental Design
The explanation of the design should include:
1. A listing of all materials to be used, relating the materials to the dependent and independent
variables as appropriate and noting controls to be placed on the study as needed.
2. A description of the design of the study, including:
a. What data will be collected?
b. How many trials will be completed?
c. How will variables be controlled?
d. How will the data be interpreted?
e. What graphs or charts will be based on the data collected?
3. A description of all safety concerns and how each will be addressed.
Data Collection, Display, and Analysis
The student conducts the experiment, carefully and systematically making measurements and entering data.
Graphic presentation(s) of data is produced appropriate to the analysis.

380
Attachment I
CLE: 7.1.A
Page 2
Conclusion
This includes a statement of what data results indicate (data analysis) and whether data supports or does not
support the hypothesis. In addition, experimental errors should be identified and their possible effect on the
reported results. Students are to discuss possible applications and extensions of research findings, indicate
other studies which have been or may be conducted to support the conclusion of the experiment.
Problem Statement
1 2 3 4
Statement of problem is
irrelevant or erroneous
Limited or no relevant
explanation
Problem partially
identified with partial
validity
Limited relevant
explanation
Problem sufficiently
identified with some
validity
Basic relevant explanation
Problem is
appropriately identified
Precise, clear and
relevant explanation
Experimental Hypothesis
1 2 3 4
Unreasonable
association between
problem and predicted
results
Results are not
operationalized
Defends or challenges
established knowledge
Scant use of scientific
concepts and
vocabulary
Association between
problem and predicted
results
Made attempt to
operationalize key
variables
Hypothesis has some
relationship to
established knowledge
but is not supported
Scientific concepts and
vocabulary used, but
contains errors
Reasonable association
between the problem and the
predicted results
Key variables are
operationalized
Hypothesis has a reasonable
relationship with established
knowledge; this relationship is
generally supported
Scientific concepts and
vocabulary used without
significant error
Association between the
problem and the predicted
results is direct and
relevant
All variables are clearly
operationalized
Hypothesis clearly refutes
or defends established
knowledge and is fully
supported
Student demonstrates
facility in the use of
scientific concepts and
vocabulary

381
Attachment I
CLE: 7.1.A
Page 3
Experimental Design
1 2 3 4
Design is not
relevant to the
hypothesis
List of materials
and controls
incomplete
Some procedural
components
generally described
but are not
replicable
Safety concerns are
not specified, are
irrelevant or are not
appropriate to the
experiment
Design has general
relevance to the
hypothesis
List of materials and
controls is nearly
complete, missing at least
one important item
Description makes it
possible to replicate the
experiment if researcher
makes some inferences
Safety concerns miss at
least one important
consideration; procedures
will result in some risk to
student safety if not
revised
Design is adequate to test the
hypothesis
List of materials and controls
is complete and some
description provided
Description makes it likely that
the experiment can be reliably
replicated
All major safety concerns are
adequately addressed;
procedures adopted are likely
to produce a safe experiment –
some further refinement could
minimize possible discomfort
to the student
Design is a well-
constructed test of the
stated hypothesis
List of materials and
controls is complete and
thoroughly described
The description of the
experiment is complete,
insuring that it can be
replicated
Safety concerns are fully
addressed and procedures
for conducting the
experiment insure that
there is little or no risk of
safety or discomfort to the
student
Data Collection & Analysis
1 2 3 4
Data are
inaccurate
Data are
haphazardly
recorded
Data table
missing
Most data are collected but
checks are not placed on
measurement to insure
accuracy
Data are recorded in a manner
that threatens reliability
Data table incomplete or
contain inconsistencies
All significant data measured
with some checks placed on
measurement for accuracy
Data recorded effectively
The data table is relevant to
the task requirements
All significant data
measured, checks are placed
on measurements for
accuracy
Data recorded effectively
and efficiently
The data table well-designed
to the task requirements

382
Attachment I
CLE: 7.1.A
Page 4
Data Display
1 2 3 4
Graph form
inappropriate
Data points missing
or incorrect
Inappropriate
labeling
Intervals
inappropriate
Graph form is
appropriate
All data points included,
some inaccurately plotted
Labeling lacks clarity
Intervals are appropriate
Graph form is appropriate,
multiple graphs used as
warranted
All data points included and
accurately plotted
Labeling clear
Intervals appropriate
Graph visually designed to
assist reader
All graph forms are
appropriate, multiple graphs
used as warranted
All data points accurately
plotted
Labeling clear
Intervals appropriate
Graph visually compelling,
highlights conclusions of the
study
Conclusion
1 2 3 4
Inconclusive, or
conclusion not
warranted by data
analysis
Conclusion too general or
over- reaches the data
analysis
Conclusion uses the
language of the experiment
but does not translate
conclusion to its relevance
to the original problem
Conclusion precise, related to
the hypothesis
Conclusion uses operational
terms of the experiment and
attempts to translate the
conclusion to make it relevant
to the original problem
The conclusion related to
general interest and other
studies
Conclusion precisely
stated, relates directly to
support or non-support of
the hypothesis
Conclusion uses
operational terms and
suggests how the
conclusion has relevancy in
resolution of the original
problem
Conclusion relates the
study to general interest,
other studies that have
been or could be conducted

383
Attachment J
CLE: 8.2.A.a-b
Research Paper
CATEGORY 4 3 2 1
Organization Information is very organized with well-constructed paragraphs and subheadings.
Information is organized with well-constructed paragraphs.
Information is organized, but paragraphs are not well-constructed.
The information appears to be disorganized. 8)
Amount of Information
There is a clear introduction and conclusion, and the scientist's life is extensively detailed and connected to his/her work.
There is a good introduction and conclusion, and the scientist's life is well detailed and connected to his/her work.
There is an introduction and conclusion, and the scientist's life is adequately detailed and connected to his/her work.
Introduction or Conclusion missing, poor account of scientist's life and poorly connected to his/her work.
Sources All sources (information and graphics) are accurately documented in the desired format.
All sources (information and graphics) are accurately documented, but a few are not in the desired format.
All sources (information and graphics) are accurately documented, but many are not in the desired format.
Some sources are not accurately documented.
Mechanics No grammatical, spelling or punctuation errors.
Almost no grammatical, spelling or punctuation errors
A few grammatical spelling, or punctuation errors.
Many grammatical, spelling, or punctuation errors.
Diagrams & Illustrations (optional)
At least three illustrations are included that add to the reader's understanding of the topic.
Two illustrations are included that add to the reader's understanding of the topic.
One illustration is included that adds to the reader's understanding of the topic.
Diagrams and illustrations are not included OR do not add to the reader's understanding of the topic.
Citations At least three citations from research sources are included and are correctly punctuated.
Two citations from research sources are included and are correctly punctuated.
Only one citation from research sources are included and are correctly punctuated
No citations are included, or the ones that are included are incorrectly punctuated.
Sources At least three different kinds of sources are used (book, magazine, website)
Two different kinds of sources are used (from the following: book, magazine, website)
Only one kind of source is used (from the following: book magazine, website)
No research sources are used