Embed Size (px)
Citation preview

ISSN 1064�2293, Eurasian Soil Science, 2010, Vol. 43, No. 10, pp. 1083–1101. © Pleiades Publishing, Ltd., 2010.Original Russian Text © T.V. Alekseeva, A.O. Alekseev, V.A. Demkin, V.A. Alekseeva, Z. Sokolowska, M. Hajnos, P.I. Kalinin, 2010, published in Pochvovedenie, 2010, No. 10, pp. 1171–1189.
1083
INTRODUCTION
This work is a continuation of our investigation intothe history of the soil and environmental evolution inthe Lower Volga region in the past 4000 years. Themodern soil cover in this area is characterized by itscomplex character and includes light chestnut soilsand solonetzes occupying nearly 40% of the territory.The light chestnut soils also contain solonetzic fea�tures that are considered to be the zonal characteristicof the desert�steppe soils [9, 13]. Demkin [9] demon�strated that the solonetzic features appeared in thesoils of this region during the third and second millen�nia BC, and their formation had an asynchronous pat�tern. The gap in the time between the appearance ofthe solonetzic features in the dry steppe and desert�steppe soils may reach 1000–2000 years and more; itdepends on the particular lithological and geomorphicconditions.
The results of examination of the paleosols buriedunder kurgans indicate that the morphological mani�festation of solonetzic features is subjected to minordiagenetic changes and can be preserved in the buriedpaleosols for hundreds and thousands of years. Thus,
the solonetzic features can be considered reliable car�riers of the soil memory [14, 25].
Solonetzes are soils with the eluvial–illuvial differ�entiation of their profile; their illuvial horizon has atypical columnar structure and an alkaline reaction.To diagnose solonetzes, the morphological features ofthe soils are used together with some analytical char�acteristics related to the soil particle�size distribution(the degree of the soil swelling, the degree of the claydifferentiation in the soil profile, and the relationshipbetween the water�peptizable and aggregated clay) andto the physicochemical properties of these soils (thecontents of soluble salts and exchangeable sodium, thesum of exchangeable sodium and magnesium, themineralogical composition of the fine earth, etc.) [8,21, 22, 28, 30].
To reconstruct the evolution of solonetzes in theLower Volga region, it was necessary to analyze themaximum possible number of various soil features andproperties indicative of the development of solonetzicprocess. Various physicochemical methods were usedfor this purpose in combination with the comparativechronological approach to soil studies. The modern
GENESIS AND GEOGRAPHYOF SOILS
Physicochemical and Mineralogical Diagnostic Features of Solonetzic Process in Soils of the Lower Volga Region
in the Late HoloceneT. V. Alekseevaa, A. O. Alekseeva, V. A. Demkina, V. A. Alekseevab, Z. Sokolowskac,
M. Hajnosc, and P. I. Kalinina
a Institute of Physicochemical and Biological Problems of Soil Science, Russian Academy of Sciences,ul. Insitutskaya 2, Pushchino, Moscow oblast, 142290 Russia
b Geographical Faculty, Moscow State University, Moscow, 119191 Russiac Institute of Agrophysics, Polish Academy of Sciences, Lublin, Poland
Received February 26, 2009
Abstract—Modern solonetzes and paleosolonetzes buried under steppe kurgans 3800–600 years ago werestudied in the Lower Volga region. Overall, 28 quantitative parameters used in the description of the solo�netzic process were examined. These parameters included the textural (the clay content, the ratio of the clay(<0.001 mm) content in the B horizon to that in the A horizon, the degree of the textural differentiation of theprofile, the degree of illuviation of the profile, the content of particles <0.005 mm, and the particle size of clayminerals) and the physicochemical and mineralogical (the cation exchange capacity; the contents of exchangeableNa, Mg, and Ca; the contents of soluble salts, smectites, hydromica, and fine�dispersed quartz particles; the specificsurface area; the contents of elements in the bulk soil samples and in the clay fraction; the Al/(K + Ca + Na + Mg)and SiO2/R2O3 ratios; the morphology of sand�size quartz particles; the magnetic susceptibility of the soils;etc.) characteristics. It was shown that the studied soils are characterized by different intensities of the solo�netzic process. The asynchronous development of solonetzes in the Lower Volga region and the polygeneticnature of these soils may be the reasons for the absence of a correlation between the degree of manifestationof solonetzic features in the soils and the soil age.
DOI: 10.1134/S1064229310100029

1084
EURASIAN SOIL SCIENCE Vol. 43 No. 10 2010
ALEKSEEVA et al.
solonetzes and paleosolonetzes buried under kurgansof different ages (3800–600 years) were examined.
OBJECTS AND METHODS
Modern soils and paleosols buried under archaeo�logical monuments were studied in the Lower Volgaregion within Volgograd oblast. The studied objectsbelong to the desert�steppe zone of the NorthernErgeni Upland (the Abganerovo group of kurgans) andto the Early Khvalyn plain within the Caspian Low�land (the Malyaevka group of kurgans). The ErgeniUpland is composed of continental loess�like deposits.The Caspian Lowland is confined to the ancient tec�tonic depression filled with marine and continentalsediments. A detailed description of the studied areawas given in our previous works [12, 13, 32]. The con�tinental climate of the territory is characterized by themean annual precipitation of 350–380 mm and by themean annual temperature of +7°С. The paleosolo�netzes buried under kurgans of the Bronze Age (the19th–18th centuries BC, pit D�464) and the EarlyIron Age (the 4th century AD, Pit D�455) were stud�ied on the Northern Ergeni Upland; the medievalpaleosolonetzes (14th century AD, pit D�485) werestudied on the Privolzhskaya Plain; and three modernsolonetzic soils were studied in pits D�451 (theAbganerovo site), D�482, and D�484 (the Malyaevkasite). The major properties of the studied soils aregiven in Table 1. The dating of the archaeologicalmonuments was based on the artifacts found in themand followed the archaeological chronologicalschemes. The accuracy of the archaeological dating isestimated at about ±100–200 years for the Bronze Ageand ±50 years for the Early Iron Age and the medievalepoch.
The use of a set of methods to study the morphol�ogy and major properties of the soils, including theirmagnetic susceptibility, allowed us to show that the cli�mate changes within the studied territory in the sec�ond part of the Holocene had a cyclic pattern [13, 32].It was shown that the magnetic parameters of the soils(in particular, their magnetic susceptibility) may beused as reliable indicators of the paleoclimate [1–3,32, 35, 38]. An approach for the quantitative recon�struction of precipitation in different historical periodswas developed on the basis magnetic properties of thepaleosols in the Holocene and Pleistocene. It wasshown that the rise in the soil magnetic susceptibilityrelative to that in the parent material is directly corre�lated with the mean annual precipitation for the drysteppe and desert�steppe zones. The following equa�tion was suggested to calculate the average norm of theatmospheric precipitation (mm) from the magneticsusceptibility data: P = 86.4Ln(χB – χC) + 90.1, where(χB – χC) is the increment of the magnetic susceptibil�
ity under the impact of the soil formation (R2 = 0.93)[3, 32, 35, 36].
Our calculations showed that the mean annual pre�cipitation within the studied territory varied from360 to 430 mm/year. The driest period took place dur�ing the Bronze Age (the 19th–18th centuries BC)(pit D�464). These calculations were performed forthe light chestnut paleosols buried under kurgans,because the differentiation of the profile in solonetzicsoils hampers the quantitative determination of theprocesses responsible for the changes in the magneticsusceptibility of these soils.
The laboratory studies included the determinationof the major soil properties by routine methods. Theclay fraction (<0.002 mm) for the further analysis wasobtained by the sedimentation method. Its mineralog�ical composition was studied by the method of x�raydiffractometry using a DRON�3 device (copper radia�tion, Ni filter). The Mg and K forms of the clay speci�mens (air�dry, ethylene glycol solvated and heated at350 and 550°C) were examined. The Li test (Т =250°С, t = 12 h; followed by saturation with ethyleneglycol) was applied to determine the position of thepredominantly negative charges on the octahedral ortetrahedral layers. The quantitative relationshipsbetween the main groups of phyllosilicates in the clayfraction were calculated from data on the peak areas inthe diffraction patterns of the samples saturated withethylene glycol [33]. The content of the finely dis�persed quartz in the clay fraction was calculated withthe use of QUANTA software (ChevronTexaco) on thebasis of the diffraction patterns of the samples with theuse of an inner standard (ZnO, 10%) [37].
The elemental composition of the bulk soil samplesand clay fractions was determined using an X�ray flu�orescent analyzer (Spectroscan MAKS�GV) accord�ing to the method developed for powdered samples. Thecalibration of the analyzer was performed with the use ofstandard soil samples for the typical chernozem, loamysandy soddy�podzolic soil, and calcareous sierozem. Onthe basis of these data, a number of geochemical indiceswere calculated. In particular, the lithochemical indexCIA = 100 · Al2O3/(Al2O3 + CaO + Na2O + K2O) wascalculated for the carbonate�free samples. This indexcharacterizes the degree of weathering of the soilmaterial and its mineralogical specificity [16]. Thespecific surface area of the soil particles was deter�mined from the data on the adsorption and desorptionof water vapor according to the BET equation [4].
The studying of the magnetic soil properties wasperformed with the use of the following devices: a kap�pameter KT�5 (the magnetic susceptibility χ underfield conditions), a kappabridge KLY�2 (the magneticsusceptibility χ under laboratory conditions), an MS�2Bartington (the frequency�dependent magnetic sus�ceptibility χfd), a Molspin magnetometer and pulse

EURASIAN SOIL SCIENCE Vol. 43 No. 10 2010
PHYSICOCHEMICAL AND MINERALOGICAL DIAGNOSTIC FEATURES 1085
Ta
ble
1.M
ajor
pro
pert
ies
of th
e st
udie
d so
ils
Hor
i�zo
nD
epth
, cm
pHC
org
Sal
tsC
aCO
3 C
aSO
4 S
um o
f the
ex
chan
geab
le
base
s, m
eq/1
00 g
Spe
cific
su
rfac
e ar
ea,
m2 /g
San
d (1
–0.
05 m
m)
Silt
(0
.05–
0.00
1 m
m)
Cla
y (<
0.00
1 m
m)
Mag
neti
c ch
arac
teri
stic
s*
%
%M
S
χA
RM
/SIR
M
HIR
M10
0
Abg
aner
ovo.
Pit
D�4
51. M
ediu
m�d
eep
solo
ncha
kous
sol
onet
z, m
oder
n ep
och.
Pre
cipi
tati
on**
, 380
mm
/yr
A1
0–11
8.0
0.98
0.10
0.0
0.00
13.5
18.1
025
.465
.88.
846
0.65
29
B1
11–
258.
60.
860.
260.
00.
0037
.261
.20
11.2
46.2
42.6
630.
7425
Cg
120–
200
8.3
1.73
10.2
2.84
26.1
26.9
45.7
27.4
Pit
D�4
55. S
hallo
w to
med
ium
�dee
p ch
estn
ut s
olon
chak
ous s
olon
etz,
the
4th
cent
ury
AD
. Pre
cipi
tati
on, 3
90 m
m/y
r
A1
0–8
8.1
0.32
0.6
0.0
0.00
14.3
27.7
124
.867
.67.
640
0.57
41
B1
8–25
8.4
0.38
0.95
2.5
0.00
39.5
106.
3012
.439
.648
.054
0.84
25
B2
25–
318.
80.
330.
6910
.20.
0028
.410
.548
.241
.2
Csg
80–
200
8.9
1.22
10.0
2.06
27.9
43.7
28.4
Pit
D�4
64. S
olon
etzi
c an
d so
lonc
hako
us li
ght c
hest
nut s
oil,
the
19th
–18
th c
entu
ries
BC
. Pre
cipi
tati
on, 3
60 m
m/y
r
A1
0–9
8.6
0.05
1.07
0.0
0.00
18.7
26.5
036
.850
.113
.032
0.60
30
B1
9–24
8.6
0.16
1.20
2.1
0.00
29.6
45.0
028
.139
.832
.039
0.68
33
B2
24–
339.
20.
321.
0116
.40.
61
Mal
yaev
ka. P
it D
�484
. Sol
onet
zic
and
deep
ly s
olon
chak
ous
light
che
stnu
t soi
l, m
oder
n ep
och.
Pre
cipi
tati
on, 3
70 m
m/y
r
A1
0–9
7.1
1.61
0.00
0.00
0.00
16.4
58.4
229
.752
.417
.88
380.
6343
B1
9–35
7.7
0.65
0.04
1.36
0.00
30.5
83.7
714
.648
.539
.96
440.
8430
B2c
a35
–50
8.8
0.35
0.08
6.47
0.25
26.2
C35
1–37
128
.4
Pit
D�4
82. D
eepl
y so
lonc
hako
us s
olon
etz,
mod
ern
epoc
h. P
reci
pita
tion
, 370
mm
/yr
A1
0–10
7.0
2.28
0.05
0.00
0.00
14.6
Not
det
.30
.053
.417
.240
0.47
44
B1
10–
307.
60.
890.
031.
020.
0022
.6''
21.6
46.0
32.3
243
0.59
63
B2c
a30
–43
8.6
0.47
0.06
1.02
0.41
27.7
''18
.964
.916
.16
Pit
D�4
85. S
olod
ic a
nd d
eepl
y so
lonc
hako
us s
hallo
w s
olon
etz,
the
14th
cen
tury
AD
. Pre
cipi
tati
on, 3
65 m
m/y
r
A1
0–5
7.8
0.55
0.41
0.92
1.65
14.8
33.8
637
.949
.712
.52
300.
5130
B1
5–30
7.7
0.47
0.49
1.10
1.97
37.7
98.8
213
.738
.447
.92
380.
6334
B2c
a30
–52
8.3
0.35
0.54
1.22
2.18
28.4
Not
es:
*M
agne
tic c
hara
cter
istic
s: M
S—m
agne
tic su
scep
tibili
ty χ
, SI u
nits
× 1
0–8 m
3 /kg;
χA
RM
/SIR
M—
the
ratio
refle
ctin
g th
e ch
ange
s in
the
size
of m
agne
tic p
artic
les,
m/A
; χA
RM
—th
e an
hyst
er�
etic
rem
anen
t mag
netiz
atio
n w
ith th
e hi
gh se
nsiti
vity
tow
ards
the
size
(0.0
2–0.
4 μ
m) o
f the
ferr
imag
netic
par
ticle
s (m
agne
tite
and
mag
hem
ite),
10–
8 m3 /k
g; S
IRM
—th
e sa
tura
tion
isot
herm
alre
man
ent m
agne
tizat
ion
in th
e fie
ld o
f up
to 1
T, 1
0–5 A
m2 /k
g; H
IRM
100—
the
hard
isot
herm
al re
man
ent m
agne
tizat
ion,
a p
aram
eter
indi
cativ
e of
the
cont
ents
of h
emat
ite a
nd g
oeth
ite.
**T
he p
reci
pita
tion
calc
ulat
ed fr
om th
e da
ta o
n th
e m
agne
tic su
scep
tibili
ty (t
he e
xpla
natio
ns a
re in
the
text
).

1086
EURASIAN SOIL SCIENCE Vol. 43 No. 10 2010
ALEKSEEVA et al.
magnetizer (the isothermal remanent magnetization(IRM) curves in fields up to 1 T), and a Molspindemagnetizer and magnetometer (the anhystereticremanent magnetization (ARM)). To estimate theconcentration of ferrimagnetic materials or the totalconcentration of paramagnetic minerals and antifer�romagnets upon the low content of ferrimagneticmaterials, the magnetic susceptibility value (χ, SIunits × 10–8 m3/kg) was applied. The presence of ferri�magnetic minerals was judged from the analysis of acombination of the magnetic parameters (the ARM,SIRM, IRM100, and χfd). The “hard” isothermalremanent magnetization (HIRM100mT) and the por�tion of the remanent magnetization in the range from300 mT to 1 T (SIRM–IRM300) reflect the contents ofthe highly coercive minerals (hematite + goethite) [36].
Another important information layer of the soil mem�ory is represented by the minerals in the sand and siltfractions. We used the method of the morphoscopy of thesand�size skeletal grains. This method suggests that thegrains of terrigenous minerals, after being released fromthe parent material, acquire the features conditioned bythe properties of those media in which the transporta�tion, accumulation, and postsedimentary transforma�tion of these minerals take place. The morphoscopy ofthe quartz grains is usually studied, because this stablemineral is widespread in various genetic types of sedi�ments [7].
In our work, we examined quartz grains separatedfrom the A1 horizon and from the parent material ofthe studied soil profiles. The preparation of the sam�ples for the analysis was performed according to theearlier developed method [1, 10]. The shape and char�acter of the surface of the quartz grains in the fine sandfraction (0.10–0.25 mm) were studied under a scan�ning electron microscope (CamScan) at magnifica�tions of 300–2000. From each of the soil samples,25 randomly selected quartz grains were examined.Their chemical composition was also determined withan x�ray microanalyzer. Three major groups of fea�tures were described: the morphology (shape) of thegrains, the elements on the grain surface that couldoriginate under some mechanical impacts, and theelements on the grain surface that could appear underthe impact of some chemical processes.
RESULTS AND DISCUSSION
All the studied soils are characterized by texturallydifferentiated profiles. The illuvial (solonetzic)B1 horizon is morphologically distinguished by itsred�brown color (2.5YR 3/4) and prismatic structure.The latter is clearly pronounced in pits D�455, D�484,and D�485. In pits D�451 and D�482, the solonetzichorizon is characterized by its unstable fine�prismaticstructure. A detailed morphological description of the
studied profiles is given in the works by Borisov andDemkin with coauthors [6, 12].
The soil texture characteristics lie in the basis of thephysical criteria for the solonetzic features. The tex�ture of the loess�like loams that serve as the parentmaterial of the soils examined at the Abganerovo site isclassified as a coarse silty–clayey light clay [26]. Thehorizons lying above the solonetzic horizon aredepleted of the clay fraction; this is accompanied by asignificant increase in the content of the coarse siltfraction (0.05–0.01 mm) and a small increase in thecontent of the fine sand (0.25–0.05 mm) fraction. Thesolonetzic horizons are rich in clay and depleted offine sand; the silt content in these horizons is close tothat in the parent material. These changes arereflected in the textural classes: the texture of theA1 horizon is classified as a coarse silty light loam, andthe texture of the B1 horizon is classified as a silty–clayey light clay. The texture of the marine loams thatserve as the parent material at the Malyaevka site isclassified as a sandy–coarse silty medium loam. Theredistribution of the soil particles in the soil profile dis�plays the same tendency that was noted for the Abgan�erovo site. The A1 horizon has a coarse silty medium(or light) loamy texture, and the B1 horizon has aclayey light clay texture.
The criteria of the solonetzic features in the studiedsoils are listed in Table 2. The traditional criterion isbased on the ratio between the content of particles<0.001 mm in the B horizon to that in the A horizon(or vice versa) [12, 14]. In the studied soils, this ratiovaries from 1.9 to 6.3. Two additional criteria are basedon the data on the clay contents [28]: the degree of thetextural differentiation of the profile (DTD), which iscalculated as the difference between the clay contentsin the B and A horizons (clay B – clay A), and thedegree of illuviation of the soil profile DI = (clay B –clay A)/(clay B + clay A) × 100 %. The first parametervaries within 15–40, and the second parameter varieswithin 31–73.
Berezin [5] demonstrated the importance of thefine silt (0.005–0.001 mm) fraction in the particle�sizedistribution studies and suggested that the content ofparticles <0.005 mm could be used as an additionaltextural characteristic of the soils and parent materi�als; this criterion was referred to as the F5 criterion.Kust [21] applied the F5 criterion to the study of solo�netzes and proved that it agrees well with the morpho�logical manifestation of solonetzic features. The F5criterion can vary from 10% (in sands) to 80% (inheavy clays). In the studied soils, it varies within 20–31 in the A1 horizon (medium loam) and within 39–59 in the B1 horizon (light clay). Another index of theparticle�size distribution suggested by Berezin [5] isthe degree of dispersion of the clay components,which is calculated according to the following equa�

EURASIAN SOIL SCIENCE Vol. 43 No. 10 2010
PHYSICOCHEMICAL AND MINERALOGICAL DIAGNOSTIC FEATURES 1087
tion: k = [ln (F5) – ln (<0.001 mm)]/1.609. The valueof k in the A1 horizon varies within 0.3–0.7 (clayeysilty to silty); in the B1 horizon, it varies within 0.1–0.2(medium colloidal to clayey colloidal). This parameteris of particular interest, because it is independent of
the contents of the silty and sandy particles and bearsinformation about the mineralogical composition ofthe clay. The high values of this parameter in theA1 horizon are indicative of the predominance of rel�atively coarse minerals of the chlorite–illite group; the
Table 2. The contents of exchangeable bases and the criteria of the textural differentiation of the soil profile
HorizonExchangeable bases, % of the CEC
Clay B/Clay A DTD* DI** F5*** K****Mg2+ Na+ Ca2+
Pit D�451. Medium�deep solonchakous solonetz, modern epoch
A1 29.58 7.93 59.30 4.8 33.8 65.6 20.2 0.5
B1 37.29 18.13 43.58 50.5 0.1
Pit D�455. Shallow to medium�deep solonchakous solonetz, the 4th century AD
A1 39.66 37.56 21.37 6.3 40.4 72.7 22.7 0.7
B1 41.79 38.12 18.74 59.2 0.1
B2 35.14 49.88 14.25 56.4 0.2
Pit D�464. Solonetzic and solonchakous light chestnut soil, the 19th–18th century BC
A1 46.31 45.34 5.78 2.5 19.0 42.1 21.8 0.3
B1 44.58 50.22 3.55 38.7 0.1
Pit D�484. Solonetzic and deeply solonchakous light chestnut soil, modern epoch
A1 38.51 1.77 54.84 2.1 19.1 34.8 31.5 0.4
B1 40.60 4.82 52.51 47.5 0.2
B2ca 40.27 5.91 51.87
Pit D�482. Deeply solonchakous solonetz, modern epoch
A1 33.80 8.30 47.80 1.9 15.1 30.5 30.5 0.4
B1 34.60 4.60 56.60 45.9 0.2
B2ca 37.20 4.40 56.30 45.3 0.6
Pit D�485. Solodized deeply solonchakous shallow solonetz, the 14th century AD
A1 36.07 26.98 34.24 3.8 35.4 58.6 24.7 0.4
B1 42.47 23.43 32.40 55.1 0.1
B2ca 36.31 22.52 38.71 53.8 0.2
Notes: * The degree of the textural differentiation of the soil profile: the content of the fraction <0.001 mm in the B horizon – the contentof the fraction <0.001 mm in the A horizon.
** The degree of illuviation of the soil profile: (the content of the fraction <0.001 mm in the B horizon – the content of the fraction<0.001 mm in the A horizon)/(the content of the fraction <0.001 mm in the B horizon + the content of the fraction <0.001 mmin the A horizon) × 100%.
*** Sum of the fractions of 0.005–0.001 and <0.001 mm. **** (ln (F5) – ln (<0.001 mm))/1.609.

1088
EURASIAN SOIL SCIENCE Vol. 43 No. 10 2010
ALEKSEEVA et al.
low values of this parameter in the B1 horizon point tothe predominance of the highly dispersed minerals ofthe vermiculite–smectite group. The textural proper�ties of the studied soil profiles are in agreement withthe data on the specific surface of the soil particles,because the latter is dictated both by the particle�sizedistribution and by the mineralogical specificity of thesoil horizons [4].
It can be concluded that the particle�size distribu�tion data and the various additional criteria listed inTable 2 attest to the different degrees of the develop�ment of solonetzic features in the studied soil profiles.The maximum development of the solonetzic processis noted for pit D�455 and the minimum development,for pit D�464 (the most ancient buried paleosol at theAbganerovo site) and for the modern soils at theMalyaevka site.
Physicochemical characteristics, mineralogical com�position, and magnetic properties. The soils studied atthe Abganerovo key site have an alkaline reaction; thepH of the soils studied at the Malyaevka site is within7.0–8.8. The maximum degree of the soil salinizationis typical of the paleosolonetz (pit D�464) from theAbganerovo site. The modern soils at the Malyaevkasite are nonsaline. The sum of the exchangeable Mg2+
and Na+ in the B1 horizon of the paleosolonetzes var�ies within 64–95% of the CEC. In the background sur�face solonetzes, it is about 41–55%. The content ofexchangeable Mg2+ is usually higher than the contentof exchangeable Na+. The paleosolonetzes (pits D�464and D�455) from the Abganerovo site are an excep�tion. In these soils, the content of the exchangeableMg2+ is 42–46%, and the content of the exchangeableNa+ is 38–50%. In the modern solonetzes, the portionof exchangeable Na+ decreases to 5–18% of the CEC.Simultaneously, the portion of exchangeable Ca2+
rises up to 44–57% of the CEC. It can be concludedfrom these data that the active stage (Na+ stage) of thedevelopment of the solonetzes is typical of the paleosolsin pits D�464 and D�455 (the Abganerovo site) and in pitD�485 (the Malyaevka site). The modern soils at theMalyaevka site are subjected to desolonetzization, andthe solonetzic features in these soils have a relict char�acter. At the same time, the modern soil at the Abgan�erovo site (pit D�451) is characterized by the currentlyactive solonetzic process. We suppose that the highcontent of exchangeable Mg2+ does not support thesolonetzic process, so that, in the solonetzic soil withthe low content of exchangeable Na+ independently ofthe Mg2+ content, the solonetzic process is inactive,and the solonetzic features have a residual relict char�acter. This conclusion is also supported by the data onthe textural differentiation of the profiles in pits D�484and D�482. Our results are in agreement with the con�clusion of Khitrov [29] about the secondary role of
exchangeable Mg2+ in the development of solonetzicprocess.
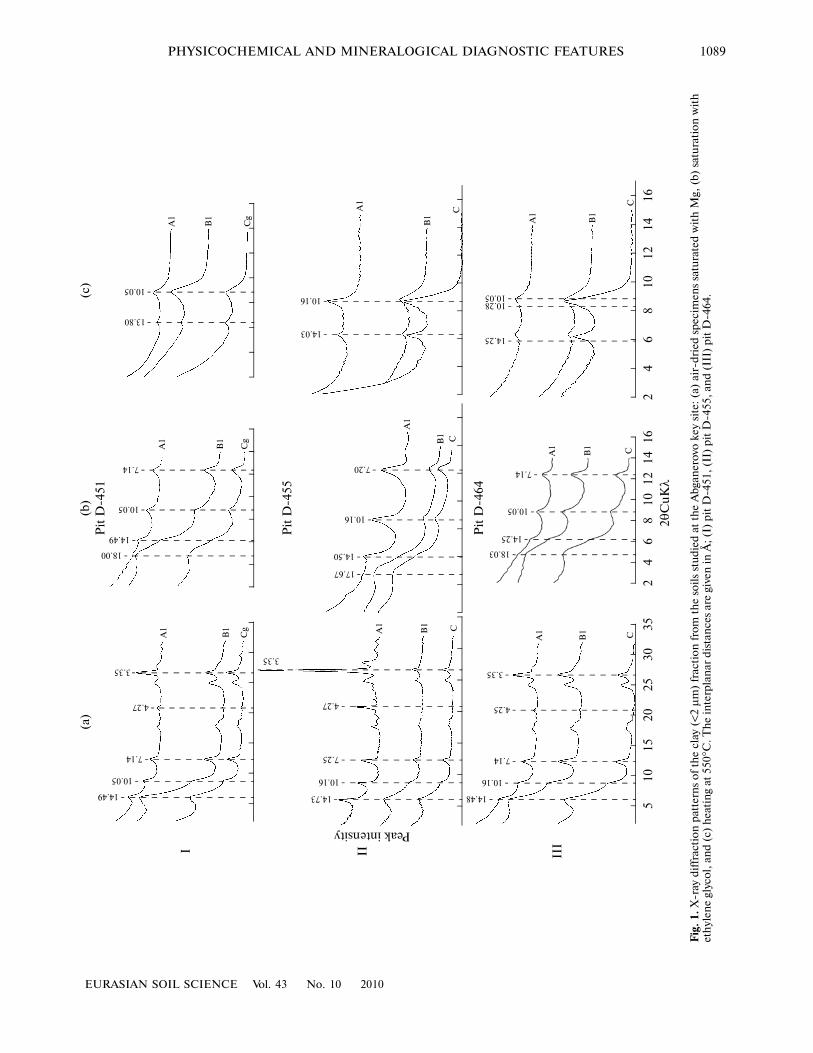
The clay fraction from the loess�like loam (QI–III)—the parent material for the soils studied at the Abgan�erovo site—is characterized by the predominance ofsmectite (37–43%) (Fig. 1, Table 3). The saturation ofthe specimens with К+ and the subsequent saturationwith ethylene glycol results in an irreversible shrinkageof the lattice to 10.3 Å, which attests to the high chargeof the smectite lattice of the micaceous nature. Theresults of the Li test indicate the irreversible shrinkageof the lattice to 10.1 Å, which is indicative of montmo�rillonite. The second mineral phase is represented bydioctahedral hydromica. Kaolinite, chlorite, and ver�miculite are also diagnosed in the clay fraction. Thebulk content of the latter three minerals was estimated.The presence of vermiculite was judged from the peakat 14 Å in the diffraction patterns of the air�dried sam�ples and from the behavior of this peak after the treat�ment with ethylene glycol and after heating at 550°С.The presence of this peak in the diffraction patterns ofboth the air�dried specimens and the specimens satu�rated with ethylene glycol may be indicative of thepresence of both vermiculite and chlorite (or theirmixture). However, upon heating at 550°C, the 14 Åpeak intensity decreases considerably (in some cases,this peak disappears), whereas the intensity of the peakat 10 Å increases, which is typical of vermiculite. Thecontent of nonlayered minerals (predominantly,quartz) in the studied samples varies from 7 to 13%.
The clay fraction from the silty marine loams (QIIIhv) atthe Malyaevka site is also characterized by a predomi�nance of labile clay minerals (about 40%). The satura�tion of the specimens with К+ and the subsequent sat�uration with ethylene glycol leads to the irreversibleshrinkage of the smectite lattice to 10.2 Å, whichpoints to the high charge of the lattice and its mica�ceous character. The results of the Li test indicate thatthe saturation with ethylene glycol leads to the expan�sion of the lattice to 17 Å; simultaneously, a consider�able rise in the intensity of the peak of mica (001) atd001 = 9.94 Å in comparison with the initial samplestakes place. These two facts suggest that the labilemineral phase is represented by montmorillonite andbeidellite with a predominance of the latter. The otherfeatures of the clay mineralogy in the parent materialsat the Malyaevka site are similar to those at the Abgan�erovo site.
The textural differentiation of the solonetzes isaccompanied by the differentiation of their physico�chemical characteristics, including their mineralogi�cal composition. In the A1 horizon of both groups ofsoils, the content of the swelling phase (with ethyleneglycol) decreases to 2–8%. This phase is representedby labile layers within an irregular mixed�layered min�eral. The major phase in the clay fraction is repre�
EURASIAN SOIL SCIENCE Vol. 43 No. 10 2010
PHYSICOCHEMICAL AND MINERALOGICAL DIAGNOSTIC FEATURES 1089
I
Peak intensity
3520
105
3025
1514
84
212
106
1614
84
212
106
16
14.49
10.05
7.14
4.27
3.35
A1
B1
Cg
14.73
10.16
7.25
4.27
3.35
A1
B1 C
7.20 7.14
7.14
7.14
14.48
10.16
4.25
3.35
A1
B1 C
18.00
14.49
10.05
A1
B1
Cg
A1
B1 C
10.16
14.50
17.67
A1
B1 C
14.25
10.05
18.03
A1
B1
C
10.0510.28
14.25
A1
B1
C
14.03
10.16
13.80
10.05
A1
B1
Cg
2θC
uKλ
(a)
II III
Pit
D�4
51(c
)
Pit
D�4
55
Pit
D�4
64
(b)
Fig
. 1. X
�ray
dif
frac
tion
pat
tern
s of
th
e cl
ay (
<2 μ
m)
frac
tion
fro
m t
he
soil
s st
udie
d at
th
e A
bgan
erov
o ke
y si
te: (
a) a
ir�d
ried
spe
cim
ens
satu
rate
d w
ith
Mg,
(b)
sat
urat
ion
wit
het
hyl
ene
glyc
ol,
and
(c)
hea
tin
g at
550°С
. Th
e in
terp
lan
ar d
ista
nce
s ar
e gi
ven
in Å
; (I)
pit
D�4
51,
(II)
pit
D�4
55,
and
(III
) pi
t D
�464
.
1090
EURASIAN SOIL SCIENCE Vol. 43 No. 10 2010
ALEKSEEVA et al.
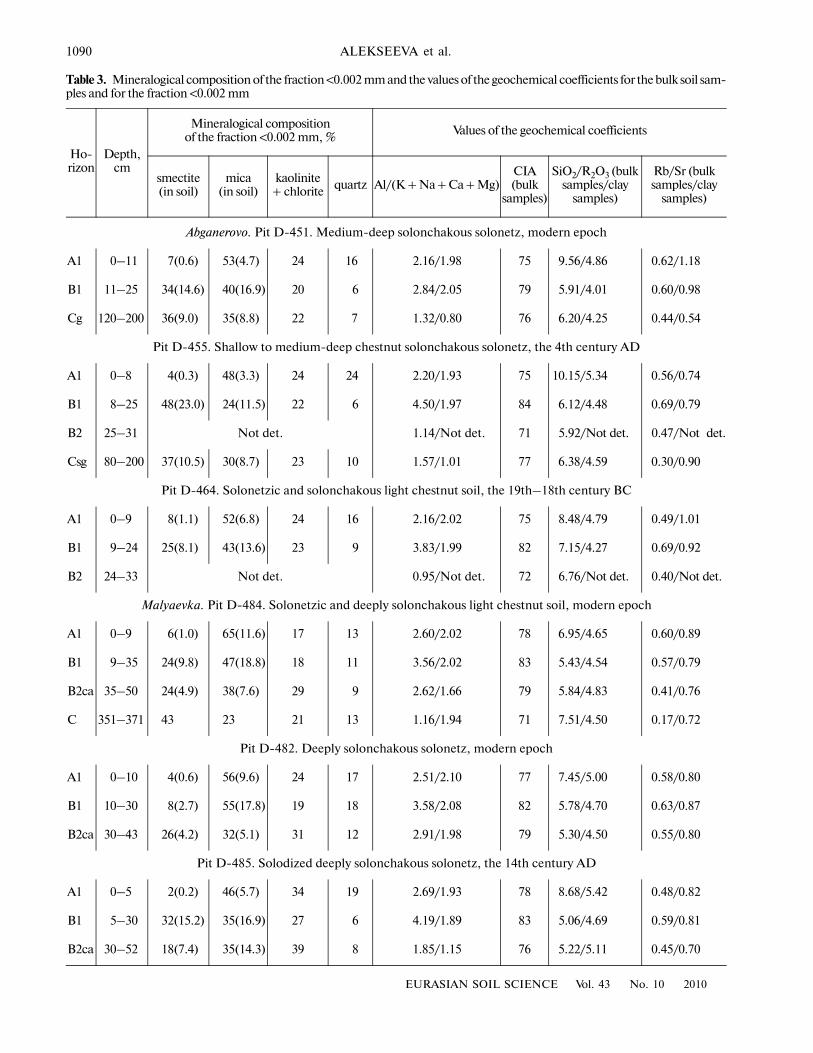
Table 3. Mineralogical composition of the fraction <0.002 mm and the values of the geochemical coefficients for the bulk soil sam�ples and for the fraction <0.002 mm
Ho�rizon
Depth, cm
Mineralogical composition of the fraction <0.002 mm, % Values of the geochemical coefficients
smectite (in soil)
mica (in soil)
kaolinite + chlorite quartz Al/(K + Na + Ca + Mg)
CIA (bulk
samples)
SiO2/R2O3 (bulk samples/clay
samples)
Rb/Sr (bulk samples/clay
samples)
Abganerovo. Pit D�451. Medium�deep solonchakous solonetz, modern epoch
A1 0–11 7(0.6) 53(4.7) 24 16 2.16/1.98 75 9.56/4.86 0.62/1.18
B1 11–25 34(14.6) 40(16.9) 20 6 2.84/2.05 79 5.91/4.01 0.60/0.98
Cg 120–200 36(9.0) 35(8.8) 22 7 1.32/0.80 76 6.20/4.25 0.44/0.54
Pit D�455. Shallow to medium�deep chestnut solonchakous solonetz, the 4th century AD
A1 0–8 4(0.3) 48(3.3) 24 24 2.20/1.93 75 10.15/5.34 0.56/0.74
B1 8–25 48(23.0) 24(11.5) 22 6 4.50/1.97 84 6.12/4.48 0.69/0.79
B2 25–31 Not det. 1.14/Not det. 71 5.92/Not det. 0.47/Not det.
Csg 80–200 37(10.5) 30(8.7) 23 10 1.57/1.01 77 6.38/4.59 0.30/0.90
Pit D�464. Solonetzic and solonchakous light chestnut soil, the 19th–18th century BC
A1 0–9 8(1.1) 52(6.8) 24 16 2.16/2.02 75 8.48/4.79 0.49/1.01
B1 9–24 25(8.1) 43(13.6) 23 9 3.83/1.99 82 7.15/4.27 0.69/0.92
B2 24–33 Not det. 0.95/Not det. 72 6.76/Not det. 0.40/Not det.
Malyaevka. Pit D�484. Solonetzic and deeply solonchakous light chestnut soil, modern epoch
A1 0–9 6(1.0) 65(11.6) 17 13 2.60/2.02 78 6.95/4.65 0.60/0.89
B1 9–35 24(9.8) 47(18.8) 18 11 3.56/2.02 83 5.43/4.54 0.57/0.79
B2ca 35–50 24(4.9) 38(7.6) 29 9 2.62/1.66 79 5.84/4.83 0.41/0.76
C 351–371 43 23 21 13 1.16/1.94 71 7.51/4.50 0.17/0.72
Pit D�482. Deeply solonchakous solonetz, modern epoch
A1 0–10 4(0.6) 56(9.6) 24 17 2.51/2.10 77 7.45/5.00 0.58/0.80
B1 10–30 8(2.7) 55(17.8) 19 18 3.58/2.08 82 5.78/4.70 0.63/0.87
B2ca 30–43 26(4.2) 32(5.1) 31 12 2.91/1.98 79 5.30/4.50 0.55/0.80
Pit D�485. Solodized deeply solonchakous solonetz, the 14th century AD
A1 0–5 2(0.2) 46(5.7) 34 19 2.69/1.93 78 8.68/5.42 0.48/0.82
B1 5–30 32(15.2) 35(16.9) 27 6 4.19/1.89 83 5.06/4.69 0.59/0.81
B2ca 30–52 18(7.4) 35(14.3) 39 8 1.85/1.15 76 5.22/5.11 0.45/0.70

EURASIAN SOIL SCIENCE Vol. 43 No. 10 2010
PHYSICOCHEMICAL AND MINERALOGICAL DIAGNOSTIC FEATURES 1091
sented by the dioctahedral hydromica (48–65%).Kaolinite, vermiculite, and chlorite (in trace amounts)are also diagnosed in the clay fraction from this hori�zon. This fraction is enriched in the nonlayered fine�dispersed minerals, including quartz. The quartz con�tent reaches 13–24%. As a result, the SiO2/R2O3 ratioincreases. The mineralogical composition of the clayfraction in the B1 horizon is closer to that in the parentmaterial. However, the content of the labile phase in theB1 horizon is higher. This phase is represented by themixed�layered illite–smectite. Its content in theB1 horizon is 1.6–2.2 times higher than that in theparent material. In pit D�464, there is no rise in thecontent of smectites in the solonetzic horizon in com�parison with the parent material, though the eluvialhorizon depleted of smectite and enriched in quartz isclearly distinguished in this profile. The contents ofmicas and quartz in the B1 horizon of the studied soilsare close to those in the parent material. The contentof chlorite in the B1 horizon is somewhat lower andcomparable with that in the A1 horizon (Fig. 1c).
The mineralogical composition of the clay fractionfrom the soil profiles studied at the Malyaevka site isgenerally close to that of the soils from the Abganerovosite. A distinctive feature of the solonetzes at theMalyaevka site is the absence of chlorites in the profiles ofthe modern solonetzes (pits D�482 and D�484); vermic�ulite is also absent in these soils. In the buried paleoso�lonetz (pit D�485), both vermiculite and chlorite arepresent in the clay fraction.
Thus, the development of the solonetzic process isaccompanied by the mineralogical differentiation ofthe soil profiles: the smectitic phase has a distinct elu�vial–illuvial distribution pattern, and the clay fractionin the eluvial horizons is enriched in minerals withnonswelling lattices (predominantly hydromicas) andin nonlayered minerals (predominantly quartz). Thecontent of chlorites in the soil horizons is lower thanthat in the parent material, and the content of kaolin�
ite remains relatively stable or somewhat increases inthe A1 horizon (pit D�455). Pit D�485 (the buriedsolonetz from the Malyaevka site) is an exception: thecontent of chlorites in this soil remains stable in theentire profile. The degree of development of the min�eralogical indices of the solonetzic process correlateswith the other physicochemical and morphologicalcriteria. According to them, the maximum manifesta�tion of the solonetzic features is observed in pits D�455and D�485. In these soils, the solonetzic horizon isenriched in smectites, and the A1 horizon is enrichedin hydromica and finely dispersed quartz. An analo�gous association of phyllosilicates in the clay fractionof the solonetzes was also observed earlier [20, 22, 27].
Figure 2 displays the results of the magnetic sus�ceptibility analyses of the bulk soil samples. The ordi�nate axis shows the χARM/SIRM ratio reflecting thesize of the particles, the mineralogical composition ofthe iron oxides, and the character of the interactionbetween the magnetic particles [38]. The values of thisratio are within the interval typical of soil magnetite(0.5–1.5 m2/A). In the parent materials, this ratio isrelatively low, and the concentration of magnetic min�erals (the magnetic susceptibility) is also low. Thesematerials are grouped into a distinct cluster in the plot.In the humus horizons of the buried paleosols, thevariability of these parameters increases. In the solo�netzic horizons, the magnetic susceptibility increasesup to 60–70 SI units, and the χARM/SIRM ratio isincreased in comparison with that in the A1 horizon,which points to a greater contribution of ferrimagneticparticles (~0.03 μm) to the magnetic properties in theB1 horizon [32, 38]. At the same time, the high vari�ability of both values in the soil profiles developedfrom the same parent materials may be indicative ofthe dependence between the mineralogical composi�tion of the iron oxides, the climatic conditions of thesoil formation, and the degree of the development ofthe solonetzic features.
0.90.8
0.60.50.40.30.20.1
0 30 70 8010 50
Pit D�451, hor. A1Pit D�451, hor. B1Pit D�455, hor. A1Pit D�455, hor. B1Pit D�464, hor. A1Pit D�464, hor. B1
P.M.
1.0
0.7
(a)
0 60 8020 40
Pit D�484, hor. A1Pit D�484, hor. B1Pit D�482, hor. A1Pit D�482, hor. B1Pit D�485, hor. A1Pit D�485, hor. B1
P.M.
(b)
5010 30 7020 6040
χ, 10–8 m3/kg
χar
m/S
IRM
Fig. 2. Magnetic characteristics of the soils studied at the (a) Abganerovo key site and (b) the Malyaevka key site; P.M. is the parentmaterial.
1092
EURASIAN SOIL SCIENCE Vol. 43 No. 10 2010
ALEKSEEVA et al.
The analysis of the magnetization curves and thevalues of the HIRM100 parameter suggest that the por�tion of goethite and hematite in the A1 horizon isincreased in comparison with the solonetzic horizons.This tendency is particularly pronounced in pit D�455with the maximum development of the solonetzic pro�cess.
Bulk chemical composition. The mineral part of theburied soils is tolerant toward diagenetic processes.Numerous works have shown that the data on the bulkelemental composition of the Holocene and Pleis�tocene paleosols and more ancient fossil soils may beused in paleopedological studies [14, 15, 31, 39, 40].
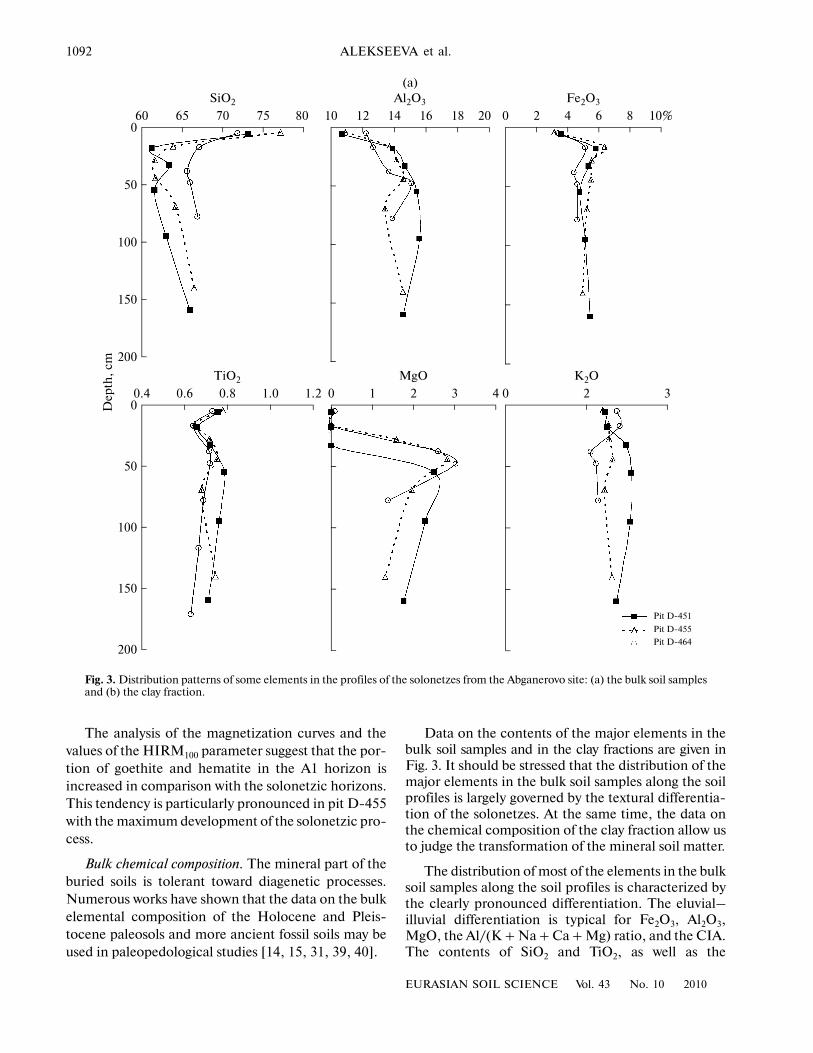
Data on the contents of the major elements in thebulk soil samples and in the clay fractions are given inFig. 3. It should be stressed that the distribution of themajor elements in the bulk soil samples along the soilprofiles is largely governed by the textural differentia�tion of the solonetzes. At the same time, the data onthe chemical composition of the clay fraction allow usto judge the transformation of the mineral soil matter.
The distribution of most of the elements in the bulksoil samples along the soil profiles is characterized bythe clearly pronounced differentiation. The eluvial–illuvial differentiation is typical for Fe2О3, Al2О3,MgO, the Al/(K + Na + Ca + Mg) ratio, and the CIA.The contents of SiО2 and TiО2, as well as the
200
150
100
50
080 7560 65 70
SiO2
20 1810 12 16
Al2O3
10%80 4 6
Fe2O3
200
150
100
50
01.21.00.4 0.6 0.8
TiO2
430 1 2
MgO
Pit D�451
30 2
K2O
14 2
Pit D�455
Pit D�464
Dep
th,
сm
(a)
Fig. 3. Distribution patterns of some elements in the profiles of the solonetzes from the Abganerovo site: (a) the bulk soil samplesand (b) the clay fraction.

EURASIAN SOIL SCIENCE Vol. 43 No. 10 2010
PHYSICOCHEMICAL AND MINERALOGICAL DIAGNOSTIC FEATURES 1093
SiO2/R2O3 ratio, are characterized by maximum val�ues in the A1 horizon and minimum values in the B1horizon. The distribution of most of the elements inthe clay fraction is characterized by only one pro�nounced maximum (or minimum). Thus, SiО2, TiО2,K2О, and MnO are accumulated in the A1 horizon;the content of MgO in this horizon has a distinct min�imum. Two elements are characterized by their elu�vial–illuvial redistribution in the clay fraction similarto that in the bulk soil samples: Fe2О3 and Al2О3. Thesame is true for the Al/(K + Na + Ca + Mg) ratio.
Let us analyze the behavior of the major elementsmore carefully. The increase in the SiO2 content in theA1 horizon is related to the textural specificity of theprofile, i.e., to the removal of clay from the A1 horizon
with the residual accumulation of silt particles and theminerals associated with this fraction. The removal ofsmectite�containing colloidal particles from theA1 horizon is accompanied by the residual accumula�tion of quartz in the clay fraction. The clay fraction inthe B1 horizon is also enriched in SiO2 in comparisonwith the clay fraction from the parent material (Fig. 4),which reflects the destruction of silicates in the soilprofile. This conclusion is in agreement with our dataon the Al/(K + Na + Ca + Mg) ratio, which is higherin the soil than in the parent material. The Ba/Sr ratiois also used to estimate the degree of weathering andleaching of the soil material [39, 40]. Both elementshave close atomic radii and are chemical relatives,though the leaching of Ba from the soil is less active
300
150
100
50
0806550 55 60
SiO2
7570
200
250
1510
Al2O3
20 10%60 2 4
Fe2O3
8
300
150
100
50
00.80.4 0.6
TiO2
1.21.0
200
250
30 1 2
MgO
4 3.01.51.0
K2O
2.52.0Dep
th,
сm
Pit D�451
Pit D�455
Pit D�464
(b)
Fig. 3. (Contd.)

1094
EURASIAN SOIL SCIENCE Vol. 43 No. 10 2010
ALEKSEEVA et al.
than the leaching of Sr bound with carbonates. TheBa/Sr ratio of more than 2.0 is indicative of consider�able leaching of the soil. The solonetzic horizon in thestudied soils is characterized by the maximum valuesof this ratio both for the bulk soil samples (with a max�imum of 2.89) and for the clay fraction (with a maxi�mum of 4.69). This fact attests to the considerable trans�formation of the material of the solonetzic horizon.
The eluvial–illuvial distribution patterns of theAl2О3 and Fe2О3 are observed both for the bulk soilsamples and for the clay fractions. The most pro�nounced differentiation of these oxides is noted for thebulk soil samples; it is explained by the textural differ�entiation of the profiles. It is interesting that the hori�zon with the maximum accumulation of Аl2О3 isfound deeper (down to 50 cm) than the horizon withthe maximum accumulation of Fe2О3. The latter isstrictly confined to the solonetzic horizon at the depthof about 20 cm. The migration of aluminum in the soil
profiles may take place in the form of aluminates,whereas the migration of iron may proceed in the formof iron–humus complexes. The latter are diagnosed bythe presence of cutans on columnar peds in the solo�netzic horizons. The distribution patterns of the Feand Al in the clay fraction, together with the mineral�ogical data, suggest that this fraction is also subjectedto differentiation. The redistribution of the soil parti�cles involves the fine colloidal particles, which isproved by the values of the coefficient of the mineraldispersion according to Berezin [5]. In the B1 hori�zon, this coefficient is about 0.1–0.2. The clay fractionfrom the B1 horizon is characterized by higher valuesof the indices of the soil weathering (the Ba/Sr andAl/(K + Na + Ca + Mg) ratios) in comparison withthose in the A1 horizon, which is also indicative of theleaching of weathering products from the A1 horizonand their accumulation in the lower horizons. It isprobable that the weathering process in the solonetzichorizon is more active than that in the A1 horizon.
The behavior of K2О in the clay fractions of thesoils is usually related to the behavior of micaceousminerals. The accumulation of potassium in the A1horizon corresponds to the predominance (45–65%)of mica in the clay fraction. The distribution patternsof the К2О and mica correlate with the k value, whichis higher in the A1 horizon and corresponds to micaand other coarse minerals [5].
Figure 4 illustrates the results of the balance calcu�lations for a number of elements from the bulk soilsamples taken from the A1 and B1 horizons (averagevalues) relative to their contents in the parent material:(A – C)/C × 100% and (B – C)/C × 100%. The max�imum losses from both soil horizons (A1 and B1) areobserved for MgO (in the bulk soil samples) and CaO(in the clay fraction). The loss of MgO from both soilhorizons is up to 100% in most of the samples.According to Kovda [18], this phenomenon is typicalof well�developed solonetzes, whereas the initialdevelopment of solonetzes is accompanied by theweak removal of Mg. At the same time, Kovda notedthat Mg is always accumulated in the illuvial horizons.For the solonetzes studied at the Abganerovo site, thedistribution of Mg in the soil profiles has an eluvial–illuvial pattern with an illuvial maximum at a depth ofabout 50 cm (below the solonetzic horizon). For thesoils studied at the Malyaevka site, the illuvial maxi�mum of Mg is not seen at all. According to Kovda, theloss of MgO upon the development of the solonetzicprocess and the soil desalinization reaches 44% in theA1 horizon and 15% in the B1 horizon. The valuesobtained in our study are considerably higher.
The distribution of the microelements (TiO2 andMnO) requires special consideration. The titaniumcontent is somewhat increased in the bulk samplesfrom the A1 horizon. The increase in the content of
100
40
20
0
–20
–40
–60
–80
–100CeMnKSi
(a)
SrAlCaMg P Ti Fe
80
60
100
40
20
0
–20
–40
–60
–80
–100MnKSi
(b)
SrAlCaMg P Ti Fe
80
60
%
hor. A hor. B
Fig. 4. Balance of some elements (average values) in the A1and B1 horizons of the studied soils (the accumulation/theloss of elements is calculated with respect to their contentsin the parent material): (a) the bulk soil samples and (b) theclay fraction.

EURASIAN SOIL SCIENCE Vol. 43 No. 10 2010
PHYSICOCHEMICAL AND MINERALOGICAL DIAGNOSTIC FEATURES 1095
TiO2 (relative to that in the parent material) is compa�rable with the increase in the content of SiO2 and canbe explained by the residual accumulation of stableminerals such as quartz and rutile. The clay fractionfrom the A1 horizon is considerably enriched in TiO2
(by 44%) and is much higher than the clay enrichmentin SiO2 (+5%). It can be supposed that the titanium�bearing compounds in the clay fraction consist of tita�nium oxides (rutile) and titanium complexes accumu�lated in the organic horizons of the studied soils. Kasi�mov [17] considers Ti, as well as Mn, Sr, and someother elements, to be typical of the sodic geochemicalassociation of elements with a high capacity for bio�logical mobilization. The accumulation of Mn in theA1 horizon may be up to 240% (the average accumula�tion is about 90%). This is the biogenic accumulationtypical of various steppe and desert landscapes [17].
The results of the bulk elemental analyses of the soilsamples indicate that the elements are arranged intothe following sequence with respect to the intensity oftheir leaching from the eluvial horizon: Mg, Ca, Fe, P,Al, and Mn (Fig. 4a). The intensity of the residualaccumulation of the elements in the eluvial horizon isas follows: Si, Ti, and K. The formation of the illuvialhorizon is accompanied by the following sequence ofthe elements' leaching: Mg, Ca, P, and Si. The inten�sity of the elements' accumulation in the illuvial hori�zon is as follows: Ti, Mn, Al, K, and Fe. Thus, bothhorizons are depleted in Mg, Ca, and P and areenriched in K and Ti.
Somewhat different patterns of the accumulationand leaching of the elements are seen upon the analy�sis of the clay fraction (Fig. 4b). The variability of theelement concentrations in the clay fraction is mostpronounced for the A1 horizon. The leachingsequence is as follows: Ca, Mg, Al, and Fe. Other ele�ments are accumulated in the following increasingorder: Si, P, K, Ti, and Mn. As noted above, the max�imum accumulation is observed for TiO2 (+44%) andMnO (+90%). Kovda [18] gave the following values ofthe accumulation of these elements (in the bulk soilmass) in the profile of a residual solonchakous solo�netz: +17% for Ti and +23% for Mn. He explained theresidual accumulation of these elements by the leach�ing of Mg, Ca, Fe, and Al. The clay fraction in the illu�vial horizon of the solonetzes studied by us is depletedof Ca, Mg, and P. The changes in the contents of theother elements are insignificant, though a tendencyfor the accumulation in the clay fraction of the illuvialhorizon is observed for Al, Si, Fe, K, Ti, and Mn. Thedegrees of accumulation of Fe, Al, and Si are veryclose to one another. The behavior of Ca in the clayfraction of the studied soils may be explained by thespecific nature of the soil adsorption complex. Theparent material is enriched in the Ca�form of smec�tites owing to the presence of calcium carbonates and
gypsum. Also, the finely dispersed calcite is containedin the clay fraction. The clay fraction of the A1 horizonis depleted in smectites and, hence, in the exchange�able calcium. In the solonetzic horizon, the smectitesare mainly present in the Na (Mg) form.
The average losses of Mg from the A1 horizonreaches 99% in the bulk soil samples and 31% in theclay fraction; the losses of Mg from the B1 horizon are98 and 17%, respectively. This may be related to thedestruction of chlorites in both horizons.
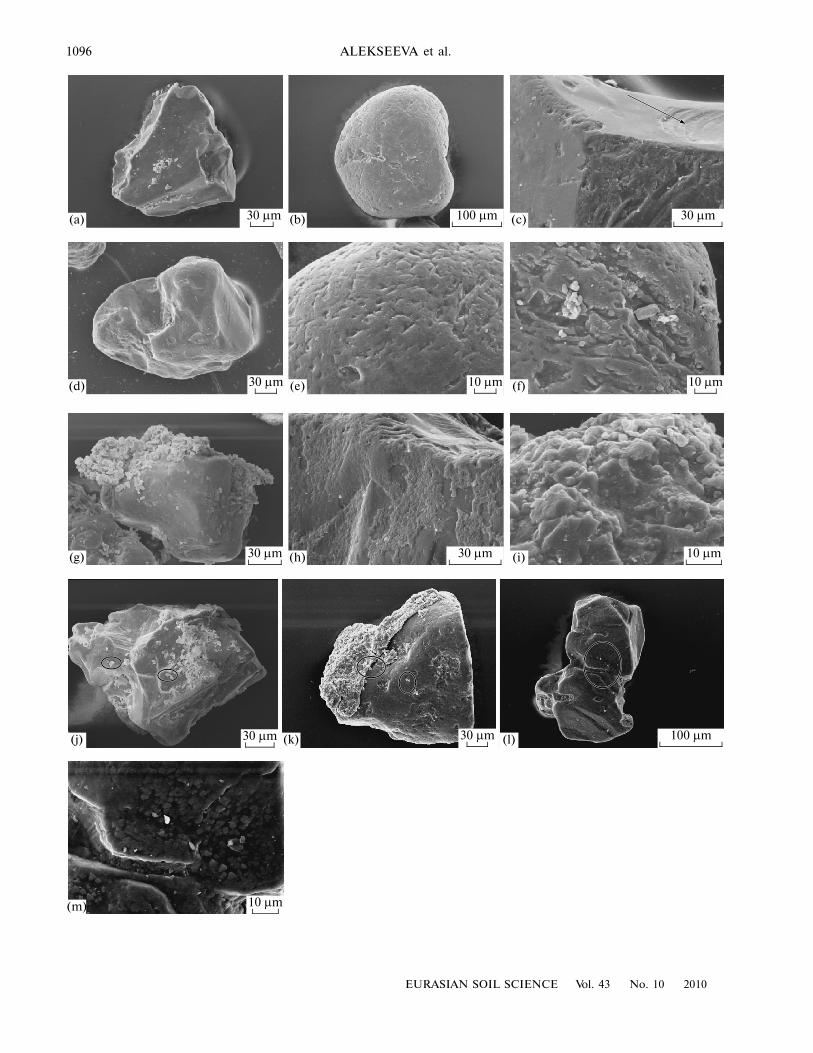
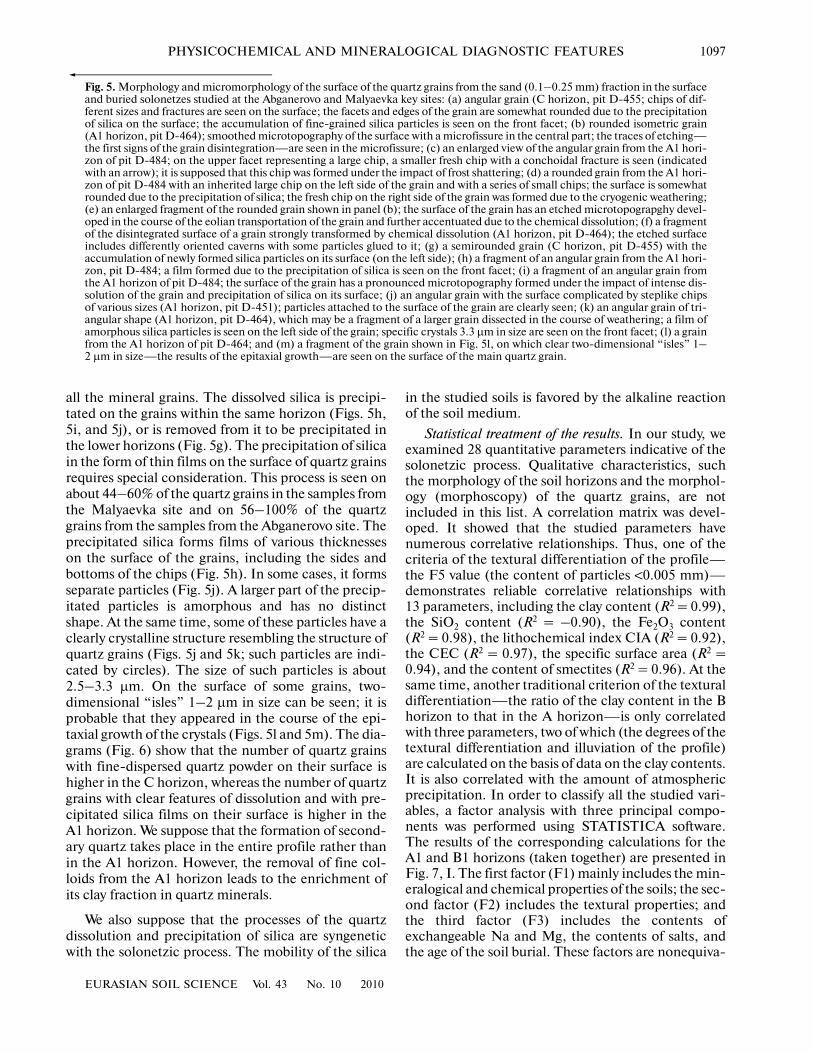
The morphology and micromorphology of the surfaceof the mineral grains are sensitive and informative ele�ments of the soil memory contained in the skeletalparticles. It is supposed that the sand grains are carriersof the lithogenic memory of the soils [24]. In our study,we tried to estimate the impact of the solonetzic pro�cess on the morphoscopy of the quartz grains.
With respect to their morphology, the quartz grainsin the studied soils may be subdivided into two groups.The first group includes angular�shaped grains withchips of different sizes on their surface (Fig. 5a). Thesecond group includes rounded grains with small cav�ities on the surface that appear upon the eolian trans�portation of the quartz grains [7, 34] (Figs. 5b and 5e).
In the first group, chips of different sizes on the sur�face of the quartz grains appear under the impact ofdifferent processes of physical weathering (Fig. 5c).Traces of cryogenic weathering can be seen on the rel�atively fresh chips that can appear on the surface uponthe seasonal freezing of the soils (Fig. 5d) [7, 19].
The surface features attributed to the chemicalweathering are represented by etching patterns [34],such as small pits and caverns of dissolution (Figs. 5fand 5i), and by silica films of different thicknesses onthe surface of quartz grains (Figs. 5g and 5h).
The results obtained upon the description of thequartz grains are presented in a quantitative form inthe diagrams (Fig. 6) for the Abganerovo key site. Theanalysis of these diagrams for the parent materialshows that the lithogenic memory of the soils can becharacterized by various features, such as the shape ofthe grains, the presence of small and large chips on thesurface, the etched microtopography, and the smallcaverns and grooves resulting from the dissolution ofthe grains.
The diagrams developed for the quartz grains fromthe A1 horizon indicate that the soil formation isaccompanied by an increase in the number of largechips on the surface of the grains and a decrease in thenumber of small chips and etched patterns. Theincreasing number of large chips points to the intensi�fication of various disintegration processes near thesoil surface. The decreasing number of small chips andetched patterns (i.e., the smoothing of the surface) is aconsequence of the chemical dissolution that affects
1096
EURASIAN SOIL SCIENCE Vol. 43 No. 10 2010
ALEKSEEVA et al.
(a) 30 μm 100 μm 30 μm
10 μm10 μm30 μm
30 μm 30 μm 10 μm
100 μm30 μm30 μm
10 μm
(b) (c)
(d) (e) (f)
(g) (h) (i)
(j) (k) (l)
(m)
EURASIAN SOIL SCIENCE Vol. 43 No. 10 2010
PHYSICOCHEMICAL AND MINERALOGICAL DIAGNOSTIC FEATURES 1097
all the mineral grains. The dissolved silica is precipi�tated on the grains within the same horizon (Figs. 5h,5i, and 5j), or is removed from it to be precipitated inthe lower horizons (Fig. 5g). The precipitation of silicain the form of thin films on the surface of quartz grainsrequires special consideration. This process is seen onabout 44–60% of the quartz grains in the samples fromthe Malyaevka site and on 56–100% of the quartzgrains from the samples from the Abganerovo site. Theprecipitated silica forms films of various thicknesseson the surface of the grains, including the sides andbottoms of the chips (Fig. 5h). In some cases, it formsseparate particles (Fig. 5j). A larger part of the precip�itated particles is amorphous and has no distinctshape. At the same time, some of these particles have aclearly crystalline structure resembling the structure ofquartz grains (Figs. 5j and 5k; such particles are indi�cated by circles). The size of such particles is about2.5–3.3 μm. On the surface of some grains, two�dimensional “isles” 1–2 μm in size can be seen; it isprobable that they appeared in the course of the epi�taxial growth of the crystals (Figs. 5l and 5m). The dia�grams (Fig. 6) show that the number of quartz grainswith fine�dispersed quartz powder on their surface ishigher in the C horizon, whereas the number of quartzgrains with clear features of dissolution and with pre�cipitated silica films on their surface is higher in theA1 horizon. We suppose that the formation of second�ary quartz takes place in the entire profile rather thanin the A1 horizon. However, the removal of fine col�loids from the A1 horizon leads to the enrichment ofits clay fraction in quartz minerals.
We also suppose that the processes of the quartzdissolution and precipitation of silica are syngeneticwith the solonetzic process. The mobility of the silica
in the studied soils is favored by the alkaline reactionof the soil medium.
Statistical treatment of the results. In our study, weexamined 28 quantitative parameters indicative of thesolonetzic process. Qualitative characteristics, suchthe morphology of the soil horizons and the morphol�ogy (morphoscopy) of the quartz grains, are notincluded in this list. A correlation matrix was devel�oped. It showed that the studied parameters havenumerous correlative relationships. Thus, one of thecriteria of the textural differentiation of the profile—the F5 value (the content of particles <0.005 mm)—demonstrates reliable correlative relationships with13 parameters, including the clay content (R2 = 0.99),the SiO2 content (R2 = –0.90), the Fe2O3 content(R2 = 0.98), the lithochemical index CIA (R2 = 0.92),the CEC (R2 = 0.97), the specific surface area (R2 =0.94), and the content of smectites (R2 = 0.96). At thesame time, another traditional criterion of the texturaldifferentiation—the ratio of the clay content in the Bhorizon to that in the A horizon—is only correlatedwith three parameters, two of which (the degrees of thetextural differentiation and illuviation of the profile)are calculated on the basis of data on the clay contents.It is also correlated with the amount of atmosphericprecipitation. In order to classify all the studied vari�ables, a factor analysis with three principal compo�nents was performed using STATISTICA software.The results of the corresponding calculations for theA1 and B1 horizons (taken together) are presented inFig. 7, I. The first factor (F1) mainly includes the min�eralogical and chemical properties of the soils; the sec�ond factor (F2) includes the textural properties; andthe third factor (F3) includes the contents ofexchangeable Na and Mg, the contents of salts, andthe age of the soil burial. These factors are nonequiva�
Fig. 5. Morphology and micromorphology of the surface of the quartz grains from the sand (0.1–0.25 mm) fraction in the surfaceand buried solonetzes studied at the Abganerovo and Malyaevka key sites: (a) angular grain (C horizon, pit D�455; chips of dif�ferent sizes and fractures are seen on the surface; the facets and edges of the grain are somewhat rounded due to the precipitationof silica on the surface; the accumulation of fine�grained silica particles is seen on the front facet; (b) rounded isometric grain(A1 horizon, pit D�464); smoothed microtopography of the surface with a microfissure in the central part; the traces of etching—the first signs of the grain disintegration—are seen in the microfissure; (c) an enlarged view of the angular grain from the A1 hori�zon of pit D�484; on the upper facet representing a large chip, a smaller fresh chip with a conchoidal fracture is seen (indicatedwith an arrow); it is supposed that this chip was formed under the impact of frost shattering; (d) a rounded grain from the A1 hori�zon of pit D�484 with an inherited large chip on the left side of the grain and with a series of small chips; the surface is somewhatrounded due to the precipitation of silica; the fresh chip on the right side of the grain was formed due to the cryogenic weathering;(e) an enlarged fragment of the rounded grain shown in panel (b); the surface of the grain has an etched microtopograpghy devel�oped in the course of the eolian transportation of the grain and further accentuated due to the chemical dissolution; (f) a fragmentof the disintegrated surface of a grain strongly transformed by chemical dissolution (A1 horizon, pit D�464); the etched surfaceincludes differently oriented caverns with some particles glued to it; (g) a semirounded grain (C horizon, pit D�455) with theaccumulation of newly formed silica particles on its surface (on the left side); (h) a fragment of an angular grain from the A1 hori�zon, pit D�484; a film formed due to the precipitation of silica is seen on the front facet; (i) a fragment of an angular grain fromthe A1 horizon of pit D�484; the surface of the grain has a pronounced microtopography formed under the impact of intense dis�solution of the grain and precipitation of silica on its surface; (j) an angular grain with the surface complicated by steplike chipsof various sizes (A1 horizon, pit D�451); particles attached to the surface of the grain are clearly seen; (k) an angular grain of tri�angular shape (A1 horizon, pit D�464), which may be a fragment of a larger grain dissected in the course of weathering; a film ofamorphous silica particles is seen on the left side of the grain; specific crystals 3.3 μm in size are seen on the front facet; (l) a grainfrom the A1 horizon of pit D�464; and (m) a fragment of the grain shown in Fig. 5l, on which clear two�dimensional “isles” 1–2 μm in size—the results of the epitaxial growth—are seen on the surface of the main quartz grain.

1098
EURASIAN SOIL SCIENCE Vol. 43 No. 10 2010
ALEKSEEVA et al.
lent. Thus, factor F1 includes 16 parameters; factorF2, 4 parameters; and factor F3, 4 parameters. Theparameters included in factor F1 can be subdividedinto two groups. The first group (area A2, Fig. 7, I)includes those parameters that are based on data onthe SiO2 content. The second group (area A1, Fig. 7, I)includes the parameters related to the presence ofphyllosilicates and iron oxides in the clay fraction andthe soil properties governed by these substances, i.e.,the specific surface of the soil particles and the soilexchange properties. The F5 parameter (the contentof particles <0.005 mm) is also included in this group.
Other than these three major factors, a group of fiveparameters requires special attention. These are themagnetic soil properties (the magnetic susceptibility(MS), the HIRM, and the χfd) and the contents ofpotassium and manganese. Their behavior in the soilprofiles cannot be explained only by the textural dif�ferentiation or by the chemical and mineralogicalproperties of the mineral mass. The results of the sta�tistical treatment of the entire set of analytical datapoint to the genetic similarity of the studied soils.
The results of the factor analysis performed for theseparate horizons are shown in Figs. 7, II and 7, III.The A1 and B1 horizons differ from one another in thesets of parameters included in the particular factorsand in the weights of these parameters. In the A1 hori�zon, most of the parameters are included into twomajor factors with definite casual relationshipsbetween them. In the B1 horizon, the situation is morecomplicated. One�third of the considered parameters(the geochemical coefficients, the magnetic parame�ters, the contents of SiO2 and quartz, and the age ofthe soils) have factor weights much less than ±1. It canbe supposed that the material of the A1 horizon in thestudied soils has reached some equilibrium state,whereas the material of the B1 horizon is more heter�ogeneous and reflects different degrees of the develop�ment of the solonetzic process. Our results are inagreement with the conclusion of Lebedeva andTonkonogov [23] about the memory of the soil profileas a combination of the memories of the particulargenetic horizons.
8
7
6
5
4
3
2
1
805040300 2010 70 9060 100
9
805040300 2010 70 9060 100
8
7
6
5
4
3
2
1
9
Pit D�451, hor. A1 Pit D�455, hor. A1
Pit D�464, hor. A1 Pit D�455, hor. C
%
Fig. 6. The occurrence of different features on the surface of quartz grains (0.1–0.25 mm) in the surface and buried solonetzes atthe Abganerovo key site. Designations: (1) angular shape, (2) rounded shape, (3) large chips, (4) small chips, (5) fresh cryogenicchips, (6) etched microtopography, (7) accumulations of attached particles, (8) traces of intense dissolution and reprecipitationof silica, and (9) etching patterns.

EURASIAN SOIL SCIENCE Vol. 43 No. 10 2010
PHYSICOCHEMICAL AND MINERALOGICAL DIAGNOSTIC FEATURES 1099
CONCLUSIONS
The results obtained in this study allow us to con�clude that the solonetzes of different ages are charac�terized by different degrees of the development of thesolonetzic features. The values of the selected textural,geochemical, and mineralogical parameters point to themaximum development of these features in pit D�455(the paleosol buried at the Abganerovo key site in the4th century AD). However, no definite relationshipsbetween the degree of the manifestation of the solo�netzic features and the age of the buried soils can betraced. We suppose that one of the reasons for this phe�nomenon lies in the fact of the asynchronous develop�ment of the solonetzic processes within the studiedterritory. In turn, this is caused by the differences inthe lithological and geomorphic conditions of the ter�ritory, including the textural characteristics of the par�ent materials and the degree of drainage of the partic�ular areas [11]. The existence of direct relationshipsbetween the solonetzic process and the generalgeochemical situation in a landscape and its geomor�phic characteristics was shown long ago by Kovda [18].
Another reason may be related to the relict natureof some of the present�day solonetzes. The results of ourstudy indicate that the solonetzic process in pit D�451(the Abganerovo site) is currently active, whereas thesolonetzic features in pits D�484 and D�482 (theMalyaevka site) are inherited from the previous stagesof the soil development and, thus, have a relict nature.This conclusion is confirmed by the low content ofsoluble salts (the development of desalinization), thelow content of exchangeable Na+, and the relativelyhigh content of exchangeable Ca2+ in the soils studiedat the Malyaevka site. The destruction of the solo�netzic features in these soils leads to somewhat lower
values of the criteria reflecting the textural differentia�tion of the soils. At the same time, all the soils havereached the mature stage of the development of thesolonetzic processes. This can be seen from the behav�ior of Mg in the soil profiles. The loss of MgO from theA1 and B1 horizons of the studied soils is close to100%. Kovda considered this phenomenon to be typi�cal of mature solonetzes, because the loss of Mg fromthe upper horizons at the early stage of the develop�ment of these soils proceeds slowly. The equal values of
1.0
0.5
–1.0
0.5–0.5 1.0 F1–1.0
–0.5
F2
1.0
0.5
–1.0
0.5–0.5 1.0 F1–1.0
–0.5
F2
1.0
0.5
–1.0
0.5–0.5 1.0 F1–1.0
–0.5
F2
MS
SiO2
ARM
MnO
K
TiO2
PD B/A
SiO2/R2O3
Fe2O3HIRM
Illite
Clay
Smectites
Salts
Mg+Na, %Na, %
CEC
Age
II
Al2O3
K2O
ClA
SSAF5
Al/K+Ca+Mg+Na
Qtz
Illuvia�
Precipitation
IlliteTiO2
Al2O3
ARMClA
Al/K+Ca+Mg+NaMS
B/AIlluvia��
SmectitesPD
CECPrecipi�
F5
ClayFe2O3
SSA
Mg+Na, %
MnO
SiO2/R2O3
Age
SiO2
SaltsNa, %
III
I
1
2326
24
27
2122
1319
20
3
28
14
15
2511
8 9
7
17
2
56 10
12
29
416
18
A2 A1
C
B
tion
tion
Qtz HIRM
K2O
K%
%
Fig. 7. (I) The results of the statistical treatment of the data(factor analysis) for the entire soil profiles (I). Analyzedcriteria: A1—the contents of the fraction >2 μm (1),smectites (27), and illites (28) in the clay fraction; the spe�cific surface area (22), the CEC (21); the contents ofFe2O3 (19) and Al2O3 (14) in the bulk soil samples; the val�ues of the CIA (20) and the Al/(K + Ca + Na + Mg)(13) coefficients calculated for the bulk soil samples; theF5 criterion (the content of particles <0.005 mm) (3) andthe ARM/SIRM ratio (24); A2—the content of fine�dis�persed quartz (29), the contents of SiO2 (16) and TiO2(18), the SiO2/R2O33 ratio (16) (for the bulk soil samples),and k (the degree of dispersion of the clay minerals) (4);B—the ratio of the clay fraction content in the B1 horizonto that in the A1 horizon (2), the degree of illuviation of thesoil profile (5), the degree of differentiation of the soil pro�file (6), and the atmospheric precipitation (10); C—thecontent of soluble salts (7), the contents of exchangeableNa+ and Mg2+ (8, 9), and the age of the soil burying (11);15—K2O; 17—MnO; 23—magnetic susceptibility; 25—HIRM; and 26—χfd. (II) and (III) are the results of thestatistical treatment of the data (factor analysis) for the A1and B1 (solonetzic) horizons, respectively. For abbrevia�tions, see notes to Tables 1 and 2.
tation
1100
EURASIAN SOIL SCIENCE Vol. 43 No. 10 2010
ALEKSEEVA et al.
the content of quartz in the clay fraction and the highvalues of the coefficient of leaching (Ba/Sr) for theclay fraction in the A1 and B1 horizons of pits D�484and D�482 attest to the intensification of the weather�ing processes and to the weakening illuviation. Thus,the textural and physicochemical features of the solo�netzic process are wiped out in these soils, though themorphological manifestation of the solonetzic fea�tures is clearly preserved in them.
Demkin [13, 14] suggests that the development of amorphologically diagnosed profile of solonetzes maytake place in less than 500 years. Despite the consider�able differences in the degree of the manifestation ofthe solonetzic process, it is evident that this processaffecting the mineral soil matrix manifests itself byvarious features at the very first stages. Thus, theA1 horizon of solonetzes is characterized by somecoarsening of the texture owing to the removal of clayand the accumulation of the coarse silt fraction, by thedepletion of montmorillonitic minerals from the clayfraction and its enrichment in hydromica and finelydispersed quartz, and by the loss of Ca and Mg. Thegroup of processes in the B1 (solonetzic) horizonincludes the illuviation of the clay and sesquioxidesand the increase in the content of exchangeablesodium in the soil adsorption complex. The solonetzichorizon is enriched in the clay material (the content ofparticles <0.001 mm is up to 48%), and the clay frac�tion is enriched in labile phyllosilicates. The rise in thecontent of the labile phase of the clay minerals repre�sented by the mixed�layered illite–smectite is up totwo times and more in comparison with that in theparent material. The accumulation of Fe in theB1 horizon is accompanied by the considerablegrowth of the magnetic susceptibility values in thishorizon and the χARM/SIRM ratio in comparison withthose in the A1 horizon, which points to the highercontent of dispersed ferrimagnetic minerals. The max�imum values of the CIA, Al/(K + Na + Ca + Mg), andBa/Sr ratios attest to the accumulation of weatheringproducts in the B1 horizon. The significant differencesin the mineralogical and chemical compositions of theclay fraction in the B1 horizon and the parent materialand the increased values of the magnetic susceptibilityin the B1 horizon indicate that the weathering pro�cesses are active not only in the A1 horizon but also inthe solonetzic horizon.
The results of the factor analysis suggest that thematerial of the A1 horizon in the studied soils hasreached some equilibrium state, whereas the materialof the B1 horizon is more heterogeneous. We supposethat its properties are more indicative (in comparisonwith the material of the A1 horizon) of the actual char�acter of the pedogenesis in the buried soils at themoment of their burial.
REFERENCES
1. A. O. Alekseev, T. V. Alekseeva, V. A. Demkin, andI. V. Sergatskov, “Magnetic Properties of the Soils Bur�ied under Archaeological Monuments: The Record ofClimatic Conditions in the Steppes of the Privolzhs�kaya Upland in the Holocene,” Archaeological Materi�als on the Volga–Don Steppes (VolGU, Volgograd,2004), Vol. 2, pp. 96–106 [in Russian].
2. A. O. Alekseev, T. V. Alekseeva, and B. A. Maher,“Magnetic Properties and Mineralogy of Iron Com�pounds in Steppe Soils,” Pochvovedenie, No. 1, 62–74(2003) [Eur. Soil Sci. 36 (1), 59–70 (2003)].
3. V. A. Alekseeva, “Micromorphology of Quartz GrainSurface as Indicator of Glacial Sedimentation Condi�tions: Evidence from the Protva River Basin,” Litol.Polezn. Iskop., No. 5, 485–494 (2005) [Lithol. Miner.Resour. 40 (5), 420–428 (2005)].
4. T. V. Alekseeva, A. O. Alekseev, Z. Sokolowska, andM. Hajnos, “Relationship between MineralogicalComposition and Physical Properties of Soils,” Poch�vovedenie, No. 5, 604–613 (1999) [Eur. Soil Sci. 32 (5),548–557 (1999)].
5. P. N. Berezin, “Specificity of Particle�Size Distributionin Soils and Parent Materials,” Pochvovedenie, No. 2,64–72 (1983).
6. A. V. Borisov, Extended Abstract of Candidate’s Disser�tation in Biology (Moscow, 2002).
7. A. A. Velichko and S. N. Timireva, “Morphoscopy andMorphometry of Sand Quartz Grains form Loess Sedi�ments and Buried Soils,” in Evolutionary Geography inPerspective (Inst. Geogr. RAN, Moscow, 2002),pp. 170–185 [in Russian].
8. L. A. Vorob’eva and E. I. Pankova, “Saline�AlkalineSoils of Russia,” Pochvovedenie, No. 5, 517–532(2008) [Eur. Soil Sci. 41 (5), 457–470 (2008)].
9. V. A. Demkin, “Spatial–Temporal Regularities of theDevelopment of Solonetzic Process in the Soils of DrySteppes and Desert Steppes,” Pochvovedenie, No. 5,533–540 (1995).
10. V. A. Demkin, L. A. Gugalinskaya, A. O. Alekseev,V. M. Alifanov, et al., “Soils in the Geological Historyof the Earth,” in Paleosols as Indicators of the BiosphereEvolution (NIA�Priroda, Fond “Infosfera”, Moscow,2007) [in Russian].
11. V. A. Demkin, T. S. Demkina, A. V. Borisov, et al.,“Transformation of Soils and Environmental Condi�tions in the Semidesert Low Volga Region within thePast 4000 Years,” Pochvovedenie, No. 3, 271–283(2004) [Eur. Soil Sci. 37 (3), 230–241 (2004)].
12. V. A. Demkin, M. V. El’tsov, A. O. Alekseev, T. V. Alek�seeva, et al., “Soil Development in the Lower VolgaArea during the Historical Period,” Pochvovedenie,No. 12, 1486–1497 (2004) [Eur. Soil Sci. 37 (12),1324–1333 (2004)].
13. V. A. Demkin and A. V. Lukashov, “On the Rate andDirection of Pedogenetic Process in the Dry SteppeZone in the Holocene,” Pochvovedenie, No. 6, 5–14(1987).
14. V. A. Demkin, Ya. G. Ryskov, A. O. Alekseev, S. A. Ole�inik, et al., “Paleopedological Study of ArchaeologicalMonuments in the Steppe Zone,” Izv. Akad. Nauk, Ser.Geogr., No. 6, 40–51 (1989).

EURASIAN SOIL SCIENCE Vol. 43 No. 10 2010
PHYSICOCHEMICAL AND MINERALOGICAL DIAGNOSTIC FEATURES 1101
15. M. I. Dergacheva, Archaeological Pedology (Sib. Otd.Ross. Akad. Nauk, Novosibirsk, 1997), 228 pp. [in Rus�sian].
16. T. N. Elizarova, L. Yu. Ditts, A. I. Syso, B. A. Smolent�sev, et al., “Recent and Relict Features in Soils of theForest�Steppe Landscapes of Western Siberia,” Sibirsk.Ekologich. Zh., No. 5, 871–883 (2005).
17. N. S. Kasimov, Geochemistry of Steppe and Desert Land�scapes (Izd. Mosk. Gos. Univ., Moscow, 1988), 254 pp.[in Russian].
18. V. A. Kovda, Solonchaks and Solonetzes (Akad. NaukSSSR, Moscow, 1937), 243 pp. [in Russian].
19. V. N. Konishchev and V. V. Rogov, “Cryogenic Trans�formation of the Mineral Matter of Soils and DispersedRocks under Different Physicochemical Conditions,”Kriosfera Zemli 8 (3), 11–16 (2004).
20. E. A. Kornblyum, T. G. Dement’eva, N. G. Zyrin, andA. G. Birina, “Transformation of Clay Minerals uponthe Development of Southern and Vertic Chernozems,Solod, and Solonetz,” Pochvovedenie, No. 1, 67–85(1972).
21. G. S. Kust, “Diagnostic Criteria of the Degree of Solo�netzicity in Southern Chernozems,” Pochvovedenie,No. 10, 23–30 (1985).
22. G. S. Kust, Extended Abstract of Candidate’s Disserta�tion in Biology (Moscow State Univ., Moscow, 1987).
23. I. I. Lebedeva and V. D. Tonkonogov, “Memory ofGenetic Horizons and Soil Profiles,” in Soil Memory:Soil as a Memory of the Biosphere–Geosphere–Anthro�posphere Interactions (Izd. LKI, Moscow, 2008),pp. 162–181 [in Russian].
24. S. N. Sedov, S. A. Inozemtsev, A. M. Kuznetsova, andS. A. Shoba, “Morphology of Sand and Silt Soil Frac�tions: A Memory of Lithogenesis in Soil Formation,” inSoil Memory: Soil as a Memory of the Biosphere–Geo�sphere–Anthroposphere Interactions (Izd. LKI, Mos�cow, 2008), pp. 206–235 [in Russian].
25. V. O. Targulian, “Soil Memory: Formation, Carriers,and the Spatial–Temporal Diversity,” in Soil Memory:Soil as a Memory of the Biosphere–Geosphere–Anthro�posphere Interactions (Izd. LKI, Moscow, 2008),pp. 24–57 [in Russian].
26. Theory and Methods of Soil Physics (Grif i K, Moscow,2007), 616 pp. [in Russian].
27. L. S. Travnikova, “On the Composition and Structureof the Main Component of Clay Material in SodicSolonetzes,” Dokl. Akad. Nauk SSSR, 226 (6), 1425–1428 (1976).
28. N. B. Khitrov, “The Choice of Diagnostic Criteria toJudge the Development of the Solonetzic Process in
Soils,” Pochvovedenie, No. 1, 18–31 (2004) [Eur. SoilSci. 37 (1), 12–24 (2004)].
29. N. B. Khitrov, “Diagnostics of Solonetzic Horizons,”Pochvovedenie, No. 3, 31–43 (1984).
30. N. B. Khitrov, Genesis, Diagnostics, Properties, and Func�tioning of Clayey Swelling Soils in the Central Cis�CaucasusRegion (Pochv. Inst. im. V.V. Dokuchaeva, Moscow,2003), 505 pp. [in Russian].
31. A. O. Alekseev, T. V. Alekseeva, M. Hajnos, Z. Soko�lowska, et al., “Modifications of the MineralogicalComposition and Surface Properties of Soils as Relatedto Steppe Climate Dynamics in Historical Time,” Eur.Soil Sci., 41 (13), 1424–1432 (2008).
32. T. Alekseeva, A. Alekseev, B. A. Maher, and V. Demkin,“Late Holocene Climate Reconstructions for the Rus�sian Steppe Based on Mineralogical and MagneticProperties of Buried Paleosols,” Palaeogeogr., Palaeo�climatol., Palaeoecol., 249, 103–127 (2007).
33. P. E. Biscaye, “Mineralogy and Sedimentation ofRecent Deep�Sea Clay in the Atlantic Ocean and Adja�cent Seas and Oceans,” Geol. Soc. Am. Bull., 76, 803–832 (1965).
34. D. H. Krinsley and J. C. Doornkamp, Atlas of QuartzSand Surface Textures (Cambridge Univ. Press, Cam�bridge, 1973).
35. B. A. Maher, A. Alekseev, and T. Alekseeva, “ClimateDependence of Soil Magnetism across the RussianSteppe: Significance for Use of Soil Magnetism as aPalaeoclimatic Proxy,” Quater. Sci. Rev., 21, 1571–1576 (2002).
36. B. A. Maher, A. Alekseev, and T. Alekseeva, “MagneticMineralogy of Soils across the Russian Steppe: Cli�matic Dependence of Pedogenic Magnetite Forma�tion,” Palaeogeogr., Palaeoclimatol., Palaeoecol., 201,321–341 (2003).
37. K. Mystkowski, J. Srodon, and D. K. McCarty, “Appli�cation of Evolutionary Programming to AutomaticXRD Quantitative Analysis of Clay�Bearing Rocks,”The Clay Mineral Soc. 39th Ann. Meeting, Boulder, Col�orado (2002).
38. Quaternary Climates, Environments and Magnetism,B. A. Maher and R. Thompson (Eds.) (Univ. Press,Cambridge, 1999), 390 pp.
39. G. J. Retallack, Soils of the Past: An Introduction toPaleopedology, 2nd ed. (Blackwell Science, Malden,USA, 2001), 404 pp.
40. G. J. Retallack, “Soils and Global Change in the Car�bon Cycle Over Geological Time,” Treatise onGeochemistry 5, 581–605 (2003).