Embed Size (px)
Citation preview

DOI: 10.1142/S0217979211100461
June 28, 2011 9:34 WSPC/140-IJMPB S0217979211100461
International Journal of Modern Physics BVol. 25, No. 16 (2011) 2157–2166c© World Scientific Publishing Company
PHYSICO-CHEMICAL, STRUCTURAL AND ELECTRICAL
STUDIES OF Cu Zn FERRITES SYNTHESIZED BY
NOVEL CHEMICAL ROUTE
K. S. LOHAR∗
Department of Chemistry, Shrikrishna Mahavidaylaya, Gunjoti, India
S. M. PATANGE and D. R. MANE
Department of Physics, Shrikrishna Mahavidaylaya, Gunjoti, India
SAGAR E. SHIRSATH
Department of Physics, Dr. Babasaheb Ambedkar Marathwada University, Aurangabad, India
N. D. SHINDE
P.G. Centre, S.C.S. College Omerga, India
NILESH KULKARNI
Department of Solid State Physics and Condensed Matter Physics,
Tata Institute of Fundamental Research, Mumbai, India
Received 27 April 2009Revised 2 July 2009
The physico-chemical, structural and electrical properties of zinc substituted copper fer-rites having the general formula Cu1−xZnxFe2O4 (x = 0.0 to x = 0.8) have been studiedas a function of zinc ion concentration. The sample was prepared by co-precipitationmethod from corresponding metal sulphates. X-ray diffraction patterns were used toconfirm the structure of synthesized samples. The calculated and theoretical values ofaverage lattice constant, tetrahedral bond, tetrahedral edge and unshared octahedraledge were found to increase, while the shared octahedral edge and octahedral bond de-crease as the Zn ion concentration increases. The dielectric constant (ε′) and dielectricloss tangent (tan δ) were measured at a constant frequency 1 kHz as a function of tem-perature. The dielectric constant and loss tangent were found to increase with rise intemperature. The conduction mechanism in these ferrites is discussed on the basis ofelectron exchange between Fe2+ and Fe3+ ions. The temperature dependent dc resis-tivity was carried out in the temperature range 300 to 800 K. The plots of log ρ versus103/T are linear showing two regions, corresponding to ferrimagnetic and paramagneticregions.
Keywords: Ferrites; XRD; dielectric constant.
PACS numbers: 75.50.G, 61.10.H, 78.20
∗Corresponding author.
2157
Int.
J. M
od. P
hys.
B 2
011.
25:2
157-
2166
. Dow
nloa
ded
from
ww
w.w
orld
scie
ntif
ic.c
omby
UN
IVE
RSI
TY
AT
BU
FFA
LO
on
05/1
6/13
. For
per
sona
l use
onl
y.
June 28, 2011 9:34 WSPC/140-IJMPB S0217979211100461
2158 K. S. Lohar et al.
1. Introduction
Mixed metallic oxides especially spinels having general formula MFe2O4 are very
promising material, having technologically important applications. The spinel type
ferrites are used in many electronic and magnetic devices due to their high perme-
ability and low eddy current losses.1 The CuFe2O4 is one of the ferrite formed by
substituting the Fe2+ ion in isostructural Fe3O4 by other 3d metallic ions. Such
ferrites exhibits electrical and magnetic properties applied in high frequency com-
munication devices.2 The structure of copper ferrite can be either tetragonal or
cubic depending on the concentration of copper ion that occupy the octahedral
site. The dielectric behavior is one of the most important property of ferrites which
depends upon chemical composition, preparation methods, sintering temperature,
sintering time, and metal ions doped.3,4 The study of dielectric properties such as
dielectric constant and dielectric loss tangents provides the valuable information
on the behavior of localized charge carriers, leading to better understanding of the
mechanism of dielectric polarization in zinc substituted copper ferrites.
The present work deals with synthesis of zinc substituted copper ferrites via
chemical method.
2. Experimental
The sample of Cu1−xZnxFe2O4 system (x = 0.0 to x = 0.8) was prepared by wet
chemical method.5,6 In order to obtain desired composition, stoichiometric amount
of corresponding sulphates were dissolved in distilled water and NaOH (2M) solu-
tion was added till pH becomes 11.5 with constant stirring at temperature 60◦C in
oxygen atmosphere. The precipitate was digested for 3 h at the same temperature
and then it was thoroughly washed with distilled water until it became free from
sodium ions and dried in oven. In order to determine optimal temperature, thermal
studies were performed at a heating rate of 10◦C min−1 in nitrogen atmosphere
using Setram differential thermal analyzer (Model 92/10, Lyon). The dried powder
was mixed homogeneously and annealed at 650◦C for 6 h, the sample was slowly
cooled to room temperature.
The energy dispersive spectroscopy (EDS) analysis has been carried out for all
the samples of Cu1−xZnxFe2O4 ferrites for wet (W) as well as annealed wet (AW)
samples. The X-ray patterns of the prepared samples were recorded at room tem-
perature using CuKα radiation on Jeol–JDX-8030, X-ray diffractometer, at TIFR
Mumbai. The X-ray diffraction data recorded in the range of 2θ range from 20–70◦
with scanning rate 2 degrees per minute. The DC and AC electrical resisitivites
were measured at different temperatures using two probe techniques, where sample
in disc shape was held between two copper electrodes that are connected to LCR–Q
meter (HP make, 4192). The estimated errors in measurement of resistivity were
approximately equal to 2%. In temperature variation resistivity, the cell contain-
ing sample was kept in furnace maintained at desired temperature with the help
of temperature controller and the plots of log ρ versus 103/T exhibit two regions,
Int.
J. M
od. P
hys.
B 2
011.
25:2
157-
2166
. Dow
nloa
ded
from
ww
w.w
orld
scie
ntif
ic.c
omby
UN
IVE
RSI
TY
AT
BU
FFA
LO
on
05/1
6/13
. For
per
sona
l use
onl
y.

June 28, 2011 9:34 WSPC/140-IJMPB S0217979211100461
Physico-Chemical, Structural and Electrical Studies of Cu–Zn Ferrites 2159
Table 1. Theoretical and observed percentage of element in wet (W) and annealed wet (AW) ofCu1−xZnxFe2O4 ferrites.
Observed % annealedTheoretical % Observed % wet (W) wet (AW)
Comp. x Cu Zn Fe Cu Zn Fe Cu Zn Fe
0.0 26.53 0.0 46.70 26.89 0.0 45.96 26.03 0.0 45.840.2 21.19 5.46 46.62 20.95 5.85 43.55 22.64 6.14 43.500.4 15.87 10.90 46.53 14.98 12.51 45.99 14.91 13.15 57.090.6 10.56 16.32 46.47 10.03 16.1 47.65 10.07 19.04 59.95
0.8 2.27 21.73 46.40 3.08 20.93 43.53 3.18 21.70 53.59
i.e., ferrimagnetic region (T < Tc) and paramagnetic region (T > Tc).7 The dielec-
tric constant (ε′) and dielectric loss tangent (tan δ) was obtained by measuring the
capacitance of these sample using LCR–Q meter.
3. Results and Discussion
The elemental analysis of Cu1−xZnxFe2O4 (x = 0.0 to x = 0.8) W and AW samples
were carried out by EDS method. The obtained results are represented in Table 1,
indicates theoretical and observed percentage of elements of W and annealed AW
samples containing elements Cu2+, Zn2+ and Fe3+ ions. The theoretical and ob-
served percentages of W samples are near about same indicating very small error in
preparation of W sample by co-precipitation method, due to solid-state reactions
in AW sample, the theoretical and observed percentage values of elemental analysis
do not match perfectly because of solid state reactions, which are not stoichiometric
reactions.
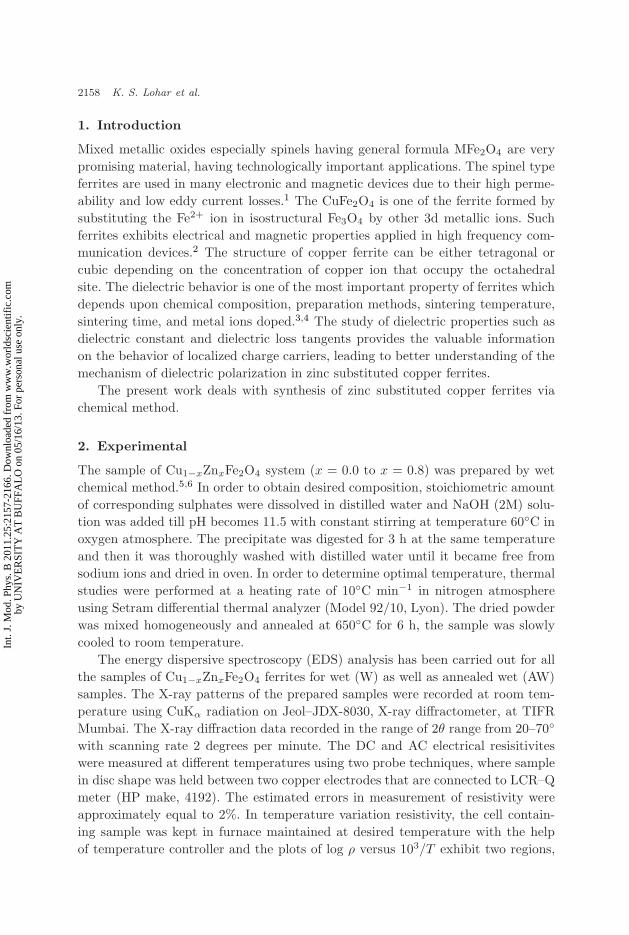
The TGA and DTA curves of all synthesized W sample are obtained and the
typical curve for sample x = 0.2 is shown in Fig. 1. From the analysis of all samples,
it is observed that all W samples loss crystalline water in the range 120–145◦C,
at temperature range 430–480◦C metal hydroxide are converted into corresponding
metal oxides and these metal oxides at temperature range 560–650◦C undergo solid-
state reaction with formation of ferrites.
The X-ray diffraction (XRD) patterns of annealed Cu1−xZnxFe2O4 (x = 0.0 to
x = 0.8) are shown in Fig. 2. The peaks obtained in XRD pattern for all samples
are indexed using Bragg’s law. For the sample at x = 0.0 i.e., CuFe2O4, all peak
values match with the standard copper ferrite peak value which confirm tetragonal
structure, this behavior is conformed by JCPDS card. The lattice parameter of
CuFe2O4 were found to be a = 8.4037 A, c = 8.8238 A nm and c/a = 1.05 A. The
JCPDS card (72-1174) gives c/a = 1.06 for CuFe2O4. The reported value ranging
between 1.01 and 1.06.8 The XRD pattern show that for samples x = 0.2 to x = 0.8
exhibit the cubic spinel structure. It is observed that Zn substituted with x = 0.2 to
0.8, the tetragonality disappear with concentration x. The values of lattice constant
“a” were determined with an accuracy ± 0.002 A. X-ray density and crystallite size
Int.
J. M
od. P
hys.
B 2
011.
25:2
157-
2166
. Dow
nloa
ded
from
ww
w.w
orld
scie
ntif
ic.c
omby
UN
IVE
RSI
TY
AT
BU
FFA
LO
on
05/1
6/13
. For
per
sona
l use
onl
y.
June 28, 2011 9:34 WSPC/140-IJMPB S0217979211100461
2160 K. S. Lohar et al.
Fig. 1. TGA and DTA curve of Cu1−xZnxFe2O4 (x = 0.2).
Fig. 2. XRD pattern of annealed samples of Cu1−xZnxFe2O4 ferrite system for x = 0.0 tox = 0.8.
are also tabulated in Table 2. It is observed that the lattice constant increases from
8.4037 to 8.4315 A with Zn2+ concentration x. The increase in lattice constant is
due to difference in ionic radii, the smaller ionic radii of Cu2+ (0.70 A) replaced by
larger Zn2+ ion (0.81 A). It is observed that X-ray densities increases from 5.349 to
5.591 gcm−3 with Zn2+ concentration x, this may be due to the fact that Zn2+ has
Int.
J. M
od. P
hys.
B 2
011.
25:2
157-
2166
. Dow
nloa
ded
from
ww
w.w
orld
scie
ntif
ic.c
omby
UN
IVE
RSI
TY
AT
BU
FFA
LO
on
05/1
6/13
. For
per
sona
l use
onl
y.

June 28, 2011 9:34 WSPC/140-IJMPB S0217979211100461
Physico-Chemical, Structural and Electrical Studies of Cu–Zn Ferrites 2161
Table 2. Lattice constant, particle size, and X-ray density of Cu1−xZnxFe2O4 ferrites.
Lattice constant (A) Particle size (nm)
Theoretical Experimental Williamson–Hall X-ray densityComp. x “ath” “a” XRD analysis (gm/cm3)
0.0 8.4103a = 8.4037
22.4 22.4 5.349c = 8.8238
0.2 8.4454 8.4120 29.2 28.2 5.4630.4 8.4805 8.4170 21.8 24.7 5.544
0.6 8.5156 8.4242 22.3 25.3 5.5640.8 8.5507 8.4315 24.5 25.1 5.591
Table 3. Cation distribution ionic radii and oxygen parameter u forCu1−xZnxFe2O4 sample.
Tetrahedral (A) Octahedral (B)Comp. x site site rA (A) rB (A) U (A)
0.0 Fe1.0 Cu1.0Fe1.0 0.670 0.685 0.3870.2 Zn0.2Fe0.8 Cu0.8Fe1.2 0.698 0.682 0.3890.4 Zn0.4Fe0.6 Cu0.6Fe1.4 0.726 0.679 0.3900.6 Zn0.6Fe0.4 Cu0.4Fe1.6 0.754 0.676 0.3920.8 Zn0.8Fe0.2 Cu0.2Fe1.8 0.782 0.673 0.394
greater atomic weight (65.39 amu) replace smaller Cu2+ (63.546 amu) and its result
increases in atomic weight with Zn contents x. The crystalline size of spinal phase
has been determined from the broadening of XRD peaks using Scherrer equation9
and Williamson-Hall plot,10 the values of both methods closely agree to each other
in the range of nm, are listed in Table 2.
Cation distribution was determined by Bertaut method selecting few pairs of
reflection according to the expression.11 The information on cation distribution is
best obtained on comparison of experimental and calculated intensity ratios for re-
flection. Table 3 shows values of cation distribution and oxygen parameter (u), the
values of oxygen parameter leads to change sub lattice until A and B site volumes
matches the radii of constituent cations. The mean ionic radius of tetrahedral A site
(rA) and octahedral B sites (rB) are calculated on the basis of cation distribution
values and using the relation12 are summarized in Table 3. It can be seen that rAvalues increases with increase in Zn content x due larger ionic radii. On the other
hand rB values decreases with increase in Zn content x as occupies A site subse-
quently. Theoretical lattice constant ath is calculated from relation13,14 to support
calculated values of rA and rB are listed in Table 2. The values of “a” theoretical
agree with observed values, which support the cation distribution estimated from
XRD. On the basis of experimental values of lattice constant and oxygen posi-
tion parameter and using relation,15 the values of tetrahedral and octahedral bond
length (dAX and dBX), tetrahedral shared and unshared octahedral edges (dAXE,
dBXE and dBXEU are calculated, using relation16,17 and represented in Fig. 3(a)
Int.
J. M
od. P
hys.
B 2
011.
25:2
157-
2166
. Dow
nloa
ded
from
ww
w.w
orld
scie
ntif
ic.c
omby
UN
IVE
RSI
TY
AT
BU
FFA
LO
on
05/1
6/13
. For
per
sona
l use
onl
y.

June 28, 2011 9:34 WSPC/140-IJMPB S0217979211100461
2162 K. S. Lohar et al.
(a)
(b)
Fig. 3. (a) Effect of Zn substitution x on tetrahedral dAX and octahedral dBX bond lengthof Cu1−xZnxFe2O4 ferrite system for x = 0.0 to x = 0.8. (b) Effect of Zn substitution x ontetrahedral dAXE, shared dBXE and unshared octahedral dBXEU edge, of Cu1−xZnxFe2O4 ferritesystem for x = 0.0 to x = 0.8.
and 3(b) as a function of Zn content x. Figure 3(a) indicates that tetrahedral bond
length (dAX) increases considerably where as octahedral bond length decreases to
small extent as Zn ions concentration increases. Figure 3(b) shows that tetrahedral
edge (dAXE) and unshared octahedral edge (dBXEU) increases where as shared oc-
tahedral edge (dBXE) decreases with increase of Zn ion this may be related to larger
radius of Zn ions as compared to Cu ions.
Int.
J. M
od. P
hys.
B 2
011.
25:2
157-
2166
. Dow
nloa
ded
from
ww
w.w
orld
scie
ntif
ic.c
omby
UN
IVE
RSI
TY
AT
BU
FFA
LO
on
05/1
6/13
. For
per
sona
l use
onl
y.

June 28, 2011 9:34 WSPC/140-IJMPB S0217979211100461
Physico-Chemical, Structural and Electrical Studies of Cu–Zn Ferrites 2163
The resistivity of the ferrites depends upon the density, porosity, grain size and
chemical composition of the sample.18 The ac and dc electrical resistivity of the
palletized sample was calculated by using two probe methods at various temper-
atures. The silver foils were used to ensure good electrical contact. The dielectric
properties of Cu–Zn ferrites were studied in temperature range 400 to 600 K at
constant frequency 1 KHz. The dielectric constant and dielectric loss tangent was
calculated by using the following formula.18
ε′ =Cd
ε0A, (1)
where d is thickness of pellet, A is the cross-section area of flat surface of the pellet,
and ε0 is free space permittivity.
tan δ =ε′
ε′′. (2)
The dielectric constant increases with increase in temperature for all samples as
shown in Fig. 4. The increase in dielectric constant with increase in temperature
is normal dielectric behavior of ferrites. This normal dielectric behavior is also ob-
served by other workers,19,20 this is due to increase of mobility of charge carriers
which increases with temperature leading to an increase in dielectric constant, be-
cause the conductivity and polarization of the same origin. Figure 5 shows a plot
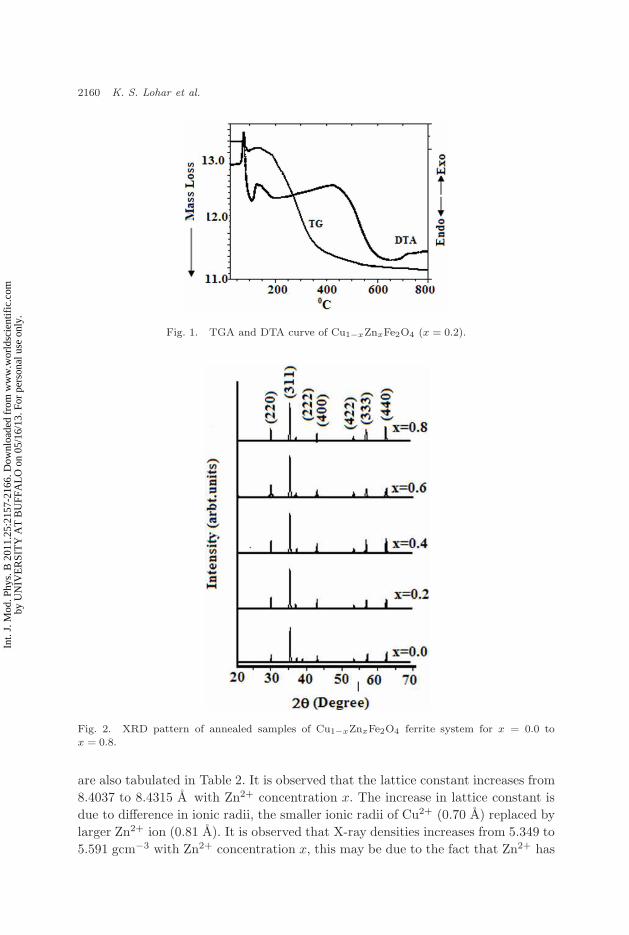
of the dielectric loss tangent tan δ versus temperature at constant frequency 1 kHz
for the investigated samples. We can see that tan δ decreases with increasing tem-
perature, similar behavior of tan δ was reported by Shinde et al.21 Conductivity in
ferrites is due to electron hopping between ions of the same element (Fe) existing in
different valence states (Fe2+ and Fe3+) on equivalent lattice sites. The dc electrical
resistivity for all the samples was measured by two probes method in a temperature
Fig. 4. Dielectric constant ε′ as a function of temperature for Cu1−xZnxFe2O4 ferrite systemfor x = 0.0 to x = 0.8.
Int.
J. M
od. P
hys.
B 2
011.
25:2
157-
2166
. Dow
nloa
ded
from
ww
w.w
orld
scie
ntif
ic.c
omby
UN
IVE
RSI
TY
AT
BU
FFA
LO
on
05/1
6/13
. For
per
sona
l use
onl
y.
June 28, 2011 9:34 WSPC/140-IJMPB S0217979211100461
2164 K. S. Lohar et al.
Fig. 5. Loss tangent (tan δ) as a function of temperature for Cu1−xZnxFe2O4 ferrite system forx = 0.0 to x = 0.8.
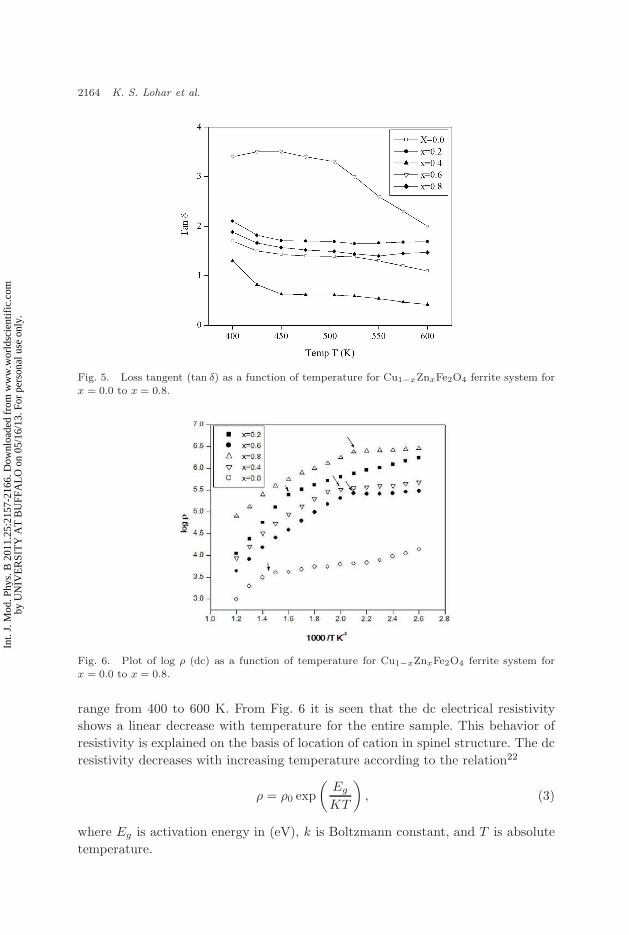
Fig. 6. Plot of log ρ (dc) as a function of temperature for Cu1−xZnxFe2O4 ferrite system forx = 0.0 to x = 0.8.
range from 400 to 600 K. From Fig. 6 it is seen that the dc electrical resistivity
shows a linear decrease with temperature for the entire sample. This behavior of
resistivity is explained on the basis of location of cation in spinel structure. The dc
resistivity decreases with increasing temperature according to the relation22
ρ = ρ0 exp
(
Eg
KT
)
, (3)
where Eg is activation energy in (eV), k is Boltzmann constant, and T is absolute
temperature.
Int.
J. M
od. P
hys.
B 2
011.
25:2
157-
2166
. Dow
nloa
ded
from
ww
w.w
orld
scie
ntif
ic.c
omby
UN
IVE
RSI
TY
AT
BU
FFA
LO
on
05/1
6/13
. For
per
sona
l use
onl
y.
June 28, 2011 9:34 WSPC/140-IJMPB S0217979211100461
Physico-Chemical, Structural and Electrical Studies of Cu–Zn Ferrites 2165
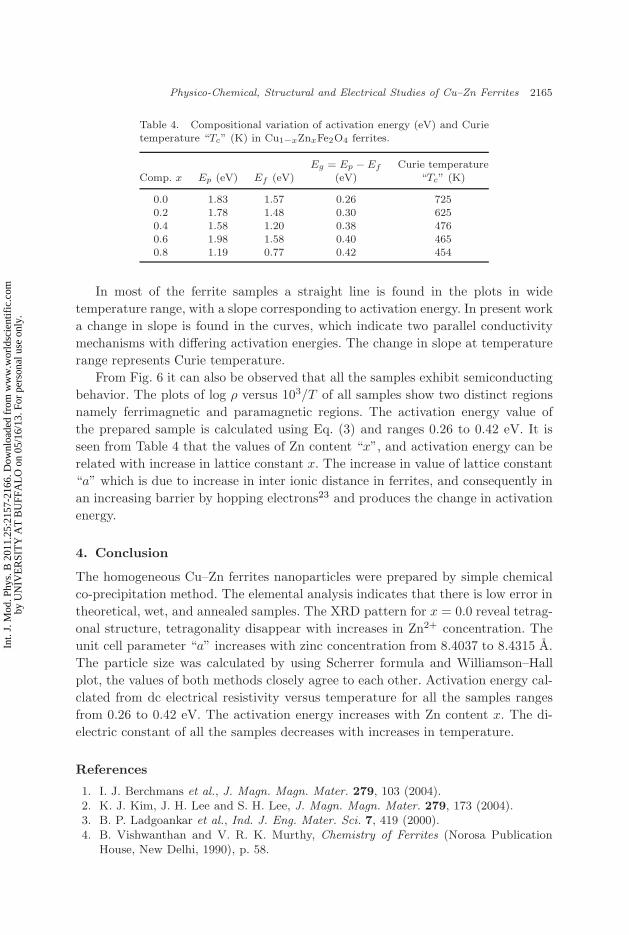
Table 4. Compositional variation of activation energy (eV) and Curietemperature “Tc” (K) in Cu1−xZnxFe2O4 ferrites.
Eg = Ep − Ef Curie temperatureComp. x Ep (eV) Ef (eV) (eV) “Tc” (K)
0.0 1.83 1.57 0.26 7250.2 1.78 1.48 0.30 6250.4 1.58 1.20 0.38 4760.6 1.98 1.58 0.40 4650.8 1.19 0.77 0.42 454
In most of the ferrite samples a straight line is found in the plots in wide
temperature range, with a slope corresponding to activation energy. In present work
a change in slope is found in the curves, which indicate two parallel conductivity
mechanisms with differing activation energies. The change in slope at temperature
range represents Curie temperature.
From Fig. 6 it can also be observed that all the samples exhibit semiconducting
behavior. The plots of log ρ versus 103/T of all samples show two distinct regions
namely ferrimagnetic and paramagnetic regions. The activation energy value of
the prepared sample is calculated using Eq. (3) and ranges 0.26 to 0.42 eV. It is
seen from Table 4 that the values of Zn content “x”, and activation energy can be
related with increase in lattice constant x. The increase in value of lattice constant
“a” which is due to increase in inter ionic distance in ferrites, and consequently in
an increasing barrier by hopping electrons23 and produces the change in activation
energy.
4. Conclusion
The homogeneous Cu–Zn ferrites nanoparticles were prepared by simple chemical
co-precipitation method. The elemental analysis indicates that there is low error in
theoretical, wet, and annealed samples. The XRD pattern for x = 0.0 reveal tetrag-
onal structure, tetragonality disappear with increases in Zn2+ concentration. The
unit cell parameter “a” increases with zinc concentration from 8.4037 to 8.4315 A.
The particle size was calculated by using Scherrer formula and Williamson–Hall
plot, the values of both methods closely agree to each other. Activation energy cal-
clated from dc electrical resistivity versus temperature for all the samples ranges
from 0.26 to 0.42 eV. The activation energy increases with Zn content x. The di-
electric constant of all the samples decreases with increases in temperature.
References
1. I. J. Berchmans et al., J. Magn. Magn. Mater. 279, 103 (2004).2. K. J. Kim, J. H. Lee and S. H. Lee, J. Magn. Magn. Mater. 279, 173 (2004).3. B. P. Ladgoankar et al., Ind. J. Eng. Mater. Sci. 7, 419 (2000).4. B. Vishwanthan and V. R. K. Murthy, Chemistry of Ferrites (Norosa Publication
House, New Delhi, 1990), p. 58.
Int.
J. M
od. P
hys.
B 2
011.
25:2
157-
2166
. Dow
nloa
ded
from
ww
w.w
orld
scie
ntif
ic.c
omby
UN
IVE
RSI
TY
AT
BU
FFA
LO
on
05/1
6/13
. For
per
sona
l use
onl
y.
June 28, 2011 9:34 WSPC/140-IJMPB S0217979211100461
2166 K. S. Lohar et al.
5. D. Pijic et al., J. Magn. Magn. Mater. 281, 353 (2004).6. M. U. Islam et al., Solid State Commun. 130, 353 (2004).7. A. Laxman et al., J. Phys. D: Appl. Phys. 38, 673 (2005).8. S. A. Mazen, Mater. Chem. Phys. 62, 131 (2000).9. B. D. Culty, Elements of X-ray Diffraction (Addison-Wesley, Reading, MA, 1956)
p. 352.10. G. K. Williamson and W. H. Hall, Acta Metall. 1, 22 (1953).11. Q.-M. Eei, J.-B. Li and Y.-J. Chan, J. Mater. Sci. 36, 5115 (2001).12. H. Ohnishi and T. Teranishi, J. Phys. Soc. Jpn. 16, 31 (1961).13. D. Ravinder, J. Appl. Phys. 75, 6121 (1994).14. A. A. Yosef et al., J. Phys. Cond. Mater. 6, 5717 (1994).15. M. A. Amir and S. F. Mansur, J. Magn. Magn. Mater. 234, 118 (2001).16. C. Arean et al., J. Matt. Sci. Lett. 9, 229 (1990).17. T. Abbas et al., Solid State Commun. 82, 710 (1992).18. S. C. Watawe et al., Int. J. Inorg. Mater. 3, 819 (2001).19. R. V. Magalaraja et al., J. Magn. Magn. Mater. 253, 56 (2002).20. D. El Kony, Egypt J. Solids 27, 285 (2004).21. S. S. Shinde and K. M. Jadhav, Mater. Lett. 37, 63 (1998).22. I. H. Gul, W. Ahmed and A. Magsood, J. Magn. Magn. Mater. 320, 270 (2008).23. A. Verma et al., Mater. Sci. Eng. B 116, 1 (�2005).
Int.
J. M
od. P
hys.
B 2
011.
25:2
157-
2166
. Dow
nloa
ded
from
ww
w.w
orld
scie
ntif
ic.c
omby
UN
IVE
RSI
TY
AT
BU
FFA
LO
on
05/1
6/13
. For
per
sona
l use
onl
y.