Embed Size (px)
Citation preview
Physicians in virtual environments — multimodalhuman–computer interaction
Christian Krapichler* , Michael Haubner, Andreas Lo¨sch,Dietrich Schuhmann, Marcus Seemann1, Karl-Hans Englmeier
GSF-National Research Center for Environment and Health, Institute of Medical Informatics & Health ServiceResearch, Ingolstadter Landstraße 1, 85764 Neuherberg Germany
Abstract
Modern tomography technologies like CT or MRI produce high-quality scans of the humananatomy. While conventional computer-aided image analysis falls back upon editing tomogramslayer by layer, virtual environments offer enhanced visualization, image analysis and manipulationof the three-dimensional data sets. In this paper, the application of multimodal, user-orientedhuman–computer interaction is presented, facilitating and accelerating work with the tomographicaldata of individual patients. Hand gesture recognition is a major component of the interface,completed by speech understanding and further units like a 6-DOF mouse or acoustic feedback.Three-dimensional image segmentation, virtual bronchoscopy and virtual angioscopy are typicalexamples that illustrate the benefits of virtual environments for the realm of medicine.q 1999Elsevier Science B.V. All rights reserved.
Keywords:Virtual reality; Man–machine communication; Human–computer interaction; Multimodal interface;Medical imaging
1. Introduction
Virtual reality (VR) can be defined as a new way of man–machine communication. Oneof its characteristics is the adaptation of displays and interaction devices to the humansenses. Stereoscopic display systems give users the impression of true spatial perception ofcomputer-generated three-dimensional images. Further, the feeling of being immersedinto the virtual environment is strengthened by devices like data gloves which allownatural and intuitive direct interaction [1].
Interacting with Computers 11 (1999) 427–452
0953-5438/99/$ - see front matterq 1999 Elsevier Science B.V. All rights reserved.PII: S0953-5438(98)00060-5
* Corresponding author. Tel.:1 49 89 3187 4455; fax:1 49 89 3187 4243.E-mail address:[email protected] (C. Krapichler)1 Department of Diagnostic Radiology, Klinikum Großhadern, Ludwig-Maximilians-University Munich,
Marchioninistraße, D-81336 Mu¨nchen, Germany.
The degree of immersion depends not only on the characteristics of each single device.Because human cognitive processes and perception build largely upon multimodality, aproper combination of different interface components results in a flow of information onseveral parallel channels and has been shown to enhance effectiveness of interaction (e.g.Refs. [2–5]). Even altering combinations of different modes or communication channelsshould be possible [6]. Those papers show that providing users concurrently with visual(graphics, images), acoustic (sound, speech) and tactile information is an important factorto enhance human–computer interaction.
Currently medicine experiences its first steps into virtual worlds, e.g. in training andeducation, therapy planning or surgery assistance (e.g. Refs. [7–10]). And in spite of somescepticism about this new technology, the expectations are high. Virtual reality broughtgreat benefits to industrial fields like architectural design or flight and driving simulations.But the requirements in the realm of medicine are quite different from those in the tradi-tional areas. This applies to the design or selection of interaction devices and trackingsystems as well as to the development of software applications [11].
In the subsequent sections, a new environment for medical image analysis ispresented. At first, the applied hardware equipment is described. After summarizingstate of the art and requirements for visualization and interaction, new methods forthose fields are presented and discussed, focusing on the tasks of human–computerinteraction.
2. Hardware equipment
Employment of high performance hardware is still an inevitable condition to meet the
C. Krapichler et al. / Interacting with Computers 11 (1999) 427–452428
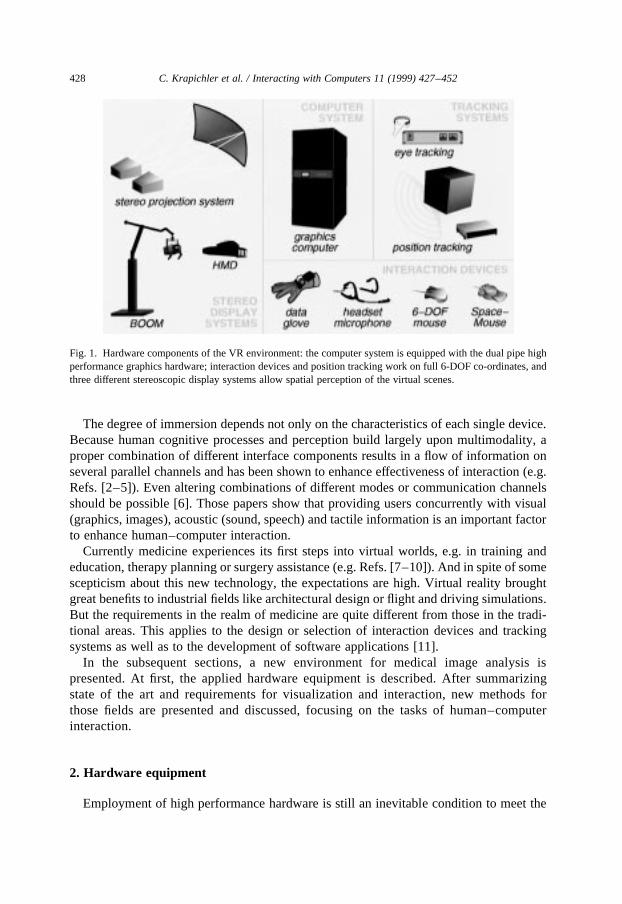
Fig. 1. Hardware components of the VR environment: the computer system is equipped with the dual pipe highperformance graphics hardware; interaction devices and position tracking work on full 6-DOF co-ordinates, andthree different stereoscopic display systems allow spatial perception of the virtual scenes.
needs of user-adequate virtual environments. The presented man–machine interface isbased upon the following hardware components, illustrated in Fig. 1, with the focus oninput–output devices:
To achieve the impression of being immersed into the virtual world and to allowcomfortable user interaction with short system reaction delays, the stereoscopicscenes have to be calculated and rendered for each eye with adequate frame ratesof at least 15 Hz. Therefore, an Onyx InfiniteReality system (Silicon Graphics, Inc.,SGI) with dual pipe configuration is used to generate the virtual worlds. Threedifferent stereoscopic display systems can be used concurrently for a stereoscopicvisualization of the virtual scenes. The BOOM 3C (Binocular Omni-OrientationMonitor, Fakespace Inc.) is a head-coupled stereoscopic colour display with twocathode ray tubes (CRTs). A rocker switch and a joystick-like button can be usedfor further user interaction [12]. The user can walk around within a limited cruisingradius and look at the virtual scene from every perspective. The Datavisor 10X (n-Vision, Inc.) is a head mounted display (HMD) with see-through option. This high-resolution colour stereo display offers simultaneous sight on the virtual and the realenvironment, known as augmented reality. For a larger group of protagonists andspectators, a stereo projection system with two video beamers (NEC PG9000G) isused. It is equipped with perpendicularly oriented polarizing filters. Wearing spec-tacles with adequately oriented polarizing foils, each viewer is able to perceive astereoscopic colour image.
Several devices are supplied for the interaction with the virtual world. TheSpaceMouse (SpaceControl GmbH) is a desktop-based device. It offers an opto-electronically tracked control ball which can be swivelled, twisted and moved in allspatial directions to influence translation and rotation coordinates. Additional inter-action is possible with eight user-definable buttons. A three-button 6-DOF mouse(Ascension Technology Corp.) allows some basic user interaction and navigation. Itis tracked magnetically with the Flock of Birds system described later. A headsetmicrophone (Shure SM10A) is used for speech input. Further, users can interactwith the virtual world via hand gestures. Five sensors of the optical fibre based 5thGlove (Fifth Dimension Technologies, Inc., 5DT) determine the flexion of eachfinger.
To be able to calculate the correct perspective of the virtual scene, all usermotions have to be determined. The BOOM system provides the application withinformation about the location and orientation of the display relative to the initialstate. Spatial positions of HMD, data glove and three-dimensional (3D) mouse aretracked simultaneously with the pulsed DC magnetic field of the modular Flock ofBirds system (Ascension Technology Corp.). The extended range transmitter allowsusers to move within a radius of about three meters. For each device, a dedicatedreceiver provides the application software with information about its position andorientation in relation to the transmitter. Additionally, eye positions can be deter-mined with the electro-oculography (EOG) feature of the BioMuse system(BioControl Systems, Inc.) which supplies four digital data streams with informa-tion about horizontal and vertical components of the position of each eye (see Ref.[13]).
C. Krapichler et al. / Interacting with Computers 11 (1999) 427–452 429
3. State of the art
Within the fields of training and education in medicine, most virtual environments relyon pregenerated databases of anatomical models (e.g. from the Virtual Human [14]),where the time-consuming image analysis has to be done only once [7]. Our approachis intended to support the daily clinical work, where the image processing has to beperformed for individual patients. This means that in addition to enhancements in visua-lization, simulation and interaction by methods of virtual reality, the system has toimprove the entire process of 3D image analysis.
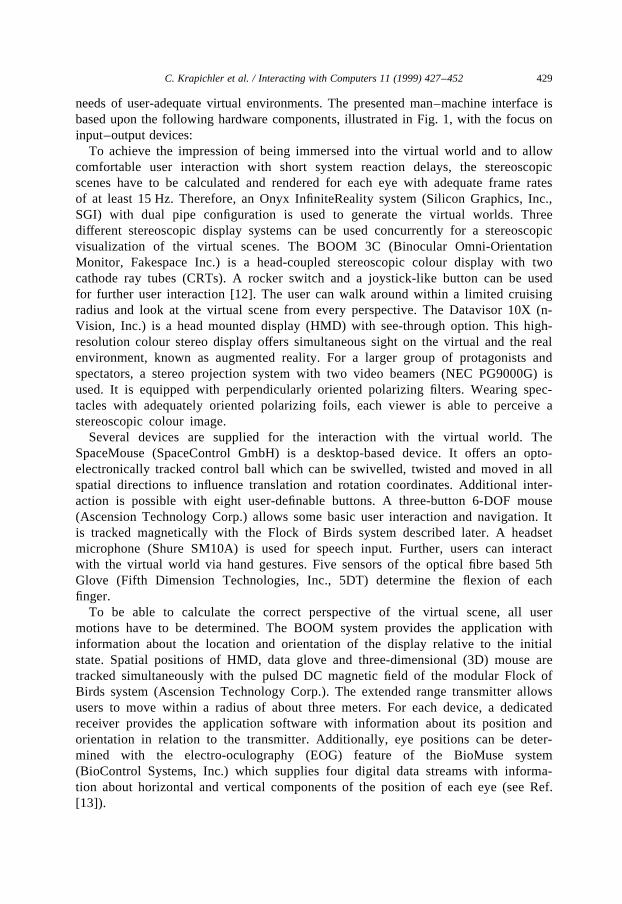
Starting point for image processing and prerequisite for the virtual environment is astack of two-dimensional radiological greyscale images (Fig. 2), acquired by modern 3Dscanning technologies like computed X-ray tomography (CT), magnetic resonanceimaging (MRI) or positron emission tomography (PET). Today’s conventional two-dimensional (2D) image processing systems are based upon editing all the single layersof those image stacks. Inspecting, manipulating and analysing the sequences in such a waycan be rather slow. On the other hand, there are no VR applications available which allowto process such stacks of discrete greyvalue images directly. This is primarily due to thefact that most known volume rendering techniques rely on extensive CPU calculations.They offer real-time volume rendering only on massively parallel systems, as the quantityof image data can be extraordinarily high in medical applications. This applies to thenumber of volume rendered voxels as well as to the number of surface rendered polygons.Hence, an essential system condition is the achievement of sufficiently high frame ratesand minimum time delays between user actions and corresponding system feedback toavoid simulator sickness (see Refs. [15,16]) and to increase usability and acceptance of thevirtual environment (see Refs. [17–20]).
C. Krapichler et al. / Interacting with Computers 11 (1999) 427–452430
Fig. 2. Different representations of tomographical images: left, image acquisition with three examples of modern3D scanning systems; centre, representation of the resulting dataset as a of stack of 2D images; right, displayingthose data conventionally as a sequence of 2D images versus volume rendered 3D visualization in VR.
3.1. Visualization
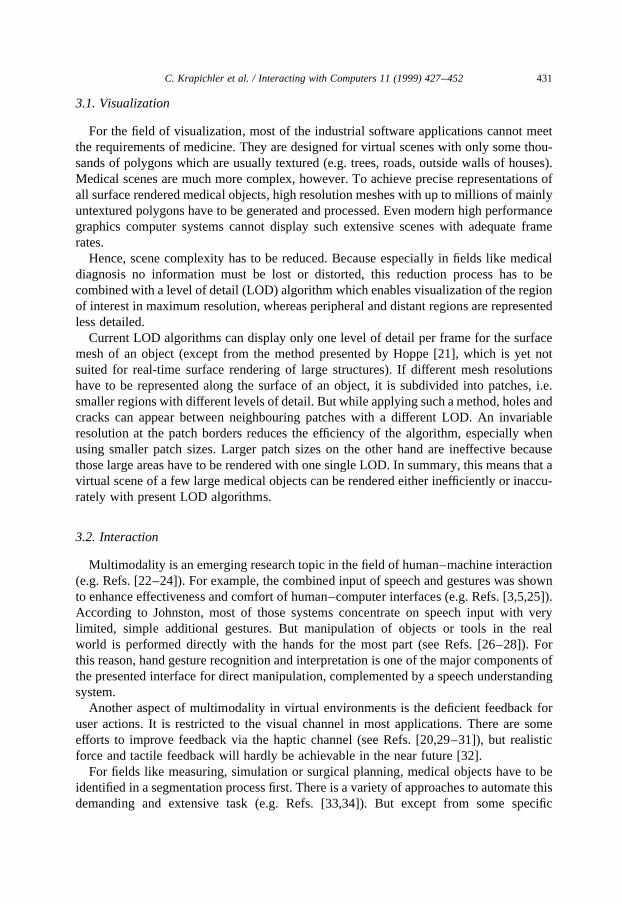
For the field of visualization, most of the industrial software applications cannot meetthe requirements of medicine. They are designed for virtual scenes with only some thou-sands of polygons which are usually textured (e.g. trees, roads, outside walls of houses).Medical scenes are much more complex, however. To achieve precise representations ofall surface rendered medical objects, high resolution meshes with up to millions of mainlyuntextured polygons have to be generated and processed. Even modern high performancegraphics computer systems cannot display such extensive scenes with adequate framerates.
Hence, scene complexity has to be reduced. Because especially in fields like medicaldiagnosis no information must be lost or distorted, this reduction process has to becombined with a level of detail (LOD) algorithm which enables visualization of the regionof interest in maximum resolution, whereas peripheral and distant regions are representedless detailed.
Current LOD algorithms can display only one level of detail per frame for the surfacemesh of an object (except from the method presented by Hoppe [21], which is yet notsuited for real-time surface rendering of large structures). If different mesh resolutionshave to be represented along the surface of an object, it is subdivided into patches, i.e.smaller regions with different levels of detail. But while applying such a method, holes andcracks can appear between neighbouring patches with a different LOD. An invariableresolution at the patch borders reduces the efficiency of the algorithm, especially whenusing smaller patch sizes. Larger patch sizes on the other hand are ineffective becausethose large areas have to be rendered with one single LOD. In summary, this means that avirtual scene of a few large medical objects can be rendered either inefficiently or inaccu-rately with present LOD algorithms.
3.2. Interaction
Multimodality is an emerging research topic in the field of human–machine interaction(e.g. Refs. [22–24]). For example, the combined input of speech and gestures was shownto enhance effectiveness and comfort of human–computer interfaces (e.g. Refs. [3,5,25]).According to Johnston, most of those systems concentrate on speech input with verylimited, simple additional gestures. But manipulation of objects or tools in the realworld is performed directly with the hands for the most part (see Refs. [26–28]). Forthis reason, hand gesture recognition and interpretation is one of the major components ofthe presented interface for direct manipulation, complemented by a speech understandingsystem.
Another aspect of multimodality in virtual environments is the deficient feedback foruser actions. It is restricted to the visual channel in most applications. There are someefforts to improve feedback via the haptic channel (see Refs. [20,29–31]), but realisticforce and tactile feedback will hardly be achievable in the near future [32].
For fields like measuring, simulation or surgical planning, medical objects have to beidentified in a segmentation process first. There is a variety of approaches to automate thisdemanding and extensive task (e.g. Refs. [33,34]). But except from some specific
C. Krapichler et al. / Interacting with Computers 11 (1999) 427–452 431
solutions, interaction of human experts is still a necessary precondition. Hence, thepresented system aims at a human-oriented handling of the entire imaging environment.The technical details have to be pushed into the background, allowing physicians toconcentrate on the medical questions and problems.
Therefore, it is important to facilitate and speed up this work by modern means ofhuman–machine interaction: virtual environments enable spatial perception and manip-ulation of both surface- and volume-rendered three-dimensional data. Thus, the 3D natureof the acquired images can be utilized, the often laborious and ineffective work on two-dimensional slices is abandoned. Further, new interaction devices and methods have to beoffered which allow to recognize and interpret human actions and gestures and to trans-form them into corresponding manipulations of the virtual scene. Both implies that opera-tions in three dimensions with six degrees of freedom (6-DOF) have to be possible.Restrictions to two dimensions have been shown to limit and slow down user interaction,e.g. natural gesture-based interaction [3] and search tasks [35].
4. Methods
The presented methods allow the generation of and interaction with the virtual world.As this paper is concentrating on the field of interaction, there is only a brief description ofvisualization methods which can be found more detailed in Haubner [36].
4.1. Visualization
To meet the aforementioned demands and requirements of visualization, we introduced
C. Krapichler et al. / Interacting with Computers 11 (1999) 427–452432
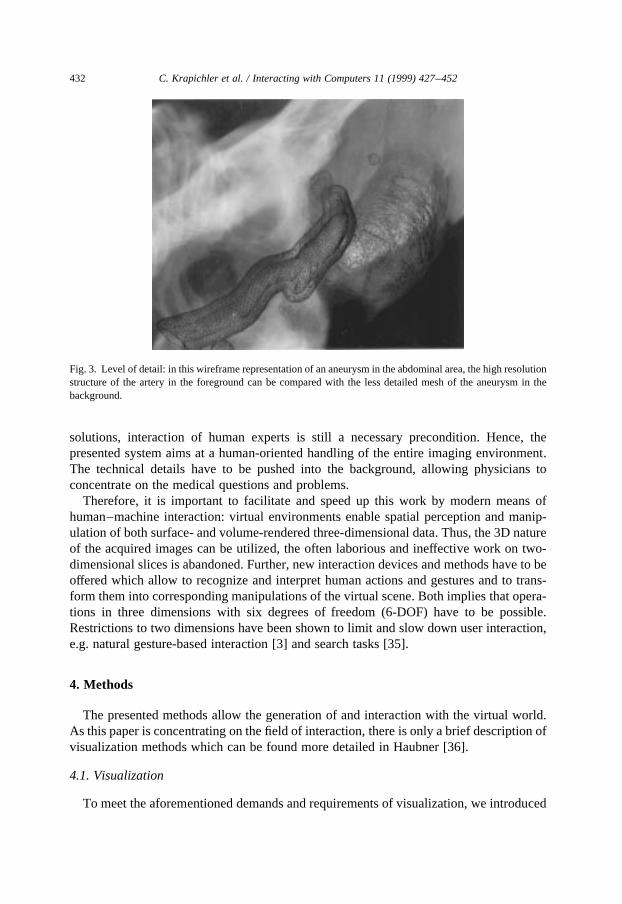
Fig. 3. Level of detail: in this wireframe representation of an aneurysm in the abdominal area, the high resolutionstructure of the artery in the foreground can be compared with the less detailed mesh of the aneurysm in thebackground.
a new level of detail (LOD) algorithm to reduce the number of displayed polygons withoutvisible loss of accuracy, and applied new volume rendering methods using volume texturemapping. In combination with powerful graphics hardware [37], this is currently the onlyway to enable real-time 3D visualization of the tomographical data for diagnosis andtherapy planning purposes.
An algorithm was developed which allows several different levels of detail for eachobject of the scene and even simultaneously within the same object (Fig. 3). With thisalgorithm, it is possible to render the virtual scene efficiently and accurately, as demandedpreviously. A hierarchical data representation stores the steps of a simplification algo-rithm. Thus, the object approximations can be partially refined during the renderingprocess. The root node of the data structure represents the whole object in minimumresolution, whereas the leaf nodes contain the surface in highest accuracy. In the innertree structure, each node represents exactly the same part of the object surface as all of itsdescendants, with increasing accuracy towards the leaves. This method makes it possibleto display various levels of detail within each object concurrently in each rendering frame,without inaccuracies due to cracks and holes. Further details of the algorithm can be foundin Haubner [36].
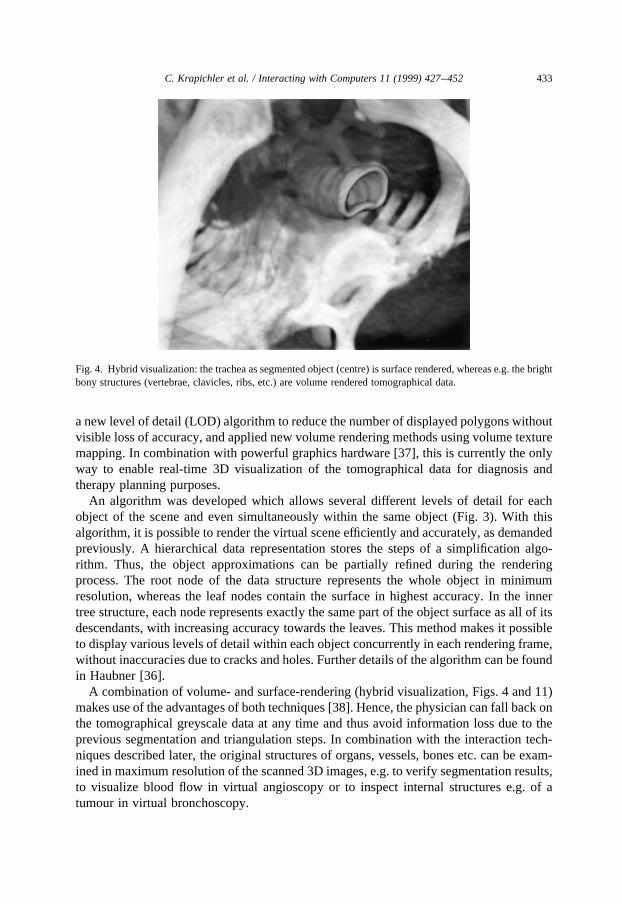
A combination of volume- and surface-rendering (hybrid visualization, Figs. 4 and 11)makes use of the advantages of both techniques [38]. Hence, the physician can fall back onthe tomographical greyscale data at any time and thus avoid information loss due to theprevious segmentation and triangulation steps. In combination with the interaction tech-niques described later, the original structures of organs, vessels, bones etc. can be exam-ined in maximum resolution of the scanned 3D images, e.g. to verify segmentation results,to visualize blood flow in virtual angioscopy or to inspect internal structures e.g. of atumour in virtual bronchoscopy.
C. Krapichler et al. / Interacting with Computers 11 (1999) 427–452 433
Fig. 4. Hybrid visualization: the trachea as segmented object (centre) is surface rendered, whereas e.g. the brightbony structures (vertebrae, clavicles, ribs, etc.) are volume rendered tomographical data.
4.2. Interaction
Besides of those advanced visualization techniques, the human–machine interface hasto provide proper capabilities and tools for image analysis and 3D interaction. And in spiteof the desired variety of features, it has to be convenient to use. The presented virtualenvironment offers a variety of gesture-controlled tools and user-adequate interaction.
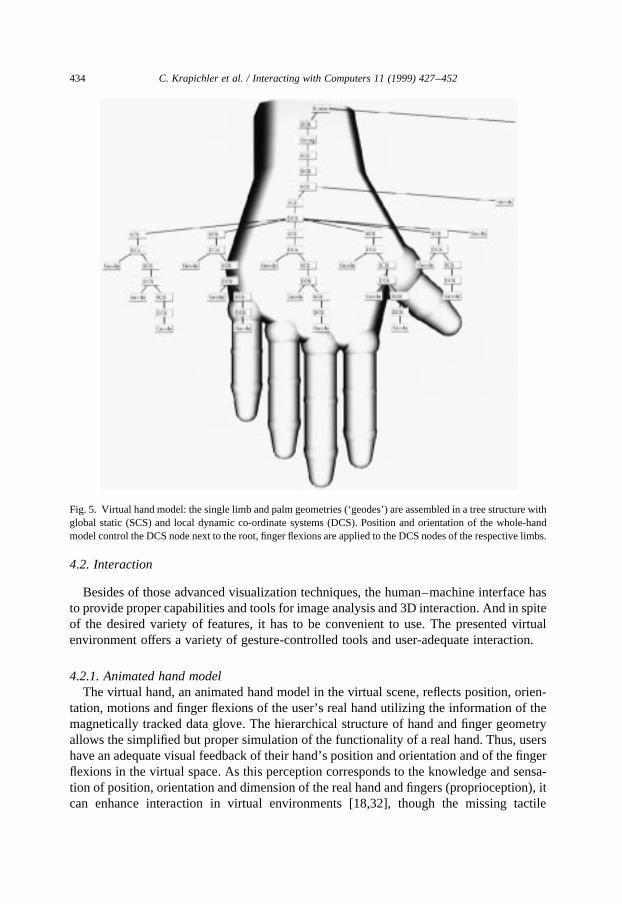
4.2.1. Animated hand modelThe virtual hand, an animated hand model in the virtual scene, reflects position, orien-
tation, motions and finger flexions of the user’s real hand utilizing the information of themagnetically tracked data glove. The hierarchical structure of hand and finger geometryallows the simplified but proper simulation of the functionality of a real hand. Thus, usershave an adequate visual feedback of their hand’s position and orientation and of the fingerflexions in the virtual space. As this perception corresponds to the knowledge and sensa-tion of position, orientation and dimension of the real hand and fingers (proprioception), itcan enhance interaction in virtual environments [18,32], though the missing tactile
C. Krapichler et al. / Interacting with Computers 11 (1999) 427–452434
Fig. 5. Virtual hand model: the single limb and palm geometries (‘geodes’) are assembled in a tree structure withglobal static (SCS) and local dynamic co-ordinate systems (DCS). Position and orientation of the whole-handmodel control the DCS node next to the root, finger flexions are applied to the DCS nodes of the respective limbs.
feedback restricts the impression of presence in the virtual world [31]. Further, restrictinggestures to only a single hand or finger motion is uncomfortable for users [3]. Hence,simulation of the full hand functionality is regarded as advantageous to the presentedenvironment.
The finger limbs and the palm are assembled in a tree structure shown in Fig. 5. Thestatic coordinate systems (SCS) provide information about the global position of subse-quent limb geometries in the initial state, and the local dynamic coordinate systems (DCS)are used to apply the current flexion information to the finger limbs and the position andorientation of the real hand to the virtual model as a whole. Hence, each finger limb can berotated in its local coordinate system with one degree of freedom and within predefinedminimum and maximum values, corresponding to anatomical limitations [27]. Measuredglove flexions are normalized and transformed to corresponding limb rotations, whiletracking values are transformed to the coordinate system of the virtual world and deter-mine position and orientation of the entire hand model in the virtual space.
4.2.2. Hand gesture recognitionHand gesture recognition in multimodal human–computer interfaces has been shown to
be very effective compared with e.g. speech recognition if applied to perform spatial tasksor direct object manipulation and selection [2,3,5,25]). Hence, a set of hand gestures isimplemented to offer such interaction tasks (e.g. select, grasp, release, accelerate, stop).
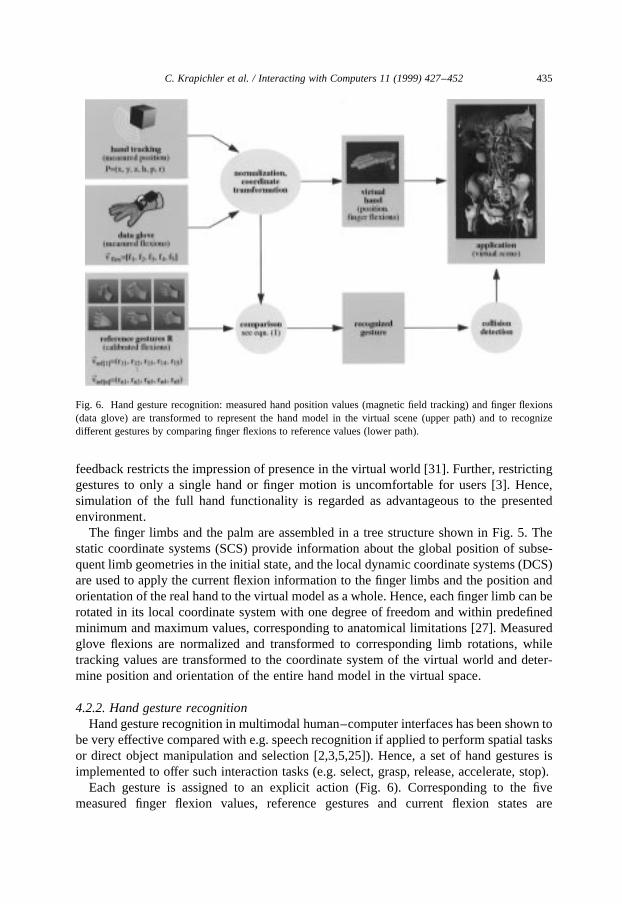
Each gesture is assigned to an explicit action (Fig. 6). Corresponding to the fivemeasured finger flexion values, reference gestures and current flexion states are
C. Krapichler et al. / Interacting with Computers 11 (1999) 427–452 435
Fig. 6. Hand gesture recognition: measured hand position values (magnetic field tracking) and finger flexions(data glove) are transformed to represent the hand model in the virtual scene (upper path) and to recognizedifferent gestures by comparing finger flexions to reference values (lower path).
represented as five-dimensional vectors. Global reference gestures are explicitly definedand stored as a dynamic list R. Calibration is done by repeatedly opening (flat hand) andclosing (fist) the hand for some seconds. The measured minimum and maximum values ofeach finger are transformed to a range of [0.0; 1.0] and stored, so calibration has not to beperformed after each system start. In an earlier version of the system, each referencegesture was calibrated separately. The required time for calibration was quite long(,1 min) compared with the duration of the calibration task in this version (,5 s) andwas reported by users to be rather cumbersome.
For applications like sign language translation [39,40], some dozens of differentgestures have to be recognized, commonly using neural networks. As mentioned earlier,in our application hand gestures should be used mainly for spatial or direct interaction.Hence, the set of required gestures is quite small compared with application fields like signlanguage. This has two major advantages compared with the use of e.g. neural networks:on the one hand, gesture recognition is less complex and costly, but nevertheless leading tostable and reliable results. On the other hand, users do not need special training to use theinterface.
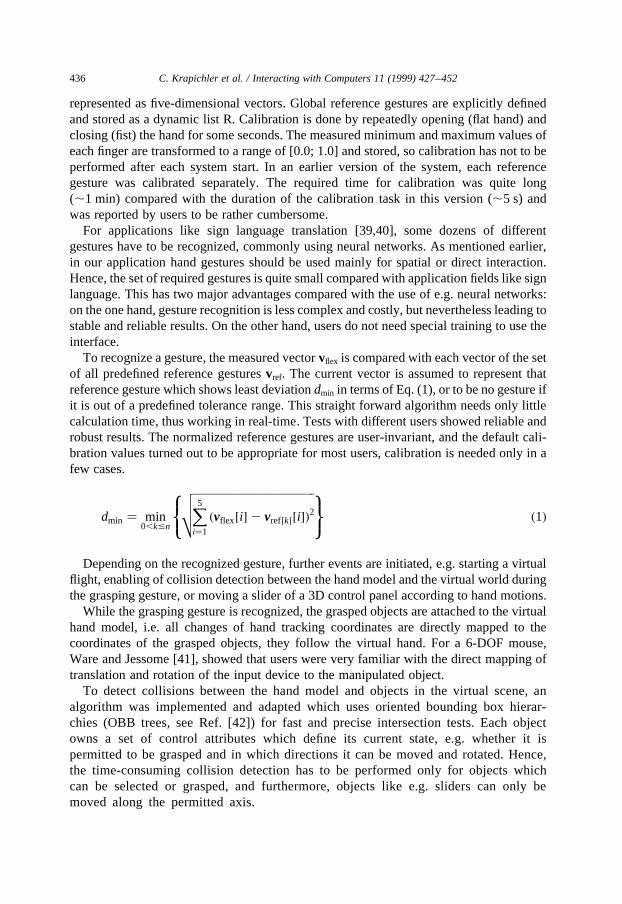
To recognize a gesture, the measured vectorvflex is compared with each vector of the setof all predefined reference gesturesvref. The current vector is assumed to represent thatreference gesture which shows least deviationdmin in terms of Eq. (1), or to be no gesture ifit is out of a predefined tolerance range. This straight forward algorithm needs only littlecalculation time, thus working in real-time. Tests with different users showed reliable androbust results. The normalized reference gestures are user-invariant, and the default cali-bration values turned out to be appropriate for most users, calibration is needed only in afew cases.
dmin � min0,k#n
����������������������������X5i�1
�vflex�i�2 vref�k��i��2vuut8<:
9=; �1�
Depending on the recognized gesture, further events are initiated, e.g. starting a virtualflight, enabling of collision detection between the hand model and the virtual world duringthe grasping gesture, or moving a slider of a 3D control panel according to hand motions.
While the grasping gesture is recognized, the grasped objects are attached to the virtualhand model, i.e. all changes of hand tracking coordinates are directly mapped to thecoordinates of the grasped objects, they follow the virtual hand. For a 6-DOF mouse,Ware and Jessome [41], showed that users were very familiar with the direct mapping oftranslation and rotation of the input device to the manipulated object.
To detect collisions between the hand model and objects in the virtual scene, analgorithm was implemented and adapted which uses oriented bounding box hierar-chies (OBB trees, see Ref. [42]) for fast and precise intersection tests. Each objectowns a set of control attributes which define its current state, e.g. whether it ispermitted to be grasped and in which directions it can be moved and rotated. Hence,the time-consuming collision detection has to be performed only for objects whichcan be selected or grasped, and furthermore, objects like e.g. sliders can only bemoved along the permitted axis.
C. Krapichler et al. / Interacting with Computers 11 (1999) 427–452436
4.2.3. Speech understandingAs already discussed earlier, speech input in combination with gesture recognition can
enhance human–computer interaction. Hand gestures are well-suited to support directmanipulation tasks, but there are several other tasks and actions (e.g. assigning of materialproperties, switching objects or tools on/off) which cannot be performed with handgestures in a direct way.
For a lot of those fields, speech is the preferred input modality. Speech input can be usedwithout visual information, it leaves hands and eyes free, and it needs no special training,as we implemented a system for speaker-independent natural language understanding[43]. Further, Lai and Vergo [44], and Dillon and Norcio [45], showed that the acceptanceof speech recognition in specific medical application fields was rather high, and the levelof experience with speech understanding systems even increased this factor.
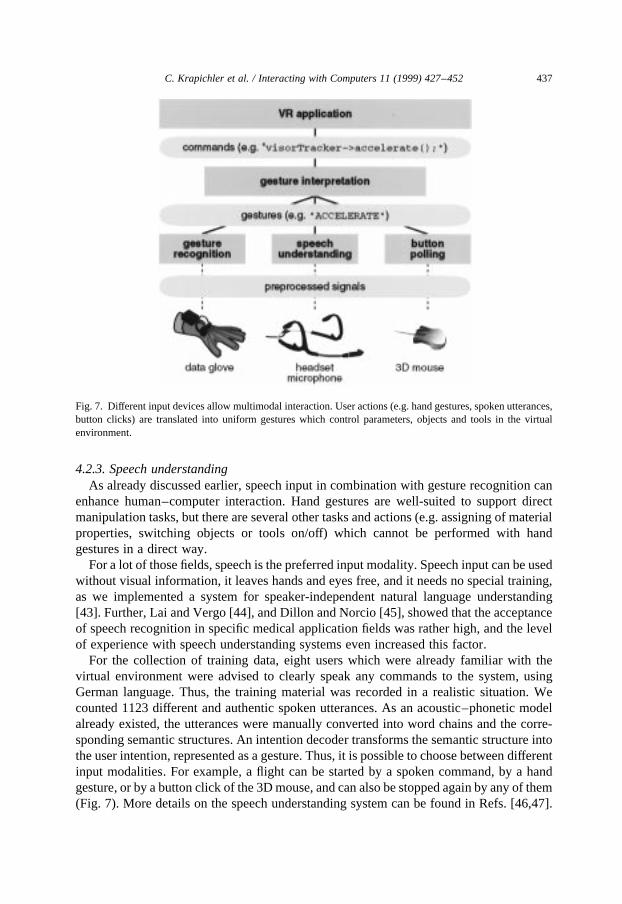
For the collection of training data, eight users which were already familiar with thevirtual environment were advised to clearly speak any commands to the system, usingGerman language. Thus, the training material was recorded in a realistic situation. Wecounted 1123 different and authentic spoken utterances. As an acoustic–phonetic modelalready existed, the utterances were manually converted into word chains and the corre-sponding semantic structures. An intention decoder transforms the semantic structure intothe user intention, represented as a gesture. Thus, it is possible to choose between differentinput modalities. For example, a flight can be started by a spoken command, by a handgesture, or by a button click of the 3D mouse, and can also be stopped again by any of them(Fig. 7). More details on the speech understanding system can be found in Refs. [46,47].
C. Krapichler et al. / Interacting with Computers 11 (1999) 427–452 437
Fig. 7. Different input devices allow multimodal interaction. User actions (e.g. hand gestures, spoken utterances,button clicks) are translated into uniform gestures which control parameters, objects and tools in the virtualenvironment.
4.2.4. Acoustic feedbackAs already pointed out, force and tactile feedback is missing in most current VR
applications, system response is usually restricted to visual information. While the predo-minant visual channel is limited to a smaller area of focus, audio signals can be perceivedfrom all the world around us, also from visually hidden regions. Following the idea ofmultimodality, the combination of visual and acoustic information can be both redundantand complementary. Brewster [48] showed the effectiveness of an auditory-enhancedscrollbar in terms of working speed and user preference and recommended the comple-mentary use of auditory feedback for hidden information. Using a rule-based system ofso-called earcons, Brewster et al. [49] could prove an enhanced navigation through ahierarchical menu structure, with a quite high recall rate (81.5%). Users could also assignnew earcons to menu items, according to the quality of the earcon in terms of rhythm,pitch, timbre, intensity or register.
The presented environment provides users with stereo sound as an acoustic feedback.Certain user actions are accompanied by different sounds, e.g. opening and closing a 3Dcontrol panel, pressing a button, moving a slider or taking a snapshot of the virtual scene.The location of the acting object (control panel, button, etc.) is regarded as sound source.According to the current user position and orientation (head tracking information), thestereoscopic sound is determined by calculating the different volumes and run times foreach ear. Though it cannot compensate deficient tactile or force feedback, it proved to be auseful compensation, a valuable complementary source of information, and it can supportthe orientation in the virtual world, because specific events can be located acoustically,even if they are hidden visually.
4.2.5. Additional interaction devicesThe natural human ‘devices’ to perform gestures for direct manipulation of objects, like
grasping or selecting, are our hands. But button clicks of e.g. the SpaceMouse or the 3Dmouse can be defined as gestures, too. As shown earlier, even spoken commands can betransformed to produce a gesture. This flexibility allows to work with the interface indifferent configurations.
For example, the 3D mouse can be used to substitute the glove, with quite restrictedfeatures though, or to support it as an additional device: the right hand wears the data glovewhile the left hand holds the 3D mouse and controls e.g. visualization parameters, flightnavigation, scene snapshots or additional tools.
Because the SpaceMouse is desktop-based, it is not suitable for operation in combina-tion with the BOOM or the HMD. But it is well suited to control navigation through thescene in combination with a monitor or the stereo projection system.
For some basic operations, picking and moving objects with the regular 2D mouse andinput of keyboard commands is possible as well. But as in this case interaction is veryrestricted and 2D motions have to be translated into the 3D world, usage of those two inputdevices should be avoided [3].
There are two ways of applying eye movements to virtual environments: active controlor manipulation, where users have to move their eyes in a specific manner to achieve thedesired results like moving objects in the scene, or passive control, where eye movementsare evaluated in the background and the user does not notice any effects or system
C. Krapichler et al. / Interacting with Computers 11 (1999) 427–452438
reactions. Controlling objects actively with the eyes is not a natural way of interaction andrequires some training and concentration. Hence, we preferred passive evaluation of eyepositions. Eye movements can influence the scene representation: the visual focus can beused as parameter for the level-of-detail algorithm mentioned earlier, reducing overallscene complexity and achieving higher frame rates without a noticeable reduction of sceneaccuracy.
4.2.6. NavigationThe easiest way to navigate through the scene is to walk around. Head tracking infor-
mation is used to calculate the current spatial position and viewing direction whichdetermines the perspective of the virtual scene for the next frame. Users do not have tolearn this form of navigation, and the vestibular system receives a stimulation correspond-ing to the perceived stereoscopic image, if the frame rate and update frequency of thetracking system are adequately high (see Ref. [15] for further discussion).
Because of the limited tracking range, the action radius of this form of navigation isrestricted. But the scaling factor of the virtual world can be controlled on-line with thecontrol panel presented later. Users can scale down the virtual scene until it is smallenough to have each object within arm’s reach.
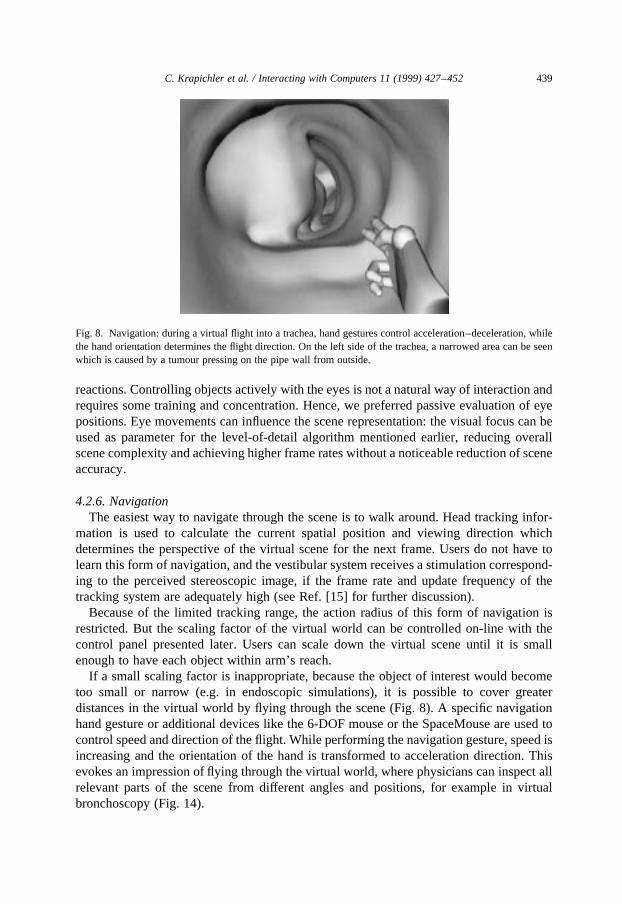
If a small scaling factor is inappropriate, because the object of interest would becometoo small or narrow (e.g. in endoscopic simulations), it is possible to cover greaterdistances in the virtual world by flying through the scene (Fig. 8). A specific navigationhand gesture or additional devices like the 6-DOF mouse or the SpaceMouse are used tocontrol speed and direction of the flight. While performing the navigation gesture, speed isincreasing and the orientation of the hand is transformed to acceleration direction. Thisevokes an impression of flying through the virtual world, where physicians can inspect allrelevant parts of the scene from different angles and positions, for example in virtualbronchoscopy (Fig. 14).
C. Krapichler et al. / Interacting with Computers 11 (1999) 427–452 439
Fig. 8. Navigation: during a virtual flight into a trachea, hand gestures control acceleration–deceleration, whilethe hand orientation determines the flight direction. On the left side of the trachea, a narrowed area can be seenwhich is caused by a tumour pressing on the pipe wall from outside.
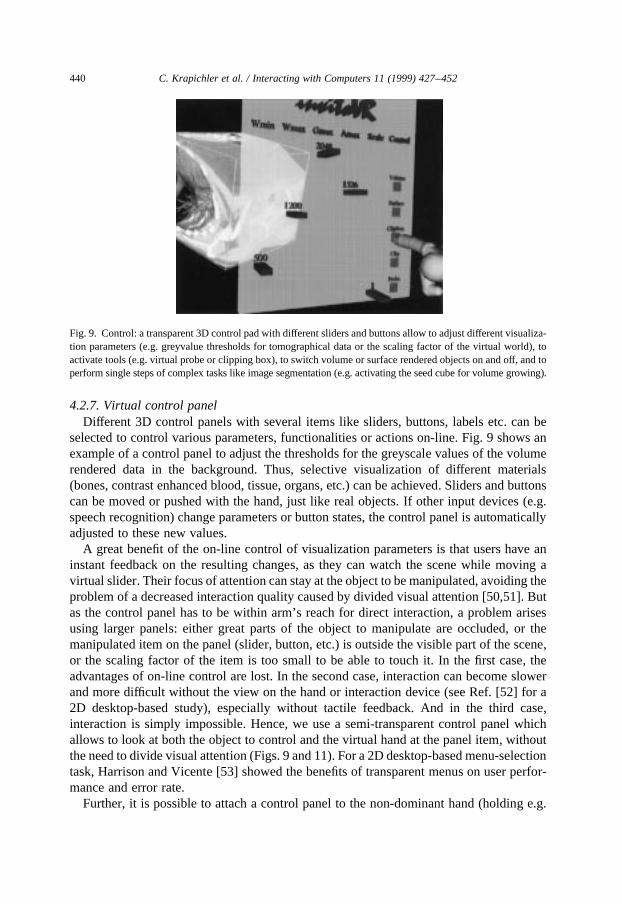
4.2.7. Virtual control panelDifferent 3D control panels with several items like sliders, buttons, labels etc. can be
selected to control various parameters, functionalities or actions on-line. Fig. 9 shows anexample of a control panel to adjust the thresholds for the greyscale values of the volumerendered data in the background. Thus, selective visualization of different materials(bones, contrast enhanced blood, tissue, organs, etc.) can be achieved. Sliders and buttonscan be moved or pushed with the hand, just like real objects. If other input devices (e.g.speech recognition) change parameters or button states, the control panel is automaticallyadjusted to these new values.
A great benefit of the on-line control of visualization parameters is that users have aninstant feedback on the resulting changes, as they can watch the scene while moving avirtual slider. Their focus of attention can stay at the object to be manipulated, avoiding theproblem of a decreased interaction quality caused by divided visual attention [50,51]. Butas the control panel has to be within arm’s reach for direct interaction, a problem arisesusing larger panels: either great parts of the object to manipulate are occluded, or themanipulated item on the panel (slider, button, etc.) is outside the visible part of the scene,or the scaling factor of the item is too small to be able to touch it. In the first case, theadvantages of on-line control are lost. In the second case, interaction can become slowerand more difficult without the view on the hand or interaction device (see Ref. [52] for a2D desktop-based study), especially without tactile feedback. And in the third case,interaction is simply impossible. Hence, we use a semi-transparent control panel whichallows to look at both the object to control and the virtual hand at the panel item, withoutthe need to divide visual attention (Figs. 9 and 11). For a 2D desktop-based menu-selectiontask, Harrison and Vicente [53] showed the benefits of transparent menus on user perfor-mance and error rate.
Further, it is possible to attach a control panel to the non-dominant hand (holding e.g.
C. Krapichler et al. / Interacting with Computers 11 (1999) 427–452440
Fig. 9. Control: a transparent 3D control pad with different sliders and buttons allow to adjust different visualiza-tion parameters (e.g. greyvalue thresholds for tomographical data or the scaling factor of the virtual world), toactivate tools (e.g. virtual probe or clipping box), to switch volume or surface rendered objects on and off, and toperform single steps of complex tasks like image segmentation (e.g. activating the seed cube for volume growing).
the 3D mouse), while the interaction is done by the dominant hand (usually equipped withthe data glove). Thus, we exploit the advantages of two-handed input: as studies on motorbehaviour showed [54], the preferred hand is moving relative to a coordinate system fixedto the non-dominant hand and is able to act in a finer resolution of motions. These resultswere confirmed by most users of our application, reporting that the quality of e.g. theadjustment of a virtual slider was improved by two-handed operation.
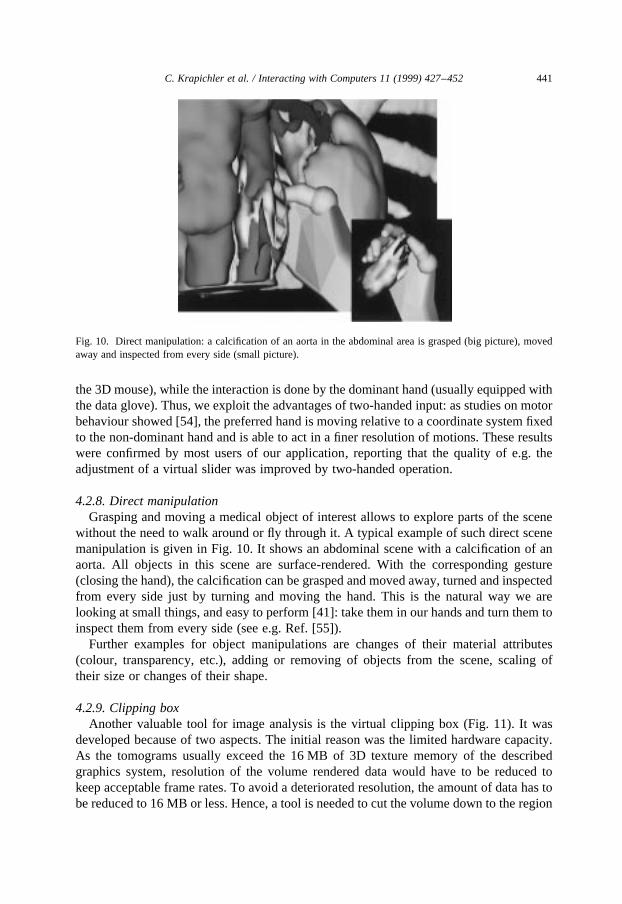
4.2.8. Direct manipulationGrasping and moving a medical object of interest allows to explore parts of the scene
without the need to walk around or fly through it. A typical example of such direct scenemanipulation is given in Fig. 10. It shows an abdominal scene with a calcification of anaorta. All objects in this scene are surface-rendered. With the corresponding gesture(closing the hand), the calcification can be grasped and moved away, turned and inspectedfrom every side just by turning and moving the hand. This is the natural way we arelooking at small things, and easy to perform [41]: take them in our hands and turn them toinspect them from every side (see e.g. Ref. [55]).
Further examples for object manipulations are changes of their material attributes(colour, transparency, etc.), adding or removing of objects from the scene, scaling oftheir size or changes of their shape.
4.2.9. Clipping boxAnother valuable tool for image analysis is the virtual clipping box (Fig. 11). It was
developed because of two aspects. The initial reason was the limited hardware capacity.As the tomograms usually exceed the 16 MB of 3D texture memory of the describedgraphics system, resolution of the volume rendered data would have to be reduced tokeep acceptable frame rates. To avoid a deteriorated resolution, the amount of data has tobe reduced to 16 MB or less. Hence, a tool is needed to cut the volume down to the region
C. Krapichler et al. / Interacting with Computers 11 (1999) 427–452 441
Fig. 10. Direct manipulation: a calcification of an aorta in the abdominal area is grasped (big picture), movedaway and inspected from every side (small picture).
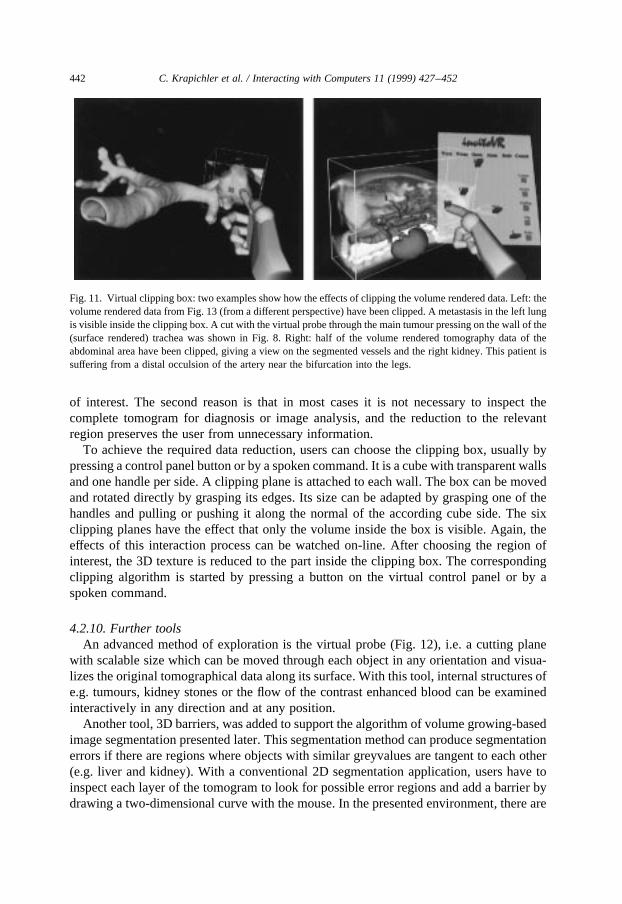
of interest. The second reason is that in most cases it is not necessary to inspect thecomplete tomogram for diagnosis or image analysis, and the reduction to the relevantregion preserves the user from unnecessary information.
To achieve the required data reduction, users can choose the clipping box, usually bypressing a control panel button or by a spoken command. It is a cube with transparent wallsand one handle per side. A clipping plane is attached to each wall. The box can be movedand rotated directly by grasping its edges. Its size can be adapted by grasping one of thehandles and pulling or pushing it along the normal of the according cube side. The sixclipping planes have the effect that only the volume inside the box is visible. Again, theeffects of this interaction process can be watched on-line. After choosing the region ofinterest, the 3D texture is reduced to the part inside the clipping box. The correspondingclipping algorithm is started by pressing a button on the virtual control panel or by aspoken command.
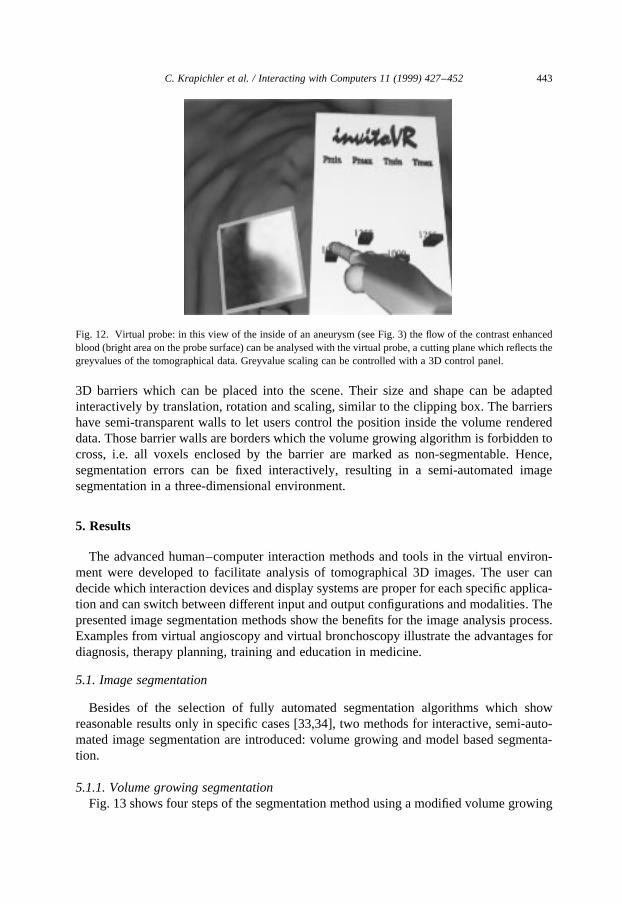
4.2.10. Further toolsAn advanced method of exploration is the virtual probe (Fig. 12), i.e. a cutting plane
with scalable size which can be moved through each object in any orientation and visua-lizes the original tomographical data along its surface. With this tool, internal structures ofe.g. tumours, kidney stones or the flow of the contrast enhanced blood can be examinedinteractively in any direction and at any position.
Another tool, 3D barriers, was added to support the algorithm of volume growing-basedimage segmentation presented later. This segmentation method can produce segmentationerrors if there are regions where objects with similar greyvalues are tangent to each other(e.g. liver and kidney). With a conventional 2D segmentation application, users have toinspect each layer of the tomogram to look for possible error regions and add a barrier bydrawing a two-dimensional curve with the mouse. In the presented environment, there are
C. Krapichler et al. / Interacting with Computers 11 (1999) 427–452442
Fig. 11. Virtual clipping box: two examples show how the effects of clipping the volume rendered data. Left: thevolume rendered data from Fig. 13 (from a different perspective) have been clipped. A metastasis in the left lungis visible inside the clipping box. A cut with the virtual probe through the main tumour pressing on the wall of the(surface rendered) trachea was shown in Fig. 8. Right: half of the volume rendered tomography data of theabdominal area have been clipped, giving a view on the segmented vessels and the right kidney. This patient issuffering from a distal occulsion of the artery near the bifurcation into the legs.
3D barriers which can be placed into the scene. Their size and shape can be adaptedinteractively by translation, rotation and scaling, similar to the clipping box. The barriershave semi-transparent walls to let users control the position inside the volume rendereddata. Those barrier walls are borders which the volume growing algorithm is forbidden tocross, i.e. all voxels enclosed by the barrier are marked as non-segmentable. Hence,segmentation errors can be fixed interactively, resulting in a semi-automated imagesegmentation in a three-dimensional environment.
5. Results
The advanced human–computer interaction methods and tools in the virtual environ-ment were developed to facilitate analysis of tomographical 3D images. The user candecide which interaction devices and display systems are proper for each specific applica-tion and can switch between different input and output configurations and modalities. Thepresented image segmentation methods show the benefits for the image analysis process.Examples from virtual angioscopy and virtual bronchoscopy illustrate the advantages fordiagnosis, therapy planning, training and education in medicine.
5.1. Image segmentation
Besides of the selection of fully automated segmentation algorithms which showreasonable results only in specific cases [33,34], two methods for interactive, semi-auto-mated image segmentation are introduced: volume growing and model based segmenta-tion.
5.1.1. Volume growing segmentationFig. 13 shows four steps of the segmentation method using a modified volume growing
C. Krapichler et al. / Interacting with Computers 11 (1999) 427–452 443
Fig. 12. Virtual probe: in this view of the inside of an aneurysm (see Fig. 3) the flow of the contrast enhancedblood (bright area on the probe surface) can be analysed with the virtual probe, a cutting plane which reflects thegreyvalues of the tomographical data. Greyvalue scaling can be controlled with a 3D control panel.
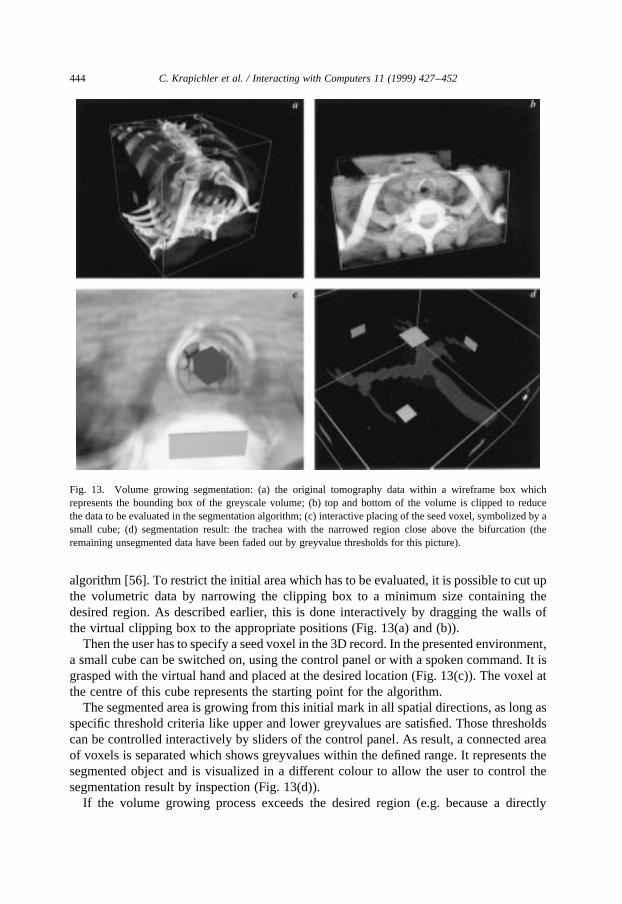
algorithm [56]. To restrict the initial area which has to be evaluated, it is possible to cut upthe volumetric data by narrowing the clipping box to a minimum size containing thedesired region. As described earlier, this is done interactively by dragging the walls ofthe virtual clipping box to the appropriate positions (Fig. 13(a) and (b)).
Then the user has to specify a seed voxel in the 3D record. In the presented environment,a small cube can be switched on, using the control panel or with a spoken command. It isgrasped with the virtual hand and placed at the desired location (Fig. 13(c)). The voxel atthe centre of this cube represents the starting point for the algorithm.
The segmented area is growing from this initial mark in all spatial directions, as long asspecific threshold criteria like upper and lower greyvalues are satisfied. Those thresholdscan be controlled interactively by sliders of the control panel. As result, a connected areaof voxels is separated which shows greyvalues within the defined range. It represents thesegmented object and is visualized in a different colour to allow the user to control thesegmentation result by inspection (Fig. 13(d)).
If the volume growing process exceeds the desired region (e.g. because a directly
C. Krapichler et al. / Interacting with Computers 11 (1999) 427–452444
Fig. 13. Volume growing segmentation: (a) the original tomography data within a wireframe box whichrepresents the bounding box of the greyscale volume; (b) top and bottom of the volume is clipped to reducethe data to be evaluated in the segmentation algorithm; (c) interactive placing of the seed voxel, symbolized by asmall cube; (d) segmentation result: the trachea with the narrowed region close above the bifurcation (theremaining unsegmented data have been faded out by greyvalue thresholds for this picture).
neighbouring organ has similar greyvalues within the specified interval) the user cancorrect this misinterpretation by placing 3D barriers at the affected locations and startthe segmentation process again. As described previously, the algorithm is prohibited tocross those barriers.
5.1.2. Model based segmentationAnother segmentation method is based upon a selection of typical models of diverse
organs. The user chooses a model from the database and adapts its shape, size and locationas close as possible to the organ which has to be segmented in the original tomographicalrecord, using the basic operations translation, rotation and scaling. To have a direct feed-back of the accuracy and quality of those matching attempts, a new visualization methodwas developed [36]. It transforms a texture map with the gradient volume to colours orintensities on the surface of the model organ. The higher the intensity of the texture on thesurface, the more precise the model is adapted. After this interactive first step of adjustingthe model organ to the 3D data set, an automated step refines the segmentation result byoperations like erosion and dilation.
5.2. Virtual endoscopy
Virtual endoscopy is a typical application of the presented virtual environment [57].There are several advantages of virtual endoscopy vs real endoscopy [58]. Virtual endo-scopy is non-invasive and thus more comfortable to the patient, it has no risk of injuries,vessel or tissue perforation or infections, it enables navigation with six degrees of freedomand thus allows perspectives which are not possible in real endoscopy (e.g. Fig. 14).
C. Krapichler et al. / Interacting with Computers 11 (1999) 427–452 445
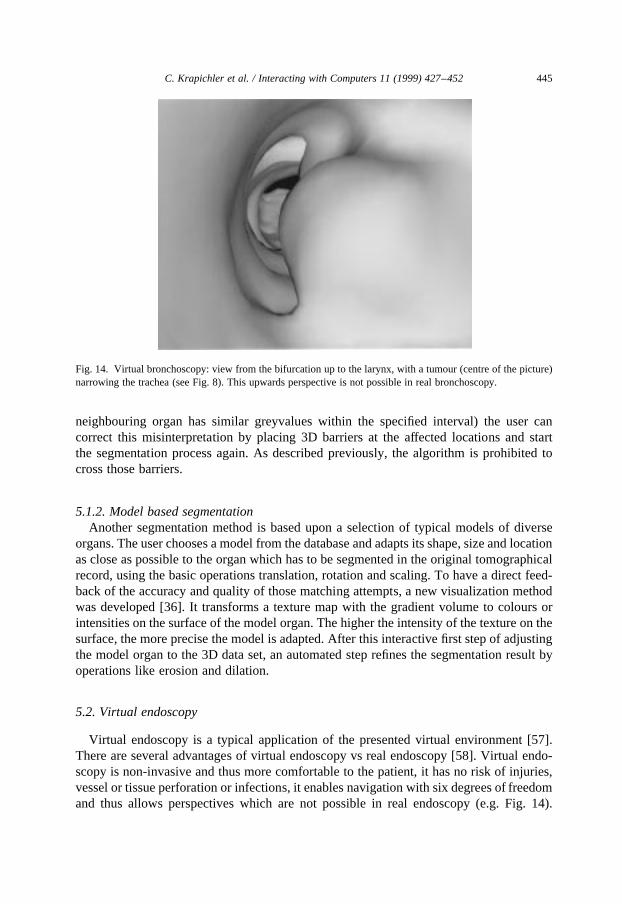
Fig. 14. Virtual bronchoscopy: view from the bifurcation up to the larynx, with a tumour (centre of the picture)narrowing the trachea (see Fig. 8). This upwards perspective is not possible in real bronchoscopy.
Further, information about geometrical dimensions of objects can be measured, and navi-gation through e.g. the bronchial tree can be trained and guided.
A disadvantage of virtual endoscopy in comparison to real endoscopy is the lack of truecolour information, which cannot be acquired by tomography methods like CT or MRI.This information, e.g. tissue reddening, may be helpful for diagnosis of certain diseases.Hence, virtual endoscopy cannot replace real endoscopy in all cases. But physiciansshould consider it as an alternative method and make the most of its advantages. Twotypical examples illustrate the benefits of virtual endoscopy.
Virtual bronchoscopyallows not only the examination of the interior of the segmentedtrachea (Figs. 8 and 14), but also the exploration of the surrounding anatomy, e.g. theinspection of the tissue around the trachea (Fig. 4) or the analysis of the internal structureof a tumour.
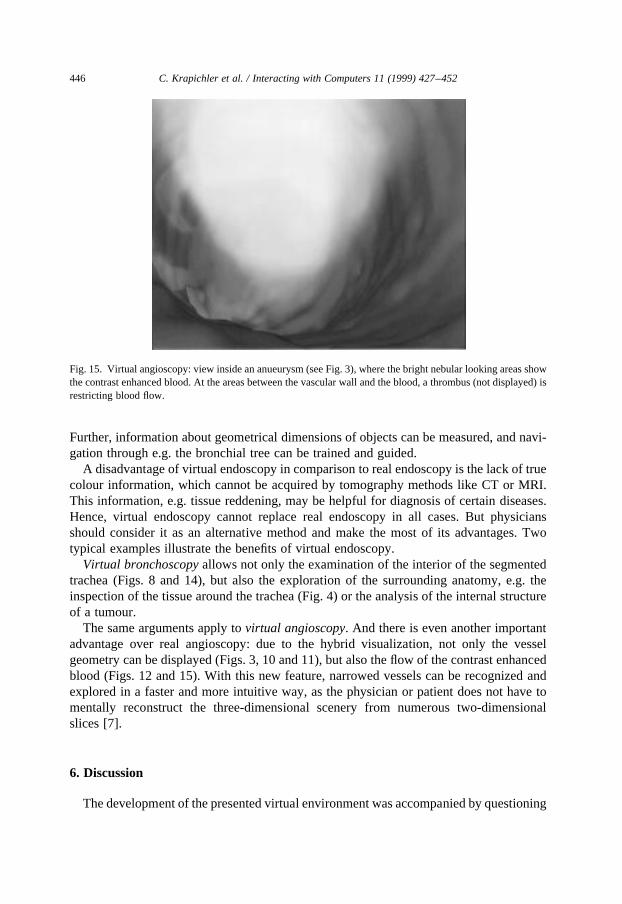
The same arguments apply tovirtual angioscopy. And there is even another importantadvantage over real angioscopy: due to the hybrid visualization, not only the vesselgeometry can be displayed (Figs. 3, 10 and 11), but also the flow of the contrast enhancedblood (Figs. 12 and 15). With this new feature, narrowed vessels can be recognized andexplored in a faster and more intuitive way, as the physician or patient does not have tomentally reconstruct the three-dimensional scenery from numerous two-dimensionalslices [7].
6. Discussion
The development of the presented virtual environment was accompanied by questioning
C. Krapichler et al. / Interacting with Computers 11 (1999) 427–452446
Fig. 15. Virtual angioscopy: view inside an anueurysm (see Fig. 3), where the bright nebular looking areas showthe contrast enhanced blood. At the areas between the vascular wall and the blood, a thrombus (not displayed) isrestricting blood flow.
several of our clinical partners — potential users of the system — about their needs andexpectations, experiences and suggestions. This gave us some valuable clues of the useful-ness, acceptance and intuitiveness of the presented methods and tools. But as the characterof those interviews was informal and qualitative, a quantitative evaluation of the usabilityand intuitiveness has to be done to show reliable results about the assessment of theenvironment.
Besides of the user’s prior experiences with other software applications (see Ref. [59]),one major criterion for the acceptance of virtual environments in medicine is the intui-tiveness and comfort of the human–machine interface. Only if physicians benefit from thenew technologies without long periods of learning and adaptation, it will gain currency.The presented environment showed that a human-oriented multimodal approach and theidea to adapt displays and interaction devices to the human senses allows enhancedinteraction with medical image data. Actions like grasping objects with the hand orinspecting them from different sides by walking around fall back on natural humanexperiences. Other capabilities like the virtual flight or the different tools and utilitiesneed a short period of time to get familiar with, though the process of learning andadaptation turned out to be rather fast.
But there are still a number of details to improve and some unresolved problems. Asalready pointed out, one major problem is the deficient force and tactile feedback. Thoughthere are several approaches to improve e.g. haptic feedback [20,29,30,31], realistic feed-back will not be achievable in the next time [32]. According to Draper [15] the missingvestibular stimulation of virtual flights can lead to simulator sickness under certain condi-tions. To circumvent this effect and to enhance the feeling of presence, Steed et al. [17],presented the virtual treadmill, where users are walking on the spot and a neural networktranslates those motions into navigation information for a walk through the virtual world.As far as our environment is concerned, we did not observe such effects during a virtualflight so far.
The output of different acoustic signals was introduced to complement the visualchannel and have a little compensation for the missing tactile feedback. Another aspectto be considered when implementing a speech recognition system has been shown e.g. inKloosterman [60], and Yankelovich et al. [61]: an appropriate feedback is an importantfactor for performance and acceptance of a dialogue-based speech user interface. Theacoustic feedback signals used for the presented environment are short samples ofdifferent sounds, there is no speech output yet. Archer et al. [62] found for adecision making application that adding voice to textual output does not improvethe acceptability compared with text only, independent of the user’s experiencewithin the task domain. On the other hand, for a GUI of a spreadsheet package, Reeveset al. [63] could improve the usability of the on-line help by spoken instructions. Accord-ing to the principles of multimodality, we favour the idea of speech output to improve theusability and intuitiveness of our application, but further research under those particularconditions is required.
As the presented virtual environment is not restricted to one specific configuration,navigation, object manipulation, data exploration and on-line control of various para-meters can be achieved with several interaction devices. This flexibility allows to workwith different computer systems and interaction devices, from high-performance graphics
C. Krapichler et al. / Interacting with Computers 11 (1999) 427–452 447
computers with advanced VR devices down to desktop workstations and simpler interac-tion devices, though with restricted usability and performance.
Most of the medical applications, especially in education and training programs, arebased upon models of the human anatomy, where the segmentation and model generationhas to be done only once. Merely a few surgery systems can be found which evaluate andwork with tomograms of individual patients. Our approach empowers clinicians to exploreand diagnose the radiological data in each particular case and to use them for furthertreatment. And the integration of the presented tools and features into the virtual worldallows physicians to stay in one environment during all stages of their work, from theinspection and exploration of the pure tomographical images and the segmentation processto qualitative and quantitative diagnosis and therapy planning.
7. Conclusion
On the way from radiological image sequences to a virtual scene of geometricallydescribed object surfaces, a lot of time-consuming steps are necessary (e.g. filtering,segmentation, triangulation). Though there is remarkable success in accelerating partsof this process by automation, human interaction will be inevitable in foreseeable future[64]. Hence, our approach supports this work by modern means of man–machine commu-nication. The presented virtual environment enhances work on the tomographical data indifferent phases and for different purposes: 3D image processing steps like image segmen-tation are accelerated as well as visualization and interaction techniques for diagnosis,therapy planning, training and education.
Image segmentation is an important but laborious step in computer aided analysis andprocessing of tomographical data. Besides of a few specialized applications with fullyautomated algorithms, the presented VR environment accelerates image segmentationcompared with conventional interactive approaches. This is achieved by virtual toolswhich make advantage of the 3D nature of the processed data.
New visualization methods for volume and surface rendering allow the real-time repre-sentation of large medical scenes and thus make comfortable work possible in the virtualenvironment. It has been shown that the ability to visualize both original volume-baseddata and surface-oriented segmented objects at the same time can be very helpful fordiagnosis. Two examples, virtual bronchoscopy and virtual angioscopy, emphasize theadvantages of this hybrid visualization as well as benefits of virtual environments and thenew interaction techniques for medicine. Further, spatial perception facilitates recognitionof three-dimensional coherencies for both physicians and patients.
For those reasons, virtual environments are likely to be used in the daily clinical routinein medicine of tomorrow [65,66]. The new technology offers powerful features for thework with tomographical data. The human-oriented display and interaction methods canfacilitate and accelerate visualization and analysis of three-dimensional records of indi-vidual patients [67]. They promise to empower clinicians to analyse and evaluate theimages in less time and in a less elaborate way, but with the required high precision.Various fields like diagnosis, therapy, surgical planning, simulation or education willbenefit from those methods and technologies.
C. Krapichler et al. / Interacting with Computers 11 (1999) 427–452448

References
[1] S.R. Ellis, What are virtual environments?, IEEE Computer Graphics and Applications 14 (1) (1994) 17–22.
[2] P. Cohen, M. Dalrymple, F. Pereira, J. Sullivan, R. Gargan Jr., J. Schlossberg, S. Tyler, Synergistic use ofdirect manipulation and natural language, in: Conference on Human Factors in Computing Systems 1989(CHI 89), Proceedings of the ACM/SIGCHI, Austin, TX, Addison-Wesley, Reading, MA, 1989, pp. 227–233.
[3] A.G. Hauptmann, P. McAvinney, Gestures with speech for graphic manipulation, International Journal ofMan–Machine Studies 38 (2) (1993) 231–249.
[4] J. Cassell, M. Steedman, N. Badler, C. Pelachaud, M. Stone, B. Douville, S. Prevost, B. Achorn, Modellingthe interaction between speech and gesture, in: A. Ram, K. Eiselt (Eds.), Proceedings of the 16th AnnualConference of the Cognitive Science Society, Lawrence Erlbaum, Hillsdale, NJ, 1994, pp. 153–158.
[5] S. Oviatt, A. DeAngeli, K. Kuhn, Integration and synchronization of input modes during multimodalhuman–computer interaction, in: S. Pemberton (Ed.), Conference on Human Factors in Computing Systems1997 (CHI 97), Proceedings of the ACM/SIGCHI, Atlanta, GA. Addison-Wesley, Reading, MA, 1997, pp.415–422.
[6] M. Lang, Towards user adequate human–computer-interaction, in: B. Horvat, Z. Kacic (Eds.), ModernModes of Man–Machine-Communication, vol. 1, Maribor, Slowenia, 1994, pp. 1–9.
[7] N. Avis, Medical applications of virtual environments, in: Proceedings of the 1st UK VR-SIG Conference,Nottingham, UK, 1994, pp. 11–19.
[8] M.A. Sagar, D. Bullivant, G.D. Mallinson, P.J. Hunter, A virtual environment and model of the eye forsurgical simulation, in: Proceedings of SIGGRAPH ’94, Computer Graphics Proceedings, Annual Confer-ence Series, ACM Press, New York, pp. 205–212.
[9] U.G. Kuhnapfel, H.G. Krumm, C., Kuhn, M., Hu¨bner, B. Neisius, Endosurgery simulations with KISMET,in: Virtual Reality World ’95, Conference documentation, Computerwoche Verlag, Munich, 1995, pp. 165–171.
[10] M. Billinghurst, J. Savage, P. Oppenheimer, C. Edmond, The expert surgical assistant: An intelligent virtualenvironment with multimodal input, in: Proceedings of Medicine Meets Virtual Reality IV: Health Care inthe Information Age, IOS Press, Amsterdam, 1996, pp. 590–607.
[11] K.-F. Kaltenborn, O. Rienhoff, Virtual reality in medicine, Methods of Information in Medicine 32 (5)(1993) 407–417.
[12] M.T. Bolas, Human factors in the design of an immersive display, IEEE Computer Graphics and Applica-tions 14 (1) (1994) 55–59.
[13] H.S. Lusted, R.B. Knapp, A. Lloyd, Biosignal processing and biocontrollers, Virtual Reality Systems 1 (1)(1993) 38–39.
[14] M. Sellberg, D. Murray, D. Knapp, T. Teske, K. Lattie, M. Vanderploeg, Virtual human: an automatedvirtual environment for computer-aided instruction and biomechanical analysis, in: K. Morgan, R. Satava,H. Sieburg, R. Mattheus, J. Christansen (Eds.), Interactive Technology and the New Paradigm for Health-care, IOS Press, Amsterdam, and Ohmsha, Tokyo, 1995, pp. 340–348.
[15] M.H. Draper, Can your eyes make you sick?: investigating the relationship between the vestibulo-ocularreflex and virtual reality. Technical report, University of Washington, Human Interface Technology Labora-tory, Seattle, WA, 1996.
[16] J.D. Prothero, M.H. Draper, T.A. Furness, D.E. Parker, M.J. Wells, Do visual background manipulationsreduce simulator sickness?, in: International Workshop on Motion Sickness, Marbella, Spain, 1997.
[17] A. Steed, M. Slater, M. Usoh, Presence in immersive virtual environments, in: Proceedings of the 1st UKVR-SIG Conference, Nottingham, UK, 1994, pp. 54–60, ftp://ftp.crg.cs.nott.ac.uk/pub/papers/UKVRSIG1.ps.gz
[18] J. Wann, M. Mon-Williams, What does virtual reality NEED?: human factors issues in the design of three-dimensional computer environments, International Journal of Human–Computer Studies 44 (6) (1996)829–847.
[19] D. Charitos, P. Rutherford, Guidelines for the design of virtual environments, in: Proceedings of the 3rdUKVR-SIG Conference, Leicester, UK, 1996, pp. 93–111.
[20] M.A. Perez-Quinones, J.L. Sibert, A collaborative model of feedback in human–computer interaction, in: R.
C. Krapichler et al. / Interacting with Computers 11 (1999) 427–452 449
Bilger, S. Guest, M.J. Tauber (Eds.), Conference on Human Factors in Computing Systems 1996 (CHI 96),Proceedings of the ACM/SIGCHI, Vancouver, BC, Canada, Addison-Wesley, Reading, MA, 1996.
[21] H. Hoppe, Progressive meshes, in: H. Rushmeier (Ed.), Proceedings of SIGGRAPH ’96, ComputerGraphics Proceedings, Annual Conference Series, New Orleans, LA. Addison Wesley, Reading, MA,1996, pp. 99–108.
[22] M. Harrison, P. Barnard, On defining requirements for interaction, in: Proceedings of IEEE InternationalSymposium on Requirements Engineering (RE ’93), IEEE Computer Society Press, Los Alamitos, CA,1993, pp. 50–54.
[23] N.O. Bernsen, Foundations of multimodal representations: a taxonomy of representational modalities,Interacting with Computers 6 (4) (1994) 347–371.
[24] G. Faconti, M. Bordegoni, K. Kansy, P. Trahanias, T. Rist, M. Wilson, Formal framework and necessaryproperties of the fusion of input modes in user interfaces, Interacting with Computers 8 (2) (1996) 134–161.
[25] M. Johnston, P.R. Cohen, D. McGee, S.L. Oviatt, J.A. Pittman, I. Smith, Unification-based multimodalintegration, in: Proceedings of the 35th Annual Meeting of the Association for Computational Linguistics,Madrid, 1997.
[26] D.J. Sturman, D. Zeltzer, A survey of glove-based input, IEEE Computer Graphics and Applications 14 (1)(1994) 30–39.
[27] J. Lee, T.L. Kunii, Model-based analysis of hand posture, IEEE Computer Graphics and Applications 15 (5)(1995) 77–86.
[28] P.R. Cohen, S.L. Oviatt, The role of voice input for human–machine communication, Proceedings of theNational Academy of Sciences 92 (22) (1995) 9921–9927.
[29] H. Durrant, VR and the missing senses, in: Proceedings of the 1st UK VR-SIG Conference, Nottingham,UK, 1994, pp. 61–66, ftp://ftp.crg.cs.nott.ac.uk/pub/papers/UKVRSIG1.ps.gz
[30] N. Durlach, A. Mavor (Eds.), Virtual Reality: Scientific and Technological Challenges. National AcademyPress, Washington, DC, 1995.
[31] H. Hoffman, J. Groen, S. Rousseau, A. Hollander, W. Winn, M. Wells, T. Furness, Tactile augmentation:enhancing presence in virtual reality with tactile feedback from real objects, in: Meeting of the AmericanPsychological Society, San Francisco, CA, 1996.
[32] M.R. Mine, F.P. Brooks Jr., C.H. Sequin, Moving objects in space: exploiting proprioception in virtual-environment interaction, in: Proceedings of SIGGRAPH ’97, Computer Graphics Proceedings, AnnualConference Series, Los Angeles, CA, ACM Press, New York, 1997, pp. 19–26.
[33] N. Ayache, J. Boissonnat, L. Cohen, B. Geiger, J. Levy-Vehel, O. Monga, P. Sander, Steps toward theautomatic interpretation of 3D images, 3D Imaging in Medicine 60 (1990) 107–120.
[34] K.-H. Englmeier, U. Fink, M. Haubner, C. Becker, M. Seemann Jr., W. Capeller, M. Reiser, Ein Verfahrenzur computergestu¨tzten, dreidimensionalen Subtraktionsangiographie mit Hilfe der Spiralro¨ntgencompu-tertomographie, Der Radiologe 36 (1996) 360–364.
[35] R. Pausch, D. Proffitt, G. Williams, Quantifying immersion in virtual reality, in: Proceedings of SIGGRAPH’97, Computer Graphics Proceedings, Annual Conference Series, Los Angeles, CA, ACM Press, New York,1997, pp. 13–18.
[36] M. Haubner, C. Krapichler, A. Lo¨sch, K.-H. Englmeier, W. van Eimeren, Virtual reality in medicine —computer graphics and interaction techniques, IEEE Transactions on Information Technology in Bio-medicine 1 (1) (1997) 61–72.
[37] B. Cabral, N. Cam, J. Foran, Accelerated volume rendering and tomographic reconstruction using texturemapping hardware, in: 1994 Symposium on Volume Visualization, Proceedings of the ACM/IEEE, ACMPress, New York, 1994, pp. 91–97.
[38] K.-H. Englmeier, M. Haubner, A. Lo¨sch, F. Eckstein, M.D. Seemann, W. van Eimeren, M. Reiser, Hybridrendering of multidimensional image data, Methods of Information in Medicine 36 (1997) 1–10.
[39] S. Fels, G. Hinton, GloveTalkII: An adaptive gesture-to-formant interface, in: Conference on HumanFactors in Computing Systems 1995 (CHI 95), Proceedings of the ACM/SIGCHI, Denver, CO, Addison-Wesley, Reading, MA, 1995.
[40] T. Takahashi, F. Kishino, Hand gesture coding based on experiments using a hand gesture interface device,SIGCHI Bulletin 23 (2) (1991) 67–74.
[41] C. Ware, D.R. Jessome, Using the bat: a six-dimensional mouse for object placement, IEEE ComputerGraphics and Applications, IEEE Computer Society Press, Los Alamitos, CA, 1988, pp. 253–262.
C. Krapichler et al. / Interacting with Computers 11 (1999) 427–452450
[42] S. Gottschalk, M. Lin, D. Manocha, OBBTree: a hierarchical structure for rapid interference detection, in:H. Rushmeier (Ed.), Proceedings of SIGGRAPH ’96, Computer Graphics Proceedings, Annual ConferenceSeries, New Orleans, LA, Addison-Wesley, Reading, MA, 1996, pp. 171–180.
[43] H. Stahl, J. Mu¨ller, M. Lang, Controlling limited-domain applications by probabilistic semantic decoding ofnatural speech, in: 1997 International Conference on Acoustics, Speech, and Signal Processing (ICASSP97), Proceedings of IEEE, Mu¨nchen, IEEE Computer Society Press, Los Alamitos, CA, 1997, pp. 1163–1166.
[44] J. Lai, J. Vergo, MedSpeak: Report creation with continuous speech recognition, in: S. Pemberton, editor,Conference on Human Factors in Computing Systems 1997 (CHI 97), Proceedings of the ACM/SIGCHI,Atlanta, GA. Addison-Wesley, Reading, MA, 1997.
[45] T. Dillon, A. Norcio, User performance and acceptance of a speech-input interface in a health assessmenttask, International Journal of Human–Computer Studies 47 (4) (1997) 591–602.
[46] H. Stahl, J. Mu¨ller, M. Lang, An efficient top-down parsing algorithm for understanding speech by usingstochastic syntactic and semantic models, in: 1996 International Conference on Acoustics, Speech, andSignal Processing (ICASSP 96), vol. 1 of Proceedings of IEEE, Atlanta, GA, IEEE Computer Society Press,Los Alamitos, CA, 1996, pp. 396–400.
[47] J. Muller, H. Stahl, M. Lang, Predicting the out-of-vocabulary rate and the required vocabulary size for speechprocessing applications, in: 4th International Conference on SpokenLanguageProcessing (ICSLP96), Proceed-ings of IEEE, Philadelphia, PA, IEEE Computer Society Press, Los Alamitos, CA, 1996, pp. 1922–1925.
[48] S.A. Brewster, P.C. Wright, A.D. Edwards, The design and evaluation of an auditory-enhanced scrollbar, in:B. Adelson, S. Dumais, J. Olson (Eds.), Conference on Human Factors in Computing Systems 1994 (CHI94), Proceedings of the ACM/SIGCHI, Addison-Wesley, Boston, MA, 1994, pp. 173–179.
[49] S.A. Brewster, V.-P. Raty, A. Kortekangas, Earcons as a method of providing navigational cues in a menuhierarchy, in: Proceedings of HCI 96, Springer, London, 1996, pp. 167–183.
[50] B.L. Harrison, H. Ishii, K.J. Vicente, W.A.S. Buxton, Transparent layered user interfaces: an evaluation of adisplay design to enhance focused and divided attention, in: Conference on Human Factors in ComputingSystems 1995 (CHI 95), Proceedings of the ACM/SIGCHI, Denver, CO. Addison-Wesley, TReading, MA,1995, pp. 317–324.
[51] G. Kurtenbach, G. Fitzmaurice, T. Baudel, B. Buxton, The design and evaluation of a GUI paradigm basedon tablets, two-hands, and transparency, in: S. Pemberton (Ed.), Conference on Human Factors in Comput-ing Systems 1997 (CHI 97), Proceedings of the ACM/SIGCHI, Atlanta, GA. Addison-Wesley, Reading,MA, 1997, pp. 35–42.
[52] E.D. Graham, C.L. MacKenzie, Physical versus virtual pointing, in: R. Bilger, S. Guest, M.J. Tauber (Eds.),Conference on Human Factors in Computing Systems 1996 (CHI 96), Proceedings of the ACM/SIGCHI,Vancouver, BC, Canada. Addison-Wesley, Reading, MA, 1996.
[53] B.L. Harrison, K.J. Vicente, An experimental evaluation of transparent menu usage, in: R. Bilger, S. Guest,M.J. Tauber (Eds.), Conference on Human Factors in Computing Systems 1996 (CHI 96), Proceedings ofthe ACM/SIGCHI, Vancouver, BC, Canada, Addison-Wesley, Reading, MA, 1996.
[54] Y. Guiard, Asymmetric division of labour in human skilled bimanual action: the kinematic chain as amodel. The Journal of Motor Behaviour, (1987) 486–517.
[55] R. Stoakley, M.J. Conway, R. Pausch, Virtual reality on a WIM: Interactive worlds in miniature, in:Conference on Human Factors in Computing Systems 1995 (CHI 95), Proceedings of the ACM/SIGCHI,Denver, CO, Addison-Wesley, Reading, MA, 1995.
[56] R. Gonzalez, P. Wintz, Digital Image Processing. Addison-Wesley, Reading, MA, 1987.[57] C. Krapichler, M. Haubner, A. Lo¨sch, M.K. Lang, K.-H. Englmeier, Human–machine interface for a VR-
based medical imaging environment, in: Y. Kim, (Ed.), Medical Imaging 1997: Image Display, vol. 3031 ofProceedings of SPIE, Newport Beach, CA, pp. 527–534.
[58] D.J. Blezek, R.A. Robb, C.M. Prather, Virtual endoscopy vs real endoscopy: a comparative evaluation, in:Y. Kim (Ed.), Medical Imaging 1997: Image Display, vol. 3031 of Proceedings of SPIE, Newport Beach,CA, 1997, pp. 542–552.
[59] S. Wiedenbeck, S. Davis, The influence of interaction style and experience on user perceptions of softwarepackages, International Journal of Human–Computer Studies 46 (5) (1997) 563–588.
[60] S.H. Kloosterman, Design and implementation of a user-oriented speech recognition interface: the synergyof technology and human factors, Interacting with Computers 6 (1) (1994) 41–60.
C. Krapichler et al. / Interacting with Computers 11 (1999) 427–452 451

[61] N. Yankelovich, G.-A. Levow, M. Marx, Designing SpeachActs: issues in speech user interfaces, in:Conference on Human Factors in Computing Systems 1995 (CHI 95), Proceedings of the ACM/SIGCHI,Denver, CO, Addison-Wesley, Reading, MA, 1995.
[62] N. Archer, M. Head, J. Wollersheim, Y. Yuan, Investigation of voice and text output modes with abstractionin a computer interface, Interacting with Computers 8 (4) (1996) 323–345.
[63] N. Reeves, S. Mills, and J. Noyes, (1996). Sounds like HELP: the use of voice for procedural instructions inGUI HELP. In Proceedings of the 6th Australian Conference on Computer–Human Interaction (OZCHI’96), Hamilton, New Zealand. IEEE Press.
[64] M.W. Krueger, Automating virtual reality, IEEE Computer Graphics and Applications 15 (1) (1995) 9–11.[65] R.M. Satava, The role of virtual reality in medicine of the 21st century, Virtual Reality Systems 1 (2) (1993)
43–52.[66] S. Weghorst, Virtual reality in medicine, Artificial Intelligence in Medicine 6 (1994) 277–279.[67] W. Ribarsky, J. Bolter, A.O. den Bosch, R. van Teylingen, Visualization and analysis using virtual reality,
IEEE Computer Graphics and Applications 14 (1) (1994) 10–12.
C. Krapichler et al. / Interacting with Computers 11 (1999) 427–452452


![Monitoria multimodal cerebral multimodal monitoring[2]](https://img.pdfslide.us/doc/110x75/552957004a79599a158b46fd/monitoria-multimodal-cerebral-multimodal-monitoring2.jpg)