Embed Size (px)
Citation preview

CALIFORNIA HEALTHCARE FOUNDATION
August 2014
Physician Participation in Medi-Cal: Ready for the Enrollment Boom?

2California HealthCare Foundation
Contents
3 Executive SummaryPhysicians with Any Medi-Cal Patients in Their Practices
Adequacy of the Supply of Physicians Participating in Medi-Cal
Physicians Accepting New Medi-Cal Patients
Changes in Medi-Cal Participation Over Time
4 Background
5 ResultsPhysicians with Any Medi-Cal Patients in Their Practice
Degree of Medi-Cal Participation
Adequacy of the Supply of Physicians Participating in Medi-Cal
Medi-Cal Participation by Geographic Region
Physicians Accepting New Medi-Cal Patients
Changes in Medi-Cal Participation Over Time
17 Conclusion Acceptance of Medi-Cal Versus Other Insurance Types
Medi-Cal Participation by Major Specialty
Regional Variation
Full-Time Equivalent Physicians Serving Medi-Cal Beneficiaries
Supply of Physicians Serving Medi-Cal Patients Relative to Need
Implications for Medi-Cal Payment
Need for Ongoing Monitoring
20 Appendices:A. Survey Instrument
B. Methodology
C. Major Specialty Groups
D. Regional Definitions
26 Endnotes
About the AuthorsJanet M. Coffman, PhD, MA, MPP, is an asso-ciate professor at the Philip R. Lee Institute for Health Policy Studies and Department of Family and Community Medicine at the University of California, San Francisco.
Denis Hulett, MS, is a programmer/analyst at the Philip R. Lee Institute for Health Policy Studies at the University of California, San Francisco.
Margaret Fix, MPH, is a research associate at the Philip R. Lee Institute for Health Policy Studies at the University of California, San Francisco.
Andrew B. Bindman, MD, is a professor at the Philip R. Lee Institute for Health Policy Studies and Department of Medicine at the University of California, San Francisco, and director of the California Medicaid Research Institute.
AcknowledgmentsThe authors thank Linda Whitney, former executive director of the California Medical Board; Kimberly Kirchmeyer, current execu-tive director of the California Medical Board; and their staff for distributing the survey, performing data entry, and transmitting the data to the authors.
About the FoundationThe California HealthCare Foundation works as a catalyst to fulfill the promise of better health care for all Californians. We support ideas and innovations that improve quality, increase efficiency, and lower the costs of care. For more information, visit www.chcf.org.
© 2014 California HealthCare Foundation

3Physician Participation in Medi-Cal: Ready for the Enrollment Boom?
86% in the North region to 66% in the San Diego region.
$$ The percentage of Medi-Cal patients in physicians’ practices also varied widely. Only 22% of primary care physicians and 16% of non-primary care physi-cians reported that 30% or more of their patients are Medi-Cal enrollees.
Adequacy of the Supply of Physicians Participating in Medi-Cal
$$ The ratio of FTE primary care physicians participating in Medi-Cal per 100,000 Medi-Cal enrollees (35 to 49 per 100,000 enrollees) was below the Health Services and Resources Administration’s (HRSA) estimate of the need for primary care physicians (60 to 80 per 100,000 people).
$$ The ratio of FTE non-primary care physicians per 100,000 Medi-Cal enrollees (68 to 102 per 100,000 enrollees) was within HRSA’s estimate of need (85 to 105 per 100,000 people).
Physicians Accepting New Medi-Cal Patients
$$ Sixty-two percent of California physicians reported that they are accepting new Medi-Cal patients.
$$ The percentage accepting new Medi-Cal patients was lower than the percentage accepting new patients with private insurance (79%) or Medicare (75%).
$$ Rates of acceptance of new Medi-Cal patients varied by major specialty, practice type, and region in a manner similar to the variation in rates of having any Medi-Cal patients.
Changes in Medi-Cal Participation Over Time
$$ The ratio of FTE Medi-Cal physicians per 100,000 Medi-Cal enrollees rose from, in 2011, 76 to 106 physicians per 100,000 enrollees to, in 2013, 106 to 153 physicians per 100,000 enrollees.
$$ The increase in the ratio of FTE Medi-Cal physi-cians per 100,000 Medi-Cal enrollees is likely due to both the increase in the total number of physicians in California and the increase in the percentage of
Executive Summary
Recent and projected enrollment increases in Medi-Cal due to the Affordable Care Act have heightened concerns about whether sufficient numbers of
physicians are participating in Medi-Cal to provide ben-eficiaries with adequate access to care. Without a large increase in the number of full-time equivalent (FTE) pri-mary care physicians participating in Medi-Cal or another means of increasing efficiency in primary care, such as greater use of nonphysician clinicians or phone and elec-tronic visits, Medi-Cal beneficiaries are likely to have difficulty accessing primary care.
This report presents findings from physician surveys con-ducted in 2011 and 2013 to assess California physicians’ participation in Medi-Cal, and discusses implications for beneficiaries’ access to care.
Physicians with Any Medi-Cal Patients in Their Practices
$$ Two-thirds of eligible physicians who responded to the 2013 survey reported having Medi-Cal patients in their practices.
$$ The percentage of physicians with any Medi-Cal patients in their practice (69%) was significantly lower than the percentage with any Medicare patients (77%) and much lower than the percentage with any privately insured patients (92%).
$$ Medi-Cal participation varied widely by major spe-cialty, practice type, and region.
$$ Physicians in facility-based specialties (e.g., emergency medicine physicians, hospitalists, anesthesiologists) had the highest rate of Medi-Cal participation (82%), and psychiatrists had the lowest (47%).
$$ Physicians practicing in community health centers and public clinics had the highest rate of Medi-Cal participation (92%); physicians in solo practice had the lowest (54%).
$$ Across California’s regions, Medi-Cal participa-tion rates among primary care physicians ranged from 85% in the North Valley/Sierra region to 49% in the Central Coast region; participation rates among non-primary care physicians ranged from

4California HealthCare Foundation
low of only 43% among psychiatrists.5 The supply of pri-mary care physicians relative to the size of the Medi-Cal patient population was below federal standards in many regions of the state.6
Medicaid provides health insurance coverage to the poor, but it does not guarantee access to health care services. Physician participation in Medicaid is voluntary, and national surveys suggest that it is substantially lower than participation in Medicare and commercial insur-ance. In 2011, 69% of physicians nationwide reported that they were willing to accept new Medicaid patients, while 83% reported they were willing to accept new Medicare patients, and 82% said they would accept new privately insured patients.7 Physician participation in Medicaid varies markedly by state. The acceptance rate for new Medicaid patients ranges across states from 46% to 91% among primary care physicians and from 57% to 96% among physicians in other specialties.8
Low physician payment rates deter providers from par-ticipating in Medicaid.9 In 2012, California had the third-lowest Medicaid primary care physician payment rate among all states and the second lowest percentage of primary care physicians reporting that they were will-ing to accept any new Medicaid patients. Federal law and regulations give state Medicaid agencies considerable flexibility to set physician reimbursement rates. This pol-icy has resulted in significant variation in payment rates across the country, with some states paying far less than Medicare or commercial payers for the same services. A 2012 study, for example, found that state Medicaid pro-vider payments ranged from 37% to 134% of Medicare rates and were, on average, two-thirds less than rates paid by Medicare.10 States with lower Medicaid physician payment rates relative to Medicare rates have lower rates of physician participation.11
Medicaid beneficiaries may have difficulty obtaining ambulatory care if the percentage of office-based physi-cians in their communities who accept Medicaid patients is low or if the total supply of physicians is low relative to the population size. In some areas, community health centers and other safety-net providers are available to care for Medicaid beneficiaries, but these providers often do not have sufficient resources to provide all Medicaid beneficiaries with timely appointments. Medicaid benefi-ciaries who have difficulty obtaining ambulatory care may delay seeking care for chronic conditions such as asthma, diabetes, and congestive heart failure. These delays can
physicians with at least some Medi-Cal patients in their practices.
$$ Much of the increase in Medi-Cal participation is among physicians who treat relatively few Medi-Cal patients. Among primary care physicians, the per-centages of physicians reporting that 1% to 9% of their patients were enrolled in Medi-Cal rose from 35% to 42%, and among non-primary care physi-cians, the percentage rose from 32% to 38%.
Background
California physicians’ willingness to include Medi-Cal patients in their practices is critical to ensuring that this form of health insurance coverage pro-
vides adequate access to care. Historically, California physicians have been less likely to participate in Medi-Cal than in other types of health insurance. Recent and pro-jected increases in Medi-Cal enrollment have heightened concerns about whether sufficient numbers of physicians are participating in Medi-Cal to ensure that beneficiaries can obtain timely care in the most cost-effective settings.
In 2013, California’s Medicaid program, Medi-Cal, pro-vided health insurance coverage to more than 8.7 million low-income people.1 The number covered by Medi-Cal grew by more than 1 million in 2013, mainly due to the transfer to Medi-Cal of children previously covered by the Healthy Families Program, which was discontinued at the end of 2012.2 Medi-Cal enrollment is continuing to grow in 2014 with the implementation of federal health care reform — the Patient Protection and Affordable Care Act (ACA). In January 2014, Medi-Cal increased its enroll-ment by approximately 650,000 people to a total of 9.4 million.3 These are primarily low-income, childless adults who are newly eligible for Medicaid coverage as a result of the ACA. The California Governor’s Office anticipates that Medi-Cal’s total enrollment could rise to 11.5 million during 2014 – 2015.4
Prior studies conducted by the University of California, San Francisco (UCSF), found that the rate of physician participation in Medi-Cal was low and varied by physi-cian specialty and by geographic location. A UCSF study found that in 2008, just over half of California physicians reported participation in Medi-Cal. The participation rate ranged from 85% among facility-based specialists (e.g., emergency medicine, radiology, and anesthesiology) to a
5Physician Participation in Medi-Cal: Ready for the Enrollment Boom?
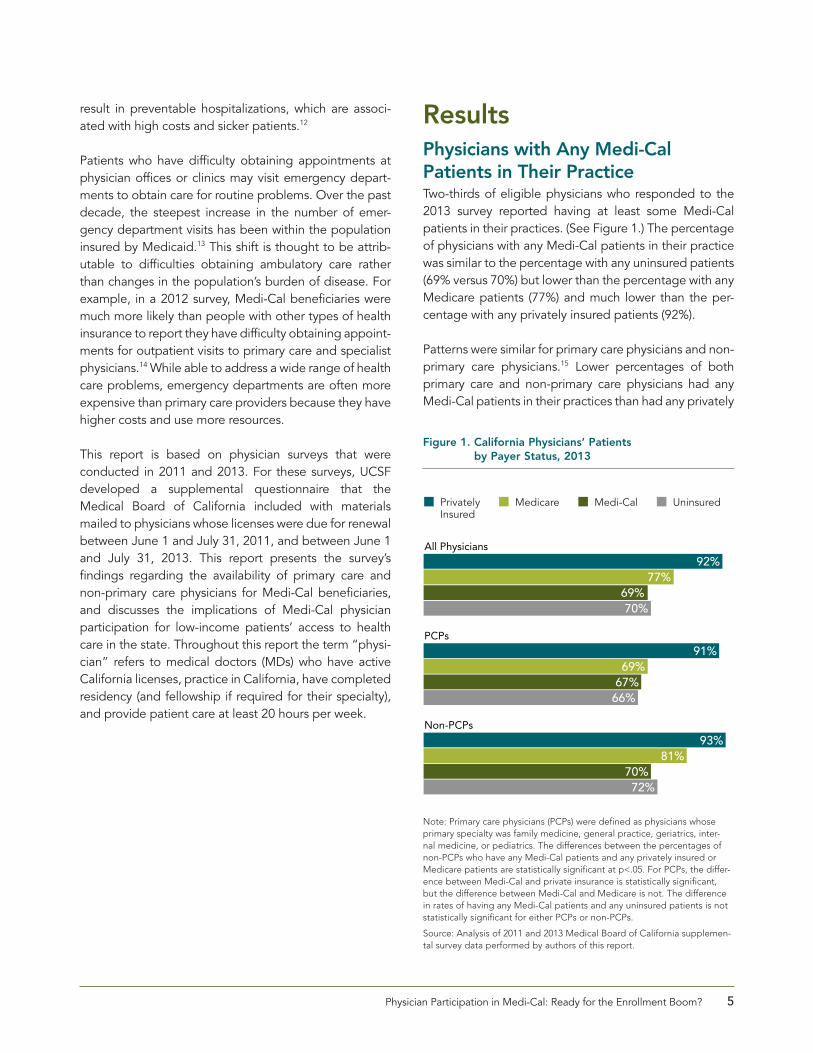
ResultsPhysicians with Any Medi-Cal Patients in Their PracticeTwo-thirds of eligible physicians who responded to the 2013 survey reported having at least some Medi-Cal patients in their practices. (See Figure 1.) The percentage of physicians with any Medi-Cal patients in their practice was similar to the percentage with any uninsured patients (69% versus 70%) but lower than the percentage with any Medicare patients (77%) and much lower than the per-centage with any privately insured patients (92%).
Patterns were similar for primary care physicians and non-primary care physicians.15 Lower percentages of both primary care and non-primary care physicians had any Medi-Cal patients in their practices than had any privately
result in preventable hospitalizations, which are associ-ated with high costs and sicker patients.12
Patients who have difficulty obtaining appointments at physician offices or clinics may visit emergency depart-ments to obtain care for routine problems. Over the past decade, the steepest increase in the number of emer-gency department visits has been within the population insured by Medicaid.13 This shift is thought to be attrib-utable to difficulties obtaining ambulatory care rather than changes in the population’s burden of disease. For example, in a 2012 survey, Medi-Cal beneficiaries were much more likely than people with other types of health insurance to report they have difficulty obtaining appoint-ments for outpatient visits to primary care and specialist physicians.14 While able to address a wide range of health care problems, emergency departments are often more expensive than primary care providers because they have higher costs and use more resources.
This report is based on physician surveys that were conducted in 2011 and 2013. For these surveys, UCSF developed a supplemental questionnaire that the Medical Board of California included with materials mailed to physicians whose licenses were due for renewal between June 1 and July 31, 2011, and between June 1 and July 31, 2013. This report presents the survey’s findings regarding the availability of primary care and non-primary care physicians for Medi-Cal beneficiaries, and discusses the implications of Medi-Cal physician participation for low-income patients’ access to health care in the state. Throughout this report the term “physi-cian” refers to medical doctors (MDs) who have active California licenses, practice in California, have completed residency (and fellowship if required for their specialty), and provide patient care at least 20 hours per week.
Figure 1. California Physicians’ Patients by Payer Status, 2013
Note: Primary care physicians (PCPs) were defined as physicians whose primary specialty was family medicine, general practice, geriatrics, inter-nal medicine, or pediatrics. The differences between the percentages of non-PCPs who have any Medi-Cal patients and any privately insured or Medicare patients are statistically significant at p<.05. For PCPs, the differ-ence between Medi-Cal and private insurance is statistically significant, but the difference between Medi-Cal and Medicare is not. The difference in rates of having any Medi-Cal patients and any uninsured patients is not statistically significant for either PCPs or non-PCPs.
Source: Analysis of 2011 and 2013 Medical Board of California supplemen-tal survey data performed by authors of this report.
Non-PCPs
PCPs
All Physicians92%
77% 69% 70%
91% 69%
67% 66%
93%81%
70% 72%
■ Privately ■ Medicare ■ Medi-Cal ■ Uninsured Insured

6California HealthCare Foundation
and women of child-bearing age are underrepresented in Medicare and overrepresented in Medi-Cal due to the eligibility rules of each program.
Facility-based physicians (e.g., emergency medicine physicians, hospitalists, radiologists, anesthesiologists, and pathologists) were the group most likely to have any Medi-Cal patients (82%). This high participation rate is due in large part to the fact that emergency medicine physicians make up a large portion of the physicians in the facility-based group. Emergency departments are required by law to treat all patients with urgent medical conditions regardless of insurance status.16 If a Medi-Cal patient treated in an emergency department is admitted to a hospital, all physicians who practice in that hospital are obliged to care for that patient.
Mental health diagnoses are among the most common reasons for hospitalizations among Medicaid patients nationwide, yet psychiatrists are less likely to have any Medi-Cal patients than physicians in any other major specialty groupings.17 Only 47% of surveyed psychiatrists reported having any Medi-Cal patients.
insured patients. Among primary care physicians, rates of participation in Medi-Cal and Medicare were similar, but non-primary care physicians were less likely to participate in Medi-Cal than in Medicare. The finding of a similar rate of primary care physician participation in Medi-Cal as Medicare may be somewhat misleading. Pediatricians have a very low rate of participation in Medicare because only children with longstanding, permanent disabilities are eligible for Medicare. Excluding pediatricians, 90% of primary care physicians (family physicians, geriatricians, general internists, and general practitioners) reported caring for Medicare patients, and 64% reported having Medi-Cal patients in their practice.
Medi-Cal and Medicare participation rates differed by major specialty groupings. (See Figure 2.) Physicians in all major specialty groups except obstetrician-gynecologists and pediatricians were less likely to have Medi-Cal patients than Medicare patients. The higher rates of Medi-Cal participation and lower rates of Medicare participation among pediatricians and obstetrician-gynecologists reflect differences between the populations these provid-ers serve and those served by other physicians. Children
Psychiatry
Family Medicine
Surgery
General Internal Medicine
Medical Specialties
Pediatrics
Obstetrics-Gynecology
Facility-Based82%
85%
76% 73%
75% 5%
67% 84%
65% 93%
65% 87%
64% 89%
47% 58%
■ Medi-Cal■ Medicare
Figure 2. California Physician Participation in Medi-Cal and Medicare, by Specialty, 2013
Note: There is a statistically significant difference in the rate of Medi-Cal participation among psychiatrists and among all other major specialty groupings. Differences between the percentages of physicians with any Medi-Cal or Medicare patients are statistically significant at p<.05 for family medicine, general internal medicine, pediatrics, medical specialties, and surgery. See Appendix C for lists of specialties in each group.
Source: Analysis of 2011 and 2013 Medical Board of California supplemental survey data performed by authors of this report.

7Physician Participation in Medi-Cal: Ready for the Enrollment Boom?
Degree of Medi-Cal ParticipationAmong physicians who reported having Medi-Cal patients, the average percentage of patients enrolled in Medi-Cal ranged from 18% to 27%.18 For primary care physicians, the average ranged from 22% to 30%, and for non-primary care physicians, the average was between 17% and 25%. These averages mask substantial variation in rates of Medi-Cal participation among primary care and non-primary care physicians.
Figure 3 shows the distribution of Medi-Cal patients among physicians who participate in Medi-Cal. For 61% of primary care physicians and 57% of non-primary care physicians, Medi-Cal patients accounted for less than 10% of patients in their practice.
To qualify for the Health Information Technology for Economic and Clinical Health Act funds to purchase elec-tronic health records (EHRs), physicians were required to have Medicaid beneficiaries comprise at least 30% of the patients in their practice.19 Only one-third of primary care physicians who participate in Medi-Cal (22% of all primary care physicians) and less than one-quarter of non-primary care physicians who participate in Medi-Cal (16% of all
non-primary care physicians) reported that 30% or more of their patients were enrolled in Medi-Cal.
Physicians in specific specialty groups differed in the breadth and depth of their Medi-Cal participation. (See Figure 4.) For example, the vast majority (82%) of facility-based physicians reported having any Medi-Cal patients, but only 21% reported that Medi-Cal patients comprise 30% or more of their total patient population. In contrast, pediatricians had a high rate of Medi-Cal participation (75%), and a relatively large percentage (43%) of pediatri-cians reported that Medi-Cal patients constitute 30% or more of their total patient population.
Figure 3. Concentration of Medi-Cal Patients Among Physicians: PCPs vs. Non-PCPs, 2013
Non-PCPsPCPs
22%
17%
28%
33%
16%
28%
27%
30%
■ 30%■ 10% to 29%■ 1% to 9%■ 0%
Note: Segments may not add to 100% due to rounding.
Source: Analysis of 2011 and 2013 Medical Board of California supplemen-tal survey data performed by authors of this report.
Psychiatry
Family Medicine
Surgery
General Internal Medicine
Medical Specialties
Pediatrics
Obstetrics-Gynecology
Facility-Based82%
21%
76% 28%
75% 43%
67% 14%
65% 11%
65% 10%
64% 20%
47% 26%
■ Any Medi-Cal ■ 30%+ Medi-Cal
Figure 4. California Physicians with Any and 30% or More Medi-Cal Patients, by Specialty, 2013
Note: There is a statistically significant difference in the percentage of pediatricians for whom Medi-Cal beneficiaries constitute 30% or more of total patients and the percentages for all other major specialty groupings (p<.05). See Appendix C for lists of specialties in each group.
Source: Analysis of 2011 and 2013 Medical Board of California supplemen-tal survey data performed by authors of this report.

8California HealthCare Foundation
Breadth and depth of Medi-Cal participation also var-ied among physicians in different types of practices. As Figure 5 shows, physicians who practice in community health centers or public clinics were the most likely to report having any Medi-Cal patients (92%) and were also the most likely to report that 30% or more of their patients are enrolled in Medi-Cal (61%). This finding reflects the mission of community health centers and public clinics to provide medical care to low-income people regard-less of their insurance status. Many of these sites are also reimbursed by Medi-Cal at a higher rate for similar types of visits than physicians in private practice because they meet certain federal or state community health center designations. Physicians in solo practice had the lowest rate of Medi-Cal participation. Only 54% of physicians in solo practice reported having any Medi-Cal patients. A relatively high percentage of Kaiser Permanente phy-sicians had Medi-Cal patients (71%), but only a small percentage (4%) reported that 30% or more of their patients were enrolled in Medi-Cal.
Adequacy of the Supply of Physicians Participating in Medi-CalEstimates of Medi-Cal participation rates alone are not sufficient to determine whether California has an ade-quate supply of physicians to provide care to Medi-Cal beneficiaries. Adequacy of physician supply is more accu-rately reflected in the ratio of full-time equivalent (FTE) physicians per a defined population size, often 100,000 people. For Medi-Cal, the pertinent ratio is the ratio of FTE physicians per 100,000 Medi-Cal enrollees.
Data on the average number of Medi-Cal enrollees during the months in which the supplemental survey was administered (March through August 2013) were obtained from the California Department of Health Services.20 Responses to the supplemental survey were used to estimate the number of FTE physicians serving Medi-Cal enrollees. For all respondents who indicated that they have any Medi-Cal patients, responses to a sur-vey question about the percentage of patients enrolled in Medi-Cal were used to create high and low estimates of full-time equivalence. The low estimates were based on the low ends of the response ranges, and the high estimates were based on the high ends. For example, if physicians reported that 10% to 19% of their patients were enrolled in Medi-Cal, the low estimate would be 0.1 FTE and the high estimate would be 0.19. Estimates for individual physicians were summed to estimate total Medi-Cal FTEs.
Table 1 presents high and low estimates of Medi-Cal FTEs in 2013. Among all physicians, the ratio of Medi-Cal FTE physicians per 100,000 Medi-Cal enrollees was within a range of 103 to 152 physicians. Among primary care physicians, the range was from 35 to 49 Medi-Cal FTE physicians per 100,000 Medi-Cal enrollees. The ratio of FTE primary care physicians to Medi-Cal enrollees is below the Health Services and Resources Administration’s estimate of need for primary care physicians (60 to 80 per 100,000 populations).21, 22 The low supply of FTE primary care physicians who provided care to Medi-Cal benefi-ciaries in 2013 suggests that the Medi-Cal program may have difficulty meeting the needs of a growing number of newly eligible beneficiaries who enroll in Medi-Cal as a result of the ACA. This potential lack of access to care could lead to an increase in visits to emergency depart-ments, many of which are already overcrowded.23, 24
Among non-primary care physicians, the range was from 68 to 102 Medi-Cal FTE physicians per 100,000 Medi-Cal
Figure 5. California Physicians with Any and 30% or More Medi-Cal Patients, by Practice Type, 2013
Note: For any Medi-Cal patients, the differences between physicians practicing in community health centers / public clinics and physicians practicing in other settings are statistically significant at p<.05. The differ-ences between solo practice and Kaiser Permanente and private group practice are also statistically significant at p<.05.
Source: Analysis of 2011 and 2013 Medical Board of California supplemen-tal survey data performed by authors of this report.
Other
Solo Practice
Kaiser Permanente
Private Group Practice
Community Health Center / Public Clinic
92%61%
76% 19%
71% 4%
54% 12%
58% 23%
65% 10%
64% 20%
47% 26%
■ Any Medi-Cal ■ 30%+ Medi-Cal

9Physician Participation in Medi-Cal: Ready for the Enrollment Boom?
Medi-Cal Participation by Geographic RegionRates of participation in Medi-Cal varied across regions of California. Statewide, 67% of primary care physicians reported having any Medi-Cal patients (with a 95% confi-dence interval of 64% to 70%). The Central Coast region had the lowest rate of primary care physician participa-tion in Medi-Cal (49%). The North Valley/Sierra region had the highest rate of Medi-Cal participation among primary care physicians (85%). See Figure 6.
For non-primary care physicians, the statewide Medi-Cal participation rate was 70% (with a 95% confidence interval of 68% to 71%). The San Diego region had the lowest rate of non-primary care physician participation in Medi-Cal (66%), with Orange County (67%) and the Bay Area and Los Angeles County regions (68% each) having slightly higher rates. The North region had the highest rate of Medi-Cal participation among non-primary care physicians (86%). See Figure 7 on page 10.
enrollees. Statewide, the ratio of FTE non-primary care physicians per 100,000 Medi-Cal beneficiaries fell within the federal estimate of need of 85 to 105 per 100,000.
Table 1. Supply of Full-Time Equivalent Physicians Serving Medi-Cal Beneficiaries, 2013
All PhySiCiAnS PCPs non-PCPs
Average number of Medi-Cal enrollees, March to August 2013
8,390,879 8,390,879 8,390,879
FTE Medi-Cal physicians
8,683 to 12,751
2,934 to 4,091
5,675 to 8,597
Ratio of Medi-Cal MDs per 100,000 Medi-Cal enrollees
103 to 152 35 to 49 68 to 102
Sources: Analysis of 2011 and 2013 Medical Board of California supple-mental survey data performed by authors of this report; author analysis of data on Medi-Cal certified eligible from the California Department of Health Services, www.dhcs.ca.gov.
NORTH(57%)
CENTRAL COAST(49%)
SAN DIEGO(63%)
SOUTH VALLEYSIERRA
(74%)
CENTRAL VALLEYSIERRA (72%)
INLANDEMPIRE(63%)
LOS ANGELES(66%)
ORANGE(61%)
BAY AREA(72%)
NORTH VALLEYSIERRA (85%)
Region’s Relationship to California Average*� Below range� Within range� Above range*67%, with a con�dence interval of 64% to 70%
Figure 6. Primary Care Physician Participation in Medi-Cal, by Region, 2013
Notes: Differences between regions with acceptance rates within the confidence interval for the statewide average and regions with rates below or above that interval are statistically significant at p<.05. See Appendix D for a list of the counties in each region.
Source: Analysis of 2011 and 2013 Medical Board of California supplemental survey data performed by authors of this report.

10California HealthCare Foundation
Physicians Accepting New Medi-Cal PatientsMonitoring rates of physician acceptance of new Medi-Cal patients is important, as implementation of the ACA has substantially increased the number of Californians eli-gible for Medi-Cal. The ability of new enrollees to get physician appointments is a key indicator of access to physicians. If new Medi-Cal enrollees cannot find physi-cians who will accept them as new patients, these new enrollees may delay care or go to emergency depart-ments for treatment that could be provided more effectively in physician offices or clinics at lower cost.
Figure 8 shows the percentage of California patient care physicians accepting new patients, by insurance status. In 2013 physicians were less likely to accept new Medi-Cal patients than new patients with private insurance or with Medicare. Whereas 79% of physicians accepted new pri-vately insured patients and 75% accepted new Medicare patients, only 62% accepted new Medi-Cal patients. Physicians, however, were more likely to accept new Medi-Cal patients than new uninsured patients (62% ver-sus 44%). These findings suggest that having Medi-Cal
NORTH(86%)
CENTRAL COAST(72%)
SAN DIEGO(66%)
SOUTH VALLEYSIERRA
(77%)
CENTRAL VALLEYSIERRA (77%)
INLANDEMPIRE(75%)
LOS ANGELES(68%)
ORANGE(67%)
BAY AREA(68%)
NORTH VALLEYSIERRA (80%)
Region’s Relationship to California Average*� Below range� Within range� Above range*70%, with a con�dence interval of 68% to 71%
Figure 7. Non-Primary Care Physician Participation in Medi-Cal, by Region, 2013
Notes: Differences between regions with acceptance rates within the confidence interval for the statewide average and regions with rates below or above that interval are statistically significant at p<.05. See Appendix D for a list of the counties in each region.
Source: Analysis of 2011 and 2013 Medical Board of California supplemental survey data performed by authors of this report.
Figure 8. California Physicians Accepting New Patients by Payer Status, 2013
Non-PCPs
PCPs
All Physicians79%
75% 62%
44%
76% 66%
57% 39%
80%79%
64% 47%
■ Privately Insured ■ Medi-Cal ■ Medicare ■ Uninsured
Note: All differences between accepting new Medi-Cal patients and new patients with other insurance statuses are statistically significant at p<.05.
Source: Analysis of 2011 and 2013 Medical Board of California supplemen-tal survey data performed by authors of this report.

11Physician Participation in Medi-Cal: Ready for the Enrollment Boom?
coverage increases access to new patient appointments relative to being uninsured, but not to the same level as that of privately insured and Medicare patients.
Rates of acceptance of new Medi-Cal patients differ sub-stantially across medical specialties. As Figure 9 shows, facility-based specialists, obstetrician-gynecologists, and pediatricians were most likely to accept new Medi-Cal patients. Of all specialties, psychiatrists were the least likely to accept new Medi-Cal patients. Physicians in all specialties except obstetrics-gynecology, pediatrics, and psychiatry were less likely to accept new Medi-Cal patients than new Medicare patients. While the percent-age of physicians who accept new Medi-Cal patients was lower than the percentage with any Medi-Cal patients in their practices, the pattern of the results relative to Medicare and private insurance was similar. These con-sistent findings are a strong indication that California physicians are less willing to care for Medi-Cal patients than patients covered by other forms of insurance.
Rates of acceptance of new Medi-Cal patients also dif-fered across types of physician practices. (See Figure 10.)
Psychiatry
General Internal Medicine
Family Medicine
Medical Specialties
Surgery
Pediatrics
Obstetrics-Gynecology
Facility-Based73%
81%
72% 73%
70% 25%
63% 87%
62% 86%
54% 77%
52% 81%
36% 45%
■ Medi-Cal■ Medicare
Figure 9. California Physicians Accepting New Medi-Cal and Medicare Patients, by Specialty, 2013
Note: There is a statistically significant difference in the percentage accepting new Medi-Cal versus Medicare patients at p<.05 for all specialties except obstetrics-gynecology and psychiatry. See Appendix C for lists of specialties in each group.
Source: Analysis of 2011 and 2013 Medical Board of California supplemental survey data performed by authors of this report.
Figure 10. California Physicians Accepting New Medi-Cal Patients, by Practice Type, 2013
Note: The difference between the percentage of physicians practicing in community health centers/public clinics who accept new Medi-Cal patients and physicians in all other types of practices is statistically significant at p<.05. The difference between physicians in solo practice and physicians who practice in Kaiser Permanente or private group practice is also statisti-cally significant at p<.05.
Source: Analysis of 2011 and 2013 Medical Board of California supplemen-tal survey data performed by authors of this report.
Other
Solo Practice
Private Group Practice
Kaiser Permanente
Community Health Center / Public Clinic
86%
68%
66%
44%
53%

12California HealthCare Foundation
care physicians accepting new Medi-Cal patients (36%) followed by the Central Valley/Sierra region (39%). The North Valley/Sierra region had the highest rate of primary care physicians accepting new Medi-Cal patients (72%).
Among non-primary care physicians statewide, 64% accepted new Medi-Cal patients in 2013 (confidence interval of 62% to 66%). (See Figure 12 on page 13.) The San Diego region had the lowest rate of non-primary care physicians accepting new Medi-Cal patients (54%) followed by the Los Angeles County region (63%). The Inland Empire region had the highest rate of accepting new Medi-Cal patients among primary care physicians (70%), followed by the Central Valley/Sierra, North, and North Valley/Sierra regions (69% each).
Physicians who practice in community or public clinics were the most likely to accept new Medi-Cal patients. As with findings for having any Medi-Cal patients, this finding reflects the mission of community and public clin-ics to serve Medi-Cal beneficiaries and other low-income patients. Physicians in solo practice were the least likely to accept new Medi-Cal patients. Findings were similar for physicians who are part of Kaiser Permanente’s medi-cal group and physicians in mid-sized and large group practices.
Physician acceptance of new Medi-Cal patients also varied by region. (See Figure 11.) Statewide, 57% of pri-mary care physicians accepted new Medi-Cal patients in 2013 (95% confidence interval of 54% to 60%). The Central Coast region had the lowest rate of primary
NORTH(55%)
CENTRAL COAST(36%)
SAN DIEGO(52%)
SOUTH VALLEYSIERRA
(52%)
CENTRAL VALLEYSIERRA (39%)
INLANDEMPIRE(58%)
LOS ANGELES(63%)
ORANGE(52%)
BAY AREA(56%)
NORTH VALLEYSIERRA (72%)
Region’s Relationship to California Average*� Below range� Within range� Above range*57%, with a con�dence interval of 54% to 60%
Figure 11. Primary Care Physicians Accepting New Medi-Cal Patients, by Region, 2013
Notes: Differences between regions with acceptance rates within the confidence interval for the statewide average and regions with rates below or above that interval are statistically significant at p<.05. See Appendix D for a list of the counties in each region.
Source: Analysis of 2011 and 2013 Medical Board of California supplemental survey data performed by authors of this report.

13Physician Participation in Medi-Cal: Ready for the Enrollment Boom?
NORTH(69%)
CENTRAL COAST(68%)
SAN DIEGO(54%)
SOUTH VALLEYSIERRA
(68%)
CENTRAL VALLEYSIERRA (69%)
INLANDEMPIRE(70%)
LOS ANGELES(63%)
ORANGE(65%)
BAY AREA(65%)
NORTH VALLEYSIERRA (69%)
Region’s Relationship to California Average*� Below range� Within range� Above range*64%, with a con�dence interval of 62% to 66%
Figure 12. Non-Primary Care Physicians Accepting New Medi-Cal Patients, by Region, 2013
Notes: Differences between regions with acceptance rates within the confidence interval for the statewide average and regions with rates below or above that interval are statistically significant at p<.05. See Appendix D for a list of the counties in each region.
Source: Analysis of 2011 and 2013 Medical Board of California supplemental survey data performed by authors of this report.

14California HealthCare Foundation
Do physicians accurately report their participation in Medi-Cal? The University of California, San Francisco, conducted a separate study to validate the responses of a subsample of physicians who participated in the 2013 supplemental survey. Physicians’ responses to the supplemental survey were compared with those obtained when research assistants posing as patients called the same physicians’ practices to make a new patient appointment.
The validation sample included 209 primary care physicians who indicated that they provide care to nonelderly adults and that their primary specialty was family medicine, general internal medicine, or general practice. These specialties and this patient age group were selected for the validation study because the majority of individuals newly eligible for Medi-Cal under the ACA are nonelderly adults.
Findings from the validation study suggest that the self-reported survey overestimates the rate at which physicians who provide primary care to adults accept new Medi-Cal patients in their practices. While 51% of the 209 primary care physicians reported on the survey that they accept new Medi-Cal patients, research assistants posing as Medi-Cal patients were only able to schedule new patient appointments with 33% of these same physicians. The research assistants were also less likely to obtain new patient appointments when they posed as privately insured patients (87% of physicians responding to the survey vs. 69% of telephone calls to physicians’ offices).
The reasons for the inaccurate self-reporting of accep-tance of new Medi-Cal patients are not known. Some physicians’ practices may have changed their policies on acceptance of new Medi-Cal patients between
the time the supplemental survey was administered (March 2013 to August 2013) and the time the tele-phone calls were made (November 2013 to February 2014). However, the size of the difference between the results obtained from the self-report in the survey and from the telephone calls by the research assis-tants makes this an unlikely explanation by itself. In some cases, physicians may have responded to the survey question in an aspirational manner — thinking about whether they would ever, as a matter of rou-tine practice, accept new Medi-Cal patients. Whereas administrative staff responding to the calls from the research assistants posing as Medi-Cal patients were indicating not only whether the physician was willing to accept new Medi-Cal patients but also whether the physician had the capacity to do so at that specific point in time. The finding that primary care physicians also overestimated their willingness to accept new privately insured patients as compared to the experi-ence of research assistants posing as privately insured patients (although to a lesser degree than they did for Medi-Cal patients) adds support to this explanation of the discrepancy. Finally, some physicians may have provided inaccurate information on the self-reported survey believing it is socially desirable to be perceived as accepting new Medi-Cal patients.
The findings of the validation study are limited to primary care physicians who provide care to adults. It is not known whether physicians in other specialties in which people typically make new patient appointments for ambulatory care also overestimate their participation in Medi-Cal. (The method of validation described is not appropriate for emergency medicine, pathology, and other specialties in which people usually do not make appointments with individual physicians.)
Accuracy of Physicians Self-Reporting New Medi-Cal Patient Acceptance

15Physician Participation in Medi-Cal: Ready for the Enrollment Boom?
Changes in Medi-Cal Participation Over TimeThe percentage of physicians with any Medi-Cal patients increased between 2011 and 2013 from 64% to 69%. (See Figure 13.) Participation increased among both pri-mary care physicians and non-primary care physicians, but the difference was statistically significant only for non-primary care physicians.
To better understand the factors that contributed to the increase in Medi-Cal participation, the concentration of Medi-Cal patients among participating physicians in 2011 was compared to the concentration in 2013. (See Figure 14.) Among both primary care physicians and non-primary care physicians, the percentages of physicians reporting that 1% to 9% of their patients were enrolled in Medi-Cal grew significantly. Among primary care physi-cians, the percentage with 1% to 9% Medi-Cal patients rose from 35% to 42%, and among non-primary care physicians, the percentage rose from 32% to 38%. Thus, much of the increase in Medi-Cal participation appears to be among physicians who treat relatively few Medi-Cal patients.
Figure 15 displays the distribution of Medi-Cal beneficia-ries among California physicians’ practices in 2011 and 2013. In each of these years, approximately 40% of phy-sicians provided 80% of Medi-Cal visits. The trend line for 2013 bends a bit more rapidly and does not flatten quite as soon as the line for 2011, reflecting the greater number of physicians who report having some Medi-Cal patients in their practices.
The increase in the percentage of physicians who serve relatively small numbers of Medi-Cal patients raises questions about whether the increase in the number of physicians serving Medi-Cal enrollees has been suffi-cient to keep pace with the growing number of Medi-Cal enrollees. During the period from 2011 to 2013, children previously enrolled in the Healthy Families Program were transferred to Medi-Cal, and as a consequence of this policy change and other factors, enrollment in Medi-Cal during these years increased by 10.5% — approximately 800,000 people.
Figure 13. California Physicians with Any Medi-Cal Patients, All Respondents, 2011 and 2013
Note: The difference in the percentage with any Medi-Cal patients in 2011 and 2013 is statistically significant at p<.05 for all physicians and non-primary care physicians. It is not statistically significant for primary care physicians.
Source: Analysis of 2011 and 2013 Medical Board of California supplemen-tal survey data performed by authors of this report.
Non-Primary Care Physicians
Primary Care Physicians
All Physicians
64%
69%
63%
67%
65%
70%
■ 2011 ■ 2013
2013201120132011
31%
35%
35%
33%
25%
42%
26%
42%
32%
22%
40%
38%
■ 1% to 9% ■ 10% to 29% ■ 30%
PCPs Non-PCPs
Figure 14. Concentration of Medi-Cal Patients Among Participating Physicians: PCPs vs. Non-PCPs 2011 and 2013
Note: Segments may not add to 100% due to rounding.
Source: Analysis of 2011 and 2013 Medical Board of California supplemen-tal survey data performed by authors of this report.

16California HealthCare Foundation
Among all physicians, the ratio of FTE Medi-Cal physi-cians to population rose between 2011 and 2013 from a range of 74 to 106 physicians per 100,000 Medi-Cal enrollees to a range of 103 to 152 physicians per 100,000 Medi-Cal enrollees. (See Figure 16.) Among primary care physicians, the range increased from 27 to 38 primary care physicians per 100,000 Medi-Cal enrollees in 2011 to 35 to 49 primary care physicians per 100,000 Medi-Cal enrollees in 2013. The increase in FTEs occurred primarily among family physicians and pediatricians. Among non-primary care physicians, the range increased from 46 to 68 non-primary care physicians per 100,000 Medi-Cal enrollees in 2011 to 68 to 102 non-primary care physi-cians per 100,000 Medi-Cal enrollees in 2013. Among non-primary care physicians, increases were not as con-centrated in particular specialties as they were in primary care.
There are two main reasons for the increase in the num-ber of FTE Medi-Cal physicians between 2011 and 2013. First, as Figure 13 shows, the percentage of physicians with at least some Medi-Cal patients in their practices increased from 64% to 69%. Second, the total number of physicians in California increased. The number of phy-sicians increased by 6% between 2011 and 2013, from 64,662 to 68,529 physicians.
0.0%
0.1%
0.2%
0.3%
0.4%
0.5%
0.6%
0.7%
0.8%
0.9%
1.0%
100%90%80%70%60%50%40%30%20%10%
2011 2013
PERCENTAGE OF PROVIDERS
PERCENTAGE OF MEDI-CAL VISITS
Figure 15. Distribution of Medi-Cal Visits Across All Physicians, 2013
Sources: Analysis of 2011 and 2013 Medical Board of California supplemental survey data performed by authors of this report; author analysis of data on Medi-Cal certified eligible from the California Department of Health Services, www.dhcs.ca.gov.
Figure 16. Full-Time Equivalent Medi-Cal Physicians per 100,000 Medi-Cal Beneficiaries, 2011 and 2013
Note: The bars indicate the midpoints of the estimated range of the ratio of physicians per 100,000 Medi-Cal beneficiaries. The black lines reflect upper- and lower-bound estimates of the ratio of physicians per 100,000 Medi-Cal beneficiaries, which are based on the upper and lower bounds of the ranges in the response options on the supplemental survey.
Sources: Analysis of 2011 and 2013 Medical Board of California supple-mental survey data performed by authors of this report; author analysis of data on Medi-Cal certified eligible from the California Department of Health Services, www.dhcs.ca.gov.
Non-PCPsPCPsAll Physicians
90
128
3342
57
85
■ 2011 ■ 2013
74–106
103–152
27–38
35–49
46–68
68 –102

17Physician Participation in Medi-Cal: Ready for the Enrollment Boom?
The concentration of Medi-Cal patients in 2011 and 2013 among physicians in different types of practices was examined to determine whether the increase in Medi-Cal participation was concentrated among physicians in spe-cific types of practices. As Table 2 illustrates, the average rates of Medi-Cal participation increased among physi-cians in all types of practices. The increase was greatest among physicians practicing in community health centers and public clinics. For these physicians, the average per-centage of patients enrolled in Medi-Cal rose from 25% to 30% in 2011 to 38% to 46% in 2013. However, only a small percentage of physicians practice in community health centers and public clinics (7% in 2013). The sub-stantial increase in Medi-Cal FTE physicians was due to a combination of this large increase in participation among community health center and public clinic physicians and smaller increases among physicians in other types of practices.
Table 2. Average Percentage of Patients Enrolled in Medi-Cal, by Practice Type, 2011 and 2013
PRACtiCE tyPE 2011 2013
Community health center / public clinic
25% to 30% 38% to 46%
Private group practice 7% to 11% 11% to 17%
Solo practice 7% to 10% 9% to 13%
Other 12% to 16% 15% to 20%
Note: Private group practice includes Kaiser Permanente. The ranges reflect lower-bound and upper-bound estimates of the percentages of Medi-Cal patients in physicians’ practices.
Source: Analysis of 2011 and 2013 Medical Board of California supplemen-tal survey data performed by authors of this report.
Conclusion
The results of the surveys administered to samples of physicians in 2011 and 2013 provide important insights regarding California physicians’ participa-
tion in Medi-Cal.
Acceptance of Medi-Cal Versus Other Insurance TypesCalifornia physicians continued to be less likely to have Medi-Cal patients than Medicare or privately insured patients. The number of California physicians who had any Medi-Cal patients was similar to the number who had any uninsured patients.
While California physicians were as likely to report having uninsured patients as Medicaid patients, they were more likely to report that they are willing to accept new Medi-Cal patients than uninsured patients into their practices. Physicians’ willingness to accept new Medi-Cal patients will be particularly important as Medi-Cal expands sub-stantially, perhaps by more than one million beneficiaries in California, as a result of the ACA.
Medi-Cal Participation by Major SpecialtyThere was wide variation across specialties and prac-tice types in physicians’ willingness to care for Medi-Cal patients. Facility-based physicians were the most likely group of physicians to care for Medi-Cal patients. These physicians, however, may not be making an individual choice, but may be responding to federal policies that require emergency departments to serve all patients regardless of insurance status or adhering to the admis-sion policies of the hospital or other institution with which they are affiliated. Physicians who practice in com-munity or public clinics were also more likely to care for Medi-Cal patients than the general physician population. Many health clinics are eligible for higher Medi-Cal reim-bursement rates than private practices and thus have a stronger incentive to care for Medi-Cal patients.
Physicians who practice in private office settings retain greater discretion than those working for clinics, hospi-tals, or other institutions as to whether to accept Medi-Cal patients. Researchers found some evidence to suggest that even in private office settings, group size influenced physicians’ likelihood of having Medi-Cal patients in their

18California HealthCare Foundation
practice. In general, physicians in larger groups were more likely than physicians in smaller groups or in solo practice to accept Medi-Cal patients. This finding may reflect a greater capacity in larger groups than in smaller practices to accept the financial consequences of accept-ing Medi-Cal patients or the ability of larger groups to provide care at a lower cost using nonphysician clinicians.
Regional VariationThere was wide variability across California’s regions as to whether physicians had any Medi-Cal patients in their practice or were accepting any new Medi-Cal patients. In most regions, Medi-Cal beneficiaries would likely have more difficulty finding a primary care physician than a non-primary care physician who would be willing to accept them as a new Medi-Cal patient. San Diego stands out as the only region in the state that had lower-than-average percentages of primary and non-primary care physicians who had any Medi-Cal patients and who were willing to accept new Medi-Cal patients. This finding is particularly concerning, as San Diego has been identified as a region that is expected to see one of the largest increases in Medi-Cal enrollment related to the ACA. On the other hand, Los Angeles, the county that is expected to have the largest number of new Medi-Cal enrollees related to the ACA, had an above average percentage of primary care physicians and an average percentage of specialist physicians who stated that they were willing to accept new Medi-Cal patients.
Full-Time Equivalent Physicians Serving Medi-Cal BeneficiariesRates of physician participation in Medi-Cal are not entirely sufficient to determine whether California has an adequate supply of physicians to meet the needs of Medi-Cal beneficiaries. A better measure may be the number of FTE physicians providing care to Medi-Cal benefi-ciaries. The actual number of FTE physicians providing care for Medi-Cal patients increased between 2011 and 2013 at a rate that was greater than the growth in the size of the Medi-Cal population, which was substantial — approximately 800,000 new Medi-Cal beneficiaries enrolled during this period.
Most of this growth in the population of physicians provid-ing care for Medi-Cal patients is among physicians who have a relatively small percentage of Medi-Cal patients in their practice, but these small contributions combined
to exceed the new demand associated with the growth of the Medi-Cal population. Some physicians who had been participating in Healthy Families and not Medi-Cal in 2011 may have started participating in Medi-Cal to allow patients who were previously covered by Healthy Families to remain in their practice. The percentage of pediatricians who had any Medi-Cal patients increased from 70% to 75% between 2011 and 2013. The number of FTE Medi-Cal pediatricians increased from a range of 869 to 1,054 pediatricians in 2011 to a range of 1,317 to 1,620 in 2013.
Supply of Physicians Serving Medi-Cal Patients Relative to NeedDespite the growth in the number of FTE physicians car-ing for Medi-Cal patients between 2011 and 2013, the number of FTE primary care physicians statewide who provide care to Medi-Cal beneficiaries was well below the federal standard. These findings are concerning as the ACA is resulting in a large increase in Medi-Cal enroll-ment.25 Without a surge in the number of primary care physicians willing to accept new Medi-Cal patients or an increase in the efficiency of the delivery of primary care services, many Medi-Cal beneficiaries may experience significant barriers to primary care, which could result in an increase in emergency department visits or delays in the receipt of necessary care.
Implications for Medi-Cal PaymentIn an effort to improve access to primary care, the ACA requires state Medicaid departments to increase 2013 and 2014 payment rates for evaluation and management services, and for certain vaccine administration services. The law limits enhanced payments to physicians with a primary specialty designation of family medicine, gen-eral internal medicine, or pediatric medicine and certain nonphysician practitioners. States are required to pay 100% of Medicare’s rates for these services, with the fed-eral government covering each state’s incremental costs (based on the difference between a state’s July 1, 2009, rates and Medicare’s 2013/2014 rates).26
California was among the last states to receive federal approval for its plan to implement this policy. Enhanced payments for primary care services were sent retrospec-tively to physicians beginning in November 2013. This delay and method of after-the-fact payment may have diminished the impact of this policy on preparing the

19Physician Participation in Medi-Cal: Ready for the Enrollment Boom?
California primary care physician workforce to increase its participation in Medi-Cal.
Previous studies suggest that increasing the generosity of payments provided by Medicaid and other insurance programs for low-income people can improve some but not all aspects of access to care.27 For example, one study that looked broadly at Medicaid enrollees of all ages and with multiple types of diseases and conditions found that Medicaid enrollees who live in states that pay physicians at higher rates are more likely to have a usual source of care, to have at least one physician visit per year, and to have a positive opinion of the care they received.28 In this study, however, Medicaid physician reimbursement rates were not associated with other major indicators of access to care, such as the probability of having unmet health care needs and the probability of receiving rec-ommended preventive services. Thus, while increasing Medi-Cal payments is likely to increase the availability of physicians for Medi-Cal beneficiaries, it may not be sufficient by itself to ensure improvements in the quality of care they receive. Increasing physician payment also does not address nonphysician factors that may affect beneficiaries’ ability to obtain needed care, such as lack of reliable transportation.
Need for Ongoing MonitoringThe findings from this survey underscore the need for ongo-ing monitoring of physician participation in Medi-Cal.29 Although the number of FTE physicians participating in Medi-Cal increased from 2011 to 2013, the ratio of FTE primary care physicians to Medi-Cal beneficiaries is well below the federal standard. Absent a substantial increase in primary care physician participation in Medi-Cal or some alternative means for expanding the availability of primary care services through greater use of nonphysi-cian clinicians, technological supports, or other systems improvements, Medi-Cal beneficiaries may face increas-ing difficulty obtaining primary care. Ongoing monitoring through physician surveys and other methods will help determine whether primary care physician participation in Medi-Cal rises in response to the expansion of enroll-ment. Ideally, this information should be collected for all California physicians so that the adequacy of the supply of Medi-Cal physicians could be assessed at the neigh-borhood level.

20California HealthCare Foundation
Appendix A. Survey Instrument
Dear Physician,
The University of California, San Francisco (UCSF) and its team of experienced researchers, with the assistance of the Medical Board of
California (MBC), is seeking information regarding physician practices in California. Your responses to these questions are critical in forming public
policy. Your participation in this endeavor is voluntary and the information will be treated confidentially and will not affect the timing or any other
aspect of your license renewal. The supplied information will be analyzed by the research team at UCSF and the findings will be presented only in
aggregate. No personal or identifying information will be shared with payers or other parties, and a specified protocol will be followed to safeguard
the information you provide. The UCSF research team may contact your office to confirm some of the information you supplied.
We would greatly appreciate your answering the following questionnaire and including your responses, along with your other license
renewal information, in the envelope provided. Alternatively, if you are completing your renewal on line, you may submit your responses through
the Web site. The study questions have been reviewed and approved by the MBC and UCSF’s Committee on Human Research.
Janet Coffman, PhD, Associate Professor Natalie Lowe
University of California, San Francisco Medical Board of California
(415) 476‐2435 (916) 263‐2382
Please answer each question by completely shading the appropriate circle like this
1. USE OF COMPUTERS IN YOUR MAIN PRACTICE LOCATION Does your main practice location have a computerized medical records system
(also known as an electronic health record or an electronic medical record)?
Yes See below No Go to Question 3 Do Not Know
YES, the feature is available
NO, the
feature is
not
available
DO
NOT
KNOW
If you answered “Yes” above, please answer the
following questions about your main practice location’s
computerized medical records system.
If a feature is available, please indicate to what extent
you use it.
Do not
use
Use
some of
the time
Use most
or all of
the time
Not
applicable
to my
practice or
specialty
a. Patient demographics (e.g., race/ethnicity)
b. Clinical notes (e.g., office visit notes)
c. Patient problem list/summary
d. List of medications patient takes
e. List of medication allergies
f. Ordering and transmitting prescriptions
electronically
g. Ordering laboratory tests
h. Viewing or receiving laboratory test results
i. Ordering radiology tests
j. Viewing printed records of radiology test results
k. Viewing images from radiology tests
l. Generating lists of patients by specific condition
m. Generating routine reports of quality indicators
n. Transmitting information electronically to entities
outside your practice to which you frequently refer
patients OR from which patients are referred to
you
o. Transmitting data to immunization registries
p. Patients able to access their own electronic record

21Physician Participation in Medi-Cal: Ready for the Enrollment Boom?
2. SATISFACTION If you answered “Yes” to Question 1, how satisfied are you with the computerized medical records system at your main practice
location. Very satisfied Somewhat satisfied Somewhat dissatisfied Very dissatisfied Go to Question 4
3. IF YOU DO NOT NOW HAVE A COMPUTERIZED MEDICAL RECORDS SYSTEM AT YOUR MAIN PRACTICE LOCATION Does your practice plan to
purchase one within the next 2 years? Yes No Undecided
4. INCENTIVES FOR EHR USE In 2011, Medicare and Medi‐Cal began offering financial incentives for physicians to adopt, implement, or upgrade
computerized medical records systems (also known as electronic health records or electronic medical records) and use them meaningfully in
practice. Please check only ONE answer from the list.
I have registered for the Medi‐Cal incentive. Go to Question 6 I have registered for the Medicare incentive. Go to Question 6
I plan to register for the Medi‐Cal incentive. Go to Question 6 I plan to register for the Medicare incentive. Go to Question 6
I plan to register for incentive payments but am uncertain as to whether Medicare or Medi‐Cal. Go to Question 6
I do not plan to register for either the Medi‐Cal or the Medicare incentive. Go to Question 5
5. REASONS FOR NOT REGISTERING If you do not plan to register for either the Medi‐Cal or Medicare incentive, please indicate why not.
Do not plan to use an EHR Money provided not sufficient Do not believe I am eligible Other reason
6. PRACTICE TYPE What is your principal practice location? (check only one)
Solo practice Kaiser Permanente
Small medical partnership (2 to 9 physicians) Community health center/public clinic
Group practice (10 to 49 physicians) VA or military
Large group practice including academia (50+ physicians) Other (specify ___________________________)
7. TIME SPENT IN HOSPITAL SETTINGS Do you spend 90% or more of your time in hospital settings (inpatient or emergency department)?
Yes No
8. PATIENT AGES What percentages of your patients are in the following age groups? (write in percentages, total should sum to 100%.)
Age 0‐17 Years Age 18‐64 Years Age 65 Years or Older Total
_____________ +
______________ +
_________________ =
100%
9. PAYERS Of your total number of patients (100%), what percentage are:
Private,
commercial,
other insurance
Medicare Medi‐Cal Healthy Families Other (e.g., VA,
CHAMPUS) Uninsured
0%
1 to 9%
10 to 19%
20 to 29%
30 to 39%
40 to 49%
50 to 59%
60 to 69%
70 to 79%
80 to 89%
90 to 99%
100%
10. New Patients
a. Are you currently accepting new patients in your practice with private insurance? Yes No
b. Are you currently accepting new Medicare patients in your practice? Yes No
c. Are you currently accepting new fee‐for‐service Medi‐Cal patients in your practice? Yes No
d. Are you currently accepting new Medi‐Cal managed care (HMO) patients in your practice? Yes No
e. Are you currently accepting any new uninsured patients in your practice who are unable to pay? Yes No
f. Are you a cash only (no 3rd party insurance) practice? Yes No

22California HealthCare Foundation
This report presents data from surveys of samples of physicians that were conducted in 2011 and 2013. The surveys were distributed to physicians renewing their medical licenses through the Medical Board of California, the state agency responsible for licensing physicians with MD degrees. During the reapplication process, physicians complete a mandatory survey that includes questions on race/ethnicity, languages spoken, training status, medical specialty, board certification, work hours, and practice location.
For this study, University of California, San Francisco (UCSF), developed a one-page double-sided supplemen-tal questionnaire that was included in the materials sent to physicians whose license renewals were due between June 1 and July 31, 2011, and between June 1 and July 31, 2013. Distributing the survey during the same months in 2011 and 2013 ensured that there would be substantial overlap between the two samples, because California requires physicians to renew their licenses every two years during the month in which their birth-day occurs. Because the timing of the relicensing process is based on the applicant’s birth month, the sample approximated a random sample. As discussed below, the sample is also representative of the population of physi-cians who provide patient care in California.
This is the third supplemental survey on which UCSF has partnered with the Medical Board. (A copy of the supple-mental survey instrument appears in Appendix A.) The supplemental questionnaire was accompanied by a letter indicating that its completion was voluntary. Physicians were given 90 days to complete the mandatory and supplemental surveys either by returning the materials by mail or by entering their answers online through the Medical Board website. Physicians received reminders if they renewed their license but did not complete either the mandatory or the supplemental survey. No financial incentives for participation were provided.
For this report, UCSF analyzed data from the supple-mental survey, the mandatory survey, and the Medical Board’s core licensing file. Physicians were included in the analysis if they reported that they have an active license, practice in California, have completed their med-ical training, and provide patient care at least 20 hours per week. In 2011 the supplemental survey was mailed to 10,353 physicians, 4,986 of whom were eligible for
the study. The 2013 supplemental survey was mailed to 9,762 physicians, of whom 5,548 were eligible for the study. Response rates among eligible physicians were 65% (n = 3,241) in 2011 and 63% (n = 3,499) in 2013. The use of the threshold of 20 hours of patient care per week is consistent with the American Medical Association’s cri-teria for identifying active patient care physicians.
Estimates of percentages of physicians with any Medi-Cal, Medicare, privately insured, or uninsured patients were based on questions about physicians’ payer mix. Physicians were asked to choose a range of percentages that best described the percentage of their patients with a particular type of insurance. For each type of insurance, physicians could choose 0%, 1 to 9%, 10 to 19%, etc., in increments of 10, up to 100%. The instructions indicated that the total payer mix should equal 100%.
Lower-bound and upper-bound estimates of full-time equivalent physicians (FTE) providing care to Medi-Cal enrollees were estimated using the lower and upper bounds of ranges of the response options. For example,
Figure 17. Identification of Respondents Included in Analyses, 2013
*Physicians not in the military, disabled, or retired.
Source: Analysis of 2011 and 2013 Medical Board of California supplemen-tal survey data performed by authors of this report.
Completed Supplemental Survey
Provide Patient Care at Least 20 Hours per Week
Completed Training
Practice in California
Actively Licensed*
Total Surveys Mailed
9,762
9,003
7,539
6,926
5,548
3,499
Appendix B. Methodology

23Physician Participation in Medi-Cal: Ready for the Enrollment Boom?
if a physician reported that 10 to 19% of their patients were enrolled in Medi-Cal, the lower-bound estimate of Medi-Cal FTE for the physician would be 0.1, and the upper-bound estimate would be 0.19. Lower-bound and upper-bound estimates were summarized across eligible respondents to generate lower-bound and upper-bound estimates of the total number of FTE physicians serv-ing Medi-Cal beneficiaries. Estimates were generated for all eligible respondents and for primary care and non-primary care physicians. Data from the California Department of Health Care Services on the number of people enrolled in Medi-Cal were used to calculate ratios of FTE Medi-Cal physicians per 100,000 Medi-Cal beneficiaries.
Analyses that compared primary care and non-primary care physicians relied on physicians’ responses to a ques-tion on the mandatory survey that asked them to indicate their primary and secondary specialties. Primary care physicians were defined as physicians who indicated that their primary specialty is family practice, general prac-tice, geriatrics, internal medicine, or pediatrics and who reported that they spent less than 90% of their patient care hours in hospital settings. Physicians in primary care specialties who indicated that they spent 90% or more of their patient care hours in hospital settings were deemed to be hospitalists and classified as non-primary care phy-sicians. Physicians whose primary specialties were not among the primary care specialties listed above were also classified as non-primary care physicians. Some physicians reported that they were board certified in a specialty but listed neither a primary nor secondary specialty. For those physicians, it was assumed that the specialty in which they were board certified was their pri-mary specialty.
Estimates of the percentage of physicians accepting new Medi-Cal, Medicare, privately insured, or uninsured patients were based on responses to yes/no questions. Physicians were considered to be accepting new Medi-Cal patients if they indicated that they accepted new Medi-Cal fee-for-service patients and/or new Medi-Cal managed care patients. In this sample, the majority of physicians accepting new Medi-Cal patients accepted both fee-for-service and managed care patients.
For all analyses, point estimates and 95% confidence intervals were calculated. Statistical tests were performed to determine whether there were statistically significant differences in point estimates.
To address potential bias associated with the characteris-tics of respondents, responses were weighted in inverse proportion to the response rates within specific groups for age (<40 years, 40 to 64 years, ≥65 years), gender, and geographic region. Weighting the survey responses in this manner generates estimates that better reflect the total population of physicians with active California licenses.
limitationsThe survey has several limitations. Because the sur-vey was administered as part of the Medical Board of California’s relicensure process, the study does not include osteopathic physicians who are licensed by the Osteopathic Medical Board of California. This limitation is minor because the overwhelming majority of physicians licensed in California are MDs. In 2012, California had 130,440 licensed MDs and only 5,057 licensed DOs.30
In addition, the study relied on physician self-reporting of Medi-Cal participation. As described in the sidebar on page 14, physicians tend to overestimate the extent to which they accept new Medi-Cal patients in their practices. This suggests that our estimates of physician participation and supply relative to the Medi-Cal popula-tion is a best-case scenario. This is of particular concern in terms of Medi-Cal beneficiaries’ access to primary care physicians because the number of FTE primary care physicians serving Medi-Cal enrollees based on survey responses is low relative to federal estimates of need.

24California HealthCare Foundation
Facility-Based SpecialtiesAnesthesiologyEmergency MedicineNuclear MedicinePathologyPhysical Medicine and RehabilitationRadiation OncologyRadiology
Family MedicineFamily Medicine*General Practice
General Internal MedicineGeriatricsInternal Medicine*
Medical SpecialtiesAllergy and ImmunologyCardiologyCritical CareDermatologyEndocrinologyGastroenterologyHematologyInfectious DiseaseMedical GeneticsNephrologyNeurologyOccupational MedicineOncologyPulmonologyRheumatologySleep Medicine
Obstetrics-GynecologyObstetrics/Gynecology
PediatricsNeonatal Perinatal MedicinePediatrics*
PsychiatryPsychiatry
Surgical SpecialtiesColon and Rectal SurgeryCosmetic SurgeryFacial/Plastic/Reconstructive SurgeryGeneral SurgeryNeurological SurgeryOphthalmologyOrthopedic SurgeryOtolaryngologyPlastic SurgerySpine SurgerySports MedicineSurgical OncologyThoracic SurgeryUrologyVascular Surgery
*Internists, pediatricians, and family physicians who reported spending 90% or more of their patient care hours in hospitals were reclassified as facility-based specialists.
Appendix C. Major Specialty Groups

25Physician Participation in Medi-Cal: Ready for the Enrollment Boom?
CENTRALCOAST SOUTH VALLEY/
SIERRA
ORANGE
LOS ANGELES
BAY AREA
NORTH VALLEY/SIERRA
NORTH
CENTRAL VALLEY/SIERRA
INLANDEMPIRE
SAN DIEGO
REgion CountiES
Bay Area Alameda, Contra Costa, Marin, Napa, San Francisco, San Mateo, Santa Clara, Santa Cruz, Solano, Sonoma
Central Coast Monterey, San Benito, San Luis Obispo, Santa Barbara, Ventura
Cental Valley/Sierra Alpine, Amador, Calaveras, San Joaquin, Stanislaus, Tuolumne
Inland Empire Inyo, Mono, Riverside, San Bernardino
los Angeles Los Angeles
North Butte, Colusa, Del Norte, Glenn, Humboldt, Lake, Lassen, Mendocino, Modoc, Plumas, Shasta, Siskiyou, Tehama, Trinity
North Valley/Sierra El Dorado, Nevada, Placer, Sacramento, Sierra, Sutter, Yolo, Yuba
Orange County Orange
San Diego Imperial, San Diego
South Valley/Sierra Fresno, Kern, Kings, Madera, Mariposa, Merced, Tulare
Appendix D. Regional Definitions

26California HealthCare Foundation
1. Authors’ estimates using data from the California Department of Health Care Services’ “Medi-Cal Monthly Eligibles Trend Report for January 2014,” www.dhcs.ca.gov.
2. California Department of Health Care Services, “Medi-Cal Monthly Eligibles Trend Report for January 2014,” www.dhcs.ca.gov.
3. California Department of Health Care Services, “Medi-Cal Expansion and Enrollment Update,” February 21, 2014, www.dhcs.ca.gov.
4. Office of Governor Edmund G. Brown, “Governor Brown Expands Health Care Coverage, Pays Down Debt and Shores Up Teachers’ Pensions in Revised State Budget,” May 13, 2014, www.gov.ca.gov.
5. A. B. Bindman, P. Chu, and K. Grumbach, Physician Participation in Medi-Cal, 2008, California HealthCare Foundation, July 2010, www.chcf.org.
6. Council on Graduate Medical Education (COGME), Patient Care Physician Supply and Requirements: Testing COGME Recommendations (Eighth Report), November 1996, www.hrsa.gov.
7. S. L. Decker, “In 2011 Nearly One-Third of Physicians Said They Would Not Accept New Medicaid Patients, But Rising Fees May Help,” Health Affairs (Millwood) 31, no. 8 (August 2012): 1,673–1,679.
8. S. L. Decker, “Two-Thirds of Primary Care Physicians Accepted New Medicaid Patients in 2011–12: A Baseline to Measure Future Acceptance Rates,” Health Affairs (Millwood) 32, no. 7 (July 2013): 1,183–1,187.
9. P. Cunningham and L. Nichols, “The Effects of Medicaid Reimbursement on the Access to Care of Medicaid Enrollees: A Community Perspective,” Medical Care Research and Review 62, no. 6 (2005): 676–695.
10. Stephen Zuckerman and Dana Goin, “How Much Will Medicaid Physician Fees for Primary Care Rise in 2013? Evidence from a 2012 Survey of Medicaid Physician Fees,” The Urban Institute and Kaiser Commission on Medicaid and the Uninsured, December 2012, www.kaiserfamilyfoundation.files.wordpress.com.
11. S. L. Decker, “In 2011 Nearly One-Third of Physicians Said They Would Not Accept New Medicaid Patients, But Rising Fees May Help,” Health Affairs (Millwood) 31, no. 8 (August 2012): 1,673–1,679.
12. A. B. Bindman et al., “Preventable Hospitalizations and Access to Health Care,” JAMA 274, no. 4 (1995): 305–11.
13. N. Tang et al., “Trends and Characteristics of US Emergency Department Visits, 1997–2007,” JAMA 304, no. 6 (August 11, 2010): 664–670.
14. California HealthCare Foundation, Medi-Cal at a Crossroads: What Enrollees Say About the Program, research conducted by Lake Research Partners, May 2012, www.chcf.org.
15. Primary care physicians are defined as physicians whose primary specialty is family medicine, general practice, geriatrics, internal medicine, or pediatrics. Non-primary care physicians are defined as physicians with other primary specialties.
16. The Emergency Medical Treatment and Active Labor Act (EMTALA) was enacted in 1986. It requires emergency departments in all hospitals that participate in Medicare to screen and stabilize all patients regardless of their ability to pay. S. Rosenbaum, “The Enduring Role of the Emergency Medical Treatment and Active Labor Act,” Health Affairs (Millwood) 32, no. 12 (December 2013): 2,075–2,081.
17. E. Stranges, K. Ryan, and A. Elixhauser, “Medicaid Hospitalizations, 2008. Healthcare Cost and Utilization Project Statistical Brief #104,” Agency for Healthcare Research and Quality, January 2011, www.hcup-us.ahrq.gov.
18. The range of estimates of the average percentage of Medi-Cal patients was determined by using the low and high values for the ranges presented to physicians as response options. Except for 0% and 100%, the response options were decile ranges (e.g., 1% to 9%, 10% to 19%).
19. For pediatricians, the threshold is 20%. Furthermore, this study reflects the practice concentrations of physicians who provide 20 or more hours per week of patient care; however, physicians providing fewer than 20 hours per week of patient care may qualify for the HITECH EHR subsidies. Physicians employed by facilities such as hospitals, as opposed to those working primarily in office-based practices or community clinics, may not be eligible for EHR subsidies even if they meet the 30% Medicaid threshold, although these institutions have other mechanisms for obtaining federal funds to purchase HIT for their providers.
20. Author analysis of data on Medi-Cal certified eligible from the California Department of Health Services, www.dhcs.ca.gov. The Medical Board distributes licensure renewal materials, including the supplemental surveys, to physicians three months in advance of the expiration date and gives them a one-month grace period afterward. For physicians whose renewals were due in June 2013, supplemental surveys were mailed in March 2013, and responses were accepted through the end of July 2013. For physicians whose renewals were due in July 2013, supplemental surveys were mailed in April 2013, and responses were accepted through the end of August 2013.
21. This benchmark was established in 1996 based largely on panel sizes observed in Kaiser Permanente and other medical groups that are part of integrated delivery systems.
22. Council on Graduate Medical Education (COGME), Patient Care Physician Supply and Requirements: Testing COGME Recommendations (Eighth Report), 1996, www.hrsa.gov.
23. E. Brown, “Doctors Give California an ‘F’ for Lacking Emergency Room Beds,” Los Angeles Times, January 15, 2014, articles.latimes.com.
Endnotes

27Physician Participation in Medi-Cal: Ready for the Enrollment Boom?
24. R. Y. Hsia et al., “California Hospitals Serving Large Minority Populations Were More Likely Than Others to Employ Ambulance Diversion,” Health Affairs (Millwood) 31, no. 8 (August 2012): 1,767–1,776.
25. Office of Governor Edmund G. Brown, “Governor Brown Expands Health Care Coverage, Pays Down Debt and Shores Up Teachers’ Pensions in Revised State Budget,” May 13, 2014, www.gov.ca.gov.
26. Centers for Medicare and Medicaid Services. RIN 0938-AQ63. November 6, 2012, www.federalregister.gov.
27 J. W. Cohen. ‘‘Medicaid Physician Fees and Use of Physician and Hospital Services.’’ Inquiry 30, no. 3 (Fall 1993): 281–292; J. W. Cohen and P. J. Cunningham. ‘‘Medicaid Physician Fee Levels and Children’s Access to Care.’’ Health Affairs 14, no. 1 (Spring 1995):255–262; S. L. Decker. “Changes in Medicaid Physician Fees and Patterns of Ambulatory Care.” Inquiry 46, no. 3 (Fall 2009): 291–304; G. M. Kenney, J. Marton, A. E. Klein, J. E. Pelletier, and J. Talbert. “The Effects of Medicaid and CHIP Policy Changes on Receipt of Preventive Care among Children” Health Services Research 46, no. 1 (February 2011); 298–318; Y. C. Shen and S. Zuckerman, “The Effect of Medicaid Payment Generosity on Access and Use Among Beneficiaries,” Health Services Research 40, no. 3 (June 2005): 723–744; C. White. “A Comparison of Two Approaches to Increasing Access to Care: Expanding Coverage versus Increasing Physician Fees.” Health Services Research 47, no. 3 (June 2012): 963–983.
28. Y. C. Shen and S. Zuckerman, “The Effect of Medicaid Payment Generosity on Access and Use Among Beneficiaries,” Health Services Research 40, no. 3 (June 2005): 723–744.
29. Surveying physicians is one of several means for monitoring Medi-Cal beneficiaries’ access to care. One alternative would be to analyze Medi-Cal claims. The feasibility of that approach depends on the accuracy of the claims data available to the California Department of Health Care Services (DHCS). The accuracy of claims data has become increasingly problematic as the percentage of Medi-Cal beneficiaries enrolled in managed care plans has increased. Since 2013, the majority of Medi-Cal beneficiaries in all counties have been enrolled in managed care plans that do not provide DHCS with the same level of detail about use of health care services that it has for beneficiaries who have fee-for-service coverage.
30. Physicians and Surgeons (MD), June 2012, California Office of Statewide Health Planning and Development, www.oshpd.ca.gov; Osteopathic Physicians and Surgeons, September 2012, California Office of Statewide Health Planning and Development, www.oshpd.ca.gov.