Embed Size (px)
Citation preview

1
Page 1February 9, 2012
Prepared for AHLA Physicians and Physician Organizations Law Institute
Physician Employment Losses:Alarming Trend or Misunderstood
Performance Metric?
Douglas K. Anning, Jon-David Deeson
Page 2February 9, 2012
Prepared for AHLA Physicians and Physician Organizations Law Institute
Net Loss per FTE PhysicianHospital/IDS Owned – Multispecialty
2005 – 2010
Source: MGMA Cost Survey, 2011.*For 2008, Net income, practices without financial support was used to provide a more accurate data point.
1998 Loss per Physician = $83,000
$0
$50,000
$100,000
$150,000
$200,000
$250,000
2005 (n=105)
2006 (n=99)
2007 (n=97)
2008* (n=83)
2009 (n=242)
2010 (n=189)
Mean
Median

2
Page 3February 9, 2012
Prepared for AHLA Physicians and Physician Organizations Law Institute
Net Loss per FTE Physician
Source: MGMA Cost Survey, 2011.
$500,000 $400,000 $300,000 $200,000 $100,000 $0 $100,000 $200,000 $300,000
Not Hospital/IDSOwned
Hospital/IDSOwned
25th %tile
10th %tile
Net Loss, 2000
90th %tile
75th %tile
Median
Standard Deviation
Mean
$189,910
Multispecialty
Page 4February 9, 2012
Prepared for AHLA Physicians and Physician Organizations Law Institute
$0
$100,000
$200,000
$300,000
$400,000
$500,000
$600,000
$700,000
10th %tile
Median
90th %tile
Net Loss per FTE Physician
Source: MGMA Cost Survey, 2011.
Eastern(n=39)
Midwest(n=41)
Southern(n=84)
Western(n=25)
Overall 10th %tile = $467,108
Overall Median = $189,910
Overall 90th %tile = $18,273
Hospital/IDS Owned – MultispecialtyGeographic Section

3
Page 5February 9, 2012
Prepared for AHLA Physicians and Physician Organizations Law Institute
$0
$100,000
$200,000
$300,000
$400,000
$500,000
$600,000
$700,000
≤10 11-25 26-50 51-75 76-150 ≥151
Hospital/IDS Owned – Multispecialty Number of Physician FTEs
10th %tile
Median
90th %tile
Net Loss per FTE Physician
Source: MGMA Cost Survey, 2011.
(n=94) (n=22) (n=13) (n=24) (n=19)
Overall 10th %tile = $467,108
Overall Median = $189,910
Overall 90th %tile = $18,273
(n=17)
Page 6February 9, 2012
Prepared for AHLA Physicians and Physician Organizations Law Institute
Alarming Trend or Misunderstood Performance Metric?
Payer Mix?
Physician Specialty?Capacity?
Culture?

4
Page 7February 9, 2012
Prepared for AHLA Physicians and Physician Organizations Law Institute
Industry Response• Repeat of the 1990’s?
– “Practice losses increasingly untenable” – Health Care Advisory Board (1999)
– “Employment choices physicians make today may not be able to be undone” – NEJM, 2011
Problem versus predicament…
– Financial, operational, strategy and potentially legal matters to consider
– Leadership is critical
Page 8February 9, 2012
Prepared for AHLA Physicians and Physician Organizations Law Institute
Hospital / IDS Owned Employment Trends
70%
30%
Yes
No
Does your hospital/system plan to employ a greater percentage of
physicians in the next 12-36 months?
HealthLeaders Intelligence Report
Top 5 Service Lines
Primary care
Hospitalists
General Surgery
Cardiology
Orthopaedics
71%
71%
51%
50%
39%Source: HealthLeaders Intelligence Report, September 2011

5
Page 9February 9, 2012
Prepared for AHLA Physicians and Physician Organizations Law Institute
U.S. Physician Practice Ownership
20%
30%
40%
50%
60%
70%
2005 2006 2007 2008 2009 2010
Hospital/IDS Owned
Physician Owned
42%
53%
10 Years Ago (2000)
MGMA
AMGA
76% 21%
54% 39%
Source: MGMA Cost Survey, 2006-2011.
Hospital/IDS: 51%
AMGA (2011)
Physicians: 40%
Page 10February 9, 2012
Prepared for AHLA Physicians and Physician Organizations Law Institute
By the Numbers…
Source: MGMA Cost Survey, 2011.
Median Data Hospital/IDS OwnedNot Hospital/IDS
Owned
Count 190 168
Total physician FTEs 11.10 34.90
Total non-physician provider FTEs 5.28 8.95
Number of branch clinics 14 5
Practice model characteristics are different

6
Page 11February 9, 2012
Prepared for AHLA Physicians and Physician Organizations Law Institute
By the Numbers…
Source: MGMA Physician Compensation and Production Survey, 2011.
Card
FP
Hosp
IM
OB/GYN
Peds
Gen Surg
Ortho Surg
1
1Includes Urgent Care.
68%
Physician specialty does influence multispecialty data
Hospital/IDS Owned
Page 12February 9, 2012
Prepared for AHLA Physicians and Physician Organizations Law Institute
Physician Compensationas a Percent of Collections
Source: MGMA Physician Compensation and Production, and Cost Survey, 2011.
0%
20%
40%
60%
80%
100%
120%
140%
Card FP IM Hosp OB/GYN Peds Gen Surg Ortho Surg
Hospital/IDSOwned
Not Hospital/IDSOwned
$83,800(n = 18)
$103,234(n = 299)
$226,823(n = 128)
$282,986(n = 68)
$185,861(n = 94)
$265,669(n = 38)
$21,833(n = 40)
$259,645(n = 44)
Net Loss per FTE MD:
Hospital/IDS
7
Page 13February 9, 2012
Prepared for AHLA Physicians and Physician Organizations Law Institute
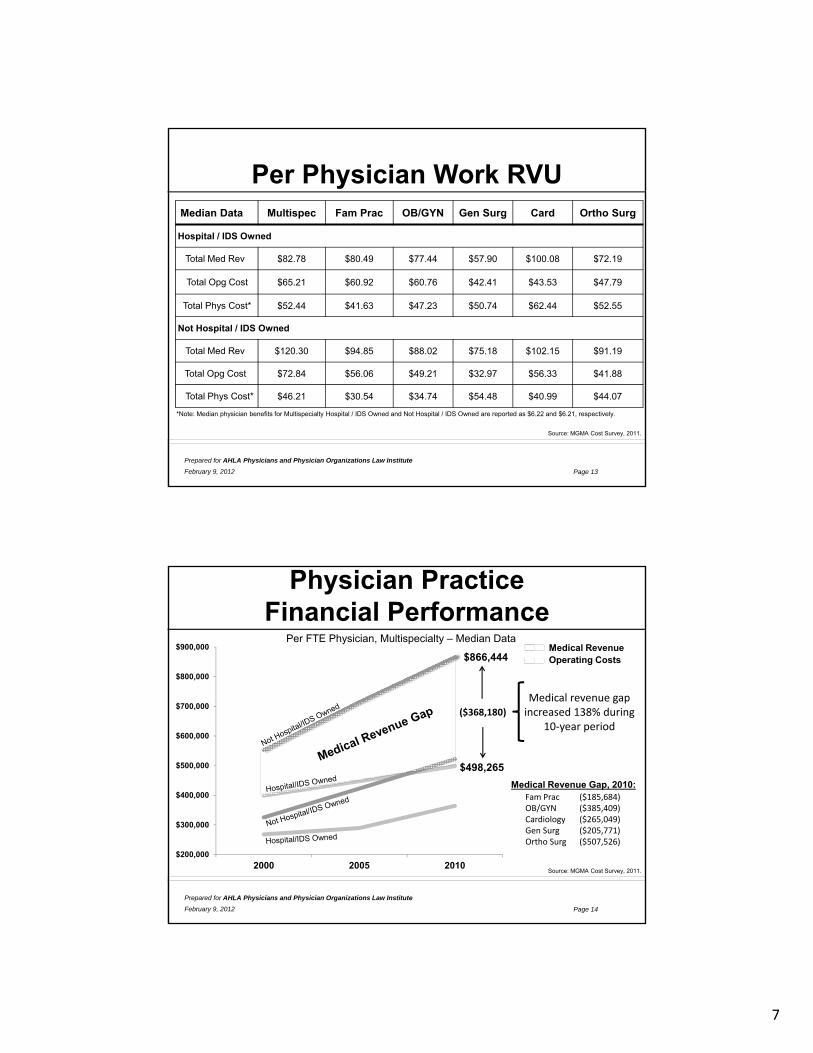
Per Physician Work RVU
*Note: Median physician benefits for Multispecialty Hospital / IDS Owned and Not Hospital / IDS Owned are reported as $6.22 and $6.21, respectively.
Source: MGMA Cost Survey, 2011.
Median Data Multispec Fam Prac OB/GYN Gen Surg Card Ortho Surg
Hospital / IDS Owned
Total Med Rev $82.78 $80.49 $77.44 $57.90 $100.08 $72.19
Total Opg Cost $65.21 $60.92 $60.76 $42.41 $43.53 $47.79
Total Phys Cost* $52.44 $41.63 $47.23 $50.74 $62.44 $52.55
Not Hospital / IDS Owned
Total Med Rev $120.30 $94.85 $88.02 $75.18 $102.15 $91.19
Total Opg Cost $72.84 $56.06 $49.21 $32.97 $56.33 $41.88
Total Phys Cost* $46.21 $30.54 $34.74 $54.48 $40.99 $44.07
Page 14February 9, 2012
Prepared for AHLA Physicians and Physician Organizations Law Institute
$200,000
$300,000
$400,000
$500,000
$600,000
$700,000
$800,000
$900,000
2000 2005 2010
Physician Practice Financial Performance
Source: MGMA Cost Survey, 2011.
Medical RevenueOperating Costs$866,444
$498,265
Per FTE Physician, Multispecialty – Median Data
($368,180)
Medical Revenue Gap, 2010:Fam Prac ($185,684)OB/GYN ($385,409)Cardiology ($265,049)Gen Surg ($205,771)Ortho Surg ($507,526)
Medical revenue gap increased 138% during
10‐year period

8
Page 15February 9, 2012
Prepared for AHLA Physicians and Physician Organizations Law Institute
Operating Costs
Source: MGMA Cost Survey, 2011.
$0
$10,000
$20,000
$30,000
$40,000
$50,000
$60,000
$70,000
Mgmt Fee Bldg &Occup
Staff StaffBenefits
ProfLiability
Info Tech
Hospital/IDS Owned
Not Hospital/IDS Owned
Hosp/IDS: 72.99% (O/H)3.46 (FTEs)
Not Hosp: 63.67% (O/H)5.52 (FTEs)
Per FTE Physician, Multispecialty – Median Data
Overhead (O/H) and FTEs
1
1
1Per FTE support staff.
Page 16February 9, 2012
Prepared for AHLA Physicians and Physician Organizations Law Institute
Physician Costs
Source: MGMA Cost Survey, 2011.
0.00%
10.00%
20.00%
30.00%
40.00%
50.00%
60.00%
70.00%
Total Cost Medical Revenue
Hospital/IDS Owned
Not Hospital/IDSOwned
As a Percent of, Multispecialty – Median Data

9
Page 17February 9, 2012
Prepared for AHLA Physicians and Physician Organizations Law Institute
Ancillary Services
$0
$20,000
$40,000
$60,000
$80,000
$100,000
$120,000
$140,000
$160,000
Clinical Lab/Pathology Diagnostic Radiology/Imaging
Not Hospital/IDS Owned
Hospital/IDS Owned
Proc./MD = 4,769GC/Pat. = $81.10
Proc./MD = 2,445GC/Pat. = $33.67
Note: Proc./MD = Procedures per Physician and GC/Pat. = Gross Charges per Patient
Proc./MD = 632GC/Pat. = $55.76
Proc./MD = 282GC/Pat. = $19.04
Source: MGMA Cost Survey, 2011.
Gross Charges per FTE Physician, Multispecialty – Median Data
Page 18February 9, 2012
Prepared for AHLA Physicians and Physician Organizations Law Institute
Surgical and Medical
$0
$100,000
$200,000
$300,000
$400,000
$500,000
$600,000
$700,000
Surgery/AnesthesiaProcedures
Surgery/AnesthesiaProcedures
Medical Procedures Medical Procedures
Hospital/IDSOwned
Not Hospital/IDSOwned
(outside practice)(outside practice)
(inside practice)(inside practice)
Source: MGMA Cost Survey, 2011.
Procedures/Physician
Gross Charges/Patient
Gross Charges per FTE Physician, Multispecialty – Median Data
183 166 227 350 629 497 4,325 5,788
$146.14 $94.50 $53.91 $44.73 $67.94 $42.21 $332.31 $371.82

10
Page 19February 9, 2012
Prepared for AHLA Physicians and Physician Organizations Law Institute
Key Performance Metrics
Source: MGMA Performance and Practices of Successful Medical Groups, 2010 and MGMA Cost Survey, 2011.
MultispecialtyMedian Data
Hospital/IDS OwnedNot Hospital/IDS
OwnedAll Owners –
Better Performers
120+ Days in A/R 24.91% 15.01% 10.23%
Days in A/R 49.53 34.79 30.56
Net Collection % 96.59% 98.32% 99.28%
Overhead % 72.99% 63.67% 61.97%
Payer Mix
Commercial 42.70% 46.39%
Medicare 24.08% 25.30%
Medicaid 9.16% 3.53%
Self-Pay 3.30% 2.80%
Financial performance and payer mix variances do exist
Page 20February 9, 2012
Prepared for AHLA Physicians and Physician Organizations Law Institute
Better Performers
0.00%
10.00%
20.00%
30.00%
40.00%
50.00%
60.00%
70.00%
80.00%
90.00%
MedicalProcedures
MedicalProcedures
SurgicalProcedures
SurgicalProcedures
LabProcedures
RadiologyProcedures
Hospital/IDSOwned
Not Hospital/IDSOwned
(inside practice) (inside practice)(outside practice) (outside practice)
Source: MGMA Performance and Practices of Successful Medical Groups, 2010.
Activity Charges to Total Gross Charges Ratio, Multispecialty ≥ 50% Primary Care
15.46%8.62%
2.52%1.13%

11
Page 21February 9, 2012
Prepared for AHLA Physicians and Physician Organizations Law Institute
Better Performers
Multispecialty:Hospital/IDS Owned –BETTER Performers compared to…
Hospital/IDS Owned – Others
(Variance)
Not Hospital/IDS Owned –
Better Performers(Variance)
Not Hospital/IDS Owned – Others
(Variance)
Medical Revenue $113,049 ($270,172) ($188,449)
Overhead % -12.55% (4.63)% (1.19%)
Total RVUs 1,414 (3,950) (1,594)
Work RVUs 693 (1,797) (481)
Source: MGMA Performance and Practices of Successful Medical Groups, 2010.
Key Performance Indicators Gap Analysis
Better performers close the gap but not in all areas
Page 22February 9, 2012
Prepared for AHLA Physicians and Physician Organizations Law Institute
Preliminary Focus Areas
Revenue, expense and physician compensation environment (both pre- and post-employment)
Performance variance explanations
Impact of post-employment performance on legal matters (e.g., FMV and Commercial Reas.)
Other unintended consequences
1
2
3
4

12
Page 23February 9, 2012
Prepared for AHLA Physicians and Physician Organizations Law Institute
Alarming Trend orMisunderstood Performance
Metric?
Page 24February 9, 2012
Prepared for AHLA Physicians and Physician Organizations Law Institute
Mitigating the Debate• Identify root causes*
– Uncontrollable – payer mix, JCAHO, etc.
– Accounting – system overhead, ancillary services
– Controllable – best practice targets, physician compensation impact
• Educate with a purpose of minimizing the impact on culture and finger pointing
• Establish integration process, trip wires
• Focus on realization of ROI – strategic value* Stopping the Bleed, Health Care Advisory Board, 1999

13
Page 25February 9, 2012
Prepared for AHLA Physicians and Physician Organizations Law Institute
Mitigating the DebateUncontrollable
(System Induced)
Payer Mix
Strategic
Accounting
(System Induced)
Ancillary Services
Overhead
Controllable
Revenue, collections and A/R
Physician Comp
OverheadDo not neglect the importance of having a pre‐versus post‐employment financial analysis
Page 26February 9, 2012
Prepared for AHLA Physicians and Physician Organizations Law Institute
Focusing on the Controllable
Strategy, Vision, Culture and Leadership
Integration Process
Compensation On Boarding
Revenue Expense
Return on Investment
[ “It All Matters” ]

14
Page 27February 9, 2012
Prepared for AHLA Physicians and Physician Organizations Law Institute
Designing a Disciplined Integration Process
ContinuousImprovement
Monitoring &Measurement
Goals &Budget
• Discuss values, culture and strategic goals
• Due diligence including financial analysis
• Terms of agreement
• FMV analysis
Planning &Partnering
Coordination & Integration
Management & Growth
Pre-Alignment Post-AlignmentOnboarding
Physician Integration Process
• Finalize agreement(s)
• Operational transition
• Work plans and checklists
120 to 360 days 90 to 180 days Effective Date +
Page 28February 9, 2012
Prepared for AHLA Physicians and Physician Organizations Law Institute
Educating the Board
• Our strategy, vision and culture
• Anatomy of employed physician losses– Uncontrollable, accounting, controllable*
• Our financial performance
• Our integration process
• Our trip wires
* Employed losses have varied contributing factors; whatever the nomenclature, organizations should work to define them and explain them accordingly

15
Page 29February 9, 2012
Prepared for AHLA Physicians and Physician Organizations Law Institute
Take Home – Questionnaire • #1 – Mitigating the debate
• #2 – Building the culture
• #3 – Designing the integration process
• #4 – Targeting performance excellence
• #5 – Maximizing the ROIWhat is not showing up in the numbers?
– Differences in values and culture
– Lack of clarity and agreement on strategic goals


![PHYSICIAN CONTRACT CHECKLIST: RECRUITMENT, EMPLOYMENT, AND ... Contract Checklist.pdf · PHYSICIAN CONTRACT CHECKLIST: RECRUITMENT, EMPLOYMENT, AND ... [geographic location] ... If](https://img.pdfslide.us/doc/110x75/5b159f007f8b9a8b288d212e/physician-contract-checklist-recruitment-employment-and-contract-checklistpdf.jpg)