Embed Size (px)
Citation preview

Physician Employment: Contracting, Compensation &
Financial Performance Improvements
(Fall)Craig E. Holm, FACHESenior Vice PresidentHealth Strategies & Solutions, Inc.Philadelphia, [email protected]
D. Louis Glaser, J.D. PartnerKatten Muchin Rosenman, LLP Chicago, Illinois [email protected]

I. Introductions and Objectives
Agenda
II. Influences on Employment
III. Employment Versus Other Alignment Approaches
IV. Employment Options: Structure and Compensation
V. Avoiding Excessive Subsidies
VI. National Survey on Employment
VII. Questions and Discussion

Describe industry trends and influences that affect joint ventures and alternatives to joint ventures
Learning Objectives
Identify opportunities for collaboration with physician partners and assess how reasonable the proposed or current transactions are from a fair market value perspective
List and develop potential performance and quality measures
Define characteristics of effective alignment

Influences on Employment

Influences on Employment
Historically, separatism and/or competition between hospitals and physicians, driven by pursuit of supplemental income, payor and regulatory environment, hospitalists, and technology development
Now, desire of physicians for security – employment by group or hospital
Soured relationships between physicians and hospitals
Regulations constrain the options for formal business relationships other than employment
Recruitment failure and difficulty in securing on-call coverage
The rush to employ by your competitors
Influences in your market?

Influences on Employment (continued)
Return of employment over past 5+/- years; one major driver is the desire for security– In some markets, virtually all physicians are employed by
hospitals or large practices– Most large employed physician networks are able to
negotiate premium reimbursement rates– While industry average subsidy is $70,000++ annually, best
practice is $35,000-$40,000– Employment is appropriate for a portion of the medical
staff– If a 150-physician group reduces subsidy from
$100K to industry average or best practice, a $5-10M savings can result

Influences on Employment (continued)
Source: 2010 Merritt Hawkins review of physician recruiting incentives survey.
The 2010 Review shows that 51% of Merritt Hawkins’ 2009/2010 physician search assignments were for settings featuring hospital
employment of the physician, up from 45% last year and up from 23% in 2005/2006

Influences on Employment (continued)
Source: HS&S Client Data
Philadelphia,PA
Cincinnati,OH
Washington,
DC
Phoenix,AZ
Milwaukee,WI
High Point,
NC
Professional Fees as %of MC Fee Schedule
A Varying Reimbursement Environment
Philadelphia, PA Cincinnati, OH Washington, DC Phoenix, AZ Milwaukee, WI High Point, NC

Physician Employment:The Research Says….
“Physician employment historically has had mixed effects on clinical integration.”
- Rob Burns, Ph.D., Wharton School of Business, University of Pennsylvania

Employment Versus Other Alignment Approaches

Employment is just one approach for hospital physician alignment
Employment is typically for a minority of medical staff
Employment Versus Other Alignment Approaches

Employment Versus Other Alignment Approaches (continued)
Selectively growImprove performance
Employed
Strong referral relationshipsStrong referral relationships
Strong PCP base, supplemented with hard-to-recruit or hard-to-gain-coverage specialtiesTolerable deficits
Strong PCP base, supplemented with hard-to-recruit or hard-to-gain-coverage specialtiesTolerable deficits
Selective business partnerships tailored to practice needs and hospital strategic prioritiesMarket growth
Selective business partnerships tailored to practice needs and hospital strategic prioritiesMarket growth
Systematic process to evaluate and develop formal business partnerships (i.e., JVs and alternatives)
Independent, but potential
partners
Proactive, comprehensive outreach initiativesOptimal hospital operations and systems, quality demonstration, IT to earn referral relationships
Independent
Physician AlignmentCategories Approach Common Objectives

The Continuum of Alignment Models
LOW
Cha
lleng
eH
IGH
HIGH
Equity Joint VentureInformation System Assistance
Recruitment AssistanceAcquisition w/o Employment
Real Estate Partnerships
Clinical Leadership Councils
Degree of Alignment
Selling/Contracting Outpatient Services
Joint Operating Agreement
MedicalDirectorship
ManagementServicesOrganization
Physician Employmentw/o Acquisition
Medical Foundation
Co-managementAgreement
Medical Home
AccountableCare Organization
EVOLVINGMODELS
Prevalence Key:
High
Low Moderate
Target Group Key:
Any
Independent PhysiciansEmployed Physicians
New PhysiciansRetiring PhysiciansOffice-Based and Hospital-Based Physicians

In employment or other business relationships, it’s not the model, it’s what the model does

Employment Options

Employment Options: Structure and Compensation
StructureDirect employmentFoundation
Compensation methodology RVUsGuaranteed salaryQuality, outcomesNet incomePercentage of collectionsCitizenship
Model and compensation pitfalls
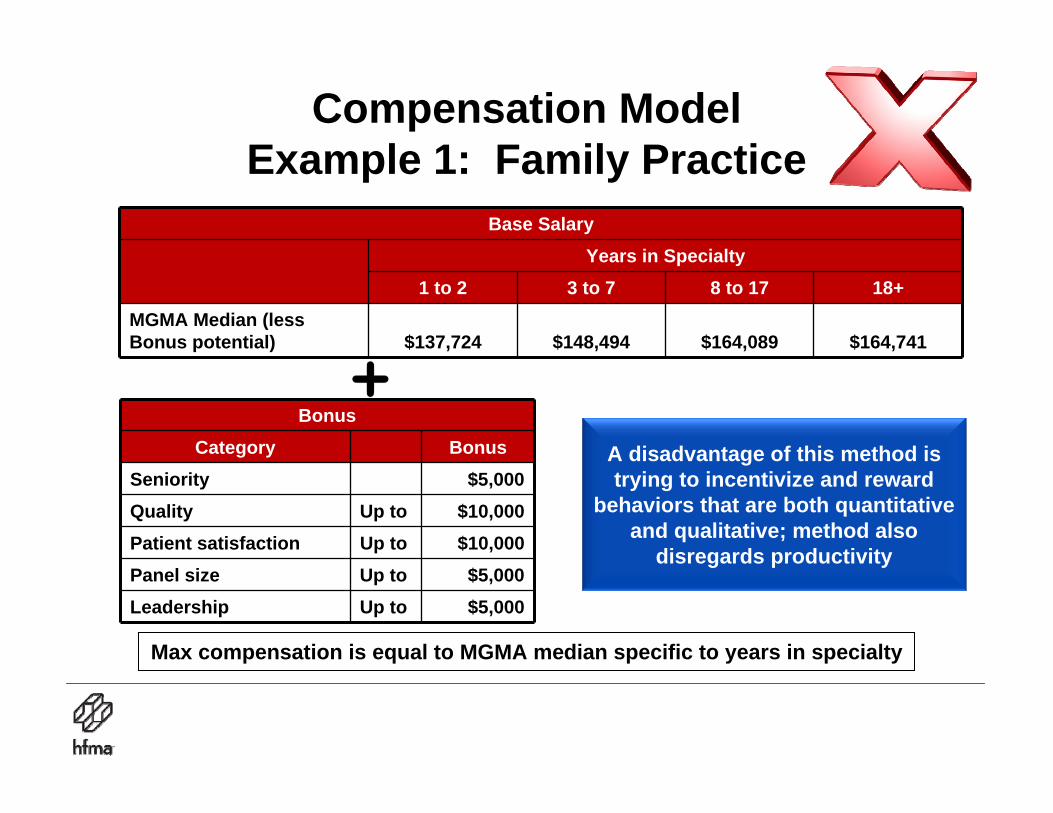
Compensation Model Example 1: Family Practice
Base SalaryYears in Specialty
1 to 2 3 to 7 8 to 17 18+MGMA Median (less Bonus potential) $137,724 $148,494 $164,089 $164,741
BonusCategory Bonus
Seniority $5,000Quality Up to $10,000Patient satisfaction Up to $10,000Panel size Up to $5,000Leadership Up to $5,000
A disadvantage of this method is trying to incentivize and reward
behaviors that are both quantitative and qualitative; method also
disregards productivity
Max compensation is equal to MGMA median specific to years in specialty

Compensation Model:Example 2: Family Practice
The importance of both group and individual effort towards productivity, efficiency and profitability is reflected by the inclusion of two incentive pools, the individual and site incentive pools
Compensation reflects overall practice performance as well as individual performance on a variety of factors

Compensation Model:Example 3: Internal Medicine
Part 1: Productivity-Based Component (Professional Services)
Tier Range of wRVUs
Bonus per Incremental
wRVUBase
CompensationProductivity
Compensation
Total Productivity-
Based Compensation
1 - 4,700 $40 $180,000 $180,0002 4,701 6,000 $41 $180,000 Up to $53,259 Up to $233,2593 6,001 8,000 $42 $233,259 Up to $83,958 Up to $317,2174 8,001 + $43 $317,217 Up to $177,783 Up to $495,000
Part 2: Other IncentivesCategory Bonus
Quality Up to $10,000Leadership Up to $10,000
Max compensation is $515,000
What characteristics of this compensation model make it
interesting?
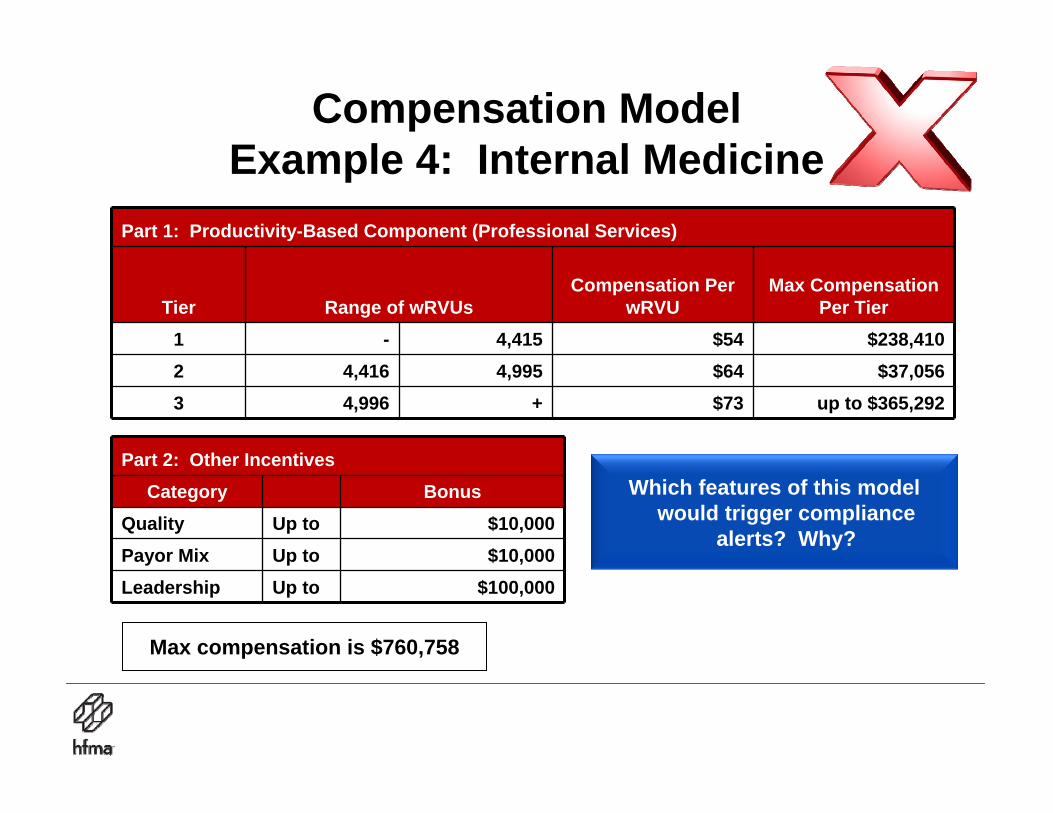
Compensation ModelExample 4: Internal Medicine
Part 1: Productivity-Based Component (Professional Services)
Tier Range of wRVUsCompensation Per
wRVUMax Compensation
Per Tier1 - 4,415 $54 $238,4102 4,416 4,995 $64 $37,0563 4,996 + $73 up to $365,292
Part 2: Other IncentivesCategory Bonus
Quality Up to $10,000Payor Mix Up to $10,000Leadership Up to $100,000
Max compensation is $760,758
Which features of this model would trigger compliance
alerts? Why?

Compensation Model:Example 5: Orthopedics
Overall Practice Expenses
Direct Expenses Shared Expenses
Tracked and allocated to individual physicians
(includes staffing, personal expenses, CME, etc.)
Distribution of overhead expenses based on
percent of individual revenue
Resulting compensation is individual revenue less direct expenses and overhead allocation
Overall Practice Revenue
Allocated to individual physicians based on actual production
Patient Care Revenue
This model can be referred to as the capitalist model as you are rewarded for your individual productivity and expense management
This model can be referred to as the capitalist model as you are rewarded for your individual productivity and expense management

Compensation Model:Example 6: Orthopedics
Overall Practice Expenses
Equal ($) distribution of practice expenses
All physicians are compensated at the same level based on overall practice performance
Overall Practice Revenue
Equal ($) distribution of practice revenue
In your opinion, could this model be sustainable in today’s reality?

Avoiding Excessive Subsidies

Avoiding Excessive Subsidies: The Formation Process
Careful selection of top-tier, professionally compatible physicians committed to clinical integrationAcquisition costs exclude excessive goodwillProductivity-based compensation and short-term (one- to two-year) contractsMedical group managed by practice managers, rather than hospital administratorsStrong focus on adding incremental practices; incremental downstream revenue offsets practice deficitsSome practice deficits are inevitable due to ramp-up, rich hospital benefits, and removal of ancillary revenue from practices

Avoiding Excessive Subsidies: Example Selection (or Divestiture) CriteriaCategory Components Score
Strategic priority
Hospital and community need (specialty-specific)
Precludes competitors
Fit with hospital and health plan initiatives
5
Financial performance targets achieved 4
Other productivity measures achieved
RVUs
NMR3
Growth potential
Historic growth rate
Physician entrepreneurial/practice building qualities2
Fulfills coverage requirements 2
Alienation factor Future competitive threat 2
Other Quality indicators
Group practice potential1
Each practice site is reviewed and scored:<10 Points = Divest; 10–13 Points = Probation; 13 Points = Retain

Avoiding Excessive Subsidies: The Downstream Revenue Rationale
Source: 2010 Physician Inpatient/ Outpatient Revenue Survey, Merrit Hawkins.
(In millions)
In 2010, physicians continue to generate approximately $1.5 million of average revenue on behalf of their affiliated hospitals.

Avoiding Excessive Subsidies:High-Return Initiatives
PotentialHigh-Return
Initiatives
Revised Medical Practice
Delivery
EliminateRedundant
Infrastructure
RevisedCompensation
Plan
OperationsImprovement
PhysicianLeadership
RevenueCapture
Transition toPrivate Practice
PracticePromotion

Avoiding Excessive Subsidies:Focus on Avoidable Losses
Productivity/compensation gapExcessive accounts receivableReduction in bad debtExcessive overhead allocationPractice staffing
Start-ups
Amortized acquisition costs
Contractual agreements
Long-term leases
Strategic practice locations
Avoidable
Unavoidable
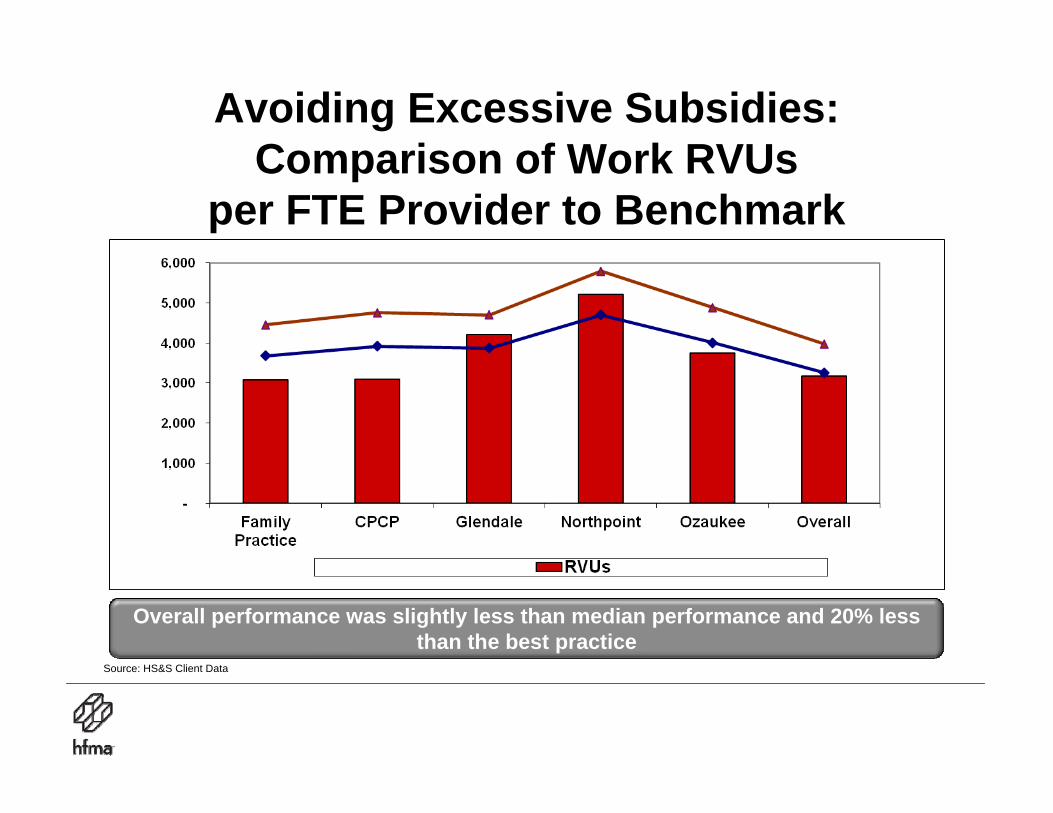
Avoiding Excessive Subsidies: Comparison of Work RVUs
per FTE Provider to Benchmark
Source: HS&S Client Data
Overall performance was slightly less than median performance and 20% less than the best practice

Practice Observations RecommendationsIM physicians are at 80% to 100% of benchmarks for office encounters and RVUs
Pediatric physicians are at 60% of productivity benchmarks
Clinic has recently expanded availability for walk-in appointments
Subspecialist physicians (dermatology and ENT) see patients at this site
Comprehensive complement of ancillary services (radiology, PT, OT, etc.)
Increase average office hours per provider
Promote practice accessibility
Add program(s) or an additional practice to the site
Promote availability of ancillary services
Avoiding Excessive Subsidies:Practice Promotion Observations and
Recommendations
Observations and recommendations developed for each practice site as well as practice group overall

Avoiding Excessive Subsidies: The Analysis of Financial Performance Indicators
Network Benchmark
Favorable Unfavorable vs.
BenchmarkAccounts Receivable Benchmarks
Days 40 50 Favorable
Average per Physician $ 76,435 $ 79,850 Favorable
Collections Rate 55.4% 68.0% Unfavorable
Percentage of Total Net Revenue Benchmarks
Bad Debt as % 3.9% 3.0% Unfavorable
Billing/Collections Cost as % 7.5% 7.0% TBD
Allocated Overhead Costs as % 8.0% 10%15% Unfavorable
Ancillary Charges as a % of Total Charges Not Applicable 26.0%
When applicable, indicators are reviewed for individual physicians, practice, and group overall

Avoiding Excessive Subsidies:The Analysis of Aggregate Performance
Against Benchmarks
0%
50%
100%
FY05 FY06 FY07
Com
paris
on to
Nat
iona
l Med
ian
Perfo
rman
ce (2
)
Office Visits RVUs Charges Net Medical Revenue Compensation
Volume, charges, revenue, and compensation indicators are reviewed for individual physicians, practice, and the group overall

Avoiding Excessive Subsidies:Outreach Programs
Monitor and communicate with dataEarning physician loyalty is a long-term process; losing loyalty occurs in a nanosecondRepresent practice support, not hospital occupancyOn time, brief, and to the pointPhysician relations staff need no office

National Survey Results

National Survey on Employment
36 hospitals and systems participated in survey on physician employment21 states representedNumber of employed physicians ranges from 6 to 300 and growing

Number of Employed Physicians

Percent of Primary Care

Compensation Model

Annual Subsidy Per Physician

Reimbursement Rates for Employed Physician vs. Private Practice
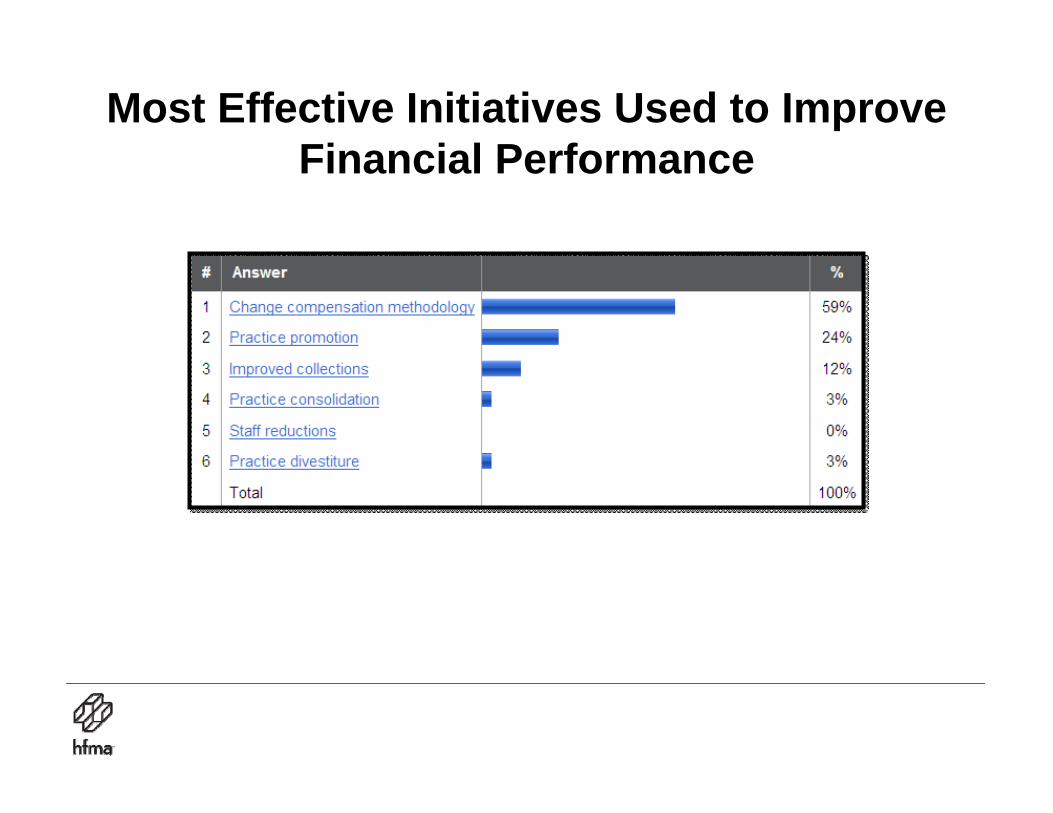
Most Effective Initiatives Used to Improve Financial Performance

Questions and Discussion

Presenter Profiles

Seminar Presenter Profile
Craig E. Holm, FACHE, senior vice president with Health Strategies & Solutions, Inc., directs the firm’s physician-hospital integration and physician practice consulting services. He has over 30 years of health care administration and consulting experience and is an expert in medical staff planning, physician-hospital relationships and joint ventures, and ambulatory care planning. Craig is a frequent speaker for national and state health care associations and societies. His second book, Allies or Adversaries: Revitalizing the Medical Staff Organization, was published in 2004 by Health Administration Press. He also wrote a column on physician-health system relationships for the Journal of Healthcare Management, and is a regular contributor to HFMA's Healthcare Cost Containment.

Seminar Presenter Profile
D. Louis Glaser, partner with Katten Muchin Rosenman, LLP, concentrates his practice on corporate, transactional, and regulatory health care law. He represents a wide variety of clients, including hospitals and multi-hospital systems, alternative delivery systems, ancillary service providers, pharmaceutical companies, physicians and group practices, and medical clinics. Louis has received a host of awards and other commendations. He has been named among “The Best Lawyers in America – Health”(2003-present), published by Corporate Counsel and was named by Nightingale’s Healthcare News as one of the Country’s Outstanding Hospital Lawyers (2003) and Outstanding Healthcare Transactional Lawyers (2004).