Embed Size (px)
Citation preview
Physical, Thermal, Mechanical Properties, andMicrostructural Characterization of Sn-9Zn-XGaAlloys
TOMASZ GANCARZ
The microstructural features, physicochemical, thermal, and mechanical properties of eutecticSnZn alloys with varying Ga contents were examined in this study. In the microstructure studyusing scanning electron microscope and X-ray diffraction analysis, intermetallic phases were notobserved. The results indicated that the primary effect of Ga was increased mechanicalproperties. The physicochemical properties of liquid alloys, density, viscosity, and surfacetension were measured using the free flow method. The addition of Ga to eutectic SnZn alloygenerally reduced density, surface tension, viscosity, and melting point, and increased thecoefficient of thermal expansion and electrical resistivity.
DOI: 10.1007/s11661-015-3235-3� The Author(s) 2015. This article is published with open access at Springerlink.com
I. INTRODUCTION
REDUCING the melting temperature is one of theobjectives in finding a replacement for lead-free solders.The melting temperature of eutectic SnPb is 456 K(183 �C), which compares to alternatives as follows:SnZn 471 K (198 �C), Sn-Cu-Ag 490 K (217 �C), SnAg494 K (221 �C), and Sn-Cu 500 K (227 �C), as pre-sented by Zhang and Tu.[1] As shown in the preliminarystudy performed by Reference 2, the melting point isreduced with the addition of Ga to SnZn alloys. In thesame study, the authors showed an increase of thewetting rate and a reduction of wetting angle withincreasing addition of Ga. Chen et al.[3] obtained similardata for the wetting test on Cu substrate using SnZnalloys with Ga, observing an increasing spreading area,but only to 0.5 Ga. For 1.0, 2.0, and 3.0 Ga thespreading area values were the same. In the solderingprocess, the thickness of intermetallic phases (IMPs) atthe interface of the solder and Cu substrate with theaddition of Ga to alloys increased. Song et al.[4] studiedthe microstructure, thermal, and tensile properties ofSnZn-Ga alloys to 1.8 wt pct Ga content. Reducingmelting temperature and increasing tensile strength withincreasing addition of Ga to eutectic SnZn wereshown.[4] Xue et al.[5] investigated the influence of Praddition to SnZn (0.5 Ga), and the obtained IMPs layerthickness for an SnZn (0.5Ga) alloy on Cu substrate wassimilar to that found by previous authors.[3] Theaddition of Ga, which dissolves in eutectic SnZn alloysas observed in Reference 4, caused increasing tensilestrength, and similar effect was obtained for the addition
of Na to SnZn alloys. However, in the latter case,increasing tensile strength was indicated for precipitatesof IMPs Na-Sn and Na-Zn.The aim of this study is to identify the characteristics
of SnZn eutectic alloys with Ga additions (0.1, 0.2, 0.5,1.0, and 3.0 wt pct). The density, viscosity, and surfacetension were obtained using the free flow method.Differential scanning calorimetry (DSC) measurementswere taken to determine the melting point, then thespecified linear expansion was determined by dilatom-etry and resistivity measurements, using the four-pointprobe method. The characteristic microstructures of theobtained cast alloys were also observed by SEM andanalysis of the occurring phase using X-ray diffraction(XRD) analysis, and a mechanical test was carried outto show the positive effect of Ga addition to eutecticSnZn alloys.
II. EXPERIMENTAL
High purity metals Sn, Zn, and Ga (99.999 pct), wereused for the preparation of the alloys. Samples weremelted in a furnace placed in a glove box with highpurity argon, to provide the best possible protectiveatmosphere during the experiment. The level of O2 andH2O was below 1 ppm as measured by solid-stateanalyzers for oxygen and moisture, and the N2 contentwas lowered (although it was not monitored), owing toAr gas circulating through the high temperature purifi-cation system filled with Ti shavings heated to 1123 K(850 �C). In order to prepare samples for electricalresistivity measurements, the liquid alloys were suckedinto quartz capillaries of 2 mm uniform inner diameter,in which they solidified rapidly.[6] The equipment andexperimental procedure for DSC, thermo-mechanicalanalysis (TMA), electrical resistivity, and mechanicaltests were described.[6] To measure the physicochemicalproperties of SnZnGa alloys, the discharge crucible
TOMASZ GANCARZ, Assistant Professor, is with the PolishAcademy of Sciences, Institute of Metallurgy and Materials Science,Reymonta 25 St., 30-059 Krakow, Poland. Contact e-mails: [email protected]; [email protected]
Manuscript submitted April 4, 2015.Article published online November 16, 2015
326—VOLUME 47A, JANUARY 2016 METALLURGICAL AND MATERIALS TRANSACTIONS A
method (DC)[7] was used. The free outflow of moltenmetal occurred through an orifice of specified diameterin the bottom of a crucible, and from a measurement ofthe mass of molten metal flowing out of the crucible as afunction of time, the surface tension, density, andviscosity could be calculated simultaneously, from oneexperiment. Calibration involved the use of a cruciblewith a hole, and the parameters specifying the experi-ment were obtained for pure metals Sb, Sn, and Zn.[8]
The liquid metal temperature was controlled with athermocouple placed inside the crucible and connectedto a temperature controller. The equipment for the DCmethod was constructed and placed in a glove box withhigh purity argon, to provide the best possible protectiveatmosphere during the experiment. The microstructurecharacteristics and elemental analysis were analyzedusing scanning electron microscopy (SEM) coupled withenergy dispersive spectrometry (EDS), and XRD toimprove the occurring phases. Mechanical tests wereconducted on an INSTRON 6025 testing machinemodernised by Zwick/Roell. The conditions of testingwere in accordance with EN ISO 6892-1:2009, with astrain rate of 0.00025 (1/s) at room temperature. Thetensile and compressive tests were performed for each ofthe SnZn alloys with Ga additions, and three successfulmeasurements were taken. The samples for tensile testswere cast to graphite molds (Ø8 9 100 mm) with thebase measuring 5 mm diameter and 40 mm length.
III. RESULTS AND DISCUSSIONS
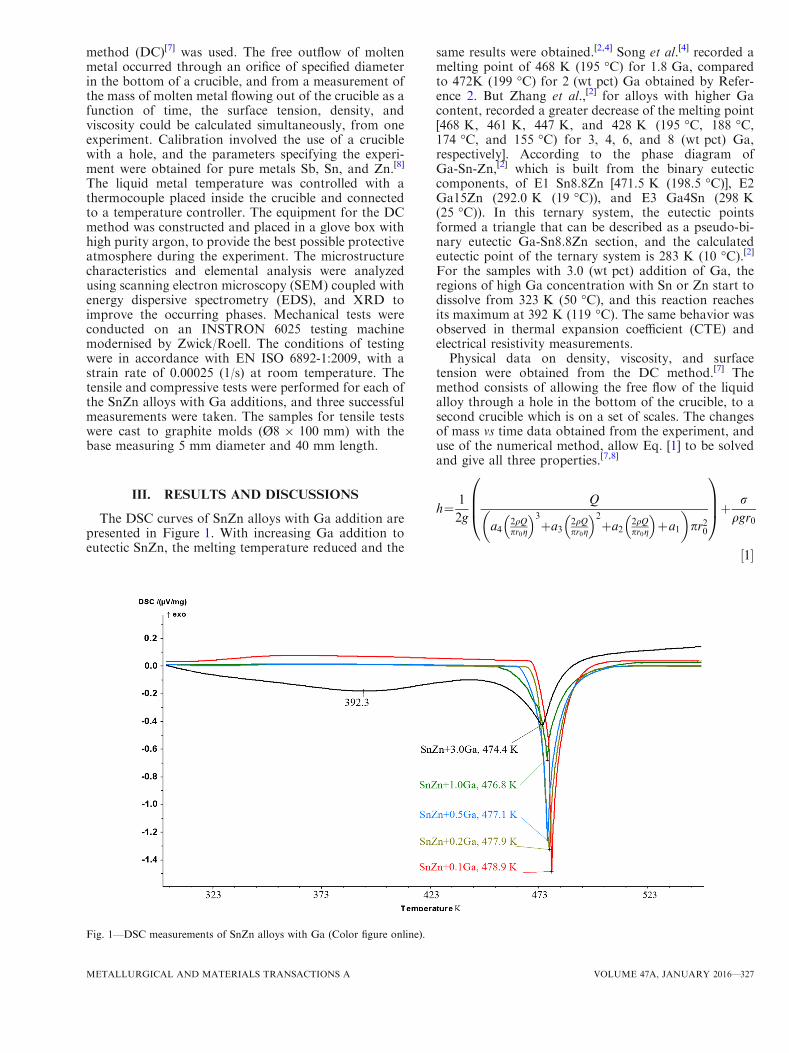
The DSC curves of SnZn alloys with Ga addition arepresented in Figure 1. With increasing Ga addition toeutectic SnZn, the melting temperature reduced and the
same results were obtained.[2,4] Song et al.[4] recorded amelting point of 468 K (195 �C) for 1.8 Ga, comparedto 472K (199 �C) for 2 (wt pct) Ga obtained by Refer-ence 2. But Zhang et al.,[2] for alloys with higher Gacontent, recorded a greater decrease of the melting point[468 K, 461 K, 447 K, and 428 K (195 �C, 188 �C,174 �C, and 155 �C) for 3, 4, 6, and 8 (wt pct) Ga,respectively]. According to the phase diagram ofGa-Sn-Zn,[2] which is built from the binary eutecticcomponents, of E1 Sn8.8Zn [471.5 K (198.5 �C)], E2Ga15Zn (292.0 K (19 �C)), and E3 Ga4Sn (298 K(25 �C)). In this ternary system, the eutectic pointsformed a triangle that can be described as a pseudo-bi-nary eutectic Ga-Sn8.8Zn section, and the calculatedeutectic point of the ternary system is 283 K (10 �C).[2]For the samples with 3.0 (wt pct) addition of Ga, theregions of high Ga concentration with Sn or Zn start todissolve from 323 K (50 �C), and this reaction reachesits maximum at 392 K (119 �C). The same behavior wasobserved in thermal expansion coefficient (CTE) andelectrical resistivity measurements.Physical data on density, viscosity, and surface
tension were obtained from the DC method.[7] Themethod consists of allowing the free flow of the liquidalloy through a hole in the bottom of the crucible, to asecond crucible which is on a set of scales. The changesof mass vs time data obtained from the experiment, anduse of the numerical method, allow Eq. [1] to be solvedand give all three properties.[7,8]
h¼ 1
2g
Q
a42qQpr0g
� �3
þa32qQpr0g
� �2
þa22qQpr0g
� �þa1
� �pr20
0BB@
1CCAþ r
qgr0
½1�
Fig. 1—DSC measurements of SnZn alloys with Ga (Color figure online).
METALLURGICAL AND MATERIALS TRANSACTIONS A VOLUME 47A, JANUARY 2016—327
where q density of liquid (kg/m3), g gravitationalacceleration (m/s2), r0 orifice radius in the bottom ofcrucible (m), r surface tension (mN/m), Q free flow (m3/s), g viscosity (mPa s), a1, a2, and a3 are constants in thepolynomial describing Cd vs Re, Cd discharge coefficientdetermined for a given crucible based on the free flow ofliquids with known density, Re Reynolds number.
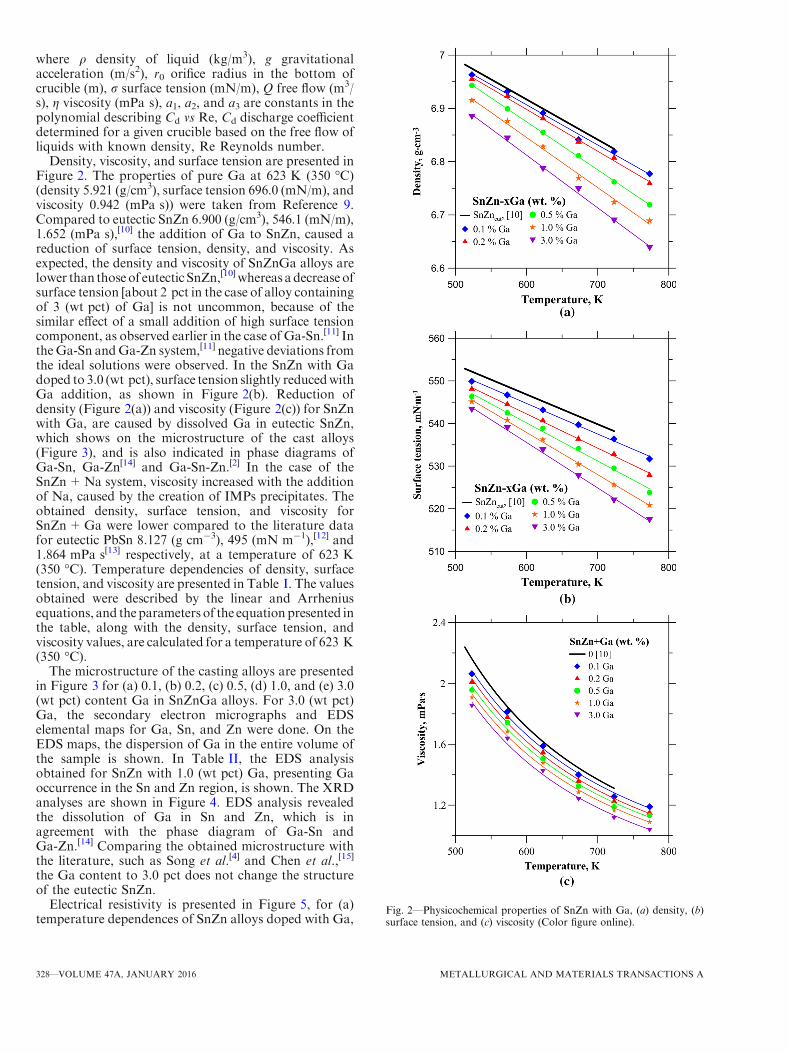
Density, viscosity, and surface tension are presented inFigure 2. The properties of pure Ga at 623 K (350 �C)(density 5.921 (g/cm3), surface tension 696.0 (mN/m), andviscosity 0.942 (mPa s)) were taken from Reference 9.Compared to eutectic SnZn 6.900 (g/cm3), 546.1 (mN/m),1.652 (mPa s),[10] the addition of Ga to SnZn, caused areduction of surface tension, density, and viscosity. Asexpected, the density and viscosity of SnZnGa alloys arelower than thoseof eutectic SnZn,[10] whereas a decrease ofsurface tension [about 2 pct in the case of alloy containingof 3 (wt pct) of Ga] is not uncommon, because of thesimilar effect of a small addition of high surface tensioncomponent, as observed earlier in the case of Ga-Sn.[11] IntheGa-Sn andGa-Zn system,[11] negative deviations fromthe ideal solutions were observed. In the SnZn with Gadoped to 3.0 (wt pct), surface tension slightly reducedwithGa addition, as shown in Figure 2(b). Reduction ofdensity (Figure 2(a)) and viscosity (Figure 2(c)) for SnZnwith Ga, are caused by dissolved Ga in eutectic SnZn,which shows on the microstructure of the cast alloys(Figure 3), and is also indicated in phase diagrams ofGa-Sn, Ga-Zn[14] and Ga-Sn-Zn.[2] In the case of theSnZn+Na system, viscosity increased with the additionof Na, caused by the creation of IMPs precipitates. Theobtained density, surface tension, and viscosity forSnZn+Ga were lower compared to the literature datafor eutectic PbSn 8.127 (g cm�3), 495 (mN m�1),[12] and1.864 mPa s[13] respectively, at a temperature of 623 K(350 �C). Temperature dependencies of density, surfacetension, and viscosity are presented in Table I. The valuesobtained were described by the linear and Arrheniusequations, and theparameters of the equation presented inthe table, along with the density, surface tension, andviscosity values, are calculated for a temperature of 623 K(350 �C).
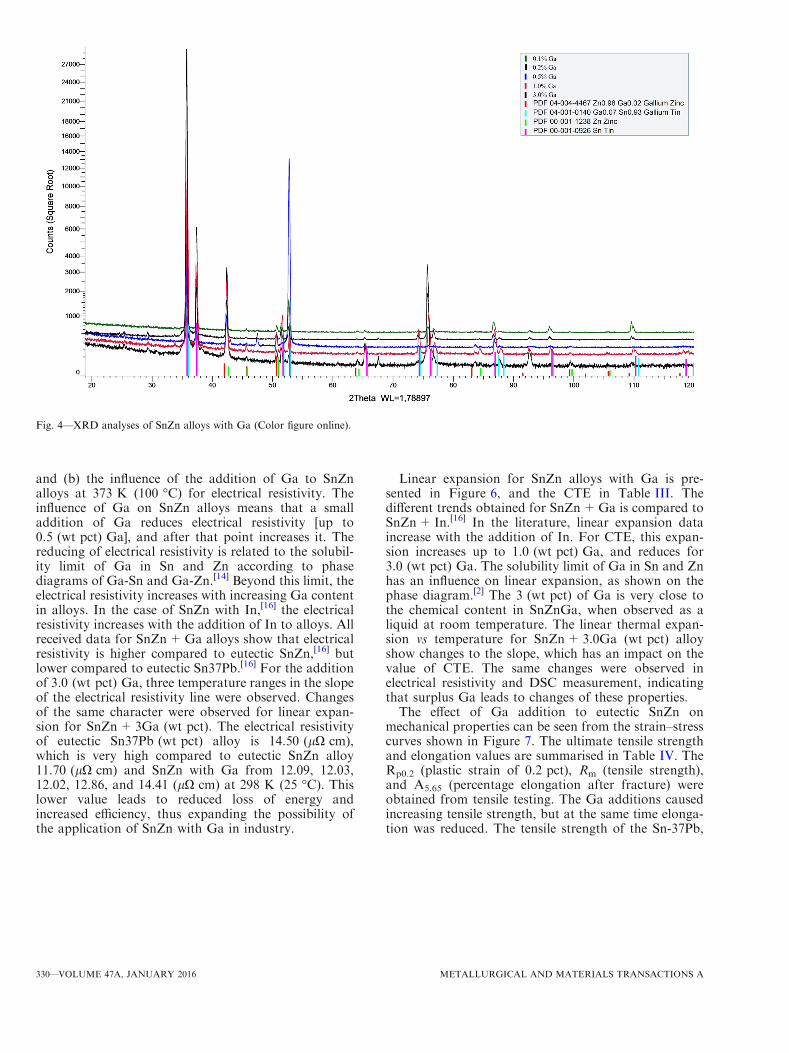
The microstructure of the casting alloys are presentedin Figure 3 for (a) 0.1, (b) 0.2, (c) 0.5, (d) 1.0, and (e) 3.0(wt pct) content Ga in SnZnGa alloys. For 3.0 (wt pct)Ga, the secondary electron micrographs and EDSelemental maps for Ga, Sn, and Zn were done. On theEDS maps, the dispersion of Ga in the entire volume ofthe sample is shown. In Table II, the EDS analysisobtained for SnZn with 1.0 (wt pct) Ga, presenting Gaoccurrence in the Sn and Zn region, is shown. The XRDanalyses are shown in Figure 4. EDS analysis revealedthe dissolution of Ga in Sn and Zn, which is inagreement with the phase diagram of Ga-Sn andGa-Zn.[14] Comparing the obtained microstructure withthe literature, such as Song et al.[4] and Chen et al.,[15]
the Ga content to 3.0 pct does not change the structureof the eutectic SnZn.
Electrical resistivity is presented in Figure 5, for (a)temperature dependences of SnZn alloys doped with Ga,
Fig. 2—Physicochemical properties of SnZn with Ga, (a) density, (b)surface tension, and (c) viscosity (Color figure online).
328—VOLUME 47A, JANUARY 2016 METALLURGICAL AND MATERIALS TRANSACTIONS A

Table I. Linear and Arrhenius Dependence for SnZn with Ga Addition for Density (q), Surface Tension (r), and Viscosity (g),with Errors and Parameters, Determined for a Temperature of 623 K (350 �C)
Alloys (Weight Percent) A dA B dB q, g cm�3 623 K (350 �C) dq
SnZn+0.1Ga 7.36 0.02 0.00075 0.00003 6.626 0.265SnZn+0.2Ga 7.37 0.01 0.00078 0.00002 6.606 0.275SnZn+0.5Ga 7.41 0.01 0.00090 0.00001 6.539 0.316SnZn+1.0Ga 7.41 0.02 0.00094 0.00003 6.495 0.333SnZn+3.0Ga 7.41 0.02 0.00099 0.00003 6.443 0.343
Alloys (Weight Percent) A dA B dB r, mN m�1 623 K (350 �C) dr
SnZn+0.1Ga 587.7 1.4 �0.072 0.002 517.98 25.22SnZn+0.2Ga 590.4 1.2 �0.080 0.002 512.33 28.37SnZn+0.5Ga 593.7 2.4 �0.089 0.004 506.82 32.08SnZn+1.0Ga 597.2 1.3 �0.099 0.002 501.04 35.16SnZn+3.0Ga 599.5 1.7 �0.107 0.003 495.78 37.92
Alloys (Weight Percent) A dA E dE g, mPa s 623 K (350 �C) dg
SnZn+0.1Ga 0.360 0.006 7633.1 22.8 1.571 0.017SnZn+0.2Ga 0.349 0.008 7649.1 31.5 1.527 0.018SnZn+0.5Ga 0.340 0.005 7671.1 37.8 1.494 0.011SnZn+1.0Ga 0.328 0.006 7713.2 25.8 1.453 0.024SnZn+3.0Ga 0.302 0.005 7938.8 30.2 1.400 0.023
Parameters of the straight line A+BT, with errors dA, dB for density and surface tension. The parameters of the Arrhenius equation AeE/(RT),with errors dA, dE for viscosity.
Table II. EDS Analysis of SnZn1.0Ga Marked in Fig. 3(d), at Weight Percent
Element/Marked Point 1 2 3 4 5 6
SnL 8.85 9.58 14.45 97.98 97.91 97.63ZnK 89.90 89.25 84.68 0.62 0.63 0.82GaK 1.25 1.17 0.87 1.40 1.46 1.55
Fig. 3—Microstructure of cast alloys SnZn with Ga, (a) 0.1, (b) 0.2, (c) 0.5, and (d) 1.0 with marked points of EDS analysis and (e) 3.0 (wt pct)and EDS maps.
METALLURGICAL AND MATERIALS TRANSACTIONS A VOLUME 47A, JANUARY 2016—329
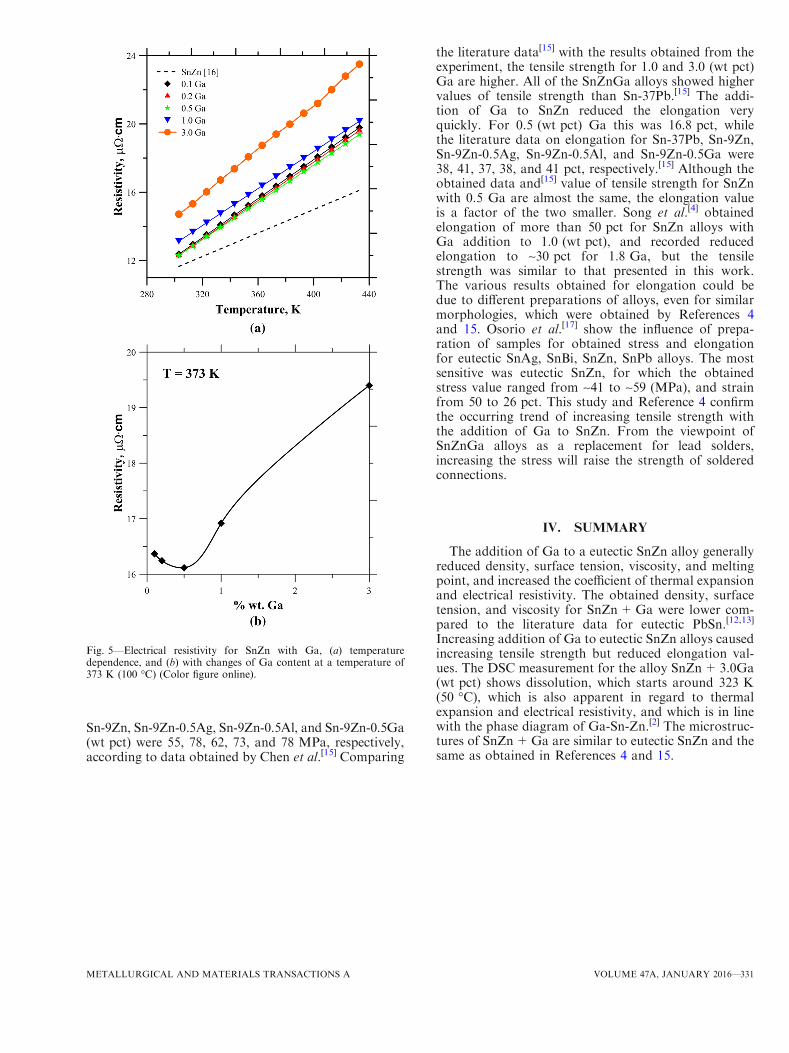
and (b) the influence of the addition of Ga to SnZnalloys at 373 K (100 �C) for electrical resistivity. Theinfluence of Ga on SnZn alloys means that a smalladdition of Ga reduces electrical resistivity [up to0.5 (wt pct) Ga], and after that point increases it. Thereducing of electrical resistivity is related to the solubil-ity limit of Ga in Sn and Zn according to phasediagrams of Ga-Sn and Ga-Zn.[14] Beyond this limit, theelectrical resistivity increases with increasing Ga contentin alloys. In the case of SnZn with In,[16] the electricalresistivity increases with the addition of In to alloys. Allreceived data for SnZn+Ga alloys show that electricalresistivity is higher compared to eutectic SnZn,[16] butlower compared to eutectic Sn37Pb.[16] For the additionof 3.0 (wt pct) Ga, three temperature ranges in the slopeof the electrical resistivity line were observed. Changesof the same character were observed for linear expan-sion for SnZn+3Ga (wt pct). The electrical resistivityof eutectic Sn37Pb (wt pct) alloy is 14.50 (lX cm),which is very high compared to eutectic SnZn alloy11.70 (lX cm) and SnZn with Ga from 12.09, 12.03,12.02, 12.86, and 14.41 (lX cm) at 298 K (25 �C). Thislower value leads to reduced loss of energy andincreased efficiency, thus expanding the possibility ofthe application of SnZn with Ga in industry.
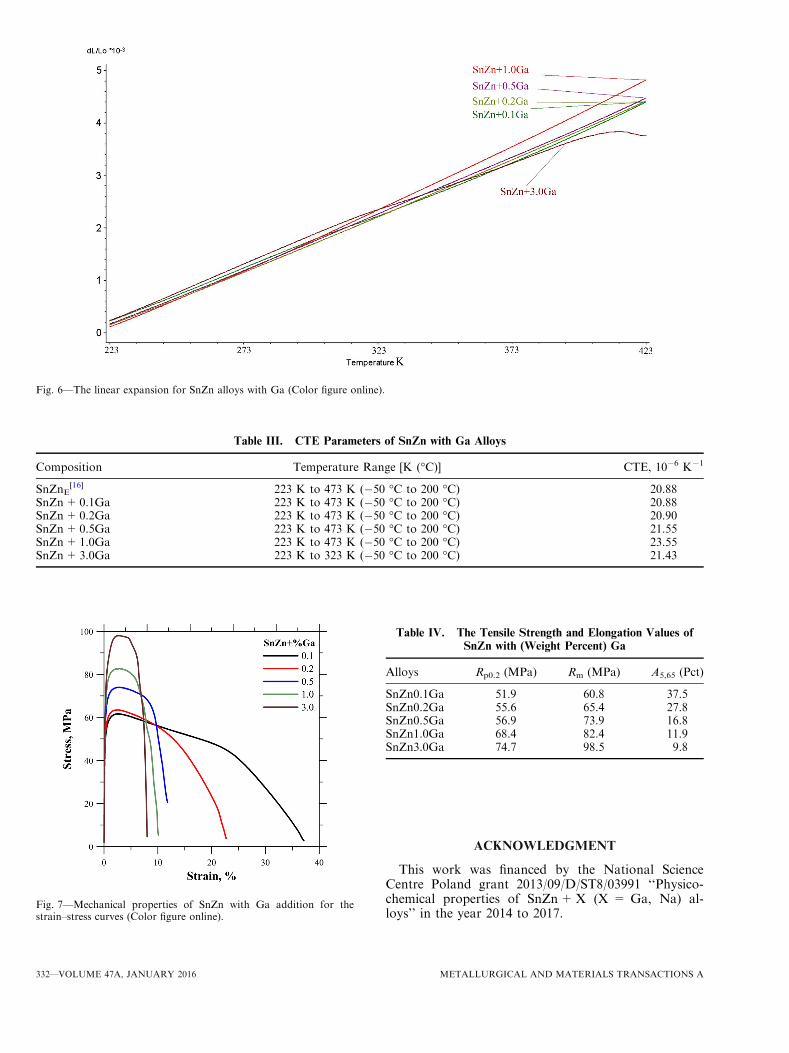
Linear expansion for SnZn alloys with Ga is pre-sented in Figure 6, and the CTE in Table III. Thedifferent trends obtained for SnZn+Ga is compared toSnZn+In.[16] In the literature, linear expansion dataincrease with the addition of In. For CTE, this expan-sion increases up to 1.0 (wt pct) Ga, and reduces for3.0 (wt pct) Ga. The solubility limit of Ga in Sn and Znhas an influence on linear expansion, as shown on thephase diagram.[2] The 3 (wt pct) of Ga is very close tothe chemical content in SnZnGa, when observed as aliquid at room temperature. The linear thermal expan-sion vs temperature for SnZn+3.0Ga (wt pct) alloyshow changes to the slope, which has an impact on thevalue of CTE. The same changes were observed inelectrical resistivity and DSC measurement, indicatingthat surplus Ga leads to changes of these properties.The effect of Ga addition to eutectic SnZn on
mechanical properties can be seen from the strain–stresscurves shown in Figure 7. The ultimate tensile strengthand elongation values are summarised in Table IV. TheRp0.2 (plastic strain of 0.2 pct), Rm (tensile strength),and A5.65 (percentage elongation after fracture) wereobtained from tensile testing. The Ga additions causedincreasing tensile strength, but at the same time elonga-tion was reduced. The tensile strength of the Sn-37Pb,
Fig. 4—XRD analyses of SnZn alloys with Ga (Color figure online).
330—VOLUME 47A, JANUARY 2016 METALLURGICAL AND MATERIALS TRANSACTIONS A
Sn-9Zn, Sn-9Zn-0.5Ag, Sn-9Zn-0.5Al, and Sn-9Zn-0.5Ga(wt pct) were 55, 78, 62, 73, and 78 MPa, respectively,according to data obtained by Chen et al.[15] Comparing
the literature data[15] with the results obtained from theexperiment, the tensile strength for 1.0 and 3.0 (wt pct)Ga are higher. All of the SnZnGa alloys showed highervalues of tensile strength than Sn-37Pb.[15] The addi-tion of Ga to SnZn reduced the elongation veryquickly. For 0.5 (wt pct) Ga this was 16.8 pct, whilethe literature data on elongation for Sn-37Pb, Sn-9Zn,Sn-9Zn-0.5Ag, Sn-9Zn-0.5Al, and Sn-9Zn-0.5Ga were38, 41, 37, 38, and 41 pct, respectively.[15] Although theobtained data and[15] value of tensile strength for SnZnwith 0.5 Ga are almost the same, the elongation valueis a factor of the two smaller. Song et al.[4] obtainedelongation of more than 50 pct for SnZn alloys withGa addition to 1.0 (wt pct), and recorded reducedelongation to ~30 pct for 1.8 Ga, but the tensilestrength was similar to that presented in this work.The various results obtained for elongation could bedue to different preparations of alloys, even for similarmorphologies, which were obtained by References 4and 15. Osorio et al.[17] show the influence of prepa-ration of samples for obtained stress and elongationfor eutectic SnAg, SnBi, SnZn, SnPb alloys. The mostsensitive was eutectic SnZn, for which the obtainedstress value ranged from ~41 to ~59 (MPa), and strainfrom 50 to 26 pct. This study and Reference 4 confirmthe occurring trend of increasing tensile strength withthe addition of Ga to SnZn. From the viewpoint ofSnZnGa alloys as a replacement for lead solders,increasing the stress will raise the strength of solderedconnections.
IV. SUMMARY
The addition of Ga to a eutectic SnZn alloy generallyreduced density, surface tension, viscosity, and meltingpoint, and increased the coefficient of thermal expansionand electrical resistivity. The obtained density, surfacetension, and viscosity for SnZn+Ga were lower com-pared to the literature data for eutectic PbSn.[12,13]
Increasing addition of Ga to eutectic SnZn alloys causedincreasing tensile strength but reduced elongation val-ues. The DSC measurement for the alloy SnZn+3.0Ga(wt pct) shows dissolution, which starts around 323 K(50 �C), which is also apparent in regard to thermalexpansion and electrical resistivity, and which is in linewith the phase diagram of Ga-Sn-Zn.[2] The microstruc-tures of SnZn+Ga are similar to eutectic SnZn and thesame as obtained in References 4 and 15.
Fig. 5—Electrical resistivity for SnZn with Ga, (a) temperaturedependence, and (b) with changes of Ga content at a temperature of373 K (100 �C) (Color figure online).
METALLURGICAL AND MATERIALS TRANSACTIONS A VOLUME 47A, JANUARY 2016—331
ACKNOWLEDGMENT
This work was financed by the National ScienceCentre Poland grant 2013/09/D/ST8/03991 ‘‘Physico-chemical properties of SnZn+X (X = Ga, Na) al-loys’’ in the year 2014 to 2017.
Table III. CTE Parameters of SnZn with Ga Alloys
Composition Temperature Range [K (�C)] CTE, 10�6 K�1
SnZnE[16] 223 K to 473 K (�50 �C to 200 �C) 20.88
SnZn+0.1Ga 223 K to 473 K (�50 �C to 200 �C) 20.88SnZn+0.2Ga 223 K to 473 K (�50 �C to 200 �C) 20.90SnZn+0.5Ga 223 K to 473 K (�50 �C to 200 �C) 21.55SnZn+1.0Ga 223 K to 473 K (�50 �C to 200 �C) 23.55SnZn+3.0Ga 223 K to 323 K (�50 �C to 200 �C) 21.43
Table IV. The Tensile Strength and Elongation Values ofSnZn with (Weight Percent) Ga
Alloys Rp0.2 (MPa) Rm (MPa) A5,65 (Pct)
SnZn0.1Ga 51.9 60.8 37.5SnZn0.2Ga 55.6 65.4 27.8SnZn0.5Ga 56.9 73.9 16.8SnZn1.0Ga 68.4 82.4 11.9SnZn3.0Ga 74.7 98.5 9.8
Fig. 6—The linear expansion for SnZn alloys with Ga (Color figure online).
Fig. 7—Mechanical properties of SnZn with Ga addition for thestrain–stress curves (Color figure online).
332—VOLUME 47A, JANUARY 2016 METALLURGICAL AND MATERIALS TRANSACTIONS A
OPEN ACCESS
This article is distributed under the terms ofthe Creative Commons Attribution 4.0 InternationalLicense (http://creativecommons.org/licenses/by/4.0/),which permits unrestricted use, distribution, and re-production in any medium, provided you give appro-priate credit to the original author(s) and the source,provide a link to the Creative Commons license, andindicate if changes were made.
REFERENCES
1. L. Zhang and K.N. Tu: Mater. Sci. Eng. R, 2014, vol. 82,pp. 1–32.
2. Y. Zhang, T. Liang, and M.A. Jusheng: J. Non-Cryst. Solids, 2004,vol. 336, pp. 153–56.
3. W.-X. Chen, S.-B. Xue, and H. Wang: Mater. Des., 2010, vol. 31,pp. 2196–2200.
4. J.M. Song, N.S. Liu, and K.-L. Lin: Mater. Trans., 2004, vol. 45,pp. 776–82.
5. H. Ye, S. Xue, J. Luo, and Y. Li: Mater. Des., 2013, vol. 46,pp. 816–23.
6. T. Gancarz and J. Pstrus: Arch. Metall. Mater., 2015, vol. 60,pp. 1603–07.
7. T. Gancarz, W. Gasior, and H. Henein: Int. J. Thermophys., 2014,vol. 35, pp. 1725–48.
8. T. Gancarz, W. Gasior, and H. Henein: Int. J. Thermophys., 2013,vol. 34, pp. 250–66.
9. W.R. Gale and T.C. Totemaier, eds.: Smithells Metals ReferenceBook, Elsevier, Butterworth-Heinemann Ltd., Oxford, 2004.
10. T. Gancarz, J. Pstrus, W. Gasior, and H. Henein: J. Electron.Mater., 2013, vol. 42, pp. 288–93.
11. R. Novakovic and D. Zivkovic: J. Mater. Sci., 2005, vol. 40,pp. 2251–57.
12. W. Gasior, Z. Moser, and J. Pstrus: J. Phase Equilib. Differ., 2001,vol. 22, pp. 20–25.
13. W. Gasior, Z. Moser, J. Pstrus, and M. Kucharski: Arch. Metall.Mater., 2001, vol. 46, pp. 23–32.
14. SGTE—SGTE alloy phase diagrams, http://www.crct.polymtl.ca/FACT/documentation/SGTE/SGTE_Figs.htm.
15. K.-I. Chen, S.-C. Cheng, S. Wu, and K.-L. Lin: J. Alloys. Compd.,2006, vol. 416, pp. 98–105.
16. T. Gancarz, P. Fima, and J. Pstrus: J. Mater. Eng. Perform., 2014,vol. 5, pp. 1524–29.
17. W. Osorio, L. Peixoto, L. Garcia, N. Mangelinck-Noel, and A.Garcia: J. Alloy Compd., 2013, vol. 572, pp. 97–106.
METALLURGICAL AND MATERIALS TRANSACTIONS A VOLUME 47A, JANUARY 2016—333