Embed Size (px)
Citation preview

PS/EARTH SCIENCEPS/EARTH SCIENCE
The University of the State of New York
REGENTS HIGH SCHOOL EXAMINATION
PHYSICAL SETTING
EARTH SCIENCEFriday, June 20, 2008 — 1:15 to 4:15 p.m., only
This is a test of your knowledge of Earth science. Use that knowledge to answerall questions in this examination. Some questions may require the use of the EarthScience Reference Tables. The Earth Science Reference Tables are supplied separately.Be certain you have a copy of the 2001 Edition (Revised November 2006) of thesereference tables before you begin the examination.
Your answer sheet for Part A and Part B–1 is the last page of this examinationbooklet. Turn to the last page and fold it along the perforations. Then, slowly andcarefully, tear off your answer sheet and fill in the heading.
The answers to the questions in Part B–2 and Part C are to be written in yourseparate answer booklet. Be sure to fill in the heading on the front of your answerbooklet.
You are to answer all questions in all parts of this examination according to thedirections provided in the examination booklet. Record your answers to the Part Aand Part B–1 multiple-choice questions on your separate answer sheet. Write youranswers to the Part B–2 and Part C questions in your answer booklet. All work shouldbe written in pen, except for graphs and drawings, which should be done in pencil.You may use scrap paper to work out the answers to the questions, but be sure torecord all your answers on your separate answer sheet and in your answer booklet.
When you have completed the examination, you must sign the statement printedat the end of your separate answer sheet, indicating that you had no unlawfulknowledge of the questions or answers prior to the examination and that you haveneither given nor received assistance in answering any of the questions during theexamination. Your answer sheet and answer booklet cannot be accepted if you fail tosign this declaration.
Notice. . .
A four-function or scientific calculator and a copy of the 2001 Earth Science Reference Tables(Revised November 2006) must be available for you to use while taking this examination.
The use of any communications device is strictly prohibited when taking thisexamination. If you use any communications device, no matter how briefly, yourexamination will be invalidated and no score will be calculated for you.
DO NOT OPEN THIS EXAMINATION BOOKLET UNTIL THE SIGNAL IS GIVEN.

Part A
Answer all questions in this part.
Directions (1–35): For each statement or question, write on your separate answer sheet the number of theword or expression that, of those given, best completes the statement or answers the question. Some questionsmay require the use of the Earth Science Reference Tables.
1 As viewed from Earth, most stars appear to moveacross the sky each night because(1) Earth revolves around the Sun(2) Earth rotates on its axis(3) stars orbit around Earth(4) stars revolve around the center of the galaxy
2 The star Algol is estimated to have approximatelythe same luminosity as the star Aldebaran andapproximately the same temperature as the starRigel. Algol is best classified as a(1) main sequence star (3) white dwarf star(2) red giant star (4) red dwarf star
3 The explosion associated with the Big Bang theory and the formation of the universe isinferred to have occurred how many billion yearsago?(1) less than 1 (3) 4.6(2) 2.5 (4) over 10
4 The diagram below represents the constellationLyra.
Which statement best explains why Lyra is visibleto an observer in New York State at midnight inJuly but not visible at midnight in December?(1) Earth spins on its axis.(2) Earth orbits the Sun.(3) Lyra spins on its axis.(4) Lyra orbits Earth.
5 The Coriolis effect provides evidence that Earth(1) rotates on its axis(2) revolves around the Sun(3) undergoes cyclic tidal changes(4) has a slightly eccentric orbit
6 The altitude of the ozone layer near the SouthPole is 20 kilometers above sea level. Which temperature zone of the atmosphere contains thisozone layer?(1) troposphere (3) mesosphere(2) stratosphere (4) thermosphere
7 A low-pressure system in the NorthernHemisphere has a surface air-circulation patternthat is(1) clockwise and away from the center(2) clockwise and toward the center(3) counterclockwise and away from the center(4) counterclockwise and toward the center
8 Air masses are identified on the basis of tempera-ture and(1) type of precipitation(2) wind velocity(3) moisture content(4) atmospheric transparency
9 During some winters in the Finger Lakes regionof New York State, the lake water remainsunfrozen even though the land around the lakesis frozen and covered with snow. The primarycause of this difference is that water(1) gains heat during evaporation(2) is at a lower elevation(3) has a higher specific heat(4) reflects more radiation
Lyra
P.S./E. Sci.–June ’08 [2]

10 The reaction below represents an energy-producing process.
The reaction represents how energy is produced(1) in the Sun by fusion(2) when water condenses in Earth’s atmosphere(3) from the movement of crustal plates(4) during nuclear decay
11 The diagram below shows the spectral lines for an element.
Which diagram best represents the spectral lines of this element when its light isobserved coming from a star that is moving away from Earth?
Hydrogen + Hydrogen → Helium + Energy(lighter element) (lighter element) (heavier element)
Violet Red
P.S./E. Sci.–June ’08 [3] [OVER]
Violet Red
( 1 )
Violet Red
( 2 )
Violet Red
( 3 )
Violet Red
( 4 )

P.S./E. Sci.–June ’08 [4]
12 Diagram 1 shows the Moon in its orbit at four positions labeled A, B, C, and D. Diagram 2 shows a phaseof the Moon as viewed from New York State.
At which labeled Moon position would the phase of the Moon shown in diagram 2 beobserved from New York State?(1) A (3) C(2) B (4) D
13 The diagram below shows an observer measuring the altitude of Polaris.
What is the latitude of the observer?(1) 20° N (3) 70° N(2) 20° S (4) 70° S
Line of sight
Observer
(Not drawn to scale)
AB
NorthPole
(Not drawn to scale)
Diagram 1
Diagram 2
Earth
Sun’srays
DC

14 The weather instrument shown below can be used to determine dewpoint.
Based on the values shown, the dewpoint is(1) –5°C (3) 8°C(2) 2°C (4) 33°C
15 Which arrangement of the Sun, the Moon, and Earth results in the highest high tides, and the lowest lowtides on Earth? (Diagrams are not drawn to scale.)
16 Which station model correctly represents the weather conditions in an area that is experiencing winds fromthe northeast at 25 knots and has had a steady drop in barometric pressure of 2.7 millibars during the lastthree hours?
( 4 )( 3 )( 1 ) ( 2 )
S E
M
S EM
S M E S E
M
( 1 ) ( 2 ) ( 3 ) ( 4 )
–27\
–27\
–27 \
–27\
Wet cloth wick
Reservoirof water
P.S./E. Sci.–June ’08 [5] [OVER]

P.S./E. Sci.–June ’08 [6]
17 The diagram below shows weather instruments A and B.
Which table correctly indicates the name of the weather instrument and the weathervariable that it measures?
Instrument Weather VariableMeasuredLetter Name
A thermometer humidityB wind vane wind direction
Instrument Weather VariableMeasuredLetter Name
A barometer wind speedB anemometer air pressure
( 3 )( 1 )
Instrument Weather VariableMeasuredLetter Name
A thermometer wind directionB wind vane humidity
Instrument Weather VariableMeasuredLetter Name
A barometer air pressureB anemometer wind speed
( 4 )( 2 )
020 40 60 80
100
A B
3029
28
31
2627
Storm
yRa
inChange
VeryDry
18 Which ocean current carries cool water toward Earth’s equator?(1) Alaska Current (3) Peru Current(2) East Australia Current (4) North Atlantic Current
19 Equal areas of which surface would most likely absorb the most insolation?(1) smooth, white surface (3) smooth, black surface(2) rough, white surface (4) rough, black surface

P.S./E. Sci.–June ’08 [7] [OVER]
20 On the map below, the darkened areas represent locations where living corals currently exist. The arrowpoints to a location where coral fossils have been found in Devonian-age bedrock in New York State.
Devonian-age coral fossils found in some New York State bedrock are not located inthe same general region that present-day corals are living because during theDevonian Period(1) corals migrated to New York State(2) corals lived everywhere on Earth (3) New York State was closer to the equator (4) New York State had a colder climate
21 Which index fossil may be found in the surface bedrock near Ithaca, New York?

23 Active volcanoes are most abundant along the(1) edges of tectonic plates(2) eastern coastline of continents(3) 23.5° N and 23.5° S parallels of latitude(4) equatorial ocean floor
24 Which part of Earth’s interior is inferred to haveconvection currents that cause tectonic plates tomove?(1) rigid mantle (3) outer core(2) asthenosphere (4) inner core
25 Compared to the continental crust, the oceaniccrust is(1) less dense and less felsic(2) less dense and less mafic(3) more dense and more felsic(4) more dense and more mafic
26 The pie graph below shows the elements com-prising Earth’s crust in percent by mass.
Which element is represented by the letter X?(1) silicon (3) nitrogen(2) lead (4) hydrogen
Aluminum
Other
CalciumSodium
MagnesiumPotassium
Iron
X
Oxygen
P.S./E. Sci.–June ’08 [8]
22 The cross sections below represent three widely separated outcrops of exposed bedrock. Letters A, B, C,and D represent fossils found in the rock layers.
Which fossil appears to have the best characteristics of an index fossil?(1) A (3) C(2) B (4) D
B
D
D
A
A
A
B
A
A
A
D
C
B
A

P.S./E. Sci.–June ’08 [9] [OVER]
27 The block diagrams below show two landscape regions labeled A and B.
What is the most probable cause of the difference in surface features between A and B?(1) A is the result of a humid climate, while B is the result of a dry climate.(2) A is at a high elevation, while B is located at sea level.(3) A is a plateau region, while B is a mountainous region.(4) A is composed of igneous bedrock, while B is composed of sedimentary bedrock.
28 The block diagram below shows a region that has undergone faulting.
Which map shows the stream drainage pattern that would most likely develop on thesurface of this region?
( 3 )( 2 ) ( 4 )( 1 )
A B

P.S./E. Sci.–June ’08 [10]
29 The map below shows the bend of a large meandering stream. The arrows show the direction of stream flow.Letters A, B, and C are positions on the streambed where erosion and deposition data were collected.
Which table best represents the locations where erosion and deposition are dominantand where an equilibrium exists between the two processes? [A check mark (✓) represents the dominant process for each lettered location.]
30 Which graph best represents the relationship between the discharge of a stream and the velocity of streamflow?
Discharge
( 4 )
Vel
oci
ty
Discharge
( 3 )
Vel
oci
ty
Discharge
( 2 )
Vel
oci
ty
Discharge
( 1 )
Vel
oci
ty
Erosion Equilibrium Deposition
A ✓B ✓C ✓
( 1 )
Erosion Equilibrium Deposition
A ✓B ✓C ✓
( 3 )
Erosion Equilibrium Deposition
A ✓B ✓C ✓
( 2 )
Erosion Equilibrium Deposition
A ✓B ✓C ✓
( 4 )
A
B
C

P.S./E. Sci.–June ’08 [11] [OVER]
31 The diagrams below represent four different examples of one process that transports sediments.
Which process is shown in these diagrams?(1) chemical weathering (3) mass movement(2) wind action (4) rock abrasion
Soil creep Debris flow Mud flow Rock fall
Gradual downhillmovement of soil
Rapid downslope flowof debris
Downward flow of fineparticles (mud) andlarge amounts of water
Rapid falling of piecesof rock from a cliff orsteep slope
32 The cross section below shows a stream flowingdownhill. Points A through D are locations in thestream.
At which point would most deposition occur?(1) A (3) C(2) B (4) D
33 A stream flowing at a velocity of 250 centimetersper second is transporting sediment particlesranging in size from clay to cobbles. Which trans-ported particles will be deposited by the stream ifits velocity decreases to 100 centimeters per second?(1) cobbles, only(2) cobbles and some pebbles, only(3) cobbles, pebbles, and some sand, only(4) cobbles, pebbles, sand, silt, and clay
34 Which rock is sedimentary in origin and formedas a result of chemical processes?(1) granite (3) breccia(2) shale (4) dolostone
35 The photograph below shows an igneous rock.
What is the origin and rate of formation of thisrock?(1) plutonic with slow cooling(2) plutonic with rapid cooling(3) volcanic with slow cooling(4) volcanic with rapid cooling
Lake
A
B
D
Stream
C

Part B–1
Answer all questions in this part.
Directions (36–50): For each statement or question, write on your separate answer sheet the number of theword or expression that, of those given, best completes the statement or answers the question. Some questionsmay require the use of the Earth Science Reference Tables.
Base your answers to questions 36 through 39 on the passage and diagram below. The diagram shows theorbits of the four inner planets and the asteroid Hermes around the Sun. Point A represents a position alongHermes’ orbit.
The Curious Tale of Asteroid Hermes
It’s dogma [accepted belief] now: an asteroid hit Earth 65 million years ago andwiped out the dinosaurs. But in 1980 when scientists Walter and Luis Alvarez first suggested the idea to a gathering at the American Association for Advancement ofSciences, their listeners were skeptical. Asteroids hitting Earth? Wiping out species? Itseemed incredible.
At that very moment, unknown to the audience, an asteroid named Hermeshalfway between Mars and Jupiter was beginning a long plunge toward our planet. Sixmonths later it would pass 300,000 miles from Earth’s orbit, only a little more than thedistance to the Moon….
Hermes approaches Earth’s orbit twice every 777 days. Usually our planet is faraway when the orbit crossing happens, but in 1937, 1942, 1954, 1974 and 1986,Hermes came harrowingly [dangerously] close to Earth itself. We know about most of these encounters only because Lowell Observatory astronomer Brian Skiff rediscovered Hermes on Oct. 15, 2003.
Astronomers around the world have been tracking it carefully ever since.…
Excerpted from “The Curious Tale of Asteroid Hermes,” Dr. Tony Phillips, Science @ NASA, November 3, 2003
Orbit ofAsteroid Hermes
Sun
(Not drawn to scale)
Mercury
Earth
Mars
VenusA
P.S./E. Sci.–June ’08 [12]

36 When Hermes is located at position A and Earthis in the position shown in the diagram, the asteroid can be viewed from Earth at each of thefollowing times except
(1) sunrise (3) 12 noon(2) sunset (4) 12 midnight
37 How does the period of revolution of Hermescompare to the period of revolution of the planets shown in the diagram?(1) Hermes has a longer period of revolution
than Mercury, but a shorter period of revolution than Venus, Earth, and Mars.
(2) Hermes has a shorter period of revolutionthan Mercury, but a longer period of revolution than Venus, Earth, and Mars.
(3) Hermes has a longer period of revolutionthan all of the planets shown.
(4) Hermes has a shorter period of revolutionthan all of the planets shown.
38 Why is evidence of asteroids striking Earth so difficult to find?(1) Asteroids are made mostly of frozen water
and gases and are vaporized on impact.(2) Asteroids are not large enough to leave
impact craters.(3) Asteroids do not travel fast enough to create
impact craters.(4) Weathering, erosion, and deposition on Earth
have destroyed or buried most impact craters.
39 According to the diagram, as Hermes and theplanets revolve around the Sun, Hermes appearsto be a threat to collide with(1) Earth, only(2) Earth and Mars, only(3) Venus, Earth, and Mars, only(4) Mercury, Venus, Earth, and Mars
P.S./E. Sci.–June ’08 [13] [OVER]
40 The map below shows the location of Grenville-age bedrock found in the northeasternUnited States.
In which New York State landscapes is Grenville-age bedrock exposed at Earth’s surface?(1) Erie-Ontario Lowlands and St. Lawrence Lowlands(2) Catskills and Allegheny Plateau(3) Tug Hill Plateau and Atlantic Coastal Plain(4) Hudson Highlands and Adirondack Mountains

Base your answers to questions 41 through 44 on the climate graphs below, which show average monthlyprecipitation and temperatures at four cities, A, B, C, and D.
41 City A has very little variation in temperature during the year because city A is located(1) on the dry side of a mountain(2) on the wet side of a mountain(3) near the center of a large landmass(4) near the equator
42 During which season does city B usually experience the month with the highest average precipitation?(1) spring (3) fall(2) summer (4) winter
Key
Precipitation
Temperature
Month
Pre
cip
itat
ion
(cm
)
757065605550454035302520151050
J F M AM J J A S O N D
35302520151050
– 5–10–15–20–25–30–35–40
City B
Month
Pre
cip
itat
ion
(cm
)
757065605550454035302520151050
J F M AM J J A S O N D
35302520151050
– 5–10–15–20–25–30–35–40
City D
Month
Pre
cip
itat
ion
(cm
)
757065605550454035302520151050
J F M AM J J A S O N D
35302520151050
– 5–10–15–20–25–30–35–40
City C
Month
Pre
cip
itat
ion
(cm
)
757065605550454035302520151050
J F M AM J J A S O N D
35302520151050
– 5–10–15–20–25–30–35–40
City A
P.S./E. Sci.–June ’08 [14]

43 It can be concluded that city C is located in the Southern Hemisphere because city C has(1) small amounts of precipitation throughout the year(2) large amounts of precipitation throughout the year(3) its warmest temperatures in January and February(4) its warmest temperatures in July and August
44 Very little water will infiltrate the soil around city D because the region usually has(1) a frozen surface (3) a small amount of runoff(2) nearly flat surfaces (4) permeable soil
Base your answers to questions 45 through 47 on the block diagram below, which shows a portion of Earth’scrust. Letters A, B, C, and D indicate sedimentary layers.
45 Which event occurred most recently? (1) formation of layer A(2) formation of layer D(3) tilting of all four sedimentary rock layers(4) erosion of the igneous rock exposed at the surface
46 The igneous rock is mostly composed of potassium feldspar and quartz crystals thathave an average grain size of 3 millimeters. The igneous rock is most likely(1) granite (3) gabbro(2) pegmatite (4) pumice
47 Which processes produced rock layer B?(1) subduction and melting (3) heat and pressure(2) uplift and solidification (4) compaction and cementation
DC
BA
Igneousrock
Key
Contactmetamorphism
P.S./E. Sci.–June ’08 [15] [OVER]

Base your answers to questions 48 through 50 on the map of Long Island, New York. AB, CD, EF, and GHare reference lines on the map.
48 Which agent of erosion transported the sediments that formed the moraines shownon the map?(1) water (3) ice(2) wind (4) mass movement
49 The cross section below represents the sediments beneath the land surface along oneof the reference lines shown on the map.
Along which reference line was the cross section taken?(1) AB (3) EF(2) CD (4) GH
50 A major difference between sediments in the outwash and sediments in the morainesis that the sediments deposited in the outwash are(1) larger (3) more angular(2) sorted (4) older
RonkonkomaMoraine
Harbor HillMoraine
OutwashOutwash
Map
A
B
C
AtlanticOcean
Long Island Sound
Harbor Hill Moraine
Outwash
E HG
FN
OutwashDRonkonkoma Moraine
P.S./E. Sci.–June ’08 [16]

Part B–2
Answer all questions in this part.
Directions (51–65): Record your answers in the spaces provided in your answer booklet. Some questionsmay require the use of the Earth Science Reference Tables.
Base your answers to questions 51 through 53 on the cross section in your answer booklet, which shows limestone bedrock with caves.
51 In the empty box on the left side of the cross section in your answer booklet, draw ahorizontal line to indicate the level of the water table. [1]
52 The precipitation in this area is becoming more acidic. Explain why acid rain weatherslimestone bedrock. [1]
53 Identify one source of pollution caused by human activity that contributes to the precipitation becoming more acidic. [1]
Base your answers to questions 54 through 58 on the satellite image shown in your answer booklet. The satellite image shows a low-pressure system over a portion of the United States. Air-mass symbols andfrontal boundaries have been added. Line XY is one frontal boundary. Points A, B, C, and D represent surface locations. White areas represent clouds.
54 In your answer booklet, draw the proper symbol to represent the most probable fronton line XY. [1]
55 State one process that causes clouds to form in the moist air along the cold front. [1]
56 Describe one piece of evidence shown on the map that suggests location A has a lowerrelative humidity than location B. [1]
57 Explain why location C most likely has a cooler temperature than location D. [1]
58 State the compass direction that the center of this low-pressure system will move overthe next few days if it follows a normal storm track. [1]
P.S./E. Sci.–June ’08 [17] [OVER]

Base your answers to questions 59 and 60 on the data table below, which provides information about four ofJupiter’s moons.
Data Table
59 Identify the planet in our solar system that is closest in diameter to Callisto. [1]
60 In 1610, Galileo was the first person to observe, with the aid of a telescope, these fourmoons orbiting Jupiter. Explain why Galileo’s observation of this motion did notsupport the geocentric model of our solar system. [1]
Base your answers to questions 61 and 62 on the cross section below, which shows a portion of Earth’s interior layers and the location of an earthquake epicenter. Letter A represents a seismic station on Earth’s surface. Letter B represents a location in Earth’s interior.
61 Explain why seismic station A receives P-waves but not S-waves from thisearthquake. [1]
62 What is the approximate depth at location B? [1]
Moons of Jupiter
Density(g/cm3)
Diameter(km)
Distance from Jupiter(km)
Io 3.5 3630 421,600
Europa 3.0 3138 670,900
Ganymede 1.9 5262 1,070,000
Callisto 1.9 4800 1,883,000
Mantle
Outercore
Innercore
Earthquakeepicenter
B
(Not drawn to scale)
A
P.S./E. Sci.–June ’08 [18]
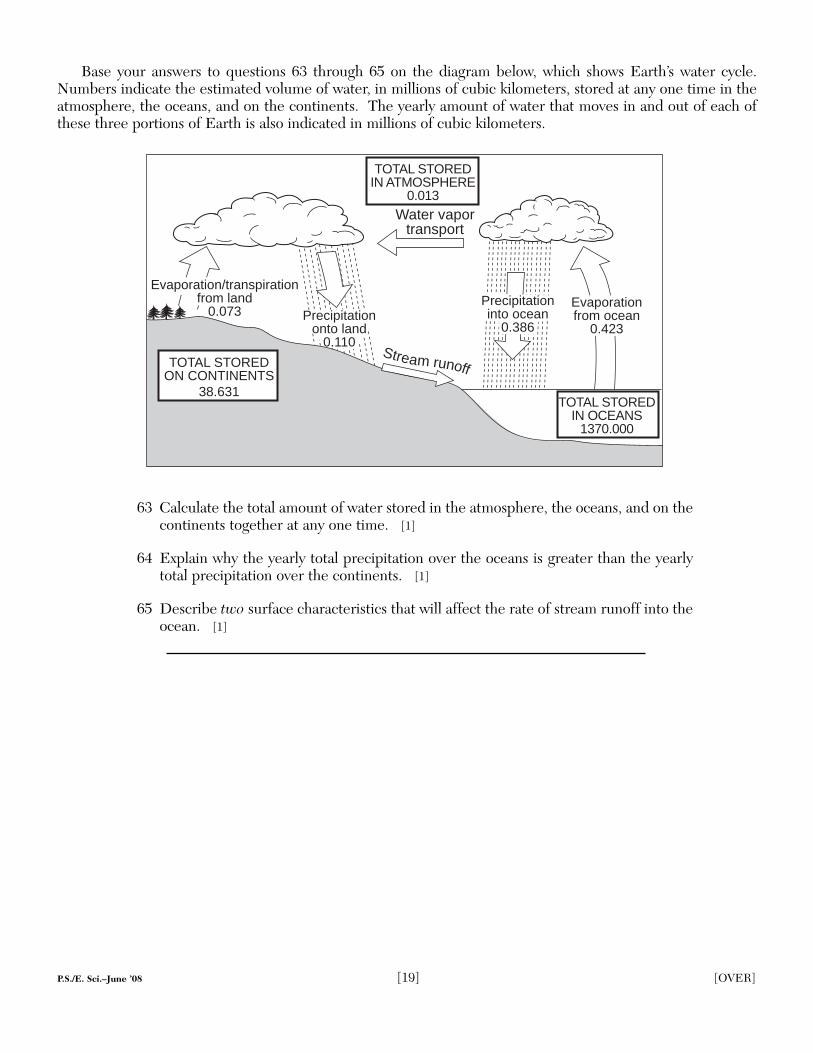
Base your answers to questions 63 through 65 on the diagram below, which shows Earth’s water cycle.Numbers indicate the estimated volume of water, in millions of cubic kilometers, stored at any one time in theatmosphere, the oceans, and on the continents. The yearly amount of water that moves in and out of each ofthese three portions of Earth is also indicated in millions of cubic kilometers.
63 Calculate the total amount of water stored in the atmosphere, the oceans, and on thecontinents together at any one time. [1]
64 Explain why the yearly total precipitation over the oceans is greater than the yearlytotal precipitation over the continents. [1]
65 Describe two surface characteristics that will affect the rate of stream runoff into theocean. [1]
Precipitationinto ocean
0.386Precipitation
onto land0.110
Stream runoff
TOTAL STOREDIN OCEANS
1370.000
TOTAL STOREDON CONTINENTS
38.631
TOTAL STOREDIN ATMOSPHERE
0.013
Evaporationfrom ocean
0.423
Water vaportransport
Evaporation/transpirationfrom land
0.073
P.S./E. Sci.–June ’08 [19] [OVER]

Part C
Answer all questions in this part.
Directions (66–84): Record your answers in the spaces provided in your answer booklet. Some questionsmay require the use of the Earth Science Reference Tables.
Base your answers to questions 66 through 68 on the data table below, which shows the radioactive decay ofcarbon-14. The number of years required to complete four half-lives has been left blank.
Radioactive Decay of Carbon-14 1
66 On the grid in your answer booklet, construct a graph that shows the radioactivedecay of carbon-14 by plotting an X to show the percentage of original carbon-14remaining after each half-life. Connect the Xs with a smooth, curved line. [1]
67 How long does it take for radioactive carbon-14 to complete four half-lives? [1]
68 The cross section below shows part of Earth’s crust. The objects in parentheses indicate materials found within each rock unit or deposit.
Which object in parentheses could be accurately dated using carbon-14? Explainyour answer. [1]
Pleistocene glacial deposits(tree trunk)
Precambrian gneiss(garnet crystal)
Cambrian sandstone(trilobite)
Ordovician shale(graptolite)
Cre
tace
ous
dior
ite
(pla
gioc
lase
cry
stal
)
Number ofHalf-Lives
Percentage of OriginalCarbon-14Remaining
Time(years)
0 100 01 50 57002 25 11,4003 12.5 17,1004 6.35 3.1 28,5006 1.6 34,200
P.S./E. Sci.–June ’08 [20]

Base your answers to questions 69 through 73 on the passage and cross section below, which explain howsome precious gemstones form. The cross section shows a portion of the ancient Tethys Sea, once locatedbetween the Indian-Australian Plate and the Eurasian Plate.
Precious Gemstones
Some precious gemstones are a form of the mineral corundum, which has a hard-ness of 9. Corundum is a rare mineral made up of closely packed aluminum and oxygen atoms, and its formula is Al2O3. If small amounts of chromium replace someof the aluminum atoms in corundum, a bright-red gemstone called a ruby is produced.If traces of titanium and iron replace some aluminum atoms, deep-blue sapphires canbe produced.
Most of the world’s ruby deposits are found in metamorphic rock that is locatedalong the southern slope of the Himalayas, where plate tectonics played a part in rubyformation. Around 50 million years ago, the Tethys Sea was located between what isnow India and Eurasia. Much of the Tethys Sea bottom was composed of limestonethat contained the elements needed to make these precious gemstones. The TethysSea closed up as the Indian-Australian Plate pushed under the Eurasian Plate, creat-ing the Himalayan Mountains. The limestone rock lining the seafloor underwent metamorphism as it was pushed deep into Earth by the Indian-Australian Plate. Forthe next 40 to 45 million years, as the Himalayas rose, rubies, sapphires, and othergemstones continued to form.
69 Which element replaces some of the aluminum atoms, causing the bright-red colorof a ruby? [1]
70 State one physical property of rubies, other than a bright-red color, that makes themuseful as gemstones in jewelry. [1]
71 Identify the metamorphic rock in which the rubies and sapphires that formed alongthe Himalayas are usually found. [1]
72 During which geologic epoch did the events shown in the cross section of the TethysSea occur? [1]
73 What type of tectonic plate boundary is shown in the cross section? [1]
Indian-AustralianPlate
Tethys Sea
North
A Portion of the Tethys Sea 50 Million Years Ago
Limestone
Eurasian Plate
P.S./E. Sci.– June ’08 [21] [OVER]

Base your answers to questions 74 through 77 on the diagrams below. Diagram 1 shows Earth’s location inits orbit on the first day of each of the four seasons, labeled A through D. Diagram 2 shows a north polar viewof Earth on March 21. Point E represents a location on Earth’s surface. Longitude lines are shown at 15° intervals.
Sun
(Not drawn to scale)
Diagram 1
A
N C
Equato
rN
NightDay
D
B
N
DayNight
Arctic Circle
N
Diagram 2
E
Noon
March 21
Sun’s
rays
P.S./E. Sci.–June ’08 [22]

74 How does the altitude of the Sun at solar noon appear to change each day for anobserver in New York State as Earth moves from position A to position B to position C? [1]
75 Explain why the duration of insolation is 12 hours at both the Arctic Circle and theequator when Earth is at position C. [1]
76 Describe one piece of evidence shown in the diagram which indicates that theNorthern Hemisphere is experiencing winter at position D. [1]
77 State the hour of the day at point E. [1]
Base your answers to questions 78 through 80 on the map in your answer booklet. The map shows the waterdepth, measured in feet, at the north end of one of the Finger Lakes. Points A and B are locations at the lake’sshoreline. Points X and Y are locations on the bottom of the lake.
78 On the map in your answer booklet, draw the 20-foot-depth isoline. The isoline mustextend to the edge of the map. [1]
79 On the grid in your answer booklet, construct a profile along the line from point A topoint B. Plot the depth along line AB by marking an X at each numbered point wherea water depth is shown. Complete the profile by connecting the Xs with a smooth,curved line. The Xs for point A and point B have been plotted. [2]
80 Calculate the gradient between point X and point Y. Label your answer with the correct units. [1]
P.S./E. Sci.–June ’08 [23] [OVER]

P.S./E. Sci.–June ’08 [24]
Base your answers to questions 81 through 84 on the map below, which shows a portion of southwesternUnited States. On January 17, 1994, an earthquake occurred with an epicenter at Northridge, California.
81 State the latitude and longitude of Northridge, California. Include the correct unitsand compass directions in your answer. [1]
82 Explain why earthquakes are common in this region of California. [1]
83 Of the cities shown on the map, explain why Oakland was the last city to receive P-waves from this earthquake. [1]
84 List two actions that a homeowner could take to prepare the home or family for thenext earthquake. [1]
Bakersfield
Northridge
San DiegoYuma
ARIZONA
NEVADA
CALIFORNIA
UTAHOakland


The University of the State of New York
REGENTS HIGH SCHOOL EXAMINATION
PHYSICAL SETTINGEARTH SCIENCE
Friday, June 20, 2008 — 1:15 to 4:15 p.m., only
ANSWER SHEET
Student . . . . . . . . . . . . . . . . . . . . . . . . . . . . . . . . . . . . . . . . . . . . . . . Sex: � Male � Female Grade . . . . . . . . . . . .
Teacher . . . . . . . . . . . . . . . . . . . . . . . . . . . . . . . . . . . . . . . . . . . . . . . School . . . . . . . . . . . . . . . . . . . . . . . . . . . . . . . . . . . .
Record your answers to Part A and Part B–1 on this answer sheet.
Write your answers to Part B–2 and Part C in your answer booklet.
The declaration below must be signed when you have completed the examination.
I do hereby affirm, at the close of this examination, that I had no unlawful knowledge of the questions or answers prior tothe examination and that I have neither given nor received assistance in answering any of the questions during the examination.
Signature
Tear
Her
eTe
ar H
ere
Part A
1 . . . . . . . . . . . . 13 . . . . . . . . . . . . 25 . . . . . . . . . . .
2 . . . . . . . . . . . . 14 . . . . . . . . . . . . 26 . . . . . . . . . . .
3 . . . . . . . . . . . . 15 . . . . . . . . . . . . 27 . . . . . . . . . . .
4 . . . . . . . . . . . . 16 . . . . . . . . . . . . 28 . . . . . . . . . . .
5 . . . . . . . . . . . . 17 . . . . . . . . . . . . 29 . . . . . . . . . . .
6 . . . . . . . . . . . . 18 . . . . . . . . . . . . 30 . . . . . . . . . . .
7 . . . . . . . . . . . . 19 . . . . . . . . . . . . 31 . . . . . . . . . . .
8 . . . . . . . . . . . . 20 . . . . . . . . . . . . 32 . . . . . . . . . . .
9 . . . . . . . . . . . . 21 . . . . . . . . . . . . 33 . . . . . . . . . . .
10 . . . . . . . . . . . . 22 . . . . . . . . . . . . 34 . . . . . . . . . . .
11 . . . . . . . . . . . . 23 . . . . . . . . . . . . 35 . . . . . . . . . . .
12 . . . . . . . . . . . . 24 . . . . . . . . . . . .
Part B–1
36 . . . . . . . . . . . . 44 . . . . . . . . . . . .
37 . . . . . . . . . . . . 45 . . . . . . . . . . . .
38 . . . . . . . . . . . . 46 . . . . . . . . . . . .
39 . . . . . . . . . . . . 47 . . . . . . . . . . . .
40 . . . . . . . . . . . . 48 . . . . . . . . . . . .
41 . . . . . . . . . . . . 49 . . . . . . . . . . . .
42 . . . . . . . . . . . . 50 . . . . . . . . . . . .
43 . . . . . . . . . . . .
Part A Score
Part B–1 Score

Tear Here
Tear Here
PS/EARTH SCIENCEPS/EARTH SCIENCE

Performance Test Score(Maximum Score: 16)
Maximum Student’sPart Score Score
A 35
B–1 15
B–2 15
C 20
Total Written Test Score(Maximum Raw Score: 85)
Final Score(from conversion chart)
Raters’ Initials:
Rater 1 . . . . . . . . . . Rater 2 . . . . . . . . . .
The University of the State of New York
REGENTS HIGH SCHOOL EXAMINATION
PHYSICAL SETTINGEARTH SCIENCE
Friday, June 20, 2008 — 1:15 to 4:15 p.m., only
ANSWER BOOKLET
Student . . . . . . . . . . . . . . . . . . . . . . . . . . . . . . . . . . . . . . Sex: � Female
Teacher . . . . . . . . . . . . . . . . . . . . . . . . . . . . . . . . . . . . . . . . . . . . . . . . . . . . . .
School . . . . . . . . . . . . . . . . . . . . . . . . . . . . . . . . . . . . . . . Grade . . . . . . . . .
Answer all questions in Part B–2 and Part C. Record your answersin this booklet.
� Male
51
Part B–2
51
For Raters Only
River
Precipitation
KEY
Water
Box
Caves

For Raters Only
52
53
54
55
56
57
58
54
55
52
53
56
[2]
cP B
D
X
C
A
Y
mT
N
57
58

[3] [OVER]
For Raters Only
59
60
61
62 km
63 millions of cubic kilometers
64
65 Characteristic 1:
Characteristic 2:
59
64
Total Score for Part B–2
60
65
61
62
63

For Raters Only
Part C
66
67 yr
68 Object:
Explanation:
69
70
71
72 Epoch
73
66
68
67
100
90
80
70
60
50
40
30
20
10
00 1 2 3 4 5 6
Per
cen
tag
e o
f O
rig
inal
Car
bo
n-1
4 R
emai
nin
g
Number of Half-Lives
Radioactive Decay of Carbon-14
69
70
71
72
73
[4]

[5] [OVER]
74
75
76
77
For Raters Only
74
75
76
77

[6]
79
78
79
For Raters Only
9
17
4
10113
15
1714 18
94
7
19 19
82 4
11
18 17
202117
15
17
16
15 26
25
21 24 25 24
24
26
30 33
26
23
24
23 13
7
13
1721
131518
10
3
4
511
13
105
5
1318
85
118
11
16
62 5 2
16
21
9
16
7
8
A
13
2
5
29
B
21
Water Depths (feet)
1.0 mile0.90.80.70.60.50.40.30.20.10
N
YX
A B
30
20
10
0
30
20
10
0
Dep
th (
ft)
Distance (mi)
Lake Surface
78

Total Score for Part C
80
81
82
83
84
80 Gradient:
81 Latitude:
Longitude:
82
83
84 Action 1:
Action 2:
For Raters Only
[7]

PS/EARTH SCIENCEPS/EARTH SCIENCE

Part A
1 . . . . . . . . . . . . 13 . . . . . . . . . . . . 25 . . . . . . . . . . .
2 . . . . . . . . . . . . 14 . . . . . . . . . . . . 26 . . . . . . . . . . .
3 . . . . . . . . . . . . 15 . . . . . . . . . . . . 27 . . . . . . . . . . .
4 . . . . . . . . . . . . 16 . . . . . . . . . . . . 28 . . . . . . . . . . .
5 . . . . . . . . . . . . 17 . . . . . . . . . . . . 29 . . . . . . . . . . .
6 . . . . . . . . . . . . 18 . . . . . . . . . . . . 30 . . . . . . . . . . .
7 . . . . . . . . . . . . 19 . . . . . . . . . . . . 31 . . . . . . . . . . .
8 . . . . . . . . . . . . 20 . . . . . . . . . . . . 32 . . . . . . . . . . .
9 . . . . . . . . . . . . 21 . . . . . . . . . . . . 33 . . . . . . . . . . .
10 . . . . . . . . . . . . 22 . . . . . . . . . . . . 34 . . . . . . . . . . .
11 . . . . . . . . . . . . 23 . . . . . . . . . . . . 35 . . . . . . . . . . .
12 . . . . . . . . . . . . 24 . . . . . . . . . . . .Part A Score
Part B–1
36 . . . . . . . . . . . . 44 . . . . . . . . . . . .
37 . . . . . . . . . . . . 45 . . . . . . . . . . . .
38 . . . . . . . . . . . . 46 . . . . . . . . . . . .
39 . . . . . . . . . . . . 47 . . . . . . . . . . . .
40 . . . . . . . . . . . . 48 . . . . . . . . . . . .
41 . . . . . . . . . . . . 49 . . . . . . . . . . . .
42 . . . . . . . . . . . . 50 . . . . . . . . . . . .
43 . . . . . . . . . . . .Part B–1 Score
FOR TEACHERS ONLYThe University of the State of New York
REGENTS HIGH SCHOOL EXAMINATION
PHYSICAL SETTING/EARTH SCIENCE
Friday, June 20, 2008 — 1:15 to 4:15 p.m., only
SCORING KEY AND RATING GUIDE
PS–ES
Directions to the Teacher:Refer to the directions on page 3 before rating student papers.
Updated information regarding the rating of this examination may be posted on the New YorkState Education Department’s web site during the rating period. Check this web sitehttp://www.emsc.nysed.gov/osa/ and select the link “Examination Scoring Information” for anyrecently posted information regarding this examination. This site should be checked before the rating process for this examination begins and several times throughout the Regents examinationperiod.
Part A and Part B–1Allow 1 credit for each correct response.
2
1
4
2
1
2
4
3
3
1
2
2
3
3
4
3
4
4
2
3
1
4
1
4
3
3
2
1
2
3
2
4
3
4
3
3
2
1
2
4
1
1
3
4
2
3
4
2
4
4
Part B–1

Directions to the Teacher
Follow the procedures below for scoring student answer papers for the Physical Setting/EarthScience examination. Additional information about scoring is provided in the publicationInformation Booklet for Scoring Regents Examinations in the Sciences.
Use only red ink or red pencil in rating Regents papers. Do not correct the student’s work bymaking insertions or changes of any kind.
On the detachable answer sheet for Part A and Part B–1, indicate by means of a check markeach incorrect or omitted answer. In the box provided at the end of each part, record the numberof questions the student answered correctly for that part.
At least two science teachers must participate in the scoring of each student’s responses to thePart B–2 and Part C open-ended questions. Each of these teachers should be responsible for scoring a selected number of the open-ended questions on each answer paper. No one teacher is toscore all the open-ended questions on a student’s answer paper.
Students’ responses must be scored strictly according to the Scoring Key and Rating Guide. Foropen-ended questions, credit may be allowed for responses other than those given in the ratingguide if the response is a scientifically accurate answer to the question and demonstrates adequateknowledge as indicated by the examples in the rating guide. In the student’s answer booklet, recordthe number of credits earned for each answer in the box printed to the right of the answer lines orspaces for that question.
Fractional credit is not allowed. Only whole-number credit may be given to a response. Unitsneed not be given when the wording of the questions allows such omissions.
Raters should enter the scores earned for Part A, Part B–1, Part B–2, and Part C on the appropriate lines in the box printed on the answer booklet and then should add these four scoresand enter the total in the box labeled “Total Written Test Score.” The student’s score for theEarth Science Performance Test should be entered in the space provided. Then, the student’sraw scores on the performance test and written test should be converted to a scaled score byusing the conversion chart that will be posted on the Department’s web sitehttp://www.emsc.nysed.gov/osa/ on Friday, June 20, 2008. The student’s scaled score should beentered in the labeled box on the student’s answer booklet. The scaled score is the student’s finalexamination score.
All student answer papers that receive a scaled score of 60 through 64 must be scored a secondtime. For the second scoring, a different committee of teachers may score the student’s paper orthe original committee may score the paper, except that no teacher may score the same open-endedquestions that he/she scored in the first rating of the paper. The school principal is responsible forassuring that the student’s final examination score is based on a fair, accurate, and reliable scoringof the student’s answer paper.
Because scaled scores corresponding to raw scores in the conversion chart may change from oneexamination to another, it is crucial that for each administration, the conversion chart provided forthat administration be used to determine the student’s final score.
[3] [OVER]
PHYSICAL SETTING/EARTH SCIENCE – continued

PHYSICAL SETTING/EARTH SCIENCE – continued
[4]
Part B–2
Allow a total of 15 credits for this part. The student must answer all questions in this part.
51 [1] Allow 1 credit. The student’s line must be at the same level as the black line shown below.
Example of a 1-credit response:
52 [1] Allow 1 credit. Acceptable responses include, but are not limited to:
— The acid rain dissolves the limestone.
— The calcite in limestone chemically reacts with the acid.
53 [1] Allow 1 credit. Acceptable responses include, but are not limited to:
— burning fossil fuels
— exhaust emission from automobiles
— smoke from factories
River
Precipitation
KEY
Water
Box
Caves

54 [1] Allow 1 credit for the warm-front symbol drawn on the correct side of line XY.
Example of a 1-credit response:
55 [1] Allow 1 credit. Acceptable responses include, but are not limited to:
— condensation
— expanding air
— cooling to the dewpoint
— rising air
— deposition (sublimation)
56 [1] Allow 1 credit. Acceptable responses include, but are not limited to:
— Location A is influenced by a cold, dry air mass.
— Location A has clear skies.
— Location B is in a warm, moist air mass.
— Location B has cloud cover.
57 [1] Allow 1 credit. Acceptable responses include, but are not limited to:
— Location C is cooler because it is farther north.
— C is in a continental polar air mass, which is cold, dry air.
— Location C has clouds that block some of the sunlight.
cP B
DN
X
C
A
Y
mT
PHYSICAL SETTING/EARTH SCIENCE – continued
[5] [OVER]
PHYSICAL SETTING/EARTH SCIENCE – continued
58 [1] Allow 1 credit. Acceptable responses include, but are not limited to:
— east
— northeast
— ENE
59 [1] Allow 1 credit for Mercury.
60 [1] Allow 1 credit. Acceptable responses include, but are not limited to:
— These moons orbit Jupiter, not Earth.
— The geocentric model has all celestial objects revolving around Earth.
61 [1] Allow 1 credit. Acceptable responses include, but are not limited to:
— P-waves can travel through the liquid outer core, but S-waves cannot.
— P-waves travel through all parts of Earth’s interior.
— S-waves do not pass through the outer core.
62 [1] Allow 1 credit for any value from 2800 to 3000 km.
63 [1] Allow 1 credit for any value from 1408 to 1409 millions of cubic kilometers.
64 [1] Allow 1 credit. Acceptable responses include, but are not limited to:
— The oceans cover a larger portion of Earth’s surface than the continents.
— Air over oceans has more moisture than air over land.
— More evaporation occurs over the oceans.
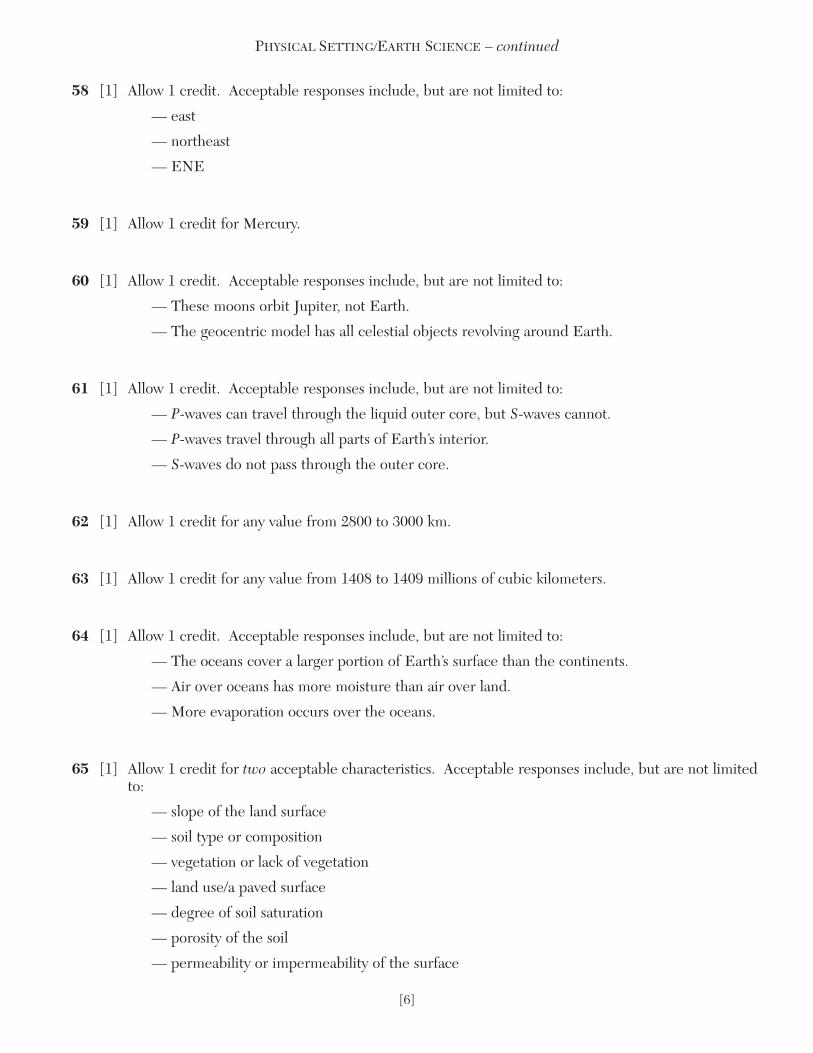
65 [1] Allow 1 credit for two acceptable characteristics. Acceptable responses include, but are not limited to:
— slope of the land surface
— soil type or composition
— vegetation or lack of vegetation
— land use/a paved surface
— degree of soil saturation
— porosity of the soil
— permeability or impermeability of the surface
[6]

Part C
Allow a total of 20 credits for this part. The student must answer all questions in this part.
66 [1] Allow 1 credit if the centers of all Xs are correctly plotted within the circles shown below and the Xs are correctly connected with a line that falls within the circles.
Example of a 1-credit graph:
Note: It is recommended that an overlay be used to ensure uniformity in scoring.
67 [1] Allow 1 credit for 22,800 yr.
68 [1] Allow 1 credit for tree trunk and an acceptable explanation. Acceptable explanations include, but are not limited to:
— The tree trunk is a recent organic remain.
— Carbon-14 is used to date recent remains.
Per
cen
tag
e o
f O
rig
inal
Car
bo
n-1
4 R
emai
nin
g
100
90
80
70
60
50
40
30
20
10
00 1 2 3 4 5 6
Number of Half-Lives
Radioactive Decay of Carbon-14
[7] [OVER]
PHYSICAL SETTING/EARTH SCIENCE – continued
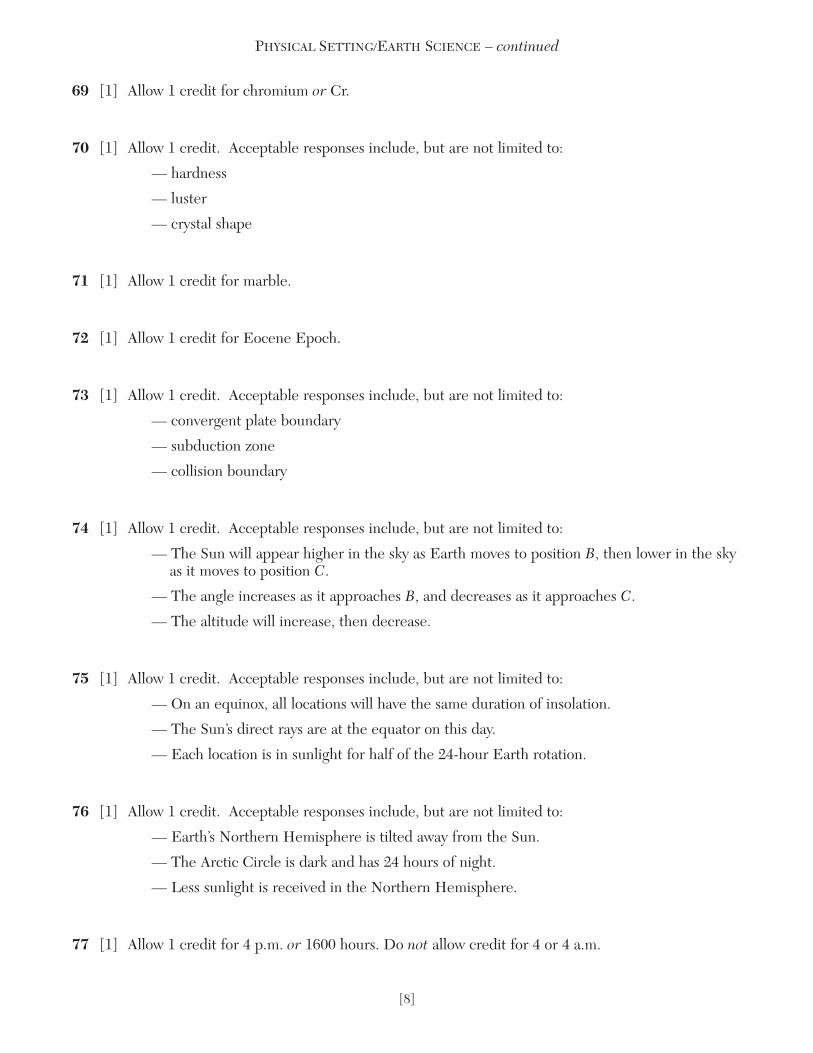
69 [1] Allow 1 credit for chromium or Cr.
70 [1] Allow 1 credit. Acceptable responses include, but are not limited to:
— hardness
— luster
— crystal shape
71 [1] Allow 1 credit for marble.
72 [1] Allow 1 credit for Eocene Epoch.
73 [1] Allow 1 credit. Acceptable responses include, but are not limited to:
— convergent plate boundary
— subduction zone
— collision boundary
74 [1] Allow 1 credit. Acceptable responses include, but are not limited to:
— The Sun will appear higher in the sky as Earth moves to position B, then lower in the sky as it moves to position C.
— The angle increases as it approaches B, and decreases as it approaches C.
— The altitude will increase, then decrease.
75 [1] Allow 1 credit. Acceptable responses include, but are not limited to:
— On an equinox, all locations will have the same duration of insolation.
— The Sun’s direct rays are at the equator on this day.
— Each location is in sunlight for half of the 24-hour Earth rotation.
76 [1] Allow 1 credit. Acceptable responses include, but are not limited to:
— Earth’s Northern Hemisphere is tilted away from the Sun.
— The Arctic Circle is dark and has 24 hours of night.
— Less sunlight is received in the Northern Hemisphere.
77 [1] Allow 1 credit for 4 p.m. or 1600 hours. Do not allow credit for 4 or 4 a.m.
[8]
PHYSICAL SETTING/EARTH SCIENCE – continued
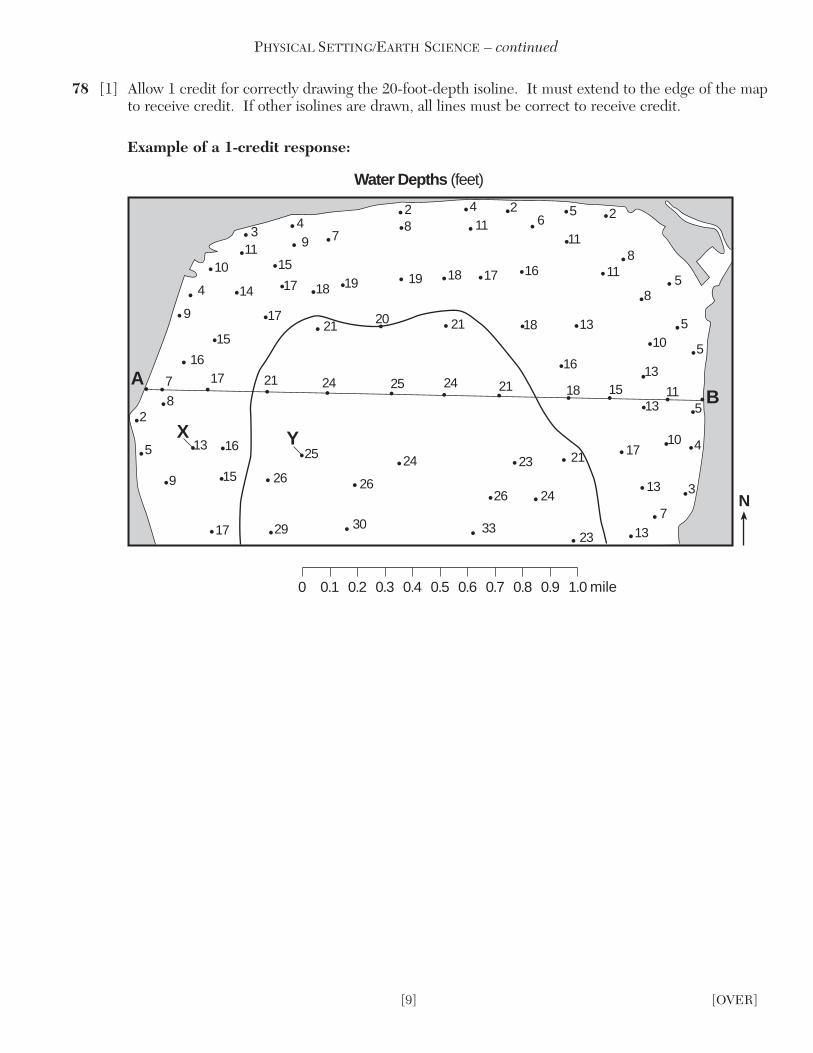
78 [1] Allow 1 credit for correctly drawing the 20-foot-depth isoline. It must extend to the edge of the map to receive credit. If other isolines are drawn, all lines must be correct to receive credit.
Example of a 1-credit response:
9
17
4
10113
15
1714 18
94
7
19 19
82 4
11
18 17
202117
15
17
16
15 26
25
21 24 25 24
24
26
30 33
26
23
24
23 13
7
13
1721
131518
10
3
4
511
13
105
5
1318
85
118
11
16
62 5 2
16
21
9
16
7
8
A
13
2
5
29
B
21
Water Depths (feet)
1.0 mile0.90.80.70.60.50.40.30.20.10
N
YX
[9] [OVER]
PHYSICAL SETTING/EARTH SCIENCE – continued

79 [2] Allow a maximum of 2 credits, allocated as follows:
Allow 2 credits if the centers of all ten student-plotted Xs are within the circles shown below andthe Xs are correctly connected with a line that falls within the circles.
Allow 1 credit if the centers of only eight or nine student-plotted Xs are within the circles shownbelow and the Xs are correctly connected with a line that falls within the circles.
or
Allow 1 credit if all ten student-plotted Xs are within the circles shown below, but not correctly connected with a line.
Example of a 2-credit response:
80 [1] Allow 1 credit for any value from 28 to 32 with correct units. Acceptable units include, but are not limited to:
— feet/mile
— ft/mi
— feet per mile
A B
30
20
10
0
30
20
10
0
Dep
th (
ft)
Distance (mi)
Lake Surface
PHYSICAL SETTING/EARTH SCIENCE – continued
[10]

81 [1] Allow 1 credit if all values, units, and compass directions for latitude and longitude are correct, as shown.
Latitude: 34° N
Longitude: 118.5° W
118° 30' W
82 [1] Allow 1 credit. Acceptable responses include, but are not limited to:
— It is near a plate boundary.
— The San Andreas Fault is nearby.
— The bedrock contains many faults.
83 [1] Allow 1 credit. Acceptable responses include, but are not limited to:
— Oakland is farthest from the epicenter.
84 [1] Allow 1 credit for two acceptable responses. Acceptable responses include, but are not limited to:
— secure heavy objects
— prepare an emergency medical kit
— plan an evacuation route
— locate the nearest shelter
— reinforce house structure
[11]
PHYSICAL SETTING/EARTH SCIENCE – concluded
[12]
The Chart for Determining the Final Examination Score for the June 2008Regents Examination in Physical Setting/Earth Science will be posted on the Department’s web site http://www.emsc.nysed.gov/osa/ on Friday,June 20, 2008. Conversion charts provided for previous administrations ofthe Regents Examination in Physical Setting/Earth Science must NOT beused to determine students’ final scores for this administration.
Regents Examination in Physical Setting/Earth Science
June 2008
Chart for Converting Total Test Raw Scores toFinal Examination Scores (Scaled Scores)
Submitting Teacher Evaluations of the Test to the Department
Suggestions and feedback from teachers provide an important contribution to the test development process. The Department provides an online evaluation form for State assessments. It contains spaces for teachers to respond to several specific questions and tomake suggestions. Instructions for completing the evaluation form are as follows:
1. Go to www.emsc.nysed.gov/osa/exameval.
2. Select the test title.
3. Complete the required demographic fields.
4. Complete each evaluation question and provide comments in the space provided.
5. Click the SUBMIT button at the bottom of the page to submit the completed form.

June 2008 Physical Setting/Earth Science
Question Numbers
Key Ideas/Performance Indicators Part A Part B Part C
Standard 1
Math Key Idea 1 63 66, 79, 80
Math Key Idea 2 26, 30, 33 37, 38, 41, 42, 43
Math Key Idea 3 59 67
Science Inquiry Key Idea 1 1, 4, 14
36, 39, 44, 45, 50, 52, 60, 64
68, 69, 82
Science Inquiry Key Idea 2
Science Inquiry Key Idea 3 6 37, 38, 46, 47, 59 71, 72
Engineering Design Key Idea 1
Standard 2
Key Idea 1
Key Idea 2
Key Idea 3
Standard 6
Key Idea 1 65 69, 70
Key Idea 2 10, 11, 12, 13, 14, 15, 16, 17, 20, 21, 22, 26, 27, 28, 29, 31, 32, 35
36, 40, 45, 48, 49, 51, 54, 55, 56, 57, 58, 61, 62, 63
71, 73, 74, 75, 76, 77, 78, 79, 81, 82, 83
Key Idea 3 2 80, 81
Key Idea 4
Key Idea 5 12 55, 56, 57, 58 67, 80
Key Idea 6
Standard 7
Key Idea 1 53
Key Idea 2 84
Standard 4
Key Idea 1 1, 2, 3, 4, 5, 10, 11, 12, 13, 15, 20, 21, 22
36, 37, 38, 39, 44, 45, 51, 59, 60, 63, 64, 65
66, 67, 68, 72, 77, 81
Key Idea 2 6, 7, 8, 9, 14, 16, 17, 18, 19, 23, 24, 25, 27, 28, 29, 30, 31, 32, 33
39, 40, 41, 42, 43, 48, 49, 50, 52, 53, 54, 55, 56, 57, 58, 61, 62
73, 74, 75, 76, 78, 79, 80, 82, 83, 84
Key Idea 3 26, 34, 35 46, 47 69, 70, 71
Reference Tables
ESRT 2001 Edition (Revised) 2, 3, 6, 14, 16, 18, 20, 21, 23, 24, 25, 26, 33, 34, 35
37, 38, 46, 47, 54, 59, 62
67, 71, 72, 73, 80, 82
Map to Core Curriculum


Regents Examination in Physical Setting/Earth Science – June 2008 Chart for Converting Total Test Raw Scores to Final Examination Scores (Scaled Scores)
To determine the student’s final score, locate the student’s Total Performance Test Score across the top of the chart and the Total Written Test Score down the side of the chart. The point where the two scores intersect is the student’s final examination score. For example, a student receiving a Total Performance Test Score of 10 and Total Written Test Score of 72 would receive a final examination score of 90.
Total Performance Test Score
16 15 14 13 12 11 10 9 8 7 6 5 4 3 2 1 0 85 100 99 99 99 98 98 97 96 96 95 94 93 91 90 88 87 85 84 99 99 98 98 98 97 96 96 95 94 93 92 91 89 88 86 84 83 99 99 98 98 98 97 96 96 95 94 93 92 91 89 88 86 84 82 98 98 98 97 97 96 95 95 94 93 92 91 90 88 87 85 83 81 97 97 97 96 96 95 95 94 93 92 91 90 89 88 86 84 82 80 97 97 97 96 96 95 95 94 93 92 91 90 89 88 86 84 82 79 97 96 96 95 95 94 94 93 92 91 90 89 88 87 85 83 82 78 96 95 95 95 94 94 93 92 91 91 89 88 87 86 84 83 81 77 96 95 95 95 94 94 93 92 91 91 89 88 87 86 84 83 81 76 95 95 94 94 93 93 92 91 91 90 89 88 86 85 83 82 80 75 94 94 93 93 92 92 91 90 90 89 88 87 86 84 83 81 79 74 94 94 93 93 92 92 91 90 90 89 88 87 86 84 83 81 79 73 93 93 92 92 92 91 90 90 89 88 87 86 85 83 82 80 78 72 92 92 92 91 91 90 90 89 88 87 86 85 84 82 81 79 77 71 92 91 91 90 90 89 89 88 87 86 85 84 83 82 80 78 77 70 91 90 90 89 89 88 88 87 86 85 84 83 82 81 79 77 76 69 91 90 90 89 89 88 88 87 86 85 84 83 82 81 79 77 76 68 90 90 89 89 88 88 87 86 85 85 84 82 81 80 78 77 75 67 89 89 88 88 87 87 86 85 85 84 83 82 80 79 77 76 74 66 88 88 87 87 86 86 85 85 84 83 82 81 80 78 77 75 73 65 87 87 87 86 86 85 84 84 83 82 81 80 79 77 76 74 72 64 86 86 86 85 85 84 84 83 82 81 80 79 78 77 75 73 71 63 86 85 85 84 84 83 83 82 81 80 79 78 77 76 74 72 71 62 86 85 85 84 84 83 83 82 81 80 79 78 77 76 74 72 71 61 85 84 84 84 83 82 82 81 80 79 78 77 76 75 73 72 70 60 84 84 83 83 82 82 81 80 80 79 78 77 75 74 72 71 69 59 83 83 82 82 81 81 80 79 79 78 77 76 74 73 71 70 68 58 82 82 81 81 81 80 79 79 78 77 76 75 74 72 71 69 67 57 81 81 81 80 80 79 78 78 77 76 75 74 73 71 70 68 66 56 80 80 80 79 79 78 78 77 76 75 74 73 72 71 69 67 65 55 80 79 79 78 78 77 77 76 75 74 73 72 71 70 68 66 65 54 79 78 78 78 77 77 76 75 74 74 72 71 70 69 67 66 64 53 78 78 77 77 76 76 75 74 74 73 72 71 69 68 66 65 63 52 77 77 76 76 75 75 74 73 73 72 71 70 69 67 66 64 62 51 76 76 75 75 75 74 73 73 72 71 70 69 68 66 65 63 61 50 75 75 75 74 74 73 73 72 71 70 69 68 67 65 64 62 60 49 75 74 74 73 73 72 72 71 70 69 68 67 66 65 63 61 60 48 73 73 72 72 71 71 70 69 68 68 67 65 64 63 61 60 58 47 72 72 71 71 70 70 69 68 68 67 66 65 63 62 60 59 57 46 71 71 70 70 69 69 68 68 67 66 65 64 63 61 60 58 56 45 70 70 70 69 69 68 67 67 66 65 64 63 62 60 59 57 55
To
tal W
ritte
n Te
st S
core
44 69 69 69 68 68 67 67 66 65 64 63 62 61 60 58 56 54

Total Performance Test Score June 2008 Examination in Physical Setting/Earth Science – continued
Total Performance Test Score
16 15 14 13 12 11 10 9 8 7 6 5 4 3 2 1 0 43 69 68 68 67 67 66 66 65 64 63 62 61 60 59 57 55 54 42 68 67 67 67 66 65 65 64 63 62 61 60 59 58 56 55 53 41 66 66 65 65 64 64 63 62 62 61 60 59 57 56 54 53 51 40 65 65 64 64 64 63 62 62 61 60 59 58 57 55 54 52 50 39 64 64 64 63 63 62 61 61 60 59 58 57 56 54 53 51 49 38 63 63 63 62 62 61 61 60 59 58 57 56 55 54 52 50 48 37 63 62 62 61 61 60 60 59 58 57 56 55 54 53 51 49 48 36 61 61 60 60 59 59 58 57 57 56 55 54 52 51 49 48 46 35 60 60 59 59 58 58 57 56 56 55 54 53 52 50 49 47 45 34 59 59 58 58 58 57 56 56 55 54 53 52 51 49 48 46 44 33 58 57 57 56 56 55 55 54 53 52 51 50 49 48 46 44 43 32 57 56 56 55 55 54 54 53 52 51 50 49 48 47 45 43 42 31 56 56 55 55 54 54 53 52 51 51 50 48 47 46 44 43 41 30 55 55 54 54 53 53 52 51 51 50 49 48 46 45 43 42 40 29 53 53 53 52 52 51 50 50 49 48 47 46 45 43 42 40 38 28 52 52 52 51 51 50 50 49 48 47 46 45 44 43 41 39 37 27 52 51 51 50 50 49 49 48 47 46 45 44 43 42 40 38 37 26 50 50 49 49 48 48 47 46 46 45 44 43 41 40 38 37 35 25 49 49 48 48 47 47 46 45 45 44 43 42 40 39 37 36 34 24 47 47 47 46 46 45 44 44 43 42 41 40 39 37 36 34 32 23 46 46 46 45 45 44 44 43 42 41 40 39 38 37 35 33 31 22 45 44 44 44 43 43 42 41 40 40 38 37 36 35 33 32 30 21 44 44 43 43 42 42 41 40 40 39 38 37 35 34 32 31 29 20 42 42 41 41 41 40 39 39 38 37 36 35 34 32 31 29 27 19 41 41 41 40 40 39 39 38 37 36 35 34 33 31 30 28 26 18 41 40 40 39 39 38 38 37 36 35 34 33 32 31 29 27 26 17 39 39 38 38 37 37 36 35 34 34 33 31 30 29 27 26 24 16 37 37 36 36 35 35 34 34 33 32 31 30 29 27 26 24 22 15 36 36 36 35 35 34 33 33 32 31 30 29 28 26 25 23 21 14 35 34 34 33 33 32 32 31 30 29 28 27 26 25 23 21 20 13 34 33 33 33 32 31 31 30 29 28 27 26 25 24 22 21 19 12 32 32 31 31 30 30 29 28 28 27 26 25 23 22 20 19 17 11 31 31 30 30 30 29 28 28 27 26 25 24 23 21 20 18 16 10 29 29 29 28 28 27 27 26 25 24 23 22 21 20 18 16 14 9 28 27 27 27 26 26 25 24 23 23 21 20 19 18 16 15 13 8 27 27 26 26 25 25 24 23 23 22 21 20 18 17 15 14 12 7 25 25 24 24 24 23 22 22 21 20 19 18 17 15 14 12 10 6 24 23 23 22 22 21 21 20 19 18 17 16 15 14 12 10 9 5 23 22 22 21 21 20 20 19 18 17 16 15 14 13 11 9 8 4 21 21 20 20 19 19 18 17 17 16 15 14 12 11 9 8 6 3 19 19 19 18 18 17 16 16 15 14 13 12 11 9 8 6 4 2 18 18 18 17 17 16 16 15 14 13 12 11 10 9 7 5 3 1 17 16 16 16 15 14 14 13 12 11 10 9 8 7 5 4 2
Tota
l Writ
ten
Test
Sco
re
0 15 15 14 14 13 13 12 11 11 10 9 8 6 5 3 2 0
Page 2