Embed Size (px)
Citation preview
SCIENCE 1206 Unit 3
Physical Science – Motion

Introduction
Motion is a common theme in our everyday
lives: birds fly, babies crawl, and we, run, drive,
and walk.
•Kinematics is the study
oof how objects move.

Sign Convention
In physics we will use
a standard set of
signs and directions.
Up, right, east and
north are positive
directions. ( + )
Down, left, west, and
south are negative
directions. ( - )

Types of Measures
Scalar –
Vector –

Distance and Displacement
Distance (d) is a scalar
measure of the actual
path between two
locations .
It has a magnitude and a
unit.
Ex: 50 m, 2.5 hrs.

Distance cont’d….


Vectors are always added tip to tail.
The resultant or net vector goes from the start of the first
vector to the tip of the last vector.
The black lines represents the distance traveled to get from the
home base to the destination(path actually taken)
The red line represents the displacement from the home base
to the destination (the shortest distance from the start point to
the end point)

Displacement (d) is a vector measure of the
change in position measured in a straight line
from a starting reference point.
It has a magnitude, unit and direction.
Ex: 5 m [W]
Displacement
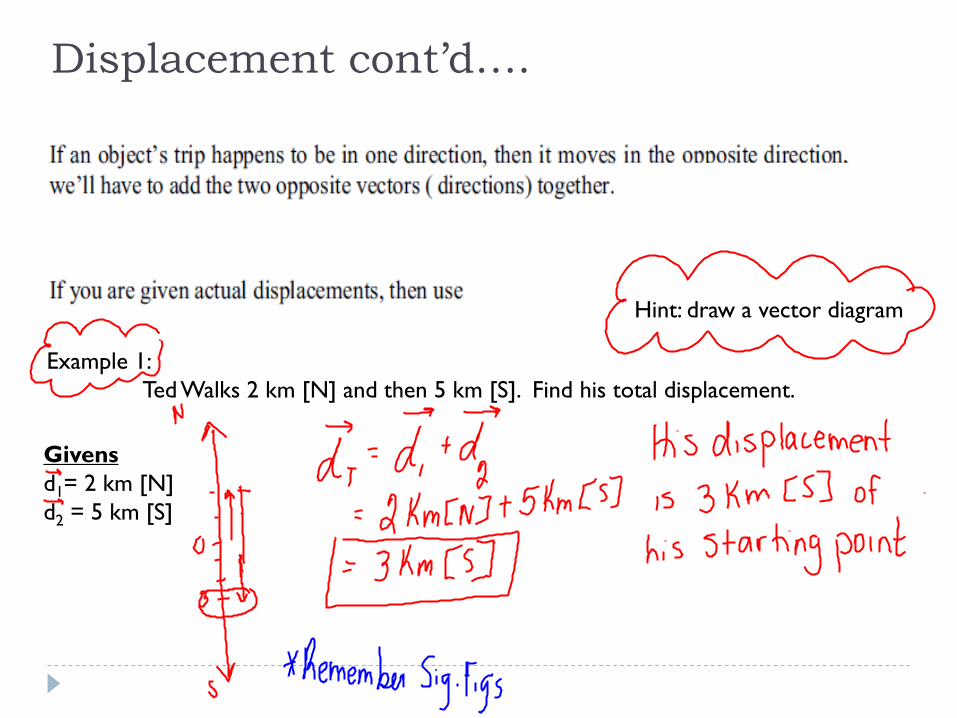
Displacement cont’d….
Example 1:
Ted Walks 2 km [N] and then 5 km [S]. Find his total displacement.
Givens
d1= 2 km [N]
d2 = 5 km [S]
Hint: draw a vector diagram

Example 1
A person started from the zero position, moved 3.0 km East (or to
the right), then moved backward 4.0 km West (or to the left).
A)What is the distance
B) What is the displacement

Distance – total trip d total = d1 + d2 + d3 + d4
d total = 2m + 4m + 2m + 4m
d total = 12 m
Displacement – change in position
d total = d1 + d2 + d3 + d4
d total =
Example 2
A person started from the zero position,
and moved as shown in the diagram.
A)What is the distance traveled?
B) What is the displacement?
Origin

When you return back to your original starting point,

Seatwork/homework: Chapter 11 in Textbook
Read P. 414-416
Complete Questions: P. 416-417 # 1,4,5,6,13
Distance and displacement worksheet
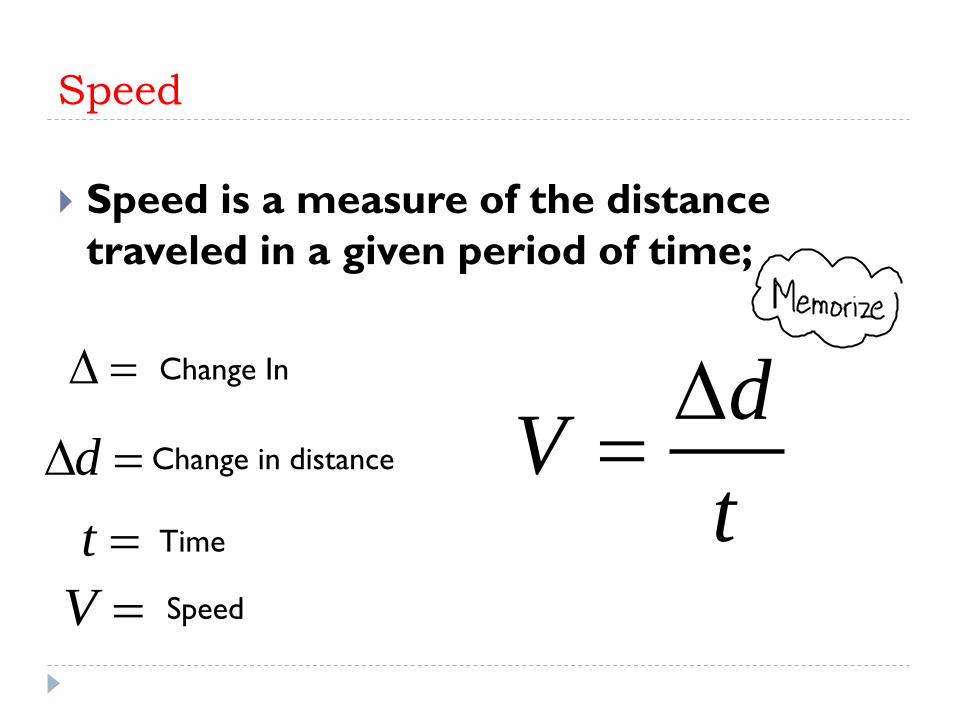
Speed
Speed is a measure of the distance
traveled in a given period of time;
Change In
Change in distance
Time
dV
t
d
t
V Speed


Instantaneous Speed
Instantaneous speed is speed at any instant
in time.
A speedometer measures speed in „real time‟
(the instantaneous speed).

Mrs. Cranford walked her dog, Dakota, at 2.0 m/s for
4.0 s. How far did Mrs. Cranford walk her dog?

The world‟s fastest car, travelled 567.7 m at an average speed of
341 m/s. What is the length of time travelled in km/h?

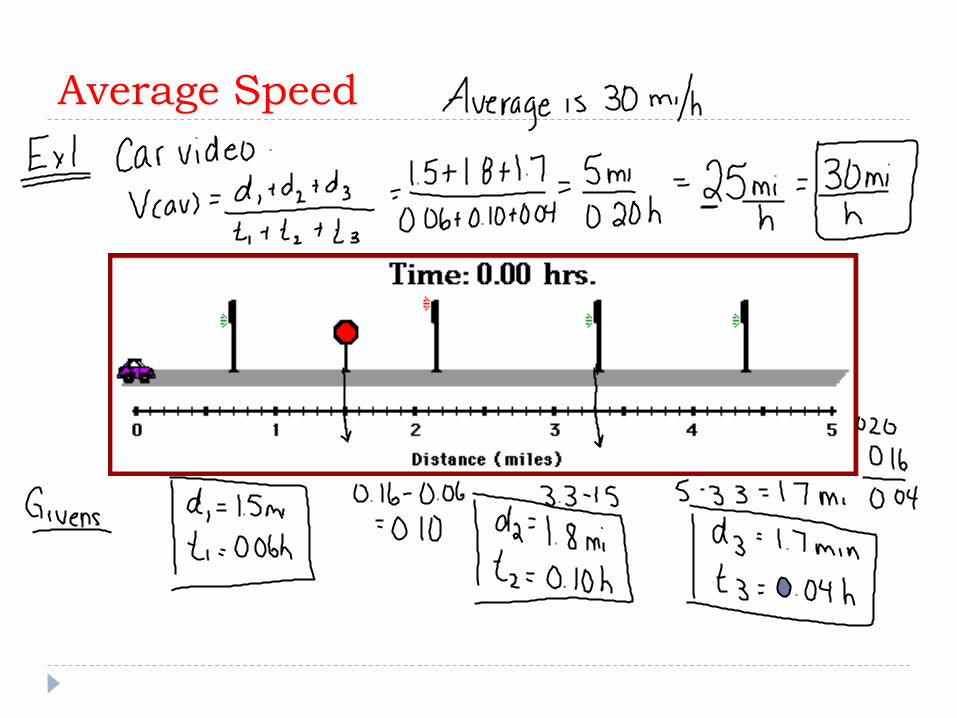
Average Speed
Average speed is the average of all
instantaneous speeds; found simply by a total
distance/total time ratio
The average speed of a trip:
timeelapsed
distance total speed average
Average Speed
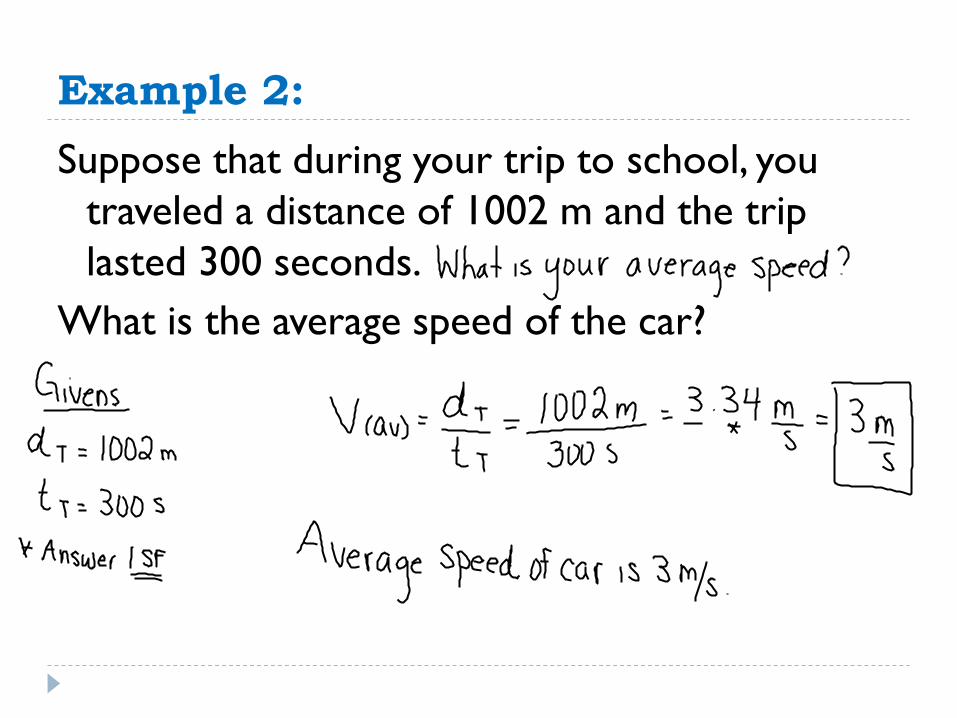
Example 2:
Suppose that during your trip to school, you
traveled a distance of 1002 m and the trip
lasted 300 seconds.
What is the average speed of the car?
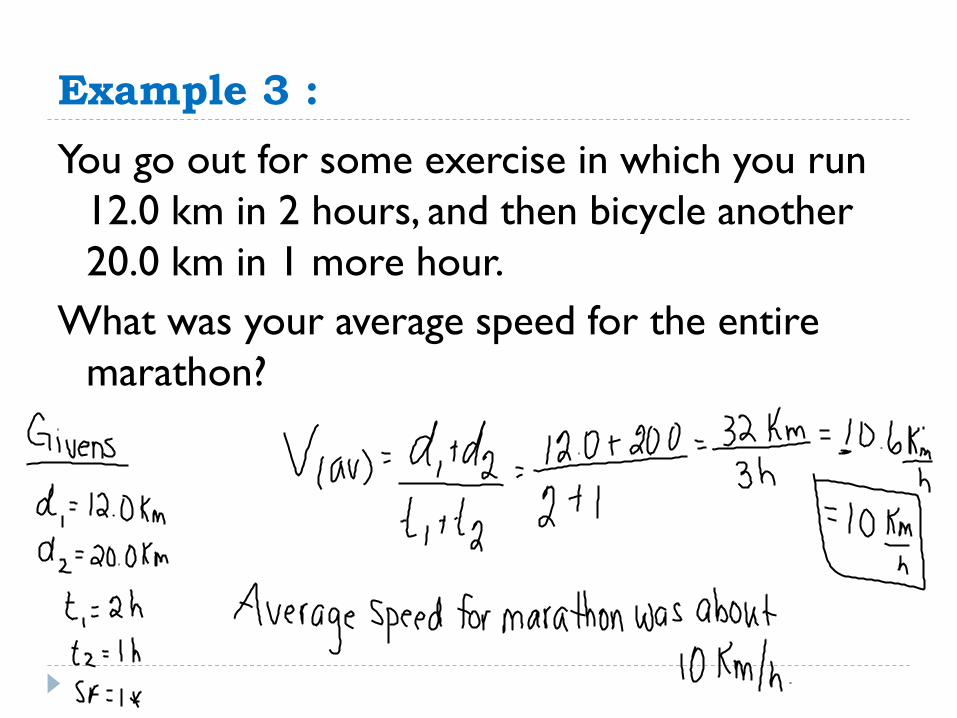
Example 3 :
You go out for some exercise in which you run
12.0 km in 2 hours, and then bicycle another
20.0 km in 1 more hour.
What was your average speed for the entire
marathon?

Givens:
The planes average speed is 570 km/h

Speed in a given direction is velocity (vector).

What is the velocity of a car that travels from
Labrador City to Churchill Falls (283Km [W]) in 3.0h?

Need to find displacement
Think
Givens:
Runners average velocity is 3.6 𝑘𝑚 ℎ 𝑁 .

Practice Examples
Question #1
An ant on a picnic table walks 130 cm to the
right and then 290 cm to the left in a total of
40.0 s. Determine the ant‟s distance covered,
displacement from original point, average
speed, average velocity.

Solution
distance = d = total path of the ant = l30 cm + 290 cm = 420
cm
displacement = d = change in position of the ant =130cm+ (–
290) cm =–160 cm = 160 cm [left] of the starting point

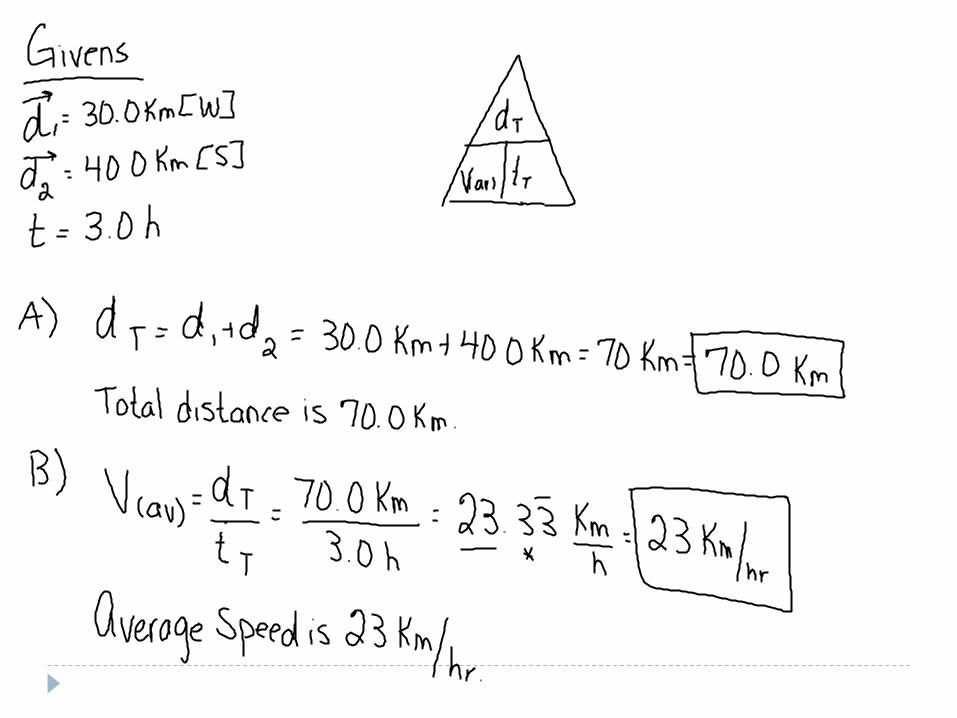
Question - Bonus
Vectors at 90 degrees. (Pythagorean Theorem C2 = a2 + b2 )
A crow flies 30.0 km west, then 40.0 km south. The
entire trek took 3.0 h.
Determine the crow‟s:
(a) total distance traveled
(b) average speed
(c) displacement (actual distance and direction from
where he started) - Hint – Pythagorean theorem
(d) average velocity


Uniform Motion
Rolling ball is an example of uniform motion.
1)Speed of the ball is constant (with no
friction).
2) In a straight line


Distance-time graphs
On your paper, graph the following:
D(m) T(sec)
0 0
5 7
10 14
15 21

Distance – Time Graphs
Distance
(m)
Time (s)
Was your graph a straight line?
A distance-time graph which is a
straight line indicates constant speed.
In constant speed, the object does
not speed up or slow down. The
acceleration is zero.

The Steeper the slope the faster the object is
moving.
In this graph Object A is moving fastest and Object C is
moving slowest

On a distance time graph for uniform motion the slope
equals the average speed.
avg
dV
t

What is the Vavg for this graph?
2 1
2 1
8 4 42 /
4 2 2avg
y yV Slope m s
x x
Displacement Time Graphs
Like distance time graphs only displacement can be either
positive or negative, therefore we need two quadrants.

AKA


Over the next few slides we will summarize some facts about
graphs and motion.
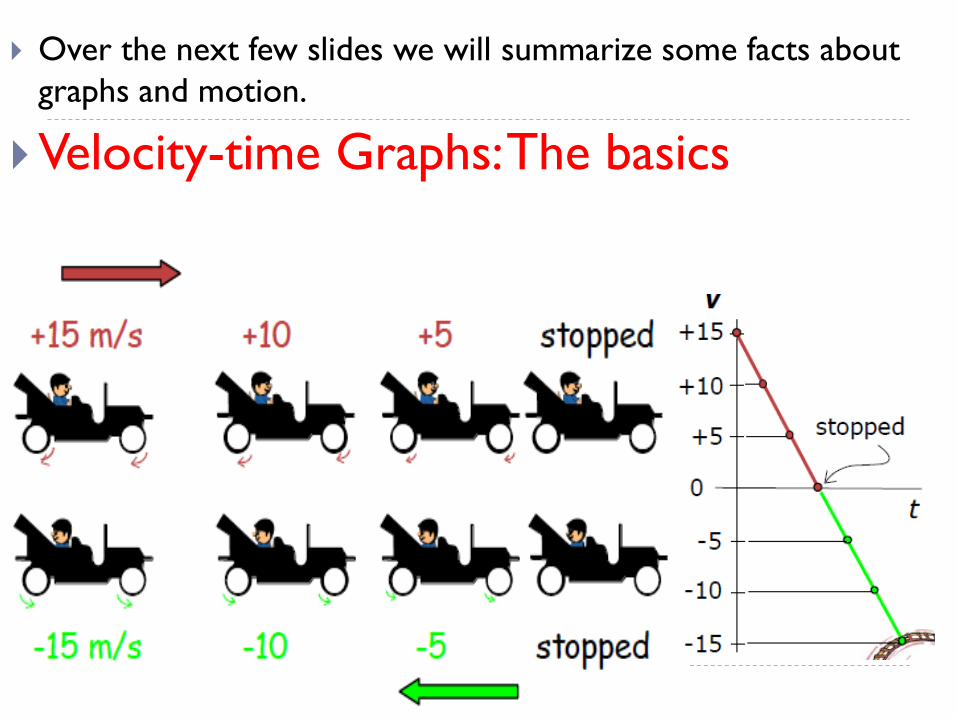
Velocity-time Graphs: The basics

Slope is zero therefore the acceleration is zero.

Describe the motion:
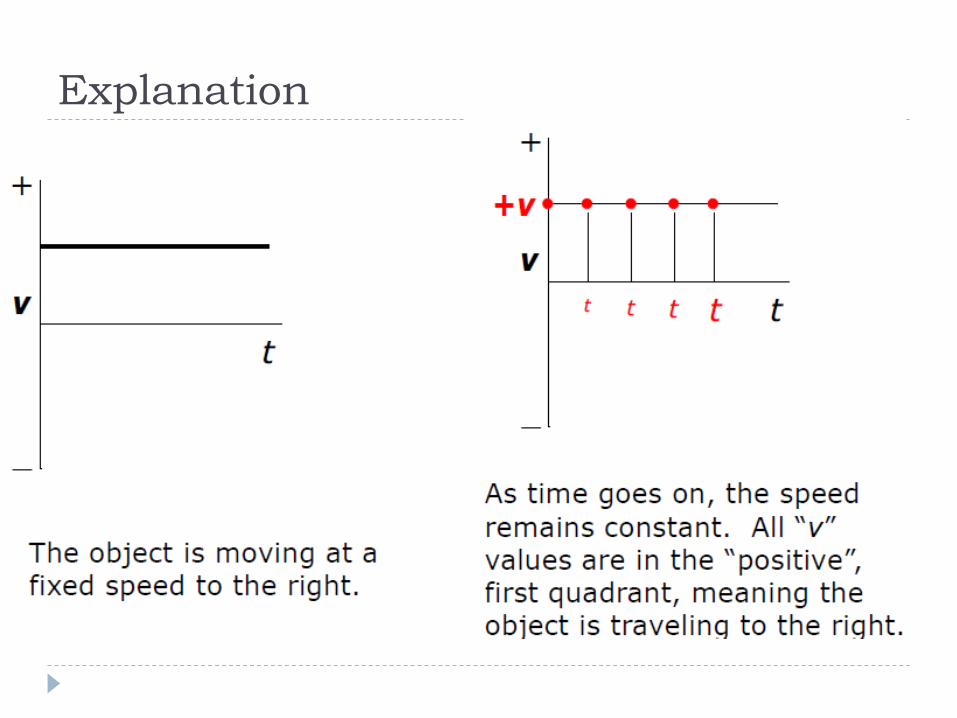
Explanation

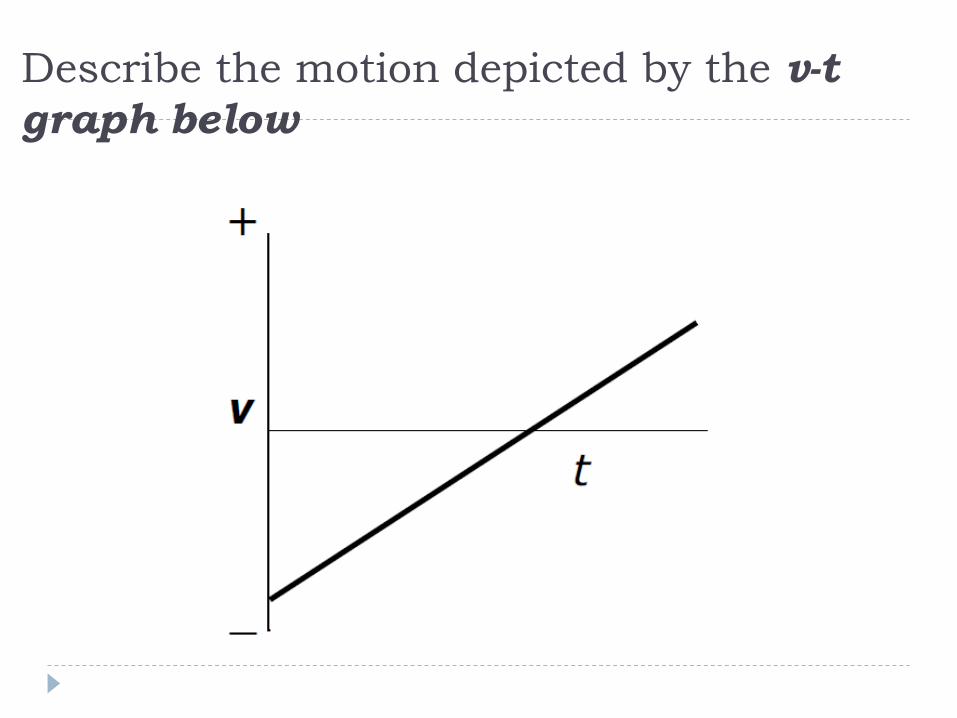
Describe the motion depicted by the v-t
graph below
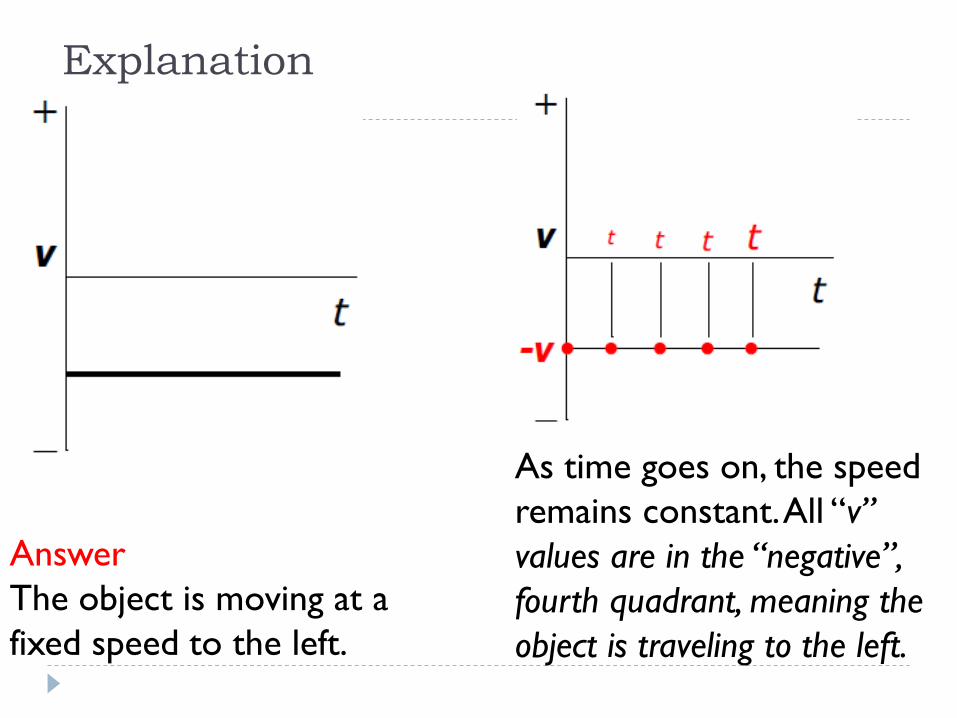
Explanation
Answer
The object is moving at a
fixed speed to the left.
As time goes on, the speed
remains constant. All “v”
values are in the “negative”,
fourth quadrant, meaning the
object is traveling to the left.
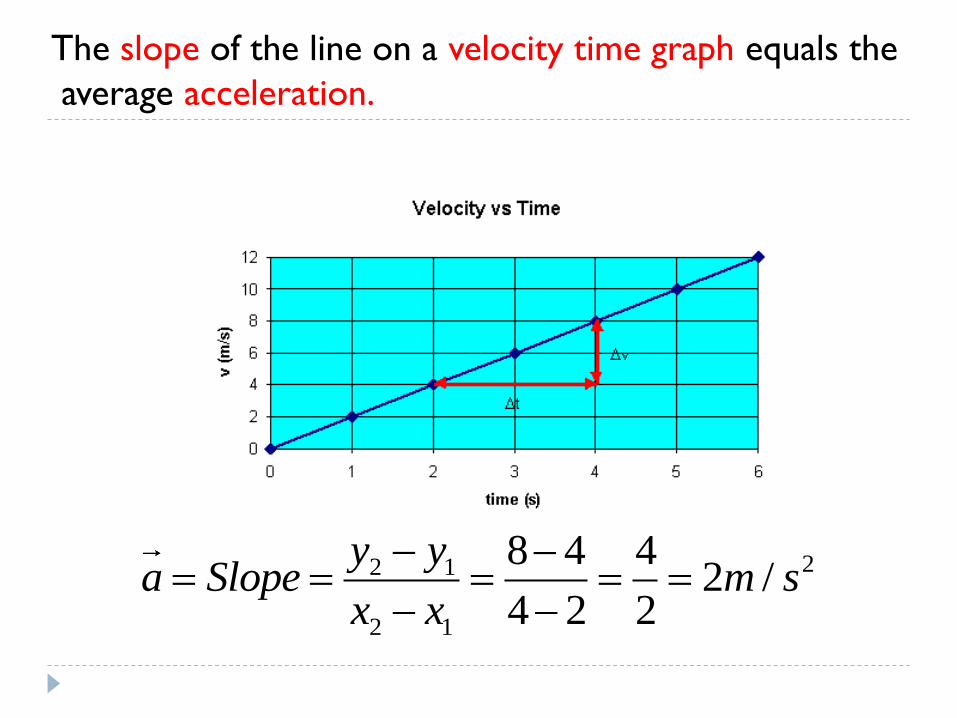
The slope of the line on a velocity time graph equals the
average acceleration.
22 1
2 1
8 4 42 /
4 2 2
y ya Slope m s
x x

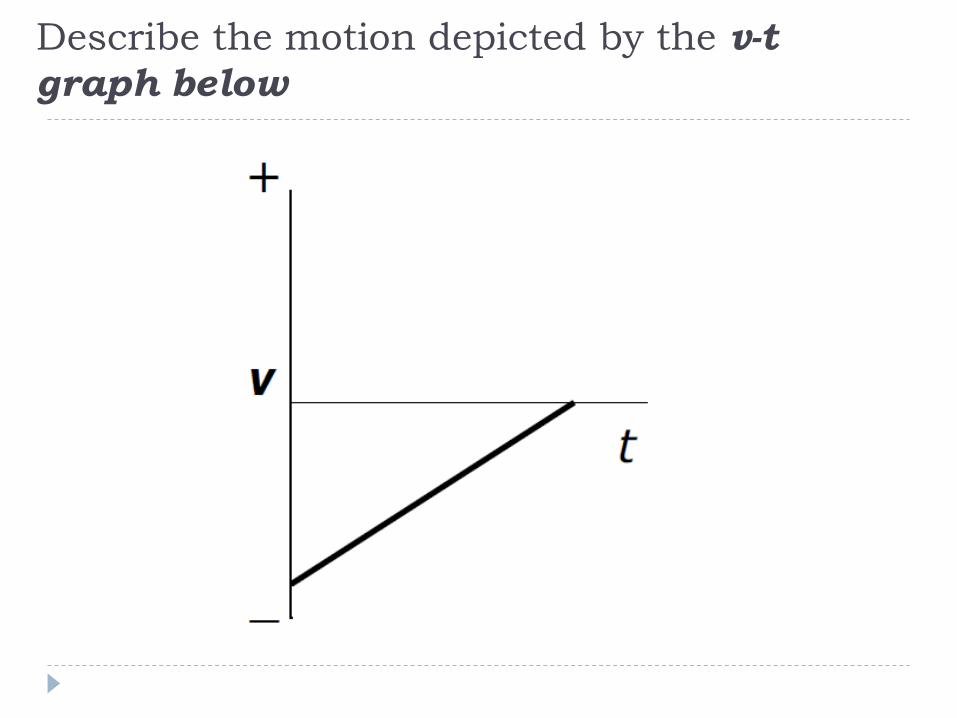
Describe the motion depicted by the v-t
graph below

Explanation
Answer
The object starts from rest
and accelerates to the right.
As time goes on, the speed
increases from zero. All “v”
values are positive meaning the
object is traveling to the right.

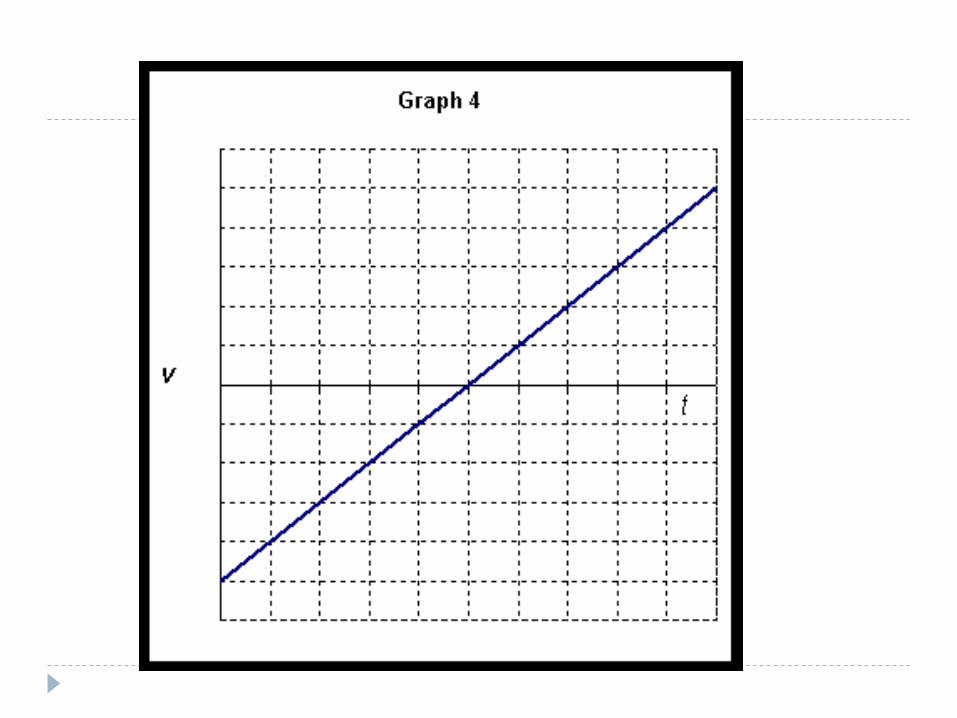
Describe the motion depicted by the v-t
graph below

Explanation
Answer
At time zero the object is
already moving to the right. It
continues to accelerate to the
right.
At time zero, there is
already a positive value for
the speed. As time goes on,
the positive speeds
increase. That is, the object
picks up speed to the right.

Describe the motion depicted by the v-t
graph below

Explanation
Answer
The object is moving to the
right but accelerating to the
left. It therefore slows down
and stops.
At time zero, there is already
a positive value for the speed.
As time goes on, the positive
speeds decrease. The object
keeps moving to the right but
slows down and stops.

Describe the motion depicted by the v-t
graph below

Explanation
Answer
The object starts from
rest and accelerates to
the left.
At time zero, the object is not
moving. Then, as time goes on
there is an increase in “negative”
speeds as the object picks up
speed to the left.
Describe the motion depicted by the v-t
graph below

Explanation
Answer
The object starts
with an initial
speed to the left
but slows down
and stops.
At time zero, the object has a
maximum speed to the left .
However, as time increases,
speed decreases, and the
object stops.
Describe the motion depicted by the v-t
graph below

Explanation
Answer
The object starts with an
initial speed to the left
and accelerates to the
right.
At time zero, the object has a
maximum speed to the left .
However, as time increases, speed
decreases, and the object stops.
But it continues to accelerate to
the right, meaning that after its
brief stop, it took off to the right.

On a velocity - time graph the area between the
graphed line and the x-axis equals the displacement
Area = l x w = 6 s x 30 m/s = 180 m
To find out the
Distance travelled
On a v-t graph!!
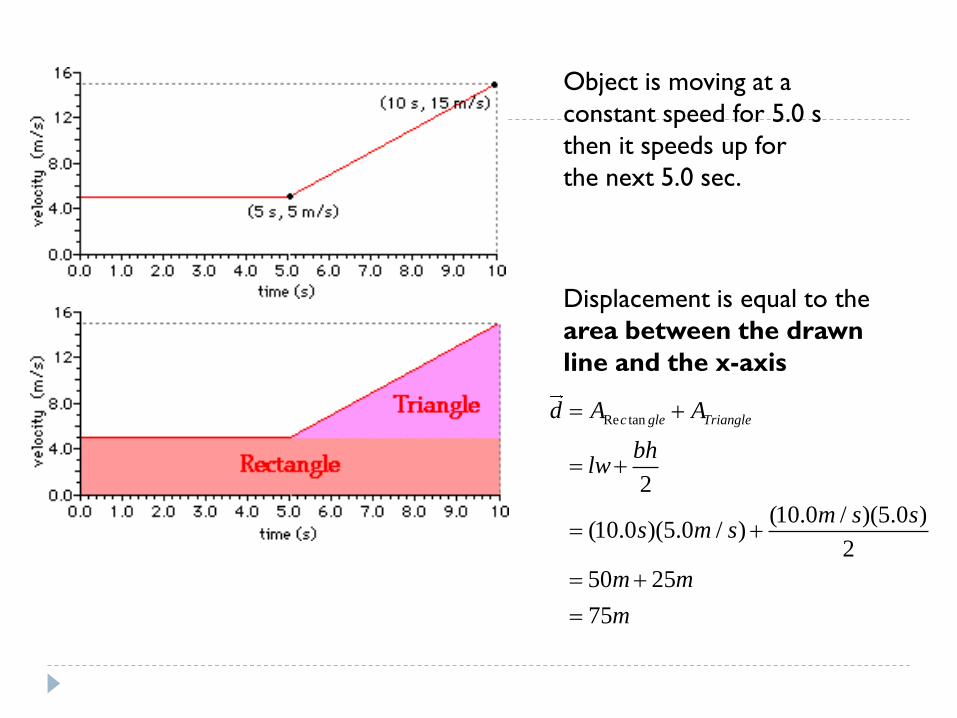
Object is moving at a
constant speed for 5.0 s
then it speeds up for
the next 5.0 sec.
Re tan
2
(10.0 / )(5.0 )(10.0 )(5.0 / )
2
50 25
75
c gle Triangled A A
bhlw
m s ss m s
m m
m
Displacement is equal to the
area between the drawn
line and the x-axis
ACCELERATION
Acceleration is a vector quantity which is
defined as "the rate at which an object changes
its velocity." An object is accelerating if it is
changing its velocity

CONSTANT ACCELERATION Sometimes an accelerating object will change its velocity by
the same amount each second. This is known as a constant
acceleration since the velocity is changing by the same
amount each second.

Calculating Acceleration
Acceleration can be found using the following
formula:
= acceleration
= initial velocity
Note: The units for acceleration is m/s/s or m/s2
2 1v vva
t t
a 2v
1v t= final velocity
= change in time

Example 1:
A skier is moving at 1.8 m/s (down) near the
top of a hill. 4.2 s later she is travelling at 8.3
m/s (down). What is her average acceleration?
Example 2:
A rabbit, eating in a field, scents a fox nearby and
races off. It takes only 1.8 s to reach a top
velocity of 7.5 m/s [N]. What is the rabbit‟s
acceleration during this time?

Note: The direction of velocity and acceleration will
determine the size of the velocity (ie. If an object
is speeding up or slowing down)
Velocity
Acc
ele
ration
+ -
+ Moving Forward,
Speeding up
Moving Forward,
Slowing down
- Moving backward,
slowing down
Moving backward,
speeding up

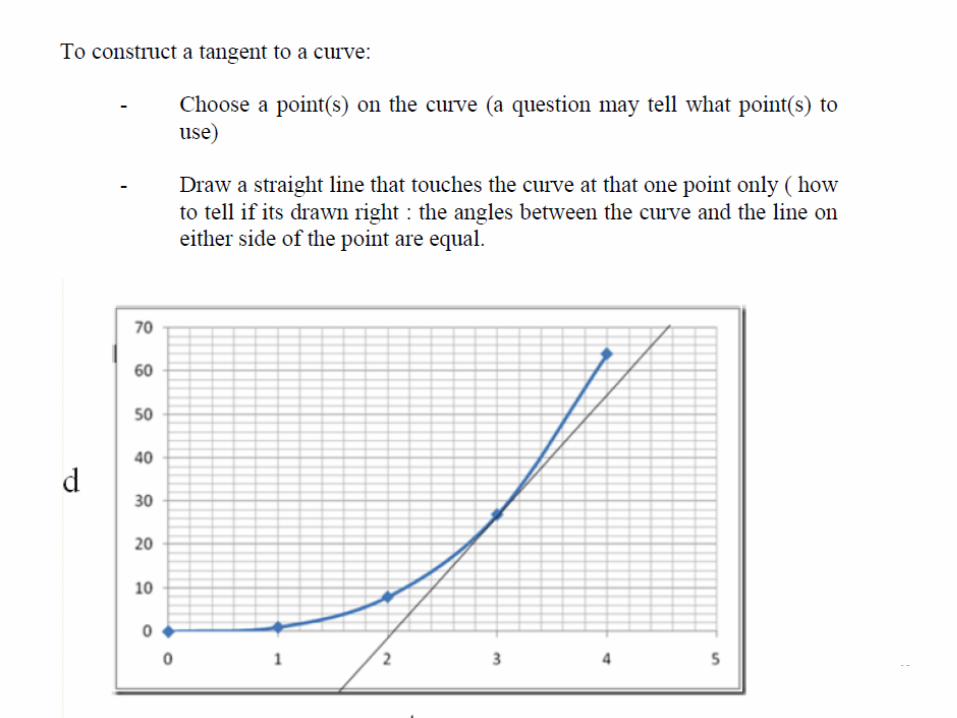
Displacement-time Graphs (Accelerated
Motion)
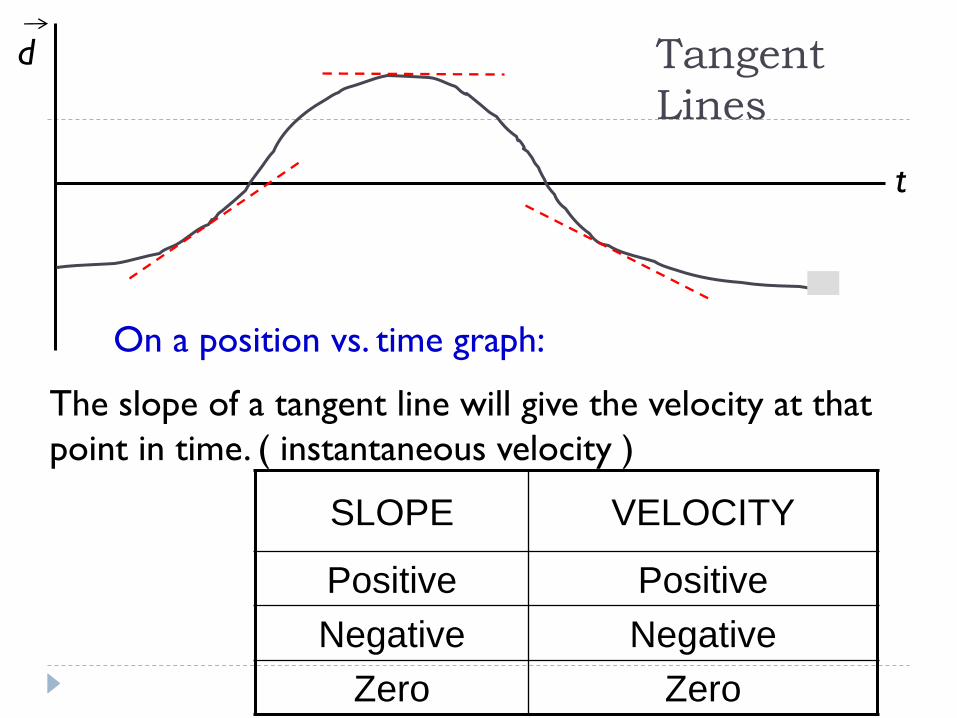
Tangent
Lines
t
SLOPE VELOCITY
Positive Positive
Negative Negative
Zero Zero
d
On a position vs. time graph:
The slope of a tangent line will give the velocity at that
point in time. ( instantaneous velocity )

Describe the motion depicted by the d-t
graph below

Explanation
Answer
The object is accelerating to
the right.
As time goes on, the tangents
acquire larger and larger
positive slopes, i.e. larger
speeds to the right.
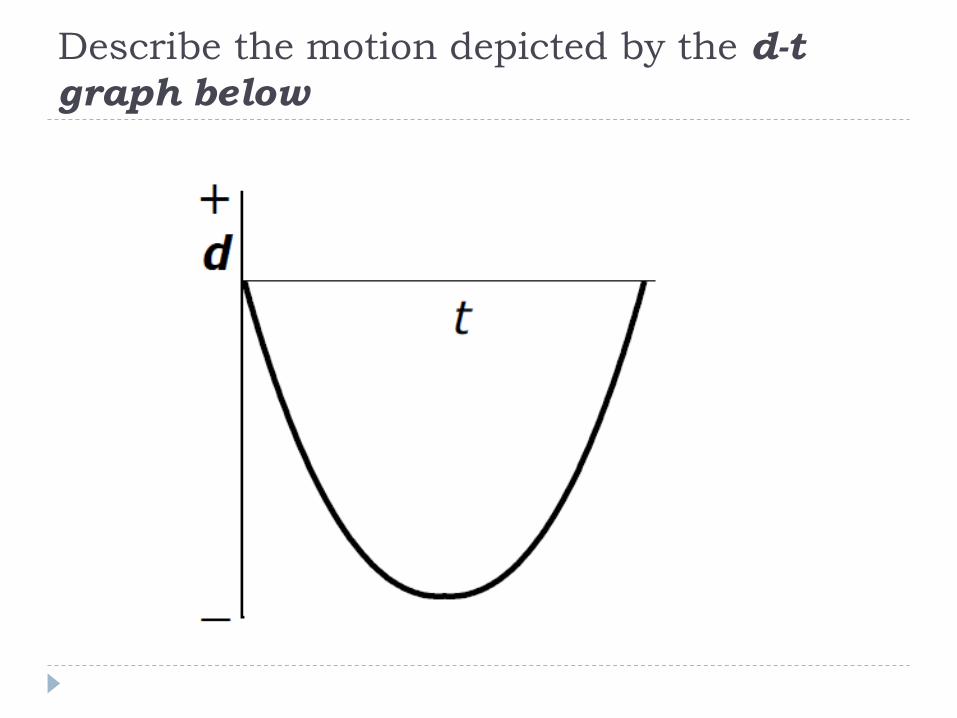
Describe the motion depicted by the d-t
graph below

Explanation
Answer The object heads left but with
ever decreasing speed. At
half-time it stops very
briefly and then speeds up
to the right.
Tangents 1, 2, and 3 have negative
slopes that are getting smaller.
This means the object is moving
to the left and slowing down. At
4 it is stopped. Then it picks up
speed to the right as indicated
by the positive slopes of 5 & 6.


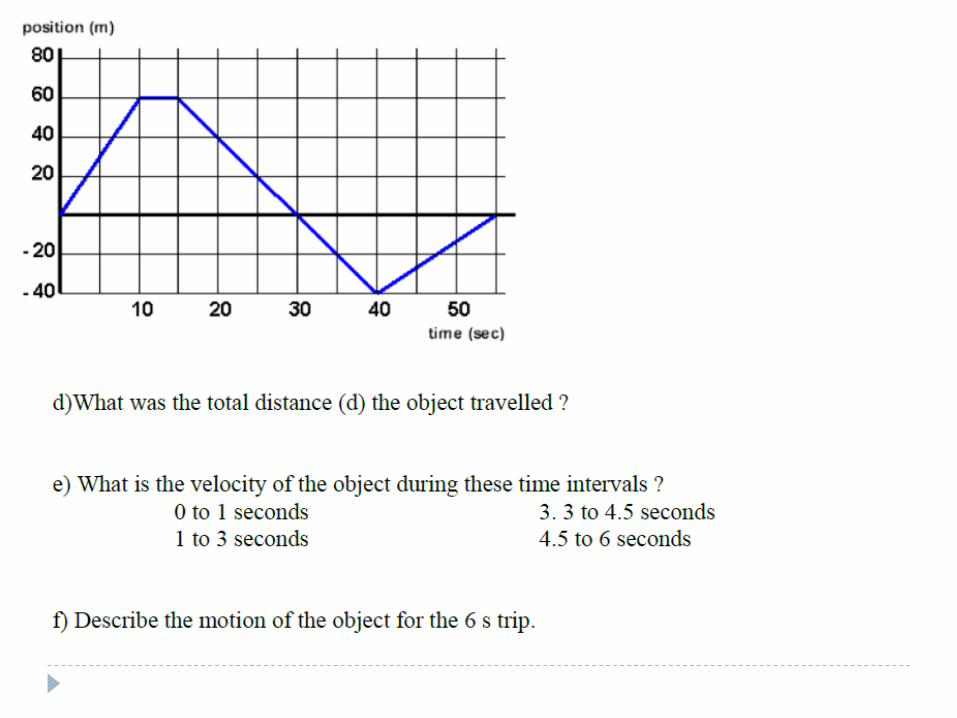
A. Describe what is happening in each leg of the trip.
B. During which parts of the trip is the object stopped?
C. During which part of the trip is the object moving the fastest?
What is its Velocity?
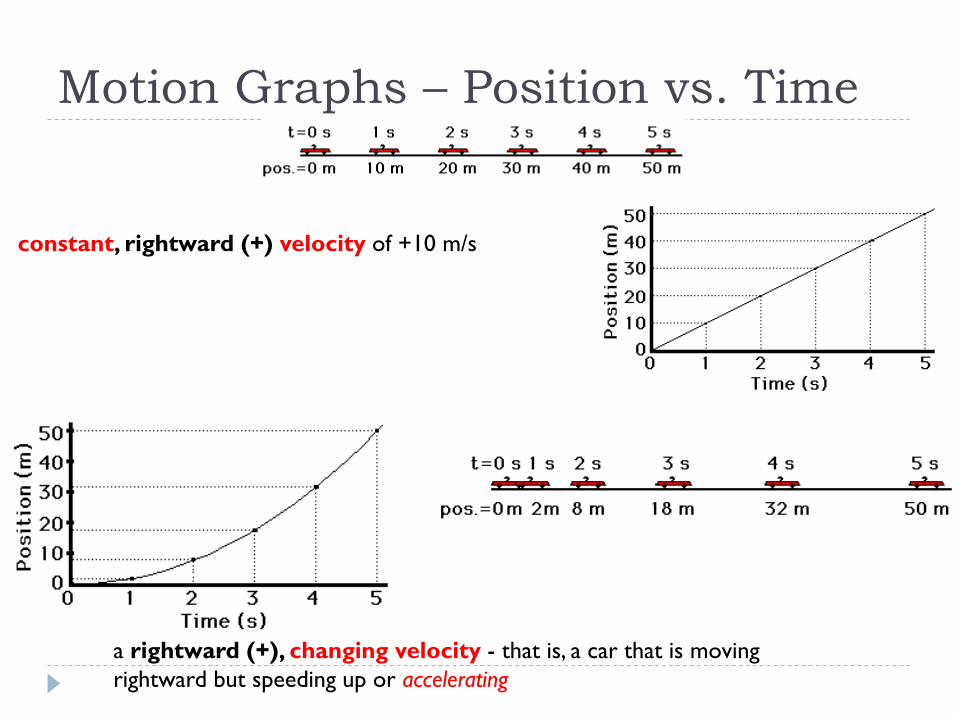
Motion Graphs – Position vs. Time
constant, rightward (+) velocity of +10 m/s
a rightward (+), changing velocity - that is, a car that is moving
rightward but speeding up or accelerating

Motion Graphs – Velocity vs. Time
constant, rightward (+) velocity of +10 m/s
a rightward (+), changing velocity - that is, a car that is moving
rightward but speeding up or accelerating


![Welcome [unisonfgpartners.com.au]unisonfgpartners.com.au/pdf/FINDEX-FMGMT.pdf4.0 1.0 1.0 1.0 1.0 1.0 1.0 50.0 43.5 34.5 25.5 12.5 5.5 9.0 9.0 8.0 7.0 5.0 2.0 5.0 5.0 5.0 5.0 5.0 14.0](https://img.pdfslide.us/doc/110x75/5f9881d4934d305cce543099/welcome-40-10-10-10-10-10-10-500-435-345-255-125-55-90-90-80.jpg)