Embed Size (px)
Citation preview

as of September % VARIANCE as of December % VARIANCE
GOAL 1: A GAINFULLY EMPLOYED WORKFORCE
MFO 1: Job Search Assistance Services for Wage EmploymentFor Local Employment
1.1 Workers placed for local employment through: 1,100,000 1,244,236 113.1% 38% 1,655,986 150.5% 51%
1.1.1 Public Employment Service Offices (PESOs) 900,000 971,709 108.0% 33% 1,305,578 145.1% 45%
1.1.2 Private Recruitment and Placement Agencies (PRPAs) 70,000 10,865 15.5% -59% 24,507 35.0% -65%
1.1.3 Jobs/Service Contractors/Sub-Contractors 130,000 261,662 201.3% 126% 325,901 250.7% 151%
1.2 Youth provided with bridging employment
1.2.1 Special Program for the Employment of Students (SPES) 141,178 150,121 106.3% 31% 167,569 118.7% 19%
1.2.2 Kasanayan at Hanapbuhay (KasH) Program 80,000 41,970 52.5% -23% 68,473 85.6% -14%
1.3 Jobs Fairs conducted 916 1,444
1.3.1 Hired-on-the-Spot (HOTS) 221,178 84,650 38.3% -37% 113,269 51.2% -49%
1.4 Career guidance advocacies conducted 3,789 5,461
1.4.1 Students/parents covered 602,633 813,256
1.4.2 Schools/colleges/universities covered 3,156 4,193
1.5 Capability-building assistance provided for employment service providers
1.5.1 Public Employment Service Offices (PESOs) 750 369 49.2% -26% 4,299 573.2% 473%
1.5.1.1 Participants 1,174 5,254 447.5% 373% 6,767 476%
(50% of total
PESO Managers
and staff)
1.5.21 Career
Congress
conducted
14 ROs conducted the
Regional Career
Advocacy Congress
(RCAC)
128
1.5.2.1 Participants 3,141 1,452 46.2% -29% 14,080 448.3% 348%
1.5.3 PRPAs/Jobs/Service Contractors/Sub-Contractors demand-driven 194 3,098
1.5.3.1 Participants demand-driven 6,285 7,731
1.6 Compliance with the prescribed process cycle time in the issuance of:
1.6.1 100.0% 82.0%81.00%
1.6.2 100.0% 100.0%100.00%
1.6.3 100.0% 71.0%78.00%
1.6.4 100.0%
1.6.5 100.0% 100.0%99.70%
REMARKS
576.4%
Department: Department of Labor and Employment
PROGRAM/ACTIVITY/PROJECT/
PERFORMANCE MEASURES
ACCOMPLISHMENTWHOLE YEAR
TARGET
Certificate of Registration of Job/Service Contractors/Sub-contractors (1
working day after filing of application and payment of registration fee)
Jobs Fair clearance (5 working days after receipt of documents) (Note:
different from Job Fair Permit)
Network of Career Guidance Counselors and Employment
Advocates/Coaches
PRPA License (10 working days upon filing of application and payment of
fees and bonds)
Authority to Operate Branch Office (10 working days upon filing of application
and payment of fees and bonds)
Authority to Recruit (1 working day after filing of application and payment of
fees and bonds)
PHYSICAL REPORT OF OPERATIONS
January - December 2013
ACCOMPLISHMENT

as of September % VARIANCE as of December % VARIANCEREMARKS
Department: Department of Labor and Employment
PROGRAM/ACTIVITY/PROJECT/
PERFORMANCE MEASURES
ACCOMPLISHMENTWHOLE YEAR
TARGET
PHYSICAL REPORT OF OPERATIONS
January - December 2013
ACCOMPLISHMENT
1.6.6 100.0% 92.6%87.90%
1.7 Jobseekers/employers provided with access to Labor Market Information (LMI)
1.7.1 Individuals reached 1,513,872 1,583,136 104.6% 30% 2,138,899 141.3% 41%
1.7.2 Institutions reached 16,988 14,136 83.2% 8% 22,517 132.5% 33%
1.7.3 Industry Career Guides (ICG) published 4 new ICGs on
Key Employment
Generators
(KEGs) and 4
new ICGs on
Emerging
Industries
developed and
published
1.7.4 Jobseekers kiosk maintained Out of the total 114 JSK
units, 102 units had been
repaired and deployed to
regions. The four (4) JSK
units are completely
declared irreparable. The
eight (8) units were under
repair.
314
Alien Employment Permits (AEPs) (3 working days or 24 hours after
publication if filed at Regional Office; 5 working days if filed at Field Office)
First batch of ICGs
distributed to the Senate
Education Committee and
selected PESOs. Initial
seven (7) ICGs posted and
downloadable in the ______
Second batch of ICGs for
finalization of the Angelo
King Institute (AKI) of
DLSU, with
updates/comments from
BLE and BLES surveys.Out of the total 114 JSKs,
100 units had been
repaired, including the units'
software replacement,
refurbished and deployed to
LGUs. In addition to the four
(4) units that are
irreparable, Region 8, which
was hardest hit by super
typhoon "Yolanda", initially
reported that four (4) out of
seven (7) were damaged
and irreparable, while the
other three (3) had not been
reported yet as to the extent
of the damage, as of this
date.
Final drafts of the second
batch of ICGs on KEGs
were received from DLSU-
AKI on 16 December 2013.
Drafts are for lay-outing
and printing.

as of September % VARIANCE as of December % VARIANCEREMARKS
Department: Department of Labor and Employment
PROGRAM/ACTIVITY/PROJECT/
PERFORMANCE MEASURES
ACCOMPLISHMENTWHOLE YEAR
TARGET
PHYSICAL REPORT OF OPERATIONS
January - December 2013
ACCOMPLISHMENT
1.8 Development/Maintenance of Labor Market Information Portal
1.8.1 Phil-Jobnet System re-ingineered SRS application
module includedEnhanced PhilJobnet
recorded the following:
Establishments: registered
9,672; Accredited 6,358;
Vacancies 127,174; and
Jobseekers: Registered
190,511
Enhanced PJN recorded
the ff:Establishments:
Registered - 14,275
Accredited -7,872
Vacancies - 1,514,264
Reistered Jobseekers -
216,876
1.8.2 Skills Registry System (SRS) 160 LGUs Since November 2009 to
September 2013, the NSRS
Project 1st, 2nd and 3rd
Waves of Implementation
covered 484,045 skills
registrants. BLE's next step
for the project is the
integration of the SRS Data
Base System to the
Enhanced Phil-Jobnet
System. This is seen as a
vital move to attain its
"liveness". Based from the
identified criteria set, the
target for the 4th Wave of
Implementation are : 386
LGUs and 10,281
barangays. Total number of
registrants per Wave (as of
15 November 2013): Pilot +
1st Wave - 202,304; 2nd
Wave - 166,837; 3rd Wave -
101,900; TOTAL - 484,045
Since November 2009 to
December 2013, the NSRS
Project 1st, 2nd and 3rd
Waves of Implementation
covered 507,945 skillsl
registrants. BLE's next
step for the project is the
integration of the SRS
Data Base System to the
Enhanced Phil-Jobnet
System, this is seen as a
vital move to attain its
"liveness".
Region gathered the
highest number of
registrants with 30,762,
closely followed by NCR
with 26,769 and CAR
with 13,883
Based from the
identified criteria set,
the target for the 4th
Wave of Implementation
are: 386 LGUs and
10,281 barangays

as of September % VARIANCE as of December % VARIANCEREMARKS
Department: Department of Labor and Employment
PROGRAM/ACTIVITY/PROJECT/
PERFORMANCE MEASURES
ACCOMPLISHMENTWHOLE YEAR
TARGET
PHYSICAL REPORT OF OPERATIONS
January - December 2013
ACCOMPLISHMENT
Total Number of
Registrants per Wave (as
of 15 November 2013)
-Pilot+1st Wave 202,304
- 2nd Wave 166,837
- 3rd Wave 101,900
- 4th Wave 23,900
TOTAL : 507,945 NCR
gathered the highest
number of registrants with
159,166, followed by
Region III with 81,026 and
Region X with 37,9171.8.3 DOLE Manpower Datawarehouse System fully
implemented and
developed
Data migration from
attached agencies still on-
going. Capacity building
for enhanced PhilJobnet
where initial orientation
on the functionalities of
the Data Warehouse is
subsumed in the training.
The following date were
uploaded to Data
Warehouse Server:
PRC - 3,588,545
professionals
NMP - 4,060 trainees
TESDA - 1,926,666
certified workers
POEA-602,227
deployment1.8.4 PESO Performance Monitoring System Development of PPMS on-
going
Initial system developed,
unresponsive, dropped
For Overseas Employment
1.9
1.9.1 Employment contracts processed 1,850,463 1,611,835 87.1% 12% 2,086,093 112.7% 13%
1.9.1.1 Landbased 1,384,094 1,254,583 90.6% 16% 1,618,208 116.9% 17%
1.8.1.2 Seabased 466,369 357,252 76.6% 2% 467,885 100.3% 0%
1.8.2 Workers deployed 1,664,118 1,098,876 66.0% -9% 1,703,911 102.4% 2%
1.8.2.1 Landbased 1,318,727 950,388 72.1% -3% 1,461,943 110.9% 11%
1.8.2.2 Seabased 345,391 148,488 43.0% -32% 241,968 70.1% -30%
1.10 Workers placed through Government Hiring Facility 5,741 6,947 121.0% 46% 8,022 139.7% 40%
1.11 Manpower Registry and Profiling (Worker-applicants registered) 203,932 121,306 59.5% -16% 234,499 115.0% 15%
2.1 Workers provided with various livelihood assistance/services 87,000 53,859 61.9% -13% 53,859 61.9% -38%
2.1.1 Informal sector workers 29,070 29,070
2.1.2 Disadvantaged workers 18,277 18,277
2.1.3 Wage workers 6,512 6,512
2.2 Community-Based Employment Program (CBEP) 2,280,078 761,871 33.4% -42% 2,098,815 92.1% -8%
2.2.1 Jobs generated through infrastructure projects 1,268,700 416,148 32.8% -42% 1,344,670 106.0% 6%
Documents reviewed/evaluated/processed for overseas employment to ensure
compliance with labor standards/laws
MFO 2: Capacity-Building Services for Livelihood

as of September % VARIANCE as of December % VARIANCEREMARKS
Department: Department of Labor and Employment
PROGRAM/ACTIVITY/PROJECT/
PERFORMANCE MEASURES
ACCOMPLISHMENTWHOLE YEAR
TARGET
PHYSICAL REPORT OF OPERATIONS
January - December 2013
ACCOMPLISHMENT
2.2.2 Jobs generated through non-infrastructure projects 1,011,378 345,723 34.2% -41% 754,145 74.6% -25%
MFO 3: Social Partnership Promotion and Dispute Resolution Services3.1 Dispute Resolution Program
Adjudication (Speedy and Efficient Delivery of Labor Justice) Disposed Disposed Disposed Disposed
within the beyond the within the beyond the
prescribed prescribed prescribed prescribed period period period period
3.1.1.1 Disposition Rate (SpeED 6) 57.0% 8.0% 65% -10% 80.0% 15.0% 95% -5%
- NCMB 40.0% 12.0% 52% -23% 60% 23% 83% -17%
- BLR 23.0% 48.0% 71% -4% 31% 54% 85% -15%
- NLRC 63.0% 6.0% 69% -6% 91.0% 8.0% 99% -1%
- LS 3.0% 72.0% 75% 0% 4.0% 82.0% 86% -14%
- BWC 0.0% 17.0% 17% -58% 71.0% 27.0% 98% -2%
- ECC 63.0 % 23.0% 86% 11% 79.0 % 21.0% 100% 0%
- POEA 10.0% 15.0% 25% -50% 21.0% 26.0% 47% -53%
3.2.1 Conciliation (Single Entry Approach)
3.2.1.1 Settlement Rate
3.2.1.1.1 NCMB, POEA, NWPC and ROs 70.0% 81.10% 111.10% 36% 81.1% 111.10% 11%
3.2.1.1.2 NLRC 70.0% 40.40% 29.60% -45% 40.40% 29.60% -70%
3.2 Enhanced Labor Education Program
3.2.1200,000 276,899 138.45% 63% 331,839
165.9% 66%
3.2.1.1 Advocacies, seminars and orientations conducted demand-driven 4,180 5,253
3.3 Registration of Workers' Organizations/Associations
3.3.1 Newly registered workers' organization 4,540 5,959
3.3.1.1 Union 162 199
3.3.1.1.1 Membership demand-driven 1,472 16,607
3.3.1.1.2 Process cycle time one (1) day one (1) day one (1) day
3.3.1.2 Workers' associations operating in the region 4,378 5,760
3.3.1.2.1 Membership demand-driven 175,018 234,629
3.3.1.2.2 Process cycle time one (1) day one (1) day one (1) day
3.4 Registration of Collective Bargaining Agreements (CBAs)
3.4.1 CBAs registered 390 427
3.4.1.1 Workers covered demand-driven 66,347 75,345
3.4.1.2 Process cycle time one (1) day
3.5 Worker's Organization and Development Program (WODP)
3.5.1 Training grants 15 20
3.5.2 Scholarship granted (Regular and Isabelo Delos Reyes Scholarships) 95 160
3.6 Labor Management Cooperation (LMC)
3.6.1 LMCs facilitated 251 156 62.15% -13% 285 113.5% 14%
3.6.2 LMCs strengthened/enhanced 1,065 622 58.40% -17% 1,089 102.3% 2%
Workers, employers, and students reached by enhanced labor and
employment education assistance/services
100% annual
case disposition
for compulsory
arbitration cases
within the
prescribed period
3.1.1
as of September % VARIANCE as of December % VARIANCEREMARKS
Department: Department of Labor and Employment
PROGRAM/ACTIVITY/PROJECT/
PERFORMANCE MEASURES
ACCOMPLISHMENTWHOLE YEAR
TARGET
PHYSICAL REPORT OF OPERATIONS
January - December 2013
ACCOMPLISHMENT
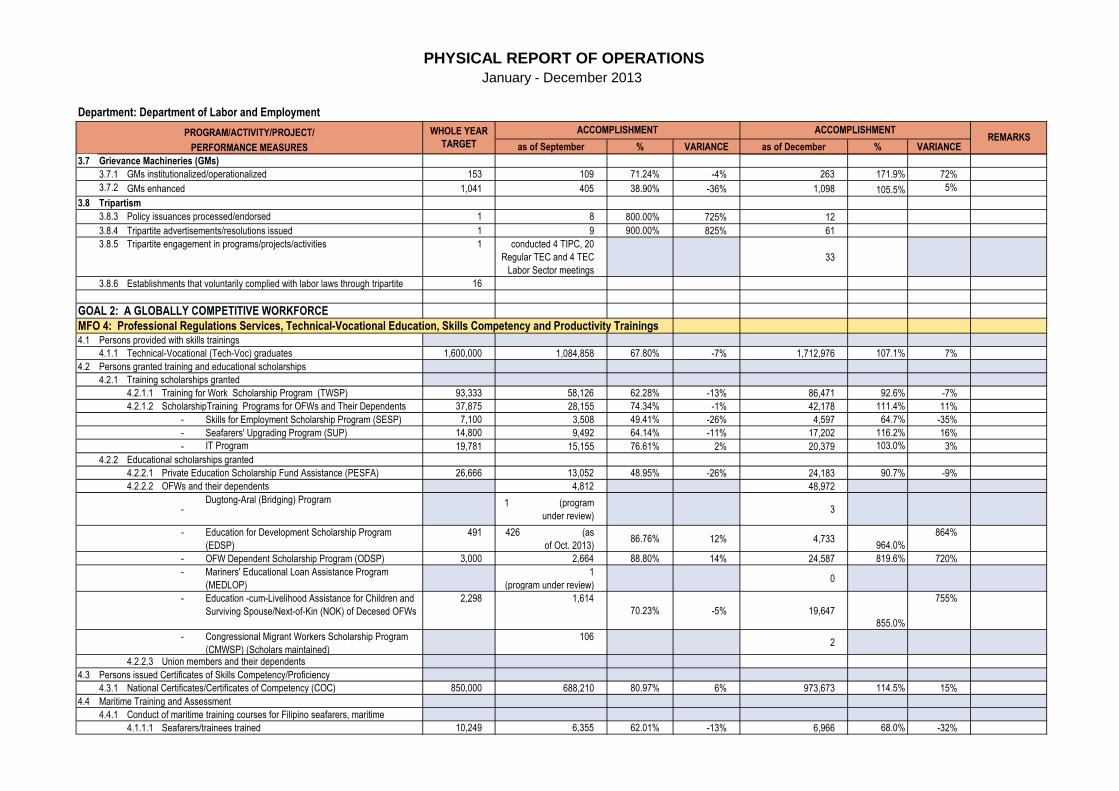
3.7 Grievance Machineries (GMs)
3.7.1 GMs institutionalized/operationalized 153 109 71.24% -4% 263 171.9% 72%
3.7.2 GMs enhanced 1,041 405 38.90% -36% 1,098 105.5% 5%
3.8 Tripartism
3.8.3 Policy issuances processed/endorsed 1 8 800.00% 725% 12
3.8.4 Tripartite advertisements/resolutions issued 1 9 900.00% 825% 61
3.8.5 Tripartite engagement in programs/projects/activities 1 conducted 4 TIPC, 20
Regular TEC and 4 TEC
Labor Sector meetings
33
3.8.6 16
GOAL 2: A GLOBALLY COMPETITIVE WORKFORCE
MFO 4: Professional Regulations Services, Technical-Vocational Education, Skills Competency and Productivity Trainings4.1 Persons provided with skills trainings
4.1.1 Technical-Vocational (Tech-Voc) graduates 1,600,000 1,084,858 67.80% -7% 1,712,976 107.1% 7%
4.2 Persons granted training and educational scholarships
4.2.1 Training scholarships granted
4.2.1.1 Training for Work Scholarship Program (TWSP) 93,333 58,126 62.28% -13% 86,471 92.6% -7%
4.2.1.2 ScholarshipTraining Programs for OFWs and Their Dependents 37,875 28,155 74.34% -1% 42,178 111.4% 11%
- Skills for Employment Scholarship Program (SESP) 7,100 3,508 49.41% -26% 4,597 64.7% -35%
- Seafarers' Upgrading Program (SUP) 14,800 9,492 64.14% -11% 17,202 116.2% 16%
- IT Program 19,781 15,155 76.61% 2% 20,379 103.0% 3%
4.2.2 Educational scholarships granted
4.2.2.1 Private Education Scholarship Fund Assistance (PESFA) 26,666 13,052 48.95% -26% 24,183 90.7% -9%
4.2.2.2 OFWs and their dependents 4,812 48,972
-Dugtong-Aral (Bridging) Program 1 (program
under review) 3
- 491 426 (as
of Oct. 2013)86.76% 12% 4,733
964.0%
864%
- OFW Dependent Scholarship Program (ODSP) 3,000 2,664 88.80% 14% 24,587 819.6% 720%
- 1
(program under review) 0
- 2,298 1,614
70.23% -5% 19,647
855.0%
755%
- 1062
4.2.2.3 Union members and their dependents
4.3 Persons issued Certificates of Skills Competency/Proficiency
4.3.1 National Certificates/Certificates of Competency (COC) 850,000 688,210 80.97% 6% 973,673 114.5% 15%
4.4 Maritime Training and Assessment
4.4.1
4.1.1.1 Seafarers/trainees trained 10,249 6,355 62.01% -13% 6,966 68.0% -32%
Education for Development Scholarship Program
(EDSP)
Mariners' Educational Loan Assistance Program
(MEDLOP)
Education -cum-Livelihood Assistance for Children and
Surviving Spouse/Next-of-Kin (NOK) of Decesed OFWs
Conduct of maritime training courses for Filipino seafarers, maritime
Congressional Migrant Workers Scholarship Program
(CMWSP) (Scholars maintained)
Establishments that voluntarily complied with labor laws through tripartite

as of September % VARIANCE as of December % VARIANCEREMARKS
Department: Department of Labor and Employment
PROGRAM/ACTIVITY/PROJECT/
PERFORMANCE MEASURES
ACCOMPLISHMENTWHOLE YEAR
TARGET
PHYSICAL REPORT OF OPERATIONS
January - December 2013
ACCOMPLISHMENT
4.1.1.2 Training certificates issued 22,547 14,458 64.12% -11% 15,742 69.8% -30%
4.1.2 Conduct of Competency Assessment
4.1.2.1
Officers (PRC)
100% of qualified
applicants
assessed and
endorsed
52 56
4.1.3 Conduct of Proficiency Assessment
4.1.3.1 Ratings (TESDA) 100% of qualified
applicants
assessed and
endorsed
302
302
4.5 Examination and Regulation of Professionals
4.5.1 Licensure Examinations 363 403 111.02% 36% 473 130.3% 30%
4.5.2 Applications processes/issued 530,570 371,897 70.09% -5% 461,986 87.1% -13%
4.5.3 Professional examinees tested 491,222 369,673 75.26% 0% 429,483 87.4% -13%
4.5.4 Licensure exams, results, computed, tabulated and released 525,205 267,061 50.85% -24% 441,757 84.1% -16%
4.5.5 Passers 110,651 177,906
4.5.6 New Registrants 206,219 131,417 63.73% -11% 182,419 88.5% -12%
4.5.7 Renewals 384,185 373,507 97.22% 22% 448,330 116.7% 17%
4.5.8 648,961 644,28899.28% 24% 783,003
120.7%
21%
4.5.9 Institutions evaluated on quality standards in the practice of profession 600 908 151.33% 76% 0.0% -100%
4.6 Firms provided with productivity services through:
4.6.1 Productivity orientations/trainings conducted
4.6.1.1 Number of firms benefited 9,600 6,327 65.91% -9% 13,496 140.6% 41%
4.6.1.2 Participants 15,506 29,002 -100%
4.6.2 Productivity Improvement Programs (PIP) installed and documented 1,500 322 21.47% -54% 2,108 140.5% 41%
4.7 Review of minimum wage levels
4.7.1 Public hearings/consultations conducted 48 18 37.50% -38% 67 139.6% 40%
4.7.2 WOs/IRRs/Advisories issued 16
(1/RB) as
necessary
4 25.00% -50% 6 37.5% -63%
4.8
4.8.1 Learning Sessions conducted 14 12 85.71% 11% 17 121.4% 21%
4.8.1.1 Workers/employers benefited 400 687 171.75% 97% 1,897 474.3% 374%
4.8.1.2 Companies benefited 180 424 235.56% 161% 606 336.7% 237%
4.8.2 255,500 194,372 76.08% 1% 239,507 93.7% -6%
MFO 5: Services to Safeguard Fair and Just Terms and Conditions of Employment
5.1 Establishments covered by labor standards (LS) compliance assistance 36,270 28,210 77.78% 3% 39,270 108.3% 8%
5.1.1 Self-Assessment 1,451 895 61.68% -13% 1,288 88.8% -11%
5.1.2 Inspection 26,748 20,692 77.36% 2% 29248 109.3% 9%
Professional Identification Cards (PIC) and Certificates of Registration (COR)
processed/issued
GOAL 3: A SECURE WORKFORCE
Awareness raising campaign on productivity, wages and employment-related
For Workers in Local Employment
Workers/employers reached by Operasyon PAWIS and Productivity

as of September % VARIANCE as of December % VARIANCEREMARKS
Department: Department of Labor and Employment
PROGRAM/ACTIVITY/PROJECT/
PERFORMANCE MEASURES
ACCOMPLISHMENTWHOLE YEAR
TARGET
PHYSICAL REPORT OF OPERATIONS
January - December 2013
ACCOMPLISHMENT
5.1.3 Training and Advisory Visits (TAVs) 8,071 6,623 82.06% 7% 8,884 110.1% 10%
5.2 Workers covered by labor standards (LS) compliance assistance 991,593 1,231,933
5.2.1 Self-assessment 279,530 343,368
5.2.2 Inspection 672,831 835,812
5.2.3 Training and Advisory Visits (TAVs) 39,232 52,753
5.3 Compliance Rate
5.3.1 Self-Assessment 90.0% 84.9% -5.1% -80% 95.5% 5.50% -95%
5.3.2 Inspection 65.0% 53.3% -11.8% -87% 66.5% 1.50% -99%
5.3.3 Training and Advisory Visits (TAVs) 70.0% 68.6% -1.4% -76% 76.9% 6.90% -93%
5.4 Kapatiran-WISE TAV
5.4.1 Establishments covered by Kapatiran-WISE TAV
5.4.1.1 Big Brothers 35 35
5.4.1.2 Small Brothers 204 204
5.4.2 Workers covered
5.4.2.1 Big Brothers 15,355 15,355
5.4.2.2 Small Brothers 13,899 13,899
5.4.3 31 31
5.4.3.1 2,364 2,364
For Workers in Overseas Employment
5.5 Licensing Program5.5.1 New licenses issued 50 26 52.00% -23% 40 80.0% -20%
5.5.2 Renewed licenses 144 109 75.69% 1% 135 93.8% -6%
5.6 Foreign principals accredited/registered 30,805 14,894 48.35% -27% 21,275 69.1% -31%
5.7 Positions / Manpower requirements approved 606,976 685,342 112.91% 38% 908,147 149.6% 50%
5.8 Manpower profiled 203,932 121,306 59.48% -16%
5.9 Employment verification 568,213
5.9.1 Individual employment contracts verified 297,173 433,566
5.9.2 Job Orders (Jos) verified (new & additonal) 32,293 45,579
5.9.2.1 Manpower required 579,202 792,680
5.9.3 New Foreign-based Principals 5,530 7,572
5.9.4 Other documents verified 68,471 89,068
MFO 6: Social Protection and Welfare ServicesFor Workers in Local Employment
6.1 20,000
6.2
6.2.1 Establishment covered 165 1,850 1121.21% 1046% 1,850 1121.2% 1021%
6.2.1.1 DOLE-initiated 1,496 1,496
6.2.1.2 Company-initiated 354 354
6.2.2 Workers covered 42,000 227,944 542.72% 468% 317,944 757.0% 657%
6.2.2.1 DOLE-initiated 121,850 121,850
Workers in the Informal Sector facilitated enrollment to government's various social
security schemes
Workers provided with Family Welfare Program (FWP)-related services/activities
demand-driven
Small Brothers which become compliant with LS
Workers benefited

as of September % VARIANCE as of December % VARIANCEREMARKS
Department: Department of Labor and Employment
PROGRAM/ACTIVITY/PROJECT/
PERFORMANCE MEASURES
ACCOMPLISHMENTWHOLE YEAR
TARGET
PHYSICAL REPORT OF OPERATIONS
January - December 2013
ACCOMPLISHMENT
6.2.2.2 Company-initiated 106,094 196,094
6.3 Children prevented from engaging in child labor through:
6.3.1 286 286
6.3.2 Educational assistance 1,910 1,910
6.4 Children removed from child labor through:
6.4.1 Sagip Batang Manggagawa (SBM) 12 12
6.4.3 Livelihood assistance to parents of child laborers 193 403
6.4.4 Educational assistance to child labor victims 1,298 1,329
6.5 Advocacy activities related to Child Labor Prevention and Elimination
6.5.1 Barangay Council for the Protection of Children created 42 50
6.5.2 MOA/MOU and other forms of commitment or support forged 113 122
6.6 100% of affected
workers racked
provided
assistance
14,777 beneficiaries thru
DOLE AMP (Amount
granted: PhP17.8-M
40,910 beneficiaries
(Amount granted:
PhP107,815,050)
For Workers in Overseas Employment
6.7 Anti-Illegal Recruitment (AIR) Program
6.7.1 Victims assisted
6.7.1.1 Illegal Recruitment (IR) 254 280 110.24% 35% 98 38.6% -61%
6.7.1.2 Recruitment Violation (RV) 6,186 5,265 85.11% 10% 2,070 33.5% -67%
6.7.2 AIR Seminars conducted 41 59 143.90% 69% 20 48.8% -51%
6.7.2.1 Participants 2,000 4,226 211.30% 136% 1,000 50.0% -50%
6.8 59 69
6.8.1 Participants 4,226 5,664
6.9 59
6.9.1 4,226
6.10 Pre-Employment Orientation Seminars (PEOS) conducted 1,150 952 82.78% 8% 800 69.6% -30%
6.10.1 Participants oriented 120,000 149,365 124.47% 49% 100,000 83.3% -17%
6.11 Pre-Departure Orientation Seminar (PDOS) conducted 94,303
6.11.1 Participants oriented 600,000 354,468 59.08% -16% 523,217 87.2% -13%
6.12 OFWs assisted thru Social Services and Family Welfare Assistance
6.12.1 12,074 24,147 199.99% 125% 40,213 333.1% 233%
6.12.2 Workers assistance
6.12.2.1 Onsite 223,530 225,356 100.82% 26% 63,817 28.5% -71%
6.12.2.2 Welfare Assistance
- Regional Welfare Case management 10,268 18,274
- OWWA 24/7 Operations Center 38,504 48,217
6.12.3 OFWs facilitated membership to OWWA 1,410,409
6.12.3.1 Local Members 921,917 1,182,135
- Total amount collected (Php) Php998,523,367.29 Php1,282,782,241.00
6.12.3.2 On-site Members 177,779 228,274
Livelihood assistance to parents of children-at-risk of becoming child laborers
Workers affected by economic crisis and natural/man-made disaster (emergency
employment) (DOLE AMP)
Clients reached
Anti-Illegal Recruitment and Trafficking in Person (AIR-TIP) campaign activities
conducted
Repatriation Program (provision of tickets, airport assistance, halfway home
accommodation, medical assistance/referral, domestic transport/fare and
psycho-social counselling
AIR-TIP information, education and communication (IEC) materials disseminated
100% of reported
CL cases acted
upon

as of September % VARIANCE as of December % VARIANCEREMARKS
Department: Department of Labor and Employment
PROGRAM/ACTIVITY/PROJECT/
PERFORMANCE MEASURES
ACCOMPLISHMENTWHOLE YEAR
TARGET
PHYSICAL REPORT OF OPERATIONS
January - December 2013
ACCOMPLISHMENT
- Total amount collected (Php) Php184,377,952.01 Php239,419,946.00
6.12.4 Disability and Death Benefits
6.12.4.1 Claims paid 1,926 1,537 79.80% 5% 1,937 100.6% 1%
6.12.4.2 Total amount released (PhP) Php371,400,000.00 Php260,416,167.00
6.13 OFWs provided with reintegration services and assistance
6.13.1 Pagpapayo (counselling, advocacy and capability-building) 3,216
6.13.2 4,680
6.13.2.1 Livelihood Assistance Program
- Number of Beneficiaries 3,340
- Total amount granted
6.13.2.2 Balik Pinay/Balik Hanapbuhay Project
- Number of Beneficiaries 683
6.13.2.3 PhP2 Billion Reintegration Program
- Number of loans approved 202
- Number of beneficiaries 202 746
- Total amount granted (Php) PhP187,256,000.00 PhP504,993,000.00
- Number of jobs generated 1,377 3,709
6.13.3 Paghahanapbuhay (Wage employment assistance)
6.13.3.1 Number of OFWs assisted 122
6.14
6.14.1
6.14.1.1 Reintegration Preparedness Program
- Trainings/seminars conducted 2,667 2,627 98.50% 24% 3,277 122.9% 23%
- OFWs benefited 42,981 53,751 125.06% 50% 74,134 172.5% 72%
6.14.1.2 Community Outreach Program
- Number of community activities/events conducted 1832 1,804 98.47% 23% 4,308 235.2% 135%
- OFWs participated 204,719 216,090 105.55% 31% 291,296 142.3% 42%
6.14.1.3
- 2,445 527 21.55% -53% 619 25.3% -75%
- OFWs benefited 21,364 16,794 78.61% 4% 23,270 108.9% 9%
- IEC dissemination activities undertaken 11,334 8,033 70.88% -4% 8,339 73.6% -26%
- OFWs covered/reached 322,305 616,945 191.42% 116% 899,492 279.1% 179%
6.14.2 OFWs provided and assisted with social protection and welfare services
6.14.2.1 Overseas Employment Certificate (OEC) Issuance
- OEC issued 408,323 341,311 83.59% 9% 531,460 130.2% 30%
6.14.2.2 Case Management
- Number of cases settled 47,234 41,899 88.71% 14% 57,353 121.4% 21%
- OFWs benefited 64,652 32,993 51.03% -24% 45,070 69.7% -30%
6.14.2.3 Welfare Assistance Program
- 360,000 372,696 103.53% 29% 589,414 163.7% 64%
6.14.2.4 Repatriation Assistance Program
Workers Information, Education and Communication Program
OFWs provided and assisted with capacity-building programs
Pagnenegosyo (livelihood, economic & social enterprise development
OFWs on-site provided with capacity building, social protection and welfare services
Post-Arrival Orientation Seminar (PAOS) facilitated /
OFWs provided with welfare assistance (hospital,
jail/detention center and work campsite visitation;
psycho-social counseling; and other assistance to
distressed workers)

as of September % VARIANCE as of December % VARIANCEREMARKS
Department: Department of Labor and Employment
PROGRAM/ACTIVITY/PROJECT/
PERFORMANCE MEASURES
ACCOMPLISHMENTWHOLE YEAR
TARGET
PHYSICAL REPORT OF OPERATIONS
January - December 2013
ACCOMPLISHMENT
100% of request served 8,683 11,470
6.14.2.5 Custodial Program (Filipino Workers Resource Centers)
- Total wards accommodated 18,074 22,690
- 8,695 11,022
6.14.2.6 Occupational Safety and Health (OSH) Program
- 93 100
- OFWs benefited 3,218 4,020
6.14.2.7
- 215 321
- 97 117
GOAL 4 : A SAFE AND HEALTHY WORKFORCE
MFO 7 : Work Accidents/Illnesses Prevention and Work Rehabilitation Services7.1 Construction Safety and Health Program (CSHP)
7.1.1 CSHP processed demand-driven 7,870 7,870
7.1.1.1 CSHP approved 6,653 6,653
7.1.2 Construction sites inspected based on approved CSHP 100%
construction sites
inspected
311 311
7.1.2.1 Contractors/Sub-contractors covered 231 231
7.1.3 Construction sites with trained safety officers 606 606
7.1.4 Construction sites with accredited OSH Practitioners 85 85
7.2 OSH Accreditation Program
7.2.1 Applications processed demand-driven 414 414
7.2.1.1 Applications approved 320 320
7.2.1.2 Certificate of accreditation issued 161 161
- New 108 108
- Renewal 53 53
7.3 Work Accidents/Injuries Reporting
7.3.1 Work-ALERT cases reported 8
Work-ALERT cases investigated demand-driven 73 73
7.3.1.1 Construction 42 42
- Injuries 37 37
- Fatalities 37 37
7.3.1.2 Manufacturing 10 10
- Injuries 6 6
- Fatalities 7 7
7.3.1.3 Shipbuilding 5 5
- Injuries 0 0
- Fatalities 5 5
7.3.1.4 Others not specified 16 16
- Injuries 9 9
- Fatalities 19 19
7.3.2 Stoppage/Cease and Desist Order issued 14 14
Number of policy advocacy/labor cooperation/ relations
Number of dialogues and consultations undertaken with
Number of awareness activities on OSH
Policy advocacy and labor cooperation/Relations Program
- OFWs repatriated (documented, undocumented
workers; minors/infants repatriated, human remains
Wards released (returned to agency, endorsed to new

as of September % VARIANCE as of December % VARIANCEREMARKS
Department: Department of Labor and Employment
PROGRAM/ACTIVITY/PROJECT/
PERFORMANCE MEASURES
ACCOMPLISHMENTWHOLE YEAR
TARGET
PHYSICAL REPORT OF OPERATIONS
January - December 2013
ACCOMPLISHMENT
7.4 15,000 9,991 66.61% -8% 15,337 102.2% 2%
7.4.1 Companies/establishments covered 110 4,290 3900.00% 3825% 5,520 5018.2% 4918%
7.5 100% of requests
served40,316 81,377
7.5.1 Companies/establishments covered 160 247
7.5.2 Personal Protective Equipment (PPE) Testing
7.5.2.1 Tests completed 1,146 2,453
7.5.2.2 Specimen Tested 625 1,163
7.6 OSH researches completed 4 2 50.00% -25% 3 75.0% -25%
7.7
7.7.1 Training organizations accredited 13 17
7.7.2 Consultants accredited 25 38
7.8 Occupationally Displaced Workers (ODWs) provided assistance
7.8.1 125 71 56.80% -18% 86 68.8% -31%
7.8.2 100 66 66.00% -9% 87 87.0% -13%
7.8.3 271 225 83.03% 8% 328 121.0% 21%
7.9 Employment compensation advocacy seminars on Work Contingency Program 250 233 93.20% 18% 266 106.4% 6%
7.9.1 6,500 6,113 94.05% 19% -100%
7.9.2 13,000 11,154 85.80% 11% 12,764 98.2% -2%
Prepared by: Approved by:
CYNTHIA R. CRUZ
PMED, PS PS Director (Concurrent)
Companies/establishments covered
Workers reached
Workers/employers reached by basic, advanced and specialized OSH courses,
orientations, seminars and trainings
Workers benefited through OSH evaluation, work environment measurement,
occupational health services and testing of safety devices
OSH Accreditation of Safety Training Organizations (STOs) and Safety Consultants
ODWs provided ECC-funded rehabilitation services (physical/ occupational
ODWs provided with Quick Response Program assistance (psychosocial
ODWs provided with Katulong at Gabay sa Manggagawang May
Kapansanan (KAGABAY) Program State Insurance Fund (SIF)-funded
vocational and entrepreneurial trainings
100% of requests
served
ANALEE B. DELOS SANTOS


![System Mechanical Drawings - Horiba · 2019. 10. 7. · System Mechanical Drawings.44 [11.1] 2X 2.19 [55.6].44 [11.1] 2X 2.06 [52.4] 1.81 [46.1] 5.56 [141.3] 3.47 [88.2] 1.96 [49.8]](https://img.pdfslide.us/doc/110x75/60fe09ae4a7cf26571276ecd/system-mechanical-drawings-horiba-2019-10-7-system-mechanical-drawings44.jpg)