Embed Size (px)
Citation preview

PHYSICAL PROPERTIES OF POLYSACCHARIDES AND
THEIR INTERACTIONS WITH PROTEIN
AT MULTI-LENGTH SCALES
By
JOOYOUNG LEE
A Dissertation submitted to the
Graduate School-New Brunswick
Rutgers, The State University of New Jersey
in partial fulfillment of the requirements
for the degree of
Doctor of Philosophy
Graduate Program in Department of Food Science
written under the direction of
Professor Qingrong Huang
and approved by
New Brunswick, New Jersey
January 2008
ii
ABSTRACT OF THE DISSERTATION
Physical Properties of Polysaccharides and
Their Interactions with Protein at Multi-Length Scales
by JOOYOUNG LEE
Dissertation Director: Professor Qingrong Huang
Polysaccharides and proteins are two key components in both natural and processed
foods. The interactions between polysaccharides and proteins determine the final
structure, texture, and stability of the food materials. Coacervates, formed through
attractive and nonspecific interactions such as electrostatic, van der Waals, and
hydrophobic interactions between proteins and polysaccharides, have already served as
important materials in food delivery applications because they create a barrier between
food ingredients and food matrices. The overall goal of this dissertation is to generate a
clear description of the dynamics and intermolecular interactions of biopolymeric
complex fluids at multi-length scales, ranging from macro- to nano- scale.
Atomic force microscopy (AFM) has been used to determine the nanoscale
mechanical properties of a series of negatively-charged polysaccharides, such as κ-
carrageenan and Na-alginate through the measurement of the pull-off forces between the
AFM tip and the immobilized polysaccharide films. The nanoscale mechanical properties
obtained have been compared with the bulk rheological properties measured by
rheometer.
iii
The interactions of bovine serum albumin (BSA) with negatively-charged surfaces,
such as mica and κ-carrageenan, in saline solutions of different pH values have been
studied using chemical force microscopy (CFM). For BSA interactions with mica surface
with the increase of pH, the statistical analysis of the CFM results shows that the
averaged pull-off force for the elongation monotonously decreases. Such decrease results
from the decrease of the strength of hydrogen bonding and the number of interaction
pairs, as well as the slight increase of the strength of van der Waals interaction,
suggesting that the force-extension curve is mainly contributed by the van der Waals
interaction. Similar results are also found in BSA interactions with κ-carrageenan. CFM
results indicate at least two pull-off events occur in the force-extension curves of BSA/κ-
carrageenan mixtures. The lower force one is interpreted as due to non-specific binding,
while the higher-force one is due to the specific binding between BSA-modified tip and
κ-carrageenan. The larger specific binding at low pH suggests the existence of stronger
electrostatic interaction at low pH, consistent with our titration and rheology results.
The rheological properties of complex coacervates formed by BSA/κ-carrageenan,
BSA/ gum arabic and BSA/pectin have shown significant correlations with sodium
chloride concentration (CNaCl) and initial protein/polysaccharide ratio (r). The higher
storage modulii (G') than loss modulii (G") for all protein/polysaccharide coacervates
suggests the formation of highly interconnected gel-like structure. The self-aggregation
properties of a protein may have significant impact on the final rheological properties of
coacervates. With the increase of salt concentration, coacervates formed by BSA and
polysaccharides (κ-carrageenan, gum arabic, and pectin) show only salt-reduced effects.
iv
Acknowledgement
I wish to express my sincere appreciation:
First and foremost, to my advisor Dr. Qingrong Huang; his infinite patience,
invaluable assistance and understanding, as well as his encouragement and advocacy over
the years, have greatly helped me to finish this work and to grow as a scientist and as an
individual.
To my committee, Dr. Paul Takhistov, Dr. Mukund Karwe, and Dr. Chii-Fen
Wang, for their helpful input and guidance.
To Dr. Holger Schöenherr (U. Twente, The Netherlands) for teaching me AFM
that all my research has been based on.
To labmates, collegues, and staffs past and present in Food Science Department,
for the time we spent together at such a helpful and friendly place to work.
Wholeheartedly, to my family, for their love and all manner of support through
this endeavor, and for still asking with interest although we live far apart.
To my little son Rookian; for eating, sleeping, and growing well, and for giving
me a perfectly pure smile as unbeatable refreshments.
To my dear husband Changhoon; his suggestion, good personality, sense of
humor, love, and endurance will be a source of comfort and inspiration for the essential
part in my life, always.

v
Table of Contents
ABSTRACT······················································································································ ii
ACKNOWLEGEMENTS ······························································································ iv
TABLE OF CONTENTS································································································· v
LIST OF FIGURES ········································································································ ix
LIST OF TABLES········································································································· xiv
CHAPTER I. INTRODUCTION ··············································································· 1
I.1. Motivation ····························································································1
I.2. Objectives·····························································································2
I.3. Thesis Outline ······················································································3
CHAPTER II. BACKGROUND·················································································· 6
II.1. Interactions between Polysaccharides and Oppositely-Charged
Proteins·································································································6
II.2. Physical Properties of Polymers ···························································9
II.2.1. Freely Jointed Chain Model ··················································10
II.2.2. Worm-like Chain Model························································12
II.2.3. Other Models ········································································15
II.3. Force Spectroscopy ············································································15
II.4. Current Status of Research ·································································22
II.5. References ··························································································24
CHAPTER III. EXPERIMENTAL PROCEDURES ················································ 30
III.1. Materials·····························································································30
III.2. Sample Preparation·············································································30
vi
III.3. Techniques for Physical Characterization···········································31
III.3.1. Potentiometric Titration ························································31
III.3.2. Turbidity Measurements························································31
III.3.3. Dynamic Light Scattering (DLS) Measurements ··················32
III.3.4. Force Spectroscopy ·······························································33
III.3.4.1 Tip Functionization··············································33
III.3.4.2 Atomic Force Microscopy Measurements············33
III.3.5. Rheological Measurements ···················································34
III.3.6. Contact Angle Measurement ·················································35
III.4. References ··························································································35
CHAPTER IV. NANOSCALE MECHANICAL PROPERTIES OF ALGINATE
AND CARRAGEENAN FILMS ······················································ 36
IV.1. Introduction ························································································36
IV.2. Materials and Methods ·······································································41
IV.2.1. Contact Angle Measurements················································41
IV.2.2. Force Measurements ·····························································41
IV.2.3. Rheological Measurements ···················································42
IV.3. Results and Discussion ·······································································42
IV.3.1. Characteristics of Sodium Alginate Film·······························43
IV.3.2. Characteristics of the Carrageenans ······································46
IV.3.2.1 Intrinsic viscoelastic behavior of carrageenans
and furcelleran ·····················································46
IV.3.2.2 Effect of counterion specificity on viscoelastic
properties of carrageenans and furcelleran···········50
IV.4. Conclusions ························································································57
IV.5. References ··························································································57
CHAPTER V. CHEMICAL FORCE MICROSCOPY STUDIES OF
INTERACTIONS BETWEEN BOVINE SERUM ALBUMIN
AND NEGATIVELY-CHARGED SURFACES ······························ 59
vii
V.1. Introduction ························································································59
V.2. Methods······························································································62
V.3. Results and Discussion ·······································································63
V.3.1. Interactions between BSA and Mica ·····································63
V.3.2. Interactions between BSA and κ-Carrageenan ······················65
V.4. Conclusions ························································································80
V.5. References ··························································································80
CHAPTER VI. RHEOLOGICAL PROPERTIES AND INTERACTIONS
BETWEEN BOVINE SERUM ALBUMIN AND
CARRAGEENANS ··········································································· 86
VI.1. Introduction ························································································86
VI.2. Materials and Methods ·······································································87
VI.2.1. Materials ···············································································87
VI.2.2. Sample Preparations······························································88
VI.2.3. Potentiometric Titration ························································88
VI.2.4. Turbidity Titration·································································88
VI.2.5. Rheological Measurements ···················································89
VI.3. Results and Discussion ·······································································89
VI.4. Conclusions ······················································································100
VI.5. References ························································································102
CHAPTER VII. RHEOLOGICAL PROPERTIES OF COACERVATES
FORMED BY BOVINE SERUM ALBUMIN AND PECTIN ····· 103
VII.1. Introduction ······················································································103
VII.2. Materials and Methods ·····································································105
VII.2.1. Materials ·············································································105
VII.2.2. Sample Preparations····························································105
VII.2.3. Rheological Measurements ·················································106
VII.3. Results and Discussion ·····································································106
VII.3.1. pH-Induced Phase Separation Behaviors in BSA/pectin
viii
Complexes············································································106
VII.3.2. Rheological Properties of BSA/Pectin Complexes··············108
VII.3.2.1 Effects of pH······················································ 110
VII.3.2.2 Effects of addition of salt ··································· 111
VII.3.2.3 Effects of BSA ratio to pectin ···························· 117
VII.3.3. Nanoscale Mechanical Properties of BSA/Pectin Complexes ···
····························································································120
VII.4. Conclusions ······················································································126
VII.5. References ························································································128
CHAPTER VIII. SUMMARY & FUTURE WORK ·················································· 131
CHAPTER IX. APPENDIX ······················································································ 133
CURRICULUM VITA································································································· 170
ix
List of Figures
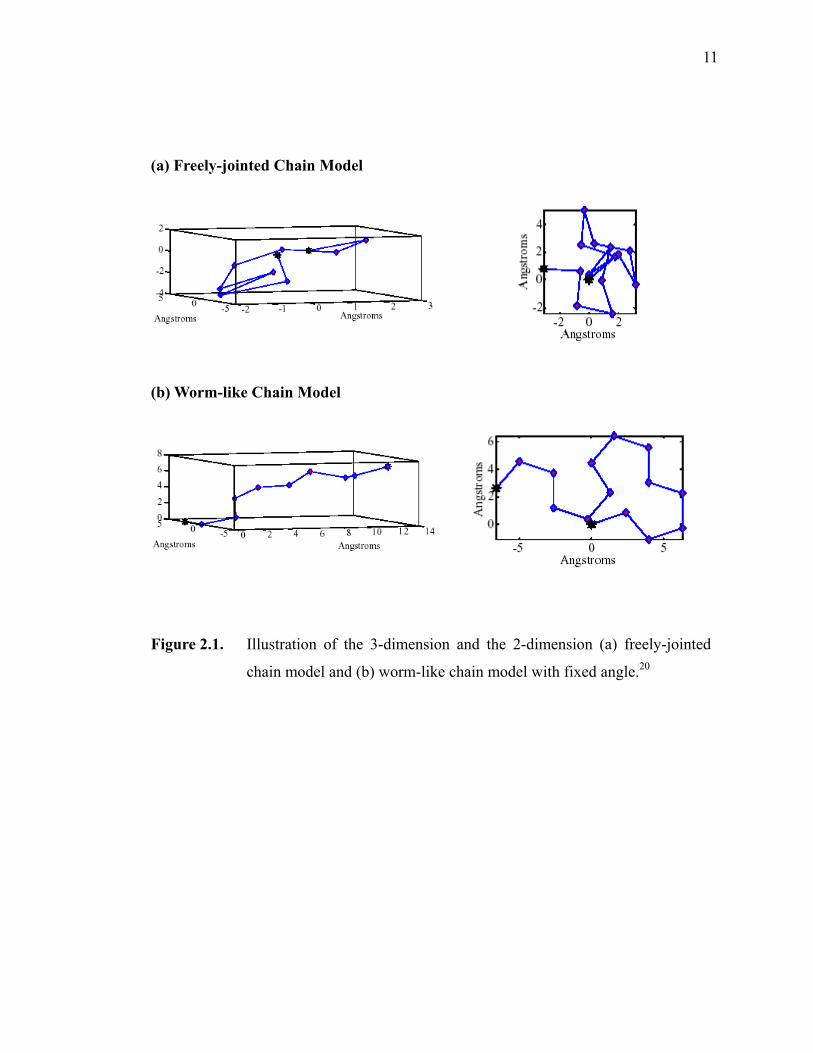
Figure 2.1. Illustration of the 3-dimension and the 2-dimension (a) freely-jointed chain model, and (b) worm-like chain model with fixed angle. ··············11
Figure 2.2. Example of saw-tooth pattern of force extension curves for the interactions between BSA-coated tip and mica surface in 0.1 M NaCl solution. ··································································································14
Figure 2.3. Representative scheme of atomic force microscopy.·······························16
Figure 4.1. Proposed structures of Na-alginate composed of D-mannuronic acid (M) and L-guluronic acid (G) with repeating block of (a) MMM, (b) GGG, and (c) MGM.·························································································37
Figure 4.2. Proposed chemical structures of various carrageenans. ···························37
Figure 4.3. Force-extension curves recorded for interactions between silicon-nitride AFM tip and Na-alginate covered mica substrate in different salt solutions.·································································································47
Figure 4.4. Histograms of pull-off forces measured with silicon-nitride AFM tip on the Na-alginate covered mica substrate at different salt solutions. ··········48
Figure 4.5. Apparent viscosities of carrageenan/furcelleran at different NaCl concentrations.························································································49
Figure 4.6. The plots of viscosity versus concentrations of carrageenans/furcelleran in water. ··································································································51
Figure 4.7. Apparent viscosities of carrageenans and furcelleran (2 g/L) in 0.1 M salt solutions of various counterion species. ···········································52
Figure 4.8. Apparent viscosities of κ-carrageenans in salt solutions of various counterion species.··················································································54
Figure 4.9. Histograms of pull-off forces from force measurements of κ-carrageenan-coated substrate emerged in different salt solutions (top), and the plot of calculated chain lengths from the difference between the
x
first peak to the other peaks versus its ruptured force (bottom).··············55
Figure 4.10. Histograms of pull-off forces from force measurements of κ-carrageenan-coated substrate emerged in differenct concentration of KCl solutions. ·························································································56
Figure 5.1. Histograms of the pull-off forces from force measurements (n ≥ 500) between bare mica substrate and BSA-modified AFM tip in 0.1 M NaCl solutions of different pH values: (a) pH 6.3; (b) pH 5.3; (c) pH 4.8; and (d) pH 4.0. ······························································································64
Figure 5.2. The schematic representation of immobilization of BSA to an AFM tip, and the formation of carrageenan film on mica or silicon wafer surface.····
················································································································66
Figure 5.3. Typical force-distance curve for κ-carrageenan (deflection voltage vs. piezo-displacement) measured by: (a) bare silicon/nitride tip; and (b) BSA-modified AFM tip in 0.1 M NaCl solution at pH 6.0.·····················68
Figure 5.4. Normalized retraction force curves (force vs. separation x) for the interactions between BSA-coated tip and κ-carrageenan in 0.1 M NaCl solution at pH 6.0 (solid line) and pH 4.7 (dashed line). ·························70
Figure 5.5. Histograms of the pull-off forces from force measurements (n ≥ 150) of κ-carrageenan covered substrate and bare AFM tip (a), as well as BSA-modified AFM tip at different pH values: (b) pH 6.0; (c) pH 5.3; and (d) pH 4.7. The NaCl concentration is fixed at 0.1 M.································ 71
Figure 5.6. The schematic representation of the effects of pH on the interactions between the BSA-modified AFM tip and carrageenan-attached substrate. ················································································································72
Figure 5.7. Typical fitting example of normalized force-separation curve fitted by worm-like chain (WLC) model for BSA-coated tip and κ-carrageenan in 0.1 M NaCl solution at pH 4.7 (top) and the comparison of fitting results by WLC model and freely-jointed chain (FJC) model (bottom) (Lc: contour length, nm; Lp: persistence length, nm; F: rupture force, pN).·········································································································74
xi
Figure 5.8. The contour lengths of κ-carrageenan obtained from the fitting to WLC model for (◆) pure carrageenan; (▲) BSA/κ-carrageenan at pH 6.0; and (●) BSA/κ-carrageenan at pH 4.7.····················································76
Figure 5.9. The contour lengths of each domain between two consecutive peaked events obtained from the fitting to WLC model for (A) pure carrageenan; (B) BSA/κ-carrageenan at pH 6.0; (C) BSA/κ-carrageenan at pH 5.3; and (D) BSA/κ-carrageenan at pH 4.7. The buffer concentration is fixed at 0.1 M.·······························································77
Figure 5.10. The persistence lengths of κ-carrageenan obtained from the fitting to WLC model for (a) BSA/κ-carrageenan at pH 6.0; (b) BSA/κ-carrageenan at pH 5.3; and (c) BSA/κ-carrageenan at pH 4.7.················79
Figure 6.1. The plots of turbidity, hydrodynamic radius, and intensity versus pH for the mixture of BSA and κ-carrageenan in 0.1 M NaCl solution. ·············90
Figure 6.2. Viscosities of BSA complexes with κ-carrageenan in 0.1 M NaCl at different pH values.·················································································92
Figure 6.3. The plots of turbidity versus pH for the mixtures of BSA/carrageenan in 0.1 M NaCl with different BSA/carrageenan ratios: (a) furcelleran, (b) κ- (c) ι-, and (d) λ-carrageenan. ······························································93
Figure 6.4. The plots of turbidity versus pH for the mixtures of BSA λ-, ι-, κ-carrageenan, and furcelleran in 0.1 M NaCl solution. ·····························95
Figure 6.5. The plots of turbidity versus pH for the mixtures of BSA/carrageenan with different ionic strengths: (a) furcelleran, (b) κ-carrageenan (c) ι-carrageenan, and (d) λ-carrageenan. ·······················································97
Figure 6.6. pHc and pHφ versus I1/2 for BSA/furcelleran (10:1) complexes in 0.1 M NaCl solution.·························································································98
Figure 6.7. The plot of storage modulus G' and loss modulus G" versus angular frequency ω for the complex formed by BSA and κ-carrageenan (10:1) in 0.1 M NaCl solution and pH=4.7. ·····················································101
Figure 7.1. The typical chemical structure of pectin.···············································104
xii
Figure 7.2. Turbidity (100-T%) of the mixture of BSA with pectin as a function of pH at 0.1 M NaCl. ················································································107
Figure 7.3. The complex viscosity (η*), the storage modulus (G'), and loss modulus (G") versus angular frequency ω for BSA/pectin coacervate prepared at CNaCl=0.1 M, r=5:1, and pH=3.0. ························································ 109
Figure 7.4. The plots of storage modulus (G') versus angular frequency ω for the complexes of BSA with pectin (5:1) in 0.1 M NaCl solutions of various pH values. ····························································································· 112
Figure 7.5. The plots of storage modulus G' versus angular frequency ω for the complexes formed by BSA and pectin (5:1) in NaCl solutions of different NaCl concentrations. The pH is fixed at 3.0. ·························· 113
Figure 7.6. Turbidimetric titration curves [(100-T%) versus pH] for the mixtures of BSA and at different NaCl concentrations. ··········································· 115
Figure 7.7. The plots of storage modulus G' versus angular frequency ω for complexes formed by BSA and pectin at various BSA/pectin ratios in 0.1 M NaCl solution at pH 3.0. ····························································· 118
Figure 7.8. Turbidimetric titration curves [(100-T%) versus pH] for the complexes of BSA with pectin at various BSA/pectin ratios in 0.1 M NaCl solution at pH 3.0. ······························································································ 119
Figure 7.9. The plots of the turbidity (100-T%), the storage modulus (G'), and Young’s modulus (E) estimated by Hertz model versus pH for complexes formed by BSA and pectin (5:1) in 0.1 M NaCl solution. ···123
Figure 7.10. Histograms of the pull-off forces obtained from the force measurements (n ≥ 1000) between the BSA/pectin coacervates covered mica substrate and a Si3N4 AFM tip emerged in 0.1M NaCl solutions of different pH values: (a) pH 4.5; (b) pH 4.0; (c) pH 3.0; and (d) pH 2.0. ···················124
Figure 7.11. Comparison of the storage modulus (G') measured by ARES and the Young’s modulus (E) estimated by the Hertz model on the basis of AFM results for the complexes formed by BSA and pectin (5:1) in different NaCl concentrations. The pH is fixed 3.0. ············································125
xiii
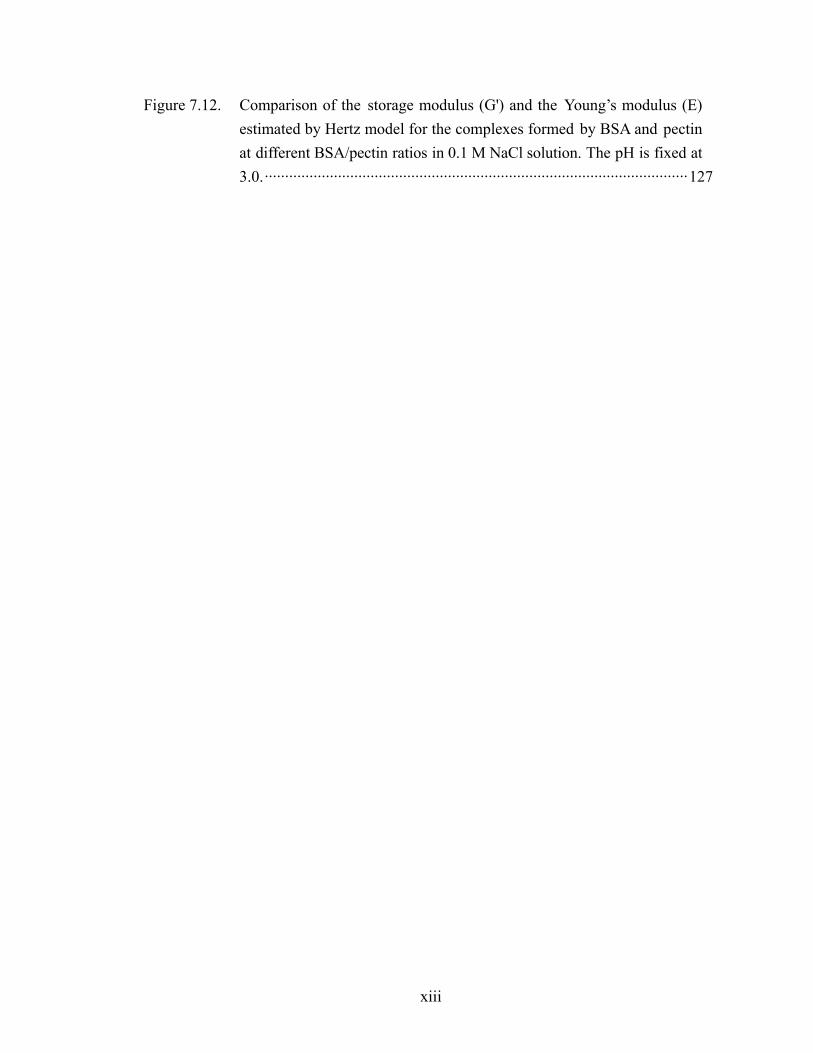
Figure 7.12. Comparison of the storage modulus (G') and the Young’s modulus (E) estimated by Hertz model for the complexes formed by BSA and pectin at different BSA/pectin ratios in 0.1 M NaCl solution. The pH is fixed at 3.0.········································································································127
xiv
List of Tables
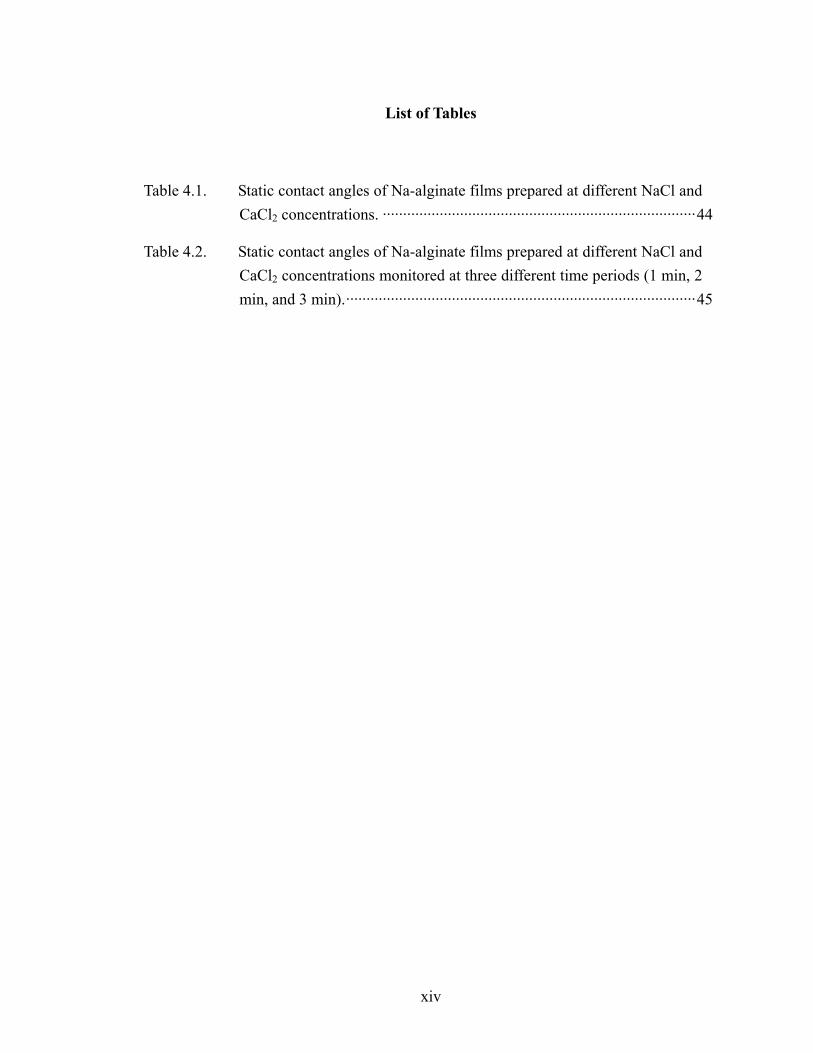
Table 4.1. Static contact angles of Na-alginate films prepared at different NaCl and CaCl2 concentrations. ·············································································44
Table 4.2. Static contact angles of Na-alginate films prepared at different NaCl and CaCl2 concentrations monitored at three different time periods (1 min, 2 min, and 3 min).······················································································45
1
I. INTRODUCTION
I.1. Motivation
The motivation of this dissertation falls into two distinct categories. The first is
related to the nanoscale physical properties of biopolymers of scientific and industrial
importance. The second is associated with the particularly well-controlled food delivery
systems that have evolved out of various industrial needs to enhance the stability and
viability of the active food ingredients. Because of the complexity of modern multi-
component food systems, the physical properties of food materials, such as phase
behaviors, mechanical properties, and intermolecular interactions between food
components at different length scales (nano-, micro-, macro-scales) must be understood.
Polysaccharides and proteins are two key components in both natural and processed
foods. Polysaccharides have been widely used as gelling or thickening agents in food
industry, and their complexes with proteins have been served as important materials in a
variety of food delivery applications because they create a barrier between food
ingredients and food matrices, and this barrier improves the ingredient performance and
shelf-life stability in many food systems. However, many issues related to the
relationship among structure, composition, and physical properties of
protein/polysaccharide complexes are not understood.
Furthermore, the macroscopic properties of food biopolymers are determined to a
great extent by the mechanical characteristics of individual components, including
2
aspects such as entropic and enthalpic elasticities, as well as their molecular
conformation. Nevertheless, the intermolecular interactions of each component also
contribute to the mechanical characteristics of the bulk assembly. The properties and
interactions of single polymer chains cannot be derived from conventional ensemble
measurements. Therefore, the development of techniques to characterize food materials at
nanoscale is important and necessary.
Our understanding of the polysaccharides involved in food systems beyond the
classical macroscopic aspect and to the more micro or nano-scale mechanism is still in its
infancy. In our quest to understand factors responsible for rheological properties and
interactions within the polysaccharide/protein complexes, we focus herein on the physical
properties of polysaccharides and their interactions with proteins from macro- to nano-
scale.
I.2. Objectives
The first objective of this dissertation is to study the nanomechanics of
polysaccharides under various cationic solutions using atomic force microscopy (AFM)*-
based single molecule force spectroscopy. AFM is sensitive to single molecular binding
events. These measurements can provide an insightful comparison with the bulk
viscoelastic properties obtained by conventional rheological measurements. Furthermore,
through the direct pull-off force measurements, we can test polymer single chain theories
that describe the behavior of polysaccharides at single molecular level.
* Note that this abbreviation will be used all over for both the technique and the instrument.
3
The interactions between polysaccharides and proteins determine the final structure,
texture, and stability of the food materials. Therefore, my second objective is to
understand the rheological properties of pH-induced protein/polysaccharide complexes
under different length scales. Molecular interactions between negatively-charged
polysaccharides and bovine serum albumin (BSA) under different physicochemical
conditions were investigated using turbidimetric and potentiometric titrations, dynamic
light scattering (DLS), and AFM. The morphologies of the complexes formed by
carrageenans and BSA have been monitored using either tapping mode or contact mode
AFM, while their intermolecular interactions have been studied by chemical force
microscopy (CFM). Strong polyelectrolytes, κ-, ι-, λ-carrageenan, and furcelleran, which
have similar chemical structure but different sulfate contents (linear charge density), were
used to study the effects of ionic strength, linear charge density of polysaccharides, and
polysaccharide counter cation specificity on the phase separation behaviors with bovine
serum albumin (BSA). Weak polyelectrolyte pectin, which is a negatively charged
polysaccharide that contains carboxyl group, was also used to study the effects of salt
concentration and pH on the rheological properties of its complexes with BSA.
I.3. Thesis Outline
Chapter 2 begins with an overview of the relevant research, as well as the theories
that are used in this thesis. For the direct quantification of the molecular-level interactions
between polysaccharides themselves and between polysaccharide and protein, or
polysaccharides and protein, we employ the technique of AFM-based single molecule
4
force spectroscopy, a relatively new method that possesses an extremely sensitive
detection with a tiny and sharp tip on flexible cantilever through the feedback of pico
Newton (pN)-level forces. Various polymer stretching models are tested in order to
understand the details of the molecular interactions between polysaccharides or between
polysaccharide and protein. Review on the complex formation between polysaccharides
and protein is also included in Chapter 2.
Chapter 3 is designed to give an overview of the instrumentation and experimental
procedures used in this dissertation. The experimental techniques used in this work
include the potentiometric titration, turbidimetric titration, dynamic light scattering
(DLS), rheological measurements, and AFM, which is used for substrate imaging and
force measurement. The method for the functionalization of AFM tip is also included in
this chapter.
In Chapter 4, AFM-based single molecule force spectroscopy has been used to probe
nanomechanics of alginate and carrageenan films under different cationic conditions. The
force-separation curves have been analyzed using modifies Hertz model to obtain
Young’s modulus of the films, and compared with their rheological properties in solutions.
Furthermore, polymer chain theories, including freely-joint chain model and worm-like
chain model, have been tested in κ-carrageenan film in 0.1 M KCl and NaCl solutions.
Chapter 5 investigates the molecular interactions between bovine serum albumin
(BSA) and negatively-charged surface such as mica and κ-carrageenan using AFM to
evaluate the strength of the binding force. The stretching of κ-carrageenan and BSA is
interpreted by worm-like chain model (WLC) in this chapter.

5
Chapter 6 is composed of the rheological properties and interactions between BSA
and carrageenans. We show that the characteristics of the complexes can change
significantly with pH, as supported by results of turbidity, hydrodynamic radius of
complexes, and viscoelastic properties.
For the further study of interactions between the weak polyelectrolyte, pectin, and
globular protein, BSA, Chapter 7 focuses on the aspect of changes on the mechanical
properties at both macro-scale by rheological measurement and nano-scale by AFM. The
dependence upon pH, salt concentration, and protein/polysaccharide ratio has been
investigated in details.
Chapter 8 and 9 contain a summary of this dissertation and the direction of the future
work.

6
II. BACKGROUND
In this chapter, we discuss background information of technological pertinence of this
thesis and its scientific contribution to the field of polymer physics and colloidal
chemistry. We begin with force spectroscopy from AFM point of view, followed by
relevant theories about physical behaviors of polymers. Finally we provide a brief
discussion on the complex formation on the basis of existing literature and current state
of knowledge regarding the chemical and physical characteristics.
II.1. Interactions between Polysaccharides and Oppositely-Charged
Proteins
Interactions between proteins and oppositely charged polysaccharides generally lead
to coacervation, which is believed to result from weak attractive and nonspecific
interactions such as electrostatic, van der Waals, hydrophobic interactions, or hydrogen
bonding between proteins and polysaccharides.1 Coacervation is a peculiar phenomenon,
in which a macromolecular aqueous solution separates into two immiscible liquid phases.
The denser phase concentrated in colloid components is generally called as the
coacervate, which is in equilibrium with the relatively dilute colloid liquid phase. This
liquid-liquid phase separation can be divided into either “simple” or “complex”
coacervation. The former involves only one macromolecule and may result from the
7
addition of a dehydrating agent that promotes polymer-polymer interactions over
polymer-solvent interactions.
In the later case, complex coacervation is usually a physicochemical phenomenon
caused by the electrostatic interaction between two oppositely charged polyion, such as
charged polysaccharides and proteins, whose characteristics were first described by
Bungenberg de Jong.2 This phenomenon is mainly due to weak attractive and nonspeci
fic interactions such as electrostatic, van der Waals, and hydrophobic interactions bet
ween proteins and polysaccharides. Coacervation occurs at pH lower than the isoelectric
point (pI) of protein when the negatively charged polysaccharide and the protein have
opposite charges. Coacervation tends to be suppressed in concentrated polymer solutions,
as well as high salt solutions. While the coacervate itself is rich in colloids and the dilute
equilibrium phase is rich in solvents, both phases may contain either of the initial
components. Coacervation requires proper charge balance between polysaccharides and
proteins, or between cations and anions, since their initial concentration or ratio directly
affect complex coacervation.
Because the coacervates formed by proteins and oppositely charged polysaccharides
are mainly driven by the long range character of the electrostatic interaction,
physicochemical parameters, such as pH, ionic strength, polysaccharide linear charge
density (ξ), protein surface charge density (σ), rigidity of the polysaccharide chain, and
protein/polysaccharide ratio, have been demonstrated to strongly influence the formation
of protein/polysaccharide coacervates.3
Polysaccharides and proteins are not only the applicable materials to coacervation,
but also two key components in both natural and processed foods.4, 5 The interactions
8
between polysaccharides and proteins determine the final structure, texture, and stability
of the food materials.6 Current understanding of the complex coacervation is that the
charged polymers interact with oppositely charged colloids first to form soluble primary
complexes. Then, the primary soluble complexes interact with each other to form
electrostatically neutral interpolymeric complexes.7-10 These insoluble complexes
ultimately coarsen with time and sediment to form the so-called coacervate phase. The
nanostructure of the protein/polysaccharide coacervates is greatly responsible for the
physicochemical properties of the functional foods. Coacervates formed by proteins and
polysaccharides have already served as important materials in various food delivery
applications because they create a barrier between food ingredients and food matrices.
Some of these properties could probably be better elucidated if the structure of the
coacervates is known. The structure and texture of the functional foods depend on the
ability of food polymers to interact and form organized structures.
Although the phenomenon of protein-polyelectrolyte coacervation has been studied
for several decades, its application in protein separation is still limited. Despite the
extensive studies on the phase boundary of the protein/polysaccharide coacervates, the
knowledge of the structure of the protein/polysaccharide coacervates is still lacking
owing to the limited methods available before. In terms of the preparation method of
coacervates, after the proteins are separated and concentrated into the coacervate phase,
polyelectrolytes contained within can be removed via ultrafiltration or selective
precipitation. The efficiency of recovering proteins via a well-designed polyelectrolyte
coacervation is relatively high. This requires careful optimization of variables such as pH,
ionic strength, and solute concentration for appropriate protein-polyelectrolyte pairs.11, 12
9
With the help of modern advanced techniques, we can now obtain more precise picture of
the nanostructure of protein/polysaccharide coacervates.
Furthermore, the development of atomic force microscopy (AFM) allows the
measurement the nanomechanics of resulted microcapsulates formed by
protein/polysaccharide coacervates, something that cannot be done by conventional
rheological measurements. Compared with other tools, AFM can probe local surface
mechanical properties with length scale down to several nanometers, and with the control
of applied force down to several nanonewtons. These two characteristics give the AFM
advantages for studying the mechanical properties of polymeric and biological systems
because most of them exhibit nanoscale heterogeneous distribution in modulus. The
measurement of nanomechanics of polymer films using AFM will be accomplished by
the indentation method, in which the AFM tip is pushed into the surface of the sample,
and force-versus-distance curves are collected.
II.2. Physical Properties of Polymers
The recent development in using AFM to manipulate single polymer chains provides
the extraordinary opportunity to single polymer chain theories on fundamental level. The
ability of using AFM to manipulate polymer chains has been demonstrated by many
systems, such as protein,13 polysaccharides,14, 15 DNA,16 antibody and antigen, ligand and
recptor.17-19 In particular, the investigation on the interactions between the AFM tip and
the polymer-functionalized surface has been carried out in this dissertation. Prior to the
discussion of this, how the force-distance curves can be used to determine the polymer
10
chain conformation and nanoscale mechanical properties has been described. Among the
different theoretical models, two polymer single chain models, the freely jointed chain
model and the worm-like chain model, will be discussed in this chapter:.
II.2.1. Freely Jointed Chain Model
The basis of many single polymer chain theories originates from the Flory’s Freely
Jointed Chain (FJC) model.15, 20-22 This model assumes that the flexible polymer chains,
whose chemical bonds have a fixed length are free to rotate with rigid connections of
bond angles, as illustrated Figure 2.1a. The polymer chain is divided into n rigid
segments with the Kuhn length, LK, which is exhibited by flexible junctions. As higher
forces are applied to the system, a random-coil structure is no longer adapted to the
pieces of the chain. The individual molecule is most noticeable to be associated with the
direction of the external force. This state can be described as the FJC model.
The extension x can be represented as a function of the loading force F. The Langevin
function L is involved in the following Equation:
contourcoth)( LFL
TkTk
FLFx
k
B
B
k •⎥⎦
⎤⎢⎣
⎡−⎟⎟
⎠
⎞⎜⎜⎝
⎛= (Eq. 2.6)
where the contour length is defined as KLnL = . In particular, as n is large enough, the
above equation can be re-written to the following Equation:
⎟⎠⎞
⎜⎝⎛= −
Lx
LTk
xFK
B 1)( L (Eq. 2.7)
where L-1 is the inverse Langevin function. For small extensions (x<< L), equation
11
(a) Freely-jointed Chain Model
(b) Worm-like Chain Model
Figure 2.1. Illustration of the 3-dimension and the 2-dimension (a) freely-jointed
chain model and (b) worm-like chain model with fixed angle.20
12
below still obeys the Hook’s law. For large extensions (x < L), however, may result in a
nonlinear relationship between the force and the extension.
Since the freely jointed chains are assumed to behave like independent segments, the
FJC model describes flexible molecules reasonably well. Several well-demonstrated
examples using FJC model are oligonucleotides, polydimethysiloxane, and PMMA.22, 23
II.2.2. Worm-like Chain Model
Worm-Like Chain (WLC) is a more realistic model for many systems.20, 21 This
model, introduced by Kratky and Porod, assumes that many polymeric molecules have
the internal stiffness.24, 25 This model refers a polymer as a homogenous chain with
entropic elasticity, and as a continuous string of a given total contour length. Therefore, it
is called a worm-like chain. While the entropic and enthalpic subscriptions are involved
in this theory, stretching is limited by the contour length of the polymer. When a polymer
is staying at a solvent, it forms a coil-like network with maximum entropy. When it is
extended, its entropy decreases and a repulsive force is generated. In this case, WLC
model takes into account the actions of the polymers under stretching.
The next estimate gives an expression for the force-distance relationship, which is
obtained by stretching of the single polymer segment. The bending properties are guided
by the persistence length, similar to the Kuhn length, which denotes the flexibility of the
molecule. The chain direction is restricted on the length scale of the persistence length,
and the linearity of polymer can be measured below the persistence length. In another
word, molecules with high persistence length tend not to form coils. Strictly speaking, the
13
persistence length is a function of the external force. The WLC model has been
effectively demonstrated to describe the elastic behavior of many coil-structured
molecules,26, 27 such as DNA,16, 28 polymethacrylic acid (PMAA), and adhesion proteins.
Especially at low forces, the relationship between persistence and Kuhn length is
PK LL 2= . Therefore, the persistence length describes the force of extension in the WLC
model that brings the molecule into a plane (Figure 2.1b). Essentially the persistence
length is described how far the polymer extends in a given direction before becoming
random.
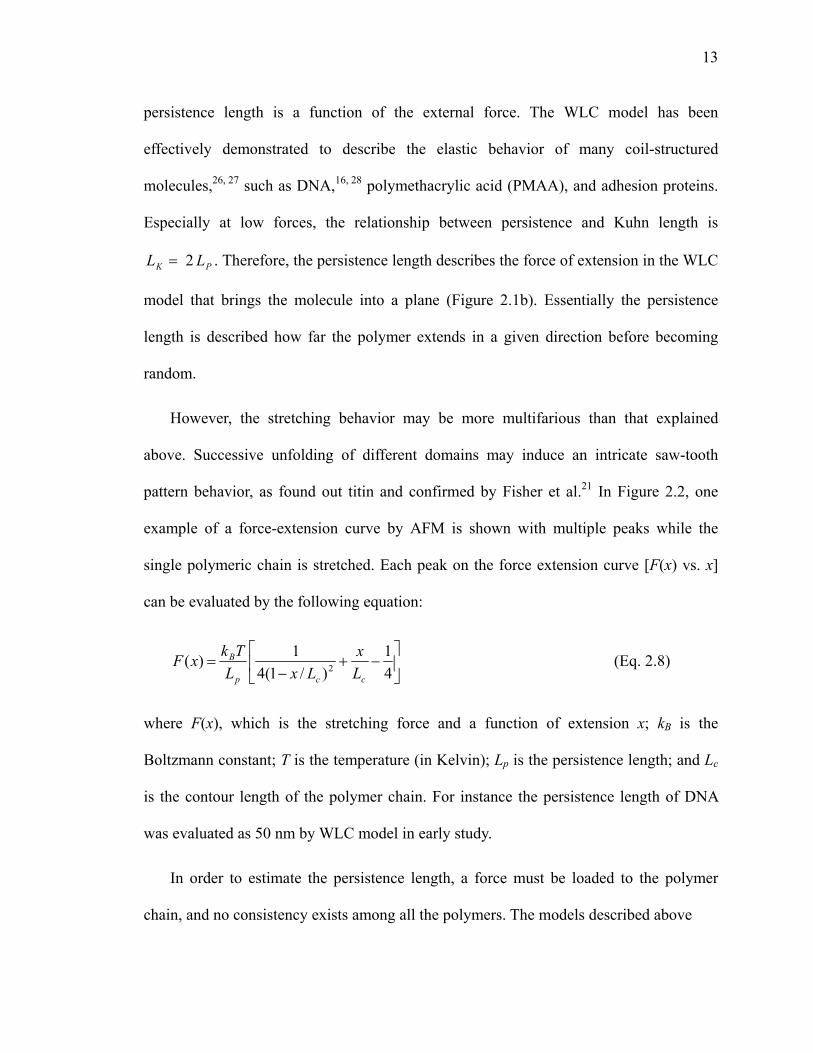
However, the stretching behavior may be more multifarious than that explained
above. Successive unfolding of different domains may induce an intricate saw-tooth
pattern behavior, as found out titin and confirmed by Fisher et al.21 In Figure 2.2, one
example of a force-extension curve by AFM is shown with multiple peaks while the
single polymeric chain is stretched. Each peak on the force extension curve [F(x) vs. x]
can be evaluated by the following equation:
⎥⎦
⎤⎢⎣
⎡−+
−=
41
)/1(41)( 2
ccp
B
Lx
LxLTkxF (Eq. 2.8)
where F(x), which is the stretching force and a function of extension x; kB is the
Boltzmann constant; T is the temperature (in Kelvin); Lp is the persistence length; and Lc
is the contour length of the polymer chain. For instance the persistence length of DNA
was evaluated as 50 nm by WLC model in early study.
In order to estimate the persistence length, a force must be loaded to the polymer
chain, and no consistency exists among all the polymers. The models described above
14
0.0
0.2
0.4
0.6
0.8
1.0
1.2
1.4
0 100 200 300 400 500
Extension, nm
Forc
e, n
NExtendingRetracting
Figure 2.2. Example of saw-tooth pattern of force extension curves for the
interactions between BSA-coated tip and mica surface in 0.1 M NaCl
solution.
15
have no direct relationship with the molecular composition of a polymer, and the
structure of a polymer is dependent upon the environment, as well as the persistence
length. Therefore, Lp can be obtained from the extension versus force and it is suitable to
analyze the experimental data on the polymer and the force-extension correlation.
II.2.3. Other models
There are other models to describe polymers under stretching, such as Rotational
Isomeric State (RIS), which has locations limits on the accessible dihedral angles in the
WLC model, and the tube model, which considers the polymer as a free tube to move
within a network of fixed boundaries. Also, there are several other theories related to the
volume exclusion and solvent quality. However, these models are beyond the scope of the
current research, thus are not included in this dissertation.
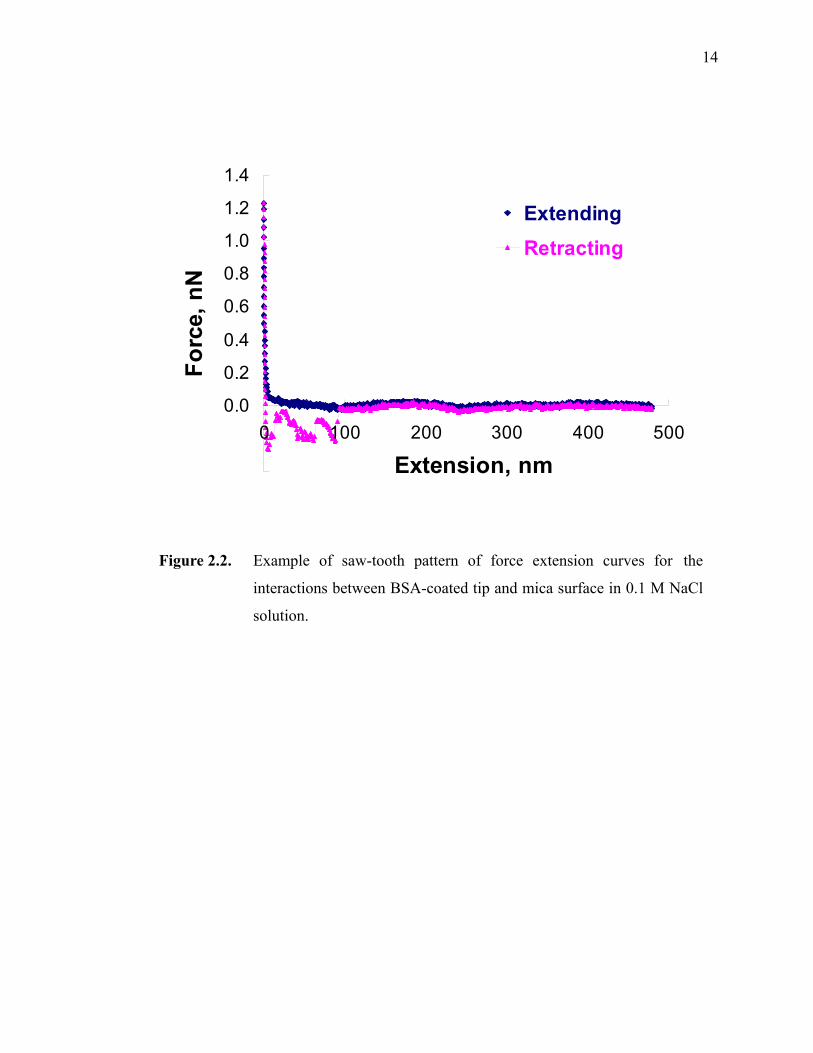
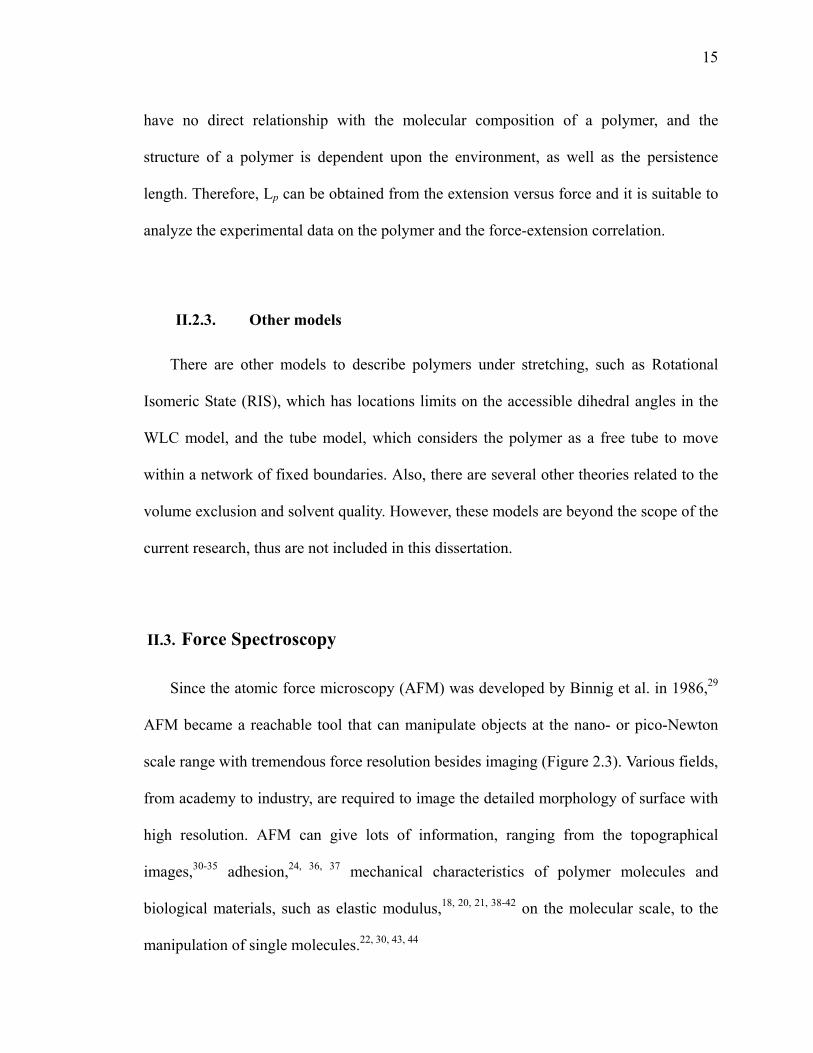
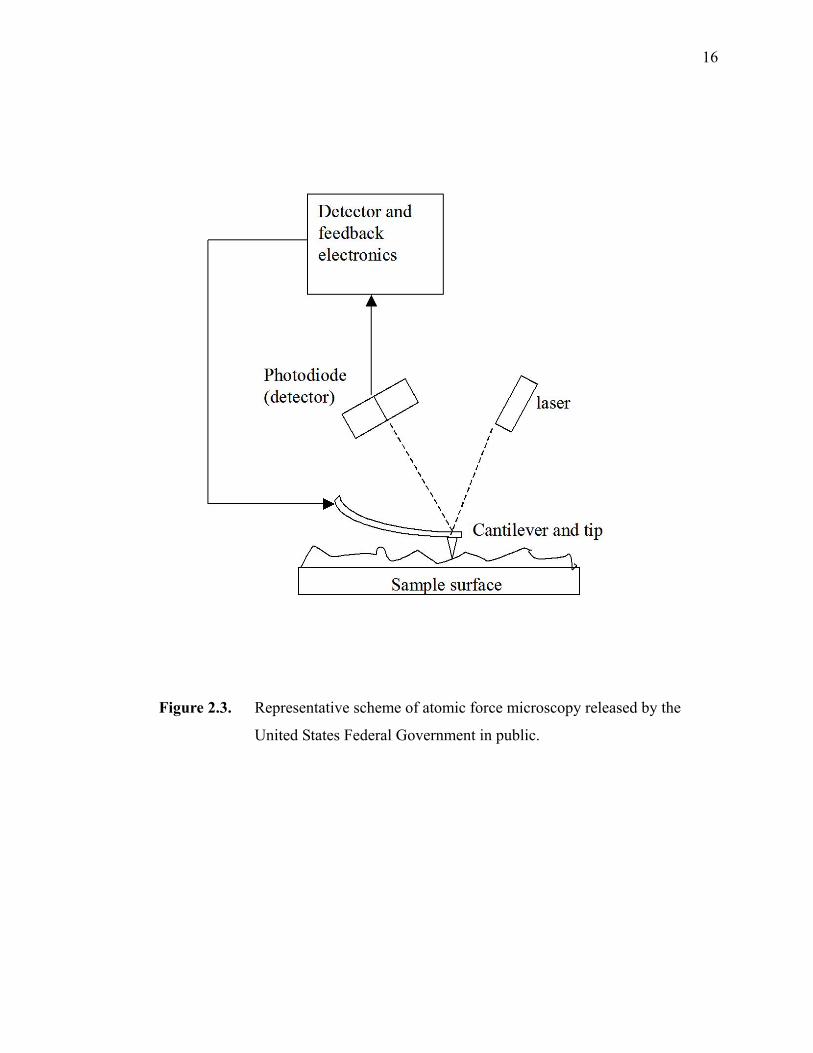
II.3. Force Spectroscopy
Since the atomic force microscopy (AFM) was developed by Binnig et al. in 1986,29
AFM became a reachable tool that can manipulate objects at the nano- or pico-Newton
scale range with tremendous force resolution besides imaging (Figure 2.3). Various fields,
from academy to industry, are required to image the detailed morphology of surface with
high resolution. AFM can give lots of information, ranging from the topographical
images,30-35 adhesion,24, 36, 37 mechanical characteristics of polymer molecules and
biological materials, such as elastic modulus,18, 20, 21, 38-42 on the molecular scale, to the
manipulation of single molecules.22, 30, 43, 44
16
Figure 2.3. Representative scheme of atomic force microscopy released by the
United States Federal Government in public.
17
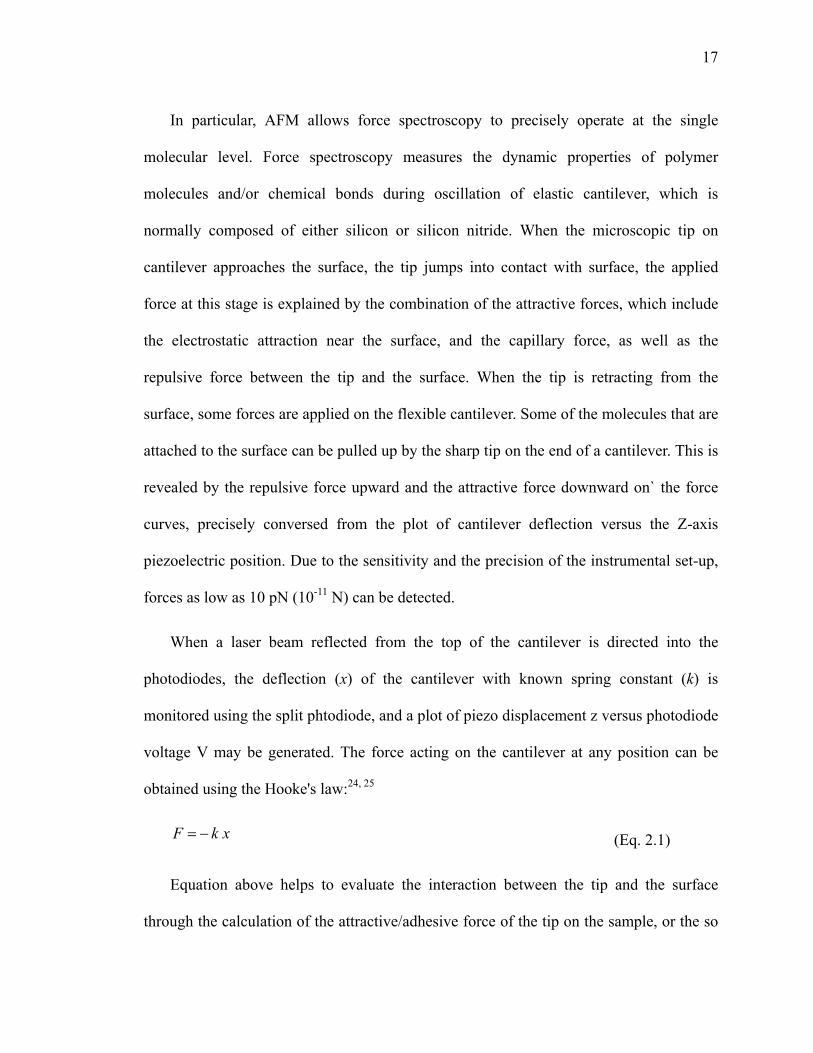
In particular, AFM allows force spectroscopy to precisely operate at the single
molecular level. Force spectroscopy measures the dynamic properties of polymer
molecules and/or chemical bonds during oscillation of elastic cantilever, which is
normally composed of either silicon or silicon nitride. When the microscopic tip on
cantilever approaches the surface, the tip jumps into contact with surface, the applied
force at this stage is explained by the combination of the attractive forces, which include
the electrostatic attraction near the surface, and the capillary force, as well as the
repulsive force between the tip and the surface. When the tip is retracting from the
surface, some forces are applied on the flexible cantilever. Some of the molecules that are
attached to the surface can be pulled up by the sharp tip on the end of a cantilever. This is
revealed by the repulsive force upward and the attractive force downward on` the force
curves, precisely conversed from the plot of cantilever deflection versus the Z-axis
piezoelectric position. Due to the sensitivity and the precision of the instrumental set-up,
forces as low as 10 pN (10-11 N) can be detected.
When a laser beam reflected from the top of the cantilever is directed into the
photodiodes, the deflection (x) of the cantilever with known spring constant (k) is
monitored using the split phtodiode, and a plot of piezo displacement z versus photodiode
voltage V may be generated. The force acting on the cantilever at any position can be
obtained using the Hooke's law:24, 25
xkF −= (Eq. 2.1)
Equation above helps to evaluate the interaction between the tip and the surface
through the calculation of the attractive/adhesive force of the tip on the sample, or the so
18
called “pull-off force”, on the basis of the captured force curves and the known spring
constant of the cantilever.
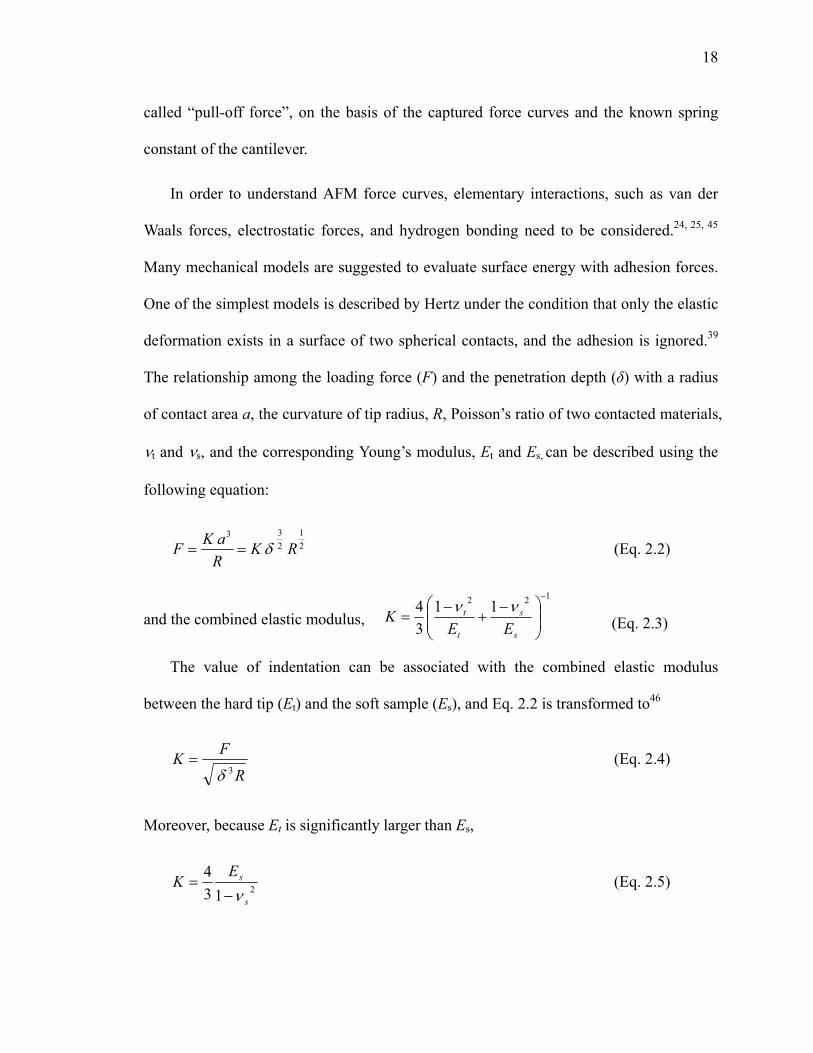
In order to understand AFM force curves, elementary interactions, such as van der
Waals forces, electrostatic forces, and hydrogen bonding need to be considered.24, 25, 45
Many mechanical models are suggested to evaluate surface energy with adhesion forces.
One of the simplest models is described by Hertz under the condition that only the elastic
deformation exists in a surface of two spherical contacts, and the adhesion is ignored.39
The relationship among the loading force (F) and the penetration depth (δ) with a radius
of contact area a, the curvature of tip radius, R, Poisson’s ratio of two contacted materials,
νt and νs, and the corresponding Young’s modulus, Et and Es, can be described using the
following equation:
21
233
RKRaKF δ== (Eq. 2.2)
and the combined elastic modulus,122 11
34
−
⎟⎟⎠
⎞⎜⎜⎝
⎛ −+
−=
s
s
t
t
EEK νν (Eq. 2.3)
The value of indentation can be associated with the combined elastic modulus
between the hard tip (Et) and the soft sample (Es), and Eq. 2.2 is transformed to46
R
FK3δ
= (Eq. 2.4)
Moreover, because Et is significantly larger than Es,
2134
s
sEK
ν−= (Eq. 2.5)

19
Hence, R
FEs 3
2 )1(43
δ
ν−= (Eq. 2.6)
Unlike the Hertz model, Johnson, Kendall, and Roberts (JKR) model considers
adhesion in contact mechanics.24, 25, 47 This model takes into account of the influence of
van der Waals force within the contact zone and the diminished elastic repulsion force
caused by the attraction. JKR model combines the elastic deformation and adhesion to
describe the contact mechanics of two contacting surfaces. The relationship between the
external force F and indentation depth δ is presented as:
33
6 aKRaKF γπ−= (Eq. 2.7)
Ka
Ra γπδ 6
323
−= (Eq. 2.8)
RF JKRad γπ23
)( = (Eq. 2.9)
where a is the contact area, γ is the interfacial energy. In most cases, the JKR model is
adequate to describe the experimental condition, particularly for soft and adhesive
materials.
The Derjajuin-Muller-Toporov Model (DMT) applies to the case of long range
surface force, i.e., large elastic modulus, small adhesion, and small tip radius.48 The
equations to describe the DMT model are formulated as:
γπ RRaKF 2
3
−= (Eq. 2.10)

20
Ra 2
=δ (Eq. 2.11)
γπ RF DMTad 2)( = (Eq. 2.12)
The Maugis-Dugdale (MD) model clearly indicated a sharp difference between JKR
model and DMT model. The former is suitable for compliant sample, while the latter is
found to be valid for the opposite extreme situation. Hence, it is necessary to propose a
connection to bridge the gap between the two classic models. The MD model provides an
analytical solution for the elastic modulus evaluation.49 A nondimensional transition
parameter λ is defined as:
31
202 ⎟⎟⎠
⎞⎜⎜⎝
⎛=
KRγπ
σλ (Eq. 2.13)
Note that this parameter is similar to the parameter defined by Tabor.50 The symbol
0σ represents the maximum adhesive force in the Dugdale potential. When λ< 0.1, the
DMT model applies; and when λ> 5, the JKR model applies. Since cumbersome
numerical iteration is necessary to obtain solutions to the equations, Pietrement and
Troyon (PT) 51 have developed a generalized equation.52 This approximation produces
results within accuracy of 1% or better.
⎥⎥⎥
⎦
⎤
⎢⎢⎢
⎣
⎡
⎟⎟
⎠
⎞
⎜⎜
⎝
⎛
+
++−⎟
⎟
⎠
⎞
⎜⎜
⎝
⎛
+
++=
)(32
)(34
)(2
)(0
1
1
1
1αβ
αα
αα
α
α
α
αδ adad FF
SFF
Ra
(Eq. 2.14)
The relationship between α and λ is given by
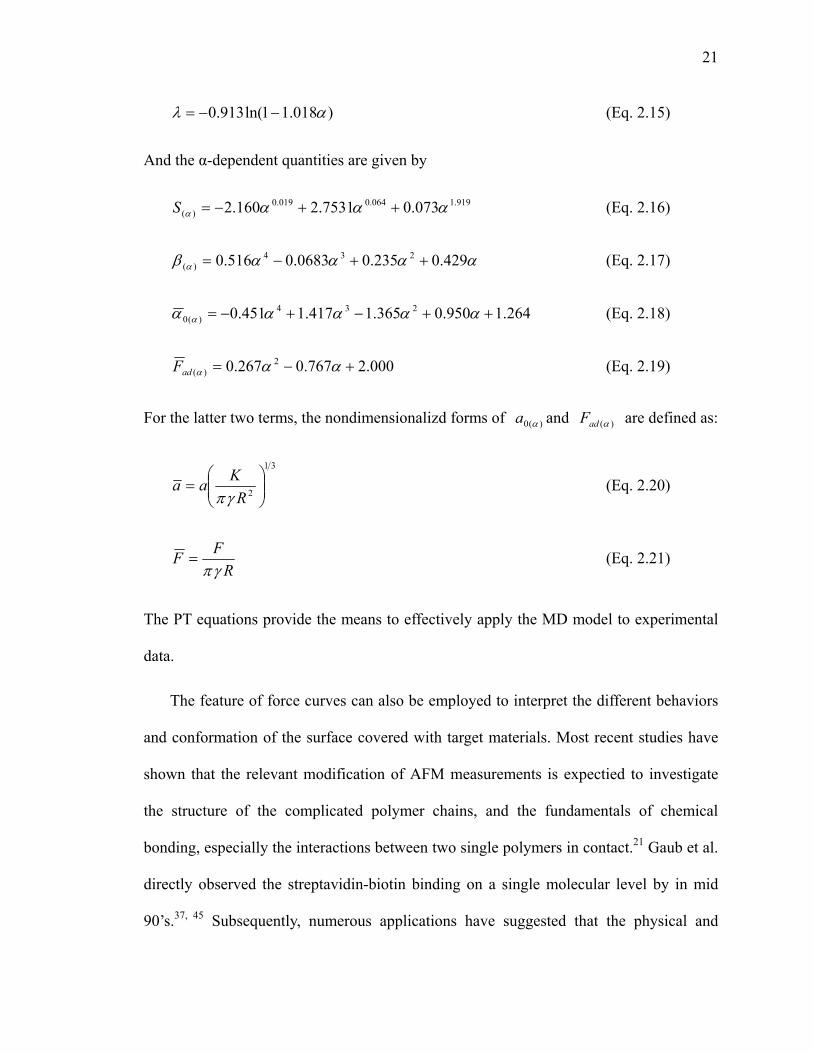
21
)018.11ln(913.0 αλ −−= (Eq. 2.15)
And the α-dependent quantities are given by
919.1064.0019.0)( 073.07531.2160.2 αααα ++−=S (Eq. 2.16)
ααααβ α 429.0235.00683.0516.0 234)( ++−= (Eq. 2.17)
264.1950.0365.1417.1451.0 234)(0 ++−+−= ααααα α (Eq. 2.18)
000.2767.0267.0 2)( +−= αααadF (Eq. 2.19)
For the latter two terms, the nondimensionalizd forms of )(0 αa and )(αadF are defined as:
31
2 ⎟⎟⎠
⎞⎜⎜⎝
⎛=
RKaaγπ
(Eq. 2.20)
RFFγπ
= (Eq. 2.21)
The PT equations provide the means to effectively apply the MD model to experimental
data.
The feature of force curves can also be employed to interpret the different behaviors
and conformation of the surface covered with target materials. Most recent studies have
shown that the relevant modification of AFM measurements is expectied to investigate
the structure of the complicated polymer chains, and the fundamentals of chemical
bonding, especially the interactions between two single polymers in contact.21 Gaub et al.
directly observed the streptavidin-biotin binding on a single molecular level by in mid
90’s.37, 45 Subsequently, numerous applications have suggested that the physical and
22
electrostatic information of polymeric materials, such as synthetic polymers,43, 53
nucleotides,28, 54 proteins,55, 56 natural polysaccharides,14, 40 and other biological
processes,57 could be revealed.
AFM technique using appropriate arrangements of molecules on the tip surface, also
called the chemical force microscopy (CFM), is able to ascertain the interactions between
expected functional groups.24, 25 In general, the experiment is executed by immobilization
or functionalization of low molecular weight molecules and solid functional groups for
the convenience of result interpretation.53, 58 Tip functionalization can be achieved by
coating the tip or sample surface with gold, then thiolated bifunctional molecules
molecules, followed by the reaction of bifunctional molecules with the target moleculs.53
In addition to the designed arrangement, many environmental parameters, such as
humidity, salt solution, and pH should be considered in CFM.59 Similar to the normal
force spectroscopy, adhesive forces are usually larger for by the specific binding pairs
between functional groups through hydrogen bonding, electrostatic bonding, or covalent
bonding, than those between bare tip and sample substrate. Therefore, when the sample
has a particular interaction, the higher energy is revealed. Force spectroscopy is a
convenient technique to detect the minor difference compared with the conventional
approaches, such as contact angle goniometry.25
II.4. Current Status of Research
When a protein and a polyelectrolyte are oppositely charged, they can form a
complex through electrostatic interaction. Various physico-chemical parameters can
23
influence the electrostatic interactions and the complex formation. It is well known that
pH plays a key role in the strength of electrostatic interaction since it determines the
charge density of the protein. The formation of electrostatic complexes has been
extensively reported in the literature for protein/synthetic polyelectrolyte systems.12, 60-62
These studies revealed that the complexation appeared as a two-step process upon pH
change. Indeed, two pH-induced structural transitions (pHc and pHφ) were identified. At
pHc, the formation of soluble complexes was initiated, and below pHφ, visible phase
separation occurred. Soluble complexes were often formed at pH values above the
isoelectric point (pI) of the protein, i.e., at a pH where the protein is negatively charged
overall, like the polyelectrolyte.62, 63 Recently, de Vries et al. (2003) 63 proposed a model
for the formation of soluble protein-polysaccharide complexes incorporating the non
homogeneous charge distribution along the protein backbone. They were able to predict
the complexation above the protein pI, due to the presence of randomly charged patches
on the surface of the proteins. The existence of two major structural transitions during the
complex formation was also shown for β-lactoglobulin(β-lg)/pectin.64 Thus, for all
systems studied, the process of complex formation can be explained by the formation of
(i) intrapolymeric soluble complexes at pHc, (ii) interpolymeric soluble and insoluble
complexes, and (iii) insoluble complexes and macroscopic phase separation at pHφ
(coacervation or precipitation). Most of the references given above dealt mainly with the
liquid / liquid complex coacervation phenomenon. Therefore, this study aims at reporting
research made on protein/polysaccharide complexes (coacervates or precipitates) as well
as their rheological properties.65-67
As mentioned above, AFM has been used to characterize various fields, ranging from
24
the topographical analysis to the evaluation of mechanical characteristics of polymer
molecules and biological materials. In addition, a wide variety of polymers, including
block copolymer, random block copolymers and homopolymers have been studied. They
all exhibit the characteristic force distance profile during polymer stretching. The
response of polymers under stretching has not been extensively studied, especially when
the polymer is mixed with a protein. Therefore, a systematic investigation of the
nanoscale mechanical properties of protein/polysaccharide complexes needs to be carries
out.
II.5. References
1. Sanchez C, Schmitt C, Babak VG, Hardy J. 1997. Rheology of whey protein isolate-xanthan mixed solutions and gels. Effect of pH and xanthan concentration. Food / Nahrung. 41(6):336-43.
2. Bungenberg de Jong HG. 1949. In: Kruyt HR,·editor. editors. Colloid science. New York: Elsevier Science Publishing Co., Inc. Vol.·2.
3. Piculell L, Bergfeldt K, Nilsson S. 1995. Factor determining phase behavior of multi-component polymer systems. In: Harding SE, Hill SE, Mitchell JR, editors. Biopolymer mixtures. Nottingham: Nottingham University Press. p·13-36.
4. Dickinson E, Pawlowsky K. 1998. Influence of κ-carrageenan on the properties of a protein-stabilized emulsion. Food Hydrocolloids. 12(4):417-23.
5. Galazka VB, Smith D, Ledward DA, Dickinson E. 1999. Complexes of bovine serum albumin with sulphated polysaccharides: effects of pH, ionic strength and high pressure treatment. Food Chemistry. 64(3):303-10.
6. Neiser S, Draget KI, Smidsrod O. 2000. Gel formation in heat-treated bovine serum albumin-κ-carrageenan systems. Food Hydrocolloids. 14(2):95-110.
7. de Kruif CG, Weinbreck F, de Vries R. 2004. Complex coacervation of proteins and anionic polysaccharides. Current Opinion in Colloid & Interface Science. 9(5):340-9.
25
8. Schmitt C, Sanchez C, Thomas F, Hardy J. 1999. Complex coacervation between β-lactoglobulin and acacia gum in aqueous medium. Food Hydrocolloids. 13:483-96.
9. Tolstoguzov V. 2003. Some thermodynamic considerations in food formulation. Food Hydrocolloids. 17(1):1-23.
10. Turgeon SL, Beaulieu M, Schmitt C, Sanchez C. 2003. Protein-polysaccharide interactions: phase-ordering kinetics, thermodynamic and structural aspects. Current Opinion in Colloid & Interface Science. 8(4-5):401-14.
11. Hashidzume A, Ohara T, Morishima Y. 2002. Coacervation of hydrophobically modified polyanions by association with nonionic surfactants in water. Langmuir. 18(24):9211-8.
12. Wang Yf, Gao JY, Dubin PL. 1996. Protein separation via polyelectrolyte coacervation: Selectivity and efficiency. Biotechnol. Prog. 12(3):356-62.
13. Mitsui K, Hara M, Ikai A. 1996. Mechanical unfolding of alpha-2-macroglobulin molecules with atomic force microscope. FEBS Letters. 385(1-2):29-33.
14. Li H, Rief M, Oesterhelt F, Gaub HE, Zhang X, Shen J. 1999. Single-molecule force spectroscopy on polysaccharides by AFM - nanomechanical fingerprint of [alpha]-(1,4)-linked polysaccharides. Chemical Physics Letters. 305(3-4):197-201.
15. Xu Q, Zou S, Zhang W, Zhang X. 2001. Single-molecule force spectroscopy on carrageenan by means of AFM. Macromolecular Rapid Communications. 22(14):1163-7.
16. Rief M, Clausen-Schaumann H, Gaub HE. 1999. Sequence-dependent mechanics of single DNA molecules. Nature Structural Biology. 6(4):346-9.
17. Florin EL, Moy VT, Gaub HE. 1994. Adhesion forces between individual ligand-receptor pairs. Science (Washington, DC, United States). 264(5157):415-7.
18. Ikai A, Xu X-M, Mitsui K. 1998. Measurement of mechanical parameters of biological structures with atomic force microscope. Scanning Microscopy. 12(4):585-98.
19. Kokkoli E, Ochsenhirt SE, Tirrell M. 2004. Collective and single-molecule interactions of α−5−β-1 integrins. Langmuir. 20(6):2397-404.
20. Bemis JE, Akhremitchev BB, Walker GC. 1999. Single polymer chain elongation by atomic force microscopy. Langmuir. 15(8):2799-805.
26
21. Fisher TE, Marszalek PE, Oberhauser AF, Carrion-Vazquez M, Fernandez JM. 1999. The micro-mechanics of single molecules studied with atomic force microscopy. Journal of Physiology. 520(1):5-14.
22. Zou S, Zhang W, Zhang X, Jiang B. 2001. Study on polymer micelles of hydrophobically modified ethyl hydroxyethyl cellulose using single-molecule force spectroscopy. Langmuir. 17(16):4799-808.
23. Zhang W, Zou S, Wang C, Zhang X. 2000. Single polymer chain elongation of poly(N-isopropylacrylamide) and poly(acrylamide) by atomic force microscopy. J. Phys. Chem. B. 104(44):10258-64.
24. Hugel T, Seitz M. 2001. The study of molecular interactions by AFM force spectroscopy. Macromolecular Rapid Communications. 22(13):989-1016.
25. Janshoff A, Neitzert M, fer YO, Fuchs H. 2000. Force spectroscopy of molecular systems-single molecule spectroscopy of polymers and biomolecules. Angewandte Chemie. 39(18):3212-37.
26. Rief M, Gautel M, Oesterhelt F, Fernandez JM, Gaub HE. 1997. Reversible unfolding of individual titin immunoglobulin domains by AFM. Science. 276(5315):1109-12.
27. Rief M, Gautel M, Schemmel A, Gaub HE. 1998. The mechanical stability of immunoglobulin and fibronectin III domains in the muscle protein titin measured by atomic force microscopy. Biophysical Journal. 75(6):3008-14.
28. Lee GU, Chrisey LA, Colton RJ. 1994. Direct measurement of the forces between complementary strands of DNA. Science (Washington, D. C.). 266(5186):771-3.
29. Binnig G, Quate CF, Gerber C. 1986. Atomic force microscope. Physical Review Letters. 56:930-3.
30. Camesano TA, Wilkinson KJ. 2001. Single molecule study of xanthan conformation using atomic force microscopy. Biomacromolecules. 2(4):1184-91.
31. Jalili N, Laxminarayana K. 2004. A review of atomic force microscopy imaging systems: application to molecular metrology and biological sciences. Mechatronics. 14(8):907-45.
32. Maurstad G, Danielsen S, Stokke BT. 2003. Analysis of compacted semiflexible polyanions visualized by atomic force microscopy: Influence of chain stiffness on the morphologies of polyelectrolyte complexes. J. Phys. Chem. B. 107(32):8172-80.
27
33. Mazzola LT. Probing biomolecular recognition using atomic force microscopy. Stanford University, Stanford, CA, 1999.
34. Keresztes Z, Rigo T, Telegdi J, Kalman E. 2001. Investigation of biopolymer networks by means of AFM. Applied Physics A: Materials Science & Processing. 72(7):S113-S6.
35. Smith DPE, Binnig G, Quate CF. 1986. Atomic point-contact imaging. Applied Physics Letters. 49(18):1166-8.
36. Heymann B, Grubmuller H. 2000. Dynamic force spectroscopy of molecular adhesion bonds. Physical Review Letters. 84(26, Pt. 1):6126-9.
37. Rief M, Oesterhelt F. 1997. Single molecule force spectroscopy on polysaccharides by atomic force microscopy. Science. 275(5304):1295-7.
38. Abu-Lail NI, Camesano TA. 2002. Elasticity of Pseudomonas putida KT2442 surface polymers probed with single-molecule force microscopy. Langmuir. 18(10):4071-81.
39. Hugel T, Grosholz M, Clausen-Schaumann H, Pfau A, Gaub H, Seitz M. 2001. Elasticity of single polyelectrolyte chains and their desorption from solid supports studied by AFM based single molecule force spectroscopy. Macromolecules. 34(4):1039-47.
40. Li H, Rief M, Oesterhelt F, Gaub HE. 1998. Single-molecule force spectroscopy on xanthan by AFM. Advanced Materials. 10(4):316-9.
41. Lu Z, Nowak W, Lee G, Marszalek PE, Yang W. 2004. Elastic properties of single amylose chains in water: A quantum mechanical and AFM study. J. Am. Chem. Soc. 126(29):9033-41.
42. Uricanu VI, Duits MHG, Nelissen RMF, Bennink ML, Mellema J. 2003. Local structure and elasticity of soft gelatin gels studied with atomic force microscopy. Langmuir. 19(20):8182-94.
43. Li H, Liu B, Zhang X, Gao C, Shen J, Zou G. 1999. Single-molecule force spectroscopy on poly(acrylic acid) by AFM. Langmuir. 15(6):2120-4.
44. Smith BL, Schaffer TE, Viani M, Thompson JB, Frederick NA, Kindt J, Belcher A, Stucky GD, Morse DE, Hansma PK. 1999. Molecular mechanistic origin of the toughness of natural adhesives, fibres and composites. Nature. 399(6738):761-3.
45. Moy VT, Florin E-L, Gaub HE. 1994. Intermolecular forces and energies between ligands and receptors. Science (Washington, DC, United States).
28
266(5183):257-9.
46. Round AN, Yan B, Dang S, Estephan R, Stark RE, Batteas JD. 2000. The influence of water on the nanomechanical behavior of the plant biopolyester cutin as studied by AFM and solid-state NMR. Biophys. J. 79(5):2761-7.
47. Johnson KL, Kendall K, Roberts AD. 1971. Surface energy and the contact of elastic solids. Proceedings of the Royal Society of London. Series A, Mathematical and physical sciences (1934-1990). 324(1558):301-13.
48. Derjaguin BV, Muller VM, Toporov YP. 1975. Effect of contact deformations on the adhesion of particles. Journal of Colloid and Interface Science. 53(2):314-26.
49. Maugis D. 1992. Adhesion of spheres: The JKR-DMT transition using a dugdale model. Journal of Colloid and Interface Science. 150(1):243-69.
50. Tabor D. 1977. Surface forces and surface interactions. Journal of Colloid and Interface Science. 58(1):2-13.
51. Roesch R, Cox S, Compton S, Happek U, Corredig M. 2004. Κ-carrageenan and β-lactoglobulin interactions visualized by atomic force microscopy. Food Hydrocolloids. 18(3):429-39.
52. Pietrement O, Troyon M. 2000. General equations describing elastic indentation depth and normal contact stiffness versus load. Journal of Colloid and Interface Science. 226(1):166-71.
53. Friedsam C, Becares AzDC, Jonas U, Gaub HE, Seitz M. 2004. Polymer functionalized AFM tips for long-term measurements in single-molecule force spectroscopy. ChemPhysChem. 5(3):388-93.
54. Jiang Y, Qin F, Li Y, Fang X, Bai C. 2004. Measuring specific interaction of transcription factor ZmDREB1A with its DNA responsive element at the molecular level. Nucl. Acids Res. 32(12):e101(7 pages).
55. Makarov DE, Wang Z, Thompson JB, Hansma HG. 2002. On the interpretation of force extension curves of single protein molecules. Journal of Chemical Physics. 116(17):7760-5.
56. Weisel JW, Shuman H, Litvinov RI. 2003. Protein-protein unbinding induced by force: Single-molecule studies. Current Opinion in Structural Biology. 13(2):227-35.
57. Lehenkari PP, Charras GT, Nesbitt SA, Horton MA. 2000. New technologies in scanning probe microscopy for studying molecular interactions in cells. Expert
29
reviews in molecular medicine [electronic resource]. 2000:1-19.
58. Ortiz C, Hadziioannou G. 1999. Entropic elasticity of single polymer chains of poly(methacrylic acid) measured by atomic force microscopy. Macromolecules. 32(3):780-7.
59. Noy A, Zepeda S, Orme CA, Yeh Y, De Yoreo JJ. 2003. Entropic barriers in nanoscale adhesion studied by variable temperature chemical force microscopy. J. Am. Chem. Soc. 125(5):1356-62.
60. Kaibara K, Okazaki T, Bohidar HB, Dubin PL. 2000. pH-Induced coacervation in complexes of bovine serum albumin and cationic polyelectrolytes. Biomacromolecules. 1(1):100-7.
61. Mattison KW, Dubin PL, Brittain IJ. 1998. Complex formation between bovine serum albumin and strong polyelectrolytes: Effect of polymer charge density. J. Phys. Chem. B. 102(19):3830-6.
62. Wen Yp, Dubin PL. 1997. Potentiometric studies of the interaction of bovine serum albumin and poly(dimethyldiallylammonium chloride). Macromolecules. 30(25):7856-61.
63. de Vries R, Weinbreck F, de Kruif CG. 2003. Theory of polyelectrolyte adsorption on heterogeneously charged surfaces applied to soluble protein-polyelectrolyte complexes. Journal of Chemical Physics. 118(10):4649-59.
64. Girard M, Turgeon SL, Gauthier SF. 2003. Thermodynamic parameters of β-lactoglobulin-pectin complexes assessed by isothermal titration calorimetry. J. Agric. Food Chem. 51(15):4450-5.
65. Bohidar H, Dubin PL, Majhi PR, Tribet C, Jaeger W. 2005. Effects of protein-polyelectrolyte affinity and polyelectrolyte molecular weight on dynamic properties of bovine serum albumin-poly(diallyldimethylammonium chloride) coacervates. Biomacromolecules. 6(3):1573-85.
66. Weinbreck F, Nieuwenhuijse H, Robijn GW, de Kruif CG. 2004. Complexation of whey proteins with carrageenan. J. Agric. Food Chem. 52(11):3550-5.
67. Weinbreck F, Tromp RH, de Kruif CG. 2004. Composition and structure of whey protein/gum Arabic coacervates. Biomacromolecules. 5(4):1437-45.
30
III. EXPERIMENTAL PROCEDURES
III.1. Materials
Bovine serum albumin (BSA), κ-, ι-, λ-carrageenan, and sodium alginate were
purchased from Sigma Chemical Co. (St. Louis, MO) and used without further
purification. Furcelleran was kindly provided by Dr. James J. Modliszewski of FMC
(Princeton, NJ). Pectin with 31% esterification obtained from Danisco A/S (Denmark)
was purified by dialysis, followed by freeze-drying. The average molecular weight (MW)
of pectin determined by gel filtration chromatography was 7.0 × 10⁵.
Standard NaOH (0.1 N), HCl (0.1 N), and analytical-grade salts like NaCl, KCl, LiCl,
and N(CH3)4Cl were purchased from Aldrich Chemical Co. (Milwaukee, WI). All
solutions were prepared with Milli-Q water (Millipore, Milford, MA) and filtered with
0.45 µm syringe filters.
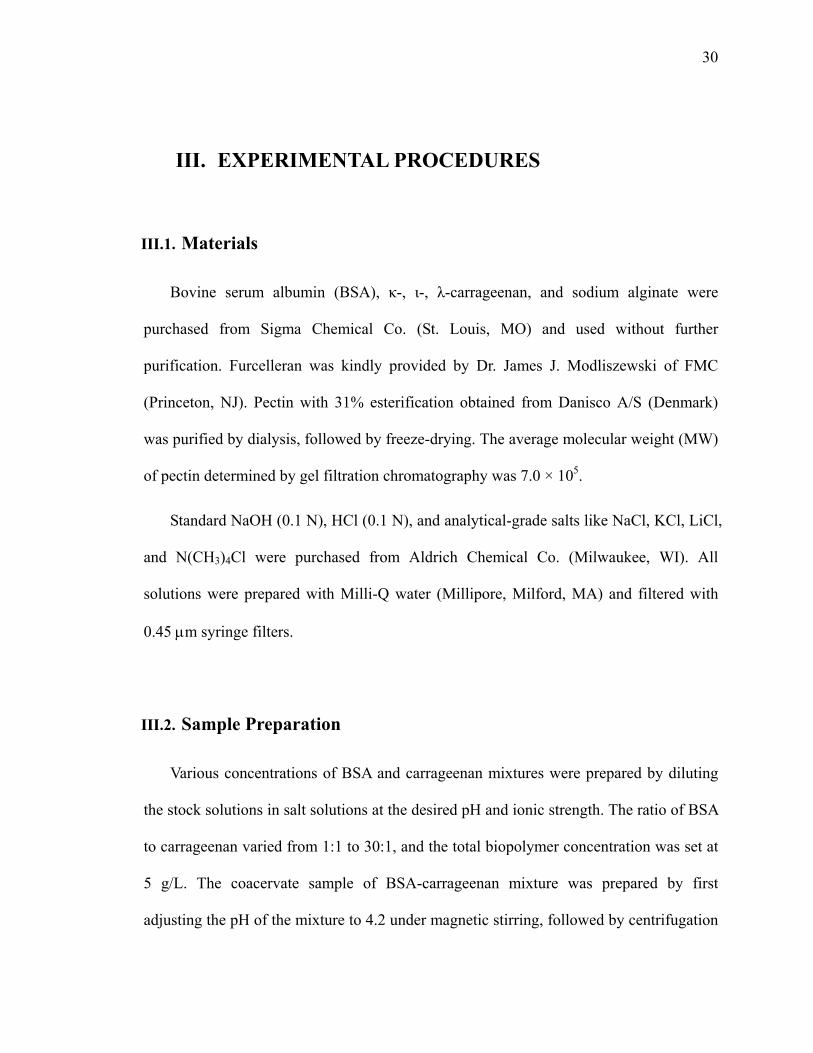
III.2. Sample Preparation
Various concentrations of BSA and carrageenan mixtures were prepared by diluting
the stock solutions in salt solutions at the desired pH and ionic strength. The ratio of BSA
to carrageenan varied from 1:1 to 30:1, and the total biopolymer concentration was set at
5 g/L. The coacervate sample of BSA-carrageenan mixture was prepared by first
adjusting the pH of the mixture to 4.2 under magnetic stirring, followed by centrifugation
31
at spin-speed of 6,000 RPM.
BSA-pectin coacervates were prepared as well as BSA-carrageenan. The ratio of
BSA-pectin varied from 1:1 to 20:1, and the concentration of NaCl was changed up to 0.8
M when both stock solutions of BSA and pectin were initially made.
III.3. Techniques for Physical Characterization
III.3.1. Potentiometric Titration
pH of protein/polysaccharide solution was measured with a VWR pH meter equipped
with a combination electrode under nitrogen atmosphere at 24±1 °C. All titrations were
accompanied with a protein-free blank.
III.3.2. Turbidity Measurements
The pH dependence of turbidity was measured using a Brinkman PC 910 colorimeter
equipped with a 1cm path length optical probe and a 420 nm filter, also at 24±1 °C. The
colorimeter was calibrated to read 100% transmittance with Milli-Q water. The solutions
were filtered with 0.22 µm Whatman filters before turbidimetric titration. All titrations
were carried out with magnetic stirring, and the time interval between measurements was
fixed at 1 min. After mixing, solutions with transmittance corresponding to (100-T%)<3
were always stable with respect to both turbidity and DLS measurements.
32
III.3.3. Dynamic Light Scattering (DLS) Measurements
DLS measurements were performed using a Brookhaven 90 Plus Dynamic Light
Scattering Apparatus equipped with a BI-9000AT autocorrelator, a 658 nm solid state
laser of 30 mW power, and an avalanche photodiode detector. All solutions were filtered
with 0.1 µm Anotec filters into the 1 mL cell. The intensity-intensity autocorrelation
function G(τ) is related to the electric field correlation function g(q, t) through the Siegert
relation:1
)],(1[),( 2 tqbgAtqG += (Eq. 3.1)
where A is the experimental baseline, and b is the spatial coherence factor, which depends
upon the scattering geometry and details of the detection system. A William-Watts (WW)
single stretched exponential function given by
])/(exp[),( βτttqg −= (Eq. 3.2)
was used to obtain the relaxation time. The diffusion coefficient D was then calculated
according to 2qD Γ= , where q is the amplitude of scattering vector defined as
)2/sin()/4( θλπnq = , n is the solution refractive index, λ is the laser wavelength, and θ is
the scattering angle. The diffusion coefficient D can be obtained from the apparent
hydrodynamic radius Rh using the Stokes-Einstein equation:
DkTRh πη6
= (Eq. 3.3)
where k is the Boltzmann constant, T is the absolute temperature, and η is the solvent
viscosity.
33
III.3.4. Force Spectroscopy
III.3.4.1. Tip Functionization
Usually triangular-shaped silicon nitride cantilevers (DI Instruments, Veeco, Santa
Barbara, CA) were used in the force measurements. For the research of interaction
between BSA and κ-carrageenan, silicon nitride tips were coated with ca. 2 nm Ti and ca.
70 nm Au in high vacuum. Gold-coated tip was functionalized with BSA through self-
assembly in 5 g/L of BSA solution for 24 hrs and followed by washing the residue of
BSA.
III.3.4.2. Atomic Force Microscopy Measurements
Polymer films were made by two different ways, one is spin coating and the other is
solution-dipping method. Silicon wafers were employed as the solid substrates in both
approaches after being cleaned with piranha solution [mixture of sulfuric acid and
hydrogen peroxide (3:1)]. When mica was used as the substrate, fresh mica surface was
prepared after peeling off the top layer right before AFM measurements.
The AFM measurements were carried out with a NanoScope IIIa Multimode AFM
apparatus (DI Instruments, Veeco, Santa Barbara, CA) in a liquid cell. The spring
constants of the cantilevers provided by the manufacturer were used in the force
calculation. Prior to the experiments, the AFM setup was equilibrated in the buffer of
desired pH and ionic strength until the thermo drift was eliminated. The force
34
measurements were performed with BSA-modified tips. For quantitative analysis, more
than 150 force curves of a given condition were collected and analyzed. Detailed
experimental conditions and method are described in each chapter.
The cantilever sensitivity (V/nm) was calculated from the slope of retracting curve
where the repulsive forces were dominant. The deflection measured in nm was calculated
by the deflection voltage divided by the cantilever sensitivity, and the extension between
sample and cantilever was able to be calculated from the sum of deflection and the height
signal. The observed individual pull-off events were analyzed individually and plotted in
histograms.
III.3.5. Rheological Measurements
Dynamic viscoelastic measurements of this study were performed using Advanced
Rheometric Expansion System2 (ARES, TA Instruments, New Castle, U.S.A.) with either
parallel plates geometry (25 or 50 mm in diameter) or couvette geometry (32 mm o.d.
bob and 34 mm i.d. cup) according to the strength of the torque. Each measurement was
conducted at 23±1 °C . For static rheological measurements, viscosity and shear stress
were observed at the shear rate range from 0.1 to 103 sec-1. For the measurements of
dynamic modulus, samples were loaded onto the plate for 10 min to allow the stresses to
relax and for thermal equilibration. Storage modulus (G') and loss modulus (G") were
measured in the angular range of 0.1 to 100 rad/sec.
Before all the rheological measurements, strain sweep test and stress sweep test were
performed to find out the proper conditions of ARES operation. According to the visible
35
phase of sample, the same geometry of serrated plate was used in order to prevent water
evaporation from the samples.
III.3.6. Contact Angle Measurement
All contact angles were measured by VCA Optima Surface Analysis System (AST
Products, Inc., Billerica, MA) with a microscope for visualization. A fixed amount of
solvent was placed onto the surface by motorized syringe, and a photograph was
subsequently taken. Images of liquid droplets were analyzed using the software provided
by the manufacturer. The contact angle measurement was duplicated at more than 5
different locations.
III.4. References
1. Berne BJ, Pecora R. 1976. Dynamic light scattering with application to chemistry, biology and physics. New York: Wiley-Interscience. 376·p.
2. Friedsam C, Becares AzDC, Jonas U, Gaub HE, Seitz M. 2004. Polymer functionalized afm tips for long-term measurements in single-molecule force spectroscopy. ChemPhysChem. 5(3):388-93.
36
IV. NANOSCALE MECHANICAL PROPERTIES OF
ALGINATE AND CARRAGEENAN FILMS
IV.1. Introduction
Water-soluble polysaccharides, also called hydrocolooids, have been used as
enhancer of solubility and texture in the food products, or served as thickening agents,
emulsifiers, and stabilizers, because they tend to form thermoreversible gels at low
quantity in an aqueous system.1-4 Intermolecular or intramolecular binding of
polysaccharides and water influences the rheological properties of the final products. This
characteristics becomes more complicated in the presence of salts, either cation or anion,
when the charged functional group exist in the chains of polysaccharides. Although
chemical reaction doesn’t occur between salt ions and the hydrolyzed polysaccharide,
changes in viscosity, elasticity, flowability, and stability of systems will occur.
Algal polysaccharides are able to affect the physico-chemical properties of the food
system.5,6 Alginate, also called alginic acid, is derived from brown algae (Phaeophyceae,
mainly Laminaria), and has been widely used in the preparation of antacid pills, in
dentistry and orthodontics, and in textiles.5, 7, 8 It is also used to give viscosity and to firm
jellies in the food industry. Alginate is known as a linear polymer composed of certain
sugar-repeating units; D-mannuronic acid (M) and L-guluronic acid (G), on the basis
upon the linkage of a bendable chain shown in Figure 4.1.6, 9 Depending on the source of
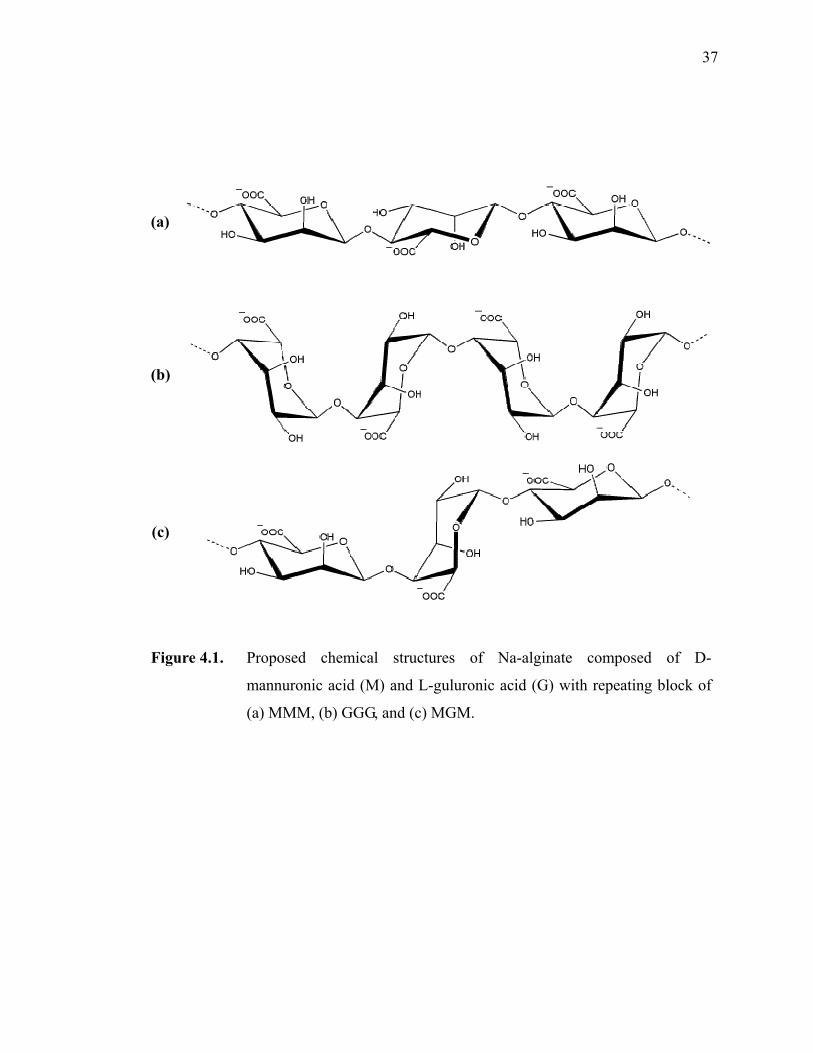
37
(a)
(b)
(c)
Figure 4.1. Proposed chemical structures of Na-alginate composed of D-
mannuronic acid (M) and L-guluronic acid (G) with repeating block of
(a) MMM, (b) GGG, and (c) MGM.

38
seaweed and growing condition, alginate with different structure and composition of
structural units can be obtained, resulting in the difference in the chemical and physical
properties of the alginate molecules. In addition to the structural difference of alginate,
calcium ions or other multivalent cations can be associated into the guluronate block
structures and made the alginate chains cross-link together, resulting in the gelation of
solution. An alginate gel is capable of holding the water molecules, causing the overall
changes of rheological properties in the system. Higher level of guluronic acid brings the
stronger interaction in the alginate polymers with stronger gel strength. However, it is not
only related with the popularity of guluronic acid, but also various factors such as pH,
solubility, and temperature, as well as the concentration of calcium ions.9-11
Carrageenan is a common name for a family of natural, water-soluble, sulphated
galactans that are isolated from red seaweeds (the Rhodophyceae containing Chondrus
crispus, Gigartina mamillosa, Gigartina stellata), and exploited on a commercial scale.
They are traditionally used as high-quality ingredients in food and cosmetics.3, 7, 12 The
three main commercial carrageenans are κ-, ι-, and λ-carrageenan, each of these being
both a general commercial name and a name that specifies the major substitution pattern
that is present in the 'ideal' galactan backbone (Figure 4.2).3, 13 An alternating 3-linked-β-
D-galactopyranose and 4-linked-α-D-galactopyranose is the basic unit of carrageenans.
Molecular structure of carrageenan is imprecise, depending on the source and extraction
conditions. The linear charge densities of λ-, ι-, κ-carrageenan, and furcelleran are 2.07,
1.53, 0.92, and 0.69, respectively, according to the sulphate group at different positions
and with different distributions. Additionally, the pKa for either carrageenan or
furcelleran was suggested to be around or below 3.
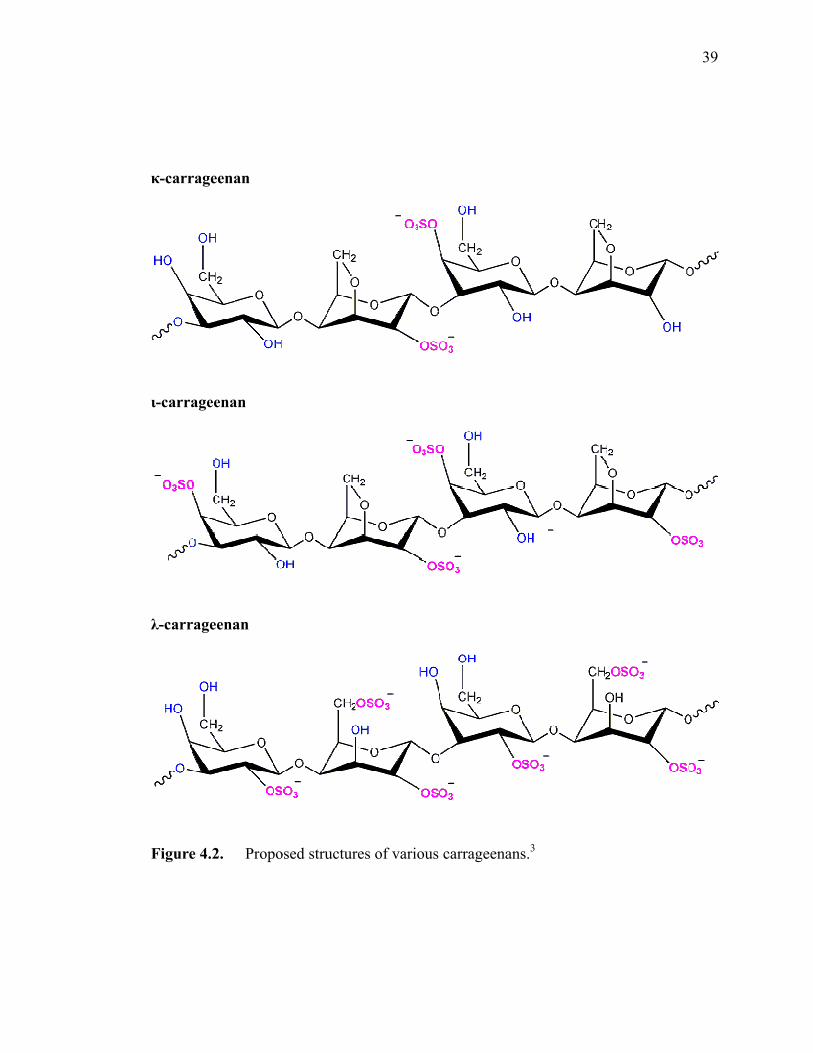
39
κ-carrageenan
ι-carrageenan
λ-carrageenan
Figure 4.2. Proposed structures of various carrageenans.3
40
Important aspects of the science of carrageenans have been summarized in review
articles on the biology of seaweeds, the rheology and applications of carrageenan, and the
biomedical applications of marine polysaccharides.3, 7, 12 Since the sulphate groups are
important structural substituents of the galactose backbonethey can influence the
functional properties of carrageenans, and carrageenans’ applications in foods, cosmetics,
and biomedical research.
The sulphate ester groups and the 3,6-anhydrogalactose rings are essential for the
physicochemical properties of the respective carrageenans, their helix formation, and
consequently their rheological properties and applications. Typically, κ-carrageenan
forms firm and brittle gels that can undergo syneresis (exudation of water), whereas ι-
carrageenan forms elastic and soft gels that usually do not undergo syneresis; and the
non-gelling λ-carrageenan is often used as a thickening agent. The gelation of a
carrageenan solution is induced by cooling a hot solution that contains gel-inducing
cations such as K+ and Ca2+. The Na+-form of either κ- or ι-carrageenans may not yield a
gel, but the addition of a gelling salt instantly induces gelation. A detailed mechanism of
gelation is not yet available, but there is a consensus that gel formation involves a
conformational transition from random coil to helix form. Carrageenans have a
significant reactivity with milk proteins, making them valuable hydrocolloids for use in
the dairy industry.3
Especially these algal polysaccharides have considerable changes on their chemical
structure with various cations, resulting in the unique physicochemical and rheological
properties. Although lots of methodologies have been developed for the fine features of
41
these polysaccharides, it still lacks the detailed verification for the effect of the cation in
most liquid or fluid systems. The aim of this chapter is to attempt to use as start-of-the art
technology, AFM, give the detailed information on the physicochemical characteristics of
polysaccharides.14
IV.2. Materials and Methods
IV.2.1. Contact Angle Measurements
5 g/L of Na-alginate solutions were prepared and spin-coated on the mica substrate at
3000 rpm for 10 seconds. All the contact angles were measured by VCA Optima Surface
Analysis System (AST Products, Inc., Billerica, MA) with a microscope for visualization.
A fixed amount of solvent was placed onto the surface by motorized syringe, and a
photograph was subsequently taken. Images of liquid droplets were analyzed using the
software provided by the manufacturer. Static contact angles at three different time
periods (1 min, 2 min, and 3 min) were monitored. The contact angle measurement was
duplicated at more than 5 different locations.
IV.2.2. Force Measurements
Polymer films of Na-alginate and κ-carrageenan were made by spin coating. When
mica was used as the substrate, fresh mica surface was prepared after peeling off the top
layer right before AFM measurements. The AFM measurements were carried out with a
42
NanoScope IIIa Multimode AFM (DI Instruments, Veeco, Santa Barbara, CA) in a liquid
cell. The spring constants of the cantilevers provided by the manufacturer were used in
the force calculation. Prior to the experiments, the AFM setup was equilibrated in the
buffer of desired salt and ionic strength until the thermo drift was eliminated. For
quantitative analysis, more than 500 force curves of a given condition were collected and
analyzed.
IV.2.3. Rheological Measurements
κ- (C-1013; Lot. 121K1653), ι-(C-1138; Lot. 81K1556), and λ-(C-3889; Lot.
062K1766) carrageenan were purchased from Sigma Chemical Co. (St. Louis, MO) and
used without further purification. Furcelleran was kindly provided by Dr. James J.
Modliszewski of FMC (Princeton, NJ). Salts like NaCl, KCl, LiCl, and N(CH3)4Cl) were
purchased from Aldrich Chemical Co. (Milwaukee, WI). All solutions were prepared with
Milli-Q water (Millipore, Milford, MA) and filtered with 0.45 µm syringe filters. The
contration of NaCl varied from 0 M to 0.6 M, and 0.1 M of salt concentration was fixed
for salt-dependent measurement.
Static shear flow measurements of the various carrageenan solutions were performed
using Advanced Rheometric Expansion System (ARES) (Rheometrics, Piscataway, NJ).
For the measurement of concentric cylinder geometry, the couette used has 32 mm o.d.
bob and 34 mm i.d. cup. Each measurement was conducted at room temperature.
IV.3. Results and Discussion
43
IV.3.1. Characteristics of Na-alginate
It is well known that Na-alginate can make a gel easily with calcium ion due to the
formation of chelation complex. In order to understand the surface characteristics of
alginate films with calcium ion, contact angle measurements were first carried out on the
alginate film-covered mica substrate. Contact angles of liquids on polymer surfaces are
generally applied to interpret the properties of wetting and adhesion on solid surface. In
the experimental aspect, it is normally found that contact angle of the polymer surfaces
are affected not only by the interfacial tensions according to Young´s equation, but also
by many other combined parameters, such as surface roughness, heterogeneity of
chemical structure, swelling, and partial sorption of the polymer material. When the
contact angles are measured and calculated for the solid surface tension of polymers,
these effective parameters are required to be considered.
In this chapter, however, we raise the question of its accuracy and the physical
meaning in accord with Kwok, et al.15 They proposed that a shape analysis of the drop for
measuring contact angles could be meaningless since the surface tension is dependent
upon the solid-vapor reaction and very sensitive due to the contact area with the liquid.
Also experimentally measured contact angles can be changed during the contact with the
solid surface by vaporization and surface area could be changed. Therefore, water contact
angles cannot be used in combination with Young`s equation. Although Table 4.1 shows
the slight effect of salt on the Na-alginate film, such a short time elapsed influences on
the data interpretation shown in Table 4.2.
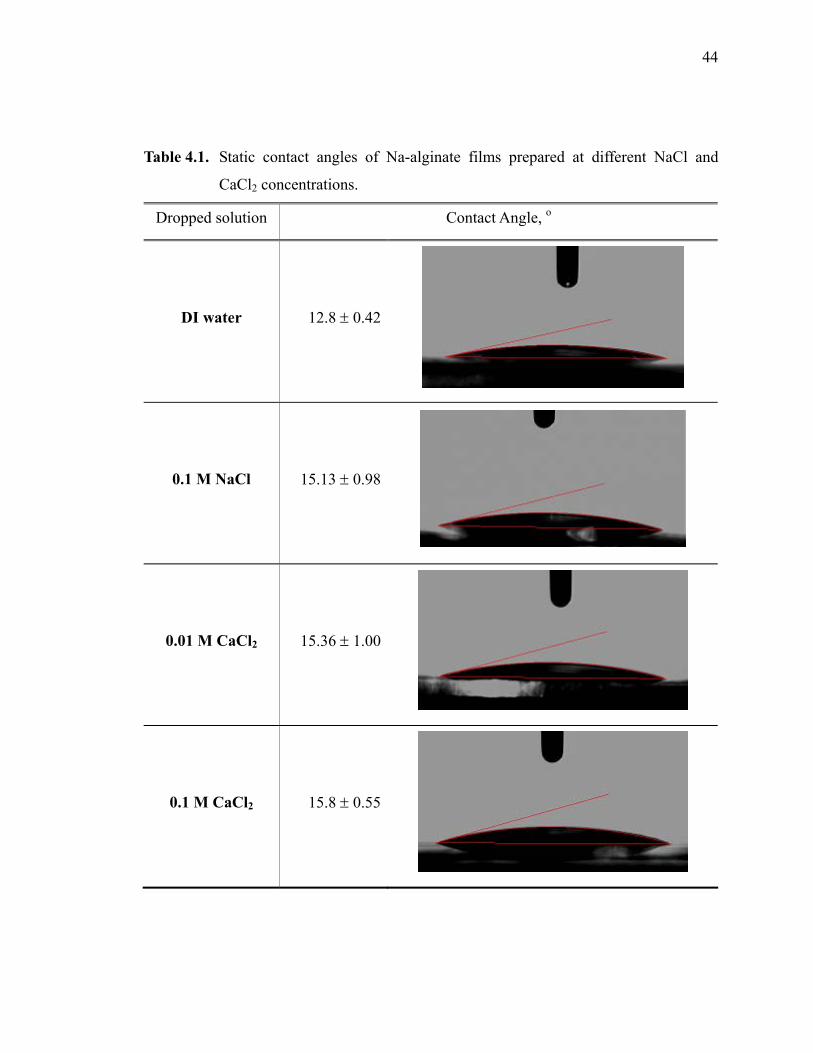
44
Table 4.1. Static contact angles of Na-alginate films prepared at different NaCl and
CaCl2 concentrations.
Dropped solution Contact Angle, o
DI water 12.8 ± 0.42
0.1 M NaCl 15.13 ± 0.98
0.01 M CaCl2 15.36 ± 1.00
0.1 M CaCl2 15.8 ± 0.55
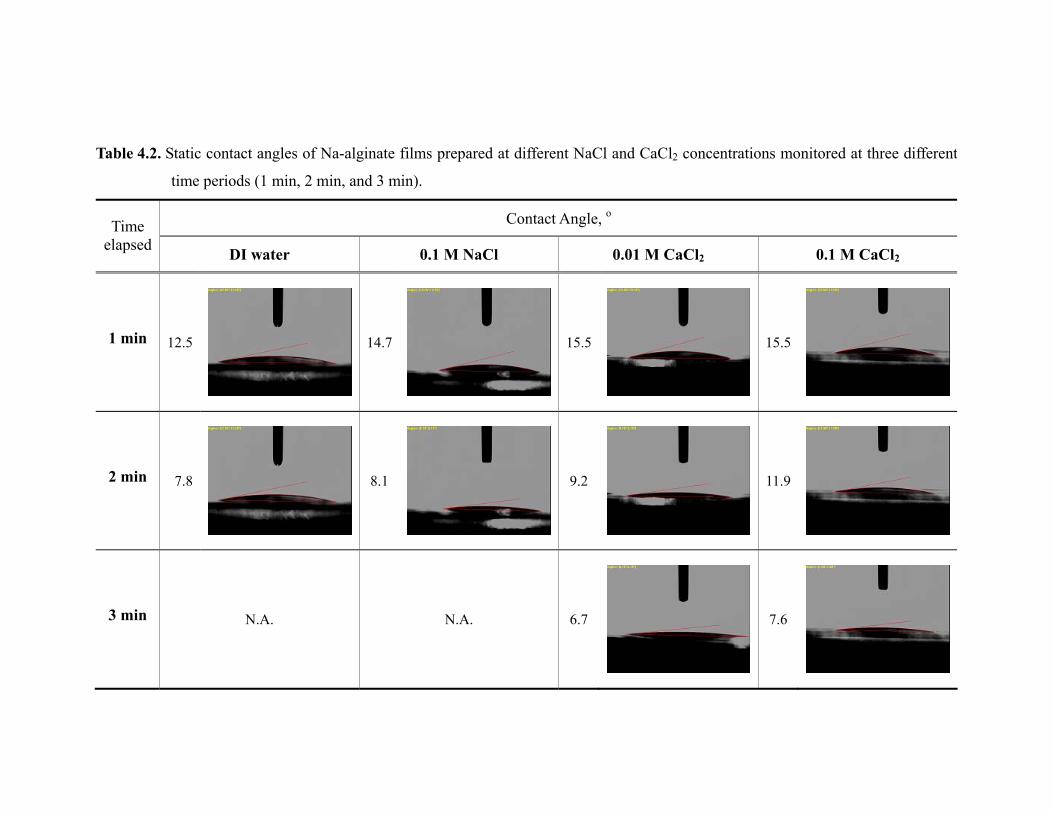
Table 4.2. Static contact angles of Na-alginate films prepared at different NaCl and CaCl2 concentrations monitored at three different
time periods (1 min, 2 min, and 3 min).
Contact Angle, o Time elapsed DI water 0.1 M NaCl 0.01 M CaCl2 0.1 M CaCl2
1 min 12.5 14.7 15.5 15.5
2 min 7.8 8.1 9.2 11.9
3 min N.A. N.A. 6.7 7.6
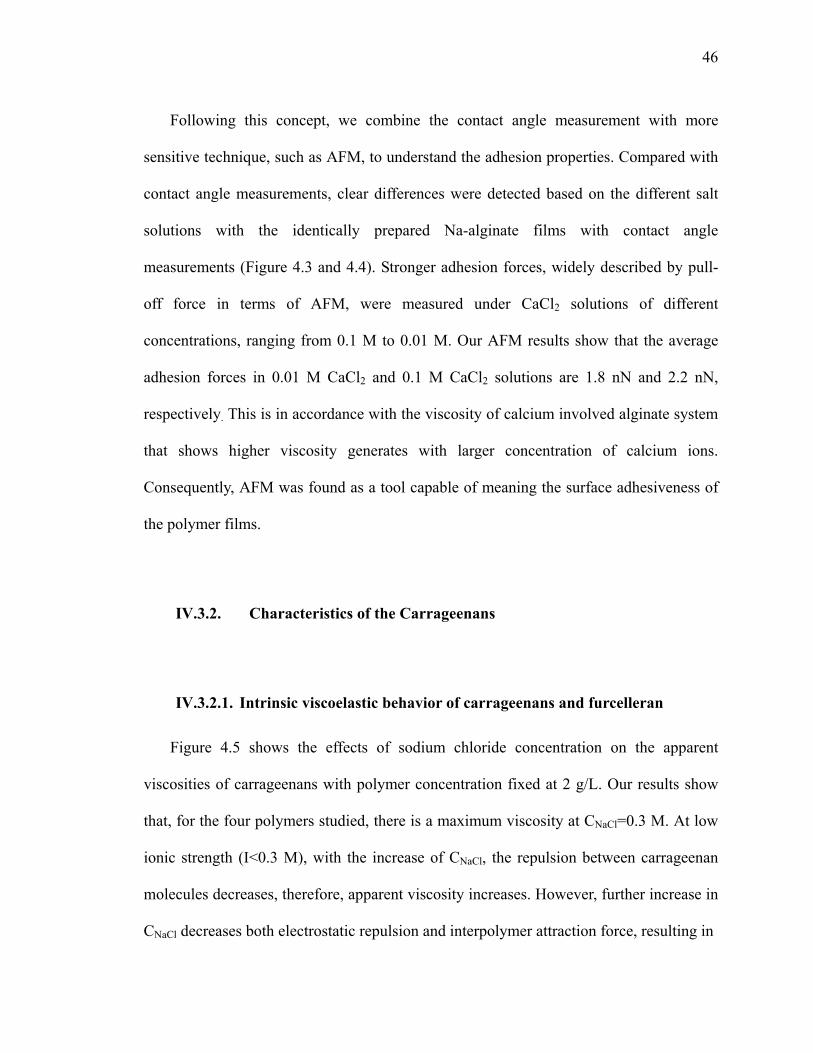
46
Following this concept, we combine the contact angle measurement with more
sensitive technique, such as AFM, to understand the adhesion properties. Compared with
contact angle measurements, clear differences were detected based on the different salt
solutions with the identically prepared Na-alginate films with contact angle
measurements (Figure 4.3 and 4.4). Stronger adhesion forces, widely described by pull-
off force in terms of AFM, were measured under CaCl2 solutions of different
concentrations, ranging from 0.1 M to 0.01 M. Our AFM results show that the average
adhesion forces in 0.01 M CaCl2 and 0.1 M CaCl2 solutions are 1.8 nN and 2.2 nN,
respectively. This is in accordance with the viscosity of calcium involved alginate system
that shows higher viscosity generates with larger concentration of calcium ions.
Consequently, AFM was found as a tool capable of meaning the surface adhesiveness of
the polymer films.
IV.3.2. Characteristics of the Carrageenans
IV.3.2.1. Intrinsic viscoelastic behavior of carrageenans and furcelleran
Figure 4.5 shows the effects of sodium chloride concentration on the apparent
viscosities of carrageenans with polymer concentration fixed at 2 g/L. Our results show
that, for the four polymers studied, there is a maximum viscosity at CNaCl=0.3 M. At low
ionic strength (I<0.3 M), with the increase of CNaCl, the repulsion between carrageenan
molecules decreases, therefore, apparent viscosity increases. However, further increase in
CNaCl decreases both electrostatic repulsion and interpolymer attraction force, resulting in
47
Extension, nm0 20 40 60 80 100
Forc
e, n
N
-0.5
0.0
0.5
1.0
1.5
2.0DI water 0.10 M NaCl 0.01 M CaCl2 0.10 M CaCl2
Figure 4.3. Force-extension curves recorded for interactions between silicon-nitride
AFM tip and Na-alginate covered mica substrate in different salt
solutions.
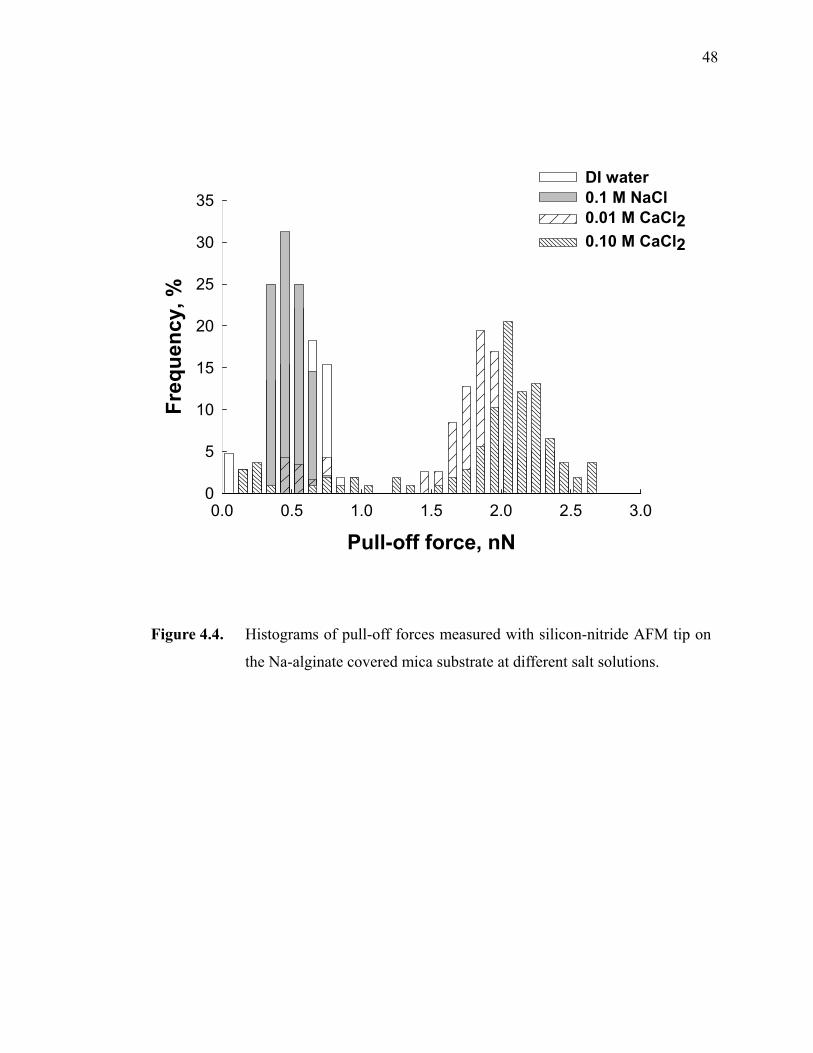
48
Pull-off force, nN0.0 0.5 1.0 1.5 2.0 2.5 3.0
Freq
uenc
y, %
0
5
10
15
20
25
30
35DI water 0.1 M NaCl0.01 M CaCl2 0.10 M CaCl2
Figure 4.4. Histograms of pull-off forces measured with silicon-nitride AFM tip on
the Na-alginate covered mica substrate at different salt solutions.
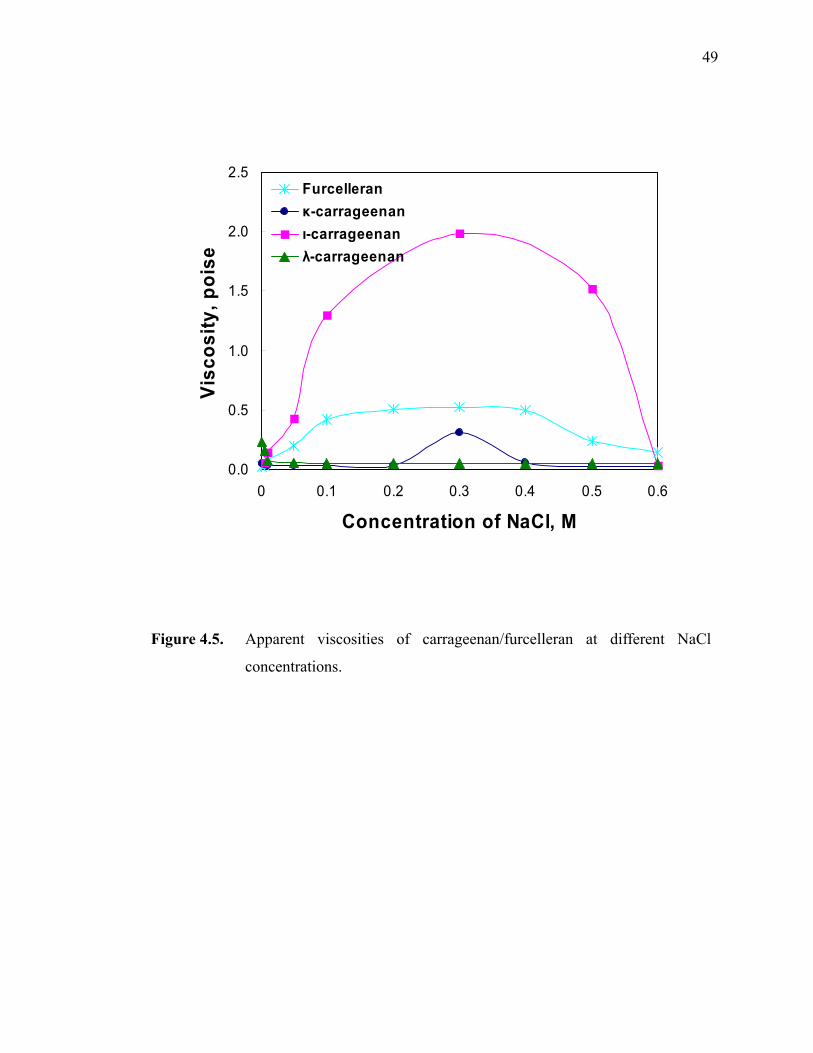
49
0.0
0.5
1.0
1.5
2.0
2.5
0 0.1 0.2 0.3 0.4 0.5 0.6
Concentration of NaCl, M
Visc
osity
, poi
seFurcelleranκ-carrageenanι-carrageenanλ-carrageenan
Figure 4.5. Apparent viscosities of carrageenan/furcelleran at different NaCl
concentrations.
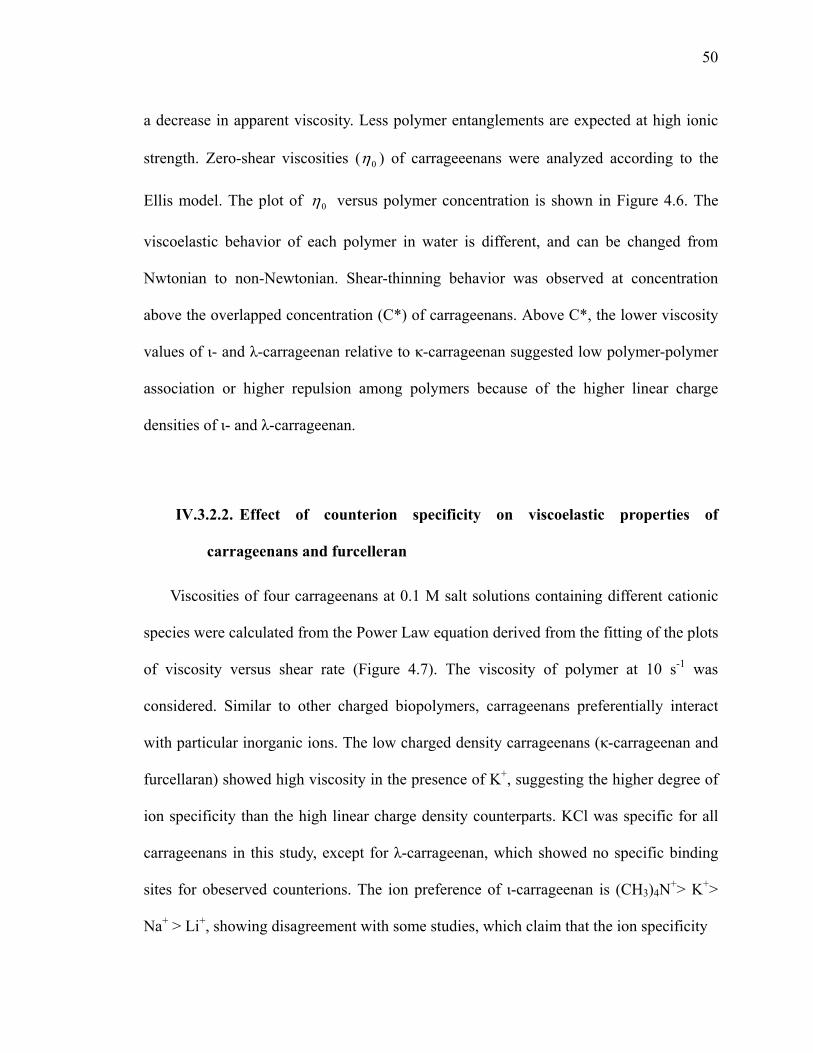
50
a decrease in apparent viscosity. Less polymer entanglements are expected at high ionic
strength. Zero-shear viscosities ( 0η ) of carrageeenans were analyzed according to the
Ellis model. The plot of 0η versus polymer concentration is shown in Figure 4.6. The
viscoelastic behavior of each polymer in water is different, and can be changed from
Nwtonian to non-Newtonian. Shear-thinning behavior was observed at concentration
above the overlapped concentration (C*) of carrageenans. Above C*, the lower viscosity
values of ι- and λ-carrageenan relative to κ-carrageenan suggested low polymer-polymer
association or higher repulsion among polymers because of the higher linear charge
densities of ι- and λ-carrageenan.
IV.3.2.2. Effect of counterion specificity on viscoelastic properties of
carrageenans and furcelleran
Viscosities of four carrageenans at 0.1 M salt solutions containing different cationic
species were calculated from the Power Law equation derived from the fitting of the plots
of viscosity versus shear rate (Figure 4.7). The viscosity of polymer at 10 s-1 was
considered. Similar to other charged biopolymers, carrageenans preferentially interact
with particular inorganic ions. The low charged density carrageenans (κ-carrageenan and
furcellaran) showed high viscosity in the presence of K+, suggesting the higher degree of
ion specificity than the high linear charge density counterparts. KCl was specific for all
carrageenans in this study, except for λ-carrageenan, which showed no specific binding
sites for obeserved counterions. The ion preference of ι-carrageenan is (CH3)4N+> K+>
Na+ > Li+, showing disagreement with some studies, which claim that the ion specificity
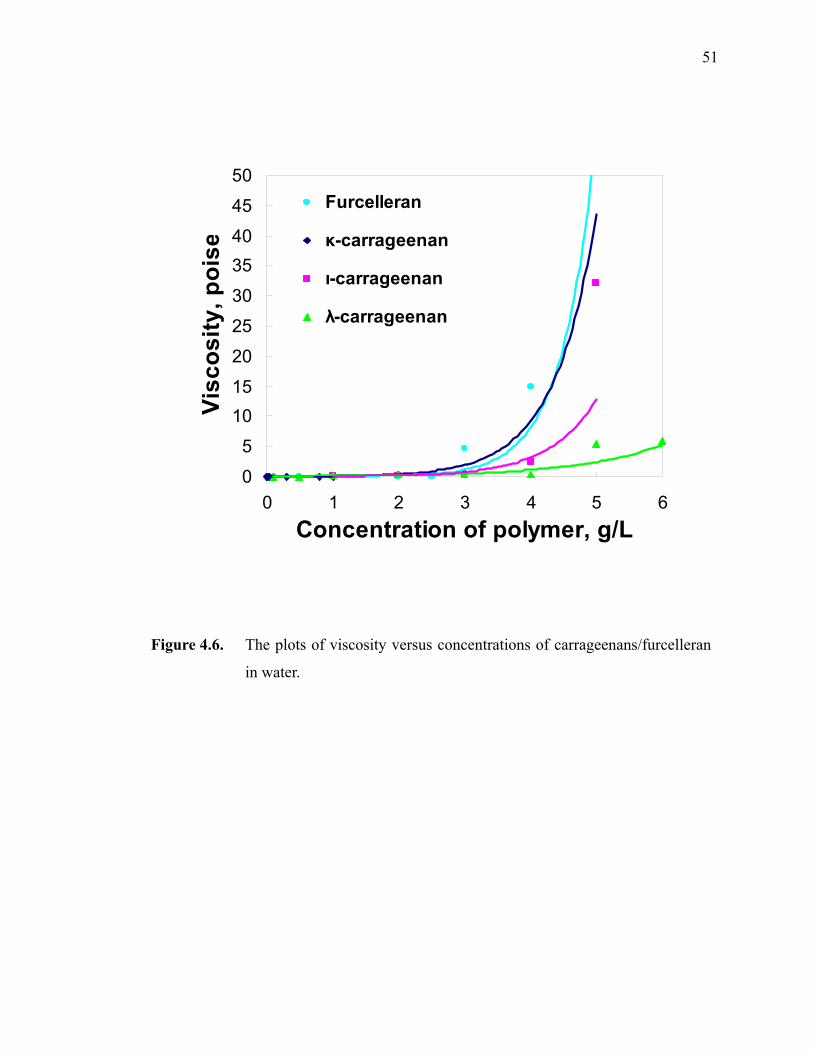
51
0
5
1015
20
25
30
3540
45
50
0 1 2 3 4 5 6Concentration of polymer, g/L
Visc
osity
, poi
seFurcelleran
κ-carrageenan
ι-carrageenan
λ-carrageenan
Figure 4.6. The plots of viscosity versus concentrations of carrageenans/furcelleran
in water.
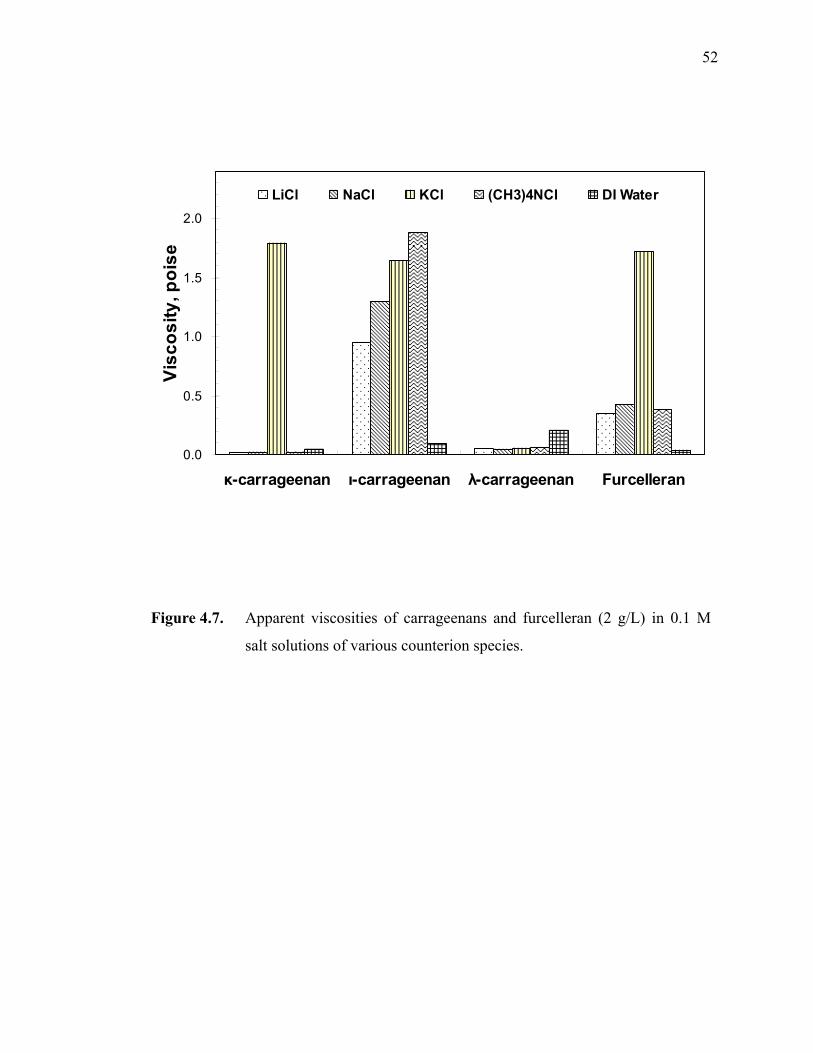
52
0.0
0.5
1.0
1.5
2.0
κ-carrageenan ι-carrageenan λ-carrageenan Furcelleran
Visc
osity
, poi
seLiCl NaCl KCl (CH3)4NCl DI Water
Figure 4.7. Apparent viscosities of carrageenans and furcelleran (2 g/L) in 0.1 M
salt solutions of various counterion species.
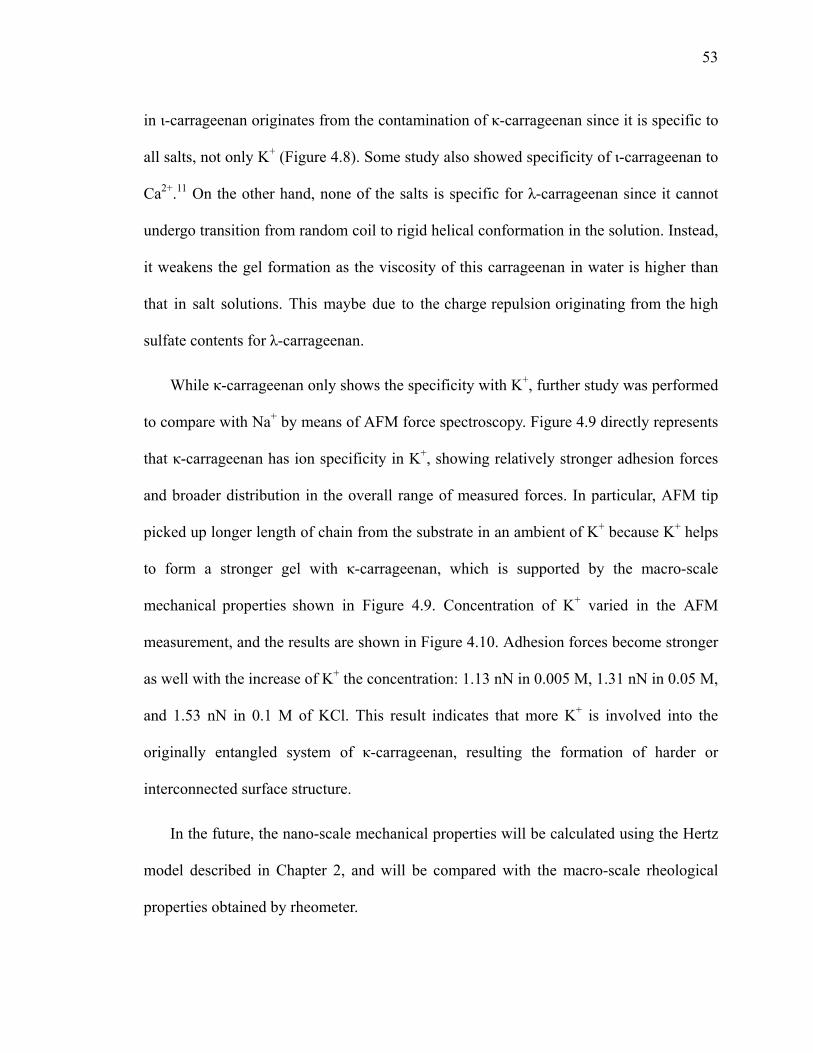
53
in ι-carrageenan originates from the contamination of κ-carrageenan since it is specific to
all salts, not only K+ (Figure 4.8). Some study also showed specificity of ι-carrageenan to
Ca2+.11 On the other hand, none of the salts is specific for λ-carrageenan since it cannot
undergo transition from random coil to rigid helical conformation in the solution. Instead,
it weakens the gel formation as the viscosity of this carrageenan in water is higher than
that in salt solutions. This maybe due to the charge repulsion originating from the high
sulfate contents for λ-carrageenan.
While κ-carrageenan only shows the specificity with K+, further study was performed
to compare with Na+ by means of AFM force spectroscopy. Figure 4.9 directly represents
that κ-carrageenan has ion specificity in K+, showing relatively stronger adhesion forces
and broader distribution in the overall range of measured forces. In particular, AFM tip
picked up longer length of chain from the substrate in an ambient of K+ because K+ helps
to form a stronger gel with κ-carrageenan, which is supported by the macro-scale
mechanical properties shown in Figure 4.9. Concentration of K+ varied in the AFM
measurement, and the results are shown in Figure 4.10. Adhesion forces become stronger
as well with the increase of K+ the concentration: 1.13 nN in 0.005 M, 1.31 nN in 0.05 M,
and 1.53 nN in 0.1 M of KCl. This result indicates that more K+ is involved into the
originally entangled system of κ-carrageenan, resulting the formation of harder or
interconnected surface structure.
In the future, the nano-scale mechanical properties will be calculated using the Hertz
model described in Chapter 2, and will be compared with the macro-scale rheological
properties obtained by rheometer.
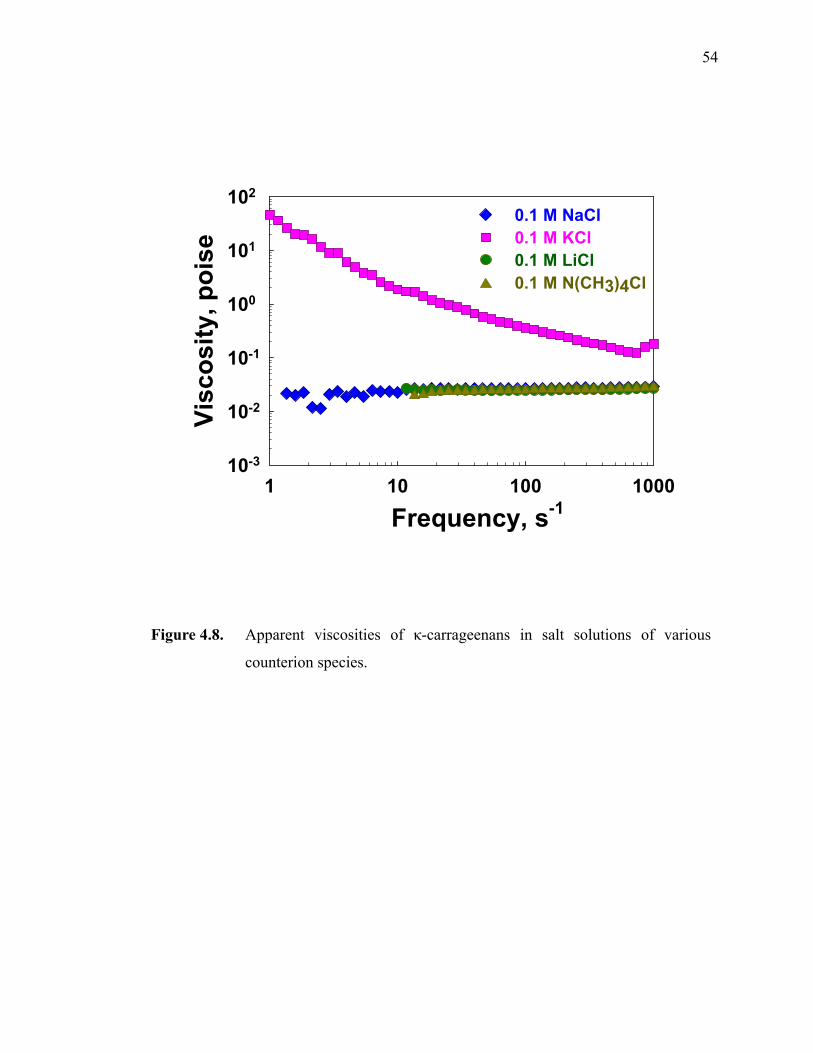
54
Frequency, s-11 10 100 1000
Visc
osity
, poi
se
10-3
10-2
10-1
100
101
102
0.1 M NaCl 0.1 M KCl 0.1 M LiCl0.1 M N(CH3)4Cl
Figure 4.8. Apparent viscosities of κ-carrageenans in salt solutions of various
counterion species.
55
Pull-off force, nN0.0 0.5 1.0 1.5 2.0 2.5 3.0
Freq
uenc
y, %
0
5
10
15
20
25
30
35
KCl NaCl
Force, pN0 200 400 600 800
Rup
ture
d ch
ain
leng
th, n
m
0
50
100
150
200
250
300
KClNaCl
Figure 4.9. Histograms of pull-off forces from force measurements of κ-
carrageenan-coated substrate emerged in different salt solutions (top),
and the plot of calculated chain lengths from the difference between the
first peak to the other peaks versus its ruptured force (bottom).
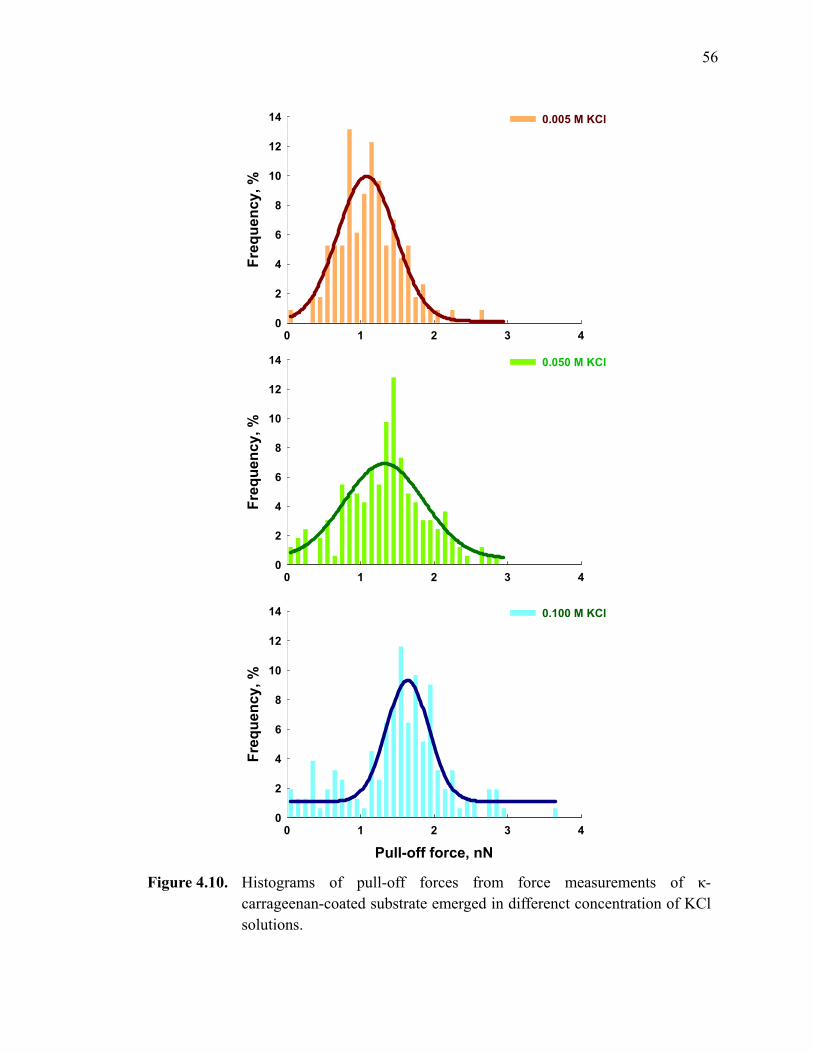
56
0 1 2 3 4
Freq
uenc
y, %
0
2
4
6
8
10
12
14 0.005 M KCl
0 1 2 3 4
Freq
uenc
y, %
0
2
4
6
8
10
12
14 0.050 M KCl
Pull-off force, nN0 1 2 3 4
Freq
uenc
y, %
0
2
4
6
8
10
12
14 0.100 M KCl
Figure 4.10. Histograms of pull-off forces from force measurements of κ-
carrageenan-coated substrate emerged in differenct concentration of KCl solutions.
57
IV.4. Conclusions
The mechanical properties of Na-alginates and various carrageenans at nano-scale
showed a good correlation with the conventional rheological measurements at macro-
scale. Single-molecule force spectroscopy can extend our understanding of polymer
single chain theories.
IV.5. References
1. Shahidi F, Han XQ. 1993. Encapsulation of food ingredients. Critical reviews in food science and nutrition. 33(6):501-47.
2. Glicksman M. 1979. Gelling hydrocolloids in food products applications. Easter School in Agricultural Science, University of Nottingham, [Proceedings]. 27(Polysaccharides Food):185-204.
3. de Ruiter GA, Rudolph B. 1997. Carrageenan biotechnology. Trends in Food Science & Technology. 8(12):389-95.
4. Yaseen EI, Herald TJ, Aramouni FM, Alavi S. 2005. Rheological properties of selected gum solutions. Food Research International. 38(2):111-9.
5. Hansen LT, Allan-Wojtas PM, Jin YL, Paulson AT. 2002. Survival of Ca-alginate microencapsulated Bifidobacterium spp. in milk and simulated gastrointestinal conditions. Food Microbiology. 19(1):35-45.
6. Onsoyen E. 2001. Alginate: Production, composition, physicochemical properties, physiological effects, safety, and food applications. Food Science and Technology (New York, NY, United States). 113(Handbook of Dietary Fiber):659-74.
7. Krochta JM, De Mulder-Johnston LC. 1996. Biodegradable polymers from agricultural products. ACS Symposium Series. 647:120-40.
8. Sheu TY, Marshall RT, Heymann H. 1993. Improving survival of culture bacteria in frozen desserts by microentrapment. Journal of dairy science. 76(7):1902-7.
9. Bu H, Kjoniksen AL, Knudsen KD, Nystrom B. 2004. Rheological and structural properties of aqueous alginate during gelation via the Ugi multicomponent condensation reaction. Biomacromolecules. 5(4):1470-9.
10. Cancela MA, Alvarez E, Maceiras R. 2003. Polymers in alimentary industry: properties of the sodium alginate. Electronic Journal of Environmental,
58
Agricultural and Food Chemistry. 2(3):380-7.
11. Montero P, Perez-Mateos M. 2002. Effects of Na+, K+ and Ca2+ on gels formed from fish mince containing a carrageenan or alginate. Food Hydrocolloids. 16(4):375-85.
12. Hammill TB, Crawford RL. 1997. Bacterial microencapsulation with three algal polysaccharides. Canadian Journal of Microbiology. 43(11):1091-5.
13. Bixler HJ, Johndro K, Falshaw R. 2001. Kappa-2 carrageenan: structure and performance of commercial extracts: II. Performance in two simulated dairy applications. Food Hydrocolloids. 15(4-6):619-30.
14. Lahaye M, Rochas C. 1991. Chemical structure and physico-chemical properties of agar. Hydrobiologia. 221(1):137-48.
15. Friedsam C, Becares AzDC, Jonas U, Gaub HE, Seitz M. 2004. Polymer functionalized AFM tips for long-term measurements in single-molecule force spectroscopy. ChemPhysChem. 5(3):388-93.
16. Kwok DY, Gietzelt T, Grundke K, Jacobasch HJ, Neumann AW. 1997. Contact angle measurements and contact angle interpretation. 1. Contact angle measurements by axisymmetric drop shape analysis and a goniometer sessile drop technique. Langmuir. 13(10):2880-94.
59
V. CHEMICAL FORCE MICROSCOPY STUDIES OF
INTERACTIONS BETWEEN BOVINE SERUM
ALBUMIN AND NEGATIVELY-CHARGED
SURFACES
V.1. Introduction
Globular proteins interact strongly with both natural and synthetic oppositely charged
polyelectrolytes. In solutions, polyelectrolytes and proteins may undergo two types of
phase separation at above or below the isoelectric point of a protein: (1) solid-liquid
phase separation called precipitation;1, 2 and (2) liquid-liquid phase separation called
coacervation.3, 4 Coacervation is a phenomenon in which a macromolecular aqueous
solution spontaneously separates into two immiscible liquid phases. The coacervate is the
denser phase that is relatively concentrated in macromolecules, and is in equilibrium with
the relatively dilute macromolecular liquid phase.5 Coacervates formed by
polysaccharides and oppositely charged colloids, such as proteins and micelles, have
widely used in microencapsulation of food ingredients, enzymes, cells,6 and
pharmaceuricals.7, 8 Because coacervates are mainly driven by electrostatic interactions,
physicochemical parameters affecting such interactions, such as pH, ionic strength,
polysaccharide linear charge density (ξ), protein surface charge density (σ), counterions
of polyelectrolytes, and protein/polysaccharide ratios, strongly influence the formation of
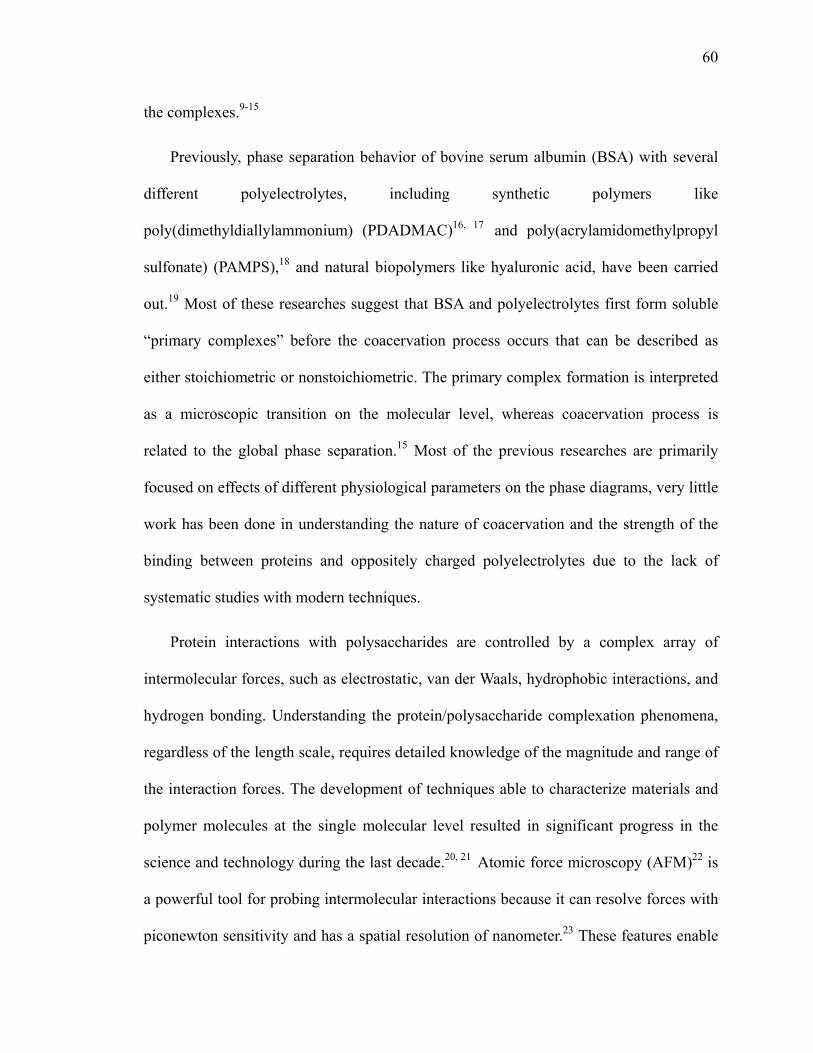
60
the complexes.9-15
Previously, phase separation behavior of bovine serum albumin (BSA) with several
different polyelectrolytes, including synthetic polymers like
poly(dimethyldiallylammonium) (PDADMAC)16, 17 and poly(acrylamidomethylpropyl
sulfonate) (PAMPS),18 and natural biopolymers like hyaluronic acid, have been carried
out.19 Most of these researches suggest that BSA and polyelectrolytes first form soluble
“primary complexes” before the coacervation process occurs that can be described as
either stoichiometric or nonstoichiometric. The primary complex formation is interpreted
as a microscopic transition on the molecular level, whereas coacervation process is
related to the global phase separation.15 Most of the previous researches are primarily
focused on effects of different physiological parameters on the phase diagrams, very little
work has been done in understanding the nature of coacervation and the strength of the
binding between proteins and oppositely charged polyelectrolytes due to the lack of
systematic studies with modern techniques.
Protein interactions with polysaccharides are controlled by a complex array of
intermolecular forces, such as electrostatic, van der Waals, hydrophobic interactions, and
hydrogen bonding. Understanding the protein/polysaccharide complexation phenomena,
regardless of the length scale, requires detailed knowledge of the magnitude and range of
the interaction forces. The development of techniques able to characterize materials and
polymer molecules at the single molecular level resulted in significant progress in the
science and technology during the last decade.20, 21 Atomic force microscopy (AFM)22 is
a powerful tool for probing intermolecular interactions because it can resolve forces with
piconewton sensitivity and has a spatial resolution of nanometer.23 These features enable
61
AFM to produce nanometer to micrometer scale of surface topography,24-29 adhesion,30
friction, and compliance, and thus make AFM an essential characterization technique for
fields from materials science to food science. Recently, with the development of pico-
Newton sensitive instrumentation, AFM-based chemical force microscopy (CFM) has
been used to study cell adhesion,31 desorption force,32 nano-mechanics of
macromolecules,33 and conformational transition of polysaccharides.34-36 No work on
polysaccharide/protein interactions using CFM has been reported. With the help of AFM,
which provides force resolution and positional precision that allows measurements at the
single molecule level,37 we can now directly measure the binding force between proteins
and polysaccharides by force-displacement measurement.
Carrageenans/furcelleran, which are linear sulfated polysaccharides found as
intercellular matrix materials in numerous species of red seaweed and widely used as
gelling agents, thickeners, and stabilizers in milk-based products, are linear sulfated
polysaccharides that are widely used as gelling agents, thickeners, and stabilizers in milk-
based products.38-42 They are hydrocolloids with a primary structure of alternating α-
(1→3)- and β-(1→4)- linked galactose residues.43 The available anionic carrageenans
include furcelleran, λ-, ι-, and κ-carrageenan, which have similar chemical structure but
different linear charge density (number of sulfate group per disaccharide). At low pH
(<6.0), carrageenans/furcelleran strongly reacted with bovine serum albumin (BSA) and
may undergo two types of phase separation: (1) solid-liquid phase separation call
precipitation; and (2) liquid-liquid phase separation call coacervation. The coacervation
phenomenon has been widely used in the microencapsulation of food ingredients,
enzymes, and cells. The release rate of the encapsulated food ingredients depends on the
62
viscoelastic properties of the coacervates.
In this chapter, the intermolecular interactions between bovine serum albumin (BSA)
and negatively-charged surface such as mica and κ-carrageenan were studied by AFM to
evaluate the strength of binding force. The complexes formed by BSA and κ-carrageenan
were further focused on the comprehension of the pH-induced coacervation and the
resulted changes in intermolecular interactions between κ-carrageenan and BSA. The
polymeric stretching of κ-carrageenan and BSA is interpreted by the worm-like chain
model (WLC) in this chapter.
V.2. Methods
The CFM measurements were carried out with a NanoScope IIIa Multimode AFM
(Veeco Instruments, Santa Barbara, CA) in a liquid cell. The spring constants of the
cantilevers provided by the manufacturer were used in the force calculation. The
molecular interaction measurements were performed using BSA-modified tips.
Triangular shaped silicon nitride cantilevers were first coated with ca. 2 nm Ti, and
subsequently by ca. 70 nm Au under high vacuum. Gold-coated tips were further
functionalized with a stable monolayer of BSA molecules through self-assembly in 5 g/L
BSA in 0.1 M NaCl solution at pH 4.0 for 24 hrs, followed by washing out the residue
BSA molecules, and dried under nitrogen flow.44 Newly cleaved mica surfaces were used
as the substrates. Κ-carrageenan surface was made by spin coating onto mica which
surface was exposed after peeling off the layer just before running AFM. The schematics
of tips and substrates used in the AFM experiments are illustrated in Figure 5.2.

63
The cantilever sensitivity (V/nm) was calculated from the slope of the retracting
curve where the repulsive forces were dominant. The deflection measured in the unit of
nanometer was calculated by the deflection voltage divided by the cantilever sensitivity,
and the extension between sample and cantilever was calculated from the sum of
deflection and the height signal.45 Prior to the experiments, the AFM setup was
equilibrated in the solution of desired pH and ionic strength until the thermal drift was
eliminated. For quantitative analysis, at least 500 force-extension curves were collected at
a given condition, and good force-extension curves are selected from these curves on the
basis of the criteria described in data analysis part.
V.3. Results and Discussion
V.3.1. Interactions between BSA and Mica
In the statistical aspect of the strength of pull-off force, approximately 500 force
curves were collected and drawn as a histogram. Before evaluating the pull-off forces of
the complex between BSA and κ-carrageenan, bare mica was used as a control for the
interaction with BSA-modified AFM tip, as shown in Figure 5.1. It shows clearly that the
pull-off forces change to a stronger value at lower pH since the surface of mica is
negatively charged.. As it starts to reveal the slight shift of pull-off force around pH 5.0, it
is suggested that BSA has a tendency to interact strongly with the negatively-charged
substrate.
64
(a)
Pull-off force (pN)0 200 400 600
Freq
uenc
y (%
)
0
1
2
3
4
5
6
7
pH 6.3
(c)
Pull-off force (pN)0 200 400 600
Freq
uenc
y (%
)
0
1
2
3
4
5
6
7pH 4.8
(b)
Pull-off force (pN)0 200 400 600
Freq
uenc
y (%
)
0
1
2
3
4
5
6
7
pH 4.7
(d)
Pull-off force (pN)0 200 400 600
Freq
uenc
y (%
)
0
1
2
3
4
5
6
7
pH 4.0
Figure 5.1. Histograms of the pull-off forces from force measurements (n ≥ 500)
between bare mica substrate and BSA-modified AFM tip in 0.1 M NaCl
solutions of different pH values: (a) pH 6.3; (b) pH 5.3; (c) pH 4.8; and
(d) pH 4.0.
65
To better understand the effects of pH on the conformation of BSA as well as its
interactions with negatively-charged mica surface in salt solution, the comparison
between the chemical force microscopy results and small-angle neutron scattering
(SANS) have been carried out.† A new approach to extract the contribution of elementary
interactions from the statistically averaged force-extension curves through self-consistent
fitting was proposed. Our results show that, when pH increases, the averaged pull-off
force for the elongation monotonously decreases. The decrease of pull-off force with the
increase of pH results from the decrease of the strength of hydrogen bonding and the
number of interaction pairs, as well as the slight increase of the strength of van der Waals
interaction, suggesting that the force-extension curve is mainly contributed by the van der
Waals interaction. The detailed comparison between the SANS and CFM results can be
found in the Appendix.
V.3.2. Interactions between BSA and κ-Carrageenan
Protein interactions with polysaccharides or other ligands are controlled by a
complex array of intermolecular forces, such as electrostatic, van der Waals, hydrophobic
interactions, and hydrogen bonding. Using AFM-based CFM, the intermolecular
unbinding forces between BSA and κ-carrageenan can be obtained through force-
extension curves. For this purpose, the AFM tip was chemically modified with BSA, and
the CFM measurements were carried out in a liquid cell at different pH conditions, as
shown in Figure 5.2. Since the chain length and charge distribution of κ-carrageenan are
† See Appendix (Chapter 9).

66
Mica or silicon substrate
Si
O
Κ-carrageenan
O Si
O
Κ-carrageenan
O
Si3N4 AFM tip
2 nm Ti70 nm AuS
SS
S
SS
BSA
BSA
Mica or silicon substrate
Si
O
Κ-carrageenan
OSi
O
Κ-carrageenan
O Si
O
Κ-carrageenan
OSi
O
Κ-carrageenan
O
Si3N4 AFM tip
2 nm Ti70 nm AuS
SS
S
SS
BSA
BSA
Si3N4 AFM tip
2 nm Ti70 nm AuSS
SSSS
S
SSS
BSA
BSA
Figure 5.2. The schematic representation of immobilization of BSA to an AFM tip,
and the formation of carrageenan film on mica or silicon wafer surface.
67
not uniform, furthermore, it was difficult to set up the exact point at which an individual
κ-carrageenan chain was picked up, interaction forces between BSA-functionalized AFM
tip and the substrate were broadly distributed. However, we can statistically overcome
this problem by collecting a large number of force-extension curves.
Figure 5.3 shows the typical force-distance plots drawn by deflection voltage vs.
piezo-displacement obtained from the interaction between the bare silicon-nitride tip and
κ-carrageenan (a) and between BSA-coated tip and κ-carrageenan in 0.1 M NaCl solution
at pH 6.0 (b). Compared with κ-carrageenan using unmodified AFM tip, a force curve of
multiple pull-off events, so called “saw-tooth” shaped force curves were observed in most
of the force curves for BSA and κ-carrageenan systems. A saw-tooth pattern has been
well known as a clear sign induced by protein or polypeptide.46-49
Figure 5.4 shows the effects of pH on the force-extension curves obtained from the
interactions between BSA-coated tip and κ-carrageenan (1) at pH 6.0; and (2) at pH 4.7.
DLS and turbidimetric titration results suggest that BSA forms soluble complex at pH 6.0
and coacervates at pH 4.7 with κ-carrageenan at 0.1 M NaCl solutions. We compare the
rupture forces with extension distance, which corresponds to rupture length between BSA
and κ-carrageenan. The individual force peak was labeled alphabetically in Figure 5.4; a
to c on the force curve of pH 6.0, while d to h on that of pH 4.7. Around the rupture force
of 400 pN (dashed line), the significant difference in extension distance appeared in
Figure 5.4. At the same rupture force, the stretching lengths of pH 4.7 were mostly longer
than those of pH 6.0. It indicates that the binding site of both κ-carrageenan and BSA is
set well enough to be extended more at the lower pH, where more positive charges of
BSA exist and interact strongly with the negatively charged κ-carrageenan, which may
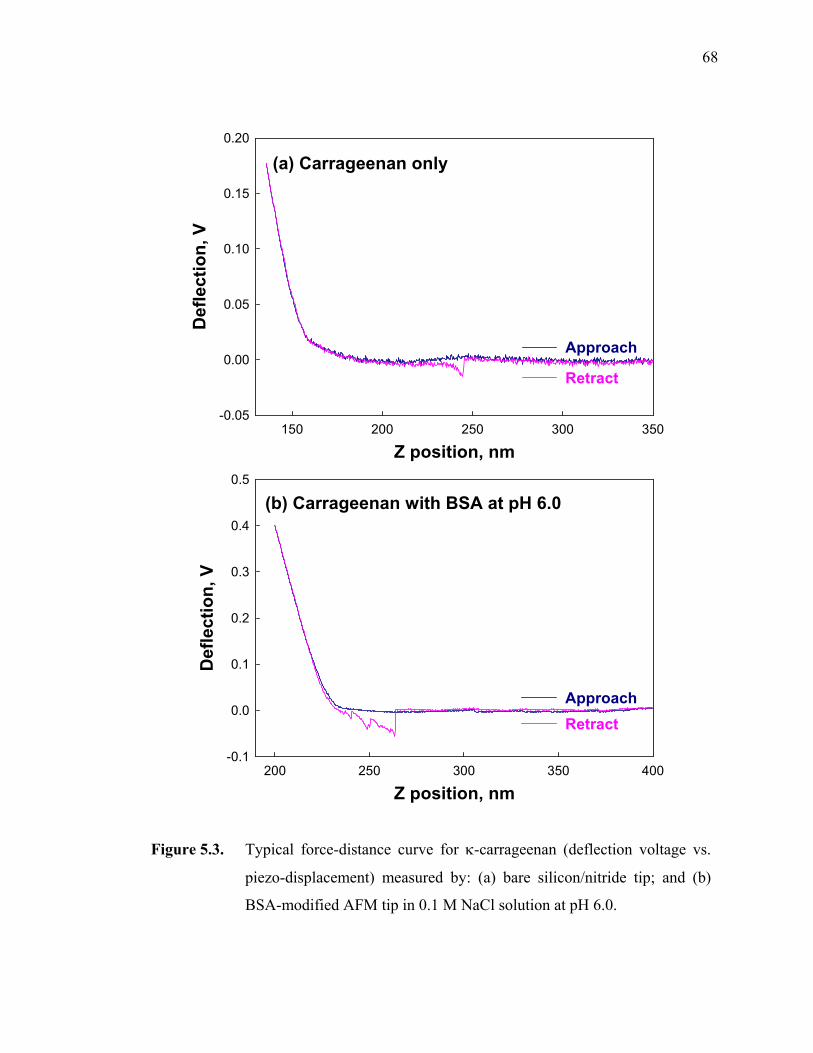
68
(b) Carrageenan with BSA at pH 6.0
Z position, nm200 250 300 350 400
Def
lect
ion,
V
-0.1
0.0
0.1
0.2
0.3
0.4
0.5
ApproachRetract
(a) Carrageenan only
Z position, nm150 200 250 300 350
Def
lect
ion,
V
-0.05
0.00
0.05
0.10
0.15
0.20
Approach
Retract
Figure 5.3. Typical force-distance curve for κ-carrageenan (deflection voltage vs.
piezo-displacement) measured by: (a) bare silicon/nitride tip; and (b)
BSA-modified AFM tip in 0.1 M NaCl solution at pH 6.0.
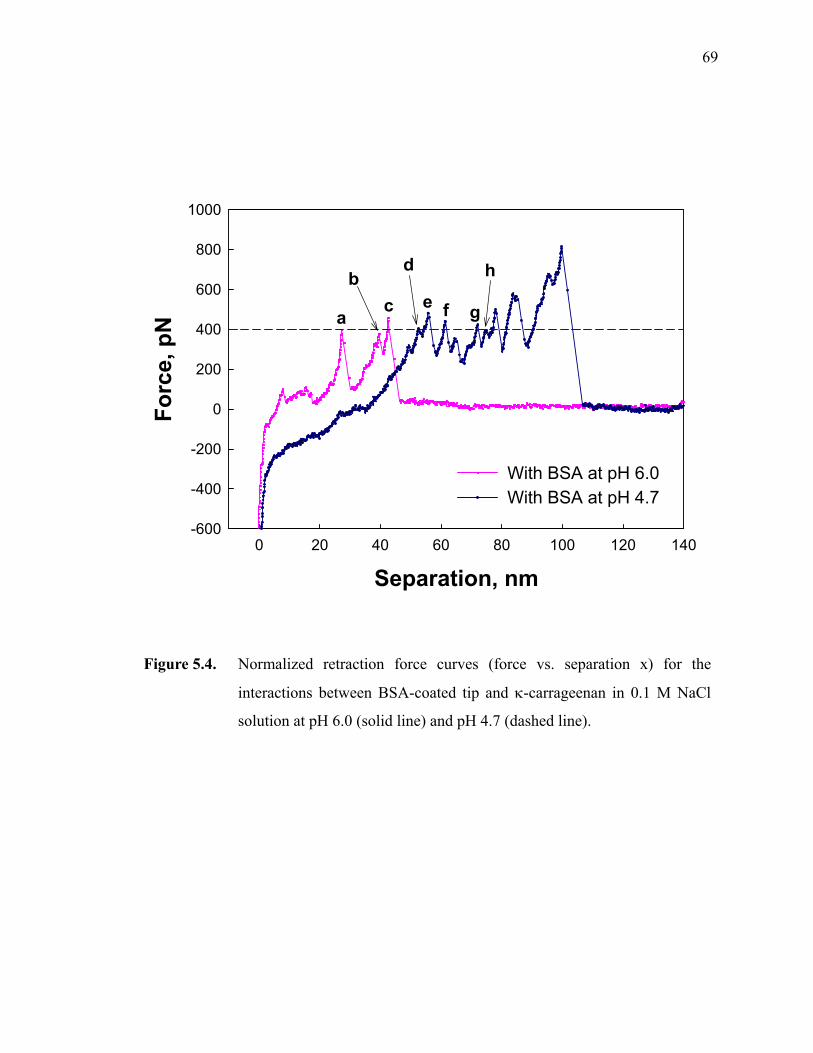
69
Separation, nm0 20 40 60 80 100 120 140
Forc
e, p
N
-600
-400
-200
0
200
400
600
800
1000
With BSA at pH 6.0 With BSA at pH 4.7
a
bc
d
e f g
h
Figure 5.4. Normalized retraction force curves (force vs. separation x) for the
interactions between BSA-coated tip and κ-carrageenan in 0.1 M NaCl
solution at pH 6.0 (solid line) and pH 4.7 (dashed line).
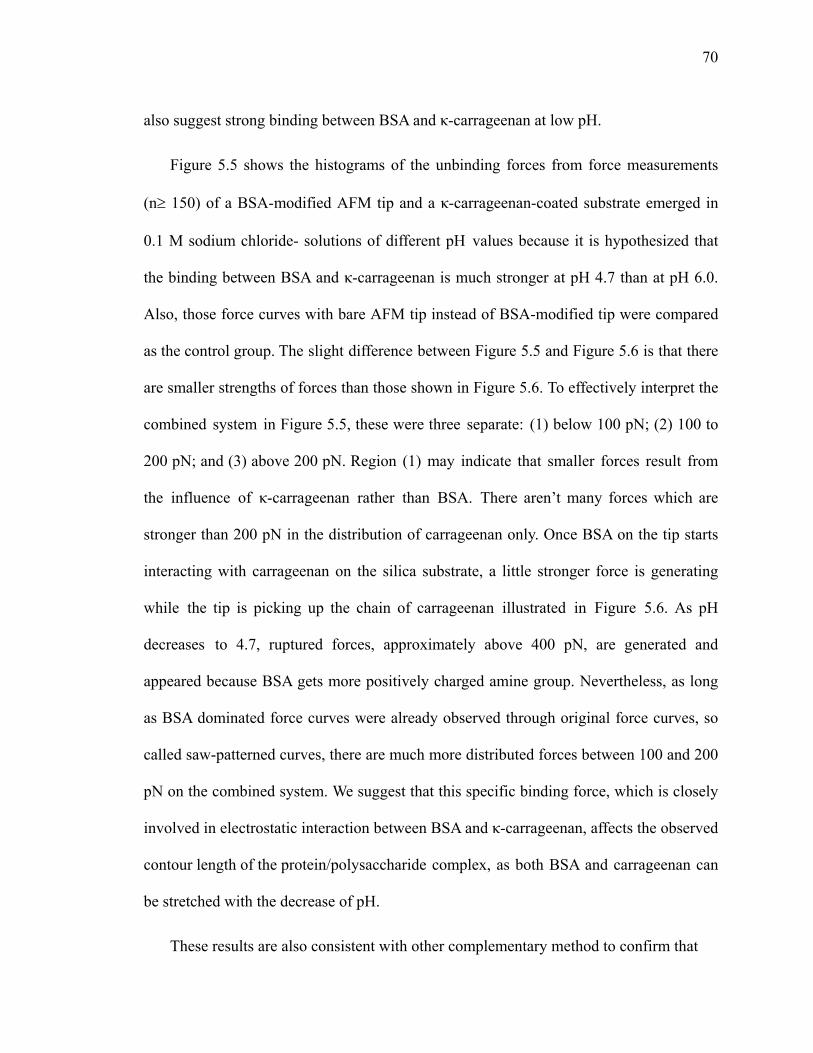
70
also suggest strong binding between BSA and κ-carrageenan at low pH.
Figure 5.5 shows the histograms of the unbinding forces from force measurements
(n≥ 150) of a BSA-modified AFM tip and a κ-carrageenan-coated substrate emerged in
0.1 M sodium chloride- solutions of different pH values because it is hypothesized that
the binding between BSA and κ-carrageenan is much stronger at pH 4.7 than at pH 6.0.
Also, those force curves with bare AFM tip instead of BSA-modified tip were compared
as the control group. The slight difference between Figure 5.5 and Figure 5.6 is that there
are smaller strengths of forces than those shown in Figure 5.6. To effectively interpret the
combined system in Figure 5.5, these were three separate: (1) below 100 pN; (2) 100 to
200 pN; and (3) above 200 pN. Region (1) may indicate that smaller forces result from
the influence of κ-carrageenan rather than BSA. There aren’t many forces which are
stronger than 200 pN in the distribution of carrageenan only. Once BSA on the tip starts
interacting with carrageenan on the silica substrate, a little stronger force is generating
while the tip is picking up the chain of carrageenan illustrated in Figure 5.6. As pH
decreases to 4.7, ruptured forces, approximately above 400 pN, are generated and
appeared because BSA gets more positively charged amine group. Nevertheless, as long
as BSA dominated force curves were already observed through original force curves, so
called saw-patterned curves, there are much more distributed forces between 100 and 200
pN on the combined system. We suggest that this specific binding force, which is closely
involved in electrostatic interaction between BSA and κ-carrageenan, affects the observed
contour length of the protein/polysaccharide complex, as both BSA and carrageenan can
be stretched with the decrease of pH.
These results are also consistent with other complementary method to confirm that
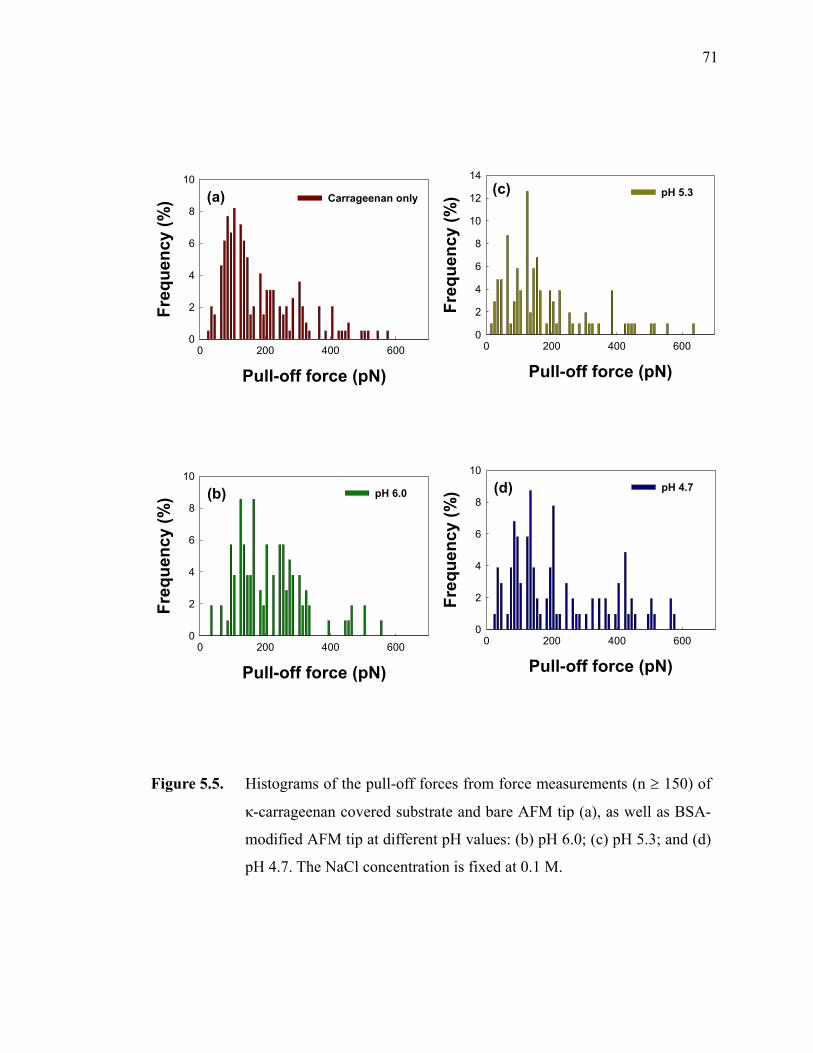
71
(a)
Pull-off force (pN)0 200 400 600
Freq
uenc
y (%
)
0
2
4
6
8
10
Carrageenan only
(c)
Pull-off force (pN)0 200 400 600
Freq
uenc
y (%
)
0
2
4
6
8
10
12
14pH 5.3
(b)
Pull-off force (pN)0 200 400 600
Freq
uenc
y (%
)
0
2
4
6
8
10pH 6.0
(d)
Pull-off force (pN)0 200 400 600
Freq
uenc
y (%
)
0
2
4
6
8
10pH 4.7
Figure 5.5. Histograms of the pull-off forces from force measurements (n ≥ 150) of
κ-carrageenan covered substrate and bare AFM tip (a), as well as BSA-
modified AFM tip at different pH values: (b) pH 6.0; (c) pH 5.3; and (d)
pH 4.7. The NaCl concentration is fixed at 0.1 M.
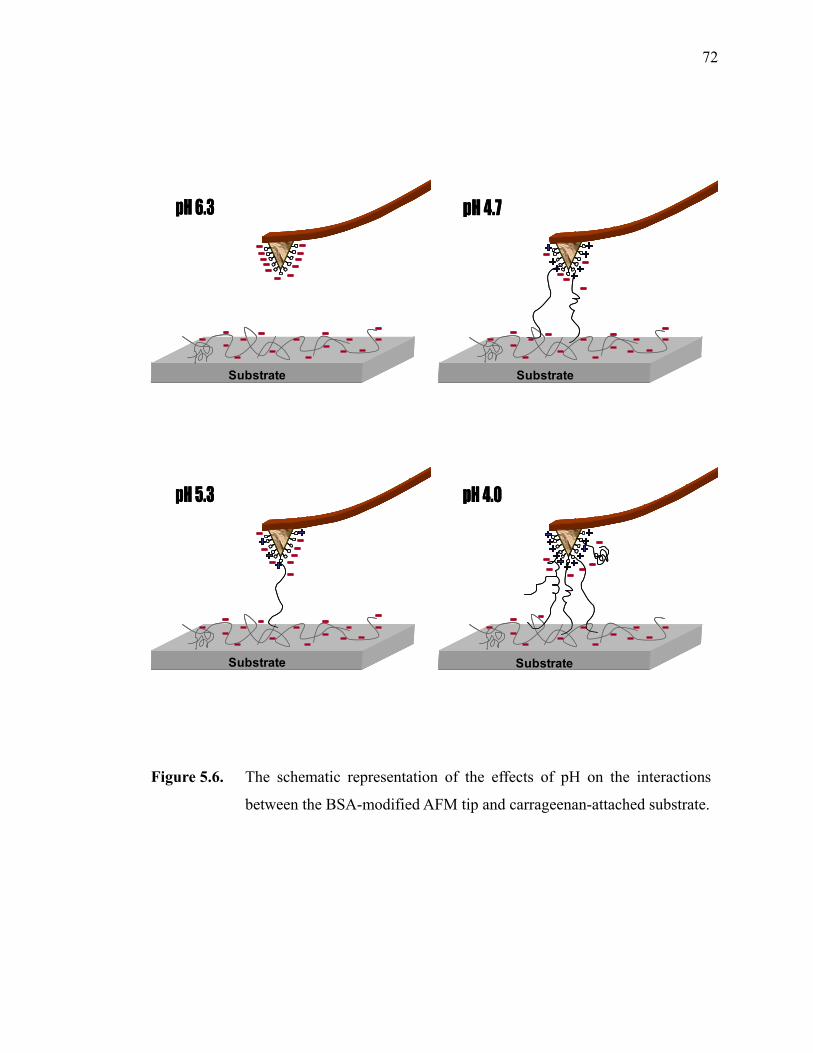
72
SubstrateSubstrate SubstrateSubstrate
SubstrateSubstrate SubstrateSubstrate
Figure 5.6. The schematic representation of the effects of pH on the interactions
between the BSA-modified AFM tip and carrageenan-attached substrate.
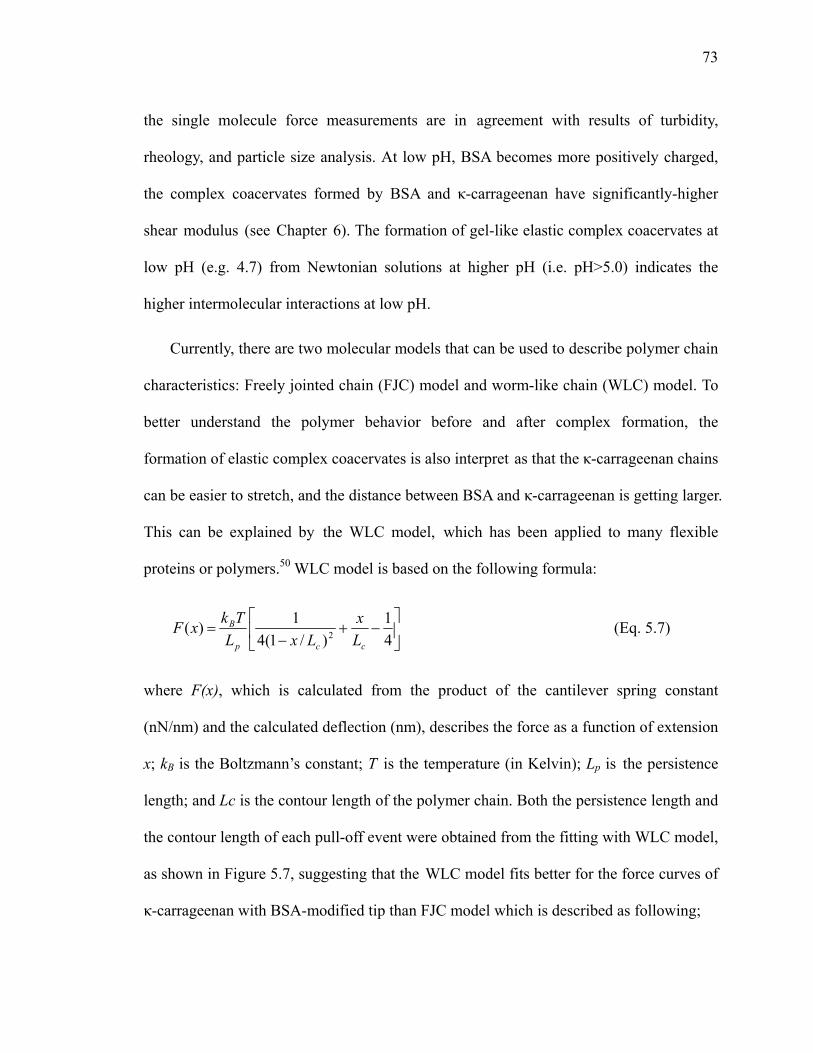
73
the single molecule force measurements are in agreement with results of turbidity,
rheology, and particle size analysis. At low pH, BSA becomes more positively charged,
the complex coacervates formed by BSA and κ-carrageenan have significantly-higher
shear modulus (see Chapter 6). The formation of gel-like elastic complex coacervates at
low pH (e.g. 4.7) from Newtonian solutions at higher pH (i.e. pH>5.0) indicates the
higher intermolecular interactions at low pH.
Currently, there are two molecular models that can be used to describe polymer chain
characteristics: Freely jointed chain (FJC) model and worm-like chain (WLC) model. To
better understand the polymer behavior before and after complex formation, the
formation of elastic complex coacervates is also interpret as that the κ-carrageenan chains
can be easier to stretch, and the distance between BSA and κ-carrageenan is getting larger.
This can be explained by the WLC model, which has been applied to many flexible
proteins or polymers.50 WLC model is based on the following formula:
⎥⎦
⎤⎢⎣
⎡−+
−=
41
)/1(41)( 2
ccp
B
Lx
LxLTkxF (Eq. 5.7)
where F(x), which is calculated from the product of the cantilever spring constant
(nN/nm) and the calculated deflection (nm), describes the force as a function of extension
x; kB is the Boltzmann’s constant; T is the temperature (in Kelvin); Lp is the persistence
length; and Lc is the contour length of the polymer chain. Both the persistence length and
the contour length of each pull-off event were obtained from the fitting with WLC model,
as shown in Figure 5.7, suggesting that the WLC model fits better for the force curves of
κ-carrageenan with BSA-modified tip than FJC model which is described as following;
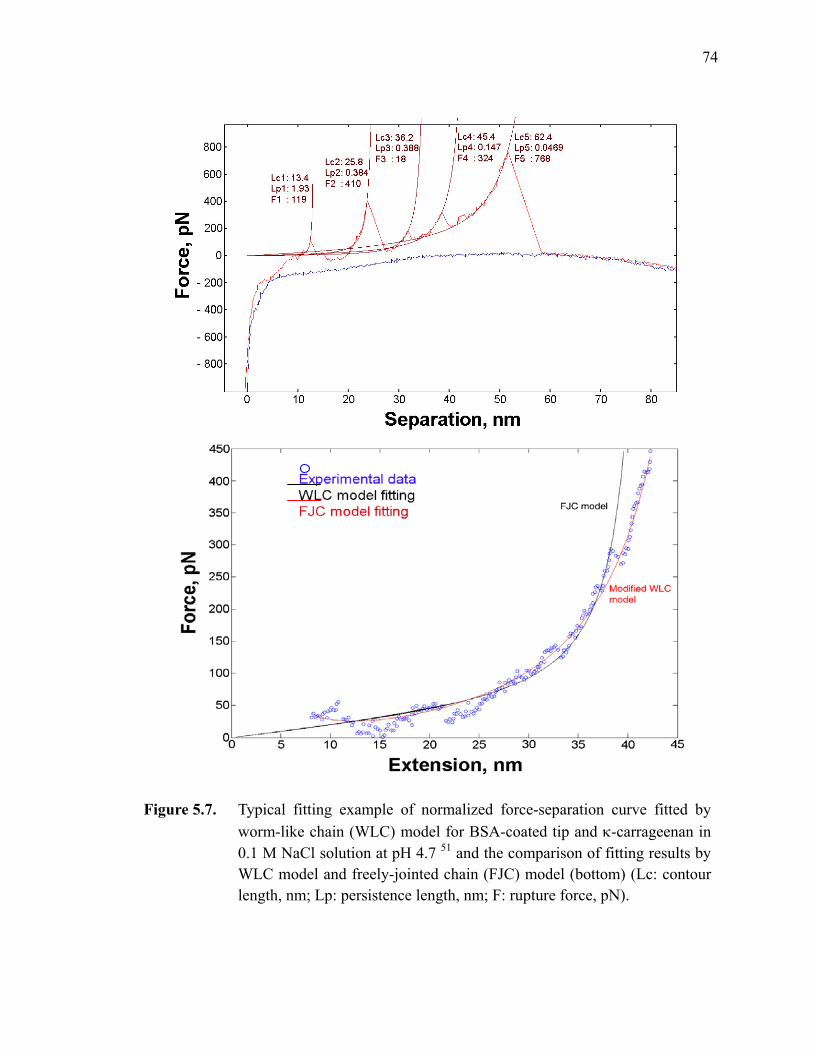
74
Figure 5.7. Typical fitting example of normalized force-separation curve fitted by worm-like chain (WLC) model for BSA-coated tip and κ-carrageenan in 0.1 M NaCl solution at pH 4.7 51 and the comparison of fitting results by WLC model and freely-jointed chain (FJC) model (bottom) (Lc: contour length, nm; Lp: persistence length, nm; F: rupture force, pN).

75
contourcoth)( LFI
TkTk
FIFxk
B
B
k •⎥⎦
⎤⎢⎣
⎡−⎟⎟
⎠
⎞⎜⎜⎝
⎛= (Eq. 5.8)
where F is the external force acting on the polymer chain, x is the extension of the
polymer chain, Lc is the contour length of the polymer chain, n is the number of
monomers in the polymer chain..
While force measurements of κ-carrageenan using bare AFM tip suggest that the
force curves are dominated by the single chain unfolding events, κ-carrageenan with
BSA-modified AFM tip typically generated multiple pull-off events. When more than
two unfolding events were detected, the result of individual contour length was displayed
as a function of the event index and came with slight difference among three groups, as
shown in Figure 5.8. While the contour lengths of the complex conditions were
represented by linear regression (p < 0.05) of more than 90% of multiple unfolding
events, force curves of single carrageenan didn’t show good linearity as the complex
system. This specific condition indicates the existence of linear relationship among
breaking of consecutive binding events, and this results are similar to the rupture of titin,
where the adhesive modules by successive binding events help to understand the
elasticity of protein titin.46, 47, 49, 52
In addition, the slope of the contour length versus consecutive peaked event from
Figure 5.8 represents the contour length of each domain, and these values are compared
in Figure 5.9. The individual contour length of carrageenan is at least twice longer than
the combined valued with BSA since originally the chain of κ-carrageenan is longer, and
the molecular weight of κ-carrageenan is larger than the small globular protein BSA. As
BSA on the tip interacts with the chain of carrageenan, its length was significantly
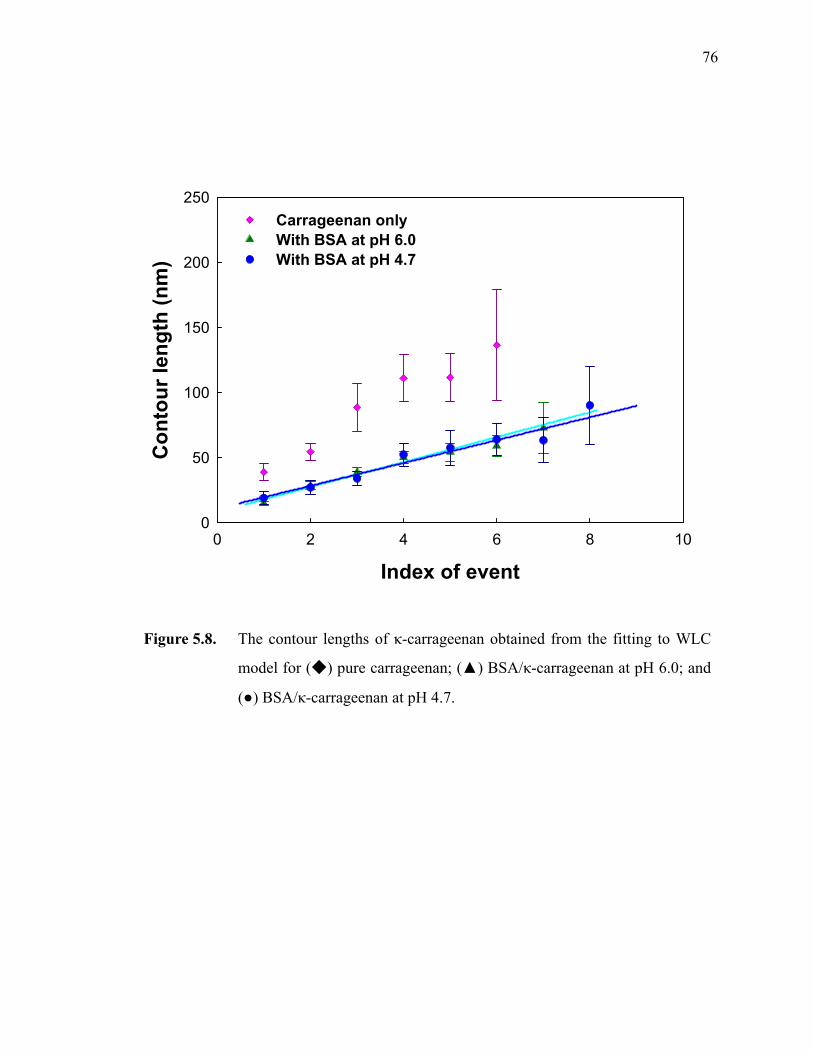
76
Index of event0 2 4 6 8 10
Con
tour
leng
th (n
m)
0
50
100
150
200
250Carrageenan onlyWith BSA at pH 6.0With BSA at pH 4.7
Figure 5.8. The contour lengths of κ-carrageenan obtained from the fitting to WLC
model for (◆) pure carrageenan; (▲) BSA/κ-carrageenan at pH 6.0; and
(●) BSA/κ-carrageenan at pH 4.7.
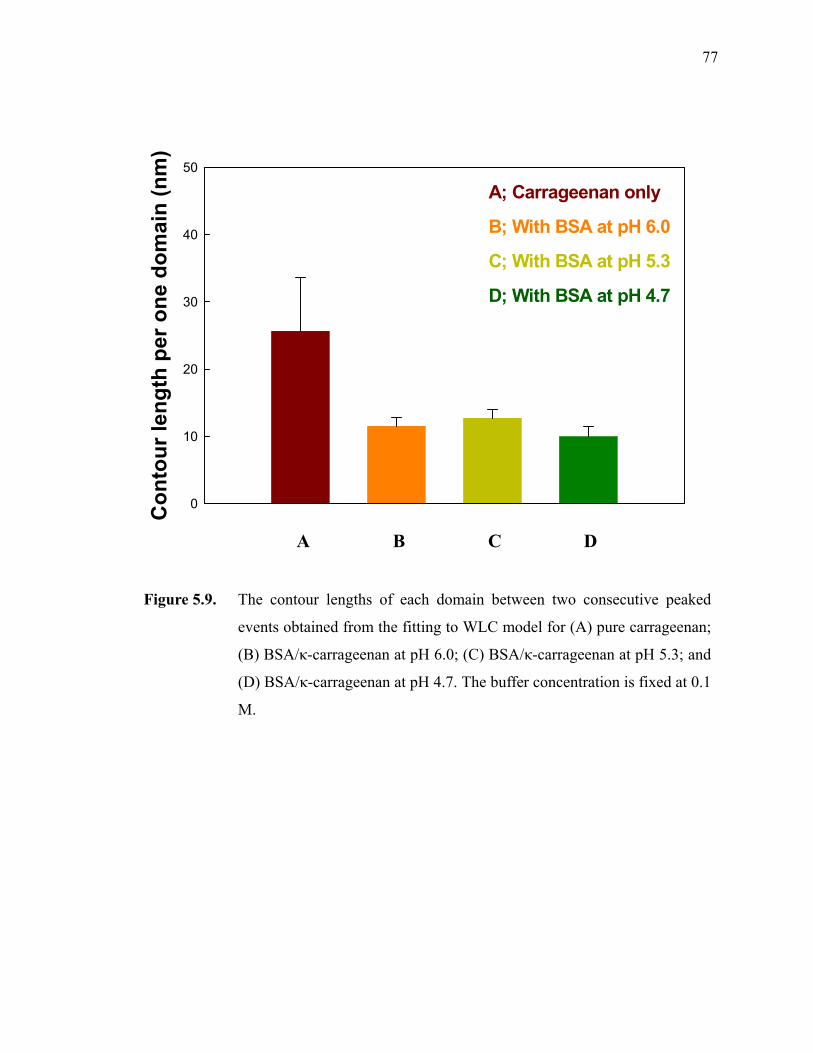
77
Con
tour
leng
th p
er o
ne d
omai
n (n
m)
0
10
20
30
40
50
A B C D
Figure 5.9. The contour lengths of each domain between two consecutive peaked
events obtained from the fitting to WLC model for (A) pure carrageenan;
(B) BSA/κ-carrageenan at pH 6.0; (C) BSA/κ-carrageenan at pH 5.3; and
(D) BSA/κ-carrageenan at pH 4.7. The buffer concentration is fixed at 0.1
M.
A; Carrageenan only
B; With BSA at pH 6.0
C; With BSA at pH 5.3
D; With BSA at pH 4.7
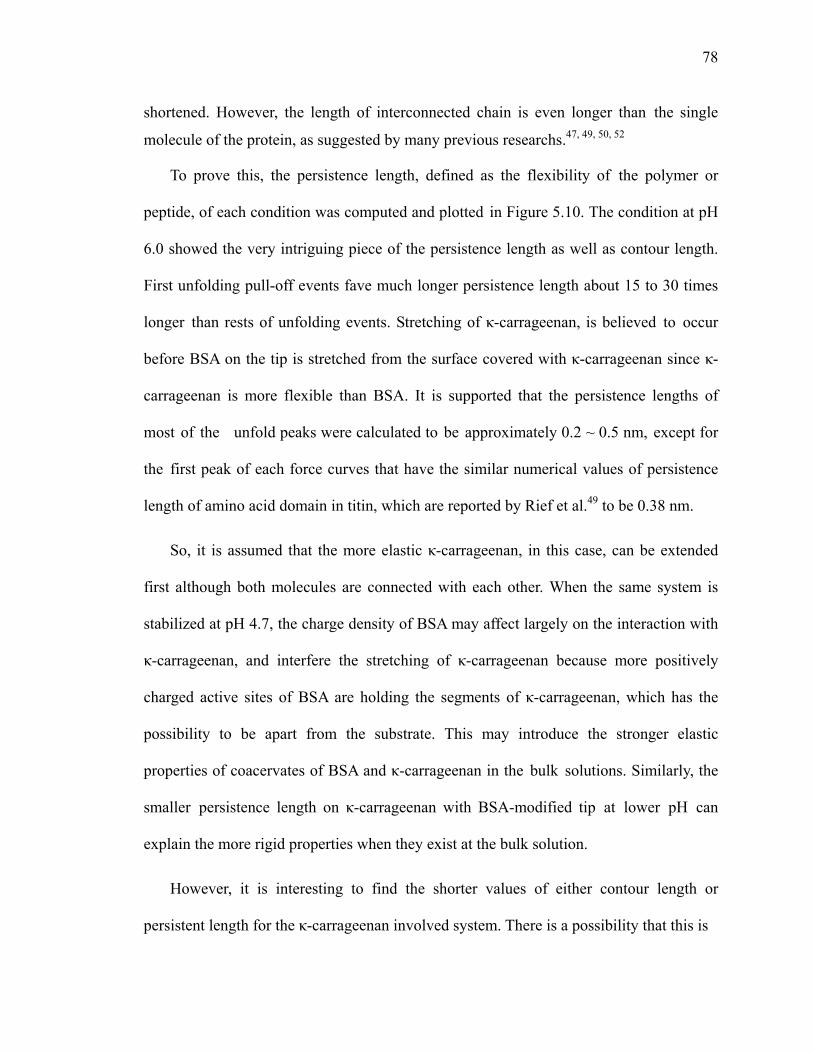
78
shortened. However, the length of interconnected chain is even longer than the single
molecule of the protein, as suggested by many previous researchs.47, 49, 50, 52
To prove this, the persistence length, defined as the flexibility of the polymer or
peptide, of each condition was computed and plotted in Figure 5.10. The condition at pH
6.0 showed the very intriguing piece of the persistence length as well as contour length.
First unfolding pull-off events fave much longer persistence length about 15 to 30 times
longer than rests of unfolding events. Stretching of κ-carrageenan, is believed to occur
before BSA on the tip is stretched from the surface covered with κ-carrageenan since κ-
carrageenan is more flexible than BSA. It is supported that the persistence lengths of
most of the unfold peaks were calculated to be approximately 0.2 ~ 0.5 nm, except for
the first peak of each force curves that have the similar numerical values of persistence
length of amino acid domain in titin, which are reported by Rief et al.49 to be 0.38 nm.
So, it is assumed that the more elastic κ-carrageenan, in this case, can be extended
first although both molecules are connected with each other. When the same system is
stabilized at pH 4.7, the charge density of BSA may affect largely on the interaction with
κ-carrageenan, and interfere the stretching of κ-carrageenan because more positively
charged active sites of BSA are holding the segments of κ-carrageenan, which has the
possibility to be apart from the substrate. This may introduce the stronger elastic
properties of coacervates of BSA and κ-carrageenan in the bulk solutions. Similarly, the
smaller persistence length on κ-carrageenan with BSA-modified tip at lower pH can
explain the more rigid properties when they exist at the bulk solution.
However, it is interesting to find the shorter values of either contour length or
persistent length for the κ-carrageenan involved system. There is a possibility that this is
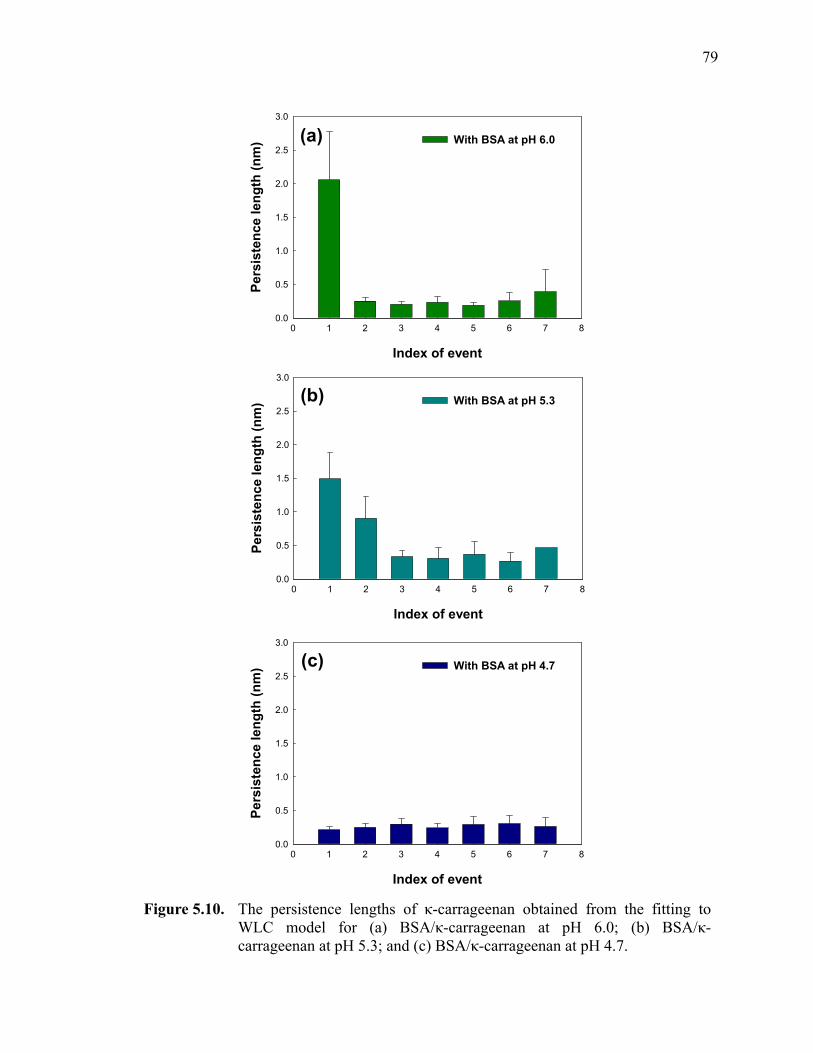
79
(a)
Index of event
0 1 2 3 4 5 6 7 8
Pers
iste
nce
leng
th (n
m)
0.0
0.5
1.0
1.5
2.0
2.5
3.0
With BSA at pH 6.0
(b)
Index of event
0 1 2 3 4 5 6 7 8
Pers
iste
nce
leng
th (n
m)
0.0
0.5
1.0
1.5
2.0
2.5
3.0
With BSA at pH 5.3
(c)
Index of event
0 1 2 3 4 5 6 7 8
Pers
iste
nce
leng
th (n
m)
0.0
0.5
1.0
1.5
2.0
2.5
3.0
With BSA at pH 4.7
Figure 5.10. The persistence lengths of κ-carrageenan obtained from the fitting to
WLC model for (a) BSA/κ-carrageenan at pH 6.0; (b) BSA/κ-carrageenan at pH 5.3; and (c) BSA/κ-carrageenan at pH 4.7.

80
caused by inappropriate use of WLC model to fit the single molecules of κ-carrageenan
since the fitting of carrageenans has been done by FJC model for the molecules having
the free and independent rotating segments.53, 54
V.4. Conclusions
The interactions of bovine serum albumin (BSA) with negatively-charged surfaces,
such as mica and κ-carrageenan, in saline solutions of different pH values have been
studied by CFM. CFM measurement allows the directly measurement of the binding
force between proteins and polysaccharides. For BSA interactions with mica surface,
when pH increases, the statistical analysis of the CFM results show that the averaged
pull-off force for the elongation monotonously decreases. The decrease of pull-off force
with the increase of pH results from the decrease of the strength of hydrogen bonding and
the number of interaction pairs, as well as the slight increase of the strength of van der
Waals interaction, suggesting that the force-extension curve is mainly contributed by the
van der Waals interaction. Similar results are also found in BSA interactions with κ-
carrageenan. CFM results indicate at least two pull-off events occur in the force-
extension curves of BSA/κ-carrageenan mixtures. The lower force one is interpreted as
due to non-specific binding, while the higher-force one is due to the specific binding
between BSA-modified tip and κ-carrageenan.
V.5. References
1. Nguyen TQ. 1986. Interactions of human hemoglobin with high-molecular-
81
weight dextran sulfate and diethylaminoethyl dextran. Die Makromolekulare Chemie. 187(11):2567-78.
2. Kokufuta E, Shimizu H, Nakamura I. 1981. Salt linkage formation of poly(diallyldimethylammonium chloride) with acidic groups in the polyion complex between human carboxyhemoglobin and potassium poly(vinyl alcohol) sulfate. Macromolecules. 14(5):1178-80.
3. Burgess DJ, Carless JE. 1984. Microelectrophoretic studies of gelatin and acacia gum for prediction of complex coacervation. Journal of Colloid and Interface Science. 88:1-8.
4. Lenk T, Thies C, Complex coacervation of acid precursor gelatin with a polyphosphate. ed.; American Chemical Society: Washington DC, 1986; 'Vol.' 302 ACS symposium series, p 240-50.
5. Bungenberg de Jong HG. 1949. In: Kruyt HR,·editor. editors. Colloid science. New York: Elsevier Science Publishing Co., Inc. Vol.·2.
6. Gibbs BF, Kermasha S, Alli I, Mulligan CN. 1999. Encapsulation in the food industry: a review. International Journal of Food Sciences and Nutrition. 50(3):213 - 24.
7. Deasy PB. 1984. ed. New York, NY: Marcel Dekker, Inc. 61–95·p.
8. Kayes JB. 1977. Pharmaceutical suspensions: micro electrophoretic properties. Journal of Pharmacy and Pharmacology. 29(3):163-8.
9. Burgess DJ. 1990. Practical analysis of complex coacervate systems. Journal of Colloid and Interface Science. 140(1):227-38.
10. Burgess DJ, Singh ON. 1993. Spontaneous formation of small sized albumin/acacia coacervate particles. Journal of Pharmacy and Pharmacology. 45(7):586-91.
11. Daniels R, Mittermaier EM. 1995. Influence of pH adjustment on microcapsules obtained from complex coacervation of gelatin and acacia. Journal of Microencapsulation. 12(6):591-9.
12. Hansen PMT, Hidalgo J, Gould IA. 1971. Reclamation of whey protein with carboxymethylcellulose. Journal of Dairy Science. 54(6):830-4.
13. Noguchi H. 1960. Interactions of serum albumin and synthetic polyelectrolytes in various buffer systems. Journal of Physical Chemistry. 64:185-7.
14. Semenova MG. 1996. Factors determining the character of biopolymer-
82
biopolymer interactions in multicomponent aqueous solutions modeling food systems. ACS Symposium Series. 650(Macromolecular Interactions in Food Technology):37-49.
15. Xia J, Dubin PL. 1994. In: Dubin PL, Bock J, Davis RM, Schulz DN, Thies C, editors. Macromolecular cmplexes in chemistry and biology. Berlin: Springer-Verlag. p·247-71.
16. Kaibara K, Okazaki T, Bohidar HB, Dubin PL. 2000. pH-Induced coacervation in complexes of bovine serum albumin and cationic polyelectrolytes. Biomacromolecules. 1(1):100-7.
17. Xia J, Dubin PL, Kim Y, Muhoberac BB, Klimkowski VJ. 1993. Electrophoretic and quasi-elastic light scattering of soluble protein-polyelectrolyte complexes. Journal of Physical Chemistry. 97(17):4528-34.
18. Mattison KW, Dubin PL, Brittain IJ. 1998. Complex formation between bovine serum albumin and strong polyelectrolytes: Effect of polymer charge density. J. Phys. Chem. B. 102(19):3830-6.
19. Grymonpre KR, Staggemeier BA, Dubin PL, Mattison KW. 2001. Identification by integrated computer modeling and light scattering studies of an electrostatic serum albumin-hyaluronic acid binding site. Biomacromolecules. 2(2):422-9.
20. Florin EL, Moy VT, Gaub HE. 1994. Adhesion forces between individual ligand-receptor pairs. Science (Washington, DC, United States). 264(5157):415-7.
21. Moy VT, Florin E-L, Gaub HE. 1994. Intermolecular forces and energies between ligands and receptors. Science (Washington, DC, United States). 266(5183):257-9.
22. Binnig G, Gerber C, Stoll E, Albrecht TR, Quate CF. 1987. Atomic resolution with atomic force microscope. Europhysics Letters. 3(12):1281-6.
23. Baselt DR, Lee GU, Colton RJ. 1996. Biosensor based on force microscope technology. Journal of Vacuum Science & Technology, B: Microelectronics and Nanometer Structures. 14(2):789-93.
24. Gunning AP, Cairns P, Kirby AR, Round AN, Bixler HJ, Morris VJ. 1998. Characterising semi-refined iota-carrageenan networks by atomic force microscopy. Carbohydrate Polymers. 36(1):67-72.
25. Jaschke M, Butt HJ, Gaub HE, Manne S. 1997. Surfactant aggregates at a metal surface. Langmuir. 13(6):1381-4.
26. Kirby AR, Gunning AP, Morris VJ. 1996. Imaging polysaccharides by atomic
83
force microscopy. Biopolymers. 38(3):355-66.
27. McIntire TM, Brant DA. 1999. Imaging of carrageenan macrocycles and amylose using noncontact atomic force microscopy. International Journal of Biological Macromolecules. 26(4):303-10.
28. Morris VJ, Gunning AP, Kirby AR, Round A, Waldron K, Ng A. 1997. Atomic force microscopy of plant cell walls, plant cell wall polysaccharides and gels. International Journal of Biological Macromolecules. 21(1-2):61-6.
29. Roesch R, Cox S, Compton S, Happek U, Corredig M. 2004. Κ-carrageenan and β-lactoglobulin interactions visualized by atomic force microscopy. Food Hydrocolloids. 18(3):429-39.
30. Maurstad G, Danielsen S, Stokke BT. 2003. Analysis of compacted semiflexible polyanions visualized by atomic force microscopy: Influence of chain stiffness on the morphologies of polyelectrolyte complexes. J. Phys. Chem. B. 107(32):8172-80.
31. Benoit M, Gabriel D, Gerisch Gt, Gaub HE. 2000. Discrete interactions in cell adhesion measured by single-molecule force spectroscopy. Nature Cell Biology. 2(6):313-7.
32. Cui S, Liu C, Zhang W, Zhang X, Wu C. 2003. Desorption force per polystyrene segment in water. Macromolecules. 36(11):3779-82.
33. Zhang W, Zou S, Wang C, Zhang X. 2000. Single polymer chain elongation of poly(N-isopropylacrylamide) and poly(acrylamide) by atomic force microscopy. J. Phys. Chem. B. 104(44):10258-64.
34. Heymann B, Grubmuller H. 2000. Dynamic force spectroscopy of molecular adhesion bonds. Physical Review Letters. 84(26, Pt. 1):6126-9.
35. Li H, Rief M, Oesterhelt F, Gaub HE. 1999. Force spectroscopy on single xanthan molecules. Applied Physics A: Materials Science & Processing. 68(4):407-10.
36. Xu Q, Zhang W, Zhang X. 2002. Oxygen bridge inhibits conformational transition of 1,4-linked α-D-galactose detected by single-molecule atomic force microscopy. Macromolecules. 35(3):871-6.
37. Gimzewski JK, Joachim C. 1999. Nanoscale science of single molecules using local probes. Science. 283(5408):1683-8.
38. Dickinson E. 2003. Hydrocolloids at interfaces and the influence on the
84
properties of dispersed systems. Food Hydrocolloids. 17(1):25-39.
39. Hugerth A, Sundel L-O. 2001. The effect of polyelectrolyte counterion specificity, charge density, and conformation on polyelectrolyte-amphiphile interaction: The carrageenan/furcellaran-amitriptyline system. Biopolymers. 58(2):186-94.
40. Yaseen EI, Herald TJ, Aramouni FM, Alavi S. 2005. Rheological properties of selected gum solutions. Food Research International. 38(2):111-9.
41. Dickinson E, Pawlowsky K. 1998. Influence of κ-carrageenan on the properties of a protein-stabilized emulsion. Food Hydrocolloids. 12(4):417-23.
42. de Ruiter GA, Rudolph B. 1997. Carrageenan biotechnology. Trends in Food Science & Technology. 8(12):389-95.
43. Bixler HJ, Johndro K, Falshaw R. 2001. Kappa-2 carrageenan: structure and performance of commercial extracts: II. Performance in two simulated dairy applications. Food Hydrocolloids. 15(4-6):619-30.
44. Dubois LH, Nuzzo RG. 1992. Synthesis, structure, and properties of model organic surfaces. Annual Review of Physical Chemistry. 43(1):437-63.
45. Janshoff A, Neitzert M, fer YO, Fuchs H. 2000. Force spectroscopy of molecular systems-single molecule spectroscopy of polymers and biomolecules. Angewandte Chemie. 39(18):3212-37.
46. Marszalek PE, Lu H, Li H, Carrion-Vazquez M, Oberhauser AF, Schulten K, Fernandez JM. 1999. Mechanical unfolding intermediates in titin modules. Nature. 402(6757):100-3.
47. Oberhauser AF, Marszalek PE, Carrion-Vazquez M, Fernandez JM. 1999. Single protein misfolding events captured by atomic force microscopy. Nature Structural Biology. 6(11):1025-8.
48. Rief M, Clausen-Schaumann H, Gaub HE. 1999. Sequence-dependent mechanics of single DNA molecules. Nature Structural Biology. 6(4):346-9.
49. Rief M, Gautel M, Oesterhelt F, Fernandez JM, Gaub HE. 1997. Reversible unfolding of individual titin immunoglobulin domains by AFM. Science. 276(5315):1109-12.
50. Fisher TE, Marszalek PE, Oberhauser AF, Carrion-Vazquez M, Fernandez JM. 1999. The micro-mechanics of single molecules studied with atomic force microscopy. Journal of Physiology. 520(1):5-14.
85
51. Sanchez C, Renard D, Robert P, Schmitt C, Lefebvre J. 2002. Structure and rheological properties of acacia gum dispersions. Food Hydrocolloids. 16(3):257-67.
52. Oberhauser AF, Marszalek PE, Erickson HP, Fernandez JM. 1998. The molecular elasticity of the extracellular matrix protein tenascin. Nature (London). 393(6681):181-5.
53. Xu Q, Zou S, Zhang W, Zhang X. 2001. Single-molecule force spectroscopy on carrageenan by means of AFM. Macromolecular Rapid Communications. 22(14):1163-7.
54. Zou S, Zhang W, Zhang X, Jiang B. 2001. Study on polymer micelles of hydrophobically modified ethyl hydroxyethyl cellulose using single-molecule force spectroscopy. Langmuir. 17(16):4799-808.
86
VI. RHEOLOGICAL PROPERTIES AND
INTERACTIONS BETWEEN BOVINE SERUM
ALBUMIN AND CARRAGEENANS
VI.1. Introduction
Carrageenans/furcelleran, which are found in intercellular matrix materials of
numerous species of red seaweed, are linear sulfated polysaccharides that are widely used
as gelling agents, thickeners, and stabilizers in milk-based products. They are
hydrocolloids with a primary structure of alternating α-(1→3)- and β-(1→4)- linked
galactose residues. The available anionic carrageenans include furcelleran, λ-, ι-, and κ-
carrageenan, which have similar chemical structure but different linear charge density (#
of sulfate group per disaccharide). The linear charge densities of λ-, ι-, κ-carrageenan,
and furcelleran are 2.07, 1.53, 0.92, and 0.69, respectively.1
Carrageenans/furcelleran interact strongly with oppositely charged globular proteins
such as bovine serum albumin (BSA). The electrostatic characteristics of such
interactions are mainly influenced by the structural parameter such as linear charge
density of polysaccharides and physicochemical conditions, such as pH, ionic strength,
polysaccharides counter cation specificity, and temperature.2 The electrostatic interaction
may induce different kind of phase separations, resulting in different viscoelastic
properties. At solutions of low pH (<6.0), the mixture of carrageenans/furcelleran and
87
BSA may undergo two types of phase separation: (1) solid-liquid phase separation call
precipitation; and (2) liquid-liquid phase separation called coacervation. The coacervation
phenomenon has been widely used in the microencapsulation of food ingredients,
enzymes, and cells. The release rate of the encapsulated food ingredients depends on the
viscoelastic properties of the coacervates.
In this chapter, we focus our attention on the effects of ionic strength, pH, linear
charge density of polysaccharides, and polysaccharides counter cation specificity on the
rheological properties of carrageenans/furcelleran-BSA complexes. The complexes
formed by BSA and κ-carrageenan were studied using several different techniques,
including turbidimetric titration, dynamic light scattering, and rheometry.
VI.2. Materials and Methods
VI.2.1. Materials
Bovine serum albumin (BSA, A7906, Lot. 102K0522), κ- (C-1013; Lot. 121K1653),
ι-(C-1138; Lot. 81K1556), and λ-(C-3889; Lot. 062K1766) carrageenan were purchased
from Sigma Chemical Co. (St. Louis, MO) and used without further purification.
Furcelleran was kindly provided by Dr. James J. Modliszewski of FMC (Princeton, NJ).
Salts like NaCl, KCl, LiCl, and (CH3)4NCl) were purchased from Aldrich Chemical Co.
(Milwaukee, WI). Standard NaOH (0.05 N) and HCl (0.05 N) solutions and analytical
grade NaCl were from Fisher Scientific (Pittsburgh, PA). All solutions were prepared
with Milli-Q water (Millipore, Milford, MA) and filtered with 0.45 µm syringe filters.
88
VI.2.2. Sample Preparations
Various concentrations of BSA and carrageenan mixtures were prepared by diluting
the stock solutions with salt solutions of different ionic strengths. The ratio of BSA to
carrageenan varied from 1:1 to 30:1 and the concentration of the total biopolymer was set
at 5 g/L. The coacervate samples of carrageenan-BSA mixtures were prepared by first
adjusting the pH of the mixtures to 4.5 under magnetic stirring, followed by centrifuging
at spin-speed of 8,000 RPM.
VI.2.3. Potentiometric Titration
pH of the solutions were measured using a VWR pH meter equipped with a
combination electrode at 23±1°C. pH values were recorded when the meter response was
stable to better than 0.01 pH/min. The time required to reach this equilibrium varied from
2 min for optically clear solutions to ca. 2 – 10 min or more for turbid (coacervate)
samples.
VI.2.4. Turbidimetric Titration
Turbidity measurements were carried out with a Brinkman PC 910 colorimeter,
equipped with a 1 cm probe and a 420 nm filter. The probe was cleaned by immersion in
1 M NaCl under magnetic stirring for a few minutes followed by washing with deionized
water, and the colorimeter was calibrated to read 100% transmittance with Milli-Q water
before each titration. Turbidity is defined as 100% – T. All titrations were carried out with
89
gentle magnetic stirring, and the time interval between measurements was ~ 2 mins or
more.
VI.2.5. Rheological Measurements
Rheological measurements were performed on a strain-controlled rheometer (ARES,
TA Instruments, New Castle, U.S.A.) fitted with parallel plate geometries (25 or 50 mm
in diameter). BSA/carrageenan coacervate samples were loaded onto the plate for 10
mins to allow the stresses to relax and the samples to reach thermal equilibrium. Storage
modulus (G') and loss modulus (G") were measured while the frequency was being varied
from 0.01 to 100 rad/sec. Strain sweep tests and stress sweep test were preliminarily
carried out to determine the proper conditions of rheological measurements.
VI.3. Results and Discussion
κ-carrageenan is a negatively-charged sulphated polyelectrolyte, while BSA is either
positively or negatively charged at above or below the isoelectric point (pI). Phase
separation behaviors in protein/polysaccharide complexes can be determined through
turbidimetric titration. Figure 6.1 shows the titration curves of turbidity (100-
transmittance T)% from turbidimetric titration and scattering intensity from DLS versus
pH for mixtures of BSA with κ-carrageenan (10:1) in 0.1 M NaCl solution with κ-
carrageenan concentration fixed at 0.5 g/L.
For tubidimetric titration, turbidity increased due to the aggregation of polymer.
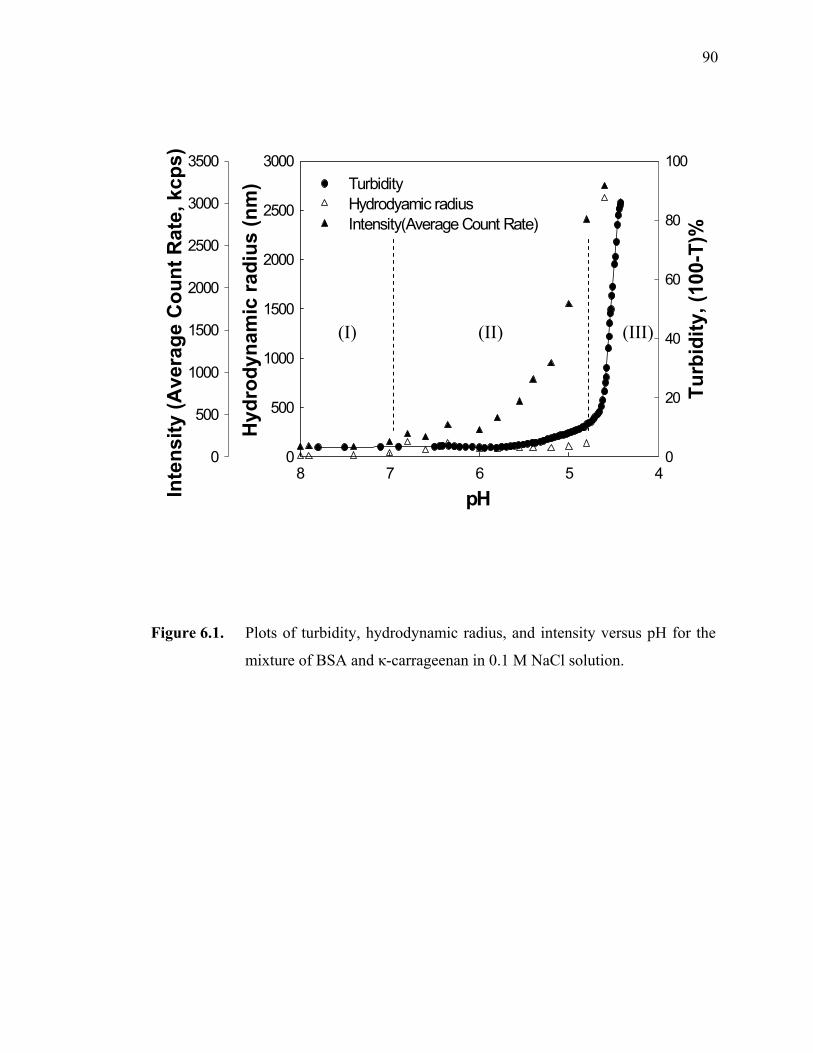
90
pH45678
Turb
idity
, (10
0-T)
%
0
20
40
60
80
100
Hyd
rody
nam
ic ra
dius
(nm
)
0
500
1000
1500
2000
2500
3000
0
500
1000
1500
2000
2500
3000
3500TurbidityHydrodyamic radiusIntensity(Average Count Rate)
Inte
nsity
(Ave
rage
Cou
nt R
ate,
kcp
s)
Figure 6.1. Plots of turbidity, hydrodynamic radius, and intensity versus pH for the
mixture of BSA and κ-carrageenan in 0.1 M NaCl solution.
(I) (II) (III)
91
Coacervates formed were detected by dramatically increased turbidity.3 As the pH
decreases to below the pI of the protein, two characteristic pH values, pHc and pHφ, were
observed in the pH titration curves. pHc is seen as the point of incipient polyanion
binding, which occurs when sufficient locally-positive charges develop on the protein
surface primary complex formation, initiated at pHc was viewed as a microscopic
transition on the molecular scales, whereas coacervate droplet formation at pHφ was
viewed as the global phase transition. It was verified through the scattering intensity that,
similar to the turbidity, the increase in scattering intensity is accompanying by the
increase in particle size. Thus, the increase in either the scattering intensity or the
turbidity suggests the complex formation. There are three regions observed in this pH
titration curve: (1) at pH>7.0, there is no change in solution turbidity; (2) at 4.8<pH<7.0,
although the solution turbidity change slightly, the scattering intensity starts to grow,
which is identified as the incipient of the soluble complex (pHc); and (3) at pH<4.8, both
turbidity and scattering intensity increase significantly with the decrease of pH, which
corresponds to the global phase separation point (pHφ). The pI of BSA is around 4.9 at
0.1 M NaCl solution.32 It should be pointed out that soluble complex occurs at pH>pI,
suggesting that even though the overall charge characteristics of BSA is negative, locally
there are positively charged patches on the protein surface, which can bind to the
negatively-charged κ-carrageenan. On the other hand, global phase separation only
occurs at pH<pI where the positive charges dominate the protein surface. The formation
of protein/polysaccharide complexes is also evidenced by the increase of viscosity with
the decrease of pH, as shown in Figure 6.2.
Figure 6.3 highlights the strong effect of the mixing ratio on complex formation.
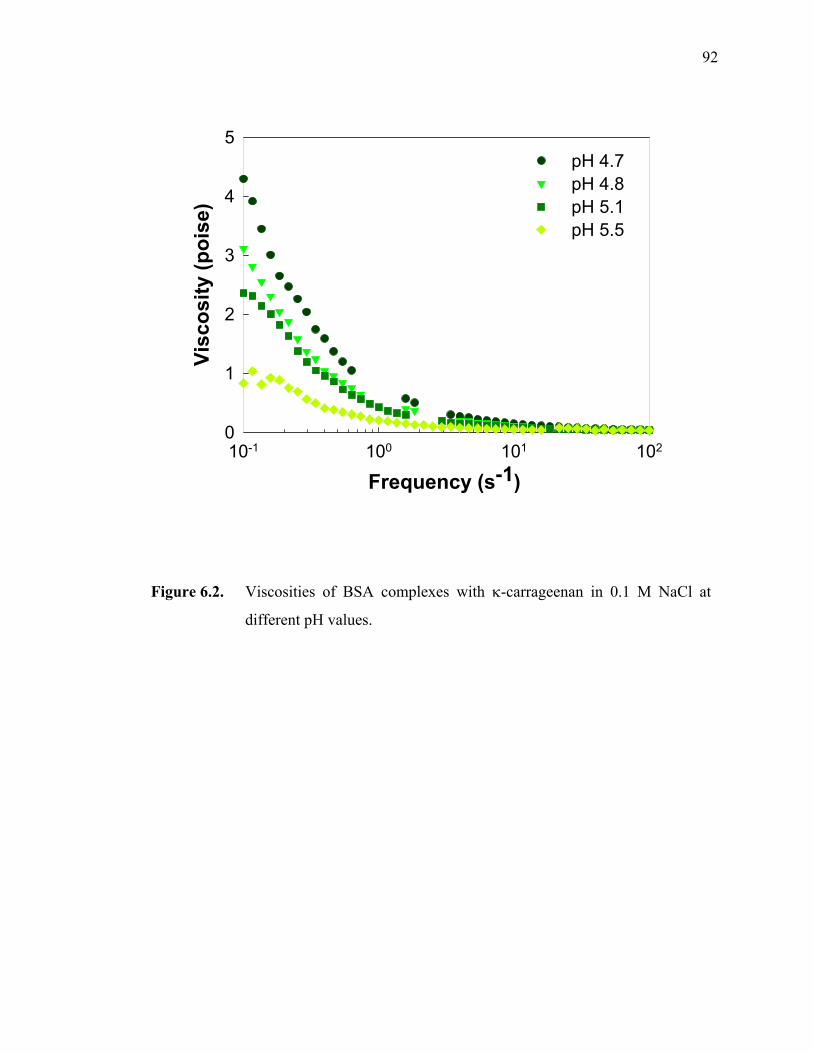
92
Frequency (s-1)10-1 100 101 102
Visc
osity
(poi
se)
0
1
2
3
4
5pH 4.7 pH 4.8 pH 5.1 pH 5.5
Figure 6.2. Viscosities of BSA complexes with κ-carrageenan in 0.1 M NaCl at
different pH values.
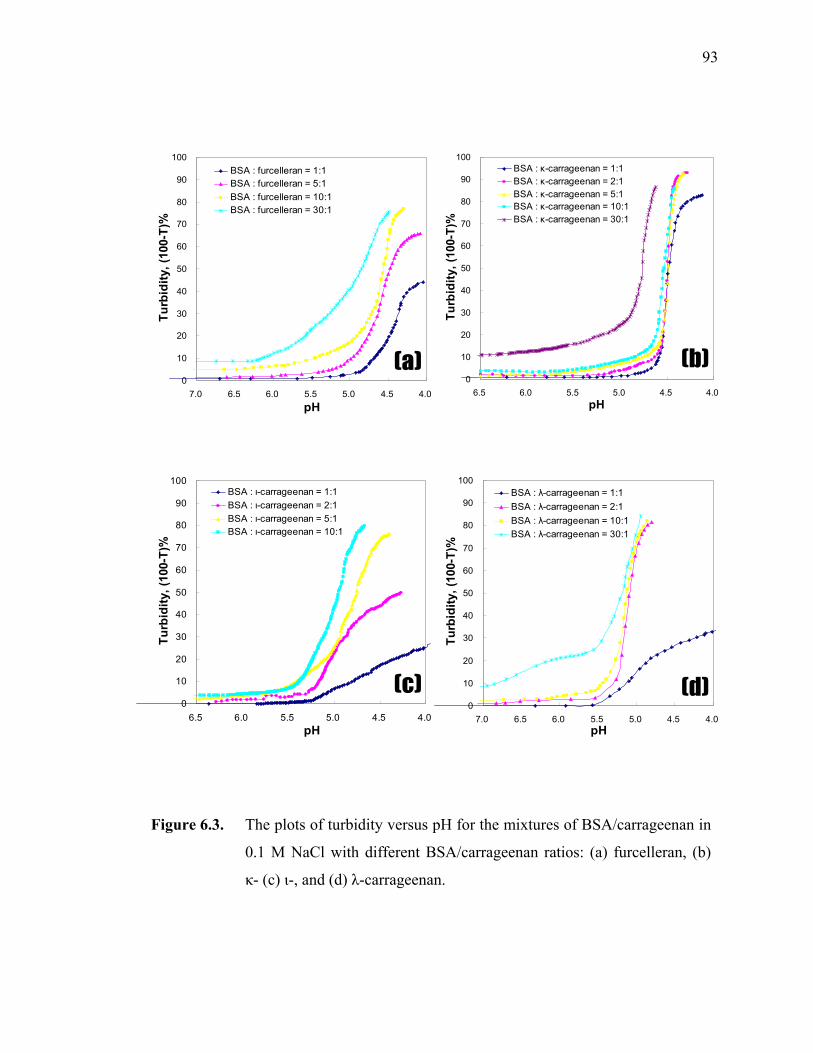
93
0
10
20
30
40
50
60
70
80
90
100
4.04.55.05.56.06.57.0pH
Turb
idity
, (10
0-T)
%BSA : furcelleran = 1:1BSA : furcelleran = 5:1BSA : furcelleran = 10:1BSA : furcelleran = 30:1
0
10
20
30
40
50
60
70
80
90
100
4.04.55.05.56.06.5pH
Turb
idity
, (10
0-T)
%
BSA : κ-carrageenan = 1:1BSA : κ-carrageenan = 2:1BSA : κ-carrageenan = 5:1BSA : κ-carrageenan = 10:1BSA : κ-carrageenan = 30:1
0
10
20
30
40
50
60
70
80
90
100
4.04.55.05.56.06.5pH
Turb
idity
, (10
0-T)
%
BSA : ι-carrageenan = 1:1BSA : ι-carrageenan = 2:1BSA : ι-carrageenan = 5:1BSA : ι-carrageenan = 10:1
0
10
20
30
40
50
60
70
80
90
100
4.04.55.05.56.06.57.0pH
Turb
idity
, (10
0-T)
%
BSA : λ-carrageenan = 1:1BSA : λ-carrageenan = 2:1BSA : λ-carrageenan = 10:1BSA : λ-carrageenan = 30:1
Figure 6.3. The plots of turbidity versus pH for the mixtures of BSA/carrageenan in
0.1 M NaCl with different BSA/carrageenan ratios: (a) furcelleran, (b)
κ- (c) ι-, and (d) λ-carrageenan.

94
Protein molecules are closed bound to the polymer chains until the polymer has no more
available binding sites for protein, similar to the results reported by Wen and Dubin3 for
the complexation of BSA and poly (dimethyldiallyl-ammonium chloride).
Solution turbidity changes when polysaccharides form complexes with proteins.
Figure 6.4 shows the turbidimetric titration curves for mixtures of BSA with λ-, ι-, κ-
carrageenan, and furcelleran in 0.1 M NaCl. The initial concentrations for BSA and
polysaccharide are 5 g/L and 0.5 g/L, respectively. The turbidity is constant and very
small at high pH. With the decrease of pH, the turbidity first shows a graduate increase,
followed by an abrupt increase. The former is identified as the incipient point of the
soluble complex, while the latter corresponds to phase separation. Both the initial
complexation and phase separation are characterized by well-defined pH values, i.e., pHc
and pHφ, which are directly related to the protein net charges. The linear charge densities
ξ of furcelleran, κ-carrageenan, ι–carrageenan, and λ-carrageenan are 0.69, 0.92, 1.53,
and 2.07, respectively.1 Early theoretical studies4-6 predicted phase-transition like
behavior, i.e., the existence of some critical conditions for complexation. At constant
temperature, the relationship among the critical surface charge density of colloidal
particle (σcrit), the linear charge density ξ of the polyelectrolyte, and Debye-Huckel
parameter κ (~I1/2) can in general be expressed as
acrit κξσ 1~ − (Eq. 5.1)
The only difference in the conclusions of Muthukumar,4 Odijk,5 and Weinbreck6 is
the exponent a, which appears as 11/5 in Muthukumar’s, as unity in Weinbreck’s, and as
3 in Odijk’s results. According to Eq. 5.1, at constant ionic strength (κ), the larger the ξ,
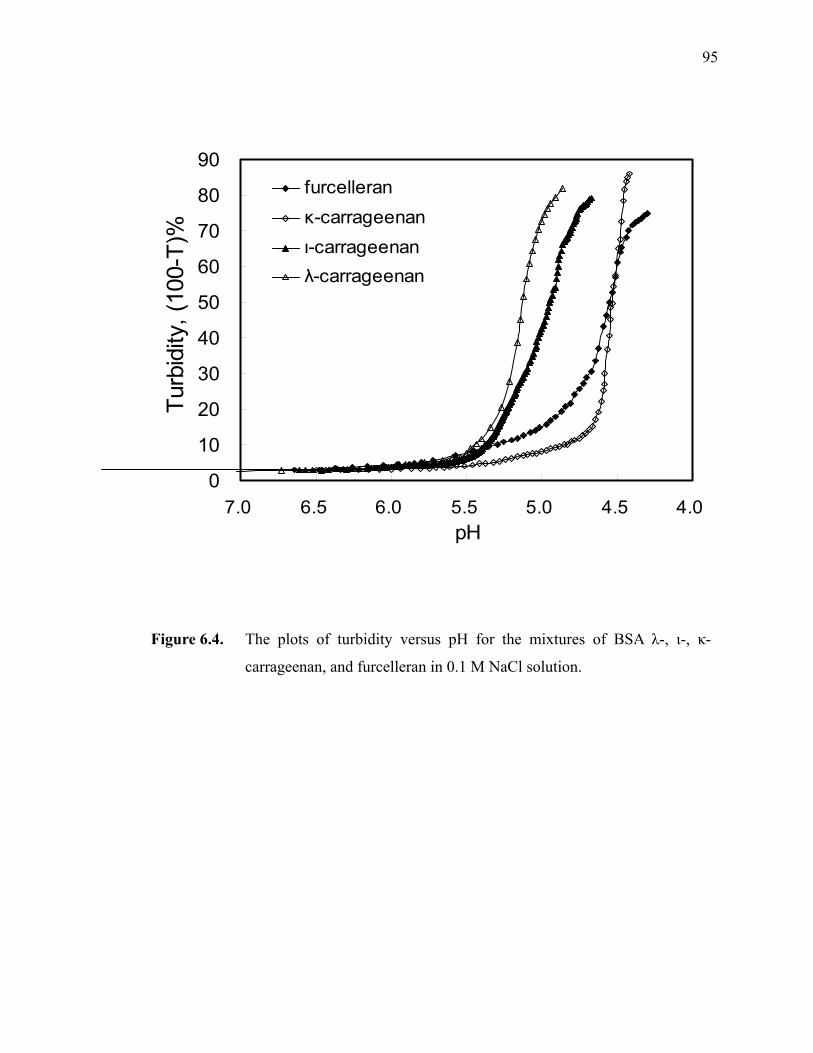
95
Figure 6.4. The plots of turbidity versus pH for the mixtures of BSA λ-, ι-, κ-
carrageenan, and furcelleran in 0.1 M NaCl solution.
0
10
20
30
40
50
60
70
80
90
4.04.55.05.56.06.57.0pH
Turb
idity
, (10
0-T)
%furcelleranκ-carrageenanι-carrageenanλ-carrageenan

96
the lower the value of σcrit or higher the pHφ for BSA. This prediction is demonstrated in
Figure 6.4, which shows that λ-carrageenan has higher pHφ (5.45) than κ-carrageenan
(pHφ=4.53).
Figure 6.5 shows the dependence of turbidity on pH for complexes of BSA and
various carrageenans (10:1) at different ionic strengths. The effects of ionic strength on
complex coacervation is a well-known phenomenon, and can also be interpreted by Eq.
5.1. The existence of microions in solution screens the charges of the polymers, thus
reduce the strength of their associative interactions.1 Consequently, the polymers bind to
the protein at a lower pH, where the protein builds up more positive charges. The screen
of the charges also reduces the number of soluble complexes formed.7 However, it should
be noticed here that the complexation is influenced by salt concentration at low pH. The
small amount of microions can even activate the coacervation a little bit because the
addition of small amount of salt screens the electrostatic repulsion to a larger degree than
the electrostatic attraction. At high salt concentration, both electrostatic repulsion and
attraction can be significantly screened, resulting in a lower coacervate yield..
The relationship between pHc, pHφ and ionic strength for BSA/furcelleran complex,
can be found in Figure 6.6, which shows that both pHc and pHφ have a linear relationship
with I1/2. The decrease of both pHc and pHφ with ionic strength suggests the decrease in
binding strength between BSA and furcelleran, which can be verified by AFM force
measurements. As discussed above, the microions in the solution screen the charges of
the polymers, thus reduce the range of their associative interactions.6, 8, 9
Despite of widespread industrial applications of coacervates, coacervation is still an
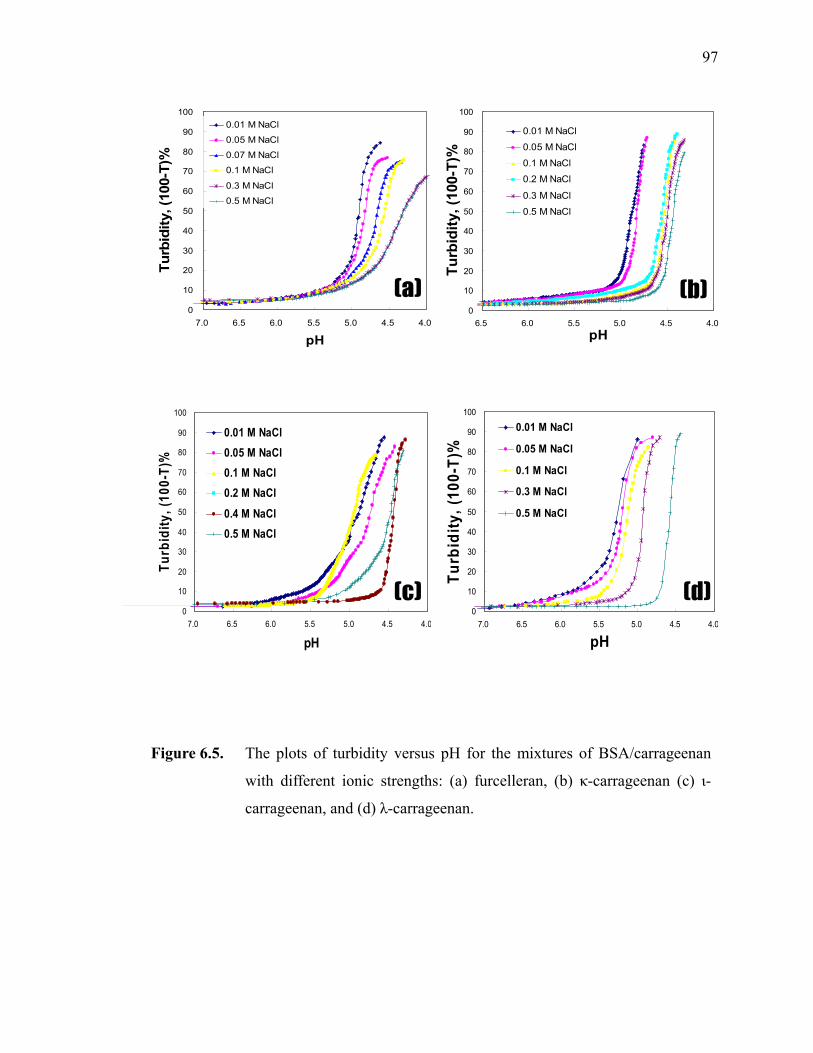
97
0
10
20
30
40
50
60
70
80
90
100
4.04.55.05.56.06.57.0
pH
Turb
idity
, (10
0-T)
%
0.01 M NaCl
0.05 M NaCl
0.07 M NaCl
0.1 M NaCl
0.3 M NaCl
0.5 M NaCl
0
10
20
30
40
50
60
70
80
90
100
4.04.55.05.56.06.5pH
Turb
idity
, (10
0-T)
%
0.01 M NaCl
0.05 M NaCl
0.1 M NaCl
0.2 M NaCl
0.3 M NaCl
0.5 M NaCl
0
10
20
30
40
50
60
70
80
90
100
4.04.55.05.56.06.57.0
pH
Turb
idity
, (10
0-T)
%
0.01 M NaCl0.05 M NaCl0.1 M NaCl0.2 M NaCl
0.4 M NaCl0.5 M NaCl
0
10
20
30
40
50
60
70
80
90
100
4.04.55.05.56.06.57.0
pH
Turb
idity
, (10
0-T)
%
0.01 M NaCl
0.05 M NaCl
0.1 M NaCl
0.3 M NaCl
0.5 M NaCl
Figure 6.5. The plots of turbidity versus pH for the mixtures of BSA/carrageenan
with different ionic strengths: (a) furcelleran, (b) κ-carrageenan (c) ι-
carrageenan, and (d) λ-carrageenan.
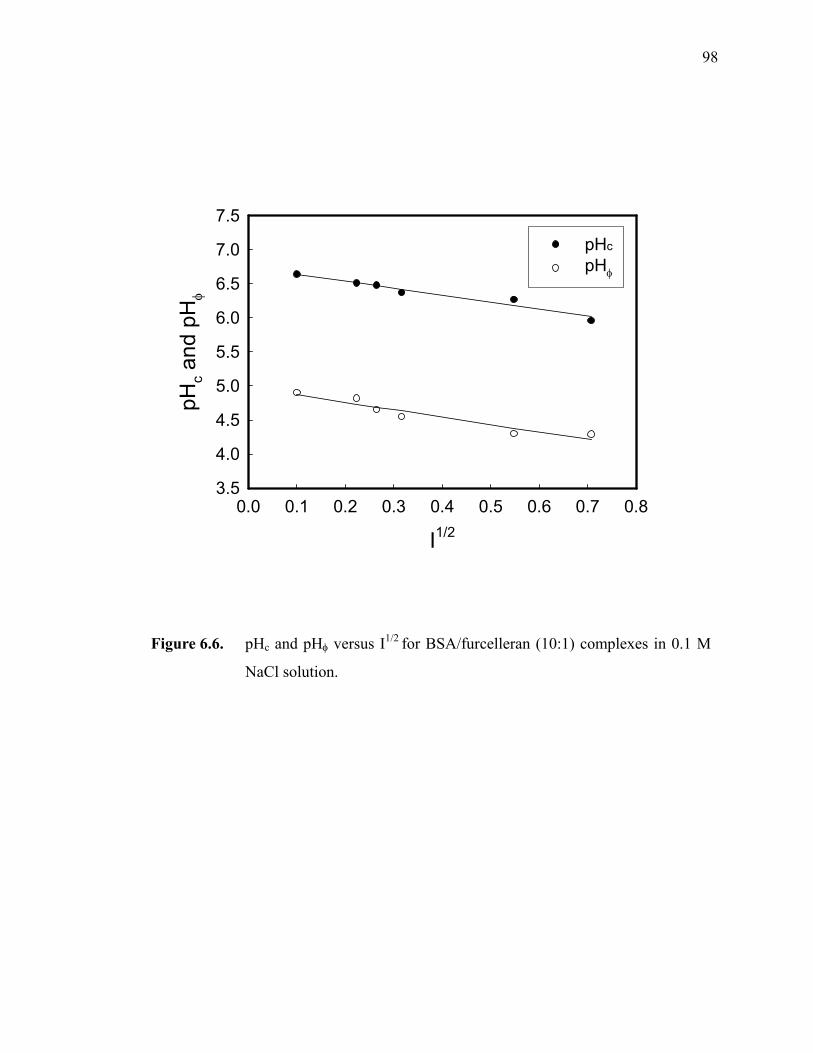
98
I1/2
0.0 0.1 0.2 0.3 0.4 0.5 0.6 0.7 0.8
pHc a
nd p
Hφ
3.5
4.0
4.5
5.0
5.5
6.0
6.5
7.0
7.5pHc
pHφ
Figure 6.6. pHc and pHφ versus I1/2 for BSA/furcelleran (10:1) complexes in 0.1 M
NaCl solution.
99
ill-understood problem. Many biological and synthetic polymers form physical gels
where bonding between chains is achieved through physical interactions, such as helix
formation, crystallization, etc. The energy involved in the crosslinking interactions is in
the order of kT, thus these gels are “thermoreversible”. In biological gels such as gelatin,
carrageenan, and gellan gum, helix formation is the principal origin of crosslinking.
However, how the phase separation induces the network formation in
protein/polysaccharide complexes remains unclear. Coacervates are dense polymer
solutions that spontaneously separate from dilute solutions, and the physical nature of
coacervate formed by BSA/κ-carrageenan complex can be studied using dynamic
rheological measurements.
Winter and Chambon found that the relaxation pattern of crosslinked polymeric
systems shows self-similarity at long time scale,10, 11
uSttG −=)( (Eq. 5.2)
where S is called the stiffness and u is the relaxation exponent. The storage modulus G'
and the loss modulus G" of a polymeric system, according to the theory of linear
viscoelasticity of polymers,12 are given by:
∫∞
=′0
)sin()()( dtttGG ωωω (Eq. 5.3)
∫∞
=′′0
)cos()()( dtttGG ωωω (Eq. 5.4)
Therefore, )(ωG′ and )(ωG ′′ for polymer gels are given by
)2
cos()1()( πωω uuSG u−Γ=′ (Eq. 5.5)
100
)2
sin()1()( πωω uuSG u−Γ=′′ (Eq. 5.5)
where Γ is the gamma function. )(ωG′ and )(ωG ′′ of a gelling systems thus obey a
scaling law with the same exponent, u:
uGG ωωω ∝′′′ )()( , (Eq. 5.6)
Therefore, parallel and straight lines with slopes u are obtained at the gel point upon
plotting both )(ωG′ and )(ωG ′′ versus angular frequency on double logarithmic scales.
The associative behavior of the BSA- κ-carrageenan complexes is evidenced by the
rheological data shown in Figure 6.7, which shows that at all frequency range studied, the
storage modulus G' of the complex is consistently highly than that of G", parallel and
straight lines were also observed in G' and G" versus ω curve at ω>0.5 rad/s, suggesting
the formation of highly interconnected gel-like network structure.
VI.4. Conclusions
Electronic interactions between BSA and carrageenans of different linear charge
densities confirm the occurrence of complex formation as a phase-transition like
phenomenon. The critical pH depends on both linear charge density of the carrageenan
and the ionic strength. Both increasing the ionic strength and decreasing the linear charge
density weaken the binding between BSA and carrageenan/furcelleran. Two characteristic
pHs were observed in the phase diagrams of carrageenan-BSA complexes through the
turbidimetric titration. The formation of gel-like interconnected network was found in
carrageenan-BSA coacervates.
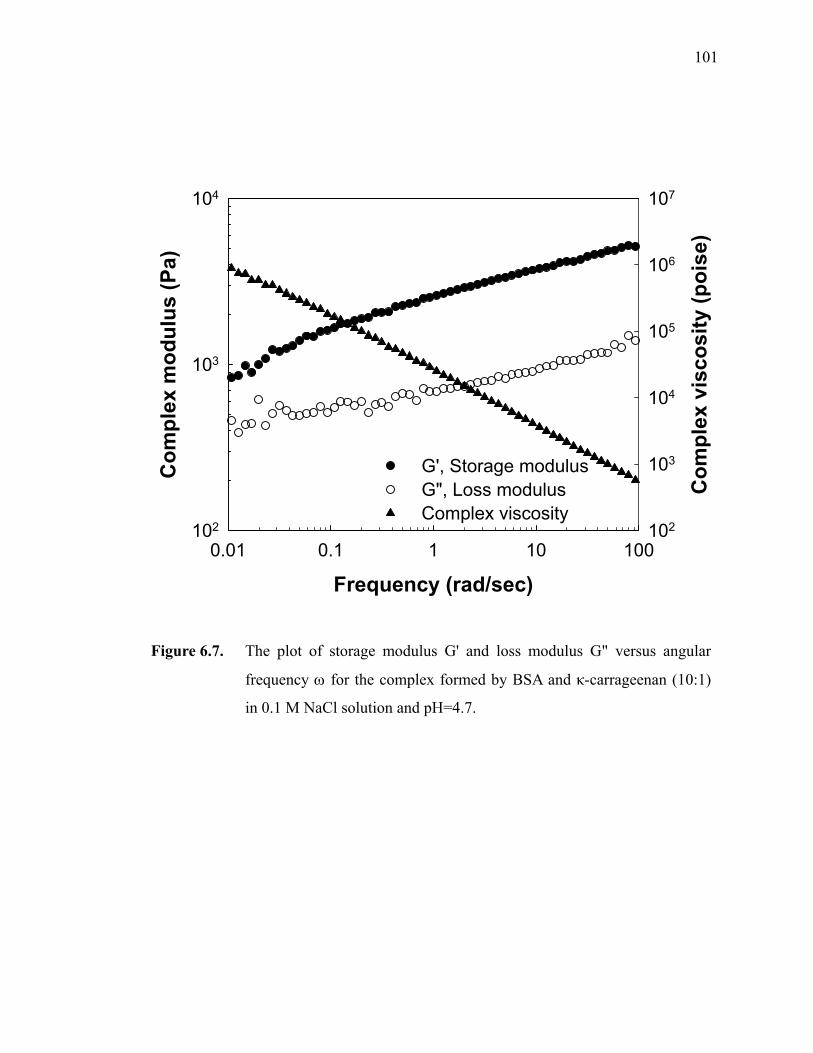
101
Frequency (rad/sec)0.01 0.1 1 10 100
Com
plex
mod
ulus
(Pa)
102
103
104
Com
plex
vis
cosi
ty (p
oise
)
102
103
104
105
106
107
G', Storage modulusG", Loss modulusComplex viscosity
Figure 6.7. The plot of storage modulus G' and loss modulus G" versus angular
frequency ω for the complex formed by BSA and κ-carrageenan (10:1)
in 0.1 M NaCl solution and pH=4.7.
102
VI.5. References
1. Hugerth A, Sundel L-O. 2001. The effect of polyelectrolyte counterion specificity, charge density, and conformation on polyelectrolyte-amphiphile interaction: The carrageenan/furcellaran-amitriptyline system. Biopolymers. 58(2):186-94.
2. Galazka VB, Smith D, Ledward DA, Dickinson E. 1999. Complexes of bovine serum albumin with sulphated polysaccharides: effects of pH, ionic strength and high pressure treatment. Food Chemistry. 64(3):303-10.
3. Wen Yp, Dubin PL. 1997. Potentiometric studies of the interaction of bovine serum albumin and poly(dimethyldiallylammonium chloride). Macromolecules. 30(25):7856-61.
4. Muthukumar M. 1987. Adsorption of a polyelectrolyte chain to a charged surface. Journal of Chemical Physics. 86(12):7230-5.
5. Odijk T. 1991. Formation of polyelectrolyte-micelle complexes. Langmuir. 7(10):1991-2.
6. Weinbreck F, de Vries R, Schrooyen P, de Kruif CG. 2003. Complex coacervation of whey proteins and gum Arabic. Biomacromolecules. 4(2):293-303.
7. Kayitmazer AB, Seyrek E, Dubin PL, Staggemeier BA. 2003. Influence of chain stiffness on the interaction of polyelectrolytes with oppositely charged micelles and proteins. J. Phys. Chem. B. 107(32):8158-65.
8. Seyrek E, Dubin PL, Tribet C, Gamble EA. 2003. Ionic strength dependence of protein-polyelectrolyte interactions. Biomacromolecules. 4(2):273-82.
9. Nickerson MT, Paulson AT. 2004. Rheological properties of gellan, kappa-carrageenan and alginate polysaccharides: effect of potassium and calcium ions on macrostructure assemblages. Carbohydrate Polymers. 58(1):15-24.
10. Chambon F, Winter HH. 1987. Linear viscoelasticity at the gel point of a crosslinking PDMS with imbalanced stoichiometry. Journal of Rheology (New York, NY, United States). 31(8):683-97.
11. Winter HH, Chambon F. 1986. Analysis of linear viscoelasticity of a crosslinking polymer at the gel point. Journal of Rheology. 30(2):367-82.
12. Ferry JD. Viscoelastic properties of polymers. John Wiley & Sons: New York, 1980.
103
VII. RHEOLOGICAL PROPERTIES OF COACERVATES
FORMED BY BOVINE SERUM ALBUMIN AND
PECTIN
VII.1. Introduction
Many complex foods are composed of protein, polysaccharide, or their mixtures.
Intermolecular or intramolecular binding of polysaccharides with water affects the
dynamic properties of final food products. This situation becomes more complicated with
the existence of salt, especially when the charged functional group is present in the chain
of polysaccharides. Although no chemical reaction will occur between salt ion and the
hydrolyzed polysaccharide, the changes in viscosity, elasticity, fluidity, and stability of
the food system may occur. In addition, pH and the protein/polysaccharide ratio also
influence their rheological properties.1-4
Food polysaccharides include either weak polyelectrolytes containing carboxyl
groups, such as pectin and alginate, or strong polyelectrolytes containing sulphate groups,
such as carrageenan. The interactions between a weak polyelectrolyte (e.g. pectin) and a
globular protein [e.g. bovine serum albumin (BSA)] have been used studied to understand
the effects of polysaccharides in complex food systems.
The anionic water-soluble polysaccharide examined in this work is pectin, which is a
natural polysaccharide extracted from plant cell walls, and widely known as a gelling and
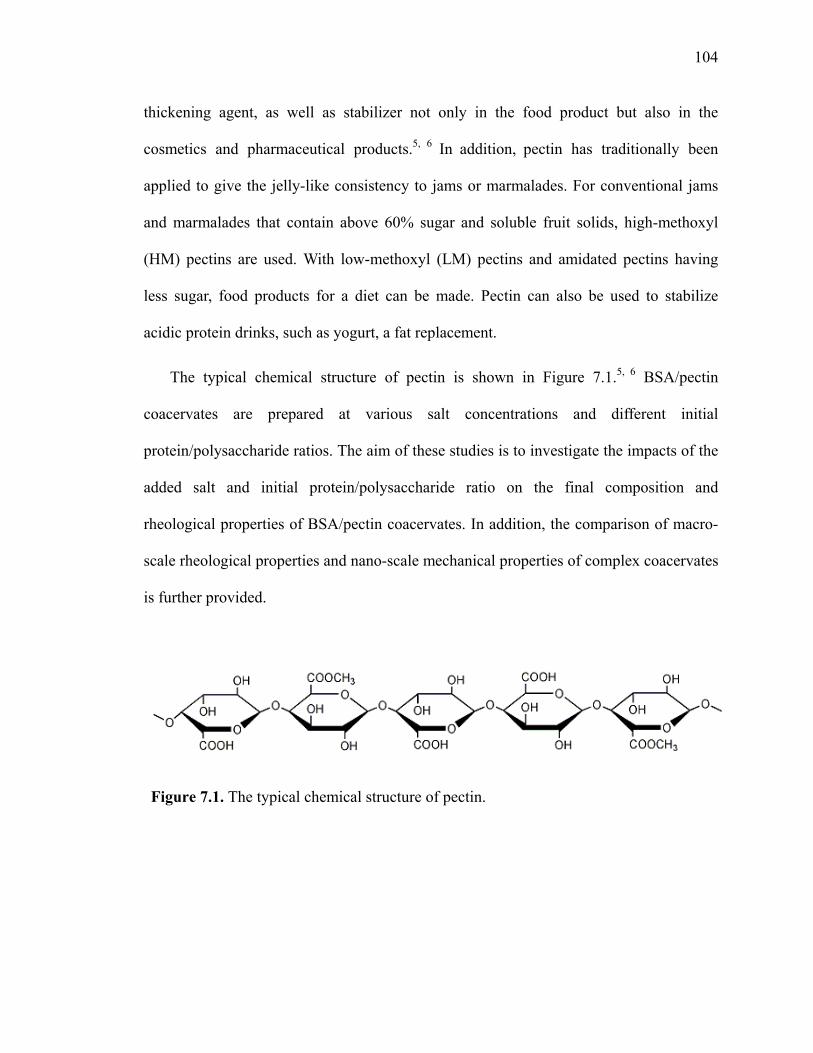
104
thickening agent, as well as stabilizer not only in the food product but also in the
cosmetics and pharmaceutical products.5, 6 In addition, pectin has traditionally been
applied to give the jelly-like consistency to jams or marmalades. For conventional jams
and marmalades that contain above 60% sugar and soluble fruit solids, high-methoxyl
(HM) pectins are used. With low-methoxyl (LM) pectins and amidated pectins having
less sugar, food products for a diet can be made. Pectin can also be used to stabilize
acidic protein drinks, such as yogurt, a fat replacement.
The typical chemical structure of pectin is shown in Figure 7.1.5, 6 BSA/pectin
coacervates are prepared at various salt concentrations and different initial
protein/polysaccharide ratios. The aim of these studies is to investigate the impacts of the
added salt and initial protein/polysaccharide ratio on the final composition and
rheological properties of BSA/pectin coacervates. In addition, the comparison of macro-
scale rheological properties and nano-scale mechanical properties of complex coacervates
is further provided.
Figure 7.1. The typical chemical structure of pectin.

105
VII.2. Materials and Methods
VII.2.1. Materials
Pectin with 31% esterification obtained from Danisco A/S, Denmark was purified by
dialysis (Spectra/Por dialysis membrane with molecular weight cut-off equal to 12,000),
followed by freeze-drying. The average molecular weight (MW) of the purified pectin
was about 7.0 × 10⁵, as determined by gel permeation chromatography. Sodium chloride
(NaCl, purity > 99%) and standard hydrochloric acid (HCl, 0.5 N) were purchased from
Fisher Scientific (Pittsburgh, PA). Milli-Q water was used in all experiments.
VII.2.2. Sample Preparation
The stock solutions of BSA and pectin were mixed together with defined external
addition of sodium chloride and initial protein/polysaccharide ratio (r). The final pectin
concentration is fixed at 0.5 wt% for all BSA/pectin mixtures. Because the pectin
molecules used have been dialyzed against DI water, they contain negligible amount of
metal ions. 0.5 N standard HCl solution was used to adjust the pH of the mixtures to 4.0.
After acidification, the coacervates were collected after removal of the supernatant
through centrifugation at 3000 rpm for 30 min. The yield of BSA/pectin coacervates
varies from 3 to 7%. It should be pointed out that CNaCl, r, and pH are the initial sample
preparation conditions from which the coacervates are formed.
106
VII.2.3. Rheological Measurements
Rheological measurements were performed on a strain-controlled rheometer (ARES,
TA Instruments, New Castle, U.S.A.) fitted with parallel plate geometries (25 or 50 mm
in diameter). BSA/pectin coacervate samples were loaded onto the plate for 10 mins to
allow the stresses to relax and the samples to reach thermal equilibrium. Storage modulus
(G') and loss modulus (G") were measured while the frequency was being varied from 0.1
to 100 rad/sec. Strain sweep test and stress sweep test were preliminarily done to find out
the proper conditions of ARES operation.
VII.3. Results and Discussion
VII.3.1. pH-Induced Phase Separation for BSA/Pectin Complexes
It is generally accepted that the primary soluble complex is usually formed before the
formation of complex coacervate for the mixture of protein and anionic polysaccharide.
Figure 7.2 shows the titration curves of turbidity (100-transmittance T)% from
turbidimetric titration verse pH for mixtures of BSA with pectin (5:1) in 0.1 M NaCl
solution. Three specific pH values, pHc, pHφ1, and pHφ2 were usually used to characterize
the coacervation between BSA and weak negatively-charged polyelectrolyte like pectin.
pHc is seen as the point of incipient polyanion binding, which occurs when sufficient
locally- positive charges develop on the protein surface. Primary complex formation,
initiated at pHc, was viewed as a microscopic transition on the molecular scales, whereas

107
0
10
20
30
40
50
60
70
80
90
100
1234567pH
Turb
idity
, (10
0-T)
%
Figure 7. 2. Turbidity (100-T%) of the mixture of BSA with pectin as a function of
pH at 0.1 M NaCl.

108
coacervate droplet formation at pHφ1 was viewed as the global phase transition.7-9 Since
pHc corresponds to local excess positive charges, it can occur at pH above protein
isoelectric point (pI). But since pHφ1 is thought to involve in the formation of charge-
neutralized complexes, it cannot be observed at pH above pI. When pH further decreases
down to the third critical pH (pHφ2, below the polyelectrolyte’s pKa), due to the low
charges of polyelectrolyte chains, as well as the repulsion between the positively-charged
proteins, protein/polyelectrolyte coacervates may dissociate into soluble complexes.
In addition, this phase diagram shows that the isoelectric point of BSA is a critical pH
that causes the sudden change in turbidity. At pH 4.7, which can be considered as the
global phase separation point (pHφ1) of pectin-BSA coacervates, the solution turbidity
starts to increase dramatically; at pH 4.3, its turbidity reaches a maximum, then shows a
gradual decrease. However, for the strong polyelectrolytes like κ-carrageenan, the pHφ of
the κ-carrageenan-BSA complex also occurs at pH approximately 4.8, close to the pI of
BSA (see Figure 6.1). However, no pHφ2 is observed in the pH titration curve of κ-
carrageenan-BSA, even at pH as low as 1.0, suggesting that pHφ2 is mainly affected by
the polysaccharides used. The overall pattern of phase separation in pectin/BSA
complexes is similar, and the global phase separation mainly occurs at pH<pI, where
positive charges dominate the protein surface.
VII.3.2. Rheological Properties of BSA/Pectin Complexes
Figure 7.3 shows the typical result of small deformation oscillatory measurements of
BSA/pectin coacervates at 0.1 M NaCl concentration (CNaCl) and 5:1

109
Frequency, rad/s0.1 1 10 100
Dyn
amic
mod
ulus
, Pa
104
105
106
Com
plex
vis
cosi
ty, P
a-s
103
104
105
106
107
Storage modulus, G'Loss modulus, G"Complex viscosity
Figure 7. 3. The complex viscosity (η*), the storage modulus (G'), and loss modulus
(G") versus angular frequency ω for BSA/pectin coacervate prepared at
CNaCl=0.1 M, r=5:1, and pH=3.0.
110
protein/polysaccharide ratio. The storage modulus (G') is found to be larger than the loss
modulus (G") at all the ranges of frequency, wherein the two moduli are almost
independent of frequency. The much higher G' indicates that BSA/pectin coacervates
have a highly interconnected gel-like network structure with mainly elastic behavior,
which agrees with the rheological properties of the simple coacervate formed by
gelatin.10 Nevertheless, in the reported frequency sweep experiments of whey
protein/gum arabic coacervates,3 the values of G" were often 3 – 7 times higher than the
values of G', showing the highly viscous character of whey protein/gum arabic
coacervates. Coacervates of bovine serum albumin (BSA) with synthetic polyelectrolyte
poly(diallyldimethylammonium chloride) (PDADMAC) also have viscous nature with G"
larger than G' in the high frequency range11 Different viscoelastic properties in different
systems reflect the characteristic of protein/polymer pair and thus distinct coacervate
structure. The gel-like structure of BSA/pectin coacervates implies that BSA molecules
and pectin chains together form more strongly crosslinked network.
VII.3.2.1. Effects of pH
Coacervates formed are easily detected by the noticeable increase of the turbidity at
the certain region, so called as the global phase separation point (pHφ), regardless of the
type of protein or polysaccharide. When pH is higher than the pI of protein, an increase in
ionic strengths may cause the dissolution of the soluble complexes. While no significant
change on turbidity of solution occurs at pH higher than pH 5.0, the turbidity starts to
increase at pH around 4.8 at 0.1 M NaCl solution, suggesting that the global phase
111
separation occurs only at pH<pI, where positive charges dominate the protein surface.
The physicochemical parameters, which affect either protein-polysaccharide
interaction or polysaccharide-polysaccharide aggregation, have significant impact on the
rheological properties of BSA/pectin coacervates The effects of pH on the storage
modulus follow the similar trend as the pH titration curves: at pH lower than 4.0, both the
shear modulus and turbidity decrease as the pH decreases (Figure 7.4). It is due to the fact
that at lower pH, the amount of net charges in pectin chain decrease, causing the
formation of loosely packed pectin/BSA coacervates, which contain higher amount of
bound water in the coacervates, causing the decrease in shear modulus.
VII.3.2.2. Effect of addition of salt
In general, the presence of salt in solution weakens the interaction, and hinders the
formation of protein/polysaccharide coacervates.9, 12, 13 In order to understand the effects
of salt on the structure and properties of BSA/pectin coacervates, dynamic rheological
measurements have been carried out on BSA/pectin coacervates prepared at 5:1 BSA to
pectin ratio, while the sodium chloride concentration CNaCl varies from 0.01, 0.05, 0.1,
0.2, 0.4, to 0.8 M. All the coacervates show significantly higher G' values than G" values,
suggesting the formation of gel-like structure. The effects of salt concentrations on the
shear modulus G' of BSA/pectin coacervates are shown in Figure 7.5. Our results show
that, at CNaCl <0.4 M, G' decreases slightly with the increase of CNaCl, further increase of
CNaCl from 0.4M to 0.8M causes G' to drop ~25 times, which is mainly because the
coacervate network is weakened by the added salts.
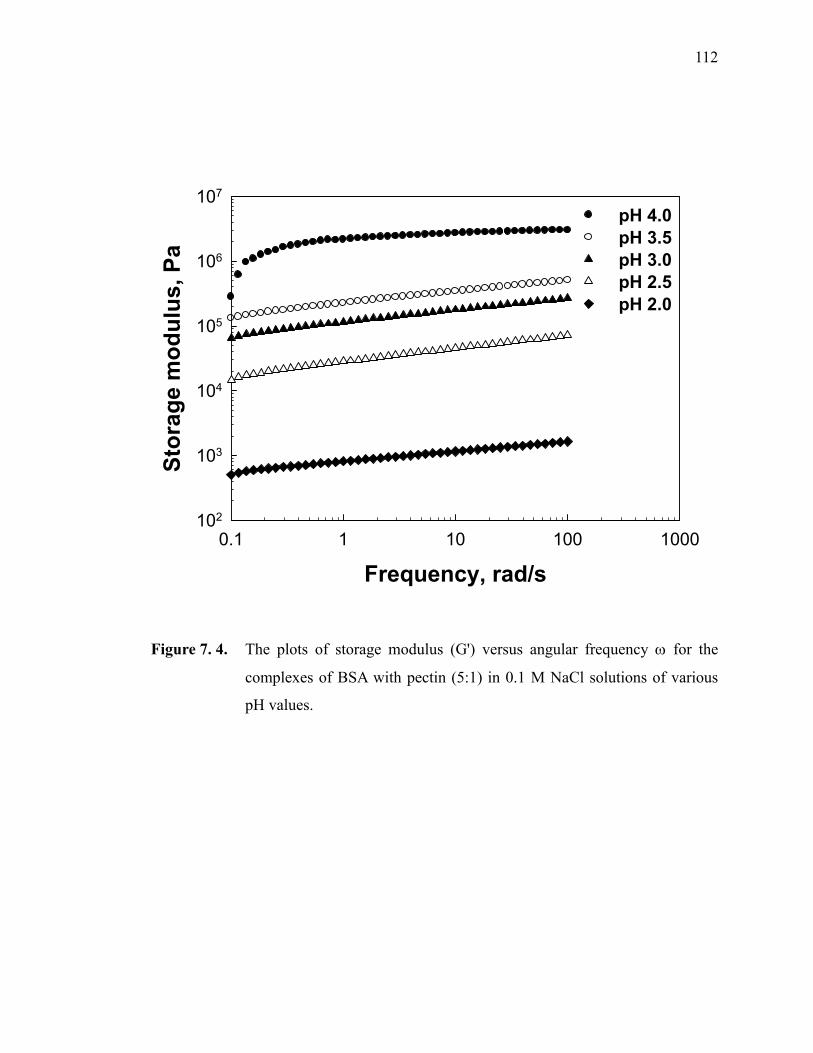
112
Frequency, rad/s0.1 1 10 100 1000
Stor
age
mod
ulus
, Pa
102
103
104
105
106
107
pH 4.0pH 3.5pH 3.0pH 2.5pH 2.0
Figure 7. 4. The plots of storage modulus (G') versus angular frequency ω for the
complexes of BSA with pectin (5:1) in 0.1 M NaCl solutions of various
pH values.

113
Frequency, rad/s0.1 1 10 100
Stor
age
mod
ulus
, Pa
103
104
105
106
0.01 M0.05 M0.1 M0.2 M0.4 M0.8 M
Figure 7. 5. The plots of storage modulus G' versus angular frequency ω for the
complexes formed by BSA and pectin (5:1) in NaCl solutions of
different NaCl concentrations. The pH is fixed at 3.0.
114
For comparison, turbidimetric titration curves of BSA/pectin mixture as a function of
pH at 0.01, 0.05, 0.1, 0.2, 0.4, and 0.8 M NaCl in were plotted in Figure 7.6. The
turbidities for all the turbidimetric titration curves are constant and very small until the
pH reaches a critical value designated as pHφ1, beyond which the turbidity rapidly
increases and reaches a maximum. Nevertheless, further reduction of pH makes turbidity
change differently in different salt concentration region. When CNaCl ≤ 0.2M, the turbidity
decreases rapidly and finally becomes small and constant again when pH approaches a
low critical value pHφ2. When CNaCl reaches 0.4 M, after the turbidity maximum, the
turbidity curve only shows much gradual decrease and does not reach the low turbidity
values as lower salt concentration ones. When the salt concentration is further increased
to 0.8 M, after pHφ1, the turbidity increases to a maximum and remains almost constant
instead of decreasing again. In these two high salt concentrations (i.e., 0.4 M and 0.8 M),
we can not determine pHφ2 values.
Because the dramatic increase of turbidity arises mainly from the change of mass and
size of aggregates in the solution, the above changes in turbidity were supposed to be the
result of the formation and dissociation of protein/polysaccahride coacervates, similar to
the other protein/polymer systems.14 At pH > pHφ1, the charge “patches” on protein
molecules may lead protein to interact with anionic polysaccharide to form soluble
protein/polysaccharide complexes, which is initiated at pHc. Then, at pHφ1, the abrupt
increases of turbidity illustrate the further aggregation of the soluble complexes into
insoluble protein/polysaccharide complexes due to the charge neutralization process,
eventually leading to coacervation (liquid-liquid phase separation). The values of pHφ1 at

115
0102030405060708090
100
1234567
pH
Turb
idity
, (10
0-T)
%0.01M
0.05M
0.1M
0.2M
0.4M
0.8M
Figure 7. 6. Turbidimetric titration curves [(100-T%) versus pH] for the mixtures of
BSA and at different NaCl concentrations.
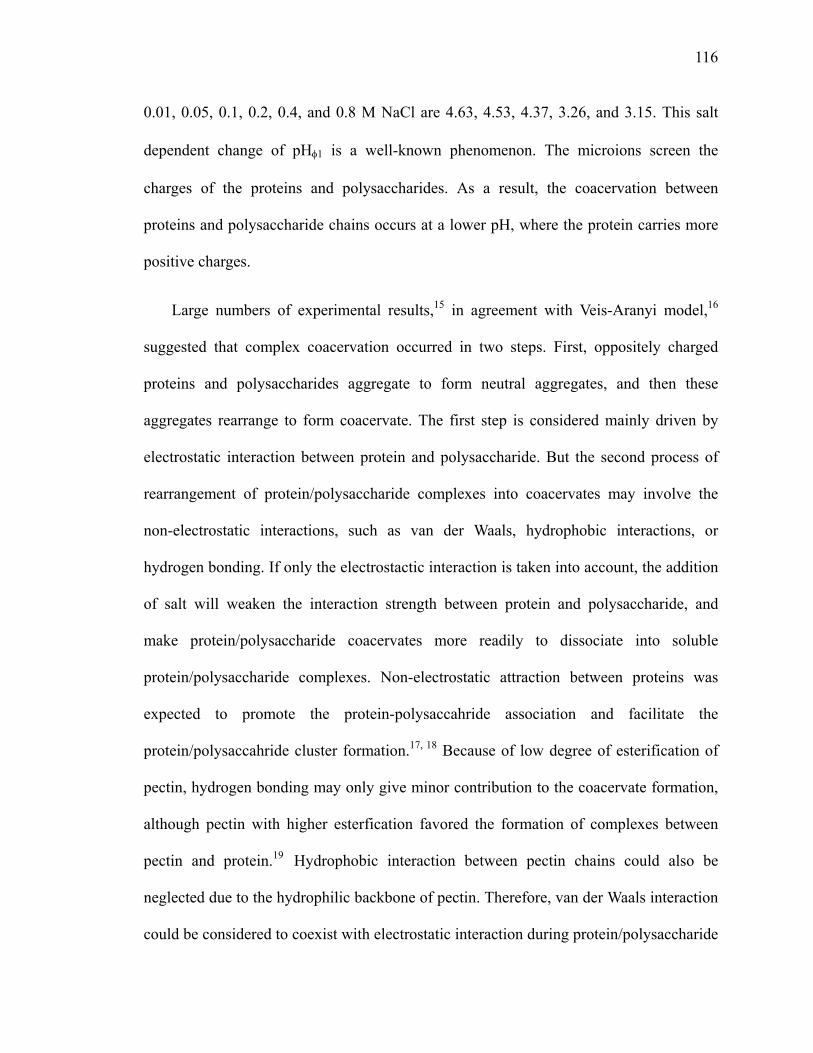
116
0.01, 0.05, 0.1, 0.2, 0.4, and 0.8 M NaCl are 4.63, 4.53, 4.37, 3.26, and 3.15. This salt
dependent change of pHφ1 is a well-known phenomenon. The microions screen the
charges of the proteins and polysaccharides. As a result, the coacervation between
proteins and polysaccharide chains occurs at a lower pH, where the protein carries more
positive charges.
Large numbers of experimental results,15 in agreement with Veis-Aranyi model,16
suggested that complex coacervation occurred in two steps. First, oppositely charged
proteins and polysaccharides aggregate to form neutral aggregates, and then these
aggregates rearrange to form coacervate. The first step is considered mainly driven by
electrostatic interaction between protein and polysaccharide. But the second process of
rearrangement of protein/polysaccharide complexes into coacervates may involve the
non-electrostatic interactions, such as van der Waals, hydrophobic interactions, or
hydrogen bonding. If only the electrostactic interaction is taken into account, the addition
of salt will weaken the interaction strength between protein and polysaccharide, and
make protein/polysaccharide coacervates more readily to dissociate into soluble
protein/polysaccharide complexes. Non-electrostatic attraction between proteins was
expected to promote the protein-polysaccahride association and facilitate the
protein/polysaccahride cluster formation.17, 18 Because of low degree of esterification of
pectin, hydrogen bonding may only give minor contribution to the coacervate formation,
although pectin with higher esterfication favored the formation of complexes between
pectin and protein.19 Hydrophobic interaction between pectin chains could also be
neglected due to the hydrophilic backbone of pectin. Therefore, van der Waals interaction
could be considered to coexist with electrostatic interaction during protein/polysaccharide

117
coacervation.
VII.3.2.3. Effect of BSA to pectin ratio
Dynamic rheology measurements have also been completed to see the influence of
protein/polysaccharide ratio r on the structure of BSA/pectin coacervates. Figure 7.7
shows the values of G' for BSA/pectin coacervates at CNaCl = 0.1 M and r = 1:1, 2:1, 3:1,
5:1, 10:1, and 20:1. The value of G' is relatively higher at r = 10:1, which suggests that
the density of positive charge on BSA is approximately equal to that of the negative
charges on pectin, and their interaction is almost maximized. With the lower portion of
BSA in the complex coacervates, the amount of positive charges was not enough to fully
interact with the existing negative charge on pectin chain, there are some residual
repulsion between negatively charged pectin chains, causing a lower shear modulus for
the BSA/pectin complexes. When r reaches 10, the positive charges in BSA and the
negative charges in pectin chains are nearly balanced, where the maximum yield of
coacervates is reached, a maximum shear modulus is observed. Further increase of r to r
= 1:20, excess amount of BSA molecules actually decrease the G' of the coacervates,
since these excess BSA may serve as the plasticizer in the coacervate network. This result
reflects that the balanced positive charges and negative charges on protein/polysaccharide
coacervate overall favors the formation of more compact network structure of
BSA/pectin coacervates.
The results from dynamic rheological measurements also suggest that
protein/polysaccharide coacervates could be considered as a network of polysaccharide
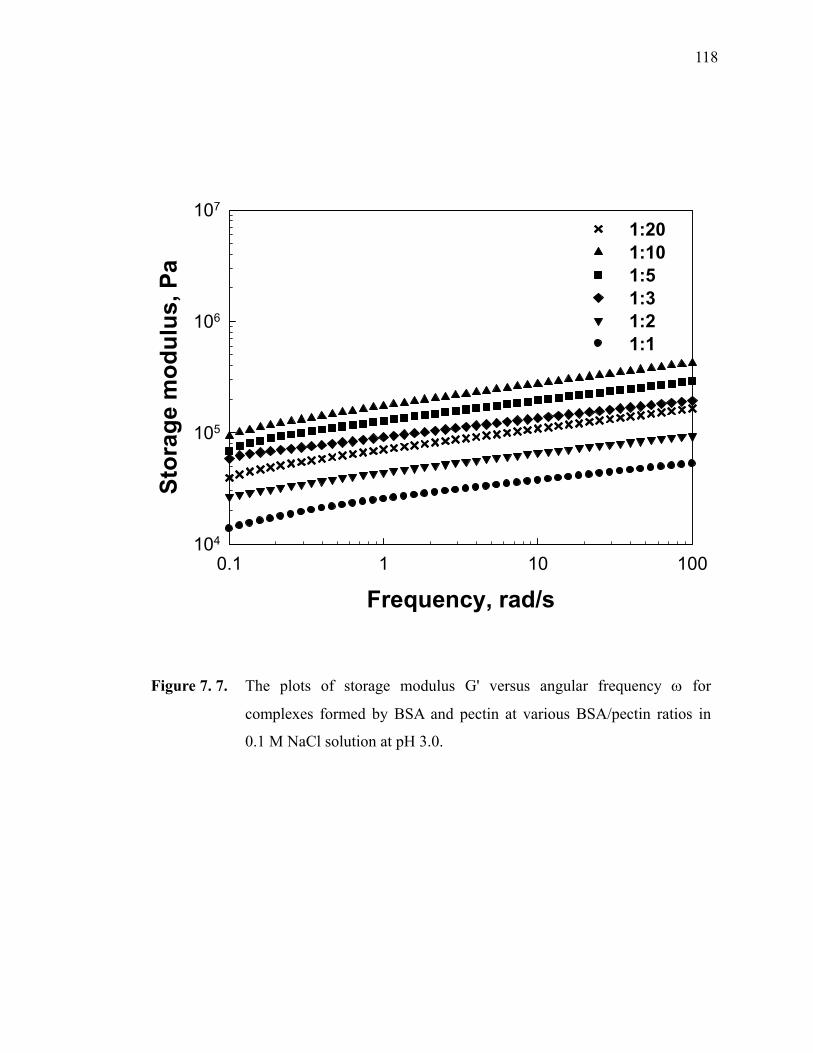
118
Frequency, rad/s0.1 1 10 100
Stor
age
mod
ulus
, Pa
104
105
106
107
1:201:101:51:31:21:1
Figure 7. 7. The plots of storage modulus G' versus angular frequency ω for
complexes formed by BSA and pectin at various BSA/pectin ratios in
0.1 M NaCl solution at pH 3.0.
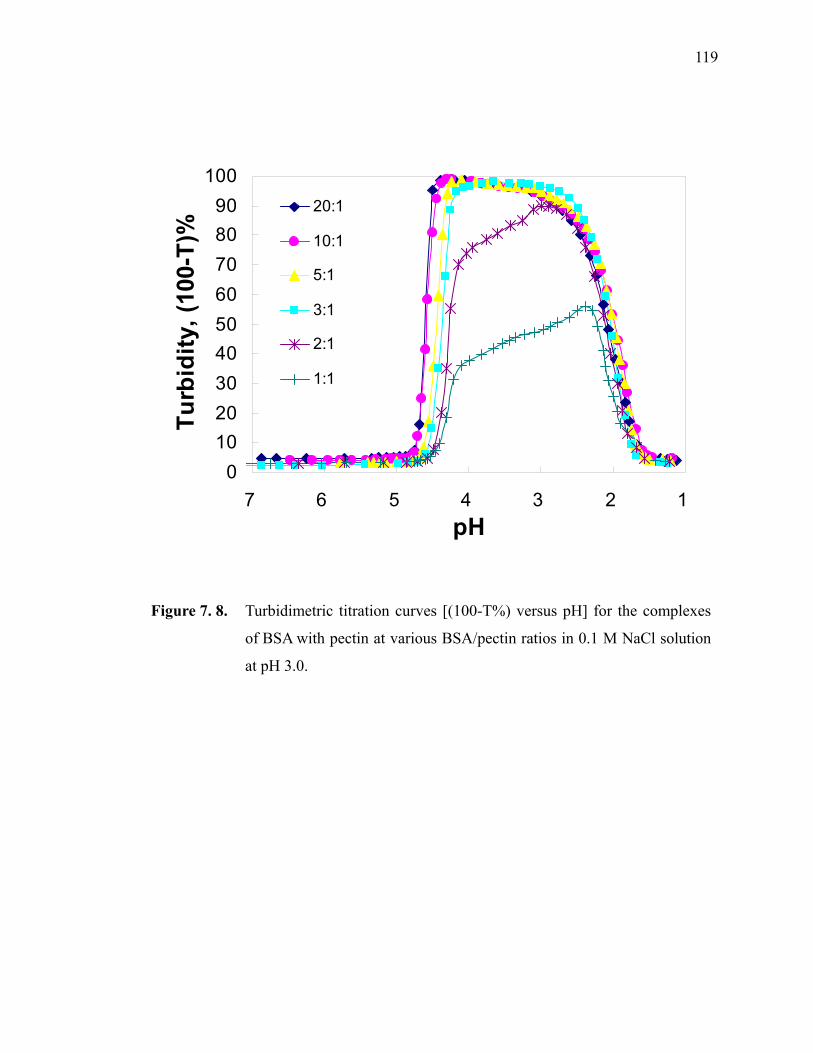
119
0102030405060708090
100
1234567pH
Turb
idity
, (10
0-T)
%20:1
10:1
5:1
3:1
2:1
1:1
Figure 7. 8. Turbidimetric titration curves [(100-T%) versus pH] for the complexes
of BSA with pectin at various BSA/pectin ratios in 0.1 M NaCl solution
at pH 3.0.

120
chains generated from the aggregation of protein/polysaccharide complexes, wherein the
bounded proteins are taken as linker. When coacervates dissociate at pHφ2, electrostatic
repulsive potential and the van der Waals attractive potential are together expected to play
an important role. Furthermore, higher protein/polysaccharide ratio means that more
protein molecules are available for binding onto polysaccharide chains. It has been
reported that protein/polysaccharide coacervates have higher amount of protein
molecules in the coacervates phase.20 The interaction between protein molecules and
polysaccharide chains is expected to be enhanced in higher protein/polysaccharide ratio.
More proteins molecules bound in polysaccharide chains may cause higher electro-
neutrality of polysaccharide chains. Consequently, higher protein/polysaccharide ratio
will cause protein/polysaccharide complexes to aggregate more tightly to form
protein/polysaccharide coacervates. BSA/pectin coacervates then exhibit stronger storage
G' values as protein/polysaccharide ratio increases from 5:1 to 40:1.
VII.3.3. Nanoscale Mechanical Properties of BSA/Pectin Complexes
While rheological measurements can give the information of protein-polysaccharide
interaction or polysaccharide-polysaccharide aggregation, AFM force measurement by
means of CFM (see Chapter 5) can probe their interactions at a smaller scale. Final
coacervates were directly measured in order to compare the same condition of samples at
nano-scale with macro-scale.
The Hertz model can be used to obtain a quantitative value of the elastic modulus of
the surface as mentioned in Chapter 2.21 The model describes the elastic deformation of
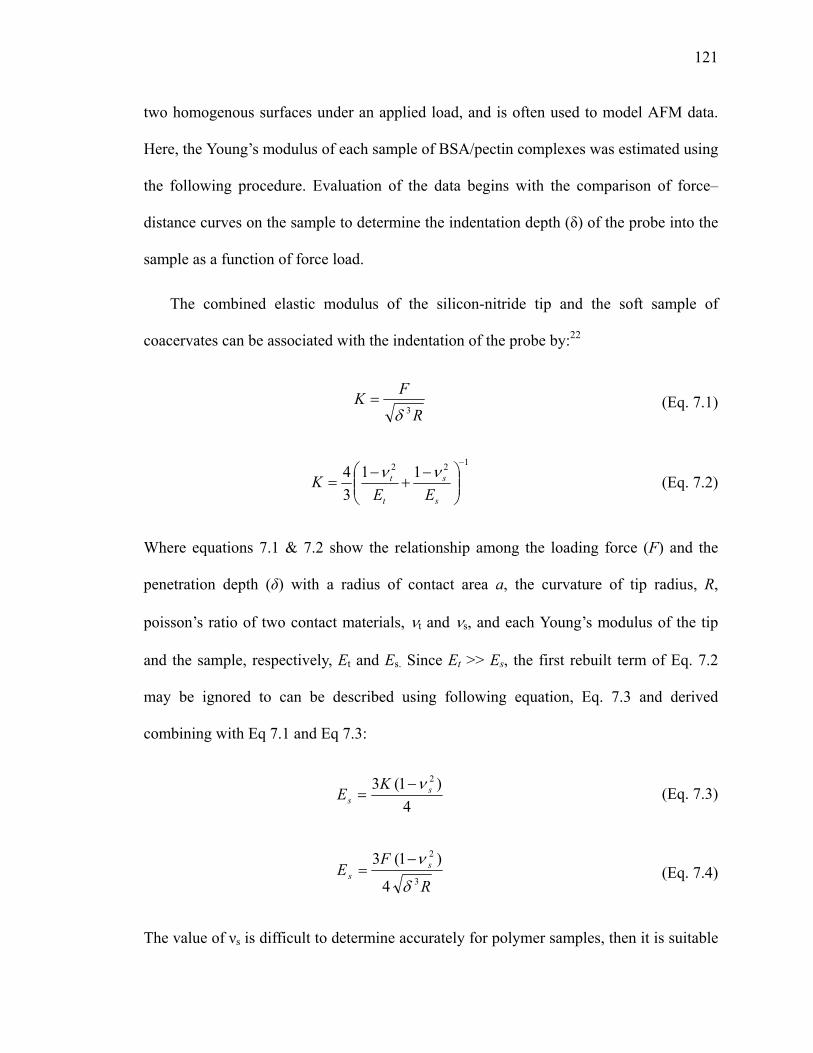
121
two homogenous surfaces under an applied load, and is often used to model AFM data.
Here, the Young’s modulus of each sample of BSA/pectin complexes was estimated using
the following procedure. Evaluation of the data begins with the comparison of force–
distance curves on the sample to determine the indentation depth (δ) of the probe into the
sample as a function of force load.
The combined elastic modulus of the silicon-nitride tip and the soft sample of
coacervates can be associated with the indentation of the probe by:22
R
FK3δ
= (Eq. 7.1)
122 1134
−
⎟⎟⎠
⎞⎜⎜⎝
⎛ −+
−=
s
s
t
t
EEK νν
(Eq. 7.2)
Where equations 7.1 & 7.2 show the relationship among the loading force (F) and the
penetration depth (δ) with a radius of contact area a, the curvature of tip radius, R,
poisson’s ratio of two contact materials, νt and νs, and each Young’s modulus of the tip
and the sample, respectively, Et and Es. Since Et >> Es, the first rebuilt term of Eq. 7.2
may be ignored to can be described using following equation, Eq. 7.3 and derived
combining with Eq 7.1 and Eq 7.3:
4)1(3 2
ss
KE
ν−= (Eq. 7.3)
R
FE s
s 3
2
4
)1(3
δ
ν−= (Eq. 7.4)
The value of νs is difficult to determine accurately for polymer samples, then it is suitable
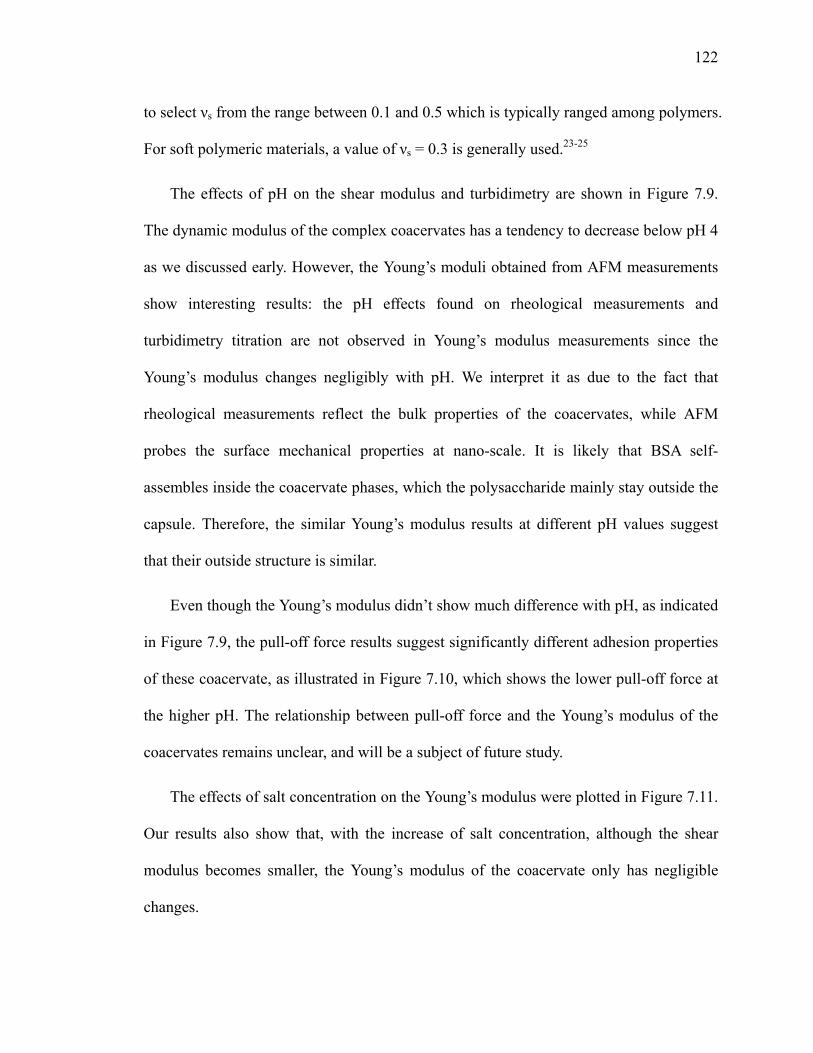
122
to select νs from the range between 0.1 and 0.5 which is typically ranged among polymers.
For soft polymeric materials, a value of νs = 0.3 is generally used.23-25
The effects of pH on the shear modulus and turbidimetry are shown in Figure 7.9.
The dynamic modulus of the complex coacervates has a tendency to decrease below pH 4
as we discussed early. However, the Young’s moduli obtained from AFM measurements
show interesting results: the pH effects found on rheological measurements and
turbidimetry titration are not observed in Young’s modulus measurements since the
Young’s modulus changes negligibly with pH. We interpret it as due to the fact that
rheological measurements reflect the bulk properties of the coacervates, while AFM
probes the surface mechanical properties at nano-scale. It is likely that BSA self-
assembles inside the coacervate phases, which the polysaccharide mainly stay outside the
capsule. Therefore, the similar Young’s modulus results at different pH values suggest
that their outside structure is similar.
Even though the Young’s modulus didn’t show much difference with pH, as indicated
in Figure 7.9, the pull-off force results suggest significantly different adhesion properties
of these coacervate, as illustrated in Figure 7.10, which shows the lower pull-off force at
the higher pH. The relationship between pull-off force and the Young’s modulus of the
coacervates remains unclear, and will be a subject of future study.
The effects of salt concentration on the Young’s modulus were plotted in Figure 7.11.
Our results also show that, with the increase of salt concentration, although the shear
modulus becomes smaller, the Young’s modulus of the coacervate only has negligible
changes.
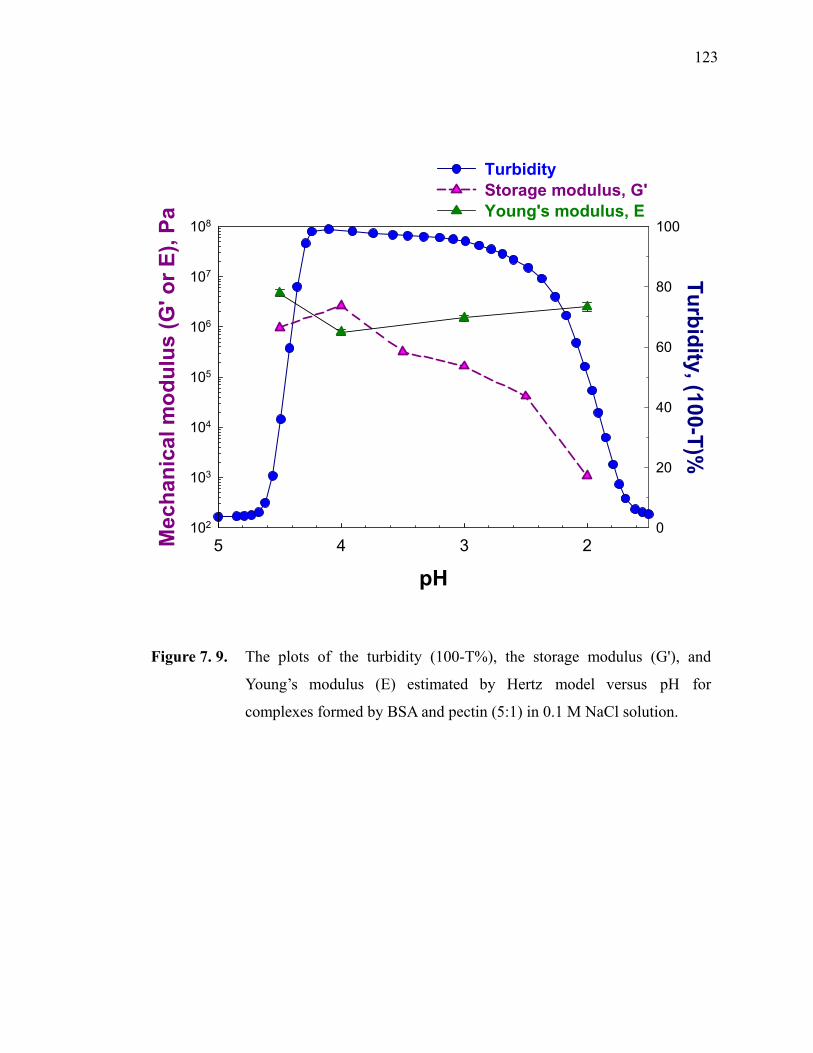
123
pH2345
Turbidity, (100-T)%
0
20
40
60
80
100
Mec
hani
cal m
odul
us (G
' or E
), Pa
102
103
104
105
106
107
108
TurbidityStorage modulus, G'Young's modulus, E
Figure 7. 9. The plots of the turbidity (100-T%), the storage modulus (G'), and
Young’s modulus (E) estimated by Hertz model versus pH for
complexes formed by BSA and pectin (5:1) in 0.1 M NaCl solution.
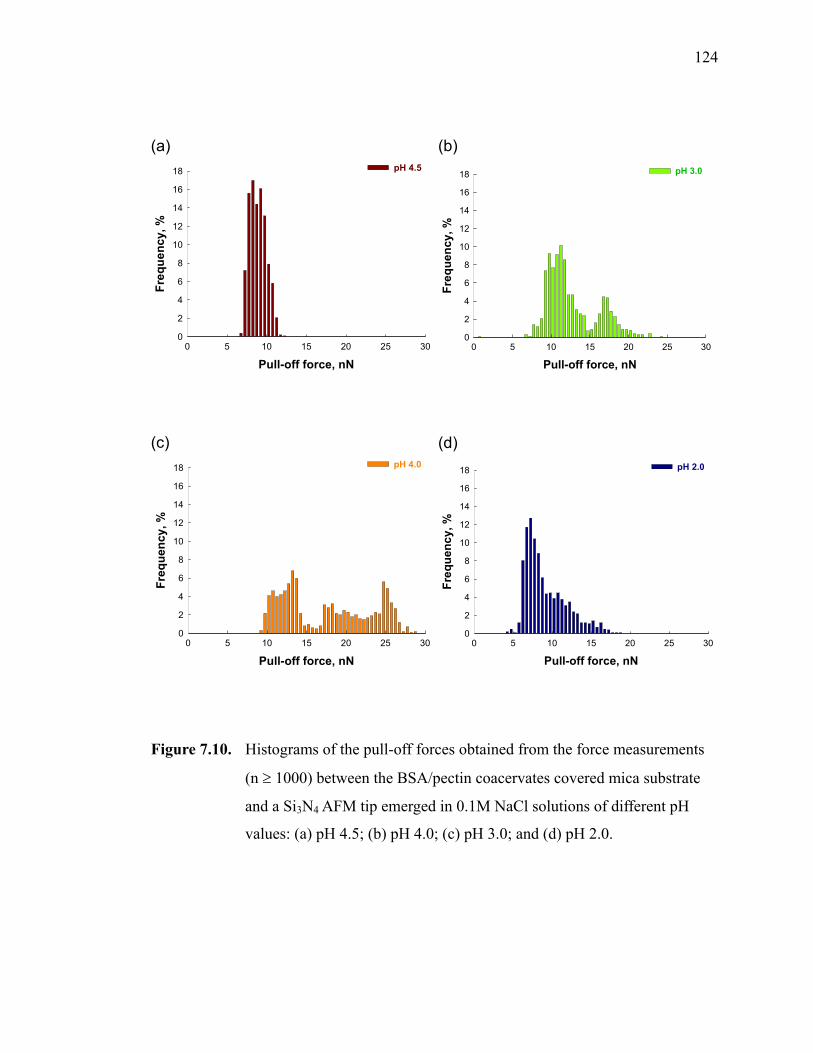
124
(a)
Pull-off force, nN0 5 10 15 20 25 30
Freq
uenc
y, %
0
2
4
6
8
10
12
14
16
18 pH 4.5
(b)
Pull-off force, nN0 5 10 15 20 25 30
Freq
uenc
y, %
0
2
4
6
8
10
12
14
16
18 pH 3.0
(c)
Pull-off force, nN0 5 10 15 20 25 30
Freq
uenc
y, %
0
2
4
6
8
10
12
14
16
18 pH 4.0
(d)
Pull-off force, nN0 5 10 15 20 25 30
Freq
uenc
y, %
0
2
4
6
8
10
12
14
16
18 pH 2.0
Figure 7.10. Histograms of the pull-off forces obtained from the force measurements
(n ≥ 1000) between the BSA/pectin coacervates covered mica substrate
and a Si3N4 AFM tip emerged in 0.1M NaCl solutions of different pH
values: (a) pH 4.5; (b) pH 4.0; (c) pH 3.0; and (d) pH 2.0.
125
Concentration of NaCl, M0.0 0.2 0.4 0.6 0.8 1.0
Mec
hani
cal m
odul
us, P
a
103
104
105
106
107
108
Storage modulus, G'Young's modulus, E
Figure 7. 11. Comparison of the storage modulus (G') measured by ARES and the
Young’s modulus (E) estimated by the Hertz model on the basis of AFM
results for the complexes formed by BSA and pectin (5:1) in different
NaCl concentrations. The pH is fixed 3.0.
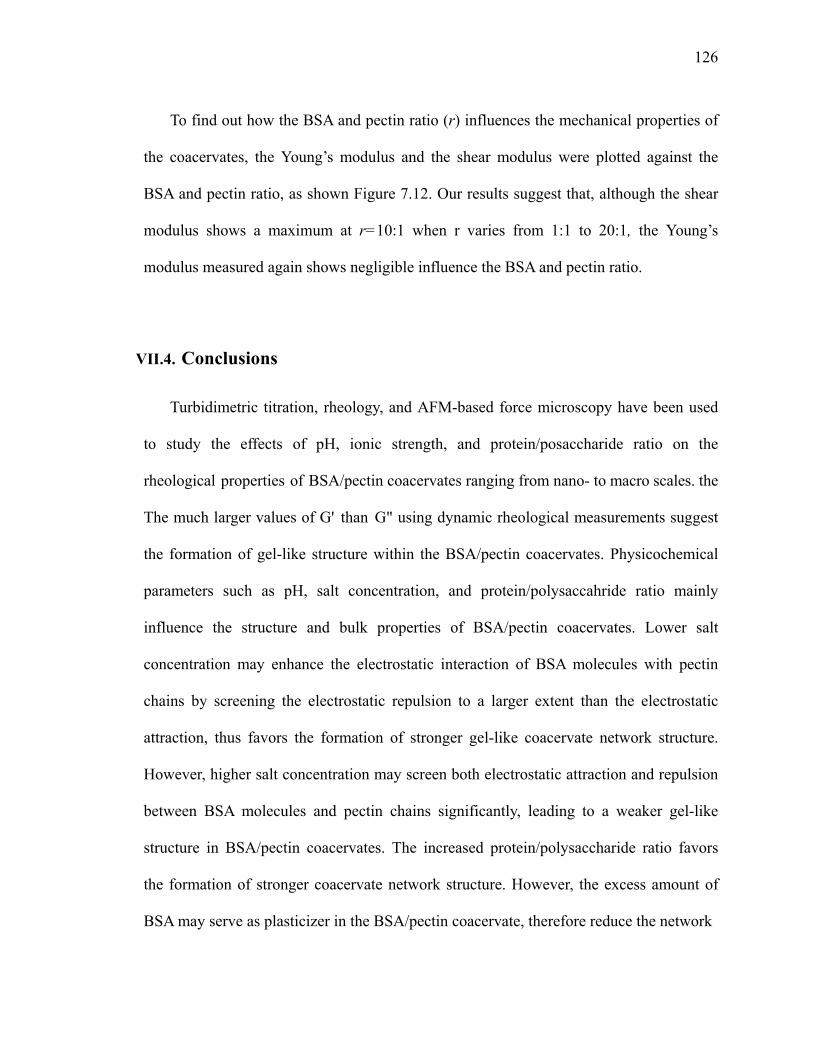
126
To find out how the BSA and pectin ratio (r) influences the mechanical properties of
the coacervates, the Young’s modulus and the shear modulus were plotted against the
BSA and pectin ratio, as shown Figure 7.12. Our results suggest that, although the shear
modulus shows a maximum at r=10:1 when r varies from 1:1 to 20:1, the Young’s
modulus measured again shows negligible influence the BSA and pectin ratio.
VII.4. Conclusions
Turbidimetric titration, rheology, and AFM-based force microscopy have been used
to study the effects of pH, ionic strength, and protein/posaccharide ratio on the
rheological properties of BSA/pectin coacervates ranging from nano- to macro scales. the
The much larger values of G' than G" using dynamic rheological measurements suggest
the formation of gel-like structure within the BSA/pectin coacervates. Physicochemical
parameters such as pH, salt concentration, and protein/polysaccahride ratio mainly
influence the structure and bulk properties of BSA/pectin coacervates. Lower salt
concentration may enhance the electrostatic interaction of BSA molecules with pectin
chains by screening the electrostatic repulsion to a larger extent than the electrostatic
attraction, thus favors the formation of stronger gel-like coacervate network structure.
However, higher salt concentration may screen both electrostatic attraction and repulsion
between BSA molecules and pectin chains significantly, leading to a weaker gel-like
structure in BSA/pectin coacervates. The increased protein/polysaccharide ratio favors
the formation of stronger coacervate network structure. However, the excess amount of
BSA may serve as plasticizer in the BSA/pectin coacervate, therefore reduce the network
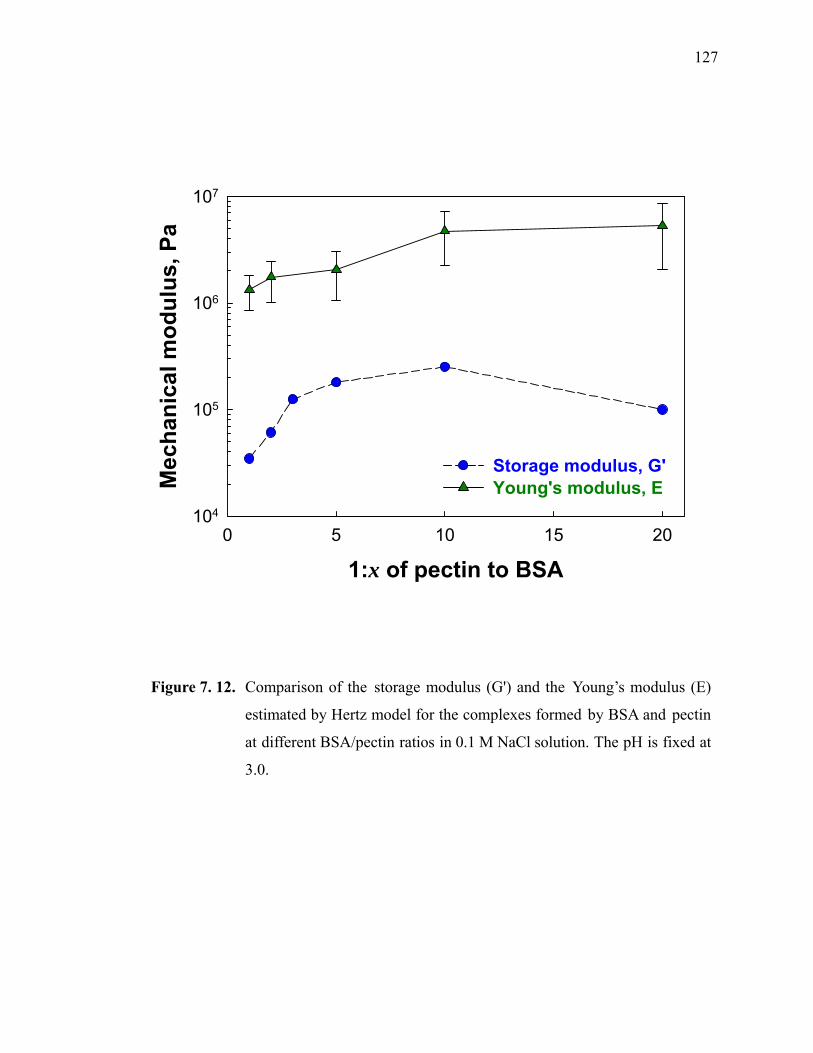
127
1:x of pectin to BSA0 5 10 15 20
Mec
hani
cal m
odul
us, P
a
104
105
106
107
Storage modulus, G'Young's modulus, E
Figure 7. 12. Comparison of the storage modulus (G') and the Young’s modulus (E)
estimated by Hertz model for the complexes formed by BSA and pectin
at different BSA/pectin ratios in 0.1 M NaCl solution. The pH is fixed at
3.0.

128
strength. However, these physicochemical parameters (i.e., pH, salt concentration, and
BSA/pectin ratio) have negligible impacts on the surface mechanical properties (i.e.,
Young’s modulus) measured by AFM-based force measurements. Our results clearly
suggest that mechanical properties obtained from nano-scale surface measurement are not
necessary equivalent to those measured at bulk conditions.
VII.5. References
1. Magnin D, Lefebvre J, Chornet E, Dumitriu S. 2004. Physicochemical and structural characterization of a polyionic matrix of interest in biotechnology, in the pharmaceutical and biomedical fields. Carbohydrate Polymers. 55(4):437-53.
2. Turgeon SL, Beaulieu M, Schmitt C, Sanchez C. 2003. Protein-polysaccharide interactions: phase-ordering kinetics, thermodynamic and structural aspects. Current Opinion in Colloid & Interface Science. 8(4-5):401-14.
3. Weinbreck F, Wientjes RHW, Nieuwenhuijse H, Robijn GW, de Kruif CG. 2004. Rheological properties of whey protein/gum arabic coacervates. Journal of Rheology. 48(6):1215-28.
4. Wen Yp, Dubin PL. 1997. Potentiometric studies of the interaction of bovine serum albumin and poly(dimethyldiallylammonium chloride). Macromolecules. 30(25):7856-61.
5. Oakenfull DG. 1991. The chemistry and technology of pectin. ed. New York, NY: Academic Press. 88-108·p.
6. Thakur BR, Singh RK, Handa AK. 1997. Chemistry and uses of pectin: A review. Critical Reviews in Food Science and Nutrition. 37(1):47-73.
7. Cooper CL, Dubin PL, Kayitmazer AB, Turksen S. 2005. Polyelectrolyte-protein complexes. Current Opinion in Colloid & Interface Science. 10(1-2):52-78.
8. Kaibara K, Okazaki T, Bohidar HB, Dubin PL. 2000. pH-Induced coacervation in complexes of bovine serum albumin and cationic polyelectrolytes. Biomacromolecules. 1(1):100-7.
9. Weinbreck F, de Vries R, Schrooyen P, de Kruif CG. 2003. Complex coacervation of whey proteins and gum Arabic. Biomacromolecules. 4(2):293-
129
303.
10. Mohanty B, Bohidar HB. 2005. Microscopic structure of gelatin coacervates. International Journal of Biological Macromolecules. 36(1-2):39-46.
11. Bohidar H, Dubin PL, Majhi PR, Tribet C, Jaeger W. 2005. Effects of protein-polyelectrolyte affinity and polyelectrolyte molecular weight on dynamic properties of bovine serum albumin-poly(diallyldimethylammonium chloride) coacervates. Biomacromolecules. 6(3):1573-85.
12. de Kruif CG, Weinbreck F, de Vries R. 2004. Complex coacervation of proteins and anionic polysaccharides. Current Opinion in Colloid & Interface Science. 9(5):340-9.
13. Weinbreck F, Nieuwenhuijse H, Robijn GW, de Kruif CG. 2004. Complexation of whey proteins with carrageenan. J. Agric. Food Chem. 52(11):3550-5.
14. Xia J, Dubin PL, Dautzenberg H. 1993. Light scattering, electrophoresis, and turbidimetry studies of bovine serum albumin-poly(dimethyldiallylammonium chloride) complex. Langmuir. 9(8):2015-9.
15. Cousin F, Gummel J, Ung D, Boue F. 2005. Polyelectrolyte-protein complexes: Structure and conformation of each specie revealed by SANS. Langmuir. 21(21):9675-88.
16. Veis A, Aranyi C. 1960. Phase separation in polyelectrolyte systems. I. Complex coacervates of gelatin. J. Phys. Chem. 64(9):1203-10.
17. Carlsson F, Linse P, Malmsten M. 2001. Monte carlo simulations of polyelectrolyte-protein complexation. J. Phys. Chem. B. 105(38):9040-9.
18. Carlsson F, Malmsten M, Linse P. 2003. Protein-polyelectrolyte cluster formation and redissolution: A monte carlo study. J. Am. Chem. Soc. 125(10):3140-9.
19. Girard M, Turgeon SL, Gauthier SF. 2003. Thermodynamic parameters of β-lactoglobulin-pectin complexes assessed by isothermal titration calorimetry. J. Agric. Food Chem. 51(15):4450-5.
20. Weinbreck F, Tromp RH, de Kruif CG. 2004. Composition and structure of whey protein/gum Arabic coacervates. Biomacromolecules. 5(4):1437-45.
21. Radmacher M, Fritz M, Cleveland JP, Walters DA, Hansma PK. 1994. Imaging adhesion forces and elasticity of lysozyme adsorbed on mica with the atomic force microscope. Langmuir. 10(10):3809-14.
130
22. Round AN, Yan B, Dang S, Estephan R, Stark RE, Batteas JD. 2000. The influence of water on the nanomechanical behavior of the plant biopolyester cutin as studied by AFM and solid-state NMR. Biophys. J. 79(5):2761-7.
23. Powers JM, Caddell RM. 1972. The macroscopic volume changes of selected polymers subjected to uniform tensile deformation. Polymer Engineering & Science. 12(6):432-6.
24. Williams PM, Davies MC, Roberts CJ, Tendler SJB. 1998. Noise-compliant tip-shape derivation. Applied Physics A: Materials Science & Processing. 66(0):S911-S4.
25. Williams PM, Shakesheff KM, Davies MC, Jackson DE, Roberts CJ, Tendler SJB. 1996. Blind reconstruction of scanning probe image data. Journal of Vacuum Science & Technology B: Microelectronics and Nanometer Structures. 14(2):1557-62.
131
VIII. SUMMARY & FUTURE WORK
The mechanical properties of κ-carrageenan at the nano-scale showed a good
correlation with the traditional rheological measurements at macro-scale, and force
spectroscopy can extend our understanding of polymer single theories.
The force for the elongation of BSA fragments, which decreases due to the
interaction of BSA chain with mica substrate, is mainly contributed by electrostatic
interaction, which changes from attractive to repulsive with pH increase, and cross the pI
of BSA. The feasibility of the statistical models used in this thesis on the analysis of
molecular force spectroscopy has been demonstrated.
Studies of interaction between BSA and κ-carrageenan and pectin were carried out
under various physicochemical conditions using rheological measurement and AFM. The
formation of gel-like interconnected network was found in both BSA/carrageenan
coacervates and BSA/pectin coacervates. At low salt concentration, the added salt may
reduce the electrostatic repulsion to a larger extent than the electrostatic attraction
between BSA molecules and pectin chains. This salt-enhancing effect for the total
interaction between BSA and negatively-charged polysaccharide favors the formation of
the coacervate structure with stronger gel network strength. Force measurements by AFM
gave independent and consistent Young’s modulus different pH values, salt
concentrations, and protein/polysaccharide ratios. These results suggested that the
mechanical properties under nano-scale measurement are not necessary equivalent to the
132
rheological properties measured in bulk conditions. It’s also proposed that BSA
molecules tend to position inside of the complexes while pectin molecules cover the outer
shell when the coacervates form.
Our current mechanical models contain several approximations, and more
experimental and theoretical work is necessary to obtain results closer to the true values.
In particular, it would be interesting to compare various force models, such as JKR, DMT,
as well as Hertz model, which will help to establish the relationship between
nanomechanics of complexes by pH-induced phenomenon. Complementary rheological
and CFM measurements will be necessary in order to better interpret the relationship
between the bulk properties and the surface characteristics at nano-scale. Although Hertz
model would highly appeal to predict the elastic modulus from the direct polymer surface,
it is limited to systems with low adhesion force. The relationship between the pull-force
and the Young’s model should be established.
We think these future investigations will be helpful in food nanomaterials research,
provide not only the fundamental understanding of the nanoassembly of the food
biopolymers, but also the new characterization tool for nanoscale properties of the food
materials involved in multicomponent food systems.
133
IX. APPENDIX
Effects of pH on the Interactions and Conformation of Bovine
Serum Albumin: Comparison between Chemical Force
Microscopy and Small-Angle Neutron Scattering‡
IX.1. Introduction
Bovine serum albumin (BSA) is a globular protein which functions biologically as a
carrier for fatty acid anions and other simple amphiphiles in the bloodstream.1 The
chemical sequence and conformation of BSA are well known: one BSA molecule
contains 583 amino acids in a single polypeptide chain with a molecular weight of about
66,000 g/mol.2 There are 17 disulfide bridges and one free thiol group in each native BSA
molecule, and the isoelectric point (pI) of BSA in aqueous solution is approximately pH
4.9. Binding of small ions may change the pI of BSA. For example, in 0.15 M NaCl
saline solution, the pI of BSA is about 4.7.3 The conformation of BSA molecules in
aqueous solutions has been well studied by small-angle neutron scattering (SANS) 4,5 and
small-angle X-ray scattering (SAXS)6. Previous results indicate that, with the decrease of
pH from 4.3 to 2.7, the conformation of BSA undergoes a transition from the native form
to the extended form.5 Intensive investigations have also been carried out on the ability
of BSA to form complexes with surfactants,7,8 polysaccharides,9,10 and other charged
‡ This Chapter is forthcoming to J. Physical Chemistry B in 2008.
134
polymers11 in the presence of monovalent salts. Conformation changes of BSA molecules
with pH12 and surfactant concentration13 have also been reported. These investigations
play a significant role in understanding the properties and behaviors of BSA molecules.
The intra- and inter- molecular interactions of proteins have significant impact over a
wide variety of problems in condensed matters, ranging from conformation to structure,
from diffusion to kinetic properties, and from self-assembly abilities to phase behaviors.7,
11, 14-18 Direct measurements of these intra- and inter- molecular interactions are of great
interest because these forces dominate the properties and behaviors in most synthetic and
biopolymeric systems. Several techniques, including interfacial force microscopy,19
colloid probe microscopy,20 optical tweezers,21 surface force apparatus,22 and total
internal reflection microscopy23, 24 have been used in the measurement of molecular
interactions with high resolution. Atomic force microscopy (AFM)25 is a powerful tool
for probing interactions at the molecular level because it can resolve forces with pico-
Newton sensitivity and has a spatial resolution of nanometers.26 In addition, compared
with electron microscopy, AFM has fewer limitations in sample preparation and
measurement environment. Previously, AFM was employed to investigate the topography
of surfaces with atomic or molecular resolution, and to measure molecular friction and
elasticity.27 Recently, AFM-based chemical force microscopy (CFM) emerged as a
promising technique for the measurement of both inter- and intra- molecular interactions
in addition to surface topography,19, 28-30 partially because AFM tip functionalization
methods are now well-established.16 During the past several years, CFM was used
mainly in studies of interactions from the following aspects: i) measurement of the
binding strength of specific interaction pairs, such as streptavidin-biotin and avidin-biotin
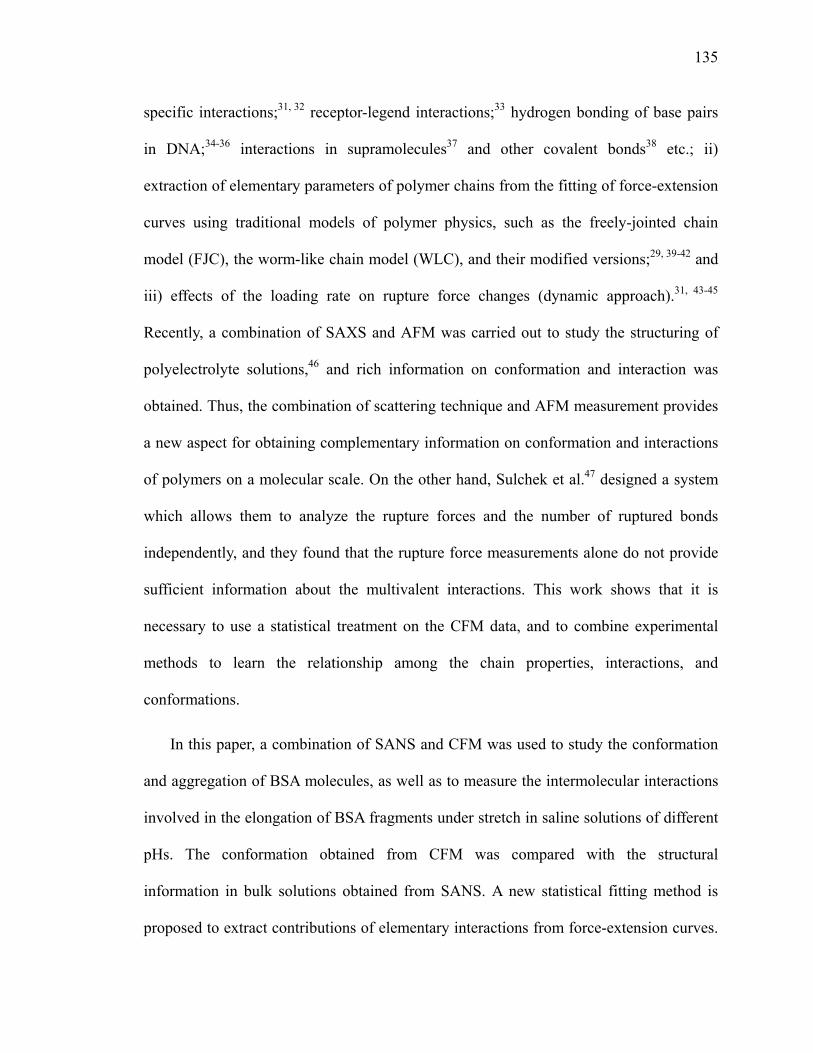
135
specific interactions;31, 32 receptor-legend interactions;33 hydrogen bonding of base pairs
in DNA;34-36 interactions in supramolecules37 and other covalent bonds38 etc.; ii)
extraction of elementary parameters of polymer chains from the fitting of force-extension
curves using traditional models of polymer physics, such as the freely-jointed chain
model (FJC), the worm-like chain model (WLC), and their modified versions;29, 39-42 and
iii) effects of the loading rate on rupture force changes (dynamic approach).31, 43-45
Recently, a combination of SAXS and AFM was carried out to study the structuring of
polyelectrolyte solutions,46 and rich information on conformation and interaction was
obtained. Thus, the combination of scattering technique and AFM measurement provides
a new aspect for obtaining complementary information on conformation and interactions
of polymers on a molecular scale. On the other hand, Sulchek et al.47 designed a system
which allows them to analyze the rupture forces and the number of ruptured bonds
independently, and they found that the rupture force measurements alone do not provide
sufficient information about the multivalent interactions. This work shows that it is
necessary to use a statistical treatment on the CFM data, and to combine experimental
methods to learn the relationship among the chain properties, interactions, and
conformations.
In this paper, a combination of SANS and CFM was used to study the conformation
and aggregation of BSA molecules, as well as to measure the intermolecular interactions
involved in the elongation of BSA fragments under stretch in saline solutions of different
pHs. The conformation obtained from CFM was compared with the structural
information in bulk solutions obtained from SANS. A new statistical fitting method is
proposed to extract contributions of elementary interactions from force-extension curves.
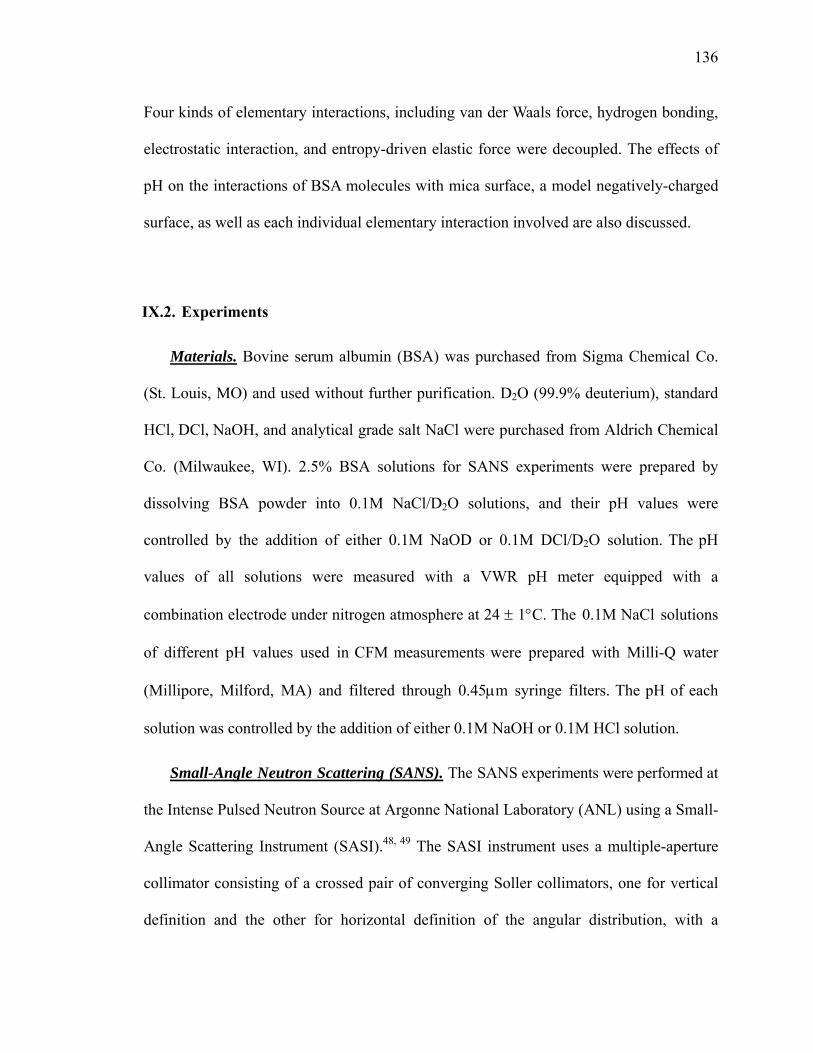
136
Four kinds of elementary interactions, including van der Waals force, hydrogen bonding,
electrostatic interaction, and entropy-driven elastic force were decoupled. The effects of
pH on the interactions of BSA molecules with mica surface, a model negatively-charged
surface, as well as each individual elementary interaction involved are also discussed.
IX.2. Experiments
Materials. Bovine serum albumin (BSA) was purchased from Sigma Chemical Co.
(St. Louis, MO) and used without further purification. D2O (99.9% deuterium), standard
HCl, DCl, NaOH, and analytical grade salt NaCl were purchased from Aldrich Chemical
Co. (Milwaukee, WI). 2.5% BSA solutions for SANS experiments were prepared by
dissolving BSA powder into 0.1M NaCl/D2O solutions, and their pH values were
controlled by the addition of either 0.1M NaOD or 0.1M DCl/D2O solution. The pH
values of all solutions were measured with a VWR pH meter equipped with a
combination electrode under nitrogen atmosphere at 24 ± 1°C. The 0.1M NaCl solutions
of different pH values used in CFM measurements were prepared with Milli-Q water
(Millipore, Milford, MA) and filtered through 0.45µm syringe filters. The pH of each
solution was controlled by the addition of either 0.1M NaOH or 0.1M HCl solution.
Small-Angle Neutron Scattering (SANS). The SANS experiments were performed at
the Intense Pulsed Neutron Source at Argonne National Laboratory (ANL) using a Small-
Angle Scattering Instrument (SASI).48, 49 The SASI instrument uses a multiple-aperture
collimator consisting of a crossed pair of converging Soller collimators, one for vertical
definition and the other for horizontal definition of the angular distribution, with a

137
wavelength resolution ∆λ/λ ranging from 5 to 25%. 2 mm quartz cells were used
throughout the experiments, and data was collected over 2 hours at each pH. Note that at
room temperature (25 ± 1°C), pH = pD-0.4 is used to convert the pD in a D2O solution to
its corresponding pH of the solution in H2O.4 All data were recorded in the q-range of
0.008-0.8 Å-1 and corrected for detector efficiency, solvent scattering, and sample
transmission. The raw data were deduced following the procedures described by
Thiyagarajan et al.48
Chemical Force Microscopy (CFM). The CFM measurements were carried out with
a NanoScope IIIa Multimode AFM (Veeco Instruments, Santa Barbara, CA) utilizing a
liquid cell. The spring constant (“apparent spring constant”) of the cantilevers provided
by the manufacturer was used in the force calculation. The same cantilever was used
throughout the measurements at various pH values. The molecular interaction
measurements were performed using BSA-modified tips. Triangular shaped silicon
nitride cantilevers were first coated with ca. 2 nm Ti, and subsequently by ca. 70 nm Au
under high vacuum. Gold-coated tips were further functionalized with a stable monolayer
of BSA molecules through self-assembly in 5 g/L BSA in 0.1 M NaCl solution at pH 4.0
for 24 hrs, followed by washing out the residue BSA molecules, and dried under nitrogen
flow.50 The success of the immobilization of BSA on gold-coated tip surface was
confirmed by the grazing angle Fourier transform infrared (FTIR) measurement on the
BSA functionalized gold coated glass slide surface prepared by using the identical
method as the AFM tip functionalization (see supporting information). Newly cleaved
mica surfaces were used as the substrates. The schematics of tips and substrates used in
the AFM experiments are illustrated in Figure 1. The cantilever sensitivity (V/nm) was
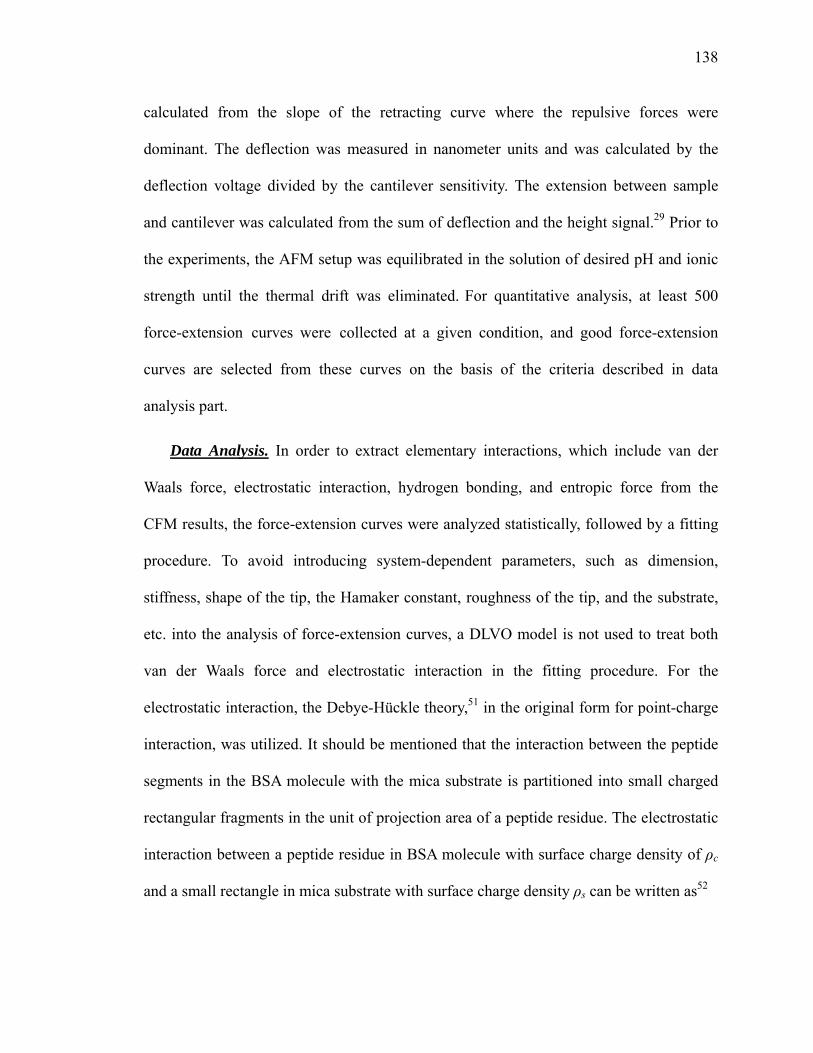
138
calculated from the slope of the retracting curve where the repulsive forces were
dominant. The deflection was measured in nanometer units and was calculated by the
deflection voltage divided by the cantilever sensitivity. The extension between sample
and cantilever was calculated from the sum of deflection and the height signal.29 Prior to
the experiments, the AFM setup was equilibrated in the solution of desired pH and ionic
strength until the thermal drift was eliminated. For quantitative analysis, at least 500
force-extension curves were collected at a given condition, and good force-extension
curves are selected from these curves on the basis of the criteria described in data
analysis part.
Data Analysis. In order to extract elementary interactions, which include van der
Waals force, electrostatic interaction, hydrogen bonding, and entropic force from the
CFM results, the force-extension curves were analyzed statistically, followed by a fitting
procedure. To avoid introducing system-dependent parameters, such as dimension,
stiffness, shape of the tip, the Hamaker constant, roughness of the tip, and the substrate,
etc. into the analysis of force-extension curves, a DLVO model is not used to treat both
van der Waals force and electrostatic interaction in the fitting procedure. For the
electrostatic interaction, the Debye-Hückle theory,51 in the original form for point-charge
interaction, was utilized. It should be mentioned that the interaction between the peptide
segments in the BSA molecule with the mica substrate is partitioned into small charged
rectangular fragments in the unit of projection area of a peptide residue. The electrostatic
interaction between a peptide residue in BSA molecule with surface charge density of ρc
and a small rectangle in mica substrate with surface charge density ρs can be written as52
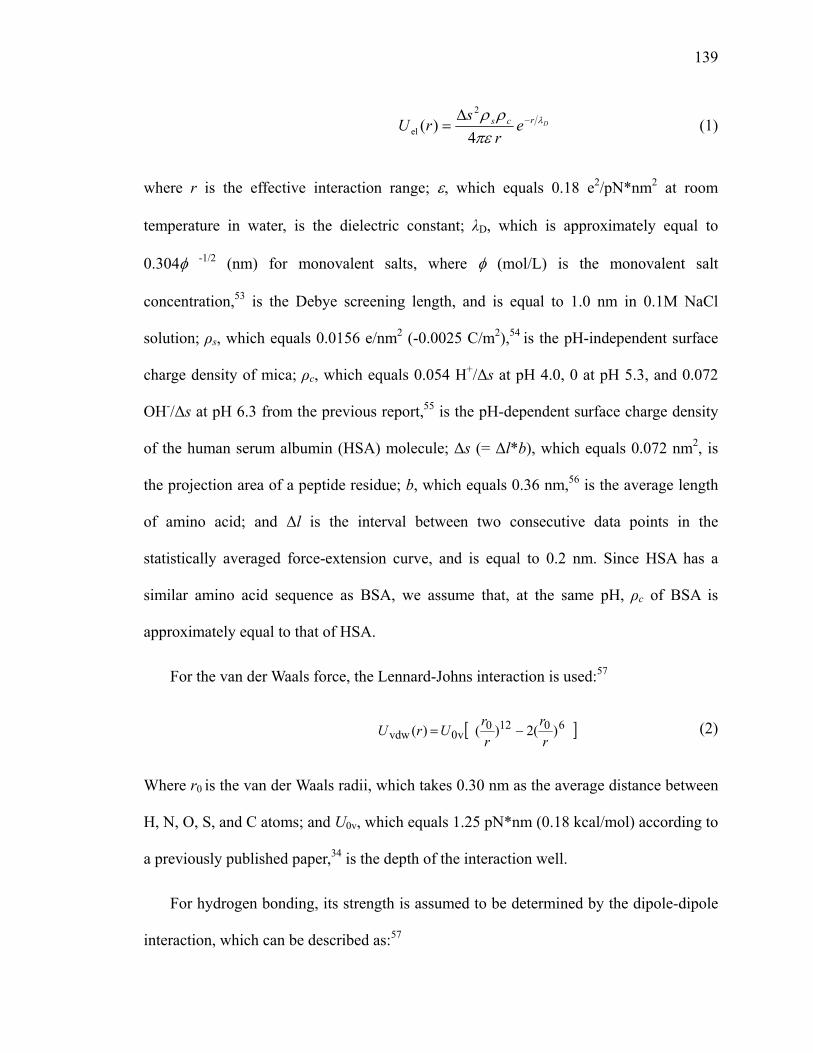
139
Drcs er
srU λ
περρ −∆
=4
)(2
el (1)
where r is the effective interaction range; ε, which equals 0.18 e2/pN*nm2 at room
temperature in water, is the dielectric constant; λD, which is approximately equal to
0.304φ -1/2 (nm) for monovalent salts, where φ (mol/L) is the monovalent salt
concentration,53 is the Debye screening length, and is equal to 1.0 nm in 0.1M NaCl
solution; ρs, which equals 0.0156 e/nm2 (-0.0025 C/m2),54 is the pH-independent surface
charge density of mica; ρc, which equals 0.054 H+/∆s at pH 4.0, 0 at pH 5.3, and 0.072
OH-/∆s at pH 6.3 from the previous report,55 is the pH-dependent surface charge density
of the human serum albumin (HSA) molecule; ∆s (= ∆l*b), which equals 0.072 nm2, is
the projection area of a peptide residue; b, which equals 0.36 nm,56 is the average length
of amino acid; and ∆l is the interval between two consecutive data points in the
statistically averaged force-extension curve, and is equal to 0.2 nm. Since HSA has a
similar amino acid sequence as BSA, we assume that, at the same pH, ρc of BSA is
approximately equal to that of HSA.
For the van der Waals force, the Lennard-Johns interaction is used:57
[ ]60120v0vdw )(2)()(
rr
rr
UrU −= (2)
Where r0 is the van der Waals radii, which takes 0.30 nm as the average distance between
H, N, O, S, and C atoms; and U0v, which equals 1.25 pN*nm (0.18 kcal/mol) according to
a previously published paper,34 is the depth of the interaction well.
For hydrogen bonding, its strength is assumed to be determined by the dipole-dipole
interaction, which can be described as:57
140
[ ]100120h0h )(6)(5)(
rr
rr
UrU hh −= (3)
Where r0h, which equals 0.19 nm, is the average equilibrium length of a hydrogen bond;
and U0h is the depth of the interaction well, and is equal to 34.72 pN*nm (5.0 kcal/mol)
on the basis of the energy penalty to break a hydrogen bond.57 This expression of
hydrogen bonding indicates that the force required to break a bare hydrogen bond is
about 173.6 pN, which is in agreement with a previous report.27
For the elastic force arising from the loss of conformational entropy of protein
molecule, the affine deformation model is used:58
)32(2
),( 2fen −+=
λλλ nkTRU (4)
Where n, which is set as 1, is the number of strands under stretch, and Rf is the end-to-
end distance of the BSA fragment under stretch; λ = x / Rf when the extension x < Rf, and
λ = Rf / x when x ≥ Rf. Because the length of the BSA fragment under stretch is quite
random and has a broad distribution, to eliminate the effects caused by its broad
distribution, at the large extension region, Rf equals Rf2, which has the same value as the
average rupture extension rupx (the longest extension in force-extension curves shown in
Figure 4a); at the small extension region, Rf equals Rf1, which is evaluated as ( rupx /b)0.5b
by assuming a Gaussian coil of the BSA fragment under stretch; at the intermediate
extension region where Rf2 < x < Rf1, the elastic force is fitted by a linear combination of
elastic forces at minimum and maximum extensions, which can be described as:
),(),()( f2enf2f1
f2f1en
f2f1
f1en λλλ RU
RRRxRU
RRxRU
−−
+−−
= (5)
141
By assuming that the interactions of BSA molecules are dominated by the four
elementary forces, the enthalpy contribution can be written as:
)()()()( elelhhvdwvdw rUNrUNrUNrH ++= (6)
where Nvdw, Nh and Nel are the number of interaction pairs for van der Waals force,
hydrogen bonding and electrostatic interaction respectively, and determine the
contribution of these elementary interactions to the total interaction. The profiles of these
interactions, the enthalpy and the entropy are illustrated in Figure 2. It can be seen that
the energy needed to break a hydrogen bond may be less than the depth of Uh due to the
screening of Uvdw. The interaction with a slow tail is contributed mainly by the
electrostatic interaction. The term of the tail interaction is called the excess enthalpy,
which is recorded as Hex(r):
∑=
∆+=10
1minmin )()(
kex lkrHrH (7)
where rmin is the position of the minimum peak in the enthalpy profile (labeled by the
arrow in Figure 2). Since the attenuation of H(r) is quite sharp, a 2.0 nm interaction range
is enough to eliminate the effect of the excess enthalpy. The total energy gained by BSA
molecule under stretch can be written as:
)()()()( enminmin xUrHrHxE ex ++= (8)
In Figure 2 it can be seen that the increase of Nh or Nel leads rmin to a smaller value, and
the increase of Nvdw leads rmin to a larger value. The inset in Figure 2 shows the entropy
contribution to the force-extension curves with different chain length according to Eq. (5).
Other interactions, such as the capillary force, are neglected because the experiments
142
are carried out in solution (liquid cell).59 The hydrophobic and the hydrophilic forces are
included into error and noise range because they are not orientated forces contributing to
the stretch force.
IX.3. Results
IX.3.1. Small-angle neutron scattering (SANS)
The small-angle scattering cross section per unit volume, I(q), for a protein solution
can be written as:
incp IqSqPVqI +∆= )()()()( 2ρφ (9)
where φ and Vp are the volume fraction and the molecular volume of BSA molecule
respectively; Iinc is the incoherent scattering intensity at large q-range, the neutron
scattering contrast ∆ρ between BSA and D2O equals 2.47×10⁻⁶ Å-2;4 P(q) is the form
factor; and S(q) is the structure factor. In the SANS experiments, the volume fraction of
every BSA solution is fixed at 2.5%, which is much lower than the critical volume
fraction φ* of about 8.7%, where 33 /)2/(* gRbN=φ , N (= 583) is the number of amino
acids in each BSA molecule; b (= 3.6 Å) is the average size of an amino acid;56 and Rg (~
34Å) 5 is the radius of gyration of the BSA molecule. Therefore, all the BSA solutions are
in dilute solution region, and S(q) is a constant of 1. P(q) is the form factor of BSA
molecule, which is fitted using three models. The first one is the isodiametric ellipsoid
model,60 where the form factor can be written as:
143
21
0 3
)cos(sin3)( ∫−
=u
uuudxqP
( ) ][ 2/122 )1(/ xbaxqbu −+= (10)
The equivalent isodiametric ellipsoid has two half-axe lengths of a and b, and the
molecular volume Vp = (4/3)πab2 of the ellipsoid has the form of a×b×b. Both the oblate
and the prolate ellipsoid models for the BSA conformation have been suggested,6, 60, 61 so
the shape of the ellipsoid can change as 70×20×20Å, 17×42×42Å or 30×80×80Å etc.,
depending on the ionic strength and pH.
The second model considers that the BSA molecule distributes like a Gaussian chain,
thus the form factor can be fitted by an Ornstein-Zernike (O-Z) equation,62 which is
written as:
2, )(1)0()(OZgqR
IqI+
= (11)
where Rg,OZ is the radius of gyration fitted from an O-Z equation, and the molecular
volume Vp = (4/3)π 3,OZgR . The O-Z fitting obtains a Gaussian coil conformation, which is
also an isodiametric ellipsoid with the ratio between the short axe and the long axe equal
to 0.41.58, 63 The third model assumes that the BSA molecule is an impenetrable spherical
colloid, and the form factor can be fitted by hard sphere form factor,62 which is written as:
⎥⎥⎦
⎤
⎢⎢⎣
⎡ −= 2
p
)())cos()(sin(3
)0()(p
pp
qRqRqRqR
IqI (12)
Here Rp is the radius of the equivalent sphere of BSA molecule and the molecular volume
Vp is equal to (4/3)π 3pR .

144
Furthermore, the actual radius of gyration of BSA molecule Rg is calculated from the
SANS data using Guinier fitting:62
⎪⎭
⎪⎬⎫
⎪⎩
⎪⎨⎧−=
3)(
exp)0()(2
gqRIqI (13)
This equation is valid in the q range where qRg <<1.
The actual size of BSA obtained from Guinier fitting is shown in Fig. 3a. It can be
seen that the Guinier fitting works well at the q-range of qRg <<1. The plot of Rg vs. pH is
presented in Figure 6, which will be discussed later. Figures 3b and 3c show the fitting
results using different form factor functions on the SANS data at different pH values. It
can be seen that, for the SANS data at low pH (i.e., pH = 3.1), Eq. (11) has the best fit for
q up to 0.3 Å-1, while at a higher pH (i.e., pH = 6.6), Eq. (12) has the best fit for q up to
0.1Å-1. This suggests that the BSA molecules are coil-like Gaussian chains at low pH,
and gradually change to hard spheres at higher pH, as illustrated by the gradually
changed scattering intensity profiles with the increase of pH (Fig. 3d). Since the neutron
scattering intensity profiles [I(q) vs. q] of bovine serum albumin (BSA) in 0.1M
NaCl/D2O solutions of different pH values show nearly the same incoherent scattering
intensity at large q range (q > 0.2Å-1), the intensity profiles are shown only in the q range
from 0.01Å-1 to 0.6Å-1 (in Figures 3b, 3c and 3d). By fitting to the form factor, it can be
seen that, at the pH region studied in this work, the ellipsoid model does not provide the
best fitting, which is different from the report by Zhang et al.6 The reason may be due to
the difference in the sample composition and measurement condition. Zhang et al. carried
out small-angle X-ray scattering (SAXS) experiments using 1% BSA in 0.3 M NaCl/H2O
solution at pH 7.0, but we carried out SANS measurements using 2.5% BSA in 0.1 M
145
NaCl/D2O solutions, with all six pH values lower than pH 7.0.
Since the radius of gyration for a single BSA molecule is about 20Å ~ 40Å at the q
range from 0.01 Å-1 to 0.03 Å-1 (209 Å ~ 628 Å using the relationship of 2π/q), the
scattering intensity profile reveals the inter-chain correlation. When the pH increases
from 3.1 to 5.1, the scattering intensity at q range from 0.01 Å-1 to 0.03 Å-1 increases;
however, the scattering intensity decreases when pH further increases from 5.1 to 6.6 (Fig.
3d), suggesting that the BSA molecules have the strongest intra-chain aggregation
(increase ∆ρ) and inter-chain correlation when pH approaches 5.1, which is very close to
the isoelectric point (pI) of BSA in 0.1M NaCl solution (between pH of 4.9 and 4.7, as
described in the introduction). When the pH increases to as high as 6.6, there is negligible
difference in scattering intensity profiles for BSA molecules at pH between 6.1 and 6.6.
When pH changes from 3.6 to 5.1, the Rg of BSA molecule increases with pH, which is
different from the report by Lee et al.,5 where BSA undergoes a conformation transition
from F (40×129 Ǻ) form to N (heart-shaped or triangular shape with 80 Ǻ edges and 30
Ǻ thick) form. The difference may come from multiple aspects, and further analysis of
the chemical force spectroscopy at molecular scale may help to better understand the
difference, as well as the relationship between interaction and conformation of BSA
molecules.
IX.3.2. Chemical force microscopy – Statistical analysis
Because the BSA fragments in contact with the mica subtract may not have the same
size, and the rupture events occur with different numbers of peptide residues under
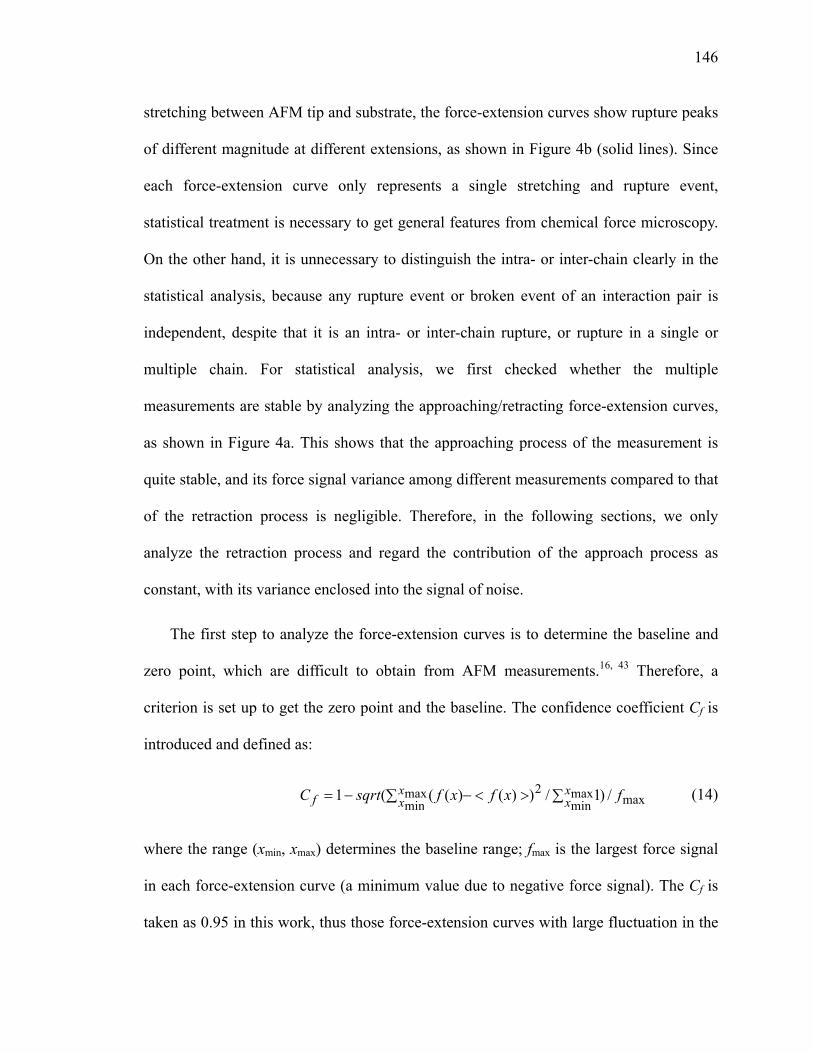
146
stretching between AFM tip and substrate, the force-extension curves show rupture peaks
of different magnitude at different extensions, as shown in Figure 4b (solid lines). Since
each force-extension curve only represents a single stretching and rupture event,
statistical treatment is necessary to get general features from chemical force microscopy.
On the other hand, it is unnecessary to distinguish the intra- or inter-chain clearly in the
statistical analysis, because any rupture event or broken event of an interaction pair is
independent, despite that it is an intra- or inter-chain rupture, or rupture in a single or
multiple chain. For statistical analysis, we first checked whether the multiple
measurements are stable by analyzing the approaching/retracting force-extension curves,
as shown in Figure 4a. This shows that the approaching process of the measurement is
quite stable, and its force signal variance among different measurements compared to that
of the retraction process is negligible. Therefore, in the following sections, we only
analyze the retraction process and regard the contribution of the approach process as
constant, with its variance enclosed into the signal of noise.
The first step to analyze the force-extension curves is to determine the baseline and
zero point, which are difficult to obtain from AFM measurements.16, 43 Therefore, a
criterion is set up to get the zero point and the baseline. The confidence coefficient Cf is
introduced and defined as:
maxmaxmin
maxmin
2 /)1/))()(((1 fxfxfsqrtC xx
xxf ∑ ∑><−−= (14)
where the range (xmin, xmax) determines the baseline range; fmax is the largest force signal
in each force-extension curve (a minimum value due to negative force signal). The Cf is
taken as 0.95 in this work, thus those force-extension curves with large fluctuation in the
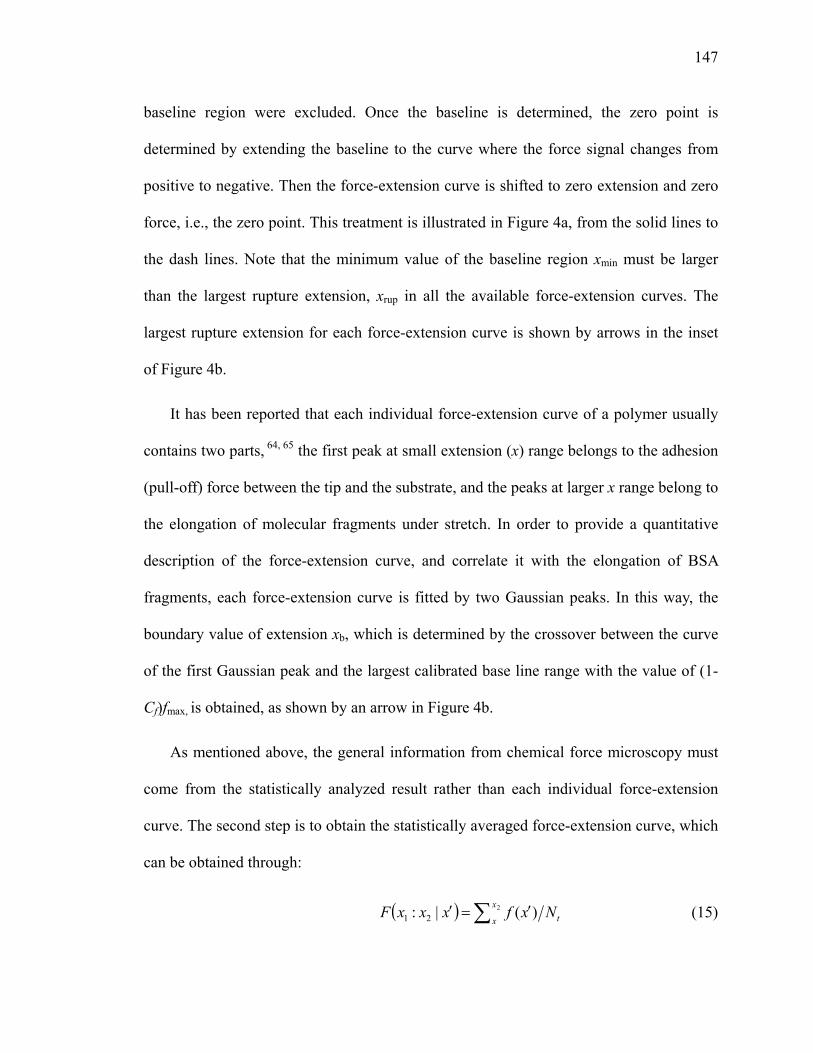
147
baseline region were excluded. Once the baseline is determined, the zero point is
determined by extending the baseline to the curve where the force signal changes from
positive to negative. Then the force-extension curve is shifted to zero extension and zero
force, i.e., the zero point. This treatment is illustrated in Figure 4a, from the solid lines to
the dash lines. Note that the minimum value of the baseline region xmin must be larger
than the largest rupture extension, xrup in all the available force-extension curves. The
largest rupture extension for each force-extension curve is shown by arrows in the inset
of Figure 4b.
It has been reported that each individual force-extension curve of a polymer usually
contains two parts, 64, 65 the first peak at small extension (x) range belongs to the adhesion
(pull-off) force between the tip and the substrate, and the peaks at larger x range belong to
the elongation of molecular fragments under stretch. In order to provide a quantitative
description of the force-extension curve, and correlate it with the elongation of BSA
fragments, each force-extension curve is fitted by two Gaussian peaks. In this way, the
boundary value of extension xb, which is determined by the crossover between the curve
of the first Gaussian peak and the largest calibrated base line range with the value of (1-
Cf)fmax, is obtained, as shown by an arrow in Figure 4b.
As mentioned above, the general information from chemical force microscopy must
come from the statistically analyzed result rather than each individual force-extension
curve. The second step is to obtain the statistically averaged force-extension curve, which
can be obtained through:
( ) ∑ ′=′ 2 )(|: 21x
x tNxfxxxF (15)
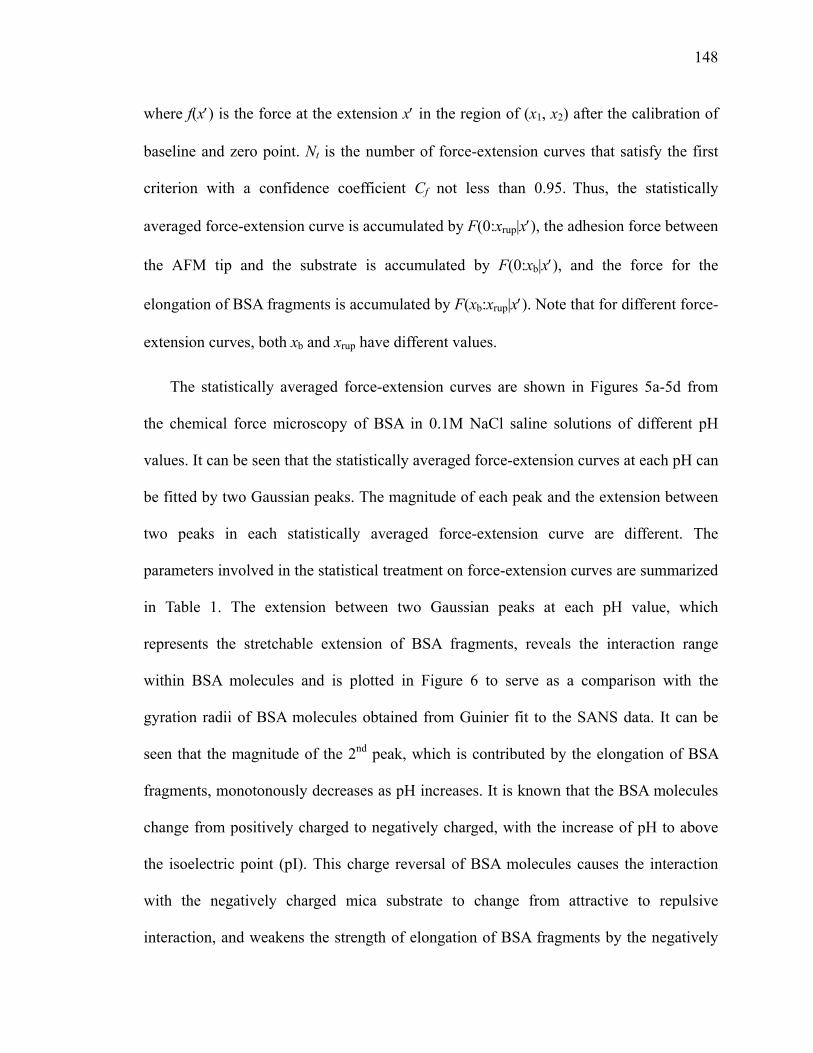
148
where f(x′) is the force at the extension x′ in the region of (x1, x2) after the calibration of
baseline and zero point. Nt is the number of force-extension curves that satisfy the first
criterion with a confidence coefficient Cf not less than 0.95. Thus, the statistically
averaged force-extension curve is accumulated by F(0:xrup|x′), the adhesion force between
the AFM tip and the substrate is accumulated by F(0:xb|x′), and the force for the
elongation of BSA fragments is accumulated by F(xb:xrup|x′). Note that for different force-
extension curves, both xb and xrup have different values.
The statistically averaged force-extension curves are shown in Figures 5a-5d from
the chemical force microscopy of BSA in 0.1M NaCl saline solutions of different pH
values. It can be seen that the statistically averaged force-extension curves at each pH can
be fitted by two Gaussian peaks. The magnitude of each peak and the extension between
two peaks in each statistically averaged force-extension curve are different. The
parameters involved in the statistical treatment on force-extension curves are summarized
in Table 1. The extension between two Gaussian peaks at each pH value, which
represents the stretchable extension of BSA fragments, reveals the interaction range
within BSA molecules and is plotted in Figure 6 to serve as a comparison with the
gyration radii of BSA molecules obtained from Guinier fit to the SANS data. It can be
seen that the magnitude of the 2nd peak, which is contributed by the elongation of BSA
fragments, monotonously decreases as pH increases. It is known that the BSA molecules
change from positively charged to negatively charged, with the increase of pH to above
the isoelectric point (pI). This charge reversal of BSA molecules causes the interaction
with the negatively charged mica substrate to change from attractive to repulsive
interaction, and weakens the strength of elongation of BSA fragments by the negatively
149
charged mica substrate.
The pH effects on the conformation and interaction of BSA molecules show that,
when pH approaches the pI of BSA, the radius of gyration of BSA molecules shows a
peak, while the stretchable extension of the BSA fragments sharply decreases and shows
a local minimum. A possible explanation is that when pH approaches the pI of BSA
molecules, the excess charge density of BSA molecules tends to be zero and the inter-
chain electrostatic repulsion decreases to zero, resulting in an increase of inter-chain
aggregation, leading to a larger Rg, as detected by SANS. On the basis of a report by
Bendedouch and Chen,4 the decrease of electrostatic interaction results in the weakening
of the long-range interaction and an increase of the contribution from the short-range
interaction, such as van der Waals interaction. Therefore, the stretchable extension of the
BSA fragments decreases.
IX.3.3. Analysis of elementary interactions
In order to decouple the contribution of the four elementary interactions from the
statistically averaged force-extension curves, the force-extension curves are statistically
analyzed. Since the interaction pair break at molecular scale is discrete, to obtain the
statistical force-extension curve, the probability for an interaction pair break at a given
extension must be considered, so we collect the statistical force-extension curve in the
form of:
∑ ∑ −= )'(/)'()( xxxfxF δ (16)
where f(x′) is the force at extension x′’ after the calibration of baseline and zero point, and
150
δ(x-x′’), which equals 1 when x-x′’=0, and otherwise equals 0, is the delta function. In
this treatment, the statistical force-extension curves take into account not only the
strength of the force signal but also the probability of the force signal appearing at the
extension x′. According to the energy conservation law, the work against the elongation
of BSA fragments under stretch must be equal to the energy increase during the
elongation of BSA fragments and the tip-substrate interactions. On the basis of the
discrete nature of interaction pairs broken event, the energy increase under stretch can be
written as:15, 34, 38
∑=
∆=x
xi
i
lxFxE0
)()( (17)
The differential relationship between the force and the energy is often used.42, 64 However,
the properties of polymer containing both discrete and continuous characters have also
been reported.40, 41 Therefore, we use the excess enthalpy defined in Eq. (8) to enable the
individual events to have some correlation rather than being totally random. The
statistically accumulated force-extension curve and the work against the energy increase
from both the tip-substrate and BSA fragments versus the extension are plotted in Figure
7. It shows that the force-extension curve still maintains the shape of an individual force-
extension curve, but the magnitude of the minimum peak is a little smaller, and the width
of peak is much broader than that of each individual force-extension curve. The reason is
that the statistically accumulated force-extension curve considers not only the magnitude
of individual signal, but also the incidence rate of signal at the extension as described
above. The decrease in the magnitude of the minimum peak derives from the fact that not
all the largest signals occur at the same extension, and the large signals are weakened due
151
to the small incidence rate. The broadening of the minimum peak is due to the broad
distribution of fragments under stretch. From the work profile, it can be seen that it takes
about 9 × 10³ pN*nm work to fully stretch the BSA fragment from the mica substrate and
overcome the energy increase arising from BSA fragment functionalized tip-substrate
interactions in 0.1M NaCl solution at pH 4.0.
The second step to decouple the contribution of elementary interactions from the
statistical force-extension curves is through self-consistent fitting. There are several
requirements to ensure the correct, reasonable, and unique fitting results: 1) the break of
each interaction pair, except the entropic elastic force, from elongation of BSA fragment
satisfies the two-state Markovian process,43 in which all or none is unfolded, or the two-
state model is either native or unfolded;67 2) the force-extension curve is an accumulation
of a finite number of discrete and independent interaction pair broken events,19 as well as
the excess enthalpy, Hex(rmin) defined in Eq. 7; 3) two end-to-end distances are used in Eq.
(5) to treat the broad distribution of the length of BSA fragment under stretch; 4) the
fitting values in Eq. (8), which are correlated to the statistical results of force-extension
curves, must satisfy the relationship:
)2)((/)()( ff CxFlxECxF −≤∆≤ (18)
5) to correlate the interaction range r with the extension x, the interaction range of the
peak in the enthalpy x must be an integral time of rmin; and 6) the Levenberg—Marquardt
fit68 was used to obtain the best fit.
The fitting to the statistical force-extension curve is shown in Figure 8a, and the
parameters used in this fitting are listed in Table 2 for the interactions between BSA-
152
functionalized AFM tip and mica surface in 0.1 M NaCl solution at pH 4.0. Several
features are observed in Fig. 8a. 1) The statistical force-extension curve is well fitted,
except for a small region at large extension where the fitted force is slightly smaller than
the force obtained from the statistically accumulated experimental data. This discrepancy
may originate from the elastic force at large deformation of BSA molecules which
dominates the force-extension curve. 2) The statistical force-extension curve is
contributed mainly by the van der Waals potential Uvdw. 3) The van der Waals force
mainly determines the shape of the statistical force-extension curve, while the hydrogen
bonding simply remains constant after an abrupt jump with one more or one less
hydrogen bond broken. The electrostatic force profile shows two peaks, with one locating
in the same position as the minimum in the force-extension curve and the other locating
in the position where BSA molecules start to be randomly ruptured. Furthermore, the
contribution of each kind of interaction, in comparison with E(x)/∆l is plotted in Figure
8b, which clearly shows that van der Waals force has a larger contribution than any of the
other three interactions in the region of adhesive peak. A similar result was also reported
by Cappella et al.,19 who indicated that the van der Waals force contributed the most to
the adhesive force when the capillary force was removed. The electrostatic force has the
second largest contribution to the force-extension curve, and increases gradually with the
increase of extension due to its nature of long-range interaction. In all cases, the
electrostatic interaction is screened substantially by either dynamically or statically
induced polarization effects.69 Hydrogen bonding dominates the force-extension curve in
the extension region where the BSA fragments are randomly ruptured, because the
hydrogen bonding potential has a sharp profile which can occur quite randomly with
153
minimum correlation (minimum excess enthalpy). The fluctuation of the hydrogen
bonding broken events can be compensated by either electrostatic potential or van der
Waals potential, especially in the extension region where BSA molecules are randomly
ruptured. The entropy shows a sharp negative peak at very small extension due to the
large deformation of chain under suppression, and its contribution increases slightly with
extension, but it occupies all the forces at very large extension due to the large
deformation under stretch.
We can obtain the total number of interaction pairs from the fitting procedure. It
should be mentioned that the force-extension curves are contributed by a combination of
the adhesive force between BSA-functionalized AFM tip and mica substrate and the
elongation of BSA fragments. According to the energy conservation rule, the work to
elongate BSA fragments equals the energy increase for the BSA fragments. Since the
latter term is an accumulation of individual interaction pair broken events, the number of
interaction pairs due to the elongation of BSA fragments can be obtained from the total
number of interaction pairs plus the fraction of A2/(A1+A2), where A1 and A2 are the
work (integral of force in Figures 5a-5d) against previously mentioned adhesion and
elongation, respectively. The number of interaction pairs (defined in Eq. 6) due to the
elongation of BSA fragments and the average strength for each kind of interaction pair
are summarized in Table 2. In pH 4.0 and 0.1 M NaCl solution, the average force to break
one interaction pair is 16.7 ± 0.6 pN for hydrogen bonding, (6.9 ± 0.2)×10-4 pN for one
electrostatic pair, and 4.8 ± 0.3 pN for one van der Waals interaction pair. The interaction
pairs broken in the statistical force-extension curve include 132 ± 2 hydrogen bonds,
(9.0±0.2)×106 electrostatic interaction pairs, and 1867 ± 41 van der Waals interaction
154
pairs. It is reported that each native BSA molecule with 583 residues contains ~ 68% α-
helix. Each α-helix consists of 10-15 amino acid residues, and there are 10-16 hydrogen
bonds in each α-helix.70 Therefore, there are total about 396 hydrogen bonds in each
native BSA molecule. Assume that the number of hydrogen bonds broken in the
elongation is linearly proportion to the number of residues in the fragments. There are
about 195 residues in BSA fragments under stretch at pH 4.0, 106 at pH 5.3, and 108 at
pH 6.3. The ideal end-to-end distance Rf0 (assuming that each BSA is a Gaussian coil, Rf0
= Nfr0.5b, where Nfr is the number of peptide residues in the fragments, and b, which is
equal to 0.36 nm, is the average size of a peptide residue) of the BSA fragment is about
5.03 nm at pH 4.0, 3.71nm at pH 5.3, and 3.74 nm at pH 6.3. Since the largest end-to-end
distance Rf2 (listed in Table 2) of the BSA fragments can be obtained from the fitting of
statistical force-extension curves, the largest elongation ratio Rf2/Rf0 is therefore obtained.
The contour length of the BSA fragments is also listed in Table 2.
It is known that the surface charge density of the BSA molecules will change with pH
due to the dissociation balance of the amino acid units. The elementary interaction
analysis results directly show how pH affects the force-extension curve of BSA
molecules. At pH 5.3, the electrostatic interaction is nearly zero because the charge
density of the BSA molecule approaches zero.55 The contribution from each elementary
interaction is similar to that at pH 4.0. At pH 6.3, the electrostatic potential is repulsive
due to the interactions between the net negatively charged BSA molecules and the
negatively charged mica substrate. The van der Waals potential is still a major
contribution to the force-extension curve, while the entropic contribution becomes
important due to the largely deformed BSA molecules. As the pH increases, the largest
155
elongation ratio increases, but the minimum force in the statistical force-extension curve
decreases, suggesting that the BSA molecules become more flexible and extensible.
IX.4. Conclusion
In summary, the conformation of BSA molecules in NaCl solutions of different pH
values and its interactions with mica surface have been studied by a combination of
small-angle neutron scattering (SANS) and chemical force microscopy (CFM). The
comparison between SANS and CFM results for the pH dependence of conformation and
interaction of BSA in bulk solution and in surface shows that, when pH is lower than the
isoelectric point (pI) of BSA, both the size of BSA chain and the stretchable extension of
BSA fragments decrease with pH increases, which suggests that when the BSA chain is
attractive to the substrate, BSA chain conformation change on surface presents similar pH
dependence as that in bulk solution; however, when pH is higher than pI of BSA, the
conformation change of BSA chain in bulk solution is contrary to that of BSA fragments
on surface, which denotes that when the BSA chain is repulsive to the substrate, the BSA
chain conformation pH dependence on surface is contrary to that of BSA chain in bulk
solution. Furthermore, the statistical and elementary interaction analysis extracts the
contribution of interactions to the statistical force-extension curve, which provides
information comparable with other experimental methods. We expect this new approach
to help further understanding of the pH dependent interaction and conformation of BSA
molecules, as well as the treatment of AFM results.
156
IX.5. Reference
1. Brown, J. R.; Shockley, P. Lipid-Protein Interactions, V1, Jost, P. C.; Griffith, O. H. edited, John Wiley & Sons, New York, 1982.
2. Peters, T. J. All about Albumin Biochemistry, Genetics, and Medical Applications, Academic Press Inc., San Diego, 1996.
3. Joubert, H. D. Magister Scientiae, University of the Free State Republic of South Africa, 2004.
4. Bendedouch, D.; Chen, S.-H. J. Phys. Chem. l983, 87, 1473.
5. Jr. Lee, C. T.; Smith, K. A.; Hatton, T. A. Biochemistry 2005, 44, 524.
6. Zhang, F.; Skoda, M. W. A.; Jacobs, R. M. J.; Martin, R. A.; Martin, C. M.; Schreiber, F. J. Phys. Chem. B 2007, 111, 251.
7. Friedli, G. L. Ph.D. Dissertation, University of Surrey, England, 1996.
8. Sun, C.; Yang, J.; Wu, X.; Huang, X.; Wang, F.; Liu, S. Biophys. J. 2005, 88, 3518.
9. Schmitt, C.; Sanchez, C.; Desobry-Banon, S.; Hardy, J. Critical Reviews in Food Science and Nutrition 1998, 38, 689.
10. Doublier, J.-L.; Garnier, C. ; Renard, D.; Sanchez, C. Current Opinion in Colloid & Interface Science 2000, 5, 202.
11. Wen, Y.-P.; Dubin, P. L. Macromolecules 1997, 30, 7856.
12. Freeman, N. J.; Peel, L. L.; Swann, M. J.; Cross, G. H.; Reeves, A.; Brand, S.; Lu, J.R. J. Phys.: Cond. Matt. 2004, 16, 2493.
13. Wang, S.-C.; Jr. Lee, C. T. J. Phys. Chem. B 2006, 110, 16117.
14. Warren, P. B. J. Phys.: Cond. Matt. 2002, 14, 7617.
15. Klimov, D. K.; Thirumalai, D. Proc. Natl. Acad. Sci. 1999, 96, 6166.
16. Willemsen, O. H.; Snel, M. M. E.; Cambi, A.; Greve, J.; De Grooth, B. G.; Figdor, C. G. Biophys. J. 2000, 79, 3267.
17. Rief, M.; Oesterhelt, F.; Heymann, B.; Gaub, H. E. Science 1997, 275, 1295.
18. Grasdalen, H.; Smidsrod, O. Macromolecules 1981, 14, 1842.
19. Cappella, B.; Dietler, G. Surface Science Reports 1999, 34, 1.
20. Joyce, S.; Houston, J. Rev. Sci. Instrum. 1991, 62, 710.
21. Ducker, W. A.; Senden, T. J.; Pashley, R. M. Nature 1991, 353, 239.
22. Kuo, S. C.; Sheetz, M. P. Science 1993, 260, 232.
23. Gingell, D.; Owens, N.; Hodge, P.; Nicholas, C. V.; O’Dell, R. J. Biomed. Mater. Res. 1994, 28, 505.
24. Ahmed, F.; Alexandridis, P.; Neelamegham, S. Langmuir 2001, 17, 537.
25. Binnig, G.; Gerber, C.; Stoll, E.; Albrecht, T. R.; and Quate, C. F. Europhysics
157
Letters, 1987, 3, 1281.
26. Colton, R. J.; Engel, A.; Frommer, J. E.; Gaub, H. E.; Gewirth, A.; Guckenberger, R.; Rabe, J.; Heckl, W. M.; Parkinson, B. Procedures in Scanning Probe Microscopy. John Wiley & Sons, New York (1998).
27. Boland, T.; Ratner, B. D. Proc. Natl. Acad. Sci. 1995, 92, 5297.
28. Butt, H.-J.; Cappella, B.; Kappl, M. Surface Science Reports 2005, 59, 1.
29. Janshoff, A.; Neitzert, M.; Oberdörfer, Y.; Fuchs, H. Angew. Chem.Int. Ed. 2000, 39, 3212.
30. Wang, M. S.; Palmer, L. B.; Schwartz, J. D.; Razatos, A. Langmuir 2004, 20, 7753.
31. Merkel, R.; Nassoy, P.; Leung, A.; Ritchie, K.; Evans, E. Nature 1999, 397, 50.
32. Wong, J.; Chilkoti, A.; Moy, V. T. Biomolecular Engineering 1999, 16, 45.
33. Dupres, V.; Verbelen, C.; Dufrên, Y. F. Biomaterials 2007, 28, 2393.
34. Stofer, E.; Chipot, C.; Lavery, R. J. Am. Chem. Soc. 1999, 121, 9503.
35. Sattin, B. D.; Pelling, A. E.; Goh, M. C. Nucleic Acids Research 2004, 32, 4876.
36. Wal, M. V.; Kamper, S.; Headley, J.; Sinniah, K. Langmuir 2006, 22, 882.
37. Zou, S.; Schönherr, H.; Vancso, G. J. Angew. Chem. Int. Ed. 2005, 44, 956.
38. Grandbois, M.; Beyer, M.; Rief, M.; Clausen-Schaumann, H.; Gaub, H. E. Science 1999, 283, 1727.
39. Bustamante, C.; Smith, S. B.; Liphardt, J.; Smith, D. Current Opinion in Structural Biology 2000, 10, 279.
40. Rosa, A.; Hoang, T. X.; Marenduzzo, D.; Maritan, A. Biophysical Chemistry 2005, 115, 251.
41. Storm, C.; Nelson, P. C. Phys. Rev. E 2003, 67, 051906.
42. Strick, T. R.; Dessinges, M.-N.; Charvin, G.; Dekker, N. H.; Allemand, J.-F.; Bensimon, D.; Croquette, V. Rep. Prog. Phys. 2003, 66, 1.
43. Schlierf, M.; Li, H.; Fernandez, J. M. Proc. Natl. Acad. Sci. 2004, 101, 7299.
44. Hummer, G.; Szabo, A. Biophys. J. 2003, 85, 5.
45. Meadows, P. Y.; Bemis, J. E.; Walker, G. C. J. Am. Chem. Soc. 2005, 127, 4136.
46. Qu, D.; Pedersen, J. S.; Garnier, S.; Laschewsky, A.; Möhwald, H.; Klitzing, R. V. Macromolecules 2006, 39, 7364.
47. Sulchek, T.; Friddle, R.W.; Noy, A. Biophys. J. 2006, 90, 4686.
48. Thiyagarajan, P.; Epperson, J. E.; Crawford, R. K.; Carpenter, J. M.; Klipper, T. E.; Wozniak, D. G. J. Appl. Cryst. 1997, 30, 280.
49. Li, Y. Q.; Sun, Z. Y.; Shi, T. F.; An, L. J.; Huang, Q. R. J. Phys. Chem. B 2006, 110, 26424.

158
50. Dubois, L. H.; Nuzzo, R.G. Annu. Rev. Phys. Chem. 1992, 43, 437.
51. Debye, P.; Hückel, E. Physikalische Zeitschrift 1923, 24, 185.
52. Griffiths, D. J.; Uvanovic, D. Z. Am. J. Phys. 2001, 69, 435.
53. Niebuhr, M.; Koch, M. H. J. Biophys. J. 2005, 89, 1978.
54. Philippsen, A.; Im, W.; Engel, A.; Schirmer, T.; Roux, B.; Müller, D. J. Biophysical J. 2002, 82, 667.
55. Tanford, C. J. Am. Chem. Soc. 1950, 72, 441.
56. Oesterhelt, F.; Oesterhelt, D.; Pfeiffer, M.; Engel, A.; Gaub, H. E.; Müller, D. J. Science 2000, 288, 143.
57. Morris, G. M.; Goodsell, D. S.; Huey, R.; Olson, A. J. AutoDock 2.4 User Guide, Scripps Research Institute, USA, 1994.
58. Rubinstein, M.; Colby, H. Polymer Physics, Oxford University Press, New York, 2004.
59. Weisenhorn, A. L.; Hansma, P. K.; Albrecht, T. R.; Quate, C. F. Appl. Phys. Lett. 1989, 54, 2651.
60. Ferrer, M. L.; Duchowicz, R.; Carrasco, B. ; de la Torre, J. G.; Acuna, A. U. Biophys. J. 2001, 80, 2422.
61. Nossal, R.; Glinka, C. J.; Chen, S. H. Biopolymers 1986, 25, 1157.
62. Higgins, J. S.; Benoit, H. C. Polymers and Neutron Scattering, Clarendon Press, Oxford, 1994.
63. Li, Y. Q.; Huang, Q. R.; Shi, T. F.; An, L. J. J. Phys. Chem. B 2006, 110, 23502.
64. Tivanski, A. V.; Bemis, J. E.; Akhremitchev, B. B.; Liu, H.; Walker, G. C. Langmuir 2003; 19, 1929.
65. Meadows, P. Y.; Bemis, J. E.; Walker, G. C. Langmuir 2003, 19, 9566.
66. Lee, G. U.; Kidwell, D. A.; Colton, R. J. Langmuir 1994, 10, 354.
67. Zocchi, G. Proc. Natl. Acad. Sci. 1997, 94, 10647.
68. Bates, D. M.; Watts, D. G. Nonlinear Regression and Its Applications Wiley, New York, 1988.
69. Schueler-Furman, O.; Wang, C.; Bradley, P.; Misura, K.; Baker, D. Science 2005, 310, 638.
70. Valstar, A. Ph.D. Dissertation, Uppsala University, 2000.
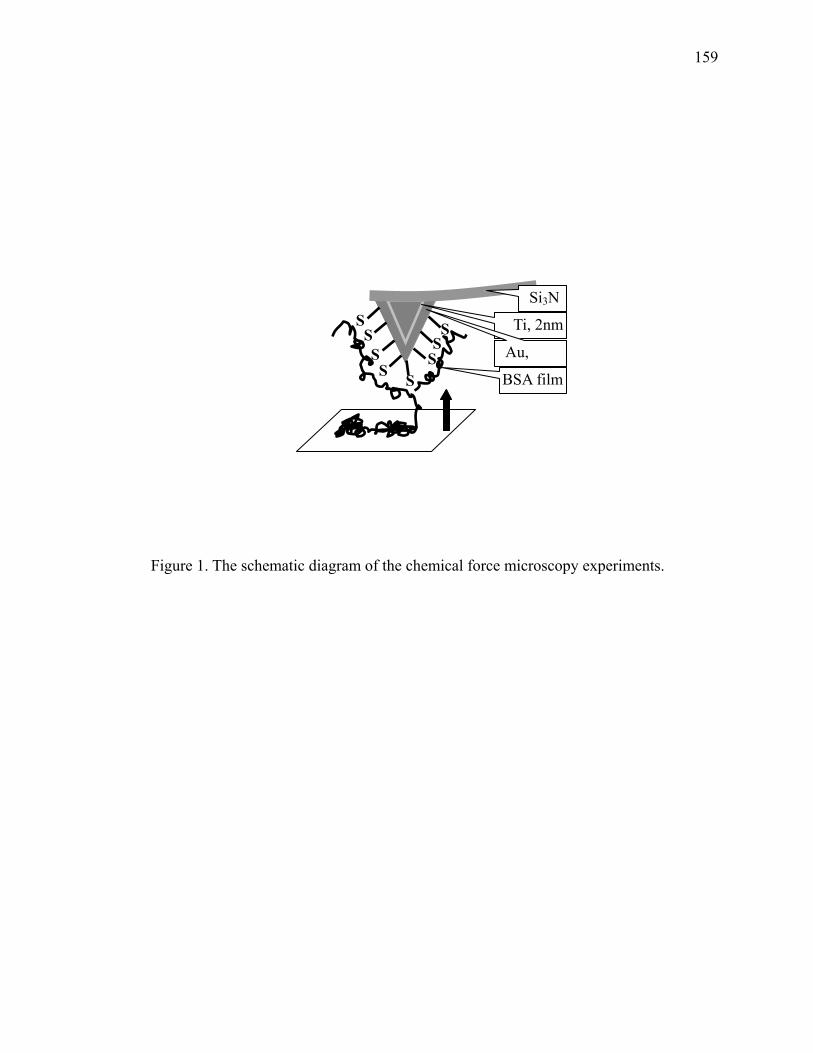
159
Figure 1. The schematic diagram of the chemical force microscopy experiments.
S
S S S
S S
S S
Ti, 2nm
Si3N
Au,
BSA film
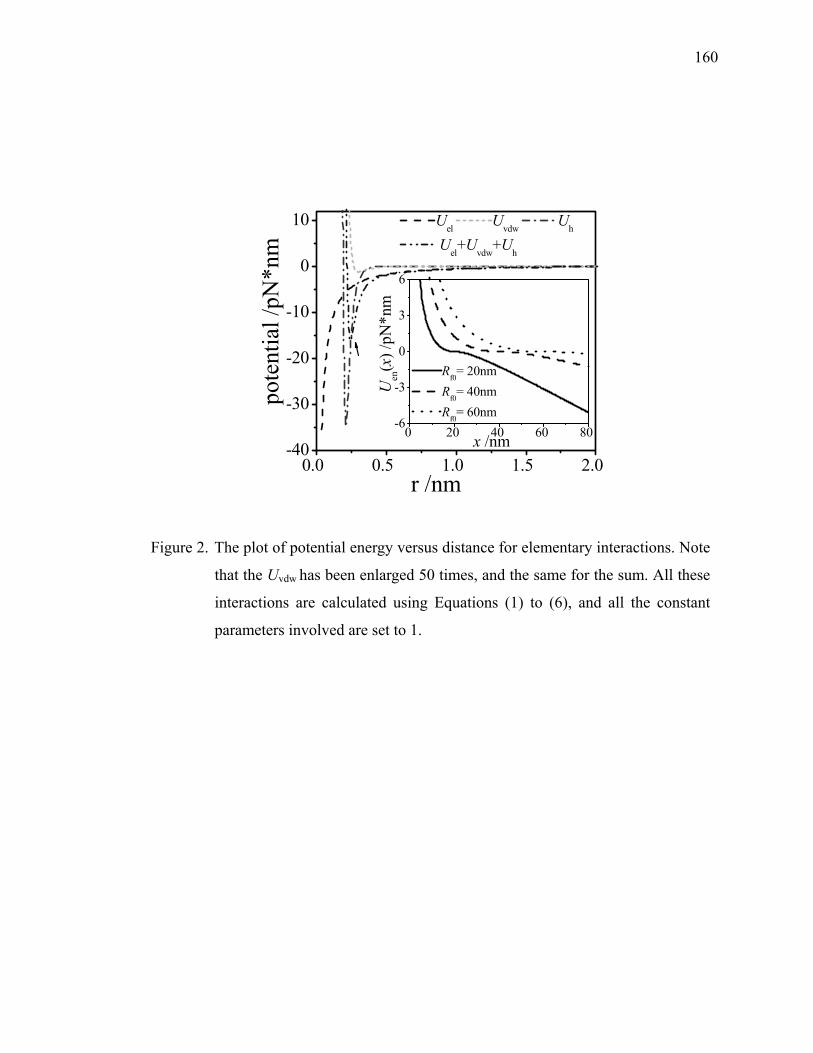
160
0.0 0.5 1.0 1.5 2.0-40
-30
-20
-10
0
10
0 20 40 60 80-6
-3
0
3
6
Rf0= 20nmRf0= 40nmRf0= 60nm
Uen
(x) /
pN*n
m
x /nm
pote
ntia
l /pN
*nm
r /nm
Uel Uvdw Uh
Uel+Uvdw+Uh
Figure 2. The plot of potential energy versus distance for elementary interactions. Note
that the Uvdw has been enlarged 50 times, and the same for the sum. All these
interactions are calculated using Equations (1) to (6), and all the constant
parameters involved are set to 1.
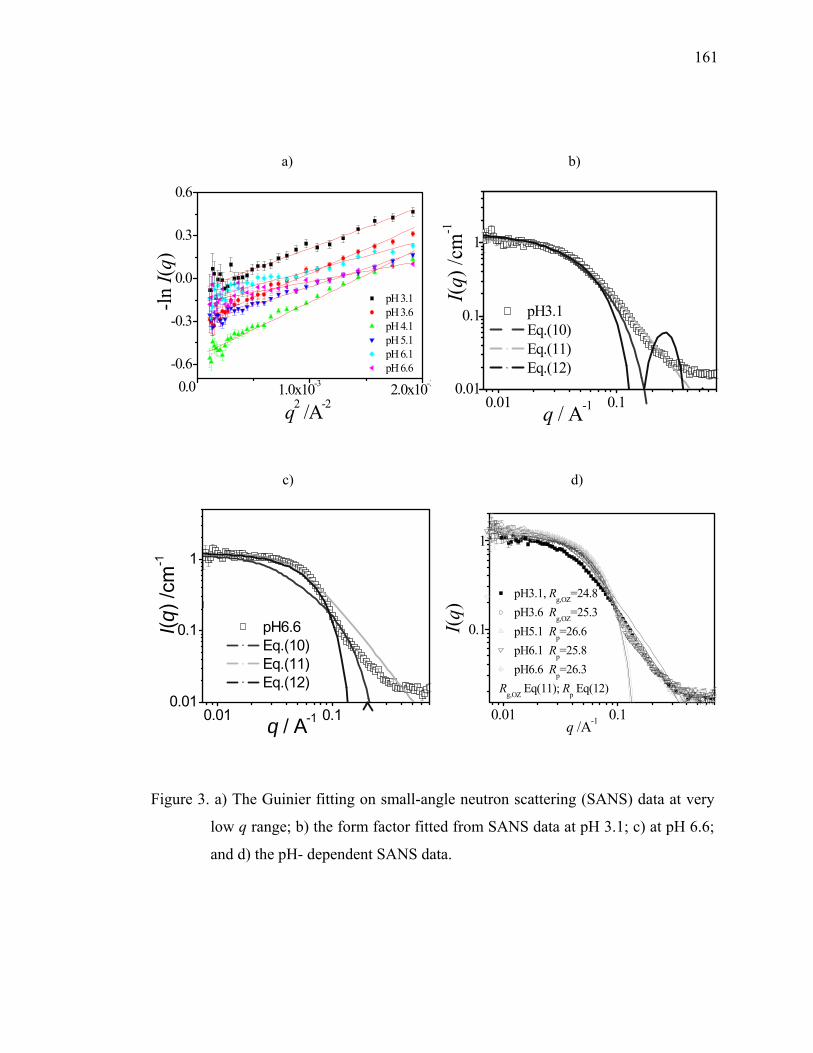
161
a)
0.0 1.0x10⁻³ 2.0x10⁻³
-0.6
-0.3
0.0
0.3
0.6
pH 3.1 pH 3.6 pH 4.1 pH 5.1 pH 6.1 pH 6.6
-ln I(
q)
q2 /A-2
b)
0.01 0.10.01
0.1
1
I(q)
/cm
-1
q / A-1
pH3.1 Eq.(10) Eq.(11) Eq.(12)
c)
0.01 0.10.01
0.1
1
I(q) /
cm-1
q / A-1
pH6.6 Eq.(10) Eq.(11) Eq.(12)
d)
0.01 0.1
0.1
1
q /A-1
I(q)
pH3.1, Rg,OZ=24.8pH3.6 Rg,OZ=25.3pH5.1 Rp=26.6pH6.1 Rp=25.8pH6.6 Rp=26.3
Rg,OZ Eq(11); Rp Eq(12)
Figure 3. a) The Guinier fitting on small-angle neutron scattering (SANS) data at very
low q range; b) the form factor fitted from SANS data at pH 3.1; c) at pH 6.6;
and d) the pH- dependent SANS data.
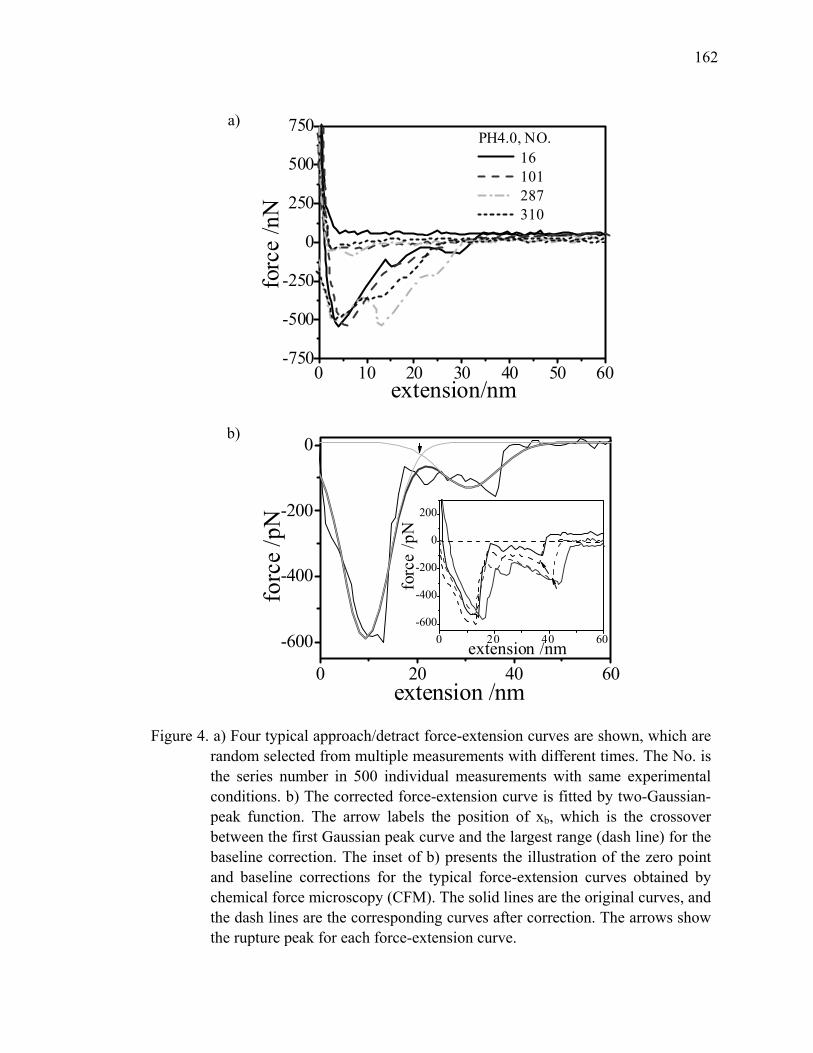
162
a)
0 10 20 30 40 50 60-750
-500
-250
0
250
500
750
forc
e /n
N
extension/nm
PH4.0, NO. 16 101 287 310
b)
0 20 40 60
-600
-400
-200
0
0 20 40 60-600
-400
-200
0
200
forc
e /p
N
extension /nm
forc
e /p
N
extension /nm
Figure 4. a) Four typical approach/detract force-extension curves are shown, which are random selected from multiple measurements with different times. The No. is the series number in 500 individual measurements with same experimental conditions. b) The corrected force-extension curve is fitted by two-Gaussian-peak function. The arrow labels the position of xb, which is the crossover between the first Gaussian peak curve and the largest range (dash line) for the baseline correction. The inset of b) presents the illustration of the zero point and baseline corrections for the typical force-extension curves obtained by chemical force microscopy (CFM). The solid lines are the original curves, and the dash lines are the corresponding curves after correction. The arrows show the rupture peak for each force-extension curve.
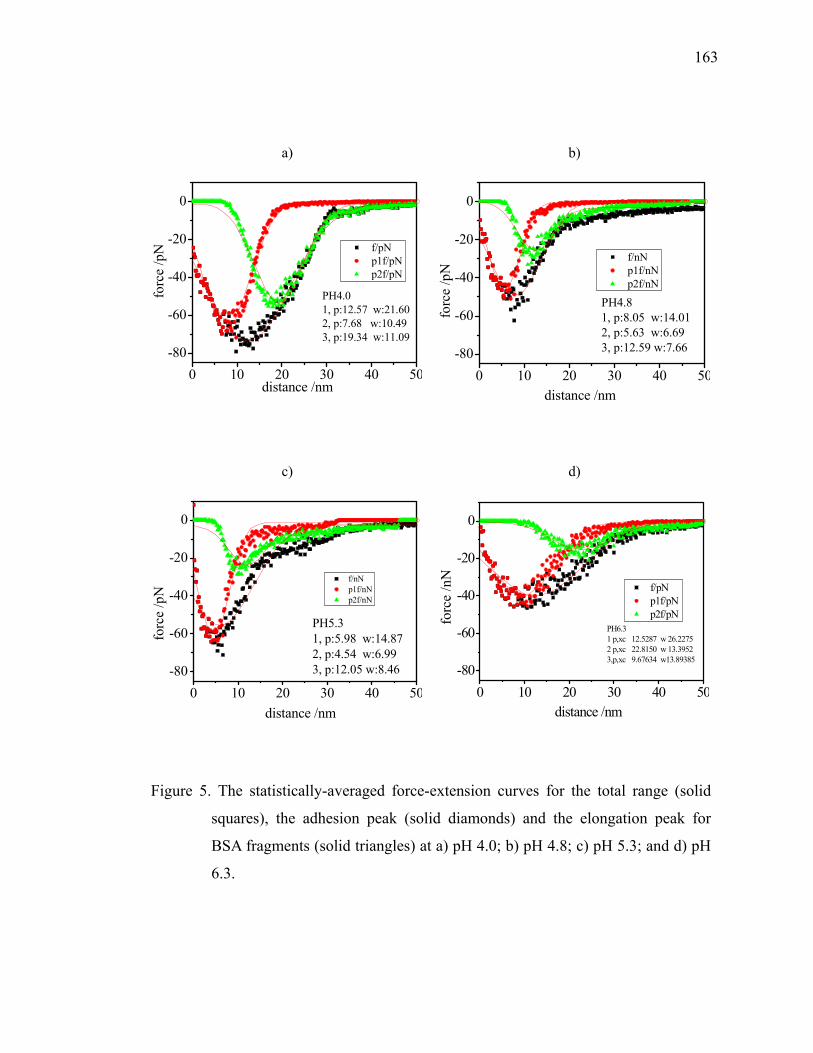
163
a)
0 10 20 30 40 50-80
-60
-40
-20
0
forc
e /p
N
distance /nm
f/pN p1f/pN p2f/pN
PH4.01, p:12.57 w:21.602, p:7.68 w:10.493, p:19.34 w:11.09
b)
0 10 20 30 40 50-80
-60
-40
-20
0
distance /nm
f/nN p1f/nN p2f/nN
forc
e /p
N
PH4.81, p:8.05 w:14.012, p:5.63 w:6.693, p:12.59 w:7.66
c)
0 10 20 30 40 50-80
-60
-40
-20
0
distance /nm
forc
e /p
N
PH5.31, p:5.98 w:14.872, p:4.54 w:6.993, p:12.05 w:8.46
f/nN p1f/nN p2f/nN
d)
0 10 20 30 40 50-80
-60
-40
-20
0
forc
e /n
N
distance /nm
f/pN p1f/pN p2f/pN
PH6.31 p,xc 12.5287 w 26.22752 p,xc 22.8150 w 13.39523,p,xc 9.67634 w13.89385
Figure 5. The statistically-averaged force-extension curves for the total range (solid
squares), the adhesion peak (solid diamonds) and the elongation peak for
BSA fragments (solid triangles) at a) pH 4.0; b) pH 4.8; c) pH 5.3; and d) pH
6.3.
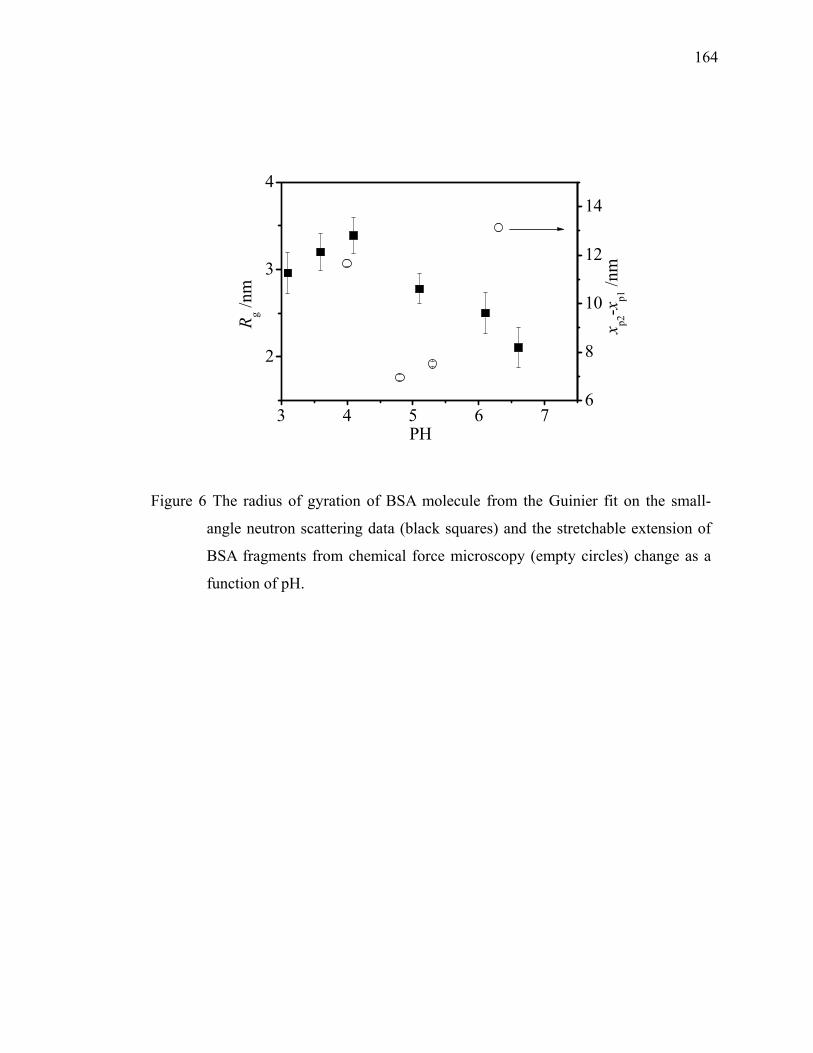
164
3 4 5 6 7
2
3
4
6
8
10
12
14
R g /nm
PH
x p2-x
p1 /n
m
Figure 6 The radius of gyration of BSA molecule from the Guinier fit on the small-
angle neutron scattering data (black squares) and the stretchable extension of
BSA fragments from chemical force microscopy (empty circles) change as a
function of pH.
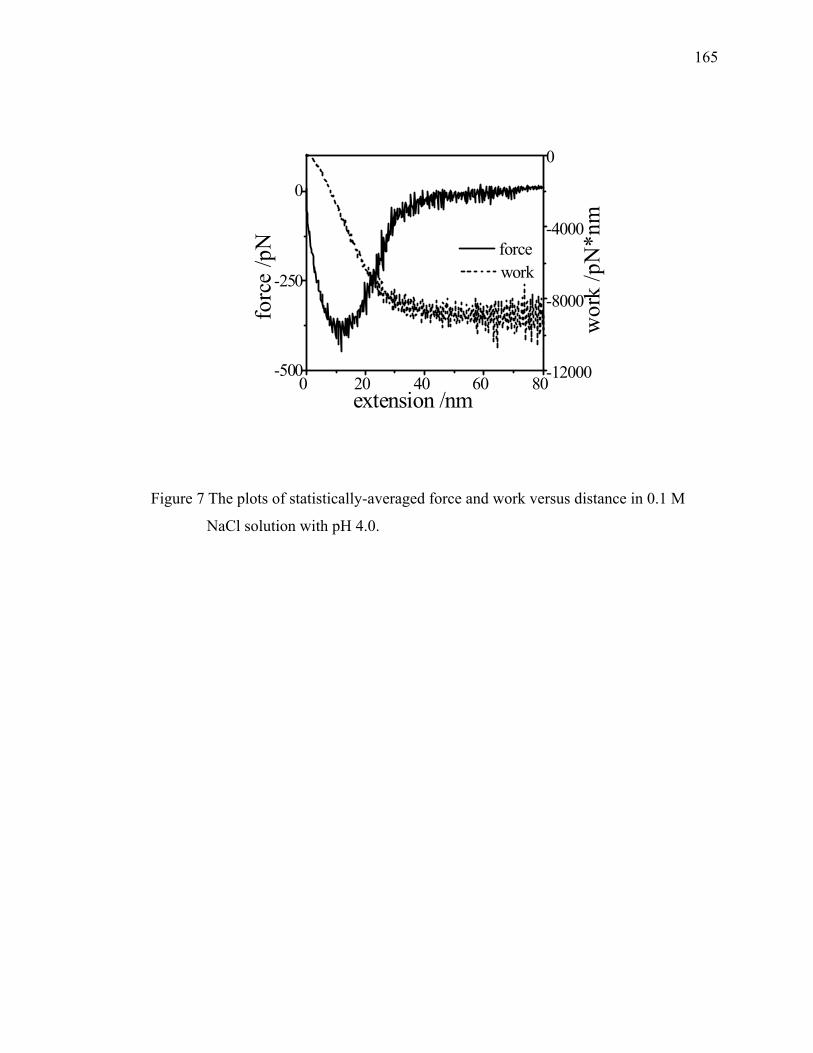
165
0 20 40 60 80-500
-250
0
-12000
-8000
-4000
0
wor
k /p
N*n
m
extension /nm
forc
e /p
N force work
Figure 7 The plots of statistically-averaged force and work versus distance in 0.1 M
NaCl solution with pH 4.0.
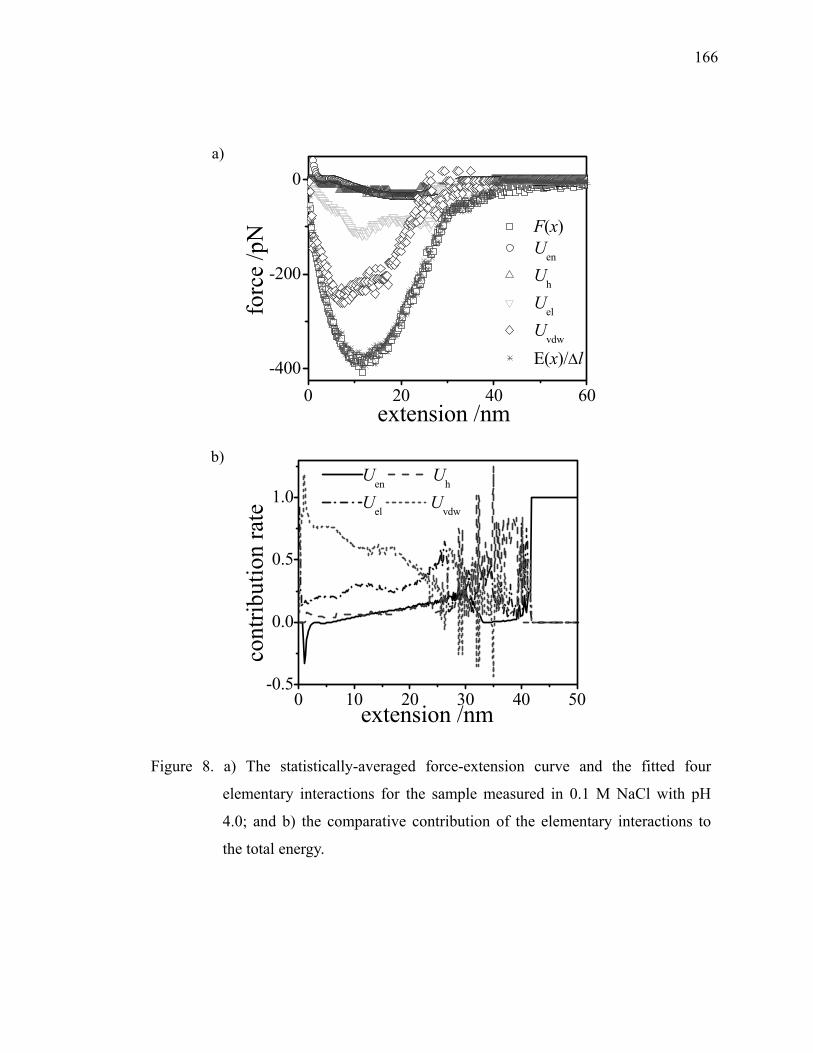
166
a)
0 20 40 60-400
-200
0
extension /nm
forc
e /p
N F(x) Uen
Uh
Uel
Uvdw
E(x)/∆l
b)
0 10 20 30 40 50-0.5
0.0
0.5
1.0
extension /nm
cont
ribut
ion
rate
Uen Uh
Uel Uvdw
Figure 8. a) The statistically-averaged force-extension curve and the fitted four
elementary interactions for the sample measured in 0.1 M NaCl with pH
4.0; and b) the comparative contribution of the elementary interactions to
the total energy.
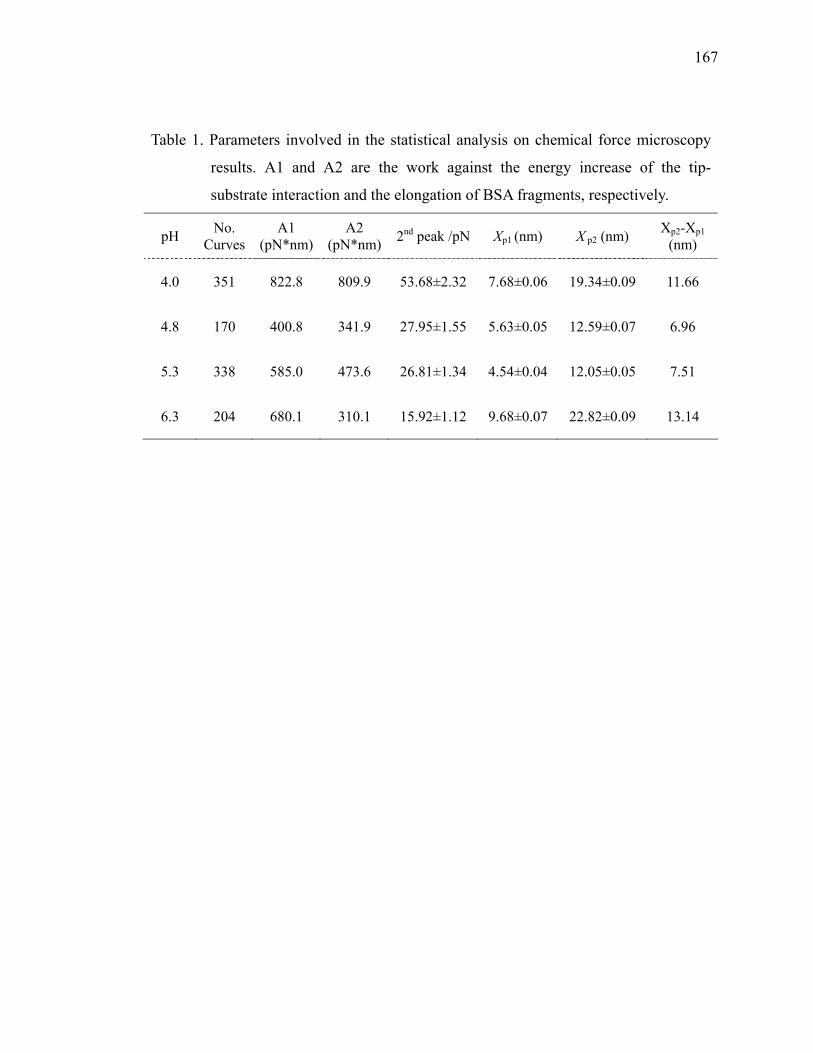
167
Table 1. Parameters involved in the statistical analysis on chemical force microscopy
results. A1 and A2 are the work against the energy increase of the tip-
substrate interaction and the elongation of BSA fragments, respectively.
pH No. Curves
A1 (pN*nm)
A2 (pN*nm) 2nd peak /pN Xp1 (nm) X p2 (nm) Xp2-Xp1
(nm)
4.0 351 822.8 809.9 53.68±2.32 7.68±0.06 19.34±0.09 11.66
4.8 170 400.8 341.9 27.95±1.55 5.63±0.05 12.59±0.07 6.96
5.3 338 585.0 473.6 26.81±1.34 4.54±0.04 12.05±0.05 7.51
6.3 204 680.1 310.1 15.92±1.12 9.68±0.07 22.82±0.09 13.14

168
Table 2. Parameters involved in the analysis of elementary interactions on chemical
force microscopy results. Nc is the contour length of BSA fragments on the
basis of the number of hydrogen bonds broken.
pH ρc (e/nm2)a
Rf1 (nm)
Rf2 (nm) Rf2/Rf0
N (nm)
Nh fh /pN
Nvdw fvdw /pN
Nel, fel /pN
4.0 0.054 3.45 33.06 6.6 70.2 132±2 16.7±0.6
1867±41 4.8±0.3
(9.0±0.2)×106
-(6.9±0.2)×10-
4
5.3 0 3.11 26.83 7.2 38.2 72±1 14.7±0.3
1152±11 5.5±0.1
0 0
6.3 -0.072 3.53 34.70 9.3 38.9 73±1 13.0±0.1
1233±11 6.2±0.5
(17.0±0.1)×106
(1.8±0.3)×10-4
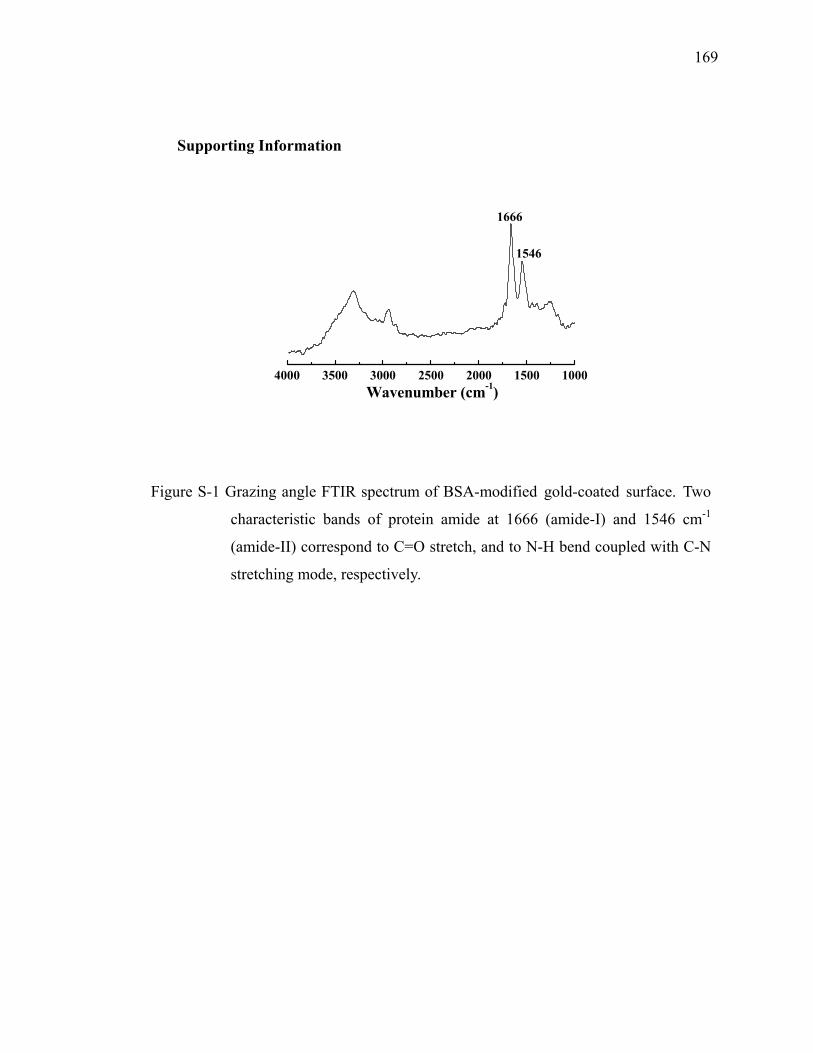
169
Supporting Information
4000 3500 3000 2500 2000 1500 1000
1546
1666
Wavenumber (cm-1)
Figure S-1 Grazing angle FTIR spectrum of BSA-modified gold-coated surface. Two
characteristic bands of protein amide at 1666 (amide-I) and 1546 cm-1
(amide-II) correspond to C=O stretch, and to N-H bend coupled with C-N
stretching mode, respectively.
170
CURRICULUM VITA
Jooyoung Lee
February 1998 B.S., Biotechnology Yonsei University, Seoul, Korea
1997 ~ 1998 Research Assistant, Engineering Research Institute Yonsei University, Seoul, Korea
Spring 1995, Fall 1997, Fall 1998
Fellowship Yonsei University, Seoul, Korea
1998 Teaching Assistant, Biotechnolo gy Yonsei University, Seoul, Korea
October, 1999 Award of the Best Thesis Korean Society of Food Science and Technology, Kyunghee University, Korea
February 2000 M.S., Biotechnology Yonsei University, Seoul, Korea
December 1999 ~ April 2002
Research Scientist R&D Center, TS Sugar Corporation, Incheon, Korea
2003 Lee, J, Ruengruglikit, C., Huang, Q., Interactions between carrageenan/furcelleran and bovine serum albumin: (1) Effects of ionic strength and linear charge density; 2003, Polymer Preprints, 44(2), 289-290
2003 Ruengruglikit, C., Lee, J., Huang, Q., viscoelastic properties of carrageenan/furcellaran and bovine serum albumin complexes. Polymeric Materials Science and Engineering, 2003, 89, 388-389
May ~ August 2003
Visiting Researcher Materials and Technology of Polymer, Univ. of Twente, The Netherlands
171
2003~2004 Graduate Research Assistant Dept. Food Science, Rutgers, The State University of New Jersey
June ~ August 2005
Intern, Materials Characterization Laboratory R&D Center, International Flavors & Fragrances (IFF), NJ
March, 2006 Traveling award, Withycombe-Charalambous Award for Excellence in Graduate Research Agricultural or Food Chemistry at American Chemical Society in Atlanta, GA
2007 Wang, X., Lee, J., Wang, Y.-W., Huang, Q., Composition and rheological properties of β-lactoglobulin/pectin coacervates: Effects of salt concentration and initial protein/polysaccharide ratio, Biomacromolecules, 2007, 8(3), 992-997
2007 Li, Y., Shi, T., An, L., Lee, J., Wang, X., Huang, Q.,Effects of polar group saturation on physical gelation of amphiphilic polymer solutions, Journal of Physical Chemistry B, 2007, 111(42), 12081-12087
2007 Lee, J., Wang, X., Ruengruglikit, C., Gezgin, Z. Huang, Q., 2007. Nanotechnology in food materials research, In Food Materials Science: Principles and Practice, J.M. Aguilera, and P.J. Lillford (Eds.). Springer Publishers, New York, NY
January 2008 Ph.D., Food Science Rutgers, The State University of New Jersey, NJ
2008 Li, Y., Lee, J., Lal, J., An, L., Huang, Q., Effects of pH on the interactions and conformation of bovine serum albumin: Comparison between chemical force microscopy and small-angle neutron scattering, 2008, Journal of Physical Chemistry B, In press
2008 Li, Y., Lee, J., Lal, J., An, L., Huang, Q., Small-angle neutron scattering studies of the gelling behaviors of carrageenans: Effects of temperature and salt, Langmuir, submitted