Embed Size (px)
Citation preview
PHYSICAL P R O P E R T I E S OF ENSILED GRASS AND C O R N , SILO C A P A C I T I E S AND
SILAGE P R E S S U R E S IN C Y L I N D R I C A L TOWER SILOS
C. 't H a r t , A . H . Bosma and M . G . Telle
Institute of A g r i c u l t u r a l E n g i n e e r i n g (IMAG) W a g e n i n g e n
(the N e t h e r l a n d s )
A B S T R A C T
Forage ensiled in tower silos is compressed solely by its own weight. The
relationship between silage density, pressure, and time, as well as seepage
losses, were studied in the laboratory. This included consolidation tests
and friction coefficient measurements.
The dry density could be expressed as function of pressure and time:
,2 pt * At + Bt ^ ° 9 P ^
• a. + a« log t and B - a^ + a, log t where A 1 I £ L J
p - dry density in kg dm/m after t hours, p » vertical pressure 2 '
i n kN/m
a., a., a. and a, are coefficients related to the forage.
The coefficients a. to a. depend on the kind of material, and for grass they
vary with chop length and stage of maturity.
The wall material is the most important parameter for the friction coefficients.
Seepage commenced at theoretical gasvolumes between 10 and 15%.
Capacities and pressures in silage tower silos were calculated using Janssen's
theory as modified by Wood for varying density and the behaviour of silage
at effective saturation.
Silage characteristics were obtained for grass and whole-plant corn. The results
were compared with settled depths measured in 10 silos filled with grass and
6 silos filled with corn. Pressure measurements were made once for grass
and once for corn. The agreement between calculations and measurements was
reasonable.
For Dutch circumstances directives for standard capacities of steel tower
silos with D = 7 m diameter are:
for grass p « 195 + 5.85 h s kg/m
valid for 50% dm and av. maturity (crude fibre 22-28%)
7
for corn p = 173 + 4.76 h kg/rrr
val i d f o r 301 dm
where p = average d ry dens i t y i n kg/tn
v a l i d f o r h = s e t t l e d he i gh t i n m between 9.30 and 21 .30 .
Cor rec t ions are g iven f o r changes in dry m a t t e r - c o n t e n t , m a t u r i t y o f the
m a t e r i a l , D, and w a l l roughness.
I N T R O D U C T I O N
This report deals with a few agricultural and structural aspects of storing
silage in tower silos. The user of a silo is interested in a certain capacity.
He has to be able to store a sufficient quantity of silage, expressed in tons
of dry matter, to feed his herd during a given time period.
Based upon this information a silo of the required capacity must be designed
such that it can safely withstand the forces exerted by wind and silage
(lateral pressures and frictional forces).
There are data available on both aspects such as ASAE Data compiled
by Aldrich (1963) and standards such as NSA Design Standards for Concrete
Stave Silos (197*0, Canadian Farm Building Code (1975), British Standard 5061
(197*0, and the German Standard DIN 1055 Blatt 6 (1964). However, these data
and standards present such widely varying values that is was considered
necessary to start our own research program to find better answers for Dutch
ci rcumstances.
In 1973 and 197't a few consolidation tests were made on whole-plant corn silage
with a consolidation machine described by and made available to us by Wood
(1971). To conduct these investigations on a larger scale we found the method
used by Daynard et al. (197**, 1978) more suitable.
In 1976 we installed a laboratory with 110 cylinders, which made it possible
to do the tests on 22 samples at one time at five different pressure levels.
In I978 an existing tower silo at our experimental dairy farm was instrumented
with pressure measuring panels and a second bottom on four load cells.
This report describes:
a. pressure consolidation tests up to saturation on grass and corn (laboratory
tests)
b. measuring friction coefficients between silage and various building materials
for silos (laboratory tests)
c. measuring capacities and settled depths on full scale towersilos
d. measuring pressures in a full scale towers!lo
e. comparison of results obtained under c and d with model predictions based
on results obtained under a and b
f. calculation of standard silo capacities based on these results.
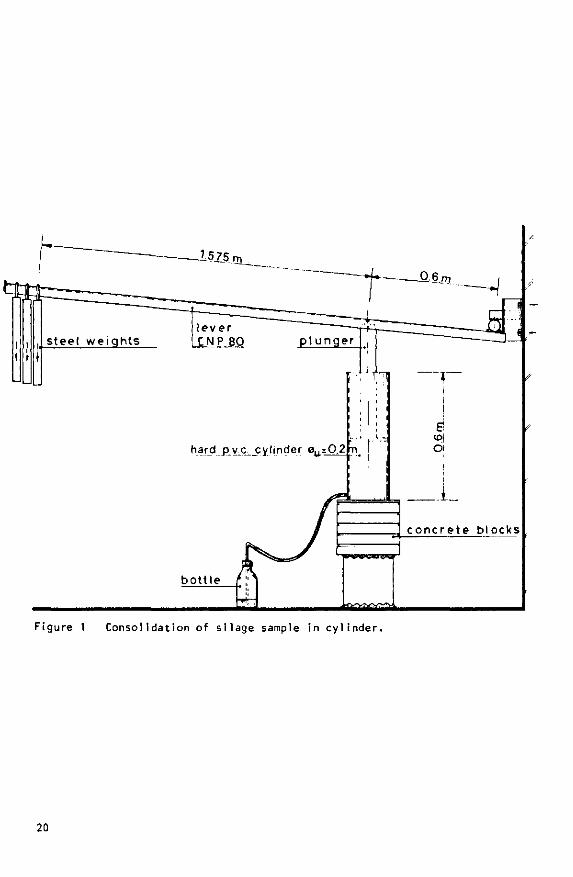
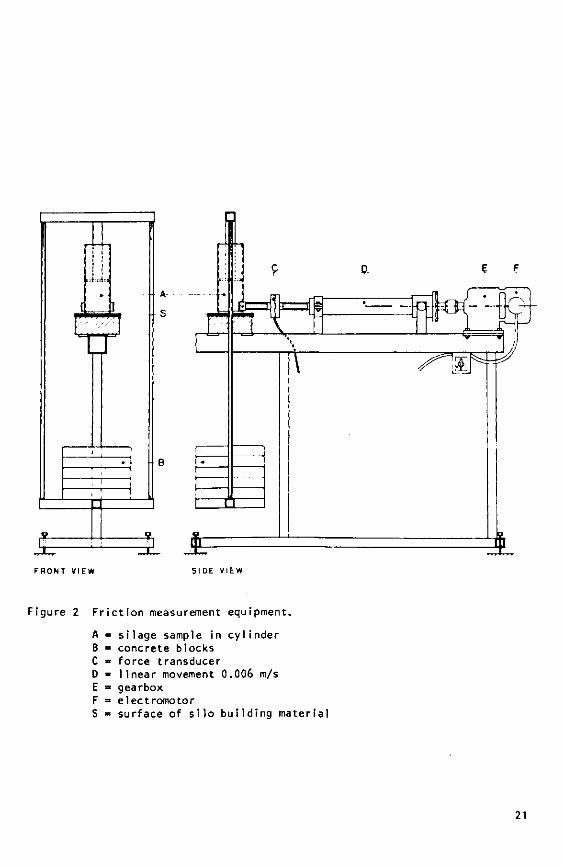
L A B O R A T O R Y T E S T S
Laboratory tests included consolidation tests and friction coefficient
measurements (Figures 1 and 2 ) . The basis of the consolidation study was that
used by Wood (1971) and Daynard et al. (197*», 1978). A weighed quantity of
forage was ensiled in polyethylene bags and placed in PVC cylinders (0 0.2 m,
height 0.6 m) . With steel levers and various steel weights different vertical 2
pressures were exerted on top of the silage, ranging from 2 to 120 kN/m .
The volume was measured at 1, 3, 10 and 30 days after filling. The volume was
also measured at the time the seepage flow started.
Consolidation tests were performed on grass in various stages of maturity and
on chopped and unchopped material. The moisture content ranged between 30 and
65% (wet basi s ) .
On whole-plant corn silage consolidation tests were made with moisture content
ranging between 75 and 65%. To measure friction coefficients between forage
and different wall surfaces small cylinders (0 0.1 m, height 0.3 m) were filled
at the same time and with the same material as used in the consolidation tests.
The samples were prepared at two pressure levels and measurements were made
after time intervals ranging from 1 to 30 days. We also measured the friction
coefficient of forage on a polyethylene sheet moving over a PVC surface,
similar to the conditions in the consolidation cylinder. The average vertical
pressure during the consolidation tests was computed taking into account the
weight of each sample and the estimated frictional forces on the cylinder wall.
The ratio of lateral to vertical pressure (k = -) was assumed to be 0.5 for
grass and 0.33 for corn.
The friction coefficient in the cylinders was estimated at 0.29 based upon the
friction tests.
RESULTS
The relationship between pressure, time, and dry density could be expressed
as: p t = At + B t (log p ) 2
where A = a + a„ log t
B t = a3 + ak log t
p = dry density (kg dm/m ) after t hours ' 2
p • vertical pressure (kN/m ) a., a„, a^, a, = coefficients related to the kind of silage.
Table 1 shows coefficients for chopped and unchopped grass. The chop length
was set at 12 mm. The coefficients a, and a^ for chopped grass are higher
and coefficients a. and a. are lower than those for unchopped material.
This means that dry densities are initially the highest in ensiled chopped
grass, but these differences decrease with time. The stage of maturity,
indicated by the crude fibre content, greatly influences the density.
Coefficients for different fibre contents are given in Table 2. Young and
leafy grass has about 1.5 times the density of mature material. This large
difference is not reduced by time and hardly by pressure.
The moisture content also influences the coefficients. As long as the saturation
point is not reached this influence is very small for unchopped grass. For
chopped grass a. and a, are lower and a_ and a^ are higher at high moisture
content. This means that differences in dry density caused by moisture content
decrease wi th time.
The average coefficients a. to a. of whole-plant corn, determined over a 3 year
period, were 120.5, 1.25, 32.1 and 7-29 respectively. The average moisture
content of these samples was 68.kt and average crude fibre 22.4%.
Generally speaking corn is less compressible than grass.
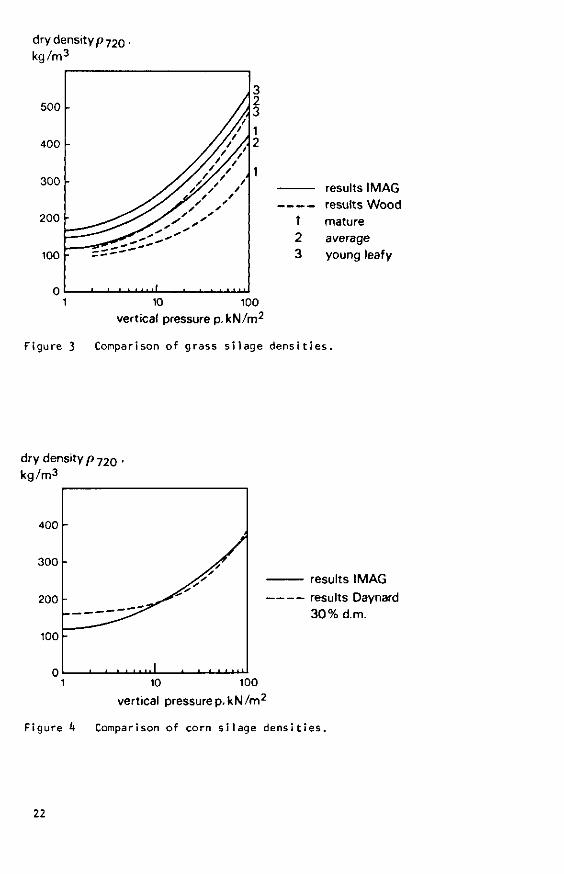
Comparison with results of others
Wood (1971) reported only on consolidation tests on grass, Daynard et al.
(197**. 1978) only on corn. Their density-pressure-time relationships are
given below.
Wood (1971): grass silage
Dry density p. = 23 log (E + FV x 10~3) + C. log T in lb/ft3
2 V = vertical pressure in lb/ft
T = time in hours
E = 1.8
F = 6.5 for young leafy grass (crude protein 20%)
F = 3-7 for average maturity grass (crude protein 12%)
F = 1 . 8 for mature grass (crude protein 8%)
C , - V x 10~3 for 0 < V < 500 d -3 c. = 0.375 + 0.25 v x 10 3 500 < v < 2500 d
c. - 1 2500 < V < 5000 d
Daynard (1978): whole-plant corn silage
Wet density p = -1.86 + 6.20 M x 10~2 - 't.09 M2 x 10 - 3-93 T 2 x 10"5 +
3.92 P x 10 - 3.h7 P2 x 10"7 + h.3k MT x 10"5 +
8.60 MP x 10"6 + 1.81 TP x 10"6
3 p ^ in g/cm wet 3
M = moisture content in % 2
P = mean vertical pressure in gf/cm
T = time in days.
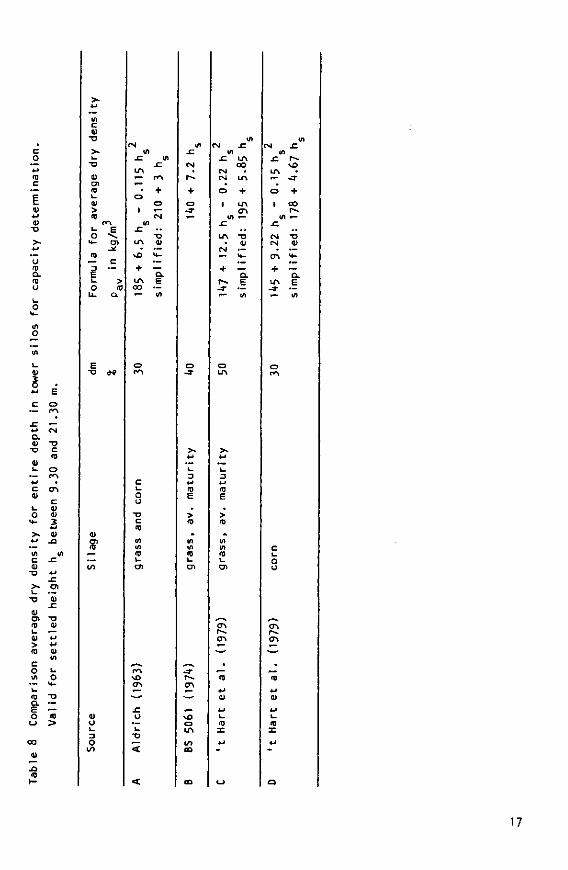
To determine standard silo capacities we used the densities after 30 days,
given below. 2 3
Dry density p = A + B (log p) in kg/m
t = time in hours 2
p = v e r t i c a l p ressure in kN/m
grass s i l a g e : A _ . = 150.8 , B . . = 85.3 f o r average m a t u r i t y (crude f i b r e 22-28%)
A720 = 1 (>9-7> B 720 = 90 .6 f o r young l ea f y grass (crude f i b r e <22%)
A = I I 7 . O , B7 2 Q = 76.5 f o r mature grass (crude f i b r e >28%)
corn s i l a g e : A ™ = 120.0 , B . . = 61.0
F igures 3 and A show the comparison o f our r e s u l t s w i t h those o f Wood and
Daynard r e s p e c t i v e l y . We found b e t t e r c o m p r e s s i b i l i t y f o r grass under our
c i rcumstances than Wood.
For corn w i t h 30% dm our r e s u l t s and Daynard's agreed c l o s e l y .
F r i c t i o n c o e f f i c i e n t s
The most important parameter for the friction coefficient was the roughness
of the wall material. The friction coefficient for forage on a rough concrete
surface was about kQ% higher than on a steel surface. The friction coefficient
for grass on a steel surface after about one week at a pressure of 65 kN/m 2
was 0.5. When the pressure was reduced to 20 kN/m the friction coefficient
was about 20? higher.The friction coefficient decreased with time. After h
weeks it was 15% lower than after one week. The friction coefficients for corn
were about 10% higher than for grass.
The friction coefficient for forage on a polyethylene sheet moving over a PVC
surface was 0.29 and was not significantly influenced by time and pressure.
S e e p a g e
There is a maximum theoretical density for silage, corresponding to zero
porosity (no entrapped gas). Effective saturation occurs in silage at a certain
remaining gasvolume. At this effective saturation the fluid pressure starts
to rise and the rate of increase of the dry density is controlled by the rate
of effluent drainage.
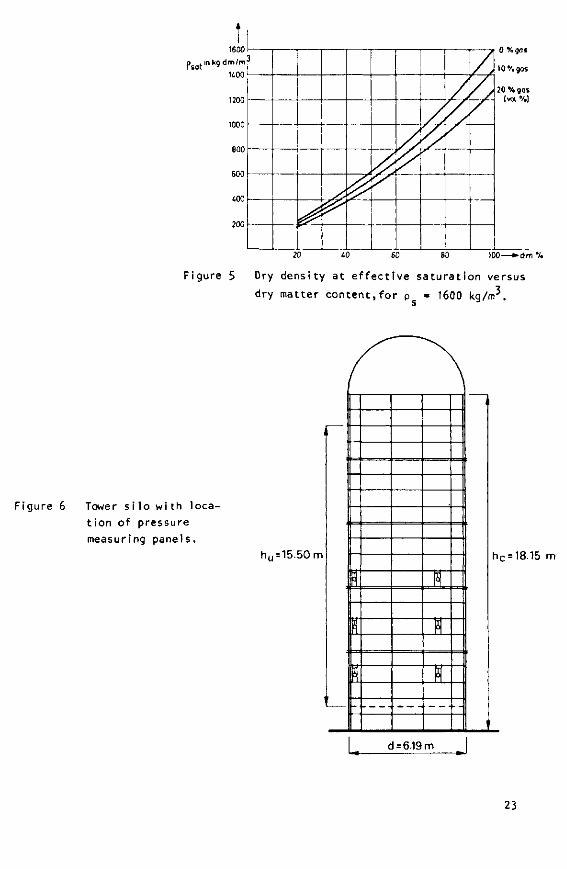
The dry density at effective saturation can be expressed as:
dm % ^ " TÖÖ^'ps , pw . , . 3 psat - ÏÖT X din d^T~ kQ dm/m
pw x TÖF + ps x {1 ' ïör}
dm % = dry matter content (% wet basis)
p - density of completely dry matter at zero porosity in kg/m s 3
p = density of water, can be assumed as 1000 kg/m n = remaining gas volume, in % at effective saturation.
The weight of the gas is neglected.
This formula is derived from a formula given by Berge et al. (197**).
Literature values of p vary between 1500 and 1700 kg/m (Berge et al. 197^,
and Holdren et al. 197^).
Figure 5 gives p as a function of dm % and different remaining gas volumes S3 t
for p - 1600 kg/m3.
For n » 10% remaining gas and moisture content M - 100-dm %, the wet
saturation density can be given as
max p ,. - \kkO (0.006 M + I ) " 1 kg/m3, wet s
Effective saturation was reached at gas volumes generally between 10 and 15%
for qrass and at an averaqe of about 20* for corn. For chopped qrass the cal
culated gas volume tended to be a little lower than for unchopped grass.
M E A S U R I N G C A P A C I T I E S AND S E T T L E D H E I G H T S IN T O W E R S I L O S
Up till now in this continuing study 16 silos were filled with weighed
quantities of forage. Each silo was sampled to determine moisture content and
consolidation characteristics of the forage. Settled depths were registered
until at least 30 days after bringing in the last material.
Settled heights for 30 days or longer after bringing in the last materia),
were calculated using Janssen's (7895) theory as modified by Wood (1971), using
a finite lamina method with varying densities. The ratio (k) of lateral to
vertical pressure was assumed to be 0.5 for grass and 0.33 for corn. The
friction coefficients (y) were taken somewhat lower than the values obtained
in the friction tests in the laboratory. During the pressure measurements in
a tower silo these coefficients appeared to decrease with time and especially
with wetness of material.
The filling with corn of each of the silos lasted between two days and one
week, in accordance with normal farming practice. The filling with grass was
extended over several months, with one exeption. The silo in which the pressure
measurements were made was filled in two days to get better controlled
conditions. Tables 3 and k give a comparison between registered an calculated
settled heights for grass and corn respectively. The formulas used in these
calculations are given in the appendix. For the majority of silos there is
reasonable agreement between actual and calculated settled heights.
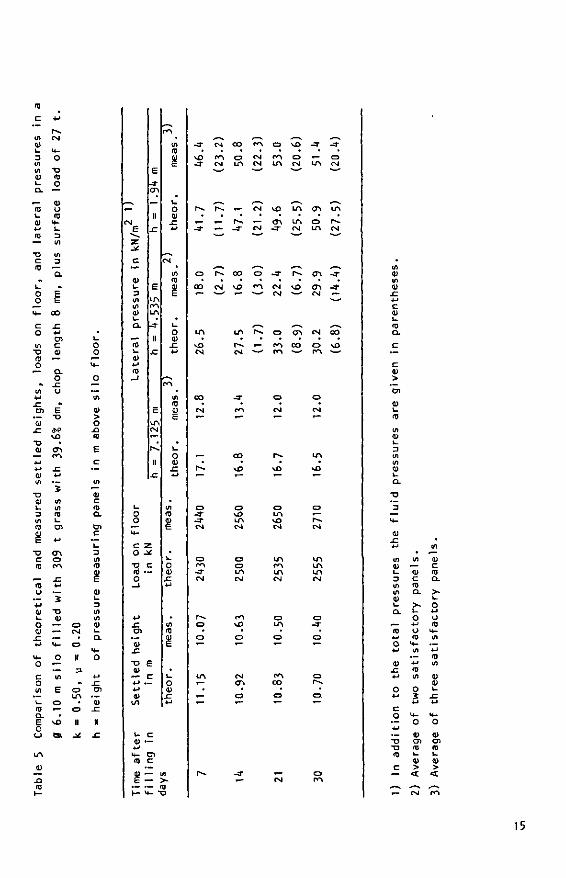
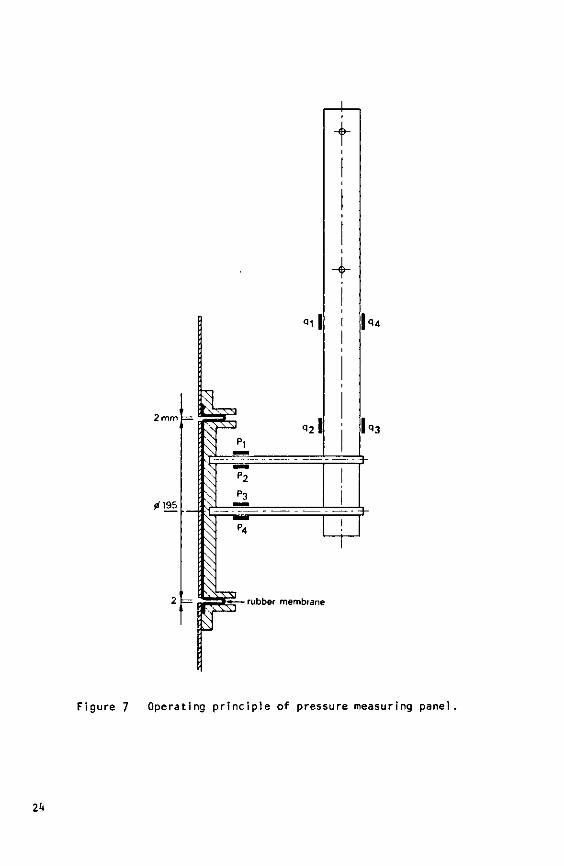
P R E S S U R E M E A S U R E M E N T IN A FULL S C A L E T O W E R S I L O
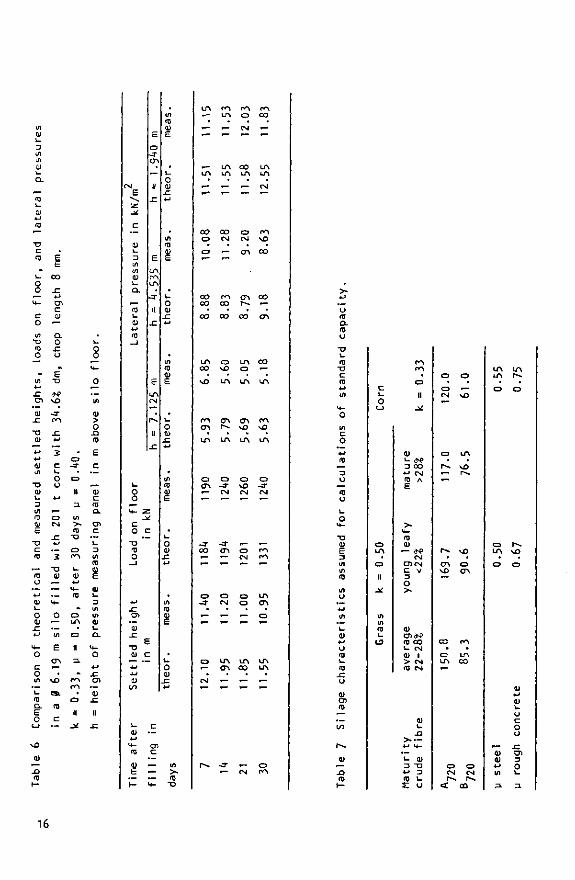
A glass lined steel silo (0 6.19 m, utilized height 15.50 m, see Figure 6 ) ,
was provided with four pressure measuring panels on each of three different
levels. The lateral pressure and the vertical friction could be measured,
as well as the fluid pressures when the saturation density was exceeded. In
Table 5 the fluid pressures are given in parentheses.
These panels were of the type developed by Hierlein (1977). Changes had to be
made to:
a seal the gap between the measuring part and the surrounding silo wall
b control the horizontal displacement of the panels under load to keep the
edge of the measuring part even with the silo wall.
The operating principle of these panels is indicated in Figure 7. The lateral
pressure on the silo wall can be determined by the strain gages q while
the strain gages p serve to measure wall friction.
The silo was provided with a second bottom on four load cells to register
the total load on the floor. This made it possible to calculate the total
frictional force on the wall. The silage effluent which drained through a
narrow gap between the silo wall and the second bottom was led to a sump
and measured.
The panels didn't function optimally during the first filling with grass and
needed some improvements. As a result the second filling, with corn, yielded
a greater number of satisfactory data. The results of the pressure measurements
are given in Tables 6 and 7- The measurements indicated that the techniques
used for determining silage properties were satisfactory, and that the
theoretical model for calculating settled depths and pressures predicted the
real behaviour of silage in the tower silo adequately.
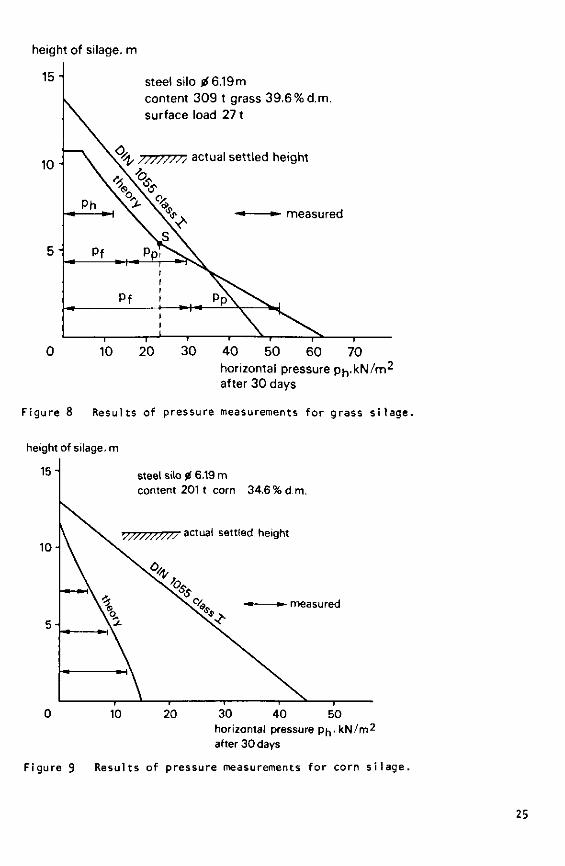
Figures 8 and 9 show calculated and measured horizontal pressures after 30
days and a comparison with the values in the German Standard DIN 1055, where
Ph - Pf + Pp
p, = total horizontal pressure
p f - fibre pressure
p » pore pressure
Pressures for corn were also calculated for k = 0.5, starting with the
calculation of the silage characteristics from the consolidation tests. The
results are not given. The agreement between measurements and calculations,
especially for the loads on the floor, was not as good as for k » 0.33.
STANDARD SILO CAPACITIES
Capacity charts with directives for Dutch circumstances were calculated based
upon the results obtained until Spring 1977- The following heights are
distinguished in the formulas:
h = cylindrical wall height in m;
h = maximum filling height in m before settlement = h - 1.50 m, U 3 3 c
1.50 m is the height of the combined distributor-unloader or a correction
for the cone when another distributor is used;
h • settled height (for grass after several refillings) = 0.90 h in m.
The silage characteristics used in the calculations are related to the densities
after 30 days (see Table 7 ) . For a steel tower silo 0 7 m filled with grass
of average maturity (crude fibre 22-28%) and 50% dm the average dry density
for the practical range of h between 9.30 and 21.30 m is: p - 11»7 + 12.5 h - 0.22 h 2 kg/m3, av s s a
For corn with 30% dm (wetter material should be avoided, especially in high
si los)
p - Il»5 + 9-22 h - 0.15 h 2
av s s
Corrections to be made on p av
f o r 1 m l a r g e r D than 7 m + 1 0 kg/m J + 5 kg/m •5 •>
f o r 1 m sma l l e r D than 7 m - 10 kg/m - 5 kg/m
f o r 10% h ighe r dm-content
f o r 10% lower dm-content
f o r 5% h ighe r dm-content - 15 kg/m
f o r rough concre te s i l o w a l l - 5% - U%
f o r young and l ea fy grass
f o r mature grass
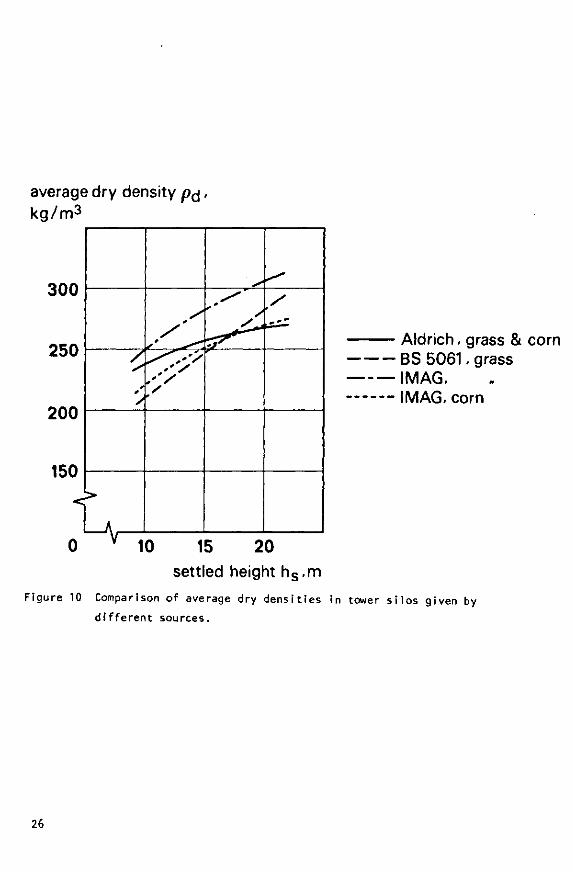
In Table 9 and F igure 10 our d i r e c t i v e s a re compared w i t h those o f ASAE D 252
( A l d r i c h ) and B r i t i s h Standard BS 5061.
+
-
-
+
-
+
-
10 kg/m3
10 kg/m3
20 kg/m3
30 kg/m3
5%
13%
23%
C O N C L U D I N G R E M A R K S
It has been shown that capacities of tower silos and pressures exerted on the
silo structure by the silage can be calculated with the results of laboratory
consolidation tests, and a simple finite lamina method based on Janssen's
theory with density varying with vertical pressure. The calculations give
reasonable agreement with registered settled heights and measured loads on
silo wa11 and floor.
The instrumented silo was filled again in 1979 > first with grass and later
with corn. The results are not yet available.
The final measurements will be made in 1980 with grass, starting in the
spring with the first cut and adding material mowed later on till about
September, in the same way as grass silos are filled in practice.
R E F E R E N C E S
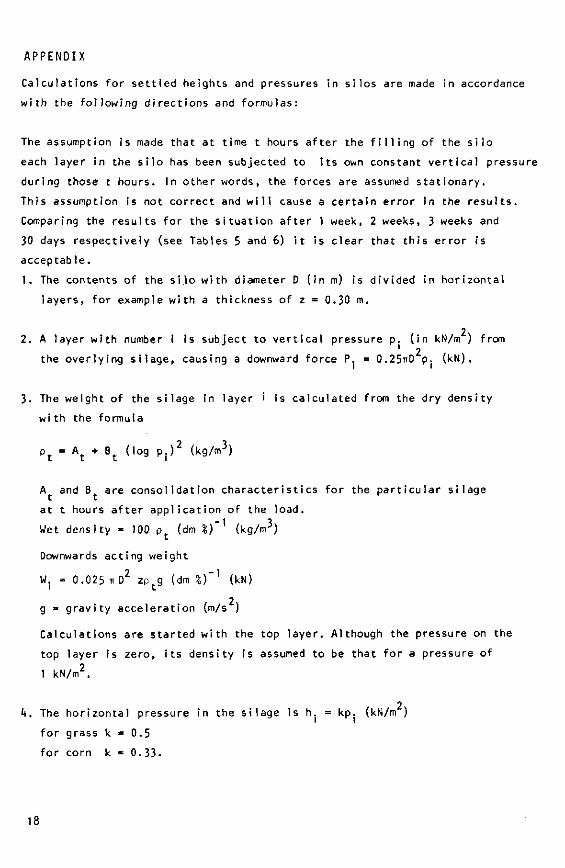
Aldrich, R.A. (1963). Tower silos: Unit weight of silage and silo capacities.
Agricultural Engineers Yearbook, ASAE D 252.
Berge, E. and Aarvold, 0 (1974). Scientific Reports of the Agricultural
University of Norway 53"1, Some physical properties of grass silage.
BS 5061 (197^)
Specification for cylindrical forage tower silos and recommendations for
their use, British Standards Institution, London.
Canadian Farm Building Code (1975). Associate Committee on the National
Building Code, National Research Council of Canada, NRCC No. 13992, Ottawa,
Ontario.
Daynard, T.B. and Arnold, R.L. (1974). Paper presented at International Silage
Research Conference, Toronto (Nat. Silo A s s . ) .
Daynard, T.B., Arnold, R.L. and Bellman, H.E. (1978). Canadian Agricultural
Engineering, 20, 45-52.
DIN 1055, Blatt 6 (1964), Deutsche Normen, Beuth-Vertrieb GmbH, Berlin.
Hierlein, J. (1977). Hottinger Mess technische Briefe, 13, 17_ 21.
Holdren, R.D., Harris, W.L. and Burkhardt, G.J. (1972). Transactions of the
ASAE, 1044-1048.
10
Janssen, H.A. (1895). Zeitschrift des Vereines Deutscher Ingenieure, 39,
1045-1049.
National Silo Association (1971*). Design standards for concrete stave silos,
Waterloo, Iowa.
Wood, J.G.M. (1971). In Proceedings Int. Silage and Res. Conf. National Silo
Ass., Cedar Falls, Iowa, 296-322.
11
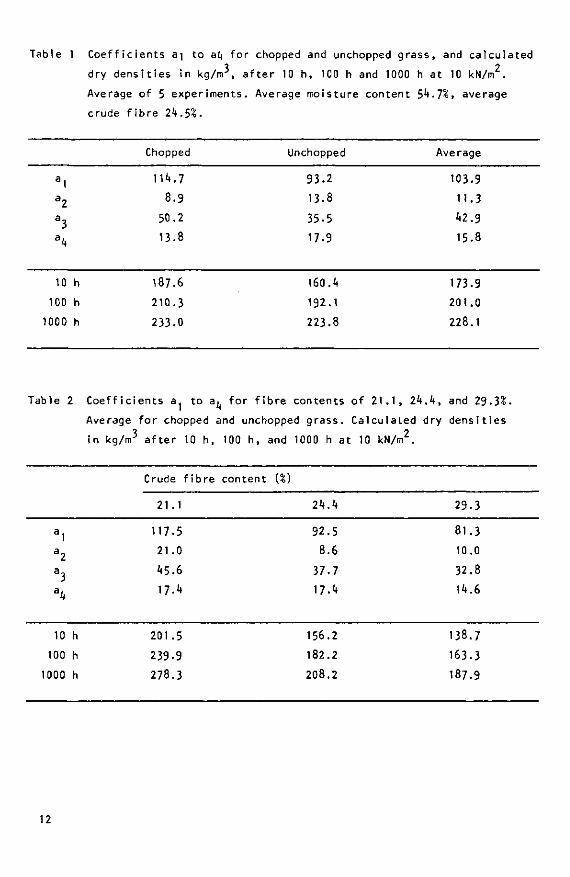
Table 1 Coefficients ai to ai) for chopped and unchopped grass, and calculated •3 2
dry densities in kg/m , after 10 h, 100 h and 1000 h at 10 kN/m . Average of 5 experiments. Average moisture content 5k.7%> average crude fibre 2k.5%.
Chopped Unchopped Average
93.2 103.9
13.8 11.3
35.5 42.9
17.9 15.8
a1 a2 a3 ak
10 h
100 h
1000 h
114.7
8.9
50.2
13.8
187.6
210.3
233.0
160.4 173.9
192.1 201.0
223.8 228.1
Table 2 Coefficients a to a. for fibre contents of 21.1, 2*1.4, and 29.3%.
Average for chopped and unchopped grass. Calculated dry densities •̂ 2
in kg/rrT after 10 h, 100 h, and 1000 h at 10 kN/m .
Crude fibre content {%)
21.1 24.4 29.3
92.5 81.3
8.6 10.0
37.7 32.8
17.k 14.6
156.2 138.7
182.2 163.3
208.2 187.9
a1 a2 a3 ak
10 h
100 h
1000 h
II7.5
21.0
45.6
M.k
201.5
239.9
278-3
12
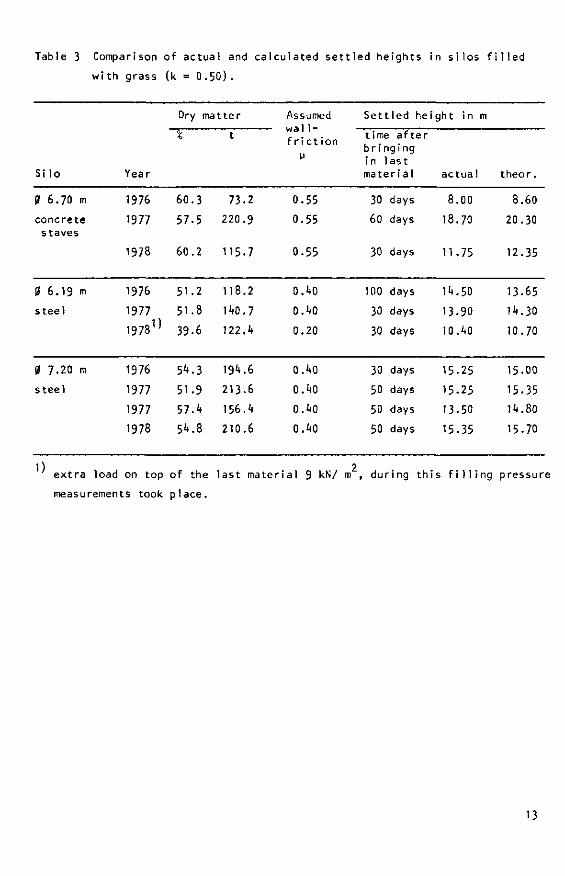
Table 3 Comparison of actual and calculated settled heights in silos filled
with grass (k = 0.50) .
S i l o
9 6.70 m
concrete staves
0 6.19 m
s t ee l
0 7.20 m
s t e e l
Year
1976
1977
1978
1976
1977
1978°
1976
1977
1977
1978
Dry mat ter
%
60.3
57.5
60.2
51.2
51.8
39-6
54.3
51.9
57.4
54.8
t
73.2
220.9
115.7
118.2
T(0.7
122.1»
194.6
213.6
156.4
210.6
Assumed • w a l l -
f r i c t i o n
V
0.55
0.55
0.55
0.1*0
0.40
0.20
0.40
0.40
0.40
0.40
S e t t l e d hei
t ime a f t e r b r i ngi ng in 1 l as t ma te r i a l
30
60
30
100
30
30
30
50
50
50
days
days
days
days
days
days
days
days
days
days
ght in m
ac tua l
8.00
18.70
11.75
14.50
13.90
10.40
15.25
15.25
13.50
15-35
t h e o r .
8.60
20.30
12.35
13.65
14.30
10.70
15.00
15-35
14.80
15-70
1) 2 extra load on top of the last material 9 kN/ m , during this filling pressure measurements took place.
Table 4 Comparison of actual and calculated settled heights in silos filled
with corn (k = 0.33) .
Dry matter Assumed Settled height in m
1 1 wa"" friction
time after bringing in last .
Silo Year material actual theor. '
0.65 30 days
0.65-0.55 30 days
1975 35.2 209 0.65 10 days
0 6.70 m
concrete staves
1973
1974
32.1
26.3
190
183
20.15
19.60
21.90
20.70
21.40 (18.60)
23-90
steel
0 8.03 m 1976 32.0 141 0.40 30 days 10.15 11.70
0 8.00 m 1977 28.3 192 0.40-0.25 30 days 14.10 15-55 (14.20)
0 6 . 1 9 m 19782 ' 34.6 69.5 0.40 30 days 10.95 11-55
1) the parentheses i n d i c a t e t h a t the content o f the s i l o was p a r t l y s a t u r a t e d .
Two f i g u r e s g i ve s e t t l e d he igh ts f o r undrained and 100% d r a i n e d , r e s p e c t i v e l y .
2) du r ing t h i s f i l l i n g pressure measurements were made.
14
CM
in <U i_
o.
ra i_
(!) + j
ra
X J
ra o — <u o ra M-i_ 3
O
14-
c o in
• o ID
O t —
« 10 4-1 J~ [71
•— Hl
.r X J
<D —
co r 4-i O l
!_ <U — n o sz o
* t-T)
fn> \0 • en
CA
XI 01
E «
-o c ra
— 2
o. E O
0> > O
ra E
c
CD C ra o.
II
3-
Ol
II
O 0
r. 0
x> ra 0
z ^ c •—
ra £
i -
0 0) x:
sz oi
ai .c XJ
i/ï
- 3 "
SO
CM OO CA
LA CM I A O »— CM LA
r^ t— N v u LA O l LA
-3- — -3" CM -3" CM LA CM
V0 CA CM . - — - CM
CA -3-CM •—
vu CM
m N 00 r-~ i— CM ~-»
CO O VO • ^ CA •—'
oo LA
vO
O O L A CM
L A C A L A CM
PA CO
CO
ra CL
01 L. 3 l/l l/l 01 u C L
<D
SI
l_ 3 l/l l/l (1) 1_
n
ra 4-1
O 4-»
<D 4-»
O 4-1
01
c ra o.
>-L.
o 4-J O
ra 4 -l/l
•— 4-1
ra m 0 S
ra C L
>-\-0 4-> O
ra 14-l/l
.— 4-1
ra i/i
i .
j =
.— T 5 X I
ra r —
m O l
ra L.
<u > <
<u O l
ra L. 01
> < — CM C A
15
ra
o x
- E (A x>
X I X
« 3
x> 0>
m o — • M
0>
o
T3 <U
r —
r —
.— u-0
L. OJ 4-t
W-nj
O
o> c ra CL
M-
o C O u> •— l_
ra a. E O
O
\ D
<u X I <D
E
<Ti
.— • \ 0 tSk
ra c "~
tl
3 .
«• m m • o
II
.*
u-o +J x en •— O) X
II
X
VI
ra <o E
un oo
« \ o
o vD
• LT\
un O
• Ln
oo « — • un
4-
ra 0) E — H
en c
_ — .— u-
m
>* fD T3
un m •— un
— un oo \s\ u\ u\
(NI (M \D
— t n oo
en oo t-~- —
0 0 0 0 OO 0">
en
un un
en
-3- — — CM
m vu
j - -a- — — oo en o en »~ •— CM rn
.— .— .— o
u. O <u
-C
CD i —
• CM
m <r» r—
LA OO
*-
t n LA
• '—
ra XI c
X I <u E
1>
Xi
II
u- d* 3 0O
ro ai
o >-
0) O l d *
ra i _
<u > (0
OO CM 1
CM CM
(NI \0
o CT»
en
V u
X I
>- — 4-1 M -
u o> 3 X I 4-> 13
m u. T. O
O c CM C
r - p < 00
en 3 O
16
c • o
<û Ol ra O) > ra
E i_ O
ui .c in LTI — r«™>
""• +
i >— CM
m - c
•o un <y
+ — Q.
u\ e oo —
E T 3
CU CT1
ra
T3
5
+ O - 3 "
CM CM
O
1
in
LA oo I A
+
vO
— -3-
O + I CO
1— tn •—
+ — o.
f » E -a- — *— tn
ra u O)
en en
+ LA
Q. E
o
17
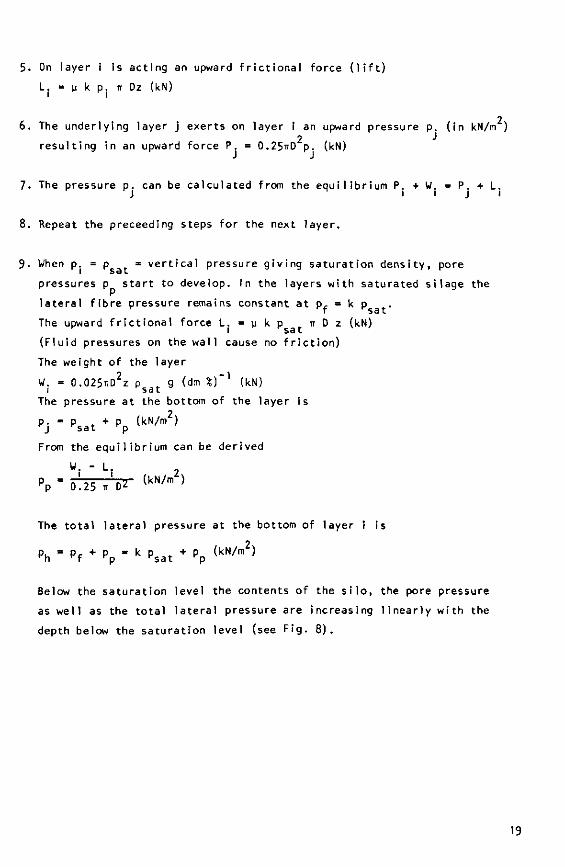
APPENDIX
Calculations for settled heights and pressures in silos are made in accordance
with the following directions and formulas:
The assumption is made that at time t hours after the filling of the silo
each layer in the silo has been subjected to its own constant vertical pressure
during those t hours. In other words, the forces are assumed stationary.
This assumption is not correct and will cause a certain error in the results.
Comparing the results for the situation after 1 week, 2 weeks, 3 weeks and
30 days respectively (see Tables 5 and 6) it is clear that this error is
acceptable.
1. The contents of the silo with diameter D (in m) is divided in horizontal
layers, for example with a thickness of z » 0.30 m.
2. A layer with number i is subject to vertical pressure p. (in kN/m ) from 1 2
the overlying silage, causing a downward force P. = 0.25TTD p. (kN) .
3. The weight of the silage in layer i is calculated from the dry density
wi th the formula
Pt = At + Bt (log p . ) 2 (kg/m3)
A and B are consolidation characteristics for the particular silage
at t hours after application of the load.
Wet density - 100 p (dm % ) _ 1 (kg/m3)
Downwards acting weight
W. = 0.025 IT D2 zp g (dm %)~] (kN)
2 g = gravity acceleration (m/s )
Calculations are started with the top layer. Although the pressure on the
top layer is zero, its density is assumed to be that for a pressure of
1 kN/m2.
2 't. The horizontal pressure in the silage is h. = kp. (kN/m )
for grass k = 0.5
for corn k = 0.33.
18
5. On l ayer i i s a c t i n g an upward f r i c t i o n a l f o r ce ( l i f t )
L. = u k p. it Dz (kN)
2 6 . The under l y ing layer j e xe r t s on l aye r i an upward pressure p. ( i n kN/m )
2 •* r e s u l t i n g in an upward f o r ce P. = 0.25TTD p. (kN)
7. The pressure p. can be c a l c u l a t e d from the e q u i l i b r i u m P. + W. = P. + L. J « i J i
8. Repeat the preceeding steps for the next layer.
9. When p. = p = vertical pressure giving saturation density, pore
pressures p start to develop. In the layers with saturated silage the
lateral fibre pressure remains constant at p, = k p r rf Ksat
The upward frictional force I. = y k p ^ n D z (kN) r i rsat
(Fluid pressures on the wall cause no friction)
The weight of the layer
W. = 0 . 0 2 5 T I D 2 Z p s a t g (dm %)~] (kN)
The pressure at the bottom of the layer is
P j = Psat + Pp ( k N / m 2 )
From the equilibrium can be derived
W. - L. 2
pP
= 0I25 * ' D * (kN/m }
The total lateral pressure at the bottom of layer i is
2 P u = P r + P = k p + p (kN/m ) Kh K f Kp K sa t r p
Below the saturation level the contents of the silo, the pore pressure
as well as the total lateral pressure are increasing linearly with the
depth below the saturation level (see Fig. 8 ) .
har_d_p.yjL_cy'!nder 0 u - Q 2 ? \
. i _
c o n c r e t e b l o c k s
F igure 1 Conso l i da t i on o f s i l a g e sample i n c y l i n d e r .
20
F R O N T V I E W S I DE V I E W
Figure 2 Friction measurement equipment.
A « silage sample in cylinder B = concrete blocks C = force transducer D = linear movement 0.006 m/s E - gearbox F = electromotor S * surface of silo building material
21
dry density p 720 • kg /m 3
500
400
300
200
100
n • i
^ ^
I
//> / /'
//'
M / / 'S' /
1 J._1-_L_LJ.XJ-
3 2 3
1 2
1
1 2 3
results IMAG results Wood mature average young leafy
1 10 100 vertical pressure p. kN /m 2
Figure 3 Comparison of grass s i lage densi t ies.
dry density/> 72o kg /m 3
results IMAG
results Daynard 30% dm.
10 100 vertical pressure p. kN /m 2
Figure k Comparison of corn s i lage densi t ies.
22
p . in kg dm /m
UOO
1200
1000
800
600
400
200
3 —
/\ /
— '
0 % gas
10 % gos
20% gas (vol %)
20 i0 » d m ' / .
Figure 5 Dry density at effective saturation versus
dry matter content,for p = 1600 kg/m^.
Figure 6 Tower silo with loca
tion of pressure
measuring panels.
i ,
h
ffzzzn:
'; — — — — 11
h c = 18.15 m
d=6.19m
23
2 mm
(*195
p 2
P3
1 -
< 1 |
q 2
-<>-
N
" 3
•+-
• rubber membrane
Figure 7 Operating principle of pressure measuring panel,
Ik
height of silage, m
1 5 "l steel silo #6.19 m
content 309 t grass 3 9 . 6 % d m .
surface load 271
//////// actual settled height
measured
i r* r 40 50 60 70
horizontal pressure p ^ k N / m 2
after 30 days
F igure 8 Resul ts o f p ressure measurements f o r grass s i l a g e .
height of silage, m
steel silo 0 6,19 m content 201 t corn 34,6% d m .
•////////// actual settled height
-• • - measured
30 40 50 horizontal pressure p n . k N / m 2
after 30 days
F igure 9 Resul ts o f p ressure measurements f o r corn s i l a g e .
25
average dry density p^ k g / m 3
300
250
200
Aldrich. grass & corn BS 5061. grass IMAG.
- IMAG, corn
15 20
settled height h s .m
Figure 10 Comparison of average dry densities in tower silos given by
different sources.
26