Embed Size (px)
Citation preview

Physical principles underlying structure, mechanics and dynamic re-organization
of hyaluronan-rich matrices — from tissues to supramolecular models in
experiment and theory
Dissertation presented to the Department of Biochemistry and Molecular Biology to obtain the degree of Doctor from the
University of Basque Country
Xinyue Chen
2016
Thesis supervisor: Dr. Ralf P. Richter
University tutor: Prof. Felix Goñi Urcelay
(c)2016 XINYUE CHEN


Physical principles underlying structure, mechanics and dynamic re-organization
of hyaluronan-rich matrices — from tissues to supramolecular models in
experiment and theory
Dissertation presented to the Department of Biochemistry and Molecular Biology to obtain the degree of Doctor from the
University of Basque Country
Xinyue Chen
Thesis supervisor: Dr. Ralf P. Richter
University tutor: Prof. Felix Goñi Urcelay
Donostia-San Sebastian 2016


The research work related to this thesis has been performed at:
CIC biomaGUNE
Donostia-San Sebastian,
Spain
Max-Planck-Institute for Intelligent Systems
Stuttgart,
Germany


Success is the ability to go
from one failure to another
with no loss of enthusiasm.
Sir Winston Churchill


Acknowledgement
i
Acknowledgement
This thesis work would not have been accomplished without the generous support
from many people around me. To only some of them it is possible to give particular
mention here.
First and foremost, I would like to express my sincere gratitude to Dr. Ralf Richter,
who served as my supervisor and continuously piloted my professional life in the past
four years. I do greatly appreciate he offered me the opportunity to commence my PhD
in his group with only curiosity and passion but not proper knowledge background. He
brought me to this new scientific field and guided me to achieve every progressive step
in the exploring journey with his extraordinary patience. I am grateful to have his
support on all scientific aspects, throughout research idea exchanges, technical
instructions and guidance of writing. As a brilliant principle investigator, his scientific
criticism, broad and deep knowledge background and perfect organization will be a
benchmark in my future professional career steps. Thank you Ralf, I will always
remember and cherish everything learned from you.
My gratitude also goes to the collaborators, in particular Dr. Oleg Borisov and Prof.
Antonietta Salustri. They are experts in their scientific fields and contributed to this
interdisciplinary project as best as they could. Without their support in theory
development and biological sample preparation, the work in this thesis would not be
completed. It was also a great fun to have fruitful discussions with them. Appreciate a
lot for your kindness.
I would like to thank all my former and current colleagues in the group, for both
valuable scientific interactions and wonderful time outside the lab. Special gratitude
goes to Dr. Natalia Baranova for guidance during my initial days in the lab and all the
rest fantastic communications, Dr. Raphael Zahn for great co-working experience, and
Dr. Leire Diaz for helping me to settle down in Spain and all the translations. Thank
you all for your friendly support in different ways.
My gratitude is extended to many other people in CIC biomaGUNE, throughout
other research groups, platform managers, administrative and maintenance staff. Their
support on different aspects provided me better working experience. Also thanks the
administrative staff in Max Planck Institute for Intelligent Systems and the University
of Basque Country for helping me on necessary paper work.
Acknowledgement
ii
I am also grateful to all sisters and girls in Residencia ¨El Carmelo¨. Their care and
kindness helped me to quickly settle down in a city that I was completely unfamiliar
with, and encouraged me throughout the past four years. Thank you very much for
providing me the home-feeling in Donosti.
My special gratitude goes to Prof. Udo Seifert. Thanks a lot for your enlightenments
of how to better understand knowledge and structure my career. On top of this, thank
you for all the encouragements when I faced difficulties or confusions.
I would also like to express my particular thankfulness to Prof. Dave Fernig, for
opening the door of science for me, for fruitful and inspiring discussions, for caring and
supporting my progress. Thank you very much for all your contributions to my
professional development.
Last but certainly not the least, I appreciate my parents for their unconditional love.
They always fully supported my decision of how to develop my career, even though
sometimes it was tough for them. Thank you very much for your enormous
contributions in every phase of my life.
Thanks all the people participated in this journey.

Abstract
iii
Abstract
The extracellular matrix (ECM) is the acellular structure of all tissues and essential
for multicellular life. Next to biochemical signals, the physical properties of the ECM
provide important signals to cells. The polysaccharide hyaluronan (HA) is ubiquitous in
the extracellular space of vertebrates and an important structural component of the
ECM. HA is a linear, unbranched and regular polymer of the glycosaminoglycan
(GAG) family, and serves as a scaffold that responds dynamically to molecular stimuli
such as HA-binding proteins, or changes in pH or ionic strength. The objective of this
PhD research project was to elucidate physical principles underlying the structure,
mechanics and dynamic re-organization of HA-rich matrices. To address this question,
we have studied the mechanical properties and morphology of HA-rich matrices at
distinct levels of complexity. On one hand, we have studied the cumulus cell-oocyte
complex (COC) matrix as an example of complex, native HA-rich tissue. On the other
hand, we have studied so-called HA brushes as a well-defined in vitro reconstituted
model of HA-rich matrices.
The HA-rich matrix in the COC forms around oocytes just before ovulation and
plays vital roles in oocyte biology. We have analyzed the micromechanical response of
mouse COC matrix by colloidal probe atomic force microscopy (AFM). We found the
COC matrix to be extremely soft yet elastic, suggesting a stable gel-like network
structure with high porosity and a large mesh size. With a Young’s modulus around 1
Pa, COC matrices are among the softest elastic biological materials known to date. In
addition, the elastic modulus increased progressively with indentation. Furthermore,
using optical microscopy to correlate these mechanical properties with ultra-structure, we
discovered that the COC is surrounded by a thick matrix shell that is essentially devoid
of cumulus cells. We propose that the pronounced non-linear elastic behaviour of COC
matrix is a consequence of structural heterogeneity and serves important functions in
biological processes, such as oocyte transport in the oviduct and sperm penetration.
To understand more comprehensively the response of HA polymers to changes in
their aqueous environment, the thickness and viscoelastic properties of films of end-
grafted HA (also called HA brushes) as a well defined in vitro model of HA-rich
matrices were characterized by reflection interference contrast microscopy (RICM) and
quartz crystal microbalance with dissipation monitoring (QCM-D) as a function of Ca2+

Abstract
iv
concentration and pH. Within the physiological range, the thickness of HA brushes
decreased significantly with Ca2+
concentration but did not change with pH. By
screening a large range of Ca2+
concentrations, we discovered that the effect of Ca2+
on
HA brush thickness is virtually identical to the effect of Na+ at 10-fold higher
concentrations. HA brushes responded only weakly to pH changes above pH 6.0, but
showed a sharp collapse around pH 3. Our results provide insights into how HA
matrices are affected by solution properties, which is relevant in biological systems and
for the design of synthetic tissues.
Finally, using theoretical computations based on self-consistent mean field theory,
we elucidated how the morphology of polymer brushes is influenced by the formation
of physical cross-links between polymers, such as they would occur in the presence of
cross-linking proteins. We find that cross-links promote a denser and more
homogeneous brush morphology. The effect of cross-links is comparable to the effect of
reduced solvent quality when the density of cross-links is low, but unique features
including the retention of solvent even with strong cross-links emerge at high cross-
linking densities.
This work provides novel insights into how the supramolecular structure and thus the
mechanical properties of HA-rich matrices can be dynamically regulated by changes in
microenvironmental conditions. This can be linked to different biological functions of
native HA-rich extracellular matrices but is also of interest for the design of tailored,
synthetic HA-based materials for applications in tissue engineering.

Table of contents
v
Table of contents
RESUMEN ......................................................................................................................................... 1
ABBREVIATIONS ............................................................................................................................... 7
OBJECTIVE AND OUTLINE ................................................................................................................. 9
I INTRODUCTION ...................................................................................................................... 13
I.1 BIOLOGICAL CONTEXT .................................................................................................................... 13
I.1.1 ECM ································································································································ 13
I.1.1.i Definition and functions ········································································································· 13
I.1.1.ii Main components and self-organization ················································································ 13
I.1.1.iii GAGs ······································································································································· 15
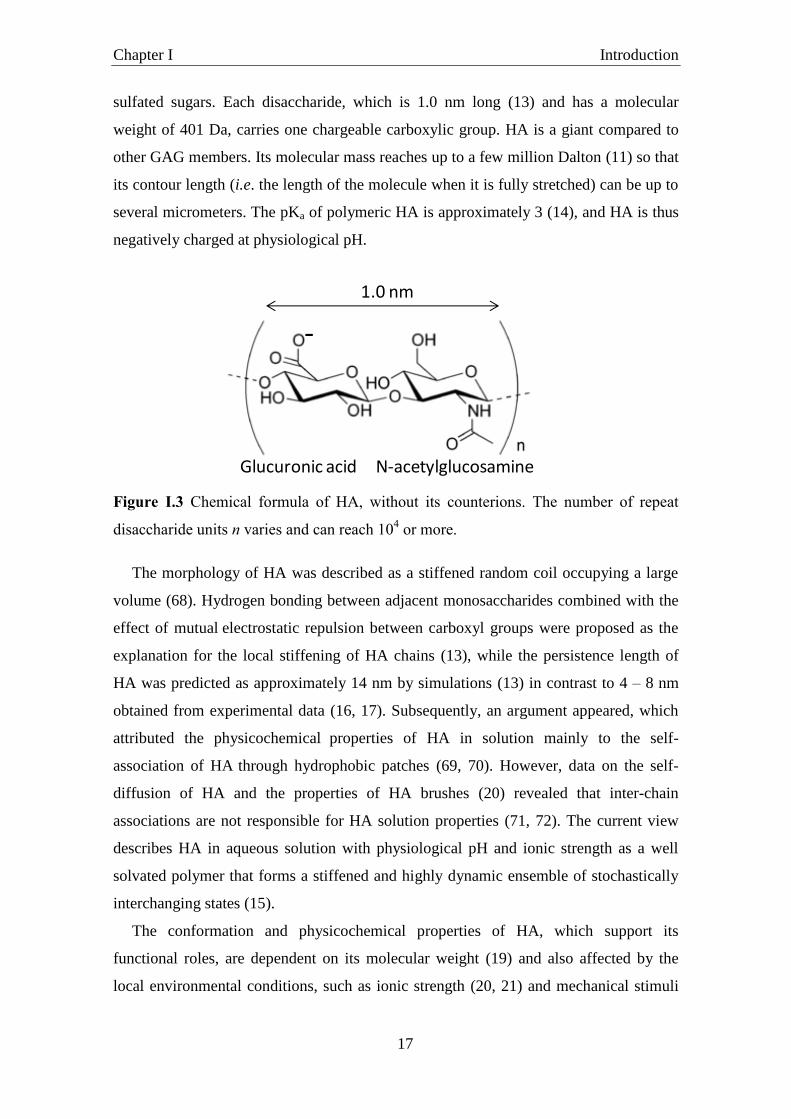
I.1.2 Hyaluronan ····················································································································· 16
I.1.2.i Structure and physicochemical properties ············································································· 16
I.1.2.ii Biosynthesis ···························································································································· 18
I.1.2.iii Roles in biological systems ····································································································· 19
I.1.3 An example of HA-rich ECM — the COC matrix ······························································ 20
I.1.3.i Definition, expansion and function of COC matrix ································································· 20
I.1.3.ii HA in the COC matrix ·············································································································· 22
I.1.4 Importance of structure and mechanical properties of HA-rich ECM ····························· 23
I.2 OBJECTIVE AND CONCEPTUAL APPROACH .......................................................................................... 25
I.3 METHODS ................................................................................................................................... 27
I.3.1 Surface functionalization and in-vitro model systems ···················································· 27
I.3.1.i Immobilization platform ········································································································· 27
I.3.1.ii Surface functionalization for immobilization of HA-rich tissues ············································· 28
I.3.1.iii Well defined in-vitro model of HA-rich matrix (HA brush) ······················································ 28
I.3.2 Biophysical characterization ·························································································· 29
I.3.2.i Mechanical method: AFM ······································································································ 29
I.3.2.ii Acoustical method: QCM-D ···································································································· 32
I.3.2.iii Optical method: RICM ············································································································ 34
I.3.3 Theoretical method: Polymer physics theory ································································· 37
II MICROMECHANICAL PROPERTIES OF NATIVE HA-RICH TISSUE: THE COC MATRIX .................. 43
II.1 INTRODUCTION ....................................................................................................................... 45
II.2 MATERIALS AND METHODS ....................................................................................................... 46
II.2.1 Materials ························································································································ 46
II.2.2 Cloning and purification of biotinylated and soluble CD44 ············································ 47
II.2.3 Preparation of colloidal probe AFM cantilevers ····························································· 48
II.2.4 Preparation of substrates ······························································································· 48

Table of contents
vi
II.2.5 In vivo and in vitro expansion of COCs············································································ 49
II.2.6 Immobilization of COCs ·································································································· 49
II.2.7 Force measurements by colloidal probe atomic force microscopy ································· 50
II.3 RESULTS ................................................................................................................................ 51
II.3.1 Immobilization of the COC matrix and experimental setup ··········································· 51
II.3.2 COC matrix is an elastic material ··················································································· 53
II.3.3 Quantification of COC matrix elasticity ·········································································· 55
II.3.4 Quantification of COC matrix extension ········································································· 57
II.4 DISCUSSION ............................................................................................................................ 60
II.5 CONCLUSION .......................................................................................................................... 65
II.6 SUPPORTING MATERIAL ............................................................................................................ 65
III MECHANICAL AND STRUCTURAL PROPERTIES OF IN-VITRO RECONSTITUTED HA BRUSHES.... 67
III.1 INTRODUCTION ....................................................................................................................... 69
III.2 EXPERIMENTAL SECTION ............................................................................................................ 70
III.2.1 Materials ························································································································ 70
III.2.2 Preparation of substrates ······························································································· 71
III.2.3 Preparation of HA brushes ····························································································· 72
III.2.4 Quartz crystal microbalance with dissipation monitoring·············································· 72
III.2.5 Reflection interference contrast microscopy ·································································· 72
III.3 RESULTS ................................................................................................................................ 73
III.3.1 Assembly of HA brushes ································································································· 73
III.3.2 HA film thickness, response to NaCl, and grafting density ············································· 75
III.3.3 Impact of calcium ions on HA films ················································································ 77
III.3.3.i Morphology ···························································································································· 77
III.3.3.ii Visco-elastic properties ·········································································································· 79
III.3.4 Impact of pH on HA films ································································································ 82
III.3.4.i Morphology ···························································································································· 82
III.3.4.ii Visco-elastic properties ·········································································································· 83
III.4 DISCUSSION ............................................................................................................................ 85
III.5 CONCLUSIONS ......................................................................................................................... 88
III.6 SUPPORTING MATERIAL ............................................................................................................ 88
III.6.1 Refinement of the colloidal probe RICM analysis for coated glass substrates ··············· 88
IV THEORETICALLY PREDICTED MORPHOLOGY OF CROSS-LINKED POLYMER BRUSHES ............... 97
IV.1 INTRODUCTION ....................................................................................................................... 99
IV.2 MATERIALS AND METHODS ..................................................................................................... 101
IV.2.1 FG domains and buffer ································································································· 101
Table of contents
vii
IV.2.2 In situ combination of spectroscopic ellipsometry (SE) and quartz crystal microbalance
with dissipation monitoring (QCM-D)··········································································· 102
IV.2.3 Surface functionalization ······························································································ 103
IV.2.4 FG domain film formation ···························································································· 103
IV.2.5 Quantification of FG domain grafting density and film thickness ································ 103
IV.3 THEORY ............................................................................................................................... 104
IV.3.1 Mean-field theory of cross-linked brushes ··································································· 104
IV.3.2 Salient theoretical predictions for cross-linked brushes ··············································· 108
IV.3.2.i Thickness of cross-linked brushes ························································································· 110
IV.3.2.ii Density profile of cross-linked brushes ················································································· 111
IV.3.2.iii Effects of grafting density on sticker association and brush thickness ································· 112
IV.4 EXPERIMENTS ....................................................................................................................... 112
IV.4.1 Formation of synthetic FG domain brushes ·································································· 112
IV.4.2 Mechanical properties, thickness and concentration of synthetic FG domain brushes 113
IV.5 CORRELATING THEORY WITH EXPERIMENTS ................................................................................. 116
IV.5.1 Estimating the density and strength of cross-links ······················································· 117
IV.5.2 Free energy gains upon cross-linking ··········································································· 119
IV.6 DISCUSSION .......................................................................................................................... 120
IV.6.1 Implications for the morphology of FG domain assemblies and the permeability barrier ·
······································································································································ 121
IV.6.2 Implications for the permselectivity mechanism of the permeability barrier ··············· 122
IV.6.3 Validity of the theory ···································································································· 123
IV.6.4 Future applications of the theory ················································································· 125
IV.7 CONCLUSION ........................................................................................................................ 126
IV.8 SUPPORTING MATERIAL .......................................................................................................... 126
V CONCLUSIONS AND PERSPECTIVES ....................................................................................... 131
V.1 CONCLUSIONS ....................................................................................................................... 131
V.2 PERSPECTIVES ....................................................................................................................... 132
REFERENCES ................................................................................................................................. 135
APPENDIX - CURRICULUM VITAE .................................................................................................. 153

Table of contents
viii

Resumen
1
Resumen
Las células en organismos multicelulares se mantienen unidas por un componente
acelular que las envuelve llamado matriz extracelular (MEC). La MEC está presente en
todos los tejidos y órganos y juega diversas funciones en los sistemas bilógicos (1-3).
Además de ser un andamiaje celular esencial para las células (4), la MEC también
funciona como un sustrato adhesivo para la migración celular (5, 6). También puede
proporcionar señales bioquímicas interpretadas por receptores de la superficie celular
(7), e iniciar, así, una cascada de señales a través de la mediación de múltiples
comportamientos celulares (8).
La MEC está compuesta por una variedad de proteínas y polisacáridos que son
secretados de forma local por las células (1, 2). Los tipos y cantidades relativas de las
macromoléculas de la matriz, y la manera en la que están organizadas en la MEC, varía
entre los distintos tejidos, y de esta manera, la MEC se adapta a las necesidades
funcionales específicas de cada tejido. La MEC madura sufre continuas modificaciones
en respuesta a estimulos del entorno (9, 10). Es importante regular de forma precisa la
estructura dinámica de la MEC para diversos procesos fisiológicos.
El ácido hialurónico (HA) es uno de los principales componentes y ubicuo en el
espacio extracelular de los vertebrados. Es un polisacárido linear, no ramificado
compuesto por unidades de disacáridos idénticos que contienen ácido glucurónico y N-
acetilglucosamina, unidos a través de enlaces glicosídicos β-1,4 y β-1,3 (11, 12). Cada
disacárido, que tiene una longitud de 1.0 nm (13) y tiene un peso molecular de 400 Da,
tiene un grupo carboxílico que se puede cargar. La pKa del HA polimérico es
aproximadamente 3 (14), y HA tiene, en consecuencia, carga negativa en condiciones
de pH fisiológico. La morfología de un polímero libre de HA en solución acuosa se
puede describir como una madeja aleatoria endurecida, es decir, un ensamblaje

Resumen
2
altamente dinámico de estados intercambiables estocásticamente (15), donde la longitud
persistente del HA se determinó en estar entre 4 y 14 nm (13, 16, 17).
Como miembro de la familia de los glicosaminoglicanos (GAG), el HA se diferencia
de otros GAGs en varios aspectos. A diferencia de otros GAGs, el HA no contiene
azúcares sulfatados. También, es un gigante comparado con otros GAGs. La masa
molecular del HA alcanza a menudo los millones de Dalton (11) de manera que la
longitud de contorno puede ser de hasta varios micrómetros. Mientras que el resto de
GAGs se sintetizan dentro de la célula, en el aparato de Golgi, y se liberan por
exocitosis, el HA es sintetizado por sintasas de HA (HASs) que residen en la membrana
plasmática (18).
La conformación y las propiedades fisicoquímicas del HA, que sostiene sus roles
funcionales, dependen de su peso molecular (19) y también se ven afectadas por las
condiciones ambientales locales, como la fuerza iónica (20, 21) y los estímulos
mecánicos (22), además de la interacción con otros componentes de la MEC, incluídos
los receptores de la superficie celular (23-25) y otros componentes del espacio
intersticial (26-30). HA recién sintetizado puede ser tanto liberado en disolución/la
MEC, como permanecer injertado a la superficie celular a través de sus sintasas (18) y/o
si no permanecer fijado a través de diversos receptores de la superficie celular (23-25)
para formar lo que se conoce como capa pericelular (PCC) que es crucial para funciones
celulares básicas, como la proliferación y migración (31), y también para regular la
adhesión entre células (32). Como sub-grupo de proteínas HA-ligantes (también
llamadas hialadherinas), proteoglicanos como agrecano y versicano, se pueden
ensamblar dentro de la MEC al estar ligados al HA a través de proteínas de unión (33-
35) formando grandes complejos. Debido a sus particulares propiedades fisicoquímicas
y su fuerte hidratación, éstos complejos ricos en HA pueden actuar como relleno de

Resumen
3
espacio y/o lubricantes (34). El HA también se puede reticular al interactuar con otras
hialadherinas como TSG-6 (26), cuya influencia en el ensamblaje y propiedades de las
matrices ricas en HA ha sido identificada (36). Éstos complejos ricos en HA también se
conocen por ser claves en procesos fisiológicos y patológicos, como desarrollo
embrionario (37, 38), inflamación (36) y desarollo tumoral (39, 40).
Está probado que las propiedades mecánicas de la MEC tienen un gran efecto en las
células a las que rodean. Las células pueden sentir las propiedades mecánicas de la
MEC que las rodea aplicándole fuerzas y midiendo el feedback resultante (41). Se ha
confirmado que ésta capacidad facilita muchos procesos celulares importantes,
incluyendo contracción celular (42), proliferación celular (43), migración (44, 45),
diferenciación (46) y muerte celular (apóptosis) (47), además de patologías como
progresión tumoral (40, 48). En particular, la importancia funcional de las propiedades
mecánicas de la MEC rica en HA se identificó claramente en décadas anteriores en
matrices ricas en HA tanto nativas como sintéticas. Debido a estudios relevantes sobre
cartílagos, se sabe que las matrices ricas en HA son esenciales para resistir la
compresión y que actúan como lubricantes (49, 50). Además, las propiedades mecánicas
bien afinadas de la matriz del cumulus oophorus (COC), una MEC rica en HA que
rodea los oocitos en el folículo ovárico y en su viaje en el oviducto, son críticas para el
transporte del ovocito (51). Entretanto, las propiedades mecánicas bien reguladas de las
matrices reticuladas de HA reconstituídas in vitro demostraron ser importantes para la
adhesión celular y la propagación en aplicaciones de bioingeniería (52).
En contraste a la reconocida importancia funcional, los principios (en particular de
aspecto físico) subyacentes a las características clave y consecuentemente las funciones
de las MEC ricas en HA siguen sin clarificarse. Por lo tanto, el objetivo de esta tésis es
elucidar las principios físicos que subyacen la estructura, mecánica y dinámica de

Resumen
4
reorganización de las matrices ricas en HA, y así llenar el espacio entre las
características moleculares bien conocidas de matrices ricas en HA y las funciones de
las complejas MEC ricas en HA nativas. Con este fin, hemos llevado a cabo un estudio
sistemático que cubre los diferentes niveles de complejidad de la matriz, y usa métodos
experimentales y teóricos.
El estudio comienza con tejido nativo, donde utilizamos la matriz de COC como
ejemplo. Las matriz del COC es una capa extensa que se forma alrededor del ovocito
unas horas antes de la ovulación y juega un papel vital en la biología del ovocito (53).
El HA es el andamiaje principal de la matriz del COC y carece de otras proteínas
estructurales de la matriz (por ejemplo colágeno, fibronectina), y, por lo tanto, esta
matriz es de particular interés en esta tesis. Las propiedades micromecánicas de la
matriz del COC se caracterizaron de forma cuantitativa por microscopía de fuerza
atómica (AFM), y revelamos más información sobre la ultra estructura de la COC por
combinación de AFM y microscopía óptica (ver Chapter II). Las caracterizaciones
micromecánicas indican que la matriz del COC es extremadamente blanda pero elástica,
y mecánicamente heterogénea. Además, se ha encontrado una capa externa gruesa libre
de cumulus que nunca había sido reportada. Tal caracterización revela propiedades
prominentes del tejido nativo, pero no son suficientes para resolver los principios físicos
que subyacen a éstas propiedades debido a la compleja organización de los tejidos
nativos.
Para analizar la auto-organización del HA como el principal componente de la
matriz, hemos estudiado un modelo in vitro simplificado de la matriz. El modelo
elegido son películas de polímeros de HA injertados por un extremo a una superficie
sólida (es decir, cepillos de HA). Las cadenas de HA injertadas por un extremo imitan a
las cadenas de HA fijadas a la superficie celular, tal como ocurriría en células del

Resumen
5
cumulus u otras células que tienen capas pericelulares extensas. En esta tesis,
determinamos las propiedades estructurales (es decir, grosor del cepillo) y mecánicas
(es decir, la viscoelesticidad) de dichos cepillos de HA valiéndonos de microscopía de
contraste de la interferencia de reflexión (RICM) y microbalanza de cristal de cuarzo
con monitorización de la disipación (QCM-D), respectivamente, concentrándonos en el
efecto de la concentración del calcio o del pH (ver Chapter III). Estos estudios han
revelado que las propiedades morfológicas y mecánicas del cepillo son sensibles a la
concentración de calcio y estables con el pH dentro del rango fisiológico. Al cubrir un
amplio rango de concentraciones de Ca2+
, descubrimos que el efecto del Ca2+
en los
cepillos de HA es prácticamente igual al efecto del Na+ en concentraciones mayores por
un factor de 10, y que los cepillos se colapsan con una protonación por debajo de pH
6.0. Esto nos acerca a la resolución de los principios físicos que subyacen a estas
propiedades.
Las características clave de las matrices ricas en HA están básicamente determinadas
por las propiedades de moléculas que las constituyen y sus interacciones, y por lo tanto
es rentable vincular las observaciones de ensamblajes supramoleculares como el cepillo
de HA a características de moléculas individuales. El estudio de la estructura y dinámica
de cadenas de polímeros de HA individuales sigue siendo desafiante en el contexto de
los cepillos de HA y de las matrices del COC. Por lo tanto, accedemos a los principios
clave que vinculan moléculas individuales y ensamblajes supramoleculares a través de
un método alternativo: teoría física de polímeros. En esta tesis, nos concentramos en el
efecto de la reticulación (reversible) física sobre la morfología de cepillos poliméricos,
y analizamos este caso utilizando la teoría de campo medio (ver Chapter IV). La teoría
predice que la compactación y cambios en el perfil de densidad de un cepillo polimérico
debido a la reticulación es equivalente a la reducción en volumen excluído cuando hay

Resumen
6
poca reticulación, mientras que un comportamiento cualitativamente nuevo surge para
cuando aumenta la reticulación. Para probar esta teoría, la contrastamos con datos
experimentales de la barrera del poro nuclear (otro ensamblaje biológico que consiste en
cadenas poliméricas flexibles) de los que disponemos en el laboratorio. La correlación
con los datos experimentales en cepillos regulares de dominios de neo-FG no sólo
provee valores importantes a los que no tenemos acceso experimentalmente, como la
fuerza de interacción de reticulaciones individuales, sino también demuestra la
aplicabilidad de la teoría. De este modo, damos luz a los mecanismos que conectan la
compleja organización y las propiedades fisico-químicas a las propiedades de las
moléculas individuales de los biopolímeros.
En resumen, hemos caracterizado las características estructurales y mecánicas
prominentes de las MEC ricas en HA y de las matrices de HA recosntituídas in vitro en
determinadas condiciones. Teoricamente, las caracteristicas de los ensamblajes
supramoleculares se correlacionan con las caracteristicas individuales de las moleculas.
Los estudios sistematicos en esta tesis revelan el principio fisico de interes, y pueden ser
extendidos con la mejora de las tecnicas/modelos/teoria, asi como ser integrados con el
conocimiento sobre el espacio intracellular o pistas bioquimicas.

Abbreviations
7
Abbreviations
8-Br-cAMP 8-bromoadenosine 3',5'-cyclic monophosphate
AC Alternating current
ADAMTS-1 A disintegrin and metalloproteinase with thrombospondin motifs 1
AFM Atomic force microscopy
Au Gold
BSA Bovine serum albumin
CD44 CD44 antigen
COC Cumulus cell-oocyte complex
COMP Cartilage oligomeric matrix protein
CS Chondroitin sulphate
DS Dermatan sulphate
ECM Extracellular matrix
FG Phenylalanine-glycine
FSH Follicle-stimulating hormone
GAG Glycosaminoglycan
Gal Galactose
GalNAc N-acetylgalactosamine
GlcA Glucuronic acid
GlcNAc N-acetylglucosamine
HA Hyaluronan
HAS Hyaluronan synthase
HC Heavy chain
hCG Human chorionic gonadotropin
HER2 Human epidermal growth factor receptor 2
HS Heparan sulphate
IdoA Iduronic acid
IVF In vitro fertilization
IVM In vitro maturation
IαI Inter-alpha-inhibitor
KS Keratan sulfate
LH Luteinizing hormone
NPC Nuclear pore complex

Abbreviations
8
NTR Nuclear transport receptor
OEG Oligo-ethylene glycol
PCC Pericellular coat
PE Polyelectrolyte
PG Proteoglycan
PI3K Phosphatidylinositol 3-kinase
PMSG Pregnant mares’ serum gonadotropin
PTX3 Pentraxin 3
QCM-D Quartz crystal microbalance with dissipation monitoring
RHAMM Receptor for HA-mediated motility
RICM Reflection interference contrast microscopy
SAM Self-assembled monolayer
SAv Streptavidin
SCFT Self-consistent field theory
SE Spectroscopic ellipsometry
SLB Supported lipid bilayer
SUV Small unilamellar lipid vesicles
TSG-6 Tumor necrosis factor-inducible gene 6 protein
UDP Uridine diphosphate

Objective and outline
9
Objective and outline
Tissues are not made up solely of cells, but also an intricate network of
macromolecules between cells constituting the so-called extracellular matrix (ECM).
The ECM is composed of a variety of proteins and polysaccharides that are secreted
locally by cells (2). It provides not only essential physical scaffolding for cells but also
crucial biochemical and biomechanical cues that are required for tissue morphogenesis,
differentiation and homeostasis (1). The types and relative amounts of matrix
macromolecules and the way they are organized in the ECM vary to a great extent
across different tissues, and in this way, the ECM adapts to the tissue-specific functional
requirements (1, 2).
Hyaluronan (HA) is one of the chief components of the ECM and ubiquitous in the
extracellular space of vertebrates. It is a linear, unbranched polysaccharide composed of
identical disaccharide units. As the simplest member of the glycosaminoglycan (GAG)
family, HA differs from other GAGs in many aspects, such as sugar sulfation degree,
molecular mass and its biosynthesis (18). The uniformity of molecular structure never
blocks HA from playing various biological roles in the ECM. The conformation and
physicochemical properties of HA, which support its functional roles, are dependent on
its molecular weight (19) and also affected by the local environmental conditions, such
as ionic strength (20, 21) and mechanical stimuli (22). HA can also form more complex
supramolecular structures by interactions with other ECM components including cell
surface receptors (23-25) and other components from the inter-cellular space (26-30).
Such HA-rich supramolecular assemblies have been known to play key roles in
physiological and pathological processes, including embryonic development (37, 38),
inflammation (36) and tumour development (39, 40).
In particular, the functional importance of the mechanical properties of HA-rich
assemblies was clearly identified in the last decades on both native and reconstituted
HA-rich matrices. For instance, HA-rich matrices were found to be essential for
resistance to compression and act as lubricant in cartilage (49, 50), as well as involved
in oocyte transport (51) and cellular mechanotransduction (54). The mechanical
properties of artificial HA gels were also shown to be an important regulator for cellular
adhesion and spreading in bioengineering applications (52).

Objective and outline
10
While the functional importance of the physical properties of HA-rich matrices is
well established, the molecular and physical mechanisms that define the physical
properties are less well understood and thus are the main interests in this thesis.
Therefore, the objective of this PhD thesis is to identify the principles, in particular
physical principles that underlie the structure, mechanics and dynamic re-organization
of HA-rich matrices. To address this question, a systematic study of the structural and
mechanical properties of HA-rich matrices was performed, which covered distinct
levels of matrix complexity and used both experiment and theory.
Outline
The biological context and the methodology relevant to this research project are
introduced in Chapter I. On the biological side, this includes a presentation of
extracellular matrices, and hyaluronan as a key component, and in particular their
crucial role from a mechanics point of view. With regard to methodology, relevant
methods for the biofunctionalization of surfaces, and for the biophysical
characterization of soft films and tissues will be covered.
The scientific results of this research project are presented in Chapters II to IV.
These chapters are presented in the format of scientific articles. A detailed description
of the specific biological context and methods used is also covered in each chapter.
An archetypical example of HA-rich ECM is the cumulus cell-oocyte complex
(COC) matrix, and extended coat that forms around oocytes before ovulation and plays
vital roles in oocyte biology (53). Very limited information about the mechanical
properties of COC matrices has been available. Chapter II presents a quantitative
analysis by colloidal probe atomic force microscopy (AFM) combined with optical
microscopy of the micromechanical properties and ultra-structure of COC matrices.
Chapter III presents the physical characterization, by a combination of acousto-
mechanical and optical techniques, of the effect of ions and pH on films of end-grafted
HA polymers. Such ‘HA brushes’ represent a simplified in vitro model of HA-rich
matrices. Because these are well-defined, it becomes possible to elucidate how the
molecular features of HA polymer chains and its confinement define the physico-
chemical properties of HA-rich materials.
The morphology of HA brushes is not only affected by ions and pH, but some HA-
binding proteins are known to physically cross-link HA. We applied self-consistent
mean field theory in an effort to understand the consequences of cross-linking on

Objective and outline
11
polymer brush morphology, and this is described in Chapter IV. The insights gained
are of relevance for polymer brushes in general, and we illustrate this by applying the
theory to analyze well-defined experimental models of another biological material, the
nuclear pore permeability barrier which gates selective macromolecular transport into
the cell nucleus.
Last but not least, Chapter V summarizes the main findings and significance of this
research project, and indicates potential future developments.

Objective and outline
12

Chapter I Introduction
13
I Introduction
I.1 BIOLOGICAL CONTEXT
I.1.1 ECM
I.1.1.i Definition and functions
In multi-cellular organisms, cells are held together by the surrounding acellular
component called the extracellular matrix (ECM). The ECM is present within all tissues
and organs and plays various roles in biological systems (1-3). Apart from being an
essential physical scaffold for the cells (4), the ECM also serves as an adhesive
substrate for cell migration (5, 6). It can also provide biochemical cues interpreted by
cell surface receptors, such as the integrins (7), and thus initiate signalling cascades
mediating multiple cell behaviours (8). These diverse functions are supported by the
complex composition and organization of the ECM.
I.1.1.ii Main components and self-organization
The ECM is composed of a variety of proteins (e.g. structural proteins including
collagen, elastin, fibronectin, laminin and signalling proteins such as chemokines and
growth factors) and polysaccharides of the glycosaminoglycan (GAG) family, which are
secreted locally by cells residing in the matrix and assembled into organized networks
(1, 2). The ECMs of each tissue possess unique compositions, ultrastructure and
physical properties that are first defined at early embryonic stages (1, 9) and markedly
heterogeneous (1). For instance, the main matrix molecule of interest for this thesis,
hyaluronan (HA), exists in both the coating around ovulated oocytes (the cumulus cell-
oocyte complex (COC) matrix) and in cartilage. However, the compositions of these
two types of matrices differ appreciably (as shown in Figure I.1). Consequently, these
matrices are responsible for different biological functions. The precise organization of
the ECM is crucial for maintaining normal biological functions (1, 2).
The ECM is not a static entity. The mature ECM undergoes continuous remodelling
in response to environmental stimuli to control tissue homeostasis (9, 10). The
remodelling of the ECM is mediated either enzymatically or non-enzymatically (8-10),
and is important for various physiological processes (e.g. in response to injury). Mis-
regulation of the dynamic ECM structure may lead to pathologies (55, 56).

Chapter I Introduction
14
Figure I.1 Composition of the ECM in different tissues. (A) Molecular structure of the
expanded COC matrix. HA is attached to cumulus cell surface via receptors (e.g. CD44
and/or Rhamm). The TSG-6/IαI heavy chains (HC)/PTX3 cross-link stabilizes the HA
matrix. Versican interacts with both HA and cell surface proteins and may further
anchor the HA matrix to cumulus cells, or gets cleaved by the protease ADAMTS-1 that
possibly modulates the COC matrix structure during ovulation. Image taken from ref.
(57). (B) Components of cartilage ECM. The matrix also contains HA but HA here is
normally densely coated with aggrecan and link proteins. There are also other important
components, such as collagen (mostly type II collagen), non-collagenous proteins like
fibronectin and cartilage oligomeric matrix protein (COMP), as well as other smaller
A
B

Chapter I Introduction
15
proteoglycans (e.g. biglycan, decorin and fibromodulin). The interaction between highly
negatively charged cartilage proteoglycans and type II collagen fibrils is essential for
the tissue resisting load in vivo. Image taken from ref. (58).
I.1.1.iii GAGs
GAGs are a group of long unbranched polysaccharides ubiquitously present on the
cell surface (glycocalyx) and in the ECM. GAGs are formed by multiple disaccharide
units, where each unit consists of an amino sugar (N-acetylglucosamine (GlcNAc) or N-
acetylgalactosamine (GalNAc)) along with an uronic sugar (iduronic acid (IdoA) or
glucuronic acid (GlcA)) or galactose (Gal) (Figure I.2) (59). Each monosaccharide is
possibly sulfated at different positions (Figure I.2). GAG synthesis is not template
driven (as for proteins or nucleic acids), and GAGs are instead dynamically formed and
modulated by processing enzymes (60), GAGs have high diversity with regards to
molecular mass (chain lengths can range from a few to a few thousand of disaccharide
units), sulfation (different sulfated positions, such as N- and O-sulfations, as well as
varied sulfation degrees along a chain can be found) and saccharide configuration
(epimerizations and varied linkages) (59). According to these diverse structural features,
GAGs can be classified into four main groups, known as chondroitin sulphate (CS)
/dermatan sulphate (DS), heparin/heparan sulphate (HS), keratan sulfate (KS) and
hyaluronan (HA) (Figure I.2) (59).
Complex supramolecular structures formed by interactions of GAGs with other ECM
components are essential for the general architecture and functions of the ECM. GAGs
(except HA) are usually attached covalently to core proteins through their reducing end
and form proteoglycans (PGs) (59, 61-63). These PGs can aggregate into larger
complexes. One typical example is the aggrecan-HA complex in cartilage. Aggrecans
are non-covalently linked to a high molecular weight HA polymer through link proteins
(Figure I.1B) (59, 61). Other complex supramolecular structures arise from binding of
GAGs to structural proteins (64, 65) or from crosslinking of GAGs by ECM proteins
(26, 36), such as the HA network in the COC matrix described in Figure I.1A (57).

Chapter I Introduction
16
Figure I.2 Schematic of saccharide units in the different types of GAGs. Each
saccharide unit is connected by α- or β-glycosidic bonds via position 3 or 4 of the
saccharide. RS (R = 2, 4, 6 or N) represents O-sulfation at different positions (2, 4 or 6)
of the saccharide or N-sulfation. Image modified from ref. (59).
I.1.2 Hyaluronan
In this thesis, the main molecule of interest is HA. As one of the chief components of
the ECM, HA is ubiquitous in the extracellular space of vertebrates and plays a variety
of biological roles. It is exceptional in the GAG family, differing from the other
members in structure, biosynthesis and biological functions.
I.1.2.i Structure and physicochemical properties
HA is often also called as hyaluronic acid, though the molecule is typically used
together with counterions and thus is a salt rather than an acid. It was discovered in
1934 by Karl Meyer (66) yet its structure was only determined almost 20 years later
(67). HA is a linear, unbranched polysaccharide composed of identical disaccharide
units containing glucuronic acid and N-acetylglucosamine, linked together via β-1,4 and
β-1,3 glycosidic bonds (Figure I.3) (11, 12). Unlike other GAGs, HA contains no
N-Acetylglucosamine (GlcNAc) N-Acetylgalactosamine (GalNAc)
Iduronic acid (IdoA) Glucuronic acid (GlcA) Galactose(Gal)
Chapter I Introduction
17
sulfated sugars. Each disaccharide, which is 1.0 nm long (13) and has a molecular
weight of 401 Da, carries one chargeable carboxylic group. HA is a giant compared to
other GAG members. Its molecular mass reaches up to a few million Dalton (11) so that
its contour length (i.e. the length of the molecule when it is fully stretched) can be up to
several micrometers. The pKa of polymeric HA is approximately 3 (14), and HA is thus
negatively charged at physiological pH.
Figure I.3 Chemical formula of HA, without its counterions. The number of repeat
disaccharide units n varies and can reach 104 or more.
The morphology of HA was described as a stiffened random coil occupying a large
volume (68). Hydrogen bonding between adjacent monosaccharides combined with the
effect of mutual electrostatic repulsion between carboxyl groups were proposed as the
explanation for the local stiffening of HA chains (13), while the persistence length of
HA was predicted as approximately 14 nm by simulations (13) in contrast to 4 – 8 nm
obtained from experimental data (16, 17). Subsequently, an argument appeared, which
attributed the physicochemical properties of HA in solution mainly to the self-
association of HA through hydrophobic patches (69, 70). However, data on the self-
diffusion of HA and the properties of HA brushes (20) revealed that inter-chain
associations are not responsible for HA solution properties (71, 72). The current view
describes HA in aqueous solution with physiological pH and ionic strength as a well
solvated polymer that forms a stiffened and highly dynamic ensemble of stochastically
interchanging states (15).
The conformation and physicochemical properties of HA, which support its
functional roles, are dependent on its molecular weight (19) and also affected by the
local environmental conditions, such as ionic strength (20, 21) and mechanical stimuli
Glucuronic acid N-acetylglucosamine
-
1.0 nm

Chapter I Introduction
18
(22), as well as interaction with other ECM components including cell surface receptors
(23-25) and other components from the inter-cellular space (26-30).
I.1.2.ii Biosynthesis
The biosynthesis of HA is exceptional within the GAG family. Whereas all other
GAGs are synthesized inside the cell in the Golgi apparatus and released by exocytosis
(60, 61, 68), HA is synthesized by HA synthases (HASs) (18, 73) that reside in the
plasma membrane (18, 74-76). Sugar units are added from nucleotide precursors to the
chain on the cytoplasmic side of the membrane and simultaneously the chain is extruded
through the membrane into the extracellular space (or to make the cell capsule in the
case of bacteria) (11, 18). This mechanism allows unconstrained polymer growth, and
thus accomplishes the exceptionally large size of HA, whereas confinement of synthesis
within a Golgi or post-Golgi compartment could limit the overall amount or length of
the polymers formed (18). On the other hand, it is known that different enzymes in HAS
family can produce HA of varying molecular masses (77). How the size of synthesized
HA is controlled is not well understood.
Moreover, the mechanism of HA synthesis was found distinctly different from that
for other GAGs (78). All other members of the GAG family are elongated on core
proteins by transferring an appropriate sugar from a sugar nucleotide onto the non-
reducing terminus of a growing chain (79). In contrast, HA synthesis occurs at the
reducing end of a growing HA chain. The two-site mechanism of HA synthesis was first
proposed by Prehm (see Figure I.4) (78, 80). Two substrates, uridine diphosphate
(UDP)-GlcA and UDP-GlcNAc, bind to two active sites within the enzyme. HA chains
are elongated by alternate addition of their reducing end to the substrates on the other
site with liberation of UDP. This synthesis mechanism is unusual and does not occur
with other systems, such as the eukaryotic HS synthase (81) and the bacterial
polysaccharide synthases (82), even though they utilize the same nucleotide sugar
substrates.

Chapter I Introduction
19
Figure I.4 Schematic of the two-site mechanism of HA synthesis. The reducing end
sugar of the growing HA chain remains covalently bound to a UDP and attaches to one
active site of the enzyme (HAS). The growing UDP-HA chain shuttles from one site to
the other with the substrate during elongation, while its terminal UDP can be replaced
by the substrate and attach a new UDP-sugar. Image taken from ref. (18).
I.1.2.iii Roles in biological systems
HA is predominantly present in the ECM and interacts with a variety of ECM
molecules. Newly synthesized HA can either be released into solution/the ECM, or stay
grafted to the cell surface via its synthases (18) and/or otherwise attached via several
cell surface receptors, such as CD44 (23, 25) and RHAMM (24, 25), to form so-called
pericellular coats (PCCs). HA-rich PCCs are crucial for basic cellular functions, such as
proliferation and migration (31), and also regulate adhesion between cells (32).
HA can form more complex supramolecular structures by interacting with HA-
binding proteins (also called hyaladherins). As a sub-group of hyaladherins,
proteoglycans like aggrecan and versican, can be assembled within the ECM by being
linked to HA via link proteins (33-35) forming large complexes (as shown in Figure I.1).
Due to its particular physicochemical properties and strong hydration, these HA-rich
complexes can act as space filler and/or lubricant. For instance, the complexes formed
by aggrecan and HA in cartilage provide load-bearing function in articular cartilage (34).
HA can be cross-linked by interacting with other hyaladherins such as TSG-6, alone (26)
or in complex with the proteoglycan IαI (27) and the protein PTX3 (83), which has been
identified to influence the HA-rich matrix assembly and properties (36). These HA-rich
complexes are also known to play key roles in physiological and pathological processes,
including embryonic development (37, 38), inflammation (36) and tumour development
(39, 40).

Chapter I Introduction
20
I.1.3 An example of HA-rich ECM — the COC matrix
An example of HA-rich ECM is the cumulus cell-oocyte complex (COC) matrix
(Figure I.5). The COC matrix is devoid of other structural matrix proteins (e.g. collagen,
fibronectin) and because HA is the main scaffold of the COC matrix, this matrix is of
particular interest in this thesis.
Figure I.5 Schematic of the COC matrix and sperm penetration process. Image
modified from ref. (38).
I.1.3.i Definition, expansion and function of COC matrix
Both in the ovarian follicle and after ovulation, the oocyte is surrounded by a distinct
population of somatic cells known as the cumulus cells (53). In response to the
ovulatory luteinizing hormone (LH) surge, the cumulus cells express proteins and HA
that assemble into a unique matrix embedding the cumulus cells and enveloping the
COC matrix
HA strand

Chapter I Introduction
21
oocyte. This process, known as the COC matrix expansion, is dependent on a cascade of
intracellular signals inducing ECM gene expression (53). The main component of the
COC matrix in all examined species is HA (53). Synthesis of HA is a fundamental
process for COC matrix expansion. COC expansion can be induced in vivo after LH
surge or by injection of human chorionic gonadotropin (hCG) to animals primed with
pregnant mares’ serum gonadotropin (PMSG) (Figure I.6) (84, 85). COC expansion can
also be reproduced in vitro by culturing isolated COCs with follicle-stimulating
hormone (FSH) (86). The enzyme that polymerizes HA chains in the COC is
hyaluronan synthase type 2 (HAS2) (87-90). HA chains synthesized and released by
HAS2 have extremely large size, with molecular masses larger than 2 MDa (91).
Figure I.6 HA synthesis during the COC expansion in mouse ovaries in vivo. HA was
stained in red by a biotinylated HA-specific protein probe (92). Each frame presents
individual follicles from ovaries that were isolated at times 0, 5 and 10 h after injection
of an ovulatory dose of hCG. The COC is encircled by a dotted blue line. It is notable
that HA synthetic activity is not exclusively localized to cumulus cells, but also occurs
at the innermost layers of mural granulosa cells (85), as pointed out by black arrows.
Image modified from ref. (38).
The synthesis of COC matrix and cumulus gene expression has been linked to oocyte
quality (85, 93) and developmental capacity, and thus the degree of cumulus expansion
has been used as a criterion for selection of oocytes for in vitro fertilization (IVF) for
many years (94-96). The presence of the COC matrix has been found to reduce
oxidative stress on the oocyte (97), and hence may protect the oocyte during the events
of tissue hyperemia and inflammation that increase oxidative free radicals during

Chapter I Introduction
22
ovulation (53). Animal models with disrupted COC matrix expansion show entrapment
of oocytes in luteinized follicles (98), and thus reveal that the matrix is crucial for
oocyte release. The COC matrix is also known to facilitate the transport of COCs along
the oviduct. Matrix-enclosed COCs are efficiently transported in the oviductal lumen
(99, 100), whereas cumulus-denuded oocytes are not (101, 102). Moreover, fertilization
is also likely dependent on the COC matrix, where sperm has to interact with the matrix
before making contact with the oocyte (Figure I.5) (38, 53). Components of the COC
matrix, such as PTX3 (83), were proposed to possibly act as an active sperm attractant
(103) and contribute to capacitation of sperm (104). The COC matrix may also present a
selective barrier that screens for sperm with high fertilization potential (105), and
accelerates the human sperm acrosome reaction (106, 107).
I.1.3.ii HA in the COC matrix
Visualization of the unperturbed COC matrix ultra-structure is challenging due to the
low degree of order and strong hydration. Therefore, it is not surprising that the HA
matrix ultrastrutures reported in some previous studies were found to be significantly
affected by preparation artifact due to a large amount of shrinkage in the cumulus
material (108). Ultra-structural analysis of the COC matrix based on improved freeze
substitution provides more reliable matrix architecture and suggests that HA strands are
organized in a mesh-like network in the matrix (109). Protease treatment was found to
be able to disrupt the matrix stability, thus demonstrating that proteins are necessary to
organize and retain the HA matrix (110).
The functional role(s) for HA in the COC is still an area of intense research. Some of
the functional properties given by HA in other tissues are also considered to be
important in the HA-rich COC matrix. For instance, the poly-anionic and locally stiff
characteristic of HA promotes the highly hydrated conformation of the COC matrix (53).
This hydrated matrix can act as a space filler and its viscoelastic properties allow the
COC to deform and easily pass through the ruptured follicle wall and the oviduct.
Moreover, by binding to cell surface receptors that are synthesized in parallel with HA
by cumulus cells (89, 93, 111), HA contributes to mediate cell signalling pathways (53).
As an example, binding between HA and CD44 receptor on the surface of tumour cells
has been confirmed to transactivate the HER2 receptor (112), which in turn stimulates
the PI3K-dependent signalling pathway (113, 114) that participates in controlling key
properties and functions of cells such as growth, aging and malignant transformation

Chapter I Introduction
23
(115). Transactivation of the HER2 receptor by binding between HA and CD44 is likely
also active in the COCs (53).
I.1.4 Importance of structure and mechanical properties of HA-
rich ECM
It is now well established that the mechanical properties of ECM have profound
effects on the cells that they surround. Cells can sense the mechanical properties of their
environmental ECM by applying forces and measuring the resulting feedback (41). This
has been confirmed to facilitate many important cellular processes including cellular
contraction (42), cell proliferation (43), migration (44, 45), differentiation (46) and cell
death (apoptosis) (47), in addition to pathologies such as tumour progression (40, 48).
In particular, the functional importance of the mechanical properties of HA-rich ECM
was clearly identified in the last decades on both native and reconstituted HA-rich
matrices. Well known from cartilage, HA-rich matrices are essential for resistance to
compression and act as lubricant (49, 50). Moreover, a stiffened COC matrix was found
to impair oocyte transport (51). It was also confirmed that HA-rich matrices are
involved in cellular mechanotransduction (54). Meanwhile, in-vitro reconstituted HA-
rich matrices have become popular in the last decade in tissue engineering research
(116-118). The mechanical properties of cross-linked HA gels, which can be very well
regulated (119-121), were shown to be an important regulator for cellular adhesion and
spreading in bioengineering applications (52).
While the functional importance of the physical properties of HA-rich matrices is
well established, the molecular and physical mechanisms that define the physical
properties are less well understood. To this end, it is essential to identify principles, in
particular physical principles, that connect molecular and supramolecular structure with
matrix mechanical properties and dynamic re-organization, and this is the main interest
in this thesis.
Previous studies have provided a good quantitative characterization of key features,
such as the average mechanical properties, at tissue or cellular level for some HA-rich
matrices. For instance, studies on brain tissue (122) or bovine lung microvascular
endothelial cells (123) indicated an elastic modulus on the order of 100 Pa in magnitude.
Nevertheless, the composition of HA-rich ECMs varies dramatically between tissues
and even within a given tissue over time (recall Figure I.1), and so will the mechanical
and other physical properties. Measurements of one type of HA rich matrix will thus not

Chapter I Introduction
24
be representative for another HA rich matrix, and there is still a need to quantify the
properties of native HA-rich ECMs. In this regard, the COC matrix is of particular
interest in this thesis.
Moreover, it still remains challenging to understand the physical principles
underlying matrix properties, assembly and reorganization, and thus, the mechanisms of
function of HA-rich ECMs and in particular the role of HA within the matrix. Previous
studies on the native matrices,such as the coat around chondrocyte (124) and the matrix
in murine growth plate cartilage (125), have well presented quantitative information of
the matrix properties at given conditions. However, these studies alone are insufficient
to reveal the principles underlying matrix assembly and properties, because accessible
parameter range is limited and the contributions of individual components within the
matrix are hardly identified.
Studies on simplified artificial models enable key structural features, mechanical
properties and the re-organization of HA-rich matrices to be quantified over a parameter
range that is larger than in native ECMs, and the reduced number of components and
controlled assembly conditions for model matrices also make it easier to reveal the
physical principles underlying matrix assembly and physical properties.
Previous investigations on HA in solution and macroscopic hydrogels reported how
the morphology and mechanical properties of HA-rich matrices can be affected by ions
and pH (17, 21, 126-128), or cross-linking density (117, 118, 129). Although these
studies provide by no means a complete description of the native biological system,
they shed light on the principles underlying the structure, mechanical properties and re-
organization of HA-rich matrices. More biologically relevant studies were previously
performed based on a model composed of HA end-grafted to a solid surface. In these
so-called HA brushes, the confinement of HA to the cell surface is reproduced and the
effect of external cues can be readily quantified. In comparison with pure HA brushes
under standard physiological buffer conditions (130), the environmental NaCl
concentration (20) and introducing other ECM components such as aggrecan (29) were
found to significantly affect brush morphology and mechanical properties. Proteins
existing in the native ECM like TSG-6, alone and in complex with other proteins and
proteoglycans, were also already shown to cross-link the HA brush and change brush
morphology (26-28). HA brushes were used in this thesis work to study how other
soluble cues, in particular divalent calcium ions and pH, influence HA matrix properties.

Chapter I Introduction
25
I.2 OBJECTIVE AND CONCEPTUAL APPROACH
The objective of this thesis was to elucidate physical principles that underlie the
structure, mechanics and dynamic re-organization of HA-rich matrices. To this end, a
systematic study was performed that covered distinct levels of matrix complexity, and
used both experiment and theory. The conceptual approach is schematically illustrated
in Figure I.7.
Figure I.7 Overview of the conceptual approach for and elements of the systematic
study in this thesis.
The study commences with native tissue, where we use the COC matrix as example.
The micromechanical properties of the COC matrix are quantitatively characterized by
atomic force microscopy (AFM), and further information about the COC ultra-structure
are revealed by combining AFM with optical microscopy (see Chapter II). Such a
characterization reveals salient properties of the native tissue, but it is not enough to
resolve the physical principles underlying these properties. This is due to the complex
organization of native tissues. Because the native matrix consists of various molecules
Examples studied in this thesis
COC matrix HA brushFlexible solvated polymer chains &
cross-linkers
Characterization Techniques
• AFM• AFM w/ optical microscope
• QCM-D • RICM
Polymer physics theory
Level of complexity Native tissues
Supromolecularmodel
Molecular constituents and
interactions
HA-rich matrices
Increasing complexity
In creasing control/ extended parameter space
Physical principles underlying structure, mechanics and dynamic re-organization of HA-rich matrices
Chapter I Introduction
26
at unknown concentration and distribution, it is difficult to define how individual
components contribute.
To analyse the self-organization of HA as the major matrix component, we therefore
study simplified in vitro models of matrix. The chosen models are films of HA
polymers end-grafted to a solid surface (i.e. HA brushes). End-grafting mimics HA
chains attached to the cell surface, such as it may occur on cumulus cells or other cells
that have extended pericellular coats. In this thesis, the structural (i.e. brush thickness)
and mechanical (i.e. visco-elastic) properties of such HA brushes are determined by
reflection interference contrast microscopy (RICM) and quartz crystal microbalance
with dissipation monitoring (QCM-D), respectively, with focus on the effect of calcium
ions and pH (see Chapter III). Importantly, a parameter range can be covered that is
not accessible with native matrix. Consequently, we can quantitatively study how
individual parameters contribute to the structure, mechanics and dynamic re-
organization of HA-rich matrices. This brings us a step closer to resolving the physical
principles underlying these properties.
The key features of HA-rich matrices are ultimately determined by the properties of
the constituent molecules and their interactions, and thus it is worthwhile to link the
observations on supramolecular assemblies like the HA brush or the COC matrix to
individual molecular features. The structure and dynamics of individual HA polymers
remain very challenging to study in the context of HA brushes or COC matrices.
However, the features of individual HA molecules (131) have been characterized in
previous studies, and it is clear that the properties of HA as a flexible and solvated
polymer chain must play an important role in defining matrix properties. Key principles
linking individual molecules and supramolecular assemblies can be accessed by an
alternative method: polymer physics theory. In this thesis, we focus on the effect of
physical (reversible) crosslinks on the morphology of polymer brushes, and develop a
mean field theory to analyse this case and test the new theory by confronting it with
experimental data (see Chapter IV).
In the following section, the main methods used in this work are introduced in some
detail.

Chapter I Introduction
27
I.3 METHODS
I.3.1 Surface functionalization and in-vitro model systems
I.3.1.i Immobilization platform
An essential technique for the experimental work was the controlled deposition of
molecules and tissues on surfaces.
An oligo ethylene glycol (OEG) monolayer deposited on gold (Au) substrates based
on Au-thiol adsorption strategy developed in previous studies (132, 133), was adopted
as solid support (Figure I.8). Although OEGs contain only hydrophilic ethylene glycol
units (134), which is not same as the amphiphilic molecules (135) used for the well
known self-assembled monolayers (SAMs), they can also form a robust and
reproducible monolayer that passivates the Au surface and prevents non-specific
adsorption of non-target molecules (136-138) or even cells (139). The resistance was
hypothesized to be supported by the ability of OEG to bind large amounts of interfacial
water (140). Through mixing two types of OEG molecules where one thiol was slightly
longer in length compared to the other and possessed a biotin tag, the passivated solid
substrate can be further functionalized with biotin-binding proteins for further
functionalization purposes.
An intermediate monolayer of streptavidin (SAv) serves as a ‘molecular breadboard’
(141) for the anchorage of desired molecules (Figure I.8). Through strong and specific
interactions between SAv and biotin exposed on the OEG monolayer, SAv can self-
assemble into a well-organized monolayer (26, 132, 142-144). SAv is expected to be
immobilized in such way that two of its four biotin-binding sites are facing the surface
for locking with the biotin exposed in the OEG layer while the other two binding sites
are facing the solution to accommodate target biotinylated molecules through a site-
specifically attached biotin tag (Figure I.8). The orientation and grafting density of
target molecules can be well controlled, which facilitates subsequent quantitative
characterizations.
Chapter I Introduction
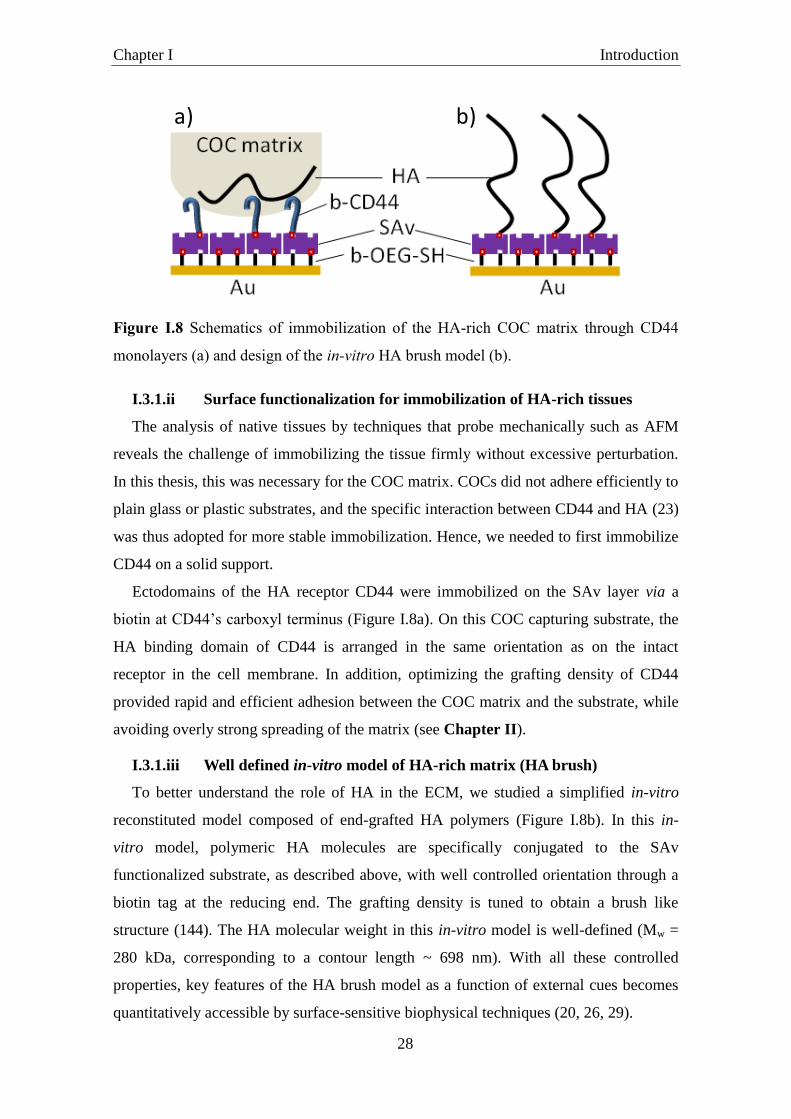
28
Figure I.8 Schematics of immobilization of the HA-rich COC matrix through CD44
monolayers (a) and design of the in-vitro HA brush model (b).
I.3.1.ii Surface functionalization for immobilization of HA-rich tissues
The analysis of native tissues by techniques that probe mechanically such as AFM
reveals the challenge of immobilizing the tissue firmly without excessive perturbation.
In this thesis, this was necessary for the COC matrix. COCs did not adhere efficiently to
plain glass or plastic substrates, and the specific interaction between CD44 and HA (23)
was thus adopted for more stable immobilization. Hence, we needed to first immobilize
CD44 on a solid support.
Ectodomains of the HA receptor CD44 were immobilized on the SAv layer via a
biotin at CD44’s carboxyl terminus (Figure I.8a). On this COC capturing substrate, the
HA binding domain of CD44 is arranged in the same orientation as on the intact
receptor in the cell membrane. In addition, optimizing the grafting density of CD44
provided rapid and efficient adhesion between the COC matrix and the substrate, while
avoiding overly strong spreading of the matrix (see Chapter II).
I.3.1.iii Well defined in-vitro model of HA-rich matrix (HA brush)
To better understand the role of HA in the ECM, we studied a simplified in-vitro
reconstituted model composed of end-grafted HA polymers (Figure I.8b). In this in-
vitro model, polymeric HA molecules are specifically conjugated to the SAv
functionalized substrate, as described above, with well controlled orientation through a
biotin tag at the reducing end. The grafting density is tuned to obtain a brush like
structure (144). The HA molecular weight in this in-vitro model is well-defined (Mw =
280 kDa, corresponding to a contour length ~ 698 nm). With all these controlled
properties, key features of the HA brush model as a function of external cues becomes
quantitatively accessible by surface-sensitive biophysical techniques (20, 26, 29).
a) b)

Chapter I Introduction
29
The HA brush model mimics the presentation of HA (through HASes) on cell
surfaces in native ECMs but neglects any other ECM components. It allows focussing
on HA behaviour under varying conditions, which is essential for extracting the
physical principles underlying key features of HA matrices on the supramolecular level.
The reduced complexity of this in-vitro model compared to the native matrix allows
highly controlled measurements and to derive quantitative information of the
mechanical properties correlating with the morphology of HA on supramolecular level
under specific conditions. Previous studies on similar brush system by varying salt
concentration revealed HA behaving as a strongly charged and semi-flexible
polyelectrolyte (20). The effects of cross-linking proteins such as TSG-6 on such HA
brushes were also well established (26). In this thesis work, the HA brush model is
characterized within a broad range of solution calcium concentration and pH to reveal
the effect of divalent cations and pH on the mechanical properties and the morphology
of HA supramolecular assemblies (see Chapter III).
I.3.2 Biophysical characterization
I.3.2.i Mechanical method: AFM
Since its invention in 1986 (145), AFM has developed rapidly and is now widely
used in many scientific fields. The main applications of AFM go into three categories:
force measurements, nanoscale topographic imaging and micro/nano-scale manipulation.
AFM is a scanning probe technique, and all functions rely on the interaction between a
microscopic (or nanoscopic) probe and a sample. In contrast to other scanning probe
techniques, AFM can be operated in liquid, which makes it particularly interesting for
biological specimen. We used atomic force microscopy (AFM) for force measurements
on the COC matrix. The basic working principle of AFM force measurements on cells
and tissues are described next.
I.3.2.i.a working principle
The working principle of AFM is shown in Figure I.9. The sample is placed on a
stage, in the case of cell and tissue specimen typically combined with an inverted
optical microscope to enable simultaneous observation of the sample on the micrometer
scale. A cantilever with a micron-sized tip (i.e. the probe) on the end approaches to or
retracts from the sample by control from a piezoelectric scanner (z). Upon interaction
between the tip and the sample, repulsion or attraction, the cantilever bends. A laser
beam is reflected from the back side of the cantilever, and the laser beam movement due

Chapter I Introduction
30
to cantilever deflection is determined with a 4-quadrant photodiode. With known spring
constant of the cantilever k, which is usually determined by the thermal noise method
(146), the interaction force F can be obtained by simple Hooke´s law:
kF ,
where δ represents the cantilever deflection.
Figure I.9 Schematic of AFM setup for force measurements on cells or tissues. Image
taken from website http://www.freesbi.ch/en/illustration/figures.
From the piezo movement z and the cantilever deflection δ, the distance between the
probe and the sample, or the indentation depth if the probe has compressed the sample,
are obtained. The output of AFM thus are curves presenting the interaction force as a
function of the probe-sample separation/ indentation. Such curves provide insight into
the nano/micromechanical properties of the sample, where the size of the probe defines
the length scale of interactions being probed.
AFM is attractive for the micromechanical characterization of the COC for several
reasons. First, AFM is applicable in aqueous environment, which is essential for
adequate mechanical characterization of hydrates species (123, 147-150). Second, AFM
allows probing micromechanical properties at controlled locations on the sample, so

Chapter I Introduction
31
that information about local mechanical properties and mechanical heterogeneity can be
obtained. Finally, AFM is able to probe a large range of magnitudes in elastic modulus
(from Pa to GPa (29, 151)) and length scale (from nm to μm (149, 152)). This is
essential for measurements on the COC matrix considering its size and softness. In
order to be sensitive to the range of mechanical properties characteristic for a given
sample, the size of the probe and the softness of the cantilever need to be carefully
selected.
I.3.2.i.b Colloidal probe AFM
Conventional sharp AFM tips, which usually have an apex radius as small as a few
nanometers, are crucial for high resolution AFM topographical imaging and provide
good performance in compression of hard objects. However, they are not appropriate for
the COC matrix or other biological materials that are very soft. Like a sharp knife, the
sharp tip may cut into the sample without any appreciable force being measured. The
accessible softness range can be significantly expanded by using colloidal probes, hard
spheres of desired size, attached to cantilevers of appropriate softness.
Colloidal probe AFM, developed in the early 1990s (153, 154), is a versatile
technique and popular for investigating the mechanical properties of thin films and
macroscopic materials (154-157). It measures the forces, down to pN resolution, that act
on a nanometer or micrometer-sized spherical probe as it interacts with the material of
interest. An advantage of using colloidal probes is that their shape and size are well
defined. This makes the geometry of interaction between probe and sample well-
controlled. The interactions between the probe and sample can be quantified with
improved sensitivity because at constant pressure (i.e. force per area) the total force
increases compared to using a conventional sharp AFM tip (157). This is crucial for
successful measurements on extremely soft materials, such as the COC matrix (see
Chapter II).
I.3.2.i.c Quantification of elasticity
The local elastic modulus E (Young´s modulus) of the sample can be determined
from the interaction forces (F) vs. the probe-sample indentation (δ) curves using a
classical theory in contact mechanics, the Hertz indentation model (158). For contact
between a hard sphere and an elastic half space (e.g. in our experiments the spherical
colloidal probe compressing on the COC matrix), the Hertz model gives
3
213
4
R
EF

Chapter I Introduction
32
where R represents the radius of spherical probe and µ is Poisson’s ratio (159) of the
elastic material that can be fixed. Most materials have Poisson’s ratio values ranging
between 0 and 0.5 (160), and thus E will be over-/underestimated by at most 25% even
if the exact value of µ remains unknown for a given sample.
The Hertz model makes a number of assumptions that are important to consider for
its application. First, it assumes the elastic modulus of the sample to be much smaller
than that of the probe, and the probe radius R to be much smaller than the effective
radius of the sample. Second, the Hertz model requires the indentation depth δ to be
small compared to the sample thickness. Third, the Hertz model is strictly valid only for
indentation depths much smaller than the probe radius. Moreover, the Hertz model
assumes zero probe-sample adhesion. Ultimately, the Hertz model makes the important
assumption that the probed material is isotropic. Chapter II illustrates that these
assumptions are fulfilled reasonably well for the analysis of COC matrix elasticity, and
the Young´s modulus E of the COC matrix was thus extracted by applying the above
equation to the F vs. δ curves acquired by AFM.
I.3.2.ii Acoustical method: QCM-D
Quartz crystal microbalance with dissipation monitoring (QCM-D) has been widely
used (161-163) to study soft and solvated interfaces. In this thesis, the mechanical
properties of the in vitro HA brush model were analyzed by QCM-D.
I.3.2.ii.a Working principle of QCM-D
The quartz crystal microbalance (QCM) relies on the piezoelectricity of quartz (164).
Specifically, an electrical signal is used to excite a quartz plate into mechanical
oscillation (inverse piezoelectric effect) and the response of the mechanical oscillations
to changes in the environment (e.g. due to molecules binding to the quartz sensor
surface) are then detected as an electrical signal (piezoelectric effect). As shown in
Figure I.10, the sensor is made of a quartz crystal plate that is sandwiched between two
electrodes. Shear oscillation of the quartz crystal can be excited by applying an AC
electric field at a frequency close to the resonance frequency (f1) that is related to the
quartz crystal thickness, or to odd overtones (fi, i = 3, 5, 7…) of the resonant frequency.
The working principle of the QCM-D is based on the so-called ring-down approach
(165), where the external electric field driving the oscillation is intermittently cut off
and the decay of the oscillation is monitored. The resonance frequency (f) of the crystal
and the energy dissipation (D) can be extracted from the oscillation profiles by fitting an

Chapter I Introduction
33
exponentially decaying curve. Both f and D are sensitive to processes occurring at the
sensor surface, such as macromolecular binding events. QCM-D measures changes, Δf
and ΔD, and allows monitoring of adsorption processes in real time in air and in
aqueous environment. Key information about binding processes such as kinetics and
stability, and about interfacial films such as morphology and mechanical properties, can
be obtained by QCM-D in real time without any labelling. The time resolution of the
QCM-D technique is typically better than 1 s.
Figure I.10 Schematic of the QCM-D working principle. (A) A quartz crystal sensor
where the piezoelectric quartz crystal is sandwiched between two gold electrodes. So-
called AT-cut crystals have shear motion when an electric field is applied between the
two electrodes (B). Oscillatory voltage (C) results in resonance of the shear motion. (D,
E) After cutting the driving circuit, the freely decaying oscillation of the crystal is
monitored. From the decay curve, the change in resonance frequency, Δf, and in energy
dissipation, ΔD, due to attached components can be extracted. Attachment of both (D) a
rigid mass and (E) a soft (viscoelastic) mass will lead to decreasing in resonance
frequency, while the latter also results in faster energy dissipation.
From the frequency shift, the adsorbed areal mass density can be estimated by the
Sauerbrey equation (166), given by
i
fCm i ,
where C is the mass sensitivity constant that depends solely on the material properties
of the sensor crystal. For a typical quartz sensor with a fundamental frequency of f0 ≈
4.95 MHz, C = 18 ng⋅cm-2⋅Hz
-1. The resolution in frequency is currently in the range of
A B C
D E
Chapter I Introduction
34
0.2 Hz (in liquid), corresponding to a resolution in areal mass density of a few ng/cm2.
Although originally derived for applications in air or vacuum 198, the Sauerbrey
equation is also valid for films immersed in Newtonian liquids such as water. It is
important to note that solvent that is hydrodynamically trapped in the interfacial film
also contributes to the areal mass density determined by QCM-D. However, for the
Sauerbrey equation to hold, the films have to be sufficiently rigid. Soft films will not
fully couple to the crystal oscillation resulting in underestimation of the mass by the
Sauerbrey equation. Soft film will give rise to an increase in dissipation, as well as Δf
and ΔD. The viscoelastic properties of these films can be accessed (161). Quantitative
information about the viscoelastic properties can in some cases be extracted by fitting
the QCM-D data with viscoelastic models (161, 167). A simple way to obtain
information about trends in film rigidity that is robust and does not require extensive
data fitting is to consider the parameter fD / . To a first approximation, this
parameter relates to the elastic compliance (or simply softness). This parameter is used
in this thesis to describe the effects of environmental conditions on the mechanical
properties of HA brushes (see Chapter III).
Another advantage of the QCM-D is that it readily allows in situ measurements in
aqueous environment while exchanging the properties of the liquid medium surrounding
the film of interest on the sensor surface. This is essential for characterizing the effect of
changes in the ionic strength and pH on HA brushes over a large parameter range, as
done in this thesis (see Chapter III).
I.3.2.iii Optical method: RICM
Reflection interference contrast microscopy (RICM) is employed in this thesis to
probe the HA brush morphology (i.e. thickness). RICM is an interferometric technique.
It was initially applied to study the interaction between cells and a planar substrate to
characterize the distance between the glass substrate and the underside of a living cell
(168). Later, the setup was greatly improved by introducing the antiflex method to
enhance the image contrast (169, 170). Subsequent work revealed that the quantitative
analysis of the RICM images for cell-substrate distances study is challenging due to the
presence of many partially reflecting interfaces within living cells (169). Instead, RICM
with improved contrast was found to have excellent potential for characterizing the
distance between a planar transparent substrate and simplified biological specimen such
as giant unilamellar vesicles or spherical objects such as colloidal probes of several

Chapter I Introduction
35
micrometers in size (171, 172). A colloidal probe hovering on top of a soft solvated film
thus can be exploited to determine the film thickness. The working principle of colloidal
probe RICM is introduced below.
I.3.2.iii.a Working principle of colloidal probe RICM
In the RICM setup with a spherical colloidal probe based on an inverted optical
microscope (Figure I.11), the incident light beam with intensity I0 is first partially
reflected at the substrate/solution interface as I1, while the rest is transmitted through the
solution and partially reflected at the solution/colloidal probe interface. This second
reflected beam passes back through the solution/substrate interface with proper
refraction and intensity I2. The two reflected beams interfere with each other, giving rise
to a pattern of concentric fringes, also called Newton’s rings, with intensity maxima
(Imax) and minima (Imin). In the simplest approximation, we can assume the incident and
reflected beams to be parallel to the optical axis. In this case, the relation between
intensity distribution I and the probe-substrate separation h is given by:
nhIIIIhI
4cos2),( maxminmaxmin ,
where n is the refractive index of the solution, and λ the wavelength of the light source.
Φ stands for the phase shift of the light upon reflection at the probe surface (169).
The probe-substrate separation h can be determined by simple analysis of the fringe
pattern (169) (Figure I.12), from the radial position of a selected extremum, j, in the
intensity profile through:
22)(
min2
j
l rRRn
lh
, if j is a minimum, and
22)(
max4
)12(j
l rRRn
lh
, if j is a maximum,
where R is the radius of colloidal probe (that can be determined from the bright field
image of the colloidal probe), l is the fringe order and rj the radial position of the
extremum j.

Chapter I Introduction
36
Figure I.11 Schematic of the RICM setup and the interference principle. The incident
light beam (intensity I0) is reflected at two interfaces. The two reflected beams interfere
with each other. With a spherical colloidal probe and a flat substrate, a pattern of
concentric fringes (Newton´s rings) arises from the distance-dependent
constructive/destructive interference.
Figure I.12 Rationale of the RICM fringe pattern forming. When the colloidal bead
changes its height h above the substrate, the radial positions of the fringes change. For
instance, the radius of the first dark fringe rj increases if the bead approaches the
Colloidal probe

Chapter I Introduction
37
substrate, as illustrated schematically on the right. The solid/dashed line represents
heights at which a fringe looks dark/bright.
From this interference pattern, the distance between sphere and substrate can be
extracted with a resolution of a few nanometers (169). The limitation of ambiguities in
distance determination that is intrinsic to the periodicity of interferometric responses
can be overcome by dual or triple wavelength RICM. This can extend the maximum
accessible probe-substrate distance to one micrometer and more.
In this thesis work, the suspended colloidal probe is separated from the substrate by a
HA brush, and thus the separation distance between the probe and the substrate is an
effective measure of HA brush thickness (see Chapter III). RICM is particularly well
suited to determine the thickness of very hydrated and soft films, for which the
thickness characterization by techniques such as QCM-D and ellipsometry is difficult.
RICM is a label-free technique and thus does not require chemical modification of the
HA film. It should be kept in mind that the interactions between the probe and the film
(e.g. gravitational forces or electrostatic repulsion) will affect the effective thickness
measured by RICM.
I.3.3 Theoretical method: Polymer physics theory
The morphology of HA brushes and matrices is determined by the molecular
properties of HA. Polymer physics theory can help understanding the mechanisms
underlying the assembly of polymer brushes (such as the HA brush) and how these are
affected by different conditions such as solvent quality change or cross-linking between
polymer chains.
Polymers such as HA are large molecules and continuously affected by thermal
fluctuation in liquid solution, and thus it is difficult to mathematically describe a system
composed of polymers by any deterministic method. In contrast, theories in polymer
physics field are powerful to study polymers, including their fluctuations, mechanical
properties and morphological features (173-175). The general idea of polymer physics
theory is to consider a polymer as many segments and use statistical approaches to
describe the collective behaviour of the segments under given conditions and constraints.
The simplest model of a polymer is the freely-jointed (ideal) chain, which assumes
fixed-length segments to be linearly connected and all bond and torsion angles
equiprobable while having no additional interactions between chain segments. Models
of increasing complexity consider also the interactions between polymer segments in

Chapter I Introduction
38
various ways (175, 176). Moving beyond the level of individual polymers, polymer
physics can also make predictions about the self-organization of polymer chains, for
example, in the case of polymers densely grafted on a surface. The next paragraphs
introduce some basic concepts of polymer physics theory that are relevant to the work
in this thesis.
I.3.3.i.a Polymer brush
In the experimental system of interest, polymers (i.e. HA) are end-grafted to a solid
substrate. Polymer chains grafted onto a planar solid substrate can adopt two distinct
conformations (Figure I.13), provided that only the polymer end is attached to the
surface. The preferable conformation depends on the magnitude of the size of the
polymer in solution compared to the mean distance s between adjacent anchor points.
The polymer size in solution is adequately described by the radius of gyration Rg, which
defines the mean distance of the polymer segments from the polymer´s centre of mass.
If s is greater than Rg, a so-called ‘mushroom’ like conformation is adopted. In this case,
the conformation of each polymer chain is not much different from that of a free
isolated chain in solution, and consequently the thickness of this mushroom film is
about Rg. When s is smaller than Rg, then the inter-polymer repulsion leads to stretching
of the polymers away from the surface. This conformation is termed a polymer ‘brush’.
Thus, by decreasing the distance between grafting points, polymer chains transit from
the mushroom to the brush regime.
Figure I.13 Morphology of flexible polymer chains attached to solid flat substrate.
I.3.3.i.b Polyelectrolyte brush
Of particular importance for the morphology of brushes are the interactions between
polymer chains, where the degree of repulsion will determine how strong the polymers
are stretched. A special case of relevance here is the repulsion through charges. HA is a

Chapter I Introduction
39
charged polymer, that is, a polyelectrolyte (PE). The behaviour of PE brushes depends
on the charge density along the polymer chain and the ionic strength of the
environmental solution, in addition to the grafting density. Three distinct regimes can be
distinguished for strong polyelectrolytes (177-179) (Figure I.14), where strong refers to
the scenario in which the degree of charging of the chargeable groups on the PE is not
affected by ionic strength.
Figure I.14 Effect of ionic strength on the morphology of PE brush. Experimental data
(blue dots) and theoretical fit (red line) of the thickness of a brush formed by HA (Mw =
1.08 ± 0.05 MDa, contour length ~ 2.86 μm) were obtained at different NaCl solution
concentrations (i.e. ionic strengths), as describe elsewhere (20). The three canonical
brush regimes – osmotic, salted and quasi-neutral – can be identified and are indicated
with the coloured background. Image modified from ref. (20).
When the concentration of counterions inside the PE brush is higher than the ion
concentration in the surrounding bulk solution, the osmotic pressure of the counterions
will dominate the chain stretching. In this osmotic regime, the equilibrium brush
thickness is determined by the balance between the elastic pressure generated by chain
stretching and the counterion osmotic pressure, and independent of the ionic strength of
the solution. When the ionic strength of the bulk solution becomes larger than the
concentration of counterions within the brush, the brush thickness will decrease upon
addition of salt because the electrostatic repulsions between chains become increasingly
screened. This regime is called the salted brush. In quasi-neutral regime, the screening
of electrostatic interactions approaches saturation. Here, the intrinsic excluded volume
of the polymer backbone dominates the brush thickness and the ionic strength
dependence is again weak (i.e. the brush thickness attains a plateau).
HA
bru
sh t
hic
knes
s (μ
m)

Chapter I Introduction
40
I.3.3.i.c Cross-linked brush
Cross-linking has been widely used to produce synthetic HA matrices (116-118, 121).
It also plays an important role in native HA matrices. For instance, HA was confirmed
to be cross-linked by interacting with TSG-6 (26), a protein that is expressed during
inflammation (36). More generally, the (reversible) cross-linking of flexible polymers is
also important in other biological systems. A case in point is the nuclear pore
permeability barrier, where intrinsically disordered proteins (so-called FG domains) fill
the channels of nuclear pore complexes (NPCs) and regulate the transport of
macromolecules into the nucleus of cells. Interestingly, FG domains are end-grafted to
the channel walls of the NPC and thus likely to form a brush. In contrast to HA being
cross-linked by external linkers, the FG domains can crosslink via phenylalanine-
glycine dipeptides (FG motifs) along each chain (180). To date, a theory that
rationalises the effect of reversible cross-links on the morphology of polymer brushes is
lacking. In Chapter IV we develop a first analytical theory of reversibly cross-linked
brushes that is based on mean field theory.
I.3.3.i.d Mean field theory
A polymer brush is a stochastic many-body system, which can be mathematically
described by mean field theory. This theory approximates the effects of all other
individuals on any given individual by a single averaged effect (a field), and thus
reduces a many-body problem to a one-body problem. Mean field theory has been
remarkably successful in predicting morphological features of polymer brushes, such as
the effect of solvent quality or ionic strength (178, 179, 181, 182). Mean field theory
often provides analytical expressions and thus enables the correlation of parameters to
be easily accessed, in contrast to other simulation methods (183, 184). Mean field
theory is employed in this thesis to study the morphology of a polymer brush as it is
affected by changes in ionic strength (Chapter III), solvent quality or cross-linking
(Chapter IV). Some basic concepts used in mean field theory and pioneering work is
introduced in the next paragraphs as a background for the theoretical approach
developed in Chapter IV.

Chapter I Introduction
41
Figure I.15 Illustration of the scaling concept and blob model of a polymer brush and
its density profile. The bottom curves represent the profiles of density c as a function of
the distance away from grafting surface x. Alexander-de Gennes model assumes a box
profile (solid line); the improved calculations by SCFT predict a parabolic density
profile (dashed line) instead. Image modified from ref. (175).
Consider a brush on a flat surface formed by polymers each containing N statistical
monomer units of length a in good solvent. Pioneering work by Alexander and de
Gennes (185) gave a first theoretical description of brush morphology. This theory
exploited the concept of blobs. Polymer chains can be seen as a series of virtual blobs
(as shown in Figure I.15). Each blob is thought to have a free energy of kT, implying
that the thermal motion is predominant within each blob whereas the external forces
become predominant at length scales above the blob size ξ. Such a separation of length
scales facilitates the understanding of polymer behaviour. According to Alexander-de
Gennes theory, the average distance between neighbouring anchor points s on a planar
surface dictates the size of the blobs (i.e. ξ = s). The equilibrium brush thickness h is
c
x
s
ξ

Chapter I Introduction
42
given by the balanced energy considering both the interaction energy (excluded volume
interactions) between the statistical segments and the energy of elastic stretching of the
chain (175). This simple model assumes that the free ends of the (monodisperse) chains
are all located at the same distance h away from the grafting surface, which implies all
chains are stretched equally. The profile of segment density c as a function of the
distance away from the surface x can then be described by a step-function (box profile,
Figure I.15). In their scaling theory, the equilibrium brush thickness h is then given by
aNh 3/1 ,
where 2)/( sa is the grafting density and the equation is accurate to within a
numerical prefactor of order unity.
Later work based on self-consistent mean field theory (SCFT) provided a more
reasonable density profile of polymer brushes (186-189). This approach takes advantage
of the fact that local fluctuations around monomers can be neglected to a first
approximation for a sufficiently stretched brush. Instead of assuming the free ends of
the chain to be positioned exclusively at the brush edge, the distribution was determined
self-consistently by this approach. A key prediction of SCFT is that the chain segment
density profile for brushes in good solvent is parabolic (Figure I.15). The SCFT
provides a brush thickness approximation, given by
aNh 3/1
3/1
2
8
.
As can be seen, the simple Alexander-de Gennes model despite its crude assumption
about the chain end positions predicts the brush thickness correctly except for the
lacking numerical prefactor. In the presence of cross-linking, the interaction free energy
of chains in the brush comprises not only the excluded volume interactions between
segments, but also the contribution from the association between pairs of stickers. By
adding this sticking term into the SCFT, the morphology of cross-linked polymer
brushes can also be self-consistently determined and correlated with experimental
systems (see Chapter IV). We have chosen to use FG domain brushes for a first
comparison, because data were available in the lab. However, future extension of the
theory could also be applied to HA brushes.

Chapter II COC matrix micromechanics
43
II Micromechanical properties of native HA-
rich tissue: the COC matrix
The research work presented in this chapter is in press in Biophysical Journal as:
Micromechanical analysis of the hyaluronan-rich matrix surrounding the oocyte
reveals a uniquely soft and elastic composition
Xinyue Chen,1,2
Rita Bonfiglio,3 Suneale Banerji,
4 David G. Jackson,
4 Antonietta Salustri,
3 and
Ralf P. Richter1,2,5
1 CIC biomaGUNE, San Sebastian, Spain;
2 Max-Planck-Institute for Intelligent Systems,
Stuttgart, Germany; 3 University of Rome Tor Vergata, Department of Biomedicine and
Prevention, Faculty of Medicine, Rome, Italy; 4
MRC Human Immunology Unit, Weatherall
Institute of Molecular Medicine, University of Oxford, Oxford, UK; 5 University Grenoble
Alpes - CNRS, Laboratory of Interdisciplinary Physics (LIPhy), Grenoble, France.
My contribution: I co-designed research (together with Antonietta Salustri and Ralf P.
Richter). With biological samples (including the COCs and essential protein reagents)
prepared by others, I performed all AFM/optical microscopy measurements and
analysed the data. I improved the data analysis method and interpreted the data (together
with Ralf P. Richter). I prepared all figures and wrote the first draft of the article, as
well as contributed to subsequent corrections to complete the article for publication.

Chapter II COC matrix micromechanics
44
Abstract: The cumulus cell-oocyte complex (COC) matrix is an extended coat that
forms around the oocyte a few hours before ovulation and plays vital roles in oocyte
biology. Here we have analyzed the micromechanical response of mouse COC matrix
by colloidal probe atomic force microscopy (AFM). We found that COC matrix is
elastic insofar as it does not flow and its original shape is restored after force release. At
the same time, COC matrix is extremely soft. Specifically, the most compliant parts of
in vivo and in vitro expanded COC matrices yielded values for the Young’s modulus of
0.5 0.1 Pa and 1.6 0.3 Pa, respectively, suggesting both high porosity and a large
mesh size (≥100 nm). In addition, the elastic modulus increased progressively with
indentation. Furthermore, using optical microscopy to correlate these mechanical
properties with ultra-structure, we discover that the COC is surrounded by a thick
matrix shell that is essentially devoid of cumulus cells and enhanced upon COC
expansion in vivo. We propose that the pronounced non-linear elastic behaviour of COC
matrix is a consequence of structural heterogeneity and serves important functions in
biological processes, such as oocyte transport in the oviduct and sperm penetration.

Chapter II COC matrix micromechanics
45
II.1 INTRODUCTION
Cumulus cells are a distinct population of somatic cells surrounding the oocyte in
mature ovarian follicles (53). In response to the hormone surge that ultimately triggers
ovulation, they produce a unique oocyte-embedding matrix. This process, known as
cumulus expansion, involves the rapid synthesis of hyaluronan (HA) (85), a
polysaccharide of the glycosaminoglycan family, and in concert, the cross-linking of
HA polymers with a complex of several distinct proteins and proteoglycans (28, 83,
190-193). The resulting matrix, termed the cumulus cell-oocyte complex (COC) matrix,
contains not only the oocyte but also a large number of cumulus cells, and is essential
for successful ovulation and in vivo fertilization. In particular, the COC matrix has been
proposed to modulate cumulus cell and sperm intracellular signalling (53), and it is
known to facilitate the transport of COCs along the oviduct (99) and to play important
roles in the attraction (83, 103), capacitation (104) and selection (105) of sperm.
Consequentially, the quality of cumulus expansion has also been a criterion for the
selection of oocytes towards in vitro fertilization (IVF) for many years (194). Intact
COCs can also be isolated from the follicle and stimulated to synthesize hyaluronan rich
matrix during in vitro maturation (IVM) of mammalian oocytes. Although the in vitro
synthesized matrix is apparently similar to that formed in vivo, it has been suggested
that it could be deficient of some components provided within the ovarian follicle by
neighboring cells, thereby establishing a different microenvironment for the oocyte (53).
It is now well established that the mechanical properties of extracellular matrix
(ECM) have profound effects on the cells that they surround, and critically affect basic
cellular processes such as proliferation, motility (45) and differentiation (46), in
addition to pathologies such as tumour progression (48). Thus, it is reasonable to
hypothesize that the mechanical properties of the COC matrix also contribute to the
control of oocyte behaviour. The functional importance of COC matrix softness is
strikingly illustrated, for example, in videos of oocyte pickup by the mammalian
oviduct where a perturbed and stiffened matrix was found to impair transport (51).
Moreover, the mechanical properties of the ECM are ultimately determined by the
properties of the constituent molecules and their interactions. Salient morphological
features of the COC matrix are extreme hydration, a highly dynamic nature and a low
degree of order, and these make it difficult to study the ultrastructure of the COC matrix
directly with conventional methods such as optical or electron microscopy. In this

Chapter II COC matrix micromechanics
46
regard, the characterization of mechanical properties can indirectly provide valuable
information about matrix morphology and ultrastructure. Currently, however, only very
limited information about the mechanical properties of the COC matrix is available.
Whereas its elasticity has been documented on the basis of a macroscopic stretching
assay (195) and an oviduct transport assay (196) developed many years ago, we are still
lacking knowledge about the local mechanical properties and the mechanical
heterogeneity of the COC matrix.
Several methods to probe the local mechanical properties of tissues, extracellular
matrix and cells have emerged over the last two decades, including particle tracking
microrheology (197, 198), optical force probe microscopy (124) and atomic force
microscopy (AFM) (147, 149, 150, 152, 199, 200). The ability to probe a large range of
magnitudes in elastic modulus (from Pa to GPa (29, 151)) and length scale (from nm to
μm (149, 152)) makes AFM particularly versatile (157). In colloidal probe AFM, this is
achieved by using hard spheres of desired size as indentation probes attached to AFM
cantilevers of appropriate softness.
In the present study, we analyze the micromechanical response of mouse COC
matrix using colloidal probe AFM. We identify the COC matrix as a biological material
that displays a unique combination of elasticity and extreme softness. Secondly, using
quantitative compressibility analysis we reveal the COC matrix to be mechanically
heterogeneous. Finally, by combining AFM with optical microscopy we show this
unusual heterogeneity stems from an additional and previously undescribed thick outer
matrix layer that is completely devoid of cumulus cells. We discuss the implications of
our findings for the nanoscale morphology and potential biological functions of the
COC matrix.
II.2 MATERIALS AND METHODS
II.2.1 Materials
Oligo-ethylene glycol (OEG) was prepared as a solution comprising a 1 mM mixture
of OEG thiol (386.5 Da) and biotinylated OEG thiol (788 Da; both Polypure, Norway)
at a molar ratio of 99:1 in synthesis grade ethanol, and stored in the dark at 4 °C.
Lyophilized streptavidin (SAv; Sigma-Aldrich) was dissolved in ultrapure water and
stored as aliquots at a concentration of 1 mg/mL at -20 °C. Lyophilized bovine serum
Chapter II COC matrix micromechanics
47
albumin (BSA; Sigma-Aldrich) was freshly dissolved in ultrapure water and used at a
concentration of 10 mg/mL for all passivation purposes.
A ‘sample preparation buffer’ comprising 10 mM HEPES and 150 mM NaCl at pH
7.4 was used for the preparation of COC-capturing substrates. Throughout the AFM
measurements, COCs were maintained in ‘culture medium’ consisting of Minimum
Essential Medium (MEM) with Earle’s salts, buffered at pH 7.3 with 20 mM HEPES
and supplemented with 50 g/ml gentamycin, 0.3 mM sodium pyruvate, 1 mg/ml BSA
and 1 mM 8-bromoadenosine 3',5'-cyclic monophosphate (8-Br-cAMP), a membrane-
permeable cyclic AMP analogue that stabilizes the expanded cumulus matrix (201).
Polystyrene microspheres with 91.0 ± 1.3 µm diameter (Polysciences, Germany)
were washed first in ethanol and then in ultrapure water, 5 times each, dried in a
vacuum oven at 40 °C for 3 h, and stored at 4 °C.
II.2.2 Cloning and purification of biotinylated and soluble CD44
The full CD44 ectodomain sequence terminating at Proline 267 was amplified from
human CD44S cDNA using the high fidelity polymerase pfu Ultra AD (Agilent)
together with the forward primer hCD44 -14 BamHI F 5’
GCGGGATCCGAAGGGGTAGGCACGATGGCCAGG and the reverse primer
hCD44 801 10H* XhoI R 5’ GCGCCTCGAGTTAGTG
ATGGTGATGGTGATGGTGATGGTGATGCCACTCGATTTTCTGTGCCTCGAAG
ATGTCATTCAGGCCGGATCTAGGAATTTGGGGTGTCCTTATAGG which
encodes a target site for biotin ligase and a ten histidine tag. The amplified fragment
was cloned into a variant of the pHR Sin vector (202) carrying an internal ribosome
entry site (IRES) upstream of a gene encoding emerald GFP and introduced into HEK
293T by transfection. Culture supernatants containing virus-like particles were then
used to transduce CHO K1 cells together with the lentiviral packaging and envelope
plasmids pMD.G and p8.91 using Genejuice (Merck, Darmstadt, Germany) and selected
for GFP expression by flow cytometry. Secreted CD44 His-tagged protein was
subsequently purified from culture supernatants using a His Trap column (GE
Healthcare) prior to biotinylation using a BirA-500 kit (Avidity, CO, USA) according to
the manufacturer’s instructions and removal of free biotin by size exclusion
chromatography. The purified CD44 protein with C-terminal biotin tag (b-CD44) was
stored at 0.5 mg/mL in phosphate buffered saline (PBS) at -20 °C until use for the
preparation of COC-capturing substrates.

Chapter II COC matrix micromechanics
48
II.2.3 Preparation of colloidal probe AFM cantilevers
Tipless V-shaped Si3N4 cantilevers with a nominal spring constant of 0.06 N/m (NP-
OW, Veeco Probes, USA) were treated for 30 min with UV/ozone (UV/Ozone
ProCleaner, Bioforce Nanoscience, USA). Polystyrene microspheres were dispersed on
a cleaned and UV/ozone treated glass cover slip, and attached to the cantilever by a UV-
cured adhesive (NOA 61, Thorlabs, Germany). Positioning and attachment were aided
by a micromanipulator (Patchstar; Scientifica, UK) and an optical microscope (Axio
Observer; Zeiss, Germany). The real cantilever spring constant was determined as 0.076
± 0.004 N/m using the thermal noise method (146) from an average over three
cantilevers with colloidal probes attached. Before use, the colloidal probe AFM
cantilever together with the chip and chip holder were immersed in BSA for 20 min, for
surface passivation. Excess BSA was removed by washing with sample preparation
buffer.
II.2.4 Preparation of substrates
Glass cover slips (1.5 mm, 24 x 24 mm2, Menzel Gläser, Germany) were gently
wiped with lint-free tissue (Kimtech Science, USA), immersed for 3 h in freshly
prepared piranha solution composed of concentrated H2SO4 (95% - 98%, Scharlab,
Spain) and H2O2 (50%, Scharlab, Spain) in a 3:1 volume ratio, thoroughly rinsed with
ultrapure water, blow-dried with N2 gas and stored in sealed petri dishes. For gold (Au)
coating, clean glass cover slips underwent 10 min plasma cleaning in the vacuum
chamber of a magnetron sputter system (ATC 1800 UHV, AJA International, USA)
before deposition of a 0.5 nm adhesive titanium (Ti) interlayer followed by a 5 nm Au
layer. All substrates were UV/ozone treated for 30 min prior to further use.
To generate COC-capturing substrates, a previously established protocol (26, 141)
for the orientated immobilization of biotin-tagged molecules was applied. The Au
coated cover slips were first immersed in OEG solution overnight, rinsed with ethanol
and ultrapure water, blow-dried with N2 gas, and attached, using a two-component glue
(Twinsil; Picodent, Germany), to a titanium holder that was custom-designed for
operation with a combined atomic force/optical microscopy setup. The surface coated
with the biotinylated OEG monolayer was then incubated with 20 µg/mL SAv for 30
min, followed by 5 µg/mL b-CD44 for 30 min. Excess proteins in the solution phase
were removed by rinsing after each incubation step, and protein-coated surfaces were
kept wet throughout the preparation and measurement procedures.

Chapter II COC matrix micromechanics
49
II.2.5 In vivo and in vitro expansion of COCs
In vivo and in vitro expansion of mouse COCs was induced as described previously
(85). Briefly, adult female Swiss CD1 mice were primed by intraperitoneal injection of
5 IU pregnant mare serum gonadotropin (PMSG), to promote the formation of multiple
antral follicles, and, 44 to 48 h later, received a 5 IU intraperitoneal injection of human
chorionic gonadotropin (hCG) to induce COC expansion and ovulation. In vivo
expanded COCs were then isolated from oviducts soon after ovulation (14 hrs from
hCG injection), and transferred with a glass micropipette to tubes in ice containing 100
l of culture medium, and immediately frozen at -80 °C.
To induce in vitro expansion, female mice were sacrificed 44 to 48 h after PMSG
injection and COCs isolated from the ovaries. Approximately 10 COCs were cultured
under oil in a 20 l drop of culture medium containing 1 mM 8-Br-cAMP and
supplemented with 5% fetal calf serum (FCS) for 15 h at 37 °C in 5% CO2. At the end
of culture, in vitro expanded COCs were collected and stored as described for in vivo
expanded COCs.
II.2.6 Immobilization of COCs
COCs were thawed on ice for approximately 1 h before transfer to COC-capturing
substrate. Visual inspection under the microscope revealed thawed in vivo expanded
COCs to be comparable in appearance to those freshly isolated from the oviduct. In
particular, the spatial extension of the cumulus cell cloud was not visibly altered by the
freeze-thawing cycle and remained virtually unchanged for several hours following
thawing. The matrix did not dissociate and the mechanical response of the matrix to
gentle stretching with a pair of tweezers also remained comparable, indicating that the
freeze-thawing cycle did not affect the matrix morphology appreciably.
200 µL micropipette tips modified to enlarge the aperture diameter, to ensure COC
uptake and release with minimal stress, and passivated with BSA, to reduce COC
adhesion, were used for the transfer. The tips were gently manipulated (with monitoring
through a phase contrast microscope), to facilitate isolation of individual oocytes with
their cumulus matrix from the original multi-oocyte clusters and their subsequent
immobilization at desired positions on the COC-capturing substrate. Care was taken to
keep the COCs fully immersed in solution during the immobilization process, and 100
µL measurement solution was added after COC immobilization. AFM measurements
were performed at room temperature and typically lasted 2 to 5 h. Immobilized COCs

Chapter II COC matrix micromechanics
50
were found to be stable during this time, i.e. the spatial arrangement of the oocyte and
the cumulus cells did not change appreciably. Matrix deformation under gentle
stretching with tweezers was qualitatively similar at room temperature and at 37 °C,
suggesting that the mechanical properties do not change appreciably over this
temperature range.
II.2.7 Force measurements by colloidal probe atomic force
microscopy
AFM measurements were performed with a NanoWizard II (JPK Instruments,
Germany) installed on an optical microscope (Axio Observer; Zeiss, Germany). The
AFM was equipped with a CellHesion module providing a z-piezo actuation range of
100 μm. The approach speed was 20 µm/s unless stated otherwise. The cantilever
sensitivity was determined prior to each measurement, from the hard-wall-contact
regime of force curves obtained on a cleaned and BSA-passivated glass cover slip in
sample preparation buffer. COC-capturing substrates bearing COCs were then mounted
and probed in measurement solution. Reference force curves were acquired at locations
devoid of COCs, to define the z location of the substrate and to test for contaminants on
the colloidal probe. Only probes that showed minimal interactions (i.e. less than 1 µm
interaction range) prior to hard-wall contact were used for further analysis. Force curves
on the COC were acquired at desired positions, with a lateral resolution of a few μm
(determined by the accuracy of the microscope’s manual xy translation stage) and an
accuracy in the distance from the glass substrate of approximately 10 μm (determined
from the repeatability in z positioning by the stepper motor of the AFM head). At least
three force curves were collected per position.
Data were corrected for linear thermal drifts in the cantilever deflection, and force vs.
distance curves were computed using established methods (157) implemented in JPK
Data Processing Software. Fits of contact mechanics models such as the Hertz model
(vide infra) to force curves were also performed with the JPK Data Processing
Software, with the measured forces around the contact point δ = 0 averaged and offset
to zero.

Chapter II COC matrix micromechanics
51
II.3 RESULTS
II.3.1 Immobilization of the COC matrix and experimental setup
The experimental setup used to characterize the local response of COC matrix to
compression is schematically shown in Figure II.1A. The AFM cantilever was used with
a colloidal probe (i.e. a microsphere) of 90 μm diameter. Such large probes were
necessary to provide the required sensitivity for the assays. In initial tests, we noted that
the COCs did not adhere efficiently to plain glass or plastic substrates - a critical
requirement for reproducible AFM measurements. Hence, we prepared a streptavidin
functionalized substrate which was coated with soluble biotin tagged ectodomains of the
hyaluronan receptor CD44 (Figure II.1A, inset) to allow more stable tethering via
hyaluronan in the COC matrix (23). The streptavidin monolayer thus serves as a
‘molecular breadboard’ (141) on which CD44 is immobilized via its carboxyl terminus
with its ligand binding domain arranged in the same orientation as the intact receptor in
the cell membrane. As shown in Figure II.1B, when a COC approaches the CD44
functionalized substrate, it adhered rapidly and the immobilized COC adopted a stable
morphology within a few seconds. This immobilization method worked for COCs
expanded in vivo as well as in vitro. We compared these two types of matrix to assess if
the in vitro expansion conditions affect COC matrix mechanics compared to the in vivo
scenario. Importantly, COCs did not adhere in the absence of CD44, indicating that the
immobilization occurs specifically via hyaluronan. Inspection by optical microscopy
revealed that cumulus cells in the COC that were located adjacent to the substrate
remained immobile under the influence of gentle pipette-induced flow, indicating firm
adhesion of the COC matrix. By comparison, more distantly located cumulus cells were
transiently displaced, indicating that the matrix was easily deformed.

Chapter II COC matrix micromechanics
52
Figure II.1 (A) Scheme of the AFM force-indentation measurement setup. The inset
illustrates the assembly of the COC-capturing surface. (B) Representative optical
micrograph of the measurement setup (right). The red arrowhead marks the colloidal
probe, attached to the V-shaped AFM cantilever and the chip (right; the shiny spot on
the upper cantilever arm is the laser detecting cantilever deflection). Cumulus cells in
the COC matrix (one is marked with a black arrowhead) and the oocyte (white
arrowhead) are also visible. Force curves were acquired at locations labelled with white
crosses, starting above the oocyte centre and interspaced by 50 µm. The left micrograph
provides a magnified view of an oocyte, where the zona pellucida surrounding the
oocyte, marked by a white arrowhead, can be identified. (C) Representative curves of
force vs. distance from contact point δ, acquired upon approach to (black line with solid
square symbols) and retraction from (red line with open circle symbols) in-vivo (left)
and in-vitro (right) expanded COC matrices. δ was set to 0 at the contact point at
approach, and positive distances correspond to sample indentation.
100 µm
B
C
A
COC-capturing substrate
Probe
Matrix
AFM cantilever
Oocyte
b-OEG-SH SAv
HA
Au
b-CD44
100 µm
× ×× ××

Chapter II COC matrix micromechanics
53
Representative force curves obtained upon indentation of an in-vivo, as well as an in-
vitro expanded COC at a location on top of the oocyte are shown in Figure II.1C. The
approach curve shows an extended baseline, where the colloidal probe was not in
contact with the sample, followed by a monotonic increase in force reflecting the
response of the COC matrix to compression. The length of the baseline was chosen to
extend at least 40 μm to enable reliable determination of the contact point (δ = 0), which
was operationally defined as the position in the approach curve at which the force
exceeded the baseline level by 50 pN. This threshold force is slightly above the
instrument noise level.
Attractive features (i.e. negative force) were not observed in the approach curves, but
they were always present in the retract curves. This reveals that some residual adhesion
between the colloidal probe and the COC occurs despite passivation of the probe with
BSA. It also implies that probe-sample adhesion must increase gradually in the course
of the indentation process. The magnitude of the adhesion forces varied. In-vivo
expanded COCs typically showed an adhesion of a few 100 pN, occasionally rising to
values in the low nN range, while in-vitro expanded COCs displayed values in the range
of 5 to 10 nN, or in some cases only a few 100 pN. The exact shape of the retract curves
also varied from one measurement to the next, even on the same spot, and yielded
multiple unbinding peaks. This indicates that the detachment of the matrix from the
colloidal probe occurs stochastically in steps, and suggests that the COC matrix may be
heterogeneous on the scale of the interaction area. Adhesion frequently persisted a few
tens of µm beyond the contact point (Figure II.1C), indicating that the COC matrix can
be stretched significantly. The overall shape and position of the COC matrix were not
visibly affected during indentation or stretching with the colloidal AFM probe, as
observed by optical microscopy. This confirmed that the COC matrix is stably
immobilized thus enabling repeated and controlled indentations at well-defined
positions.
II.3.2 COC matrix is an elastic material
To investigate the mechanical response of the COC matrix to applied force, we
indented the matrix atop oocytes repeatedly and at various loading rates (Figure II.2).
The shapes of approach curves obtained during the first and subsequent indentations at
the same position on the COC matrix were virtually identical, for COCs expanded in
vivo (Figure II.2A) as well as in vitro (Figure II.2B). Moreover, the distances of the

Chapter II COC matrix micromechanics
54
contact point from the glass substrate also remained unchanged. This indicates that the
matrix fully recovers its original shape when the compressive force is released. In other
words, COC deformation is elastic and not plastic.
Figure II.2 Effects of compressive forces on indentation of COC matrix: elastic vs.
plastic and viscous deformation. (A-B) Representative curves of force vs. distance from
contact point δ, measured on COCs expanded in vivo (A) and in vitro (B). The first and
second approach curves obtained at a previously unperturbed position on the COC are
shown for two selected approach speeds (1 µm/s and 20 µm/s, as indicated). (C-D)
Slopes measured between δ = 25 and 30 µm in series of force vs. distance curves
acquired at fixed positions with varied approach speed, normalized by the slope at 20
µm/s. Data represent the mean standard deviation from measurements on 3 COCs
each, expanded in vivo (C) and in vitro (D).
The force responses of in vivo expanded COC matrices were sensitive to the loading
rate. For example, applying a more rapid rate of compression led to a marked increase
in the force required to generate a given indentation (Figure II.2A). To analyze this
dependence, the slopes of the force vs. distance curves at a selected indentation depth
(25 µm < δ < 30 µm) were computed. As shown in Figure II.2C, the value was
significantly lower at 1 µm/s (the lowest rate measured) compared to 20 µm/s (the
highest rate measured). This suggests that there is a viscous component to the
mechanical response. Interestingly, a plateau is observed at higher loading rates,
indicating a transition from a viscoelastic to a purely elastic behavior around 5 µm/s.
COC matrices expanded in vitro showed no significant loading rate dependence (Figure
II.2D), indicating that this matrix remains purely elastic across the measured range.

Chapter II COC matrix micromechanics
55
II.3.3 Quantification of COC matrix elasticity
The Young´s modulus E of the COC matrix was determined from force (F) vs.
indentation (δ > 0) curves using the Hertz indentation model (158)
3
213
4
R
EF
, (Eq. 1)
where R represents the radius of spherical probe (45 µm) and µ is Poisson’s ratio (159).
Most materials have Poisson’s ratio values ranging between 0 and 0.5 (160), and we
fixed µ = 0.5 for simplicity. This implies that E will be underestimated by at most 25%
depending on the exact value of µ. The simplified form of the Hertz model given in Eq.
1 assumes E to be much smaller than the Young’s modulus of the probe (in the GPa
range for polystyrene (151)), and R to be much smaller than the effective radius of the
probed sample. Both conditions are met in our experiments (vide infra).
The Hertz model provided satisfactory fits when the first 10 μm of indentation were
considered for analysis Figure II.3A, solid line). The resulting Young’s modulus of
matrix expanded in vivo was extremely low; an average from measurements atop the
oocyte in 3 COCs gave E = 0.5 0.1 Pa. In vitro expanded COC matrices possessed
values for Young’s modulus (E = 1.6 0.3 Pa) that were several fold higher.
Extrapolation of the fit (Figure II.3A, dotted line), however, revealed that the Hertz
model does not adequately describe the experimental data at larger indentations. We
considered several effects to explain this discrepancy.
First, the Hertz model requires the indentation depth to be small compared to the
sample thickness (158). This is the case in our experiments (vide infra). Second, the
maximal indentation depth in our experiment approached the radius of the indenter (δ ~
R) whereas the Hertz model is strictly valid only for δ << R. However, comparison with
an improved model by Sneddon (203) shows that the Hertz model overestimates the
force at a given indentation and fixed Young’s modulus, the opposite to what is
observed in the experiment (Figure II.3A). Moreover, the discrepancy between the two
models remains below 10% for all δ < R (Supporting Figure II.S1), implying that the
Hertz model provides a reasonable approximation even at the largest measured
indentations. Third, the Hertz model assumes zero probe-sample adhesion. The absence
of negative forces in the approach curves (Figure II.1C) indicated that adhesion was
indeed virtually absent at small indentations in our experiments. The negative forces in
the retract curves (Figure II.1C) revealed that adhesion develops gradually upon
indentation, and this would affect the shape of the approach curve at larger indentations

Chapter II COC matrix micromechanics
56
in a way that is not properly accounted for in the Hertz model. However, a reduction in
the force would be expected, again opposite to what is seen in Figure II.3A, and
adhesive interactions therefore also cannot explain the discrepancy between the Hertz
model and experiment.
Figure II.3 Quantification of COC matrix elasticity. (A) Representative curves of force
vs. distance from contact point δ, acquired on top of the oocyte centre of in-vivo (left)
and in-vitro (right) expanded matrix (grey solid lines), fitted to the Hertz model over 0 ≤
δ ≤ 10 µm (black solid line) that yields values for Young´s modulus of 0.4 and 1.6 Pa,
respectively. The black dotted line is an extrapolation of the fit, illustrating that the
Hertz model does not reproduce data yielding large indentation values accurately, and
that the matrix effectively stiffens upon compression. Data over 0 ≤ δ ≤ 12 µm are
magnified (insets), to illustrate the quality of the fits. (B) Effective elastic moduli E’ for
a COC expanded in vivo (solid squares) and in vitro (open circles). The force curves in
(A) were downsampled to reduce scatter and then used for analysis. For 0 ≤ δ ≤ 10 μm,
E’ was determined through a fit with Eq. 1; for δ > 10 μm, E’ was calculated with Eq. 2.
Ultimately, the Hertz model makes the important assumption that the probed material
is isotropic and linearly elastic. The enhanced increase in the compression force with
indentation observed in the experiment (Figure II.3A) thus would indicate that COC
matrix effectively stiffens upon compression. We sought to obtain a more detailed

Chapter II COC matrix micromechanics
57
characterization of the matrix mechanical properties as a function of indentation. To this
end, we define the elastic modulus E’ by considering only the force ’ at a given
indentation depth δ = δ’ > 0, but not the shape of the force curve between the contact
point (δ = 0) and δ’, for the Hertz model analysis. From Eq. 1, we find
3
214
3
R
FE . (Eq. 2)
E’ provides a simple quantification of matrix elasticity. For small indentations, i.e. in
the linear elastic regime where the Hertz model reproduces the experimental data well,
it is identical to the Young’s modulus E. For large indentations, where the Hertz model
deviates from the experimental data (δ > 10 µm in our case), it represents a measure of
non-linear elasticity. We note that the way in which non-linear effects influence the
shape of the force vs. distance curves may depend in complex ways on the shape and
size of the employed probe, as well as the internal organization of the matrix. In
addition, the force curves at large compression are also likely to be affected by probe-
sample adhesion (Supporting Figure II.S2). Therefore, we consider E’ an effective
measure of matrix elasticity in the non-linear elastic regime.
Figure II.3B shows the result of this analysis on representative force curves acquired
in the central region above the oocytes. E’ was a few fold higher for in-vitro expanded
matrix (open circles) than for in-vivo expanded matrix (solid squares) irrespective of the
indentation, and increased by a few fold over the accessible indentation range of 40 μm.
Nonlinear effects were appreciable and more pronounced for in-vitro expanded matrix.
II.3.4 Quantification of COC matrix extension
Because the HA-rich matrix is not directly visible by optical microscopy, the
distribution of cumulus cells is commonly used as an indirect measure for COC matrix
extension. In our assay, the contact point determined through indentation measurements
provided an alternative measure for matrix extension. Interestingly, our finding that
these two measures differ indicates that the COC features an extended outer matrix
layer that is essentially free of cumulus cells – a novel and unexpected feature that has
not been described previously. Specifically, we defined the ‘mechanical height’, Hmech,
as the distance between the point of contact on the COC and the glass surface, which
was determined from the combined motion of the AFM’s z piezo and stepper motor to
an accuracy of approximately 10 μm. The ‘optical height’, Hopt, on the other hand was
determined as the objective travel required for moving the optical focus from the glass

Chapter II COC matrix micromechanics
58
substrate to the outermost cumulus cells (multiplied by nliquid/nair = 1.334, to correct for
the effect of the refractive index change between aqueous solution and air on the
focusing). We estimate a resolution of 30 μm for this parameter, based on the accuracy
of the focusing itself and the manual readout of the focus travel position. This is much
less than the dimensions of the COC and thus provided measurements with good
accuracy.
Figure II.4 Determination of COC dimensions. (A) Heights, Hmech (determined
mechanically from the contact point) and Hopt (determined optically from the location of
the topmost cumulus cells), as a function of the distance from the oocyte centre. Data
represent mean and standard deviations from measurements on 3 COCs; error bars are
drawn along one direction only to facilitate visualization. (B) Illustration of the
approximate dimensions of the COC matrix and the location of cumulus cells within it,
as determined from the spatial mapping of Hmech and Hopt. The height of the oocyte
A
C In-vivo expanded In-vitro expanded
B In-vivo expanded In-vitro expanded
100 µm
MatrixOocyte with
zona pellucidaCumulus cell
Cumulus-free matrix

Chapter II COC matrix micromechanics
59
above the substrate was determined optically. Oocyte and cumulus cell sizes are drawn
to scale. (C) Elasticity of COCs expanded in vivo (left) and in vitro (right) as a function
of distance from the oocyte centre. Young’s moduli in the linear elastic regime (solid
squares) as determined through a fit with Eq. 1 for δ < 10 μm; elastic moduli at δ = 30
μm (open circles) were calculated with Eq. 2. Data represent the mean standard
deviation from measurements on 3 individual COCs, except at 200 µm where only 2 of
3 in-vivo expanded COCs had a matrix and were analyzed.
Figure II.4A shows that the part of the matrix containing the oocyte and the cumulus
cells is approximately 200 μm thick, independent of the method used for matrix
expansion. Remarkably, the optically invisible cell-free coat contributes appreciably to
the total coat extension. For in-vivo expanded matrix, it adds another 200 μm to the total
thickness. For in-vitro expansion, the cell-free coat remains appreciable but its thickness
reduces by 50%, indicating that factors in the follicle that are not present in vitro might
play an important role in the formation of this part of the matrix.
To map the dimensions of the COC matrix laterally, Hmech and Hopt were measured as
a function of the distance from the oocyte centre. These results are also shown in Figure
II.4A, and summarized in Figure II.4B in which the results of the correlative analysis of
micromechanical and optical data are reflected in schemes that depict the extensions of
the cumulus-containing and the cumulus-free parts of matrix, the oocyte and the
cumulus cells drawn to scale. The sharp drops in Hmech and Hopt between 200 and 250
μm distance for in-vivo expanded matrix, and between 150 and 200 μm distance for in-
vitro expanded matrix, indicate that the lateral extension of the coat is not diffuse but
clearly delimited and that the cell-free coat lining the immobilized COC matrix laterally
is very thin. Moreover, we found no significant cumulus free layer separating the
substrate from the cumulus-containing matrix. At first, the asymmetric distribution of
the cell-free coat – thick on the substrate-distal face, thin on the sides and virtually
absent on the substrate-proximal face of the COC – was surprising, as we expected the
unperturbed COC matrix to have roughly spherical symmetry. We reasoned that COC
immobilization somehow entails deformation of the cumulus-free matrix in the vicinity
of the substrate. Apparently, the multivalent binding between HA in the matrix and
CD44 on the substrate (Figure II.1A, inset), possibly in conjunction with the
gravitational forces exerted by the COC as a whole, are sufficiently strong to promote
collapse of the extremely soft substrate-proximal matrix. We also noticed that Hopt

Chapter II COC matrix micromechanics
60
measured across the oocyte (200 μm) was smaller than the lateral extension of the
cumulus-containing matrix (400 to 500 μm for in-vivo expanded matrix, and 300 to 400
μm for in-vitro expanded matrix), and that the lateral diameter of the zona pellucida in
immobilized COCs (~110 μm; Figure II.1B, left) was larger than what is typically
observed in free-floating COCs (~80 μm (204)). This suggests that immobilization also
deforms the cumulus-containing part of the matrix as well as the oocyte-surrounding
zona pellucida, though only moderately and to a much lesser extent than the cumulus-
free substrate-proximal parts. On the other hand, the thickness of the cumulus-free
substrate-distal part of the matrix (indicated by the length of the open bars in Figure
II.4A) was essentially constant within 150 μm from the oocyte center for in-vitro
expanded matrices and within 100 μm for in-vivo expanded matrices, suggesting that
this part of the matrix is largely unperturbed by the immobilization although its apparent
thickness could possibly be modified slightly by lateral matrix stretching upon
immobilization or by gravity acting on the cells.
To test the homogeneity of the COC matrix, we analyzed force curves taken between
0 and 150 μm from the oocyte centre (as well as 200 μm for in-vivo expanded matrix),
i.e. distances for which a matrix was clearly present (Figure II.4A), at a selected loading
rate (20 µm/s). Figure II.4C shows that both the Young’s modulus in the linear elastic
regime (δ < 10 μm; solid squares) and the effective modulus in the nonlinear elastic
regime at a selected indentation (δ = 30 μm; open circles) are virtually constant across
the COC matrix, for matrices expanded in vivo as well as in vitro. This suggests that the
matrix is homogeneous, and that the presumably stiffer oocyte does not affect the
measurements appreciably, consistent with expectations (205) based on the small
indentation depths used compared to total matrix thickness (< 20%). The decrease in E
and E’ at 200 μm for in-vivo expanded matrix (Figure II.4C, left) appears to be an
outlier. Figure II.4A shows that the COC thickness decreases rapidly beyond 200 µm
from the oocyte center. The measurements at the COC periphery are thus most likely
performed on a strongly tilted COC-solution interface, and we propose that this
effectively reduces the elastic modulus.
II.4 DISCUSSION
We have determined the most compliant parts of mouse COC matrix to have a
Young’s modulus below 1 Pa, and the effective elastic modulus to remain at a level of a
few Pa across the range of strains tested (up to about 10%; Figure II.3). Considering all

Chapter II COC matrix micromechanics
61
possible systematic errors described above, we estimate the modulus values to be
accurate to within a factor of two. To our knowledge, this is the lowest elastic modulus
thus far determined for any mammalian tissue (206). By comparison, brain which is
typically considered one of the softest tissues, has a value for Young’s modulus that is
approximately two orders of magnitudes higher than that of COC matrix (122). The
hyaluronan-rich glycocalyx lining the blood vessel endothelium is also considered very
soft, and a Young’s modulus in the range of a few 100 Pa has been reported on bovine
lung microvascular endothelial cells (123). Among the larger animal kingdom, even the
mostly acellular mesoglea of the jellyfish has local elastic modulus values that range
between a few 10 Pa and a few 100 Pa (198). Furthermore, as reported by Velegol and
Lanni (207), collagen gels formed in vitro at 0.5 mg/mL are predominantly elastic with
local elastic modulus values in the range of 1 Pa, we ourselves found films reconstituted
from hyaluronan and the matrix proteoglycan aggrecan (at 4 mg/mL total concentration)
to exhibit a Young’s modulus of a few 10 Pa (29), and others reported predominantly
elastic macroscopic hydrogels containing chemically cross-linked hyaluronan with
values of Young’s modulus below 100 Pa (117, 118, 129), thus demonstrating that
materials reconstituted from matrix molecules can also be very soft. Taken together,
these comparisons illustrate that COC matrix is extremely soft, and most likely the
predominantly elastic biological material with the lowest elastic modulus known to date.
To our knowledge, only a single study has hitherto reported a quantitative analysis of
COC elasticity. Dunn and Picologlou (195) stretched entire COCs by between 15 and
400% of the extension at rest, and found a linear elastic response over the entire
stretching range, with a Young’s modulus of 150 Pa. In marked contrast, the value for
Young’s modulus that we report in the present work is 2 to 3 orders of magnitude
smaller and our data showed that the COC matrix stiffens appreciably even at a few per
cent compression (Figure II.3). The discrepancy suggests that the two measurements
provide distinct information about COC matrix mechanics. On one hand, our AFM-
based micromechanical method is particularly sensitive to the cumulus-free soft outer
shell of the COC. In the macromechanical approach of Dunn and Picologlou, on the
other hand, the deformation of the inner and more rigid cumulus-containing part is
monitored and the cumulus-free shell is largely neglected. The two methods thus are
complementary, providing information about distinct parts of the COC matrix. We note
that Dunn and Picologlou studied rabbit COCs that were expanded in vivo but extracted
before ovulation, whereas our COCs were isolated from mice and were either expanded
Chapter II COC matrix micromechanics
62
in vivo and extracted after ovulation, or expanded in vitro. The differences in the animal
source and COC preparation might also contribute to the distinct results observed by us
and others. Future studies combining our micromechanical testing with frozen-cut COC
sections should reveal valuable details about the mechanical heterogeneity of the COC
matrix and the micromechanics of the inner parts of the COC matrix.
Previous studies have suggested that the COC matrix is a mesh-like network (109),
that is, effectively a cross-linked hydrogel. Here, we found that even the softest and
peripheral parts of COC matrix are predominantly elastic (Figure II.2). This extends
previous findings and indicates that the COC matrix is stably cross-linked throughout. It
has previously been demonstrated that hyaluronan together with the proteins TSG-6
(191) and pentraxin 3 (PTX3) (83) as well as the proteoglycan inter-α-inhibitor (IαI)
(190, 192) are essential for the stabilization of COC matrix, and sufficient to form a
cross-linked hydrogel (28). The exact molecular nature of the cross-links, however,
remains unknown. The elasticity of the COC matrix in our assays reveals that the cross-
links are sufficiently stable to resist breakage on the time scale of seconds and minutes.
The measured Young’s modulus can provide a first estimate of the mesh size of the
COC matrix. Specifically, for a homogeneous polymer meshwork that is dominated by
cross-links, the so-called correlation length ξ (a statistical measure of the distance
between segments on neighboring chains, or the effective mesh size) can be extracted
approximately from G ≈ kT/ξ3, where G represents the so-called plateau shear modulus,
and kT = 4.1 × 10⁻²¹
J is the thermal energy (175). From 12GE and E < 1 Pa,
we can estimate that the effective mesh size is on the order of a few 100 nm, i.e. the
softest parts of the COC matrix are likely to be very sparsely cross-linked. This value is
comparable to the correlation length reported for chondrocyte pericellular matrix (PCM)
based on optical force probe and particle exclusion assays (124). The PCM, like the
COC matrix, is rich in hyaluronan. However, the PCM’s overall topology must be
distinct from the COC matrix because its mechanical stability is not provided by cross-
links but by the tethering of long hyaluronan chains to the cell wall (124).
Interestingly, the mechanical response of in-vivo expanded COCs contains an
appreciable viscous contribution at low (< 5 µm/s) but not at high (> 5 µm/s) approach
speeds (Figure II.2C). The drainage of liquid through the hydrogel pores during
compression is a possible source of viscosity. Can poroelasticity explain our
experimental observation? In a scaling approximation, the time scale associated with the

Chapter II COC matrix micromechanics
63
liquid movement (the poroelastic time) is tp ≈ L2/Dp, where L is the length scale
associated with the indentation (L2 ≈ Rδ for a spherical indenter (208)) and Dp is the
poroelastic diffusion constant (Dp ≈ Edξ2/η, where Ed is the drained elastic modulus of
the hydrogel matrix and η is the viscosity of the draining solution) (209). With the
above scaling approximation for the correlation length ξ and Ed = 2Gd(1+µ), this gives tp
≈ Rδη/{Ed1/3
[2kT(1+µ)]2/3
}. The drained elastic modulus is a lower limit of the
measured value of Young’s modulus (Ed ≤ E < 1 Pa), and with η ≥ ηwater ≈ 1 mPa·s and
µ ≤ 0.5 we find tp 0.8 s δ/µm. For comparison, the experimental compression time
is tc ≈ δ/vc. Thus, tp/tc 0.8 at the lowest approach speed (vc = 1 µm/s), indicating that tp
and tc may well be comparable and that the appreciable viscous responses at lower
speeds arise from liquid drainage through the COC matrix. At the highest speed (20
µm/s), however, tp is much larger than tc, such that draining becomes negligible. The
values of Young’s modulus determined at higher speeds, therefore, represent the
elasticity of the un-drained matrix.
The clear segregation into a cumulus cell-containing inner part and a cumulus cell-
free outer shell (Figure II.4), as well as its marked stiffening in response to stress
(Figure II.3), indicate that the COC matrix is not a homogeneous structure. Specifically,
the mechanical properties of COC matrix suggest a heterogeneous network structure in
which mesh size increases with distance from the oocyte perimeter. Future studies that
measure the permeability of the COC matrix directly with probes of different size
should be useful in defining the sieving properties and the fine structure of the COC
matrix in more detail. In particular, it will be interesting to test if the COC matrix
exhibits a gradient of mesh size distribution similar to what was reported for the
chondrocyte PCM (124) despite the distinct topologies of these two hyaluronan
meshworks.
What are the functional implications of the COC matrix’ mechanical properties and
ultrastructure? An essential step in the reproductive process is the transport of the
ovulated COC along the ciliated oviduct, and pickup and transport of the COC are
tightly regulated by an interplay of mechanical and adhesive cues (51). It is clear that
the COC matrix, and in particular the outer cumulus cell-free layer, is extremely
deformable. Matrix size and shape can vary in a large range upon applied force, but the
original shape is fully restored once the mechanical perturbation is released (Figure
II.2A-B). This should ensure the COC’s structural and functional integrity throughout its
transport through the narrow oviduct. Moreover, the large size and the extreme softness

Chapter II COC matrix micromechanics
64
of the COC matrix’ outer shell might be a crucial ingredient for efficient capture and
subsequent transport by the beating cilia that line the oviduct. Additionally, it is
increasingly apparent that biological hydrogels function as selective diffusion barriers,
where both the physical constraints imposed by the hydrogel’s mesh size and specific
interactions with the hydrogel’s scaffold regulate macromolecular transport (210). In
this regard, it is possible that the heterogeneity of the COC matrix provides spatio-
temporal control over storage and access to signaling molecules and enzymes that are of
critical importance for proper oocyte development and fertilization. Given the large
mesh size of the HA matrix, physical constraints are probably of minor importance for
the distribution of such proteins. However, signaling proteins are known to bind to
matrix components such as the glycosaminoglycan chains on the proteoglycan versican,
and heterogeneities in the biochemical environment may thus produce strong effects.
In this study, we have defined for the first time a thick and soft matrix coat
surrounding the COC that is essentially free of cumulus cells (Figure II.4) – an
unexpected feature that has not been reported previously. Remarkably, the coat is much
less pronounced around in-vitro expanded matrix, indicating that the in vivo
environment provides unique cues that enable the formation of the cell free coat. Likely
antral granulosa cells, lining the antrum of the preovulatory follicle, contribute to this
difference. Indeed, these cells produce hyaluronan which likely becomes incorporated in
the cumulus matrix (85). In addition, granulosa cells produce the proteoglycan versican,
and versican binding to hyaluronan may well enhance the swelling of the outer coat
(211). At this point, we can only speculate about the biological role of the cumulus cell-
free coat. Early in vitro work (212) indicated that sperm recognize the interfacial zone
of COC matrix and respond by changes in their orientation and in the beating pattern of
their flagella. Moreover, a subpopulation of weakly motile sperm would not be capable
of penetrating into the matrix. This raises the possibility that the additional coat
discovered here is not only important for capture and transport of the ovum through the
oviduct, but that it also plays a role in the selection, capture and guidance of sperm
during fertilization. Clearly, there is a potential for comparative studies of sperm
interaction with in-vivo and in-vitro expanded COCs to provide further understanding of
the initiation of sperm penetration and to improve the efficiency of in-vitro fertilization
procedures. Moreover, comparative micromechanical studies of in-vivo and in-vitro
expanded COCs may help optimize oocyte IVM, a technique widely applied for the
breeding of agriculturally important species and proposed as an alternative treatment in

Chapter II COC matrix micromechanics
65
human assisted reproduction technology to circumvent the drawbacks of standard
ovarian stimulation regimens (213).
II.5 CONCLUSION
We have successfully quantified the micromechanical response of COC matrix to
compression by colloidal probe AFM. Owing to the nature of the COC matrix, it was
necessary for us to develop a tailored immobilization procedure and to adapt the size of
the colloidal probe. The matrix was confirmed to be elastic rather than plastic or viscous.
Salient features of the COC compressive mechanics are an extreme degree of softness
and a marked tendency to stiffen under stress. Through the combination of mechanical
and optical analysis, we could identify the presence of a thick cumulus free coat that is
particularly pronounced around in-vivo expanded matrix. The COC matrix
heterogeneity and the unique combination of elasticity and extreme softness may be
functionally important, in particular for the maintenance of COC integrity during
transport through the oviduct and for the proper selection, capture and guidance of
sperm. The methods we have established should also be valuable for characterization of
hyaluronan-rich matrices in a wide range of other cells and tissues.
II.6 SUPPORTING MATERIAL
Figure II.S1 Comparison of the Hertz model (solid line) (158) with the Sneddon model
(dashed line) (203). The latter is more accurate at large indentation, because it properly
considers sample deformation (214). Predictions are shown in terms of normalized force,
F* = F/(4R2E/3(1-µ
2)), vs. normalized indentation, δ* = δ/R > 0. At any given
indentation and fixed Young’s modulus, the Hertz model overestimates the force, and

Chapter II COC matrix micromechanics
66
this effect increases with δ approaching R. However, the discrepancy between the two
models remains small, i.e. below 10%, for all δ ≤ R.
Figure II.S2 Comparison of the Hertz model (solid line; approach and retract curves are
identical) with the Johnson-Kendall-Roberts (JKR) model (approach curve - dashed line,
retract curve - dotted line) (157) which includes the effect of adhesion forces (215).
Predictions are shown in terms of normalized force F* vs. normalized distance from
contact point at approach δ*, assuming a normalized adhesion force of F*ad = 0.1. In the
presence of adhesion, a jump in the force curve at negative indentation is expected. This
feature was found in the experimental retract curves but not in the approach curves (Fig.
1C), indicating that adhesion established gradually as the colloidal probe indented the
sample. The Hertz model therefore is expected to provide a reliable measure of the
Young’s modulus at small indentations (where adhesion is weak) and to underestimate
the elastic modulus E’ at large indentations (where adhesion is sizeable). The magnitude
of the adhesion force observed in our experimental retract curves was typically smaller
than the magnitude of the compression force at largest indentation. Based on a
numerical comparison of Hertz model and JKR model, one can show that, under this
condition, E’ is underestimated by less than 43%.

Chapter III HA brush mechanics and morphology
67
III Mechanical and structural properties of in-
vitro reconstituted HA brushes
The research work presented in this chapter is in preparation as a manuscript, for
submission to a peer reviewed journal, as:
Effect of calcium ions and pH on the morphology and mechanical properties of
hyaluronan brushes
Xinyue Chen,1,2
and Ralf P. Richter1,2,3
1 CIC biomaGUNE, San Sebastian, Spain;
2 Max-Planck-Institute for Intelligent Systems,
Stuttgart, Germany; 3 University Grenoble Alpes - CNRS, Laboratory of Interdisciplinary
Physics (LIPhy), Grenoble, France.
My contribution: I co-designed research (together with Ralf P. Richter) and performed
all experiments (in particular RICM and QCM-D measurements). I analysed and
interpreted the data (together with Ralf P. Richter). I prepared all figures and wrote the
first draft of the manuscript, as well as contributed to subsequent revisions.

Chapter III HA brush mechanics and morphology
68
Abstract: Hyaluronan (HA) is a linear, unbranched polysaccharide composed of
repeated disaccharide units. Playing as one of the chief components in peri- and
extracellular matrices, HA contributes significantly to many basic cellular processes.
Typically, the biological activity of HA is supported by the physico-chemical properties
of the supramolecular assemblies that it makes. To understand more comprehensively
the response of the supramolecular organization of HA polymers to changes in their
aqueous environment, we study the effects of Ca2+
concentration and pH on the
morphology and viscoelasticity of films of end-grafted HA polymers on planar supports
(HA brushes), as a well-defined in vitro model system of HA-rich matrices, by
reflection interference contrast microscopy (RICM) and quartz crystal microbalance
with dissipation monitoring (QCM-D). Our results reveal that both the thickness and
softness of HA brushes decrease significantly with Ca2+
concentration but do not change
with pH within the physiological ranges of these parameters. By studying a large range
of Ca2+
concentrations, we discovered that the effect of Ca2+
on HA brush thickness is
virtually identical to the effect of Na+ at 10-fold higher concentrations. Moreover, the
thickness and softness of HA brushes decreases appreciably upon protonation of HA at
pH values below 6. Importantly, effects of pH and calcium ions are fully reversible over
large parameter ranges. These findings are relevant for understanding the
supramolecular organization and dynamics of HA-rich matrices in biological systems
and potentially will also benefit the rational design of synthetic HA-rich materials with
tailored properties.

Chapter III HA brush mechanics and morphology
69
III.1 INTRODUCTION
As a chief component of extracellular matrix (ECM), hyaluronan (HA) is ubiquitous
in the extracellular space of vertebrates and plays various biological roles. It is a linear,
unbranched polysaccharide composed of identical disaccharide units containing
glucuronic acid and N-acetylglucosamine (11). Each disaccharide, which is 1.0 nm long
(13), carries one chargeable carboxylic group. The pKa of polymeric HA is
approximately 3, which implies that HA is negatively charged at physiological pH (14).
Cells use HA synthases (HASs) in the plasma membrane to synthesize HA and
extrude it into the extracellular space (18). HA molecules thus produced can reach a
very high molecular weight, up to millions of Daltons (11). HA can either be released
into the extracellular space, or remain grafted to the cell surface via HASs (18) or
otherwise attached through HA receptors, such as CD44 (23), to form so-called
pericellular coats (PCCs). HA-rich PCCs fulfil crucial functions in basic cellular
processes such as proliferation and migration (31), intercellular adhesion (32), and
mechanosensing (54). To modulate these functions, the morphology and physical
properties of HA-rich PCCs are remodelled by changes in the extracellular environment.
HA-binding proteins, for example, can induce condensation and rigidification (by cross-
linking, such as with the inflammation-associated protein TSG-6 (26)) or swelling of
HA-rich matrices (by intercalation of swollen proteoglycans such as aggrecan (29, 33)).
On a more basic level, the physico-chemical properties of the aqueous solution such as
pH and ionic strength also affect the properties of the HA and the assemblies that it
forms. This is not only relevant for the function of HA-rich matrices around cells and in
biological tissues, where changes in salt concentration and pH have been found to
modulate HA-related functions (216-219). Over the past decade, artificial HA-rich
matrices (116) and surface coatings (220) have also become popular in bioengineering
research. A good knowledge of the effect of pH and salts on the ultra-structure and
mechanical properties of HA-rich matrices is thus also important for technological
applications. Previous studies focussing on HA solutions have shown that besides
monovalent cations such as sodium (221, 222), divalent calcium ions and pH also
modulate the molecular structure and viscoelasticity of HA (126-128, 223-226). In
biological and synthetic materials, however, HA is confined by cross-linking (in
hydrogels) or by grafting or adsorption (in interfacial films), and there is still very

Chapter III HA brush mechanics and morphology
70
limited information about the impact of environmental conditions such as pH and salts
on such supramolecular HA assemblies.
Here, we study the effect of environmental conditions on films of HA polymers that
are grafted via their reducing end to a planar rigid support (Figure III.1A). These films
are less complex than native PCCs yet they reproduce salient features such as the
confinement of HA to a surface, the density of HA in PCCs and the typical thickness of
PCCs. Moreover, they are well defined in that the molecular weight and arrangement of
HA are tightly controlled. This enables highly quantitative studies and correlation with
polymer physics theory that would not be possible with native PCCs. If the surface
density of HA is high enough, then repulsion between neighbouring HA chains induces
their stretching away from the surface and the films thus formed are adequately
described as regular polyelectrolyte brushes. In previous work, we quantified the
mechanical properties of such HA brushes at physiological ionic strength and pH (130),
and also how the monovalent salt NaCl affects HA brush morphology and mechanical
properties (20). The latter study, in particular, revealed how the strong charge and the
intrinsic stiffness of HA lead to brush properties that are distinct from those observed
for synthetic polyelectrolytes. In the present study, we employ two surface-sensitive
analysis techniques, reflection interference contrast microscopy (RICM) and quartz
crystal microbalance with dissipation monitoring (QCM-D), to quantify the effects of
calcium ions and pH on the thickness and softness of HA brushes systematically over an
extensive parameter range, that is, calcium concentrations between 1 µM and 1 M, and
pH values between 1.0 and 9.0. The study sheds light on the effect of calcium and pH
on the supramolecular organization and physical properties of surface-confined HA
chains and highlights HA to be exquisitely responsive to these stimuli, both in terms of
the magnitude and the reversibility of the response.
III.2 EXPERIMENTAL SECTION
III.2.1 Materials
The oligo-ethylene glycol (OEG) solution was a mixture of 99% of 1 mM OEG thiol
(Mw 386.5 Da) and 1% of 1 mM biotinylated OEG thiol (788 Da; both from Polypure,
Oslo, Norway) in synthesis grade ethanol, stored in the dark at 4 °C. Lyophilized
streptavidin (SAv; 60 kDa; Sigma-Aldrich) was dissolved in ultrapure water. The stock
solution at 1 mg/mL was stored as aliquots at -20 °C. Before each measurement, the

Chapter III HA brush mechanics and morphology
71
SAv stock solution was centrifuged at 10,000 rpm and 4 °C for 10 min. Lyophilized
hyaluronan, biotinylated at its reducing end (b-HA) and with well-defined molecular
masses of 280 ± 14 kDa (Select-HA B250) and 58 ± 3 kDa (Select-HA B50), as well as
nonbiotinylated HA of 237 ± 12 kDa (Select-HA 250), were purchased from Hyalose
(Oklahoma City, USA). HA was suspended in ultrapure water at 1 mg/mL (HA) or 0.5
mg/mL (b-HA), gently shaken at 4 °C for 2 h for reconstitution, stored at -20 °C, and
used within one week after thawing.
All buffer and salt solutions were prepared in ultrapure water (resistance 18.2
MΩ/cm), and degassed before use. The sample preparation buffer contained 10 mM
HEPES and 150 mM NaCl at pH 7.4. NaCl and CaCl2·2H2O were from Sigma Aldrich.
Potassium phosphate solutions with pH values ranging from 9.0 to 5.0 were prepared by
mixing desired ratios of stock solutions, 100 mM KH2PO4 (Sigma Aldrich) and 50 mM
K2HPO4 (Fluka, Germany), prior to use. The potassium phosphate solution with pH 5.0
was further titrated by concentrated HCl (37%, reagent grade; Scharlab, Spain) to obtain
solutions with pH values down to 1.0.
Polystyrene microspheres with 23.7 ± 1.5 µm diameter (Polysciences, Hirschberg,
Germany) were washed in ethanol and ultrapure water, and stored at 4 °C in ultrapure
water.
III.2.2 Preparation of substrates
Glass cover slips (#1.5, 24 × 24 mm2; Menzel Gläser, Germany) were gently wiped
by lint-free tissue (Kimtech Science, Surrey, UK) and blow-cleaned with N2 gas before
immersion in freshly prepared piranha solution composed of concentrated H2SO4 (95%
to 98%; Scharlab, Spain) and H2O2 (50%; Scharlab, Spain) at a volume ratio of 3:1 for 3
h, thoroughly rinsed with ultrapure water, blow-dried with N2 gas and stored in sealed
petri dishes. To obtain gold (Au) coated substrates, clean glass cover slips underwent 10
min plasma cleaning in the vacuum chamber of the magnetron sputter system (ATC
1800 UHV; AJA International, Scituate, MA) before deposition of an adhesive titanium
(Ti; 0.5 nm) and a 5 nm Au layer. The layer thickness was determined from the
deposition rate which was calibrated by spectroscopic ellipsometry on reference silicon
wafers. Au-coated QCM-D sensors (QSX301; Biolin Scientific, Västra Frölunda,
Sweden) were rinsed with ethanol and ultrapure water and blow-dried with N2 gas. UV-
ozone treatment (ProCleaner; Bioforce Nanoscience, Ames, IA) was applied for 30 min
to all substrates prior to their further use.

Chapter III HA brush mechanics and morphology
72
III.2.3 Preparation of HA brushes
Cleaned gold-coated substrates were immersed in OEG solution overnight, rinsed by
ethanol and ultrapure water, blow-dried with N2 gas, installed in fluidic devices for
QCM-D and RICM, and covered with sample preparation buffer. The surfaces were
then sequentially exposed to SAv (20 µg/mL for 30 min) and b-HA (5 µg/mL for QCM-
D and 20 µg/mL for RICM, both for 2 h) in sample preparation buffer, with each
incubation step followed by abundant rinsing to remove excess molecules from the
solution phase.
III.2.4 Quartz crystal microbalance with dissipation monitoring
QCM-D measures the changes in resonance frequency, Δf, and dissipation, ΔD, of a
sensor crystal upon molecular binding and reorganization events on its surface. The
QCM-D response is sensitive to the mass (including hydrodynamically coupled water)
and the mechanical properties of the surface-bound layer. Measurements were
performed with a Q-Sense E4 system (Biolin Scientific) in flow mode (5 to 20 µL/min,
adjusted with a syringe pump; KD Scientific, Holliston, MA) at a working temperature
of 24 °C on Au-coated QCM-D sensors with an OEG monolayer. Changes in frequency
(∆fi) and dissipation (∆Di) were collected at 6 overtones (i = 3, 5, 7, 9, 11, 13,
corresponding to resonance frequencies of fi ≈ 15, 25, 35, 45, 55, 65 MHz); for
simplicity, only selected overtones (i = 3, 7, 11) are presented. As controls,
measurements were also performed on surfaces covered by SAv, with or without 10
µg/mL of non-biotinylated HA in the ambient solution.
III.2.5 Reflection interference contrast microscopy
For RICM, we used fluidic chambers in the form of cylindrical open cuvettes (5 mm
diameter) made from a tailored Teflon holder and a glass cover slip at the bottom, glued
together with two-component glue (Twinsil; Picodent, Germany). Cuvettes were used
with a liquid volume of 50 µL. Samples were injected and the solution rapidly
homogenized with a pipette. Samples were removed from the solution phase by
repeated dilution and aspiration of the cuvette content until a concentration reduction of
at least 105 fold was reached. Care was taken to keep the glass cover slip wet throughout
all solution exchanges. A separate cuvette was used to test for the effect of each salt
(CaCl2 or NaCl) concentration or pH on HA brush thickness. Polystyrene microspheres
for RICM analysis were added 15 min after incubation of a given test solution.

Chapter III HA brush mechanics and morphology
73
Interferographs were obtained with an inverted microscope (Axio Observer Z1;
Zeiss, Oberkochen, Germany) in epi-illumination reflection mode, using a XBO xenon
short-arc lamp as light source, an antiflex oil immersion objective (EC Plan Neofluar
Antiflex 63×/1.25; Zeiss) and a filter cube with two crossed polarizers (AHF
Analysentechnik, Germany).(169) The reflected light passed through a custom-built
beam splitter unit(130) with band pass filters which in combination with two CCD
cameras (ORCA-ER; Hamamatsu Photonics, France) permitted simultaneous
acquisition of interferographs at wavelengths λ = 630 nm, 546 nm and 490 nm. The
opening of the aperture diaphragm was reduced to its minimum throughout all
measurements.
To quantify the distance between the polystyrene sphere and the substrate surface,
we adapted a previously established algorithm implemented in Matlab (130). Briefly,
the method is based on the determination of the position of extrema in the radial
intensity profile of interferographs (169), and has an estimated accuracy of 5 nm. The
method was here adapted to account for the presence of the metallic coating and the
OEG and SAv layers, and the revised method includes reference measurements on bare
Au-coated substrates, and on substrates coated with OEG and SAv monolayers (see
Supplementary Methods and Figure III.S1). Unless otherwise stated, 10 polystyrene
beads were analyzed per sample, and mean distances standard deviation were used for
further analysis.
III.3 RESULTS
III.3.1 Assembly of HA brushes
Hyaluronan brushes were formed, as schematically shown in Figure III.1A, by
grafting of HA with well-defined molecular weight (280 14 kDa) via a biotin at the
reducing end to a monolayer of streptavidin supported by a biotinylated thiol-OEG-
monolayer on gold. This approach has been established previously (26, 144). Quartz
crystal microbalance with dissipation monitoring (QCM-D) was used to follow the main
assembly steps (Figure III.1B). To a first approximation, a decrease in frequency shift
∆f indicates an increase in the surface-bound mass (including hydrodynamically
coupled water), whereas the dissipation shift ∆D reflects the softness of the surface-
associated film (144).
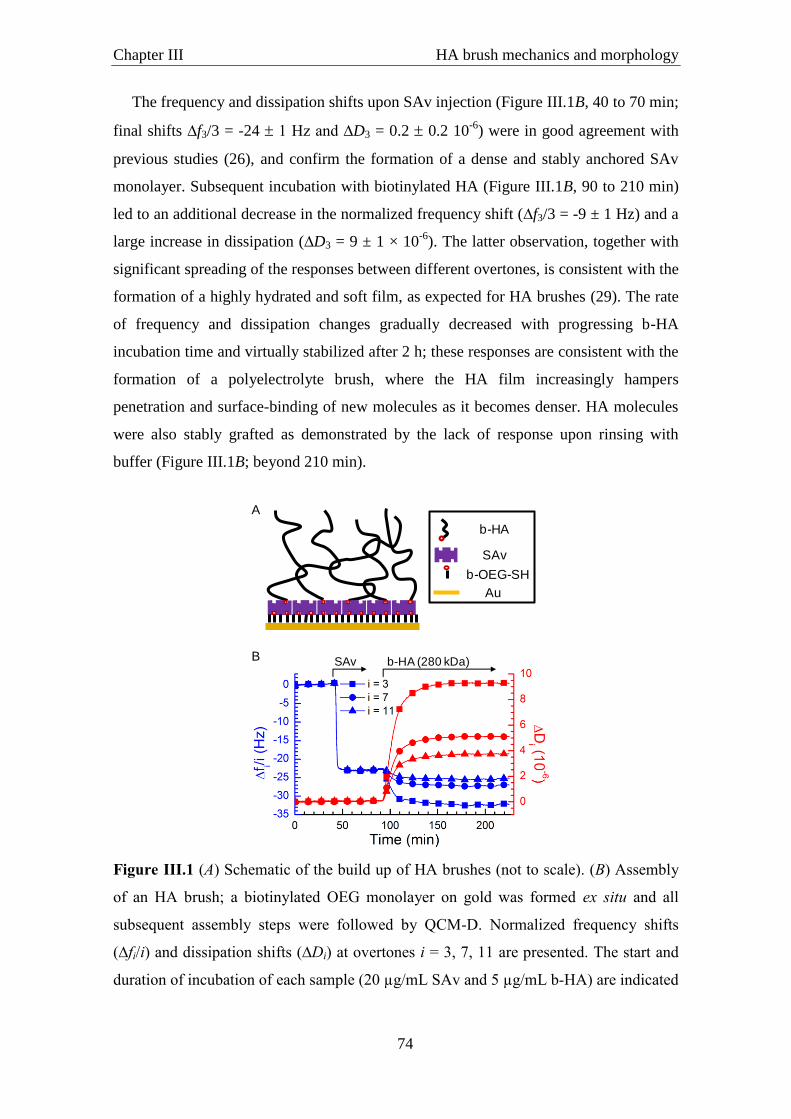
Chapter III HA brush mechanics and morphology
74
The frequency and dissipation shifts upon SAv injection (Figure III.1B, 40 to 70 min;
final shifts ∆f3/3 = -24 1 Hz and ∆D3 = 0.2 0.2 10-6
) were in good agreement with
previous studies (26), and confirm the formation of a dense and stably anchored SAv
monolayer. Subsequent incubation with biotinylated HA (Figure III.1B, 90 to 210 min)
led to an additional decrease in the normalized frequency shift (∆f3/3 = -9 ± 1 Hz) and a
large increase in dissipation (∆D3 = 9 ± 1 × 10⁻⁶
). The latter observation, together with
significant spreading of the responses between different overtones, is consistent with the
formation of a highly hydrated and soft film, as expected for HA brushes (29). The rate
of frequency and dissipation changes gradually decreased with progressing b-HA
incubation time and virtually stabilized after 2 h; these responses are consistent with the
formation of a polyelectrolyte brush, where the HA film increasingly hampers
penetration and surface-binding of new molecules as it becomes denser. HA molecules
were also stably grafted as demonstrated by the lack of response upon rinsing with
buffer (Figure III.1B; beyond 210 min).
Figure III.1 (A) Schematic of the build up of HA brushes (not to scale). (B) Assembly
of an HA brush; a biotinylated OEG monolayer on gold was formed ex situ and all
subsequent assembly steps were followed by QCM-D. Normalized frequency shifts
(∆fi/i) and dissipation shifts (∆Di) at overtones i = 3, 7, 11 are presented. The start and
duration of incubation of each sample (20 µg/mL SAv and 5 µg/mL b-HA) are indicated
SAv b-HA (280 kDa)
A
B
SAv
b-HA
Au
b-OEG-SH

Chapter III HA brush mechanics and morphology
75
by arrows on top; during remaining times, the surface was exposed to sample
preparation buffer (10 mM HEPES, 150 mM NaCl, pH 7.4).
III.3.2 HA film thickness, response to NaCl, and grafting density
Colloidal probe reflection interference contrast microscopy (RICM) was used to
quantify the thickness of the HA film. The method measures the distance between a
colloidal sphere and a planar transparent substrate (169), with a resolution of a few
nanometers by the analysis of interference patterns arising from partial reflection of
light at the interfaces between the planar SAv-covered substrate and the solution, and
between the solution and the colloidal probe. Analogous to previous work by us and
others (144, 227), we used triple wavelength RICM to unambiguously resolve the
thickness over a range of 1 µm, but we here refined the analysis method to account for
the presence of the semi-transparent gold coating and the OEG and SAv layers (see
Supplementary Methods and Figure III.S1).
The mean thickness of the HA film in sample preparation buffer (i.e. with
physiological ionic strength and pH) was 207 nm. The standard deviation across 10
colloidal probes randomly positioned on the same surface was typically 10 nm, and
the standard deviation of the mean values of 5 measurements on independently prepared
HA films was 5 nm. This demonstrates that the HA brushes are laterally
homogeneous and that their preparation is reproducible. With a contour length of 1.0
nm per disaccharide (13) and a molecular mass of 401 Da (including the Na+
counterion) per disaccharide, the contour length of 280 14 kDa HA is lc = 698 35
nm, and at physiological ionic strength, an unperturbed HA chain of this length is
expected to form a random coil with a radius of gyration of Rg ≈ 40 nm (228). The HA
chains are thus significantly stretched compared to their dimensions in solution,
confirming that a polyelectrolyte brush is effectively formed.
To further validate the integrity of the HA brush, we quantified the brush thickness
as a function of NaCl concentration. We have previously reported a detailed analysis of
such a dependence for brushes of HA with a distinct molecular weight (1083 kDa) (20),
which serves as a benchmark for the present work. The distance H between polystyrene
spheres floating on the HA brush and the SAv-coated substrate was again used as an
approximate measure of the brush thickness, and the results are shown in Figure III.2A
(red line with solid circles). Consistent with our previous findings (20), H decreased
monotonically with increasing NaCl concentration. The shape of the curve was

Chapter III HA brush mechanics and morphology
76
qualitatively consistent with theoretical predictions for brushes of strongly charged
polyelectrolytes (177-179). Specifically, at low ionic strength ([NaCl] ≤ 0.5 mM) the
measured thickness varied only weakly, and this regime corresponds to the “osmotic
brush” regime (179) where the brush thickness is determined by the balance of the
osmotic pressure of counterions trapped in the brush and the entropy of chain stretching
(177). At higher ionic strengths (1 mM ≤ [NaCl] ≤ 1000 mM), salt screens the
electrostatic interactions (“salted brush” regime) (179) and leads to a progressive
decrease in brush thickness. At very high ionic strength, it is expected that the screening
becomes so strong that the excluded volume repulsion of the uncharged polymer
backbone (intrinsic excluded volume) dominates the brush behaviour and the
dependence on ionic strength again weakens. This “quasi-neutral” brush regime is
barely reached in the experiment presented here. We note that the slope for the salted
brush regime in the log-log plot is -0.22, which deviates from the power of -1/3
expected by simple theory (177-179). We had previously demonstrated that the apparent
attenuation of the salt dependence compared to the theoretical prediction is expected
and due to two distinct effects (20): towards low ionic strength, HA brushes become
strongly stretched (with H/lc larger than 0.5) and the resistance to stretching thus
becomes stronger than what is predicted according to the Gaussian chain approximation
used in the theory; towards high ionic strength, on the other hand, the intrinsic excluded
volume of the uncharged polymer backbone, which is positive for HA but not
considered in the scaling theory, increasingly contributes to inter-chain repulsion and
thus limits the screening effect of the salt.
In our previous work, we also showed that the combined effect of intrinsic excluded
volume and electrostatic repulsion on HA brush morphology can be quantitatively
reproduced in the limit of high ionic strength (NaCl ≥ 50 mM) with an analytical self-
consistent mean-field theory (20). With this approach, we can estimate the grafting
density of the HA brush studied here (Supporting Figure III.S2), and the root-mean-
square (rms) distance between anchor points is s ≈ 47 nm. From the HA molecular
weight, the brush thickness and the grafting density, one can estimate the concentration
of chargeable groups in the HA brush to match the concentration of added salt at around
0.8 mM NaCl. This value is consistent with the transition between the osmotic and
salted brush regimes identified above.
Detailed inspection of the bead-substrate distances H in Figure III.2A reveals that
these exceed the contour length of the HA chain without added salt or at very low NaCl

Chapter III HA brush mechanics and morphology
77
concentrations. Specifically, in ultrapure water, H exceeded lc by approximately 260 nm.
This result was unexpected and was not observed in the earlier study with HA brushes
made from approximately 4 times larger HA chains (20). On the other hand, we found
the bead-substrate distance on HA brushes made from smaller HA chains (58 3 kDa)
to be 579 8 nm in ultrapure water, that is, the discrepancy with the contour length
(145 7 nm) is even larger than in the case of 280 kDa b-HA. Clearly, the polystyrene
bead hovers at a certain distance above the HA brush and we propose that this is due to
repulsive electrostatic interactions between the negatively charged polystyrene bead and
an excess negative charge displayed by the HA brush. The grafting density of the HA
brush is expected to increase with decreasing HA size in our assays, because the kinetic
limitations associated with brush formation becomes less severe for shorter chains (229).
The stretching of the HA chains and also the excess charge of the brush would increase
with grafting density, and the thickness trends as a function of HA molecular weight
would thus be consistent with such a scenario.
Our finding thus indicates that H can significantly overestimate the brush thickness
in the limit of low ionic strength. A quantitative estimation of the magnitude of the
discrepancy appears difficult, because we lack the surface charge density on the
colloidal sphere. However, with increasing salt concentration, the charges are screened,
and we thus expect that the error is progressively decreasing as salt is added. At the
same time, the colloidal probe will exert some pressure on the brush due to gravitation
and H may thus effectively underestimate the thickness of the unperturbed brush.
However, the forces acting on the brushes are small, less than 4 pN considering that
gravitational forces are offset by buoyancy, and we thus estimate this effect to be small
(20).
III.3.3 Impact of calcium ions on HA films
III.3.3.i Morphology
We used colloidal probe RICM to analyze the impact of CaCl2 on HA film thickness
(Figure III.2A, black line with squares). As for NaCl, the HA film thickness decreased
monotonically with increasing CaCl2 concentration, with the salt dependence being
most pronounced at intermediate ionic strengths (0.1 mM ≤ [NaCl] ≤ 100 mM) and a
trend towards plateaus at higher and lower ionic strengths. Over the entire range of
CaCl2 concentrations, the film thickness was reproducible to within a few nanometres
across the measured surfaces, and the film thickness remained well above the rms

Chapter III HA brush mechanics and morphology
78
distance between grafting points. This reveals that the HA polymers retain their
hydrated and stretched, brush-like conformation even at the highest CaCl2 concentration.
Closer inspection revealed a high degree of similarity in the responses of HA brushes
to the two salts. The curves for CaCl2 and NaCl could be virtually overlaid on a single
master curve through a simple re-scaling of the CaCl2 concentration by a factor of 10
(Figure III.2B). This indicates that the effect of calcium ions on the interaction between
HA chains in the brush, and apparently also the repulsion between the HA brush and the
colloidal probe in the limit of low ionic strength, is equivalent to the effect of sodium
ions at 10-fold higher concentration. Considering that the two anions have different
valency, this simple scaling is remarkable and not trivial.
Figure III.2 Effect of sodium and calcium ions on HA brush thickness. (A) The
distance H of colloidal probes (polystyrene beads, around 24 µm diameter, hovering on
top of HA brushes due to gravitation) from the SAv-coated substrate was quantified by
RICM and is a measure of the HA film thickness. HA brushes were prepared as shown
in Figure III.1B, and data represent means and standard deviations from two
independent experiments. Next to CaCl2 (black squares), results for NaCl (red circles)
are also shown, together with results in ultrapure water without added salt (mQ). (B)
Both data sets superpose when the salt concentration is re-scaled, by multiplication with

Chapter III HA brush mechanics and morphology
79
λ = 1 for NaCl and λ = 10 for CaCl2. The three canonical brush regimes – osmotic,
salted and quasi-neutral – can be identified and are indicated with the coloured
background.
III.3.3.ii Visco-elastic properties
The effect of Ca2+
on the visco-elastic properties of HA brushes was characterized by
QCM-D. To this end, frequency and dissipation shifts upon variation of the ambient
CaCl2 concentration were monitored on HA brushes (Supporting Figure III.S3A) as well
as reference surfaces (bare SAv without HA; Supporting Figure III.S3B). By subtracting
the responses on the reference surfaces from those on the HA brushes, the effect of the
HA brush could be discriminated from the effects of the ions on the density and
viscosity of the solution phase, to which the QCM-D is also sensitive. These data are
shown in Figure III.3A-B. In addition, we also examined over the full range of CaCl2
concentrations if non-biotinylated HA polymers (237 12 kDa, at 10 µg/mL) bind to
the reference surface (Supporting Figure III.S3C), and these effects are shown as insets
in Figure III.3A-B. Figure III.3C shows the ratio of dissipation and frequency shifts
ΔDi/(-Δfi/i). This parameter is related to the mechanical properties of the surface-
confined films. For very thin films, this parameter is proportional to the elastic
compliance, a measure of film softness (161). The HA films studied here are too thick
for this proportionality to hold, and the parameter should thus be considered an effective
and relative measure of HA brush softness. Overall, the film softness decreased with
increasing calcium concentration, a trend that is expected as the salt-induced contraction
of the HA brush (Figure III.2) makes the film denser. The dependence is monotonous
except for a shallow local minimum around 2 mM CaCl2. At this salt concentration, we
also found HA to show minor yet significant non-specific interaction with the SAv
substrate which was not present at lower and higher ionic strengths (Figure III.3A,
inset). The local minimum in the softness parameter, therefore, most likely is the
consequence of a slight perturbation of the HA brush morphology by binding of a
fraction of the HA chains to the SAv substrate in addition to the biotin anchorage. It is
also notable that the softness parameter (Figure III.3C) does not show the pronounced
sigmoidal dependence on the calcium concentration that we had observed for the HA
brush thickness (Figure III.2). In particular, the rapid decrease in softness in the low
ionic strength regime (osmotic brush) suggests that the mechanical properties of the HA

Chapter III HA brush mechanics and morphology
80
brush are sensitive to ionic strength in the osmotic brush regime even though the
thickness remains roughly unchanged.
We also note that the effect of calcium on the HA brushes was fully reversibly for
most of the calcium concentrations investigated, that is, QCM-D responses in ultrapure
water before and after exposure to each calcium concentration were comparable
(Supporting Figure III.S3A). Exceptions in this regard were the highest calcium
concentrations ( 100 mM), for which a fraction of the frequency and dissipation shifts
was not recovered upon rinsing in ultrapure water, as shown in detail in Supporting
Figure III.S4. Apparently, very high calcium concentrations can promote irreversible
(though minor) changes to the HA brush.

Chapter III HA brush mechanics and morphology
81
Figure III.3 Effect of calcium ions on HA brush rigidity, characterized by QCM-D.
Normalized frequency shifts (Δfi/i; A), dissipation shifts (ΔDi; B) and softness parameter
(ΔDi/(-Δfi/i); C) are displayed for selected overtones (i = 3, 7 and 11, as indicated in C).
HA brushes were prepared as in Figure III.1B, and data represent responses at
equilibrium of the HA film compared to a reference SAv monolayer film as a function
of the CaCl2 concentration in ultrapure water (see Supporting Figure III.S3 for details;
data in ultrapure water without added salt are also shown, as mQ). Responses upon
exposure of non-biotinylated HA (10 µg/mL) to the SAv monolayer are shown for
comparison in the insets in A and B; these show minor non-specific binding at
A
B
C

Chapter III HA brush mechanics and morphology
82
intermediate CaCl2 concentrations and correlate with transient minima in the frequency
shifts for the HA brush. The softness parameter indicates HA brush stiffening with
CaCl2 concentration.
III.3.4 Impact of pH on HA films
III.3.4.i Morphology
The effect of pH on the thickness of HA brushes was again characterized by RICM
(Figure III.4A). We used potassium phosphate as buffering agent throughout, to avoid
any effects due to variations in cation species or concentration. Phosphate buffer has
pKa values of 2.1, 7.2 and 12.3 (230), and we found the buffering capacity at a
concentration of 100 mM K+ to be satisfactory over the tested pH range (1.0 to 9.0).
Over a broad range around neutral pH (6.0 ≤ pH ≤ 9.0), H remained virtually
constant at 216 7 nm. This value matches the results for 100 mM NaCl (206 7 nm;
Figure III.2), indicating that potassium and sodium have very similar effects on the HA
brush. The mean H decreased by roughly two-fold between pH 6.0 to pH 3.0, and then
remained roughly constant down to pH 1.0. The carboxyl groups in HA have a pKa
around 3 (14), and the reduction in film thickness is thus likely due to the protonation of
carboxyl groups and loss of the polyelectrolyte character of the HA chains.
It is notable that the standard deviations in H increased markedly at pH values ≤ 5
(Figure III.4A). This indicates that the HA film loses its homogeneity under strongly
acidic conditions, and instead forms a film that is heterogeneous on a scale comparable
to or larger than the size of the colloidal probe. Circumstantial evidence for the presence
of microscale heterogeneities also comes from interferographs taken on HA films in the
absence of a colloidal probe. These revealed a distinctive pattern at pH 1.5 that was not
(or only faintly) visible at pH values larger than 3 (Figure III.4B). The contrast and
spatial resolution of the interferographs are too low to assign a specific structure.
However, the fact that we observe heterogeneities indicates that protonated HA
becomes sticky, and we tentatively propose that the patterns arise from the clustering of
sticky HA polymers into microdomains as schematically indicated in Figure III.4C. The
formation of microphases is indeed predicted by theory (231, 232) and was
experimentally observed for other polymer brushes (180).

Chapter III HA brush mechanics and morphology
83
Figure III.4 (A) Effect of pH on HA film thickness, quantified by RICM analogous to
Figure III.2. Two independent experiments are shown, with means and standard
deviations from measurements at 10 different positions per sample. (B) Representative
interferographs (w/o colloidal probe) of patterns on a substrate with HA film in the
presence of pH 3 (left) and pH 1.5 (right). The contrast of both images was adjusted
consistently, and interferographs acquired at pH > 3 were comparable to what is shown
here for pH 3. Interferographs at pH 1.5 reveal a distinctive pattern, that is not (or only
faintly) visible at pH 3. (C) Schematic of the hypothesised microphase formation in
end-grafted HA films at low pH (not to scale).
III.3.4.ii Visco-elastic properties
QCM-D was again used to study the influence of pH on HA film softness (Figures
III.S5 and 5) following the method used for the characterization of the effect of CaCl2
solutions (Figures III.S3 and 3). The softness parameter (Figure III.5C) was not
sensitive to pH between pH 6.0 and 9.0, but decreased substantially at lower pH values.
1 2 3 4 5 6 7 8 90
50
100
150
200
250
H (
nm
)
pH
A
C
SAv HAAu with OEG coating
B
5 μmpH 1.5pH 3.0

Chapter III HA brush mechanics and morphology
84
The most rigid films (i.e. with the smallest softness parameter) occurred at pH 2.5. At
the lowest pH values (≤ 2.0) the HA films became again somewhat softer but clearly
remained more rigid than at neutral pH. The effect of pH changes on HA brushes was
fully reversible over the large range of pH variations studied, indicating that pH can be
used for the reversible switching of HA brush properties. Notably, we did not find any
indications for the degradation of HA upon exposure to pH down to 1.0, in contrast to
some earlier reports studying HA in the solution phase (225, 226, 233).
It is notable that HA polymers also showed rather strong non-specific binding to the
SAv-coated substrate for pH values ranging between 2.5 and 4.0, whereas no such
binding was detectable at lower and higher pH values (Figure III.5A-B, insets). The
electrostatic potential of SAv is positive below pH 6 (234), and attractive electrostatic
interactions between the (partially) de-protonated HA and the acidic SAv may well be
responsible for the selective non-specific binding of HA between pH 2.5 and 4.0.
Moreover, it is likely that the transient minimum in the softness parameter at pH 2.5
arises from a combination of reduced inter-HA-chain repulsion (due to HA protonation)
and HA-substrate attraction, whereas the values measured at pH 1.0 and 1.5 may well
represent the genuine softness of the fully protonated HA brush (in the absence of
attractive HA-substrate interactions).

Chapter III HA brush mechanics and morphology
85
Figure III.5 Effect of pH on HA brush rigidity, characterized by QCM-D. Data are
displayed analogous to Figure III.3, in potassium phosphate buffer (containing 100 mM
potassium) at various pH. The insets in A and B show strong non-specific binding of
non-biotinylated HA at pH 4.0, 3.0 and 2.5. The softness parameter indicates that HA
brush stiffening is most pronounced at these pH values.
III.4 DISCUSSION
On the qualitative level, the results of our systematic analysis of the response of HA
brushes to calcium ions and pH are largely in line with the known properties of HA in
the solution phase. In particular, the response of HA brushes to sodium and calcium
ions (Figure III.2) confirms that HA around neutral pH behaves as a strongly charged
A
B
C
Chapter III HA brush mechanics and morphology
86
and semi-flexible polyelectrolyte in good solvent (we here refer to strongly charged as
all chargeable groups being charged irrespective of the ionic strength of the medium,
and to semi-flexible as the statistical polymer segment length being much larger than
the size of the chemical monomer). Moreover, a ‘putty’ gel state has been reported for
HA solutions around pH 2.5 (225, 235, 236), and the collapse of HA brushes at low pH
(Figure III.4A), accompanied by microphase formation (Figure III.4B-C) and film
rigidification (Figure III.5), would be consistent with a transition from repulsive to
attractive inter- and intra-chain interactions upon HA protonation.
On the quantitative level, a striking observation that to the best of our knowledge has
not previously been reported is that divalent calcium ions affect the HA brush thickness
in much the same way as monovalent sodium ions do at tenfold higher concentrations.
Can we explain such a similar behaviour? It is well known that divalent ions are more
effective than monovalent ions in screening electrostatic interactions, and thus not
surprising that calcium ions have the same effect at a lower concentration than sodium
ions. However, it remains unclear why the factor of potentiation is around 10, and the
divalent ions may well affect the measured brush thickness (Figure III.2B) by distinct
mechanisms in the different brush regimes. First, divalent counterions can decrease the
surface potential more dramatically compared to monovalent ions (237), or may even
decrease the surface charge more effectively by counterion condensation. This would
result in a decrease in the electrostatic repulsion between the HA brush and the surface
of the polystyrene bead, which we have seen to be important at low ionic strength.
Second, for a polyelectrolyte brush in the osmotic regime, the brush morphology has
been predicted to be sensitive to the valency of added ions (238): ions with multiple
charges can substitute several monovalent ions, thus reducing the number of mobile
counterions that is necessary to compensate the polymer charge within the brush and
thereby diminishing the osmotic pressure of the counterion gas. Specifically, with
calcium and sodium having valencies of zCa = 2 and zNa = 1, respectively, the brush
thickness would be expected to decrease by a factor of for divalent
counterions compared to monovalent counterions at the same molar ion concentration
(239). Our experimental data at 0.1 mM and 0.5 mM added salt showed a decrease in H
by 1.3 and 1.5, respectively, which is in reasonably good agreement with the theoretical
prediction. Third, the thickness of a polyelectrolyte brush is expected to scale with the
Debye screening length -1 as H ~ -2/3
in the salted regime if the thickness changes

Chapter III HA brush mechanics and morphology
87
were solely driven by electrostatic screening by free ions in the solution phase (239).
The Debye length scales as and as ,(237) and
consequently, a reduction in thickness by a factor of would be
expected when replacing NaCl by CaCl2 at a given salt concentration. Inspection of
Figure III.2A reveals that the factor is significantly larger in our experiments (1.6 0.1
between 1 and 50 mM salt). Equivalently, the scaling predicts that CaCl2 has the same
screening effect as NaCl at a concentration that is increased by a factor of
. This is clearly smaller than the factor of 10 obtained in our
experiments, indicating that additional effects must also play a role. Possible
mechanisms are a reduced polymer charge due to condensation of calcium ions on the
HA chains, and potentially also the bridging of carboxylic groups on HA owing to the
bivalency of the calcium ions (240). Taken together, the mechanisms underlying the
tenfold potentiation of calcium over sodium ions with regard to brush thickness
variations remains to be further elucidated. Future comparative studies with different
divalent ions, and possibly also monovalent and trivalent ions, may help resolving this
question.
On one hand, the results of the present study are relevant for rationalizing the basic
physical properties of HA-rich matrices in biological systems. We learn that protonation
of carboxyl groups affects HA brush morphology and mechanical properties only at pH
values below 6.0 and is thus unlikely to be relevant under physiological conditions. The
presence of a few mM calcium ions in the extracellular space, on the other hand, should
impact the properties of HA-rich matrices appreciably already via simple physical
effects related to the screening of charges. Naturally, the situation in native HA-rich
matrices will be more complex, for example, because HA-binding and other proteins
also contribute to defining matrix assembly and dynamic reorganization, and their
function may also be modulated by calcium ions. However, the simplified yet well-
defined model system studied here provides an idea of the magnitude of effects that can
occur and provides a reference for studies with more complex systems.
On the other hand, our results provide information that should be useful for the
rational design of HA-based materials with tailored properties. Here, HA brushes appear
particularly attractive for the development of stimuli-responsive surface coatings: it
combines a large dynamic range – such as a fivefold thickness change in response to
ions (Figure III.2) and a twofold thickness change in response to pH (Figure III.4) –

Chapter III HA brush mechanics and morphology
88
with a high degree of reversibility in the morphological changes, thus allowing for
strong and repeatable switching by external stimuli. Changes in thickness can be
exploited directly as a readout, or as a mechanical actuator, for sensing applications.
Associated changes in brush concentration and hence physical properties such as
viscoelasticity (Figures III.3 and 5) or permeability could also be exploited for
applications. An important parameter defining permeability is the correlation length ξ, a
statistical measure of the distance between segments on neighbouring chains (175). In
homogeneous meshworks of flexible polymers, the correlation length is an effective
measure for the mesh size, and in good solvent it is predicted to decrease with polymer
concentration c with a power of -3/4 (174). For a given HA brush (i.e. at constant
grafting density), we have thus ξ ~ c-3/4
~ H-3/4
to a first approximation, and a fivefold
reduction in brush thickness would thus entail a more than threefold reduction in the
size of particles that can effectively permeate the HA film.
III.5 CONCLUSIONS
In this work, we have systematically analyzed the variations in thickness (by
colloidal probe RICM) and softness (by QCM-D) of HA brushes over a broad range of
Ca2+
concentrations and pH. Within the physiologically relevant ranges of these two
parameters, we found the softness and thickness of HA brushes to be exquisitely
sensitive to Ca2+
concentrations but essentially insensitive to pH. More broadly, we
discovered that the effect of divalent calcium ions on HA brush thickness is virtually
identical to the effect of monovalent sodium ions at 10-fold higher concentrations, and
that HA brushes collapse upon protonation below pH 6.0. Our findings are relevant for
understanding the supramolecular organization and dynamics of HA-rich matrices in
biological systems and potentially will also benefit the rational design of synthetic HA-
rich materials with tailored properties.
III.6 SUPPORTING MATERIAL
III.6.1 Refinement of the colloidal probe RICM analysis for coated
glass substrates
In previous work (130), we found an algorithm that is based on the quantification of
the radial position of intensity extrema in colloidal probe interferographs (130, 169) to
work well for quantifying the thickness of HA brushes formed on bare glass. In the
present work, HA brushes were formed on glass that was coated with a thin metal film.

Chapter III HA brush mechanics and morphology
89
In the following, we show that the established method can also be applied on metal-
coated glass with a simple modification.
We follow textbook knowledge (241) to describe the interference of light following
transmission and reflection at multiple interfaces (Figure III.S1A). For two parallel
interfaces – formed by medium 0, an interlayer of medium 1, and medium 2 – the total
reflectance R, which determines the reflected intensity Ireflection for a given intensity
Iincidence of the incident light, is given by
2
012/ rIIR incidencereflection , (Eq. 1)
where r012 presents the total effective reflection coefficient. This coefficient takes all
light beams reflected back into medium 0 into account (Figure III.S1A) and is given by
]2exp1/[]2exp[ 1201120101
6
12
2
101001
4
12101001
2
12100101012
irrirrr
errtterrtterttrr iii
, (Eq. 2)
where rxy and txy are the local reflection and transmission coefficients at the interface
between media x and y. The phase variation between two contiguous outcoming beams
is constant. Assuming to a first approximation that light is incident perpendicular to the
substrate, it is expressed as
/2 1dñ , (Eq. 3)
where 1ñ and d are the complex refractive index and the thickness of the interlayer, and
λ is the wavelength of the incident light. Both reflection and transmission coefficients
are then easily determined as
)/()( yxyxxy ññññr and xyxy rt 1 . (Eq. 4)
The complex refractive index, expressed as
/2 kinñ , (Eq. 5)
considers the refractive index n and the extinction coefficient k, and thus is appropriate
for fully transparent layers (such as glass or the solution) as well as light-absorbing
layers (such as Au).
The case of two interlayers can be reduced to the case of one interlayer (Figure
III.S1B), that is, the effective reflection coefficient r123 of a system consisting of media
1, 2 and 3 can first be determined by the approach described above, and then integrated
with medium 0 by treating the two interlayers (made of media 1 and 2) as a single layer
with effective optical properties. The total effective reflection coefficient is then

Chapter III HA brush mechanics and morphology
90
]2exp1/[]2exp[ 1230112301010123 irrirrrr . (Eq. 6)
This method can be further expanded for more interlayers.
To reproduce our experimental setup, we simulated the reflectance of a system
consisting of a glass substrate, followed by a metal film (0.5 nm Ti adhesion layer + 5
nm Au), a hydrated organic film (8 nm, representing the OEG and SAv monolayers), a
buffer layer of variable thickness (representing the space between the planar coated
substrate and a given position on the surface of the colloidal probe; due to its strong
hydration, the refractive index of the HA film can be considered equivalent to that of
buffer to a good approximation) and a polystyrene medium (representing the colloidal
probe). The optical properties used for the different media are provided in Table III.S1
and the results are shown in Figure III.S1C.
The data in Figure III.S1C illustrate the periodic dependence of the reflectivity on the
probe-substrate distance. Importantly, the sinusoidal shape of the curve is not
appreciably distorted by the metal film, alone (red curve) or in conjunction with the
organic film (blue curve), as compared to the bare glass (black curve), and the length of
the period (λ / 2 nbuffer) also remains unchanged. The position of the extrema, on the
other hand, is sensibly affected.
Table III.S1 Refractive indices and extinction coefficients used in the simulation of
reflectance.
Glass Ti Au Organic
film Buffer Polystyrene
n 1.514 1.771 1.017 1.450 1.333 1.550
k 0 2.374 1.826 0 0 0
These theoretical predictions justify our approach to analyze the experimental RICM
data. Specifically, we used the analysis approach previously established for bare glass
(130) to determine (i) the effective probe-surface distance Href on a reference surface
featuring the metal film, the OEG monolayer and the SAv monolayer, and (ii) the
effective probe-surface distance HHA on an identically prepared surface with grafted HA.
The real probe-substrate distance was then obtained as H = HHA - Href. The offset by Href
fully accounts for the effect of the metal and organic films on the position of the
extrema with respect to the probe-surface separation.

Chapter III HA brush mechanics and morphology
91
We note in passing that Figure III.S1C also shows that the maximal reflectance is
enhanced with the metal film. This was indeed observed in the experiment and is an
advantage as it enhances image contrast.
III.6.2 Supporting figures
Figure III.S1 Impact of coatings on the glass substrate on RICM data analysis. (A)
Schematic of the multiple reflections occurring at a single layer (medium 1) sandwiched
between two other media (0 and 2). (B) Schematic of the light paths in a system with
two layers and simplification to a single effective layer. (C) Simulated reflectance for a
multilayer system consisting of a glass substrate, a buffer interlayer and polystyrene as a
funcation of the buffer interlayer thickness H (for details see the text above and Table
III.S1; λ= 490 nm). The glass was either bare (black curve), coated with a metal film
(red curve), or coated with a metal film and an organic film (blue curve). In the
experiment, the data would correspond to the reflectance at the centre of the colloidal
probe as a function of the probe-surface separation H.
0 50 100 150 200 250 3000.000
0.005
0.010
0.015
0.020
0.025
0.030
Re
fle
cta
nce
Buffer layer thickness,
or probe-surface separation, H (nm)
Bare glass
w/ metal film
w/ metal and organic films
A
B
C

Chapter III HA brush mechanics and morphology
92
Figure III.S2 Estimation of grafting density. Unperturbed HA brush thickness
measured at different NaCl concentration (symbols, extracted from Figure III.2) together
with a fit (line, to data ≥ 50 mM NaCl) with a previously developed mean field theory
(20). From the fit, a root-mean-square distance s = 47 nm between anchor points is
estimated.
The mean field approach of treats HA as a semi-flexible polymer and the electrostatic
repulsion between polyelectrolyte chains in the brush as an effective excluded volume,
and has previously been found to describe HA brushes in NaCl solutions of sufficiently
high ionic strength (≥ 50 mM) well (20). Specifically, the thickness is predicted to
depend on ionic strength as H = (8/π2)1/3
(pv/bs2)1/3
lc, where lc is the polymer contour
length, b the monomer unit length, p characterizes the intrinsic chain stiffness, and v is
the effective excluded volume. At high ionic strength, v = v0 + α2 / (4cNaCl), where α is
the fraction charge per monomer unit and v0 = Ab3 the ‘bare’ excluded volume in the
absence of charge repulsion (A is a numerical pre-factor, and depends on the monomer
shape and the solvent quality). For the fitting, we used p = 14, b = 1 nm, A = 0.9 and α =
1 (established in ref. (20)), lc = 698 nm (equivalent to 280 kDa HA), and s was the only
adjustable parameter.
1E-3 0.01 0.1 1
200
400
600
800
1000
H (
nm
)
csalt
(M)

Chapter III HA brush mechanics and morphology
93
0 50 100 150 200 250 300
-80
-60
-40
-20
0
f i/i
(H
z)
Time (min)
i = 3
i = 7
i = 11
0
5
10
15
20
25
30
35
40
D
i (10
-6)
10
µM
100
µM
500
µM
1
mM
2
mM
5
mM
10
mM
20
mM
50
mM
100
mM
200
mM
500
mM
1
MA
0 50 100 150 200 250 300
-80
-60
-40
-20
0
f i/i
(H
z)
Time (min)
0
5
10
15
20
25
30
35
40
D
i (10
-6)
10
µM
100
µM
500
µM
1
mM
2
mM
5
mM
10
mM
20
mM
50
mM
100
mM
200
mM
500
mM
1
M
B
0 50 100 150 200 250 300 350 450 500 550 600-80
-60
-40
-20
0
f i/i
(H
z)
Time (min)
0
5
10
15
20
25
30
35
D
i (10
-6)
10
µM
100
µM
500
µM
1
mM
2
mM
5
mM
10
mM
20
mM
50
mM
100
mM
200
mM
500
mM
1
M
HA HA HA HA HA HA HA HA HA HA HA HA HAHAC

Chapter III HA brush mechanics and morphology
94
Figure III.S3 Effect of calcium ions on HA brushes, characterized by QCM-D.
Representative time-resolved data for an HA brush (prepared as in Figure III.1B; A), a
reference surface (SAv monolayer without HA; B), and non-specific binding of non-
biotinylated HA to the reference surface (C). Shifts in normalized frequency, Δfi/i, and
in dissipation, ΔDi, relative to a SAv monolayer in ultrapure water are displayed for
overtones i = 3, 7 and 11 (as indicated in A). The start and duration of incubation of
CaCl2 (at various concentrations, as displayed) or HA (at 10 µg/mL) are indicated by
arrows on top; during remaining times, surfaces were exposed to ultrapure water. The
QCM-D responses upon incubation of CaCl2 solution in B do not reflect any changes on
the surface but result from changes in viscosity and/or density of the solution owing to
the added CaCl2. The frequency and dissipation shifts displayed in Figure III.3A-B were
obtained by subtracting data in B from A, and essentially reflect the HA film alone.
Figure III.S4 Reversibility of calcium effect on HA brushes. An HA brush was
prepared as in Figure III.1B, and time-resolved QCM-D data at overtones i = 3, 7 and 11
for the response to various solutions (indicated by arrows on top) are shown. The
transition from sample preparation buffer (SPB) to ultrapure water (mQ) is fully
reversible, but 1 M CaCl2 in ultrapure water has a minor irreversible effect on the HA
brush.
0 20 40 60 80 100 120 140 160 180
-80
-60
-40
-20
0
20
f i/i
(H
z)
Time (min)
i = 3
i = 7
i = 11
-10
-5
0
5
10
15
20
25
30
D
i (10
-6)
SPB mQ SPB mQ 1 M CaCl2 mQ

Chapter III HA brush mechanics and morphology
95
Figure III.S5 Effect of pH on HA brushes, characterized by QCM-D. Representative
time-resolved data for an HA brush (prepared as in Figure III.1B; A), a reference surface
(SAv monolayer without HA; B), and non-specific binding of non-biotinylated HA to
the reference surface (C). Overtones i = 3, 7 and 11 are shown, as indicated in A. The
start and duration of incubation of potassium phosphate buffer (containing 200 mM
potassium at various pH, as displayed) or HA (at 10 µg/mL) are indicated by arrows on
top; during remaining times, surfaces were exposed to potassium phosphate buffer at pH
0 50 100 150 200 250 300-60
-40
-20
0
f i/i
(H
z)
Time (min)
i = 3
i = 7
i = 11
0
5
10
15
20
25
D
i (10
-6)
9.0 8.0 6.0 5.0 4.0 3.0 2.5 2.0 1.5 1.0A
0 50 100 150 200 250 300-60
-40
-20
0
f i/i
(H
z)
Time (min)
0
5
10
15
20
25
D
i (10
-6)
B 9.0 8.0 6.0 5.0 4.0 3.0 2.5 2.0 1.5 1.0
0 50 100 150 200 250 300 350 400 450 500 550-60
-40
-20
0
f i/i
(H
z)
Time (min)
0
5
10
15
20
25
D
i (10
-6)
C HA HA HA HA HA HA HA HA HA HAHA
9.0 8.0 6.0 5.0 4.0 3.0 2.5 2.0 1.5 1.0

Chapter III HA brush mechanics and morphology
96
7.0. The QCM-D responses upon incubation of solutions with different pH in B do not
reflect any changes on the surface but result from changes in viscosity and/or density of
the solution owing to the presence of added salt. The frequency and dissipation shifts
displayed in Figure III.5A-B were obtained by subtracting data in B from A, and
essentially reflect the HA film alone.

Chapter IV Cross-linked polymer brush morphology
97
IV Theoretically predicted morphology of
cross-linked polymer brushes
The research work presented in this chapter is in preparation as a manuscript, for
submission to a peer reviewed journal, as:
Morphology and function of the nuclear pore permeability barrier – a case study of
cross-linked polymer brushes
Xinyue Chen,1,2,*
Raphael Zahn,1,*
Steffen Frey,3,7
Dirk Görlich,3 Oleg V. Borisov,
4,5
and Ralf P. Richter1,2,6
1 CIC biomaGUNE, San Sebastian, Spain;
2 Max-Planck-Institute for Intelligent
Systems, Stuttgart, Germany; 3 Department of Cellular Logistics, Max Planck Institute
for Biophysical Chemistry, Göttingen, Germany; 4 CNRS, MR 5254, IPREM Institut
des Sciences Analytiques et de Physico-Chimie pour l’Environnement et les Mat riaux,
niversit de Pau & Pays de l’Adour, Pau, France ; 5 Saint-Petersburg State Polytechnic
University, St. Petersburg, Russia; 6 University Grenoble Alpes - CNRS, Laboratory of
Interdisciplinary Physics (LIPhy), Grenoble, France; 7 Current address: NanoTag
Biotechnologies, Göttingen, Germany.
* These authors contributed equally.
My contribution: I co-designed research (together with Raphael Zahn, Oleg V. Borisov
and Ralf P. Richter). I contributed to developing the theoretical approach (together with
Oleg V. Borisov and Ralf P. Richter), and performed all computational work. I analyzed
the computational data and correlated theoretical results with experiments (together with
Raphael Zahn, Oleg V. Borisov and Ralf P. Richter). I prepared the figures and wrote
the first draft of the manuscript except for the parts pertaining to the experimental
system and data. I contributed to the revisions of the manuscript.

Chapter IV Cross-linked polymer brush morphology
98
Abstract: The permeability barrier of nuclear pore complexes (NPCs) controls bulk
macromolecular exchange between the cytoplasm and the nucleus of eukaryotic cells. It
consists of flexible protein domains (‘FG domains’) that are grafted to the pore walls
and rich in phenylalanine-glycine (FG) motifs. FG motifs act as ‘stickers’ and promote
binding of nuclear transport receptors (NTRs) and inter-FG-domain cross-linking. To
understand the functional implications of inter-FG-domain cross-linking and shed light
on the physical mechanisms behind NPC permselectivity, we have combined
quantitative experiments on planar cross-linked brushes made from regular neo FG
domains as a well-defined nanoscale model of the permeability barrier with a self-
consistent mean-field theory that predicts brush thickness and density profile as a
function of the density and strength of reversible stickers. By correlating theory and
experiments, we estimate that the strength of individual inter-FG-motif interactions is
relatively weak ( ), and that a relatively small fraction of FG motifs
( ) is simultaneously engaged in cross-linking at physiological FG motif
concentrations. Moreover, we find that not only the FG motifs but also the spacer
regions between FG motifs make sizeable contributions to the overall cohesiveness of
FG domains. Based on these new insights, we propose a refined model for nuclear pore
permselectivity in which the (individual) inter-FG-motif and NTRFG motif
interactions all are of low affinity, enabling dynamic reorganization of the permeability
barrier and rapid NTR translocation, whereas the multivalency of the (collective)
NTRFG domain and inter-FG-domain interactions promotes the formation of a
cohesive meshwork with a small mesh size (for size selectivity) and the selective entry
(and thus translocation) of NTRs.

Chapter IV Cross-linked polymer brush morphology
99
IV.1 INTRODUCTION
Nuclear pore complexes (NPCs) are large membrane-spanning protein structures that
are embedded in the nuclear envelope and regulate bulk macromolecular transport into
and out of the nucleus (242-246). Their functional key component is a central 30 to 50
nm wide channel that is filled with NPC protein (nucleoporin) domains that are rich in
phenylalanine-glycine (FG; single letter code is used throughout) dipeptide motifs (FG
domains). FG domains bind nuclear transport receptors (NTRs) and act as a
permeability barrier allowing small molecules (up to approximately 40 kDa or 5 nm in
diameter) to translocate freely between cytosol and nucleus while the passage of larger
molecules is delayed or blocked unless they are bound to NTRs (246-249).
FG domains are natively unfolded (250-252), and thus lack a defined three-
dimensional structure and can be considered as flexible polymers. The FG domains are
grafted at a high density to the NPC channel walls (251, 253), and – from a polymer
physics point of view – their assembly may hence be qualified a polymer brush (187).
However, FG domains are not devoid of intramolecular and intermolecular interactions.
They interact attractively with each other, and this cohesiveness promotes the formation
and determines the properties of FG domain phases (180, 254-257), and is also essential
for the formation of a functional permeability barrier (256, 258). FG motifs contribute
to these interactions (180, 256), and with each FG domain carrying many FG motifs,
these interactions are intrinsically multivalent. At the same time, FG domains also
interact with nuclear transport receptors, and this interaction facilitates their passage
through the NPC. This interaction is also multivalent and involves multiple FG motifs
on FG domains and FG motif binding sites on the NTR (259-263). Adding to the
complexity, there are different types of FG motifs (FG, FxFG and GLFG being the most
common ones), and FG domains differ in prevalent FG motif types, FG domain size,
abundance of FG motifs relative to FG domain size, as well as in the distribution of FG
motifs along the peptide chains and the composition of the spacer regions between FG
motifs (264). How the variety in FG domain primary structure, and the associated
variety in inter-FG-domain and NTRFG domain interactions collectively define the
function of the permeability barrier remains controversial (265), and there remains
uncertainty about the morphology of the permeability barrier (255, 256, 266, 267).
Physical models have been helpful for understanding the mechanisms underlying the
assembly and function of the nuclear pore permeability barrier. We and others have

Chapter IV Cross-linked polymer brush morphology
100
recently shown, for example, that the binding of NTRs into FG domain films, and the
ensuing film thickness changes, can be effectively reproduced by models that
completely ignore all chemical and structural heterogeneity and instead consider the FG
domains as homogeneous, flexible polymers and the NTRs as featureless spheres (268,
269). Homopolymer models also effectively explain how cohesiveness of FG domains
enhances the rate of FG domain supramolecular assembly, and how it may determine
the size selectivity of FG domain assemblies (180) and the viscoelastic properties of the
nuclear pore permeability barrier (270) or FG domain films (167). These findings imply
that the exact chemical make-up and structure of FG domains and NTRs may not be
critical for controlling the assembly, physical properties and permselectivity of the
nuclear pore permeability barrier.
By their nature, however, FG motifs are discrete interaction sites along FG domains
(and so are their corresponding binding sites on the NTR surface). To capture this level
of complexity, we here consider FG domains as flexible polymers that are endowed
with a set of discrete ‘stickers’ that can interact more strongly with each other than the
rest of the otherwise homogeneous polymer chain. With such a model, we can resolve
important questions that thus far have proven difficult to address: How do discrete
stickers affect the morphology of FG domain assemblies, as compared to attractive
interactions between homopolymers? How strong are individual inter-FG-motif
interactions? And do all FG motifs in FG domain assemblies simultaneously engage in
bonds?
Here, we address these questions by studying planar cross-linked brushes as a well-
defined nanoscale model system of the nuclear pore permeability barrier that is tractable
in quantitative experiments and in analytical theory. The experimental approach builds
on previous work, were we produced films of end-grafted purified FG domains that are
similar to the protein meshwork in NPCs, both in their thickness and in their FG motif
density (180, 268, 271). However, instead of the native FG domains with their complex
amino acid composition we here employ artificial polypeptide chains that are made of a
16-fold repetition of a 19 amino acid sequence containing an FG motif (‘sticker’; FSFG,
GLFG, GSFG, or SSSG as control) along with 15 other amino acids (‘spacer’). The 16
stickers per neo FG domain together have a quantifiable effect on brush rigidity and
thickness, and because the polymer is regular we can deduce the properties of individual
interactions from the collective response, even if the individual interaction per se is too
weak to be measured directly. Specifically, our sequence was inspired by the C-terminal

Chapter IV Cross-linked polymer brush morphology
101
part (amino acids 298 to 600) of the FG domain of the nucleoporin Nsp1 from S.
cerevisiae which features almost exclusively FSFG motifs along with spacers of regular
length (15 amino acids).
To rationalize how the reversible association of discrete ‘stickers’ into cross-links
affects the morphology of brushes, we combine the self-consistent mean-field theory of
polymer brushes (182) with the mean-field theory of thermo-reversible gelation of
associative polymers (272). The new analytical theory reveals that the effect of weak
stickers on the brush thickness and density profile can be effectively described by the
simpler and well known case of a homopolymer brush at reduced solvent quality (182),
whereas a distinct behavior that has no classical counterpart emerges for strong stickers,
with the brushes adopting a more box-like density profile.
Importantly, the correlation of theory and experiment provides quantitative estimates
of fundamental interaction parameters that have so far been difficult to access, that is, (i)
the relative effects of FG motifs vs. spacer regions on the cohesiveness of FG domains,
(ii) the strength of individual inter-FG-motif interactions, and (iii) the fraction of FG
motifs that are on average engaged in bonds. To assess the functional implications of
our findings, we compare the strength of individual inter-FG-motif interactions with the
strength and kinetics of individual NTRFG motif interactions (259), and consider the
interplay of multivalent inter-FG-domain and NTRFG domain interactions. We
propose a model in which the individual inter-FG-motif and NTRFG motif interactions
define the dynamics (rate of reorganization and NTR translocation), and the collective
inter-FG-domain and NTRFG domain interactions the morphology (compactness and
NTR uptake), of the permeability barrier.
IV.2 MATERIALS AND METHODS
IV.2.1 FG domains and buffer
We used three artificially designed regular FG domains which were largely identical
in sequence, but had distinct FG motifs. Specifically, they consisted of an N-terminal
H14 tag (MSKHHHHSGHHHTGHHHHSGSHHHTG), followed by a TEV cleavage site
(ENLYFQGSA), 16 repetitions of the sequence STPAXXXXASNNNSTNNGT and a
C-terminal cysteine (SC). The letters XXXX define the FG motif and the name of the
neo FG domains: FSFG (molecular mass MW = 34.1 kDa), GLFG (33.1 kDa) and GSFG
(32.7 kDa). As a reference, we used a fourth polypeptide with an SSSG sequence

Chapter IV Cross-linked polymer brush morphology
102
instead of the FG motif (32.2 kDa). All polypeptides were purified as described earlier
(180, 271, 273, 274) and stored at a concentration of 10 mg/mL in 50 mM Tris pH 8.0
and 6 M guanidine hydrochloride (GuHCl) at -80 °C. Prior to use, the polypeptides
were diluted in working buffer (10 mM Hepes, pH 7.4, 150 mM NaCl) to desired
concentrations. The residual concentration of GuHCl in the final solution was kept
below 60 mM in all measurements.
IV.2.2 In situ combination of spectroscopic ellipsometry (SE) and
quartz crystal microbalance with dissipation monitoring
(QCM-D)
The formation of FG domain films was simultaneously followed by SE and QCM-D
on the same surface and in a liquid environment (275). To this end, we used a custom-
built cuvette-like open fluid cell, placed in a Q-Sense E1 system (Biolin Scientific AB,
Västra Frölunda, Sweden; providing QCM-D data) and mounted on a spectroscopic
rotating-compensator ellipsometer (M2000V, J. A. Woollam Co., Lincoln, NE;
providing SE data), as described in detail elsewhere (276).
In the SE measurements, ellipsometric angles (Δ and ψ) were acquired over a
wavelength range of λ = 380 to 1000 nm at 70° angle of incidence and ~5 s time
resolution. In the QCM-D measurements, frequency and dissipation shifts (Δfi and ΔDi)
were acquired for six overtones (i = 3, 5, ..., 13, corresponding to resonance frequencies
fi ≈ 15, 25, ..., 65 MHz) with a time resolution of ~1 s. For analysis that does not require
viscoelastic modelling, each overtone provided similar information, and we therefore
present changes in dissipation, ΔD, and normalized frequency, Δf = Δfi/i, for only one
selected overtone (i = 3).
Prior to each measurement, the walls of the cuvette were passivated by incubation
with a buffer solution containing 10 mg/mL of bovine serum albumin (BSA; Sigma) for
30 min. The cuvette was rinsed with buffer, ultrapure water and blow-dried with
nitrogen gas. For the measurement, the cuvette was filled with ~2 mL working buffer,
continuously stirred and held at a temperature of 23 °C. Samples were injected directly
into the buffer-filled cuvette at desired concentrations. To remove samples, the cuvette
content was diluted, by repeated addition of excess buffer and removal of excess liquid,
until the concentration of soluble sample, estimated from the dilution rate, was below 10
ng/mL.

Chapter IV Cross-linked polymer brush morphology
103
IV.2.3 Surface functionalization
All measurements were performed on silica-coated QCM-D sensors that are
optimized for combined SE/QCM-D experiments (QSX335; Biolin Scientific AB). The
sensors were cleaned by immersion in a 2 % sodium dodecyl sulfate solution for 30
min, rinsed with ultrapure water, blow-dried with nitrogen gas, and exposed to
UV/ozone (BioForce Nanosciences, Ames, IA) for 30 min. We mounted the cleaned
sensors in the combined SE/QCM-D and functionalized their surface with supported
lipid bilayers (SLBs) exposing Ni2+
ions for the capture of His tagged molecules, as
described previously (180, 271). Briefly, we used sonication to prepare small
unilamellar lipid vesicles (SUVs) containing dioleoylphosphatidylcholine (DOPC;
Avanti Polar Lipids, Alabaster, AL) and 3 mol-% of lipid analogs with headgroups
comprising three Ni2+
-chelating nitrilotriacetic acid moieties (SOA-tris-NTA) (277).
SLBs were spontaneously formed by injecting SUVs (at 50 µg/mL final concentration)
with NiCl2 (at 10 µM final concentration) into the buffer-filled SE/QCM-D fluid cell.
Binding and spreading of SUVs eventually leading to SLB formation was monitored by
SE and QCM-D and only SLBs of good quality (i.e. showing QCM-D frequency shifts,
Δf = 29 ± 1 Hz, and dissipation shifts, ΔD < 0.5 × 10⁻⁶
) were used for further
measurements.
IV.2.4 FG domain film formation
We injected the FG domains directly into the SE/QCM-D cuvette equipped with an
SLB-coated sensor. During sample injection and for a brief period (10 to 15 s)
afterwards, the cuvette content was homogenized with a magnetic stirrer. FG domain
film formation was then followed in still solution to ensure homogeneous binding
across the sensor surface and thus to guarantee that SE and QCM-D (which have
overlapping but not identical sensing areas) monitor the same process (276). During all
other incubation and rinsing steps, the solution was stirred to maintain the cuvette
content homogeneous.
IV.2.5 Quantification of FG domain grafting density and film
thickness
We quantified FG domain surface densities by fitting the SE data to a model of
multiple optically homogeneous layers implemented in the software CompleteEASE (J.
A. Woollam Co.). The fitting method for the QSX335 sensor substrate is described in

Chapter IV Cross-linked polymer brush morphology
104
detail in ref. (276). The FG domain film was treated as a transparent Cauchy film with
an effective optical thickness dSE and a wavelength-dependent refractive index n(λ). FG
domain grafting densities where obtained through de Fejter’s equation (278), i.e.,
W
, where Δn is the difference in refractive index between the FG domain
film and the buffer solution (assumed to be wavelength independent) and MW the FG
domain molecular mass. We used dn/dc = 0.18 cm3/g as refractive index increment,
which is typical for proteins (275). The resolution in × MW was ~0.5 ng/cm2. Among
the optical mass-sensitive techniques, SE is particularly suited to quantify the areal mass
density of organic films up to a few 10 nm thick, because mass determination is
virtually insensitive to the distribution of material within the film (275).
We determined the thickness of FG domain films by fitting the QCM-D data to a
continuum viscoelastic model, as described in detail previously (167). Briefly, we used
the software QTM (279) (option “small load approximation” (162, 280)). The FG
domain films were modeled as homogeneous viscoelastic films with a storage modulus
(G’) and a loss modulus (G”) that depend on frequency in the form of a power law. The
film density was fixed based on the areal mass density (determined by SE) and partial
specific volume of proteins, and the density of water. The semi-infinite bulk solution
was assumed to be a Newtonian fluid with the density and viscosity of water. The
specified errors represent a confidence level of one standard deviation (68 %). In
previous studies (167, 180, 271), we found that the thickness results obtained by QCM-
D for FG domain films are comparable to within the specified confidence levels to those
obtained with another technique, atomic force microscopy, thus confirming that the
thickness determination is robust.
Computation. A closed set of equations describing the morphology of cross-linked
brushes was solved numerically for selected parameter sets (see below) using a custom-
made algorithm implemented in Matlab (Mathworks, Natick, MA).
IV.3 THEORY
IV.3.1 Mean-field theory of cross-linked brushes
We consider a polymer brush formed by linear, flexible homopolymers with
associating groups (i.e. stickers) grafted onto a planar, solid substrate and immersed in a
solvent at temperature . Each polymer chain is composed of segments of length .
The root-mean-square (rms) distance between two adjacent anchor points is . Each

Chapter IV Cross-linked polymer brush morphology
105
polymer contains stickers, and a pair-wise bond is considered formed when two
stickers are found within a volume 2 , where is the ‘sticker volume’. The free
energy gain for the association of two isolated stickers into a pair is represented by
.
It is our aim to predict how the morphology of the polymer brush is affected by the
association of stickers. To this end, we use the self-consistent mean-field theory
developed by Zhulina et al. (182) to describe the polymer brush, and combine it with the
mean-field theory of thermo-reversible gelation of associative polymers developed by
Semenov and Rubinstein (272).
The Helmholtz free energy per chain in the brush can be presented as
, [1]
where and are the free energy of interactions and the contribution of
conformational entropy of stretched chains per unit volume of the brush, respectively,
is the distance from the grafting surface, and H is the brush thickness.
The elastic free energy is specified under the strong stretching approximation
employed by the theory (182) as
, [2]
where is the Boltzmann constant, is the normalized distribution of the free ends
of the chains, is the local stretching function and is the most
probable position of the n-th segment of the chain (counted from the grafting point)
provided that the chain end is located at .
The interaction free energy comprises two contributions,
, [3]
where is the concentration of polymer segments and is the density of the
excluded volume interactions which in the virial approximation can be presented as
, [4]
where v and w are the second and the third virial coefficients, respectively, and where
we neglect all higher order terms in the following. is the contribution to the free
energy arising due to pair-wise association of stickers. The latter comprises the
combinatorial entropy of choosing different pairs of stickers on polymer chains and the
free energy gain upon association. As demonstrated in ref. (272), in a semi-dilute

Chapter IV Cross-linked polymer brush morphology
106
polymer solution of concentration the fraction of stickers associated into pairs can
be found from
, [5]
and the corresponding contribution to the free energy is given by
, [6]
where is the number of stickers per segment. The quantity is
an effective measure of the interaction strength between stickers. The nature of
illustrates that both an interaction range (defined by the volume term ) and an
interaction strength (defined by the energy term ) are needed to describe the
association of stickers. As a consequence, is expressed in units of volume, and we call
it the ‘attractive volume’ of a sticker. must be positive and in the limiting case of
, we recover the properties of a brush without stickers. Taken together, the total
density of the free energy of interactions in the brush is given from Eqs. [4] and [6] by
. [7]
The self-consistent mean-field theory provides the expression for the chemical
potential of segments in the brush as a function of the distance from the surface as (182)
. [8]
This expression applies for any type of interaction in the brush provided that the chains
obey Gaussian elasticity on all length scales. From Eqs. [5], [7] and [8] we obtain the
relation
, [9]
which together with Eq. [5] constitutes a closed set of equations for the polymer density
profile and the fraction of closed stickers as a function of the distance from
the grafting surface. The parameter Λ appearing in Eqs. [8] and [9] can be calculated
using the condition of vanishing osmotic pressure
[10]
at the edge of the brush, that is at . Hence, from the simultaneous solution of the
set of two equations
and [11.1]
, [11.2]

Chapter IV Cross-linked polymer brush morphology
107
one obtains the values of polymer concentration and the fraction of closed stickers
at the edge of the brush as a function of the set of interaction parameters ,
, and . Then, using Eq. [9] one obtains the following expression for :
. [12]
In the absence of stickers ( ) and under good or θ-solvent conditions ( ), the
polymer density vanishes at the brush edge, and , whereas under poor
solvent conditions ( ), vanishing of osmotic pressure requires a nonzero polymer
concentration (or stepwise density drop) at the brush edge with and
. [13]
The overall brush thickness has to be determined from the normalization of the
polymer density profile,
, [14]
where we also introduce the average segment concentration.
For the brush with stickers, it is easy to check from Eqs. [5] and [9] that the chemical
potential of the polymer segments in the brush is a monotonous function of the polymer
concentration and that the polymer density vanishes at the edge of the brush,
and , if . Here, we have introduced the notation
. An increase in either the fraction of stickers or in the
attractive sticker volume results in a decrease and eventually in the inversion of the
sign of . At , the polymer concentration and the fraction of closed stickers
exhibits a discontinuity at the brush edge, and , as follows from Eq.
[12], .
Remarkably, when the fraction of closed stickers is small throughout the brush
( ), then and the term in curly brackets in Eq. [7] reduces to
implying that the effect of stickers is equivalent to the renormalization
of the second virial coefficient in a conventional homopolymer brush. That is,
all structural properties of the brush with stickers can be obtained from those for the
conventional homopolymer brush by simply replacing by . This case has been
considered in detail in ref. (182).
As a measure of the average degree of cross-linking in the brush we introduce the
average fraction of closed stickers
. [15]

Chapter IV Cross-linked polymer brush morphology
108
Another property of interest is the free energy per chain in the brush. It can be
calculated from Eqs. [1], [7] and [10] by making use of the fact that as long as the
chains in the brush obey Gaussian elasticity, the local force balance leads to the relation
between the density of the elastic free energy and the local osmotic pressure as
.
IV.3.2 Salient theoretical predictions for cross-linked brushes
To reveal salient theoretical predictions for cross-linked brushes, we consider two
distinct solvent qualities, good solvent ( ) and θ solvent ( ), and used
default values for , , and corresponding to parameter set 1 in Table IV.1. For
convenience, all relevant quantities in this section are normalized by appropriate powers
of the segment length a without explicitly annotating this in text and figures. N and s
were chosen such that, with v and w fixed, the chain stretching and the polymer
concentration in the formed brushes are in line with the assumptions of the model over a
large range of other parameters. Without loss of generality, we fix , such that
the attractive sticker volume can also be expressed in terms of the sticker strength
(recall that ); this is convenient because the quantity (expressed in units of
) is more intuitively accessible.
Table IV.1. Polymer brush and interaction parameters chosen for the computations.
Parameters Values
Parameter set 1 Parameter set 2
N 1600 170.5
a - 0.76 nm
s/a 8 (or varied) 6.65 (or varied)
v/a3
0 (θ solvent)
0.5 (good solvent) 0.048
w/a6 1/6 1/6
Fst 0.1 (or varied) 0.094
vb/a3 0.5 1
, λ varied varied

Chapter IV Cross-linked polymer brush morphology
109
Figure IV.1 Theoretically predicted brush properties. (A) Brush thickness H vs.
effective excluded volume, (with varying ) for brushes containing
different fractions of stickers Fst (symbols with solid lines) in good solvent ( ; left)
and θ solvent ( ; right). Other parameter settings are as listed in Table IV.1
(parameter set 1). For comparison, data for the equivalent brush without stickers as a
function of excluded volume are also shown (dashed lines). (B) Segment
concentration c vs. distance from the grafting surface x at a selected fraction of stickers
( ). Profiles of brushes with stickers (where thickness decreases with attractive
sticker volume , expressed in with fixed ; solid lines) are
compared with brushes lacking stickers (where thickness decreases with solvent quality
v; dashed lines). Matching colors indicate that and v, respectively, were selected such
Cross-linked brushes in good solvent (v = 0.5)
Cross-linked brushes in θ solvent (v = 0)

Chapter IV Cross-linked polymer brush morphology
110
that the brush thickness values coincide for the two different brush types. (C) Brush
thickness H (black) and average fraction of stickers associated in pairs (red) at a
selected and a set of selected (again expressed in ) as a function of grafting
density 1/s2 (solid lines with symbols); for comparison, the thickness of equivalent
brushes without stickers is also shown (dashed lines).
IV.3.2.i Thickness of cross-linked brushes
Figure IV.1A presents the dependence of the brush thickness on , plotted as
versus (recall that eff st with st ) for different fractions of
stickers at (left panel) and (right panel). For comparison, the
thickness of the corresponding ‘reference’ brush without stickers as a function of the
second virial coefficient is also shown (where the lower limit corresponds
to the fully collapsed brush, i.e. H = N/s2 = 25). For the sake of completeness, the
dependencies of on and are also explicitly presented in Figure IV.S1.
As follows from Figure IV.1A, the thickness of the brush with stickers decreases as a
function of the effective excluded volume parameter much weaker than the
thickness of the reference brush as a function of . Obviously, there is no universal
dependence of on , and for any given value of the brush thickness decreases
upon an increase in the fraction of stickers .
All curves in Figure IV.1A coincide though for small st. This corresponds to the
regime where the fraction of stickers associated in bonds is small ( ) and the
effect of stickers on the brush structure can be effectively treated as a reduction of the
solvent quality. As a control, we verified that the thickness computed in the absence of
stickers ( ) is in line with expectations for homopolymer brushes (182):
for is in agreement with (eq [17] of ref. (182));
for is slightly larger than obtained from the asymptotic
expression (eq [21] of ref. (182)), which is valid in the limit
of good solvent, that is, neglecting ternary and higher order interactions. The minor
divergence in the case of good solvent is reasonable because Eq. [21] in ref. (182) was
derived for the limit of , whereas in our case (cf.
Table IV.1).
In the other extreme, when becomes very small, the thickness of the cross-linked
brushes approaches a plateau. In this regime, the attractive sticker volume (or the

Chapter IV Cross-linked polymer brush morphology
111
sticker strength ) are so large that virtually all stickers are associated into bonds
( ), and this condition defines the lower limit for the thickness of a brush
with a given number of stickers. From Figure IV.1A (and Supporting Figure IV.S1), it
can be appreciated that for small , is relatively large. This is a consequence of
the solubility of the spacer segments between stickers which keep the brush in a swollen
state even if the stickers are bonding strongly.
IV.3.2.ii Density profile of cross-linked brushes
Figure IV.1A (left panel) also reveals that the brush with stickers may need a
negative effective excluded volume ( ) to attain the same thickness as a partially
swollen ( ) reference brush. Remarkably, brushes with and without stickers may
thus have qualitatively different density profiles at the same (sufficiently small)
thickness. To illustrate how the segment density profile evolves as cross-links become
stronger, we fixed the number of stickers per segment to , and varied (and
thus ) such that brush thickness values , and were obtained
(Figure IV.1B, colored solid lines). As one can see, the segment density decreases
monotonously with distance from the grafting surface, and the brushes become more
compact as the sticker association strength increases. The segment density vanishes
smoothly at the brush periphery for the reference brushes and also for small (and ) in
good solvent (i.e. where ), whereas a discontinuous drop of density emerges as
(and ) become larger ( ).
For comparison, density profiles for the sticker-free reference brush at specific
values of corresponding to the same thickness of the reference brushes as for the
brushes with stickers are plotted as dashed lines. In accordance with our observation in
Figure IV.1A, the comparison reveals that stickers produce a discontinuity in at larger
than a decrease in solvent quality would (cf. Figure IV.1B, left). More generally it is
clear that, for a given brush thickness, cross-links make the density profile more box-
like than a reduction in solvent quality (Figure IV.1B), and a few strong cross-links
make the profile more box-like than many weak cross-links (Supporting Figure IV.S2).
The differences are pronounced when the cross-linked brushes are in good solvent
(Figures IV.1B and S2, left), and only minor in θ solvent (Figures IV.1B and S2, right).
As controls, profiles of the corresponding brushes without stickers are also shown in
Figure IV.1B (black solid lines): the profile for indeed shows the parabolic

Chapter IV Cross-linked polymer brush morphology
112
shape ( ) characteristic for brushes in good solvent, and the profile for
shows the expected dependence (182).
IV.3.2.iii Effects of grafting density on sticker association and brush thickness
To assess how the grafting density affects the cross-linking of brushes, we calculated
the brush thickness and the average fraction of stickers associated into bonds as a
function of for selected values of (corresponding to at
), a fraction of stickers , and otherwise unchanged parameters (Figure
IV.1C). It can be seen that varies from around 10% at to almost 100% at
, i.e. the range covers almost the full spectrum of possible
brush conformations. Both (black solid lines) and (red solid lines) increase
monotonously with grafting density. The thickness of the equivalent brush without
stickers is also shown in Figure IV.1C (black dashed lines) for comparison. From the
log-log plot, one can appreciate that the dependence of brush thickness on grafting
density obeys a power law relationship for brushes without stickers. The power is 0.5
for and 0.356 for . These values are comparable to theoretical predictions
of 1/2 for θ solvent and 1/3 for good solvent according to ref. (182), where the minor
discrepancy for good solvent is again due to the fact that the parameter is only a few
fold larger than 1 in our case. With stickers, the power-law dependence is lost and a
more complex behavior emerges. As expected, the thickness of the brush with stickers
is smaller than that of the reference brush for any given grafting density. The relative
difference, however, decreases with grafting density due to a concomitant increase in
the strength of repulsive excluded volume interactions. The interplay of different
interactions gives rise to apparent powers of the versus dependency for the
brush with stickers that are larger than for the equivalent brush without stickers.
IV.4 EXPERIMENTS
IV.4.1 Formation of synthetic FG domain brushes
The approach to form films of grafted FG domains and study their properties has
been established previously (167, 180, 271, 281), and is schematically presented in
Figure IV.2A. The different neo FG domains (FSFG, GLFG, GSFG, and the reference
SSSG) were attached through their N-terminal histidine tag to Ni2+
-loaded NTA
moieties on a supported lipid bilayer (SLB). Figure IV.2B-E demonstrate that all neo
FG domain types bound stably (i.e. were not released upon rinsing in buffer), and that

Chapter IV Cross-linked polymer brush morphology
113
the SLB also serves as an effective passivation layer: the FG domains could be fully
eluted in 0.5 mM imidazole indicating that the His tag is the only moiety through which
the FG domains bind to the surface thus providing a well-defined mode of attachment.
In our experiments, we used an in situ combination of SE and QCM-D to study the
properties of the end-grafted FG domain films (276, 281). For this purpose, we
simultaneously acquired, on the same sensor, the ellipsometric angles (Δ and ψ; optical
signal) and the QCM-D frequency and dissipation shifts (Δf and ΔD; acoustic signal;
Figure IV.2B-E, bottom panels). FG domain grafting densities (Figure IV.2B-E, top
panels) were obtained through optical modeling of SE data, whereas the thickness of the
corresponding films was obtained through viscoelastic modeling of QCM-D data (see
Materials and Methods for details).
IV.4.2 Mechanical properties, thickness and concentration of
synthetic FG domain brushes
The mechanical properties of FG domain films can be appreciated from Figure
IV.3A, where the parameter D/-f, which can be computed from the QCM-D data
without any fitting, is proportional to the elastic compliance to a first approximation,
and thus a measure of film softness (161, 180). The graph demonstrates that all FG
domain films become stiffer as the grafting density increases. This trend is expected,
because the increase in grafting density entails an increase in the polymer concentration,
and polymer meshworks tend to stiffen with concentration (175). Importantly, there are
significant differences in stiffness as a function of FG motif type: at any given grafting
density, SSSG films are softest and films become gradually stiffer from GSFG to GLFG
to FSFG. This provides a first and robust indication about the differences in the cross-
linking propensity of the synthetic FG domains, and identifies FSFG as being the most
cohesive motif.

Chapter IV Cross-linked polymer brush morphology
114
Figure IV.2 (A) Schematic illustration of the experimental approach and the FG domain
film architecture. (B-E) FG domain film formation and properties. FG domain grafting
densities (upper graph; obtained from SE data) are shown together with QCM-D
frequency and dissipation shifts (Δf and ΔD; lower graphs). Arrows on top of each
panel indicate the start and duration of incubation with different sample solutions, for
SSSG (B), FSFG (C), GLFG (D) and GSFG (E) domains; during remaining times, the
surface was exposed to working buffer. All FG domains remained stably bound upon
rinsing in working buffer. Full elution after treatment with imidazole (grey shaded area,
SE grafting density
QCM-D film thickness
A
silica
passivation
FG domain
H14 tag
B
D E
C
-80
-40
0
f
(Hz)
0 60 120 1800
3
6
9
D
(1
0-6
)
Time (min)
0
5
10
15
500 mM
imidazole
gra
ftin
g d
en
sit
y
(pm
ol/
cm
2)
0.12 M
SSSG
-80
-40
0
f (H
z)
0 60 120 180 2400
3
6
9
D
(1
0-6
)
Time (min)
0
5
10
15
500 mM
imidazole
gra
ftin
g d
en
sit
y
(pm
ol/
cm
2)
0.12 M
FSFG
-80
-40
0
f
(Hz)
0 60 120 1800
3
6
9
D
(1
0-6
)
Time (min)
0
5
10
15
500 mM
imidazole
gra
ftin
g d
en
sit
y
(pm
ol/
cm
2)
0.12 M
GSFG
-80
-40
0
f
(Hz)
0 60 120 180 2400
3
6
9
D
(1
0-6
)
Time (min)
0
5
10
15
500 mM
imidazole
gra
ftin
g d
en
sit
y
(pm
ol/
cm
2)
0.12 M
GLFG

Chapter IV Cross-linked polymer brush morphology
115
not monitored) demonstrates that the FG domains bound specifically through their H14
tags. The perturbations in the SE and QCM-D signals right after the end of FG domain
incubation are due to transient temperature fluctuations caused by solution exchange
and do not represent changes of the FG domain films.
Figure IV.3 (A) FG motifs differentially stiffen the FG domain film. The parameter
ΔD/-Δf (obtained from QCM-D data) is a measure of the films’ softness (or elastic
compliance) and plotted here as a function of grafting density Γ (determined from SE
data). (B) Experimentally determined best-fit thickness H of different types of FG
domain films determined by viscoelastic modeling of QCM-D data obtained at a
grafting density of 6.5 pmol/cm2. The error bars represent 1σ confidence intervals
obtained from the fitting procedure. (C) Average FG domain concentration
, derived from B.
Figure IV.3B shows the thickness H of the four brushes at a selected grafting density
(Γ = 6.5 pmol/cm2), and Figure IV.3C shows the average concentration Γ/H in mg/mL.
From SSSG to GSFG to GLFG to FSFG, the thickness gradually decreases, and the
concentration increases. This is fully consistent with the stiffness trends, and thus
provides confidence in the robustness of the thickness data despite the relatively large
confidence intervals associated with the data fitting. The film thickness values exceed
the rms distance between adjacent anchors (s = 5.05 nm at Γ = 6.5 pmol/cm2) by 2.5 to
3 fold, indicating that the chains are partially stretched away from the grafting surface
0 2 4 6 8 10 12 140.0
0.1
0.2
So
ftn
es
s p
ara
me
ter,
D
/-
f (1
0-6
Hz
-1)
grafting density, (pmol/cm2)
SSSG
GSFG
GLFG
FSFG
A
B C

Chapter IV Cross-linked polymer brush morphology
116
and thus form a so-called polymer brush. Moreover, the FG domain concentrations are
on the order of a few 100 mg/mL, and it can be readily calculated that this corresponds
to FG motif concentrations between 65 and 85 mM depending on the FG domain type.
These values are comparable in their order of magnitude to what we have previously
reported for self-assembled films (180, 271, 281) and microgels (254) of native FG
domains, and to the conditions that are likely to be present inside the nuclear pore.
Therefore, the inter-FG-motif interactions with our artificial FG domains occur at close-
to-physiological local protein and FG motif concentration levels.
IV.5 CORRELATING THEORY WITH EXPERIMENTS
Towards quantitative comparison with experiment, we performed calculations with
parameter set 2 in Table IV.1. In this section, we consider the segment size explicitly in
all quantities, to facilitate correlation with the experiment. Specifically, segments were
taken to be twice the size of an amino acid ( ), mirroring the flexibility of
unfolded polypeptide chains (282). is half the number of amino acids per FG
domain construct, and with 16 stickers per chain, we have . We fixed
, and the default rms distance between grafting points
is equivalent to a grafting density of Γ = 6.5 pmol/cm2.
Using these parameters, and the experimentally measured thickness of the SSSG
reference brush at 6.5 pmol/cm2 (Figure IV.3B), we can calculate the second virial
coefficient . This value should be considered an average effective
excluded volume per segment, in the sense that it was derived by representing the
reference polypeptide sequence as a homopolymer. We note here that the effective
hydrodynamic thickness measured by QCM-D may not be fully equivalent to the
thickness defined in the theory, and should thus be considered an estimate that
provides the correct order of magnitude. is positive but clearly much smaller than
0.5 which would be expected for a fully solvated polymer. This indicates that there is a
net attraction between the polymers even in the absence of authentic stickers, and that
our experimental conditions are rather close to θ conditions.

Chapter IV Cross-linked polymer brush morphology
117
Figure IV.4 (A) Theoretical predictions (dashed lines) of brush thickness H vs.
attractive sticker volume (left) and vs. the fraction of stickers engaged in bonds
(right) for a cross-linked brush at 6.5 pmol/cm2 with parameters chosen to match the
neo FG domains used in the experiments (cf. Table IV.1, parameter set 2). Horizontal
lines represent the best-fit thickness of SSSG (grey), FSFG (red), GLFG (blue) and
GSFG (green) domain films taken from Figure IV.3B. (B) (left) and (right)
obtained by matching theory and experiment as illustrated in A. Error bars were
determined from the confidence ranges in the experiment for the thickness of FSFG,
GLFG and GSFG as shown in Figure IV.3B. The inset shows the sticker association
energy obtained from , assuming .
IV.5.1 Estimating the density and strength of cross-links
Figure IV.4A shows the theoretically predicted brush thickness (dashed lines) as
functions of the attractive sticker volume (left panel) and the average fraction of
stickers engaged in bonds (right panel) together with the best-fit experimental
thickness values for the four FG domain constructs (horizontal lines; cf. Figure IV.3B)
at 6.5 pmol/cm2. The correlation of experiment with theory thus provides estimates of
and for the FSFG, GLFG and GSFG domain brushes. These quantitative data,

Chapter IV Cross-linked polymer brush morphology
118
summarized in Figure IV.4B, are a major result of this study. They reflect the expected
trends, with FSFG having the largest attractive sticker volume and the largest number of
bonds. A salient feature for all tested brushes is that only a minor fraction of stickers
associate into bonds, whereas 75% and more of the stickers effectively remain free. We
do not know the exact value of , but if we consider that a sticker spans two segments
(or four amino acids) and assume that the geometrical excluded volume of the sticker
defines the volume for bond formation, then this would correspond to .
With this assumption, we obtain bond formation energies in the range of a few
(Figure IV.4B, left panel, inset). In particular, the sticking energy of for FSFG
corresponds to an affinity . Moreover, the order of
magnitude of the estimated is very likely to be correct, and since
this implies that the affinity is also correct to within an order of
magnitude. Therefore, we can conclude that individual inter-FG-motif interactions have
an affinity above 10 mM and are thus rather weak compared to common biospecific
interactions.
Figure IV.5 Theoretical predictions (dashed lines) and experimental results (symbols)
for the thickness of brushes formed from different FG domains (as indicated in the
graph) vs. grafting density . Experimental data at 4.5, 6.5 and 8.0 pmol/cm2, and at
12.5 pmol/cm2 for FSFG, were obtained from combined QCM-D/SE measurements
(Figure IV.3). To avoid overlap of the symbols and error bars, data at 4.5, 6.5 and 8.0
pmol/cm2 were displaced along the x axis by small amounts. Experimental data at larger
grafting densities for SSSG, GSFG and GLFG were obtained from separate QCM-D
measurements, and the grafting density in this case was estimated by correlation of the
Δf value with extrapolated Δf vs. calibration curves obtained from the combined

Chapter IV Cross-linked polymer brush morphology
119
SE/QCM-D measurements (see Supporting Figure IV.S3 for details). For the theoretical
calculations, the best-fit values in Figure IV.4B, obtained at 6.5 pmol/cm2, were used
with other parameters defined in Table IV.1 (parameter set 2).
To further validate our analysis, we determined the thickness of the synthetic FG
domain brushes experimentally for selected grafting densities spanning from 4.5 to 13
pmol/cm2, and compared the results with theoretical predictions for the brush thickness
with all input parameters fixed to the above-established values. The consistent match
within the experimental uncertainty revealed in Figure IV.5 provides additional support
to the applicability of the theoretical model to our experimental system.
Figure IV.6 Free energy predictions. Solid lines are predicted gains in free energy
per chain in the cross-linked neo-FG-domain brushes compared to the sticker-free SSSG
reference brush as a function of grafting density Γ. Dashed lines in corresponding colors
represent the total binding energy of the engaged stickers, which is . Values
were obtained based on the theoretically predicted thickness values shown in Figure
IV.5, and assuming .
IV.5.2 Free energy gains upon cross-linking
Using the derived parameters, it becomes possible to explore the free energy balance
upon assembly of the neo FG domains. Figure IV.6 (solid lines) shows the theoretically
predicted free energy gains per polymer chain in the cross-linked neo-FG-domain
brushes compared to the sticker-free SSSG reference brush. It can be seen that this
quantity increases rather weakly with grafting density and is typically small, in the
range of a few . A comparison with the total binding energy of the engaged stickers
(dashed lines in matching colors) reveals that other contributions to the free

Chapter IV Cross-linked polymer brush morphology
120
energy are significant, and that these can be positive or negative. Apparently, the
reduction in elastic energy and the enhancement in excluded volume interactions upon
cross-linking balance such that they make for a net extra energy gain in the case of
GSFG whereas there are penalties for GLFG and FSFG. Reassuringly, the magnitude of
is consistent with previously reported results obtained with brushes of the FG
domains of the native nucleoporin Nsp1 (180).
IV.6 DISCUSSION
We have developed an analytical mean-field theory to predict the morphology of
physically cross-linked brushes and, by correlating theory with experiment, estimated (i)
the effective excluded volume of the FG-motif free reference polymer, (ii) the binding
strength of inter-FG-motif interactions, and (iii) the morphology and degree of cross-
linking of neo-FG-domain films. The main results are that the reference polymer
effectively behaves like a homopolymer close to θ conditions ( ), that the
interaction of individual FG motifs is relatively weak ( ), and that only a
relatively small fraction of FG motifs is simultaneously engaged in cross-linking
( ).
It is likely that, on a qualitative level, these findings are also valid for native FG
domains at the concentrations that prevail inside the nuclear pore complex. A case in
point is the Nsp1 FG domain which is 600 amino acids (or 300 polymer segments) long
and features 33 FG motifs (18 FSFG and 15 other). We have previously reported the
thickness of films made from Nsp1 and from a FILVS mutant in which all
hydrophobic amino acids were replaced by the hydrophilic serine (Figure IV.3B in ref.
(180)). Using the here-described method, we can estimate from the Nsp1
FILVS film thickness, which is moderately larger than for our regular SSSG
construct yet again closer to zero than to the value of 0.5 expected for a polymer in good
solvent. The fraction of stickers per segment in Nsp1 is , and the thickness of
the Nsp1 brush was reduced by approximately 25% compared to the FILVS analogue.
Both values compare favorably with our neo FSFG domain, where (cf.
Table IV.1) and (cf. Figure IV.5), indicating that the mean sticker
strength in Nsp1 is comparable to the sticker strength in our neo FSFG domain.
Moreover, we also found that both neo FSFG domains and Nsp1 FG domains form
macroscopic hydrogels whereas the respective FS and FILVS analogues do not.

Chapter IV Cross-linked polymer brush morphology
121
Taken together, the correlation of the morphological effects of FSFG motifs in the neo-
FG-domain with FG motifs in the Nsp1 context is remarkably good. We thus propose
that the results obtained here can be generalized to native FG domains.
Evidently, native FG domains are diverse: they vary not only in FG motif type
(FxFG, GLFG and other) and the mean density and distribution of FG motifs along the
chain but also in the nature of the sequences that flank the FG motifs and more
generally in the composition of the spacer sequences. These variations may well
modulate the morphology of FG domain assemblies locally (e.g. as a function of
distance from the equator of the NPC (283)). Systematic studies will be needed to
resolve this question, where tailored regular neo FG domains can reveal, for example,
how important the flanking sequences are for the affinity between FG motifs.
IV.6.1 Implications for the morphology of FG domain assemblies
and the permeability barrier
In previous works (180, 281), we had analyzed the cohesive interactions between FG
domains using theoretical models that treat FG domains as regular polymers where all
interactions are effectively smeared out homogeneously along the polymer chain. In our
new, extended model, we consider the discreteness of stickers explicitly, and this
revealed that the homopolymer approximation describes brush thickness and density
profiles well in the limit of weak stickers ( ), but increasingly fails as the stickers
become stronger ( ) (Figure IV.1A-B). The values for our neo FG domains
are moderate to small (Figure IV.4B, right panel). We can hence conclude that the
homopolymer approximation, despite its simplicity, is satisfactory for predicting the
brush thickness and density profiles for all neo FG domains used here, and most likely
also for native FG domains. In particular, the effect of discrete cross-links to make
brushes more box like (Figures IV.1B and S2) is likely to be marginal for FG domains,
not only because is moderate but also because the equivalent sticker-free polymers
are like homopolymers close to θ conditions.
In the computational model by Zahn, Osmanovic et al. (281), we quantified the
effective attractive interaction between homopolymer segments by the parameter ,
and reported for the neo FSFG domain. A comparison of the
predictions of this model (Figure IV.3B in ref. (281)) with the thickness of the reference
SSSG film (Figure IV.5) reveals that FG motifs contribute only approximately
to this energy term. Thus, only about 25% of the attraction between neo FSFG

Chapter IV Cross-linked polymer brush morphology
122
domains comes from the FG motifs, whereas the rest is intrinsic to the (sticker-free)
polymer itself. In our new model, attractive interactions reduce the excluded volume
and, unsurprisingly, we see an equivalent effect: the reduction in excluded volume due
to attraction between SSSG polypeptides compared to polymers in good solvent
( ) is larger than the additional effect of the FSFG stickers
( ; recall that ). These comparisons highlight that
not only FG motifs but also the spacer regions between them contribute significantly to
the cohesion of FG domains.
IV.6.2 Implications for the permselectivity mechanism of the
permeability barrier
NTRs are known to be strongly enriched in the nuclear pore. Next to inter-FG-
domain interactions, the morphology and function of the permeability barrier are thus
also defined by NTRFG domain interactions, and it is instructive to compare the two.
Since inter-FG-domain as well as NTRFG domain interactions are mediated by FG
motifs and intrinsically multivalent, we need to discriminate the affinity of individual
inter-FG-motif and NTRFG motif interactions from the avidity of multivalent inter-
FG-domain and NTRFG domain interactions.
Milles et al. (259) recently determined dissociation constants of individual NTRFG
motif interactions in the context of a 78 amino acid long FG-rich strand of Nup153 and
found these to scatter around 1 mM irrespective of the NTR type for all FG motifs in the
sequence. With an equivalent strand in which all but one of the strongest binding FG
motifs were impaired by FA mutations, the Kd of the remaining NTRFG motif
interaction increased to 7 mM. Collectively, these data would suggest that individual
NTRFG motif interactions have Kd values in the lower 10 mM range. This is
comparable to (or slightly smaller than) the affinity of individual inter-FG-motif
interactions determined here, and implies that these two types of interactions can
effectively compete with each other.
How important is this competition? Based on work with two selected NTRs
(importin β and NTF2) and three selected FG domains (Nsp1, Nup98 and neo FSFG),
we have previously estimated that, within the range of physiological NTR and FG
domain concentrations, less than 20% of all FG motifs within FG domain assemblies
are simultaneously engaged in NTR binding (281). We show here that the fraction of
FG motifs engaged in inter-FG-domain interactions is also unlikely to exceed a few 10%

Chapter IV Cross-linked polymer brush morphology
123
(Figure IV.4B, right panel). Extrapolated to other FG domains and NTRs, this would
suggest that the total number of available FG motifs available in the NPC is more than
sufficient to allow for simultaneous FG-domain cross-linking and NTR binding.
However, the local arrangement of the participating molecules also affects
multivalent interactions and thus the avidity of NTRFG domain and inter-FG-domain
interactions. We propose that it is at this level that competing effects come into play.
Our recent finding that NTRs bind to FG domain films with negative cooperativity (281)
supports this hypothesis. Specifically, we had attributed the negative cooperativity to
the effect of excluded-volume interactions and entropic costs of NTR absorption that, in
turn, reduce the conformational freedom of the grafted and flexible FG domains. It can
hence be expected that NTR binding also effectively reduces the avidity of inter-FG-
domain interactions. The reduction in direct interactions between FG domains does not
imply an opening of the permeability barrier though, because cross-links between two
FG motifs are effectively replaced by FG-motifNTRFG-motif cross-links.
Another important aspect of permselectivity is the dynamics of interactions. Milles et
al. revealed NTRFG motif interactions to be ultrafast (259). The rates of individual
inter-FG-motif interactions are, to our knowledge, not known, but the low affinity of
these interactions and the small number of amino acids involved suggest that they are
also very fast, possibly as fast as (or even faster than) NTRFG motif interactions. With
all elementary interactions being short lived, it can thus be expected that the nuclear
pore permeability barrier is highly dynamic.
Taken together, the emerging picture is that NTRFG motif and inter-FG-motif
interactions co-exist. The short lifetime of all elementary interactions facilitates rapid
local rearrangements of the FG domain/NTR assembly and thus uptake and permeation
of nuclear transport receptors (NTRs) and their cargo. At the same time, the
multivalency of NTRFG domain interactions ensures adequate avidity to enrich NTRs
in the permeability barrier (thus enhancing their translocation compared to other
molecules of comparable size) and, together with the multivalent cohesive interactions
between FG domains, reduces the effective mesh size of the permeability barrier (thus
limiting the size of molecules that can permeate unhindered and optimizing size
selectivity (180)).
IV.6.3 Validity of the theory

Chapter IV Cross-linked polymer brush morphology
124
Our mean-field theory of physically cross-linked brushes predicted the
experimentally observed film thickness trends well (Figure IV.5) yet clearly remains a
simplified representation of the experimental neo-FG-domain brushes. Some
simplifications such as the assumption of the sticker-free reference polymer to be
homogeneous were made deliberately to be able to focus on generic features. Others
were needed to arrive at simple analytical expressions that reveal key parameters and
their dependencies without the need for heavy computational work.
Firstly, we assumed the chains to obey Gaussian elasticity on all length scales. This
approximation is likely to hold as long as the density of bonds (determined by and
) is small. This is the case in our experiments, but implies that theoretical predictions
(Figures IV.1 and S1-2) in cases where both and are large are unlikely to be
matched by any experiment.
Secondly, the model relies on the strong stretching approximation. In our
experiments (Figure IV.5), this is the case at the higher grafting densities (were )
but only marginally so at the lowest grafting densities (were ) (284). However,
since the cross-linked neo-FG-domain brushes are rather compact with a box-like
profile, excluded volume effects will dominate over elastic effects, and our model
therefore is expected to give reasonable results even if the brush is not much thicker
than the Flory radius of the polymer chains.
Thirdly, the value used for the third virial coefficient is a reasonable guess that
cannot be confirmed experimentally, and we also assumed the effective thickness
determined from the QCM-D data to be equivalent to the thickness defined in the theory.
The impact of these assumptions on the determination of (and thus and Kd) and
is likely to be small, because the trends in experimental and theoretical thickness are
likely to be comparable, and moderate systematic deviations in and would affect
the reference SSSG brush and the neo-FG-domain brushes to similar extents.
Finally, we considered binary associations between stickers and up to ternary
excluded volume interactions. The neglect of all higher-order interactions appears
appropriate for the analysis of our experiments, given that the normalized polymer
concentrations inside the brushes remain moderate ( , equivalent to
), but the theoretical predictions at the highest concentrations in Figures
IV.S1-2 will need to be considered with caution.

Chapter IV Cross-linked polymer brush morphology
125
Taken together, we can conclude that the theoretical model represents our
experimental system well and therefore expect the derived values for the strengths of
inter-FG-motif interactions and to be reasonably accurate.
IV.6.4 Future applications of the theory
The theory presented here is valid for physical (i.e. reversibly) cross-linked brushes,
for which the degree of cross-linking will adjust dynamically as environmental factors
such as solvent quality or grafting density are modified (Figure IV.1C). This case is
distinct from chemically (i.e. covalently) cross-linked brushes, where not only the
number of cross-links but also the conditions under which the cross-links are introduced
can appreciably influence the brush morphology (‘memory effect’), as pointed out in
recent theoretical work by Lang et al. (285).
The nuclear pore permeability barrier that we have considered here is not the only
biological system bearing resemblance to a physically cross-linked brush. Another
salient example is pericellular coats rich in the polysaccharide hyaluronan (HA). This
case is somewhat different from the case considered here in that soluble HA-binding
proteins constitute the cross-linking nodes (26, 28), and that the local stiffening of HA
chain makes the properties of the sticker-free brush distinct (20). These features could
be captured by future extensions of the model presented here.
The predictions of our theory of physically cross-linked brushes also make it possible
to rationally design novel synthetic polymer brushes with tailored stimuli-responsive
properties that could be useful in a broad range of applications. For example,
morphological changes upon cross-linking of brushes by soluble target molecules that
are selectively captured by recognition elements on polymers may be exploited for
biological or environmental sensing, and the modulation of cross-linking in polymer-
filled channels by environmental stimuli could be used to switch molecular transport
and sieving. Here, the range of high should be particularly interesting because new
morphologies become feasible that cannot be produced with homopolymers and simple
variations in solvent quality. In contrast to physical hydrogels, for which a wide range
of synthetic routes and applications have already been established (286), the current
literature on polymer brushes with discrete, reversible cross-links is sparse and much
remains to explore, though at least one work (287) has demonstrated how such brushes
can be produced synthetically.
Chapter IV Cross-linked polymer brush morphology
126
IV.7 CONCLUSION
We have developed a mean-field theory to describe the morphology of physically
cross-linked brushes. The theory predicts that the compaction and changes in the density
profile due to cross-links is equivalent to an effective reduction in excluded volume, by
, for weak stickers ( ) whereas a qualitatively new behavior arises for
stronger stickers. Specifically, a desired modulation of brush thickness can be achieved
with either a few strong stickers or many weak stickers, but a few strong stickers make
the brushes more box-like than many weak stickers. The theoretical model should be of
interest for the design of synthetic brushes with novel ‘smart’ properties, but also to
understand morphological remodeling and transport phenomena in biological systems,
such as the nuclear pore permeability barrier and glycan-rich or mucosal cell coats.
By using the theory to analyze experimental data on regular neo-FG-domain brushes we
revealed that individual inter-FG-motif interactions are rather weak (Kd > 10 mM) and
that only a fraction of FG motifs is simultaneously engaged in cross-links at FG domain
concentrations that are likely to prevail in the NPC. From this analysis a model for
permselectivity emerges in which the individual inter-FG-motif and NTRFG-motif
interactions all are of low affinity thus rendering the permeability barrier highly
dynamic and enabling rapid NTR translocation, whereas the avidity of the collective
inter-FG-domain and NTRFG-domain interactions is tuned to simultaneously promote
(i) the formation of a size-selective meshwork and (ii) selective entry (and thus
translocation) of NTRs with their cargo. Our soft matter physics approach thus
contributes important information towards understanding the mechanism of selective
gating of nucleo-cytoplasmic transport.
IV.8 SUPPORTING MATERIAL

Chapter IV Cross-linked polymer brush morphology
127
Figure IV.S1 Effect of stickers on the brush thickness. Theoretically predicted brush
thickness H as function of the attractive sticker volume (for selected
numbers of stickers per segment Fst; A), and as a function of Fst (for selected ,
expressed as with fixed ; B) for brushes in good solvent ( ; left) and θ
solvent ( ; right). The dotted lines on the top represent the thickness of the brush
without stickers (reached at ), and the dashed lines on the bottom the thickness of
the fully collapsed brush (N/s2 = 25). and Fst are indicated in the figure, and all other
parameter settings are listed in Table IV.1 (parameter set 1).

Chapter IV Cross-linked polymer brush morphology
128
Figure IV.S2 Effect of stickers on the brush density profile. We exploited the
parameters and , compared to the average density as
quantitative measures of the shape of the segment density profile. The information
provided by and can be appreciated by considering the extreme case of a ‘box’
profile, where the density is constant throughout the brush and drops to zero at .
In this case, . On the other hand, it is clear that in the general case
because the density profile decreases monotonously with under all
conditions, and that and will increasingly diverge from as the brush becomes
less compact. The relative deviations of and from , therefore, are
two interrelated measures for the homogeneity of the brush. The quantity
merges these into a single number, and the smaller the more box-like the
density profile.
(A) (black symbols) and (red symbols) over the range (in steps of 0.1)
for selected (expressed as with fixed ) as a function of for
brushes in good solvent ( ; left) and θ solvent ( ; right). All other parameter
settings are listed in Table IV.1 (parameter set 1). The ‘box profile’ limit is shown as
dashed lines for reference. (B) Selected data from A presented as in the

Chapter IV Cross-linked polymer brush morphology
129
form of a mesh of iso- lines (black solid lines) and iso- lines (red dashed lines). The
meshes formed by the iso- and iso- lines demonstrate that a given average segment
density (or equivalently, a given brush height ) can be reached with various
combinations of and (or ), and that a few strong stickers render the brush more
box-like than many weak stickers. Moreover, the difference in the area spanned by the
meshes illustrates that the diversity of possible morphologies is larger for brushes in
good solvent than in θ solvent.
Figure IV.S3 Estimation of grafting densities for QCM-D data lacking corresponding
SE data. Figure IV.2 illustrates that the maximal grafting density practically attainable
in the combined SE/QCM-D measurements is ~6.5 pmol/cm2 for SSSG, ~9 pmol/cm2
for GSFG and 11 pmol/cm2 for GLFG. Essentially, this is because the incubation
conditions required for combined SE/QCM-D measurements limit the applicable
solution concentration (because during the brief initial stirring for solution
homogenization (cf. Materials and Methods) binding should remain low). In
independent QCM-D measurements, however, higher grafting densities can be reached,
because these can be performed at higher concentrations, and with the application of
0 2 4 6 8 10 12
(pmol/cm2)
0 2 4 6 8 10 12
(pmol/cm2)
0 2 4 6 8 10 120
20
40
60
80
100
-f
(Hz)
(pmol/cm2)
C
3.1 M
GSFG
0 30 60 90 120Time (min)
3.0 M
GLFG
0 30 60 90
Time (min)
-80
-40
0
f
(Hz)
3.1 M
SSSG
0 30 60 90 120
0
3
6
9
D
(1
0-6
)
Time (min)
A
0 20 40 60 80
-f (Hz)
0 20 40 60 80
-f (Hz)
0 20 40 60 800.0
0.1
0.2
0.3
D
/-
f (1
0-6
/Hz)
-f (Hz)
B

Chapter IV Cross-linked polymer brush morphology
130
flow adsorption which is additionally enhanced when binding is mass-transport limited.
To be able to cover a large range of grafting densities in the comparison of theory with
experiment (Figure IV.5), we therefore performed independent QCM-D measurements
using a Q-Sense E4 system equipped with flow modules (Biolin Scientific AB; flow
rate 5 µL/min). The FG domain concentration for these measurements was 3 µM, and
we determined the film thickness at the end of the film formation processes by
viscoelastic modeling. To estimate the grafting density, we extrapolated reference
curves that relate Δf (measured by QCM-D) with Γ (measured by SE) obtained from
combined SE/QCM-D measurements.
(A) FG domain film formation monitored in independent QCM-D measurements.
Arrows on top of each panel indicate the start and duration of incubation with different
sample solutions; during remaining times, the surface was exposed to working buffer.
(B) ΔD/-Δf vs. -Δf plots obtained from the data in A (independent QCM-D
measurements; red symbols) and in Figure IV.2 (corresponding QCM-D measurements
combined with SE; black symbols). Data for large values of –Δf superpose well,
demonstrating that the film morphology at high coverage is not affected by the different
incubation conditions. The reduced ΔD/-Δf values for low –Δf in the independent
QCM-D measurements are likely due to heterogeneous surface coverage in the initial
phase of film formation (which is strongly affected by mass transport limitations). (C)
Representative reference curves (black open circles), obtained from the data in Figure
IV.2. Towards high grafting densities, extrapolation of a linear fit to the experimental
data over the largest 3 pmol/cm2 available (green dotted line) provides an upper bound
of Δf, and extrapolation of a quadratic fit over the largest 4 pmol/cm2 available (red
dashed line) a lower bound. The intersections of the interpolation lines with the
experimentally determined frequency shift (after film formation and rinsing) for the
independent QCM-D data (black horizontal line) thus determine the error range in the
grafting density (indicated as grey shaded area).

Chapter V Conclusions and perspectives
131
V Conclusions and perspectives
The objective of this thesis was to elucidate physical principles that underlie the
structure, mechanics and dynamic re-organization of HA-rich matrices. To address this
question, a systematic study covering distinct levels of matrix complexity was
performed. Salient structural and mechanical features of both native HA-rich ECM and
in-vitro reconstituted HA matrices at given conditions, which reflect the physical
principles of interest, were obtained from characterizations using AFM with optical
microscopy, and RICM and QCM-D, respectively. The properties of supramolecular
assemblies were linked to individual molecular features using polymer physics theory.
In the next paragraphs, the main findings of this study and the potential development
and impact on future studies are summarized.
V.1 CONCLUSIONS
We first successfully quantified the micromechanical response of an example of
native HA-rich matrix, the COC matrix, to compression by colloidal probe AFM. The
matrix was confirmed to be elastic rather than plastic or viscous. With a tailored
immobilization procedure and size of the colloidal probe, we determined the most
compliant parts of mouse COC matrix to have a Young’s modulus below 1 Pa. To our
knowledge, this is the lowest elastic modulus thus far determined for any mammalian
tissue. Another salient feature of the COC compressive mechanics is marked stiffening
in response to stress, which suggests a heterogeneous network structure in which mesh
size increases with distance from the oocyte perimeter. Through the combination of
mechanical and optical analysis, we discovered the presence of a thick cumulus free
coat that is particularly pronounced around in-vivo expanded matrix. The COC matrix
heterogeneity and the unique combination of elasticity and extreme softness may be
functionally important, in particular for the maintenance of COC integrity during
transport through the oviduct and for the proper selection, capture and guidance of
sperm.
Thereafter, we systematically analyzed the impact of a broad range of Ca2+
concentrations and pH on structural and mechanical properties of a simplified in-vitro
model of HA-rich matrices, the HA brush. The variations of thickness and softness of
HA brushes were characterized by RICM and QCM-D, respectively. On one hand, we
found the softness and thickness of HA brushes to be exquisitely sensitive to Ca2+
Chapter V Conclusions and perspectives
132
concentrations but essentially insensitive to pH within the physiologically relevant
ranges of these two parameters. These results are relevant for rationalizing the basic
physical properties of HA-rich matrices in biological systems. On the other hand, by
viewing a broad range of Ca2+
concentrations and pH, we discovered that the effect of
divalent calcium ions on HA brush thickness is virtually identical to the effect of
monovalent sodium ions at 10-fold higher concentrations, and that HA brushes collapse
upon protonation below pH 6.0.
Last but not least, we developed a mean-field theory to describe the effect of physical
(reversible) cross-links on the morphology of polymer brushes. This theory connects the
molecular properties of the constituents with the behaviour of the supramolecular
assemblies. The theory predicts that the compaction and changes in the density profile
due to cross-links is equivalent to an effective reduction in excluded volume (i.e. a
reduction in solvent quality) in the presence of weak cross-linking, whereas stronger
cross-linking makes the density profile more box-like than a reduction in solvent quality
for a given brush thickness. Specifically, a desired modulation of brush thickness can be
achieved with either a few strong stickers or many weak stickers, but a few strong
stickers make the brush density profile more box-like than many weak stickers. By
using the theory to analyze experimental data on regular neo-FG-domain brushes (a
model of the nuclear pore permeability barrier that has in common with HA-rich
matrices that it is made from flexible polymers), we quantified properties that were not
directly accessible in experiments, such as the strength of individual inter-FG-motif
interactions (which are rather weak, in the millimolar range) and the fraction of FG
motifs that is simultaneously engaged in cross-linking at FG domain concentrations that
are likely to prevail in the nuclear pore. Comparison of experiment also confirmed the
applicability of our theory.
V.2 PERSPECTIVES
Many questions remain that are related to the work in this thesis that can be
potentially developed in the future and facilitate a more comprehensive understanding
of the physical principles underlying the structure, mechanics and dynamic
reorganization of HA-rich matrices.
The micromechanical properties of native matrix, as we acquired on the COC matrix
in this thesis, are potentially mapped at higher resolution in three dimensions upon
improvement of the AFM setup and/or proper deconstruction of the complex native

Chapter V Conclusions and perspectives
133
matrix (e.g. cut the matrix into slices or dissociate the outer layer(s) by controlled
method). Such a mapping of micro or nanomechanical properties can be correlated with
future structural studies that measure the permeability of the matrix directly with probes
of different size and thus reflect the fine structure (i.e. mesh size and mesh size
distribution) of the matrix. Although varying environmental conditions impact on all
components within the native matrix and consequently identifying the contribution of
each component is challenging, it is possible to quantitatively characterize the structural
and mechanical properties of the matrix analogously in the presence of specific
activator/inhibitor of selected component to understand how the selected component
contribute to the matrix features. Indeed, the methods we have established should also
be valuable for characterization of hyaluronan-rich matrices in a wide range of other
cells and tissues.
Potential future work on in-vitro reconstituted HA brushes includes comparative
studies of the effect of different divalent ions, and possibly also monovalent and
trivalent ions on brush thickness, which may resolve the question of the mechanism
underlying the ten-fold potentiation of calcium over sodium ions with regard to brush
thickness variations. Moreover, the organization in native HA-rich matrices is far more
complex than the HA brushes investigated in this thesis. By adding other components of
native matrices, more complex in-vitro models can be reconstituted and analogous
mechanical and structural characterization can be performed on such more complex in-
vitro model, which should bring us closer to the behaviour of the native HA-rich
matrices. The results can benefit the rational design of synthetic HA-rich materials with
tailored properties (e.g. stimuli-responsive surface coatings).
We obtained good agreement between the developed theory describing the impact of
physical cross-links on polymer brush morphology and experimental data regarding
neo-FG-domain brushes as models of the nuclear pore permeability barrier in this thesis.
However, there are many more biological systems bearing resemblance to a physically
cross-linked brush, such as pericellular coats rich in HA that can be mimicked in in-
vitro studies by HA brushes as we used in this thesis. The case of such HA brushes is
somewhat different from the assumptions in our developed theory in that soluble HA-
binding proteins constitute the cross-linking nodes and that the local stiffening of HA
chains makes the properties of the brush distinct. Extensions of the model presented in
this thesis are required to capture these distinct features of HA brush, or other
biologically relevant systems. The theoretical model with further improvements should

Chapter V Conclusions and perspectives
134
be of interest for the design of synthetic brushes with novel properties, and also for
understanding morphological remodeling and transport phenomena in other biological
systems.
More generally, our results reflecting the physical principles underlying key features
of HA-rich matrices can potentially be integrated with the research on intracellular
space, to build up a comprehensive path of mechanotransduction covering dual
directions between the interstitial space and the nuclear. Moreover, the physical
principles found in this thesis can be combined with relevant biochemical principles, to
reveal how both aspects regulate each other. Finally, interventions that exploit
ultrastructural or mechanical properties based on physical principles can be potentially
considered for therapeutic applications that complement drugs designed relying on
biochemical interactions.

References
135
References
1. Frantz, C., K. M. Stewart, and V. M. Weaver. 2010. The extracellular matrix at a
glance. J. Cell Sci. 123:4195-4200.
2. Mouw, J. K., G. Ou, and V. M. Weaver. 2014. Extracellular matrix assembly: a
multiscale deconstruction. Nat. Rev. Mol. Cell Biol. 15:771-785.
3. Naba, A., K. R. Clauser, H. Ding, C. A. Whittaker, S. A. Carr, and R. O. Hynes.
2016. The extracellular matrix: Tools and insights for the “omics” era. Matrix
Biol. 49:10-24.
4. Humphrey, J. D., E. R. Dufresne, and M. A. Schwartz. 2014.
Mechanotransduction and extracellular matrix homeostasis. Nat. Rev. Mol. Cell
Biol. 15:802-812.
5. Hynes, R. O. 2009. The extracellular matrix: not just pretty fibrils. Science
326:1216-1219.
6. Charras, G., and E. Sahai. 2014. Physical influences of the extracellular
environment on cell migration. Nat. Rev. Mol. Cell Biol. 15:813-824.
7. Campbell, I. D., and M. J. Humphries. 2011. Integrin structure, activation, and
interactions. Cold Spring Harb. Perspect. Biol. 3.
8. Rozario, T., and D. W. DeSimone. 2010. The extracellular matrix in
development and morphogenesis: a dynamic view. Dev. Biol. 341:126-140.
9. Bonnans, C., J. Chou, and Z. Werb. 2014. Remodelling the extracellular matrix
in development and disease. Nat. Rev. Mol. Cell Biol. 15:786-801.
10. Daley, W. P., S. B. Peters, and M. Larsen. 2008. Extracellular matrix dynamics
in development and regenerative medicine. J. Cell Sci. 121:255-264.
11. Fraser, J. R., T. C. Laurent, and U. B. Laurent. 1997. Hyaluronan: its nature,
distribution, functions and turnover. J. Intern. Med. 242:27-33.
12. Laurent, T. C., and J. R. Fraser. 1992. Hyaluronan. FASEB J. 6:2397-2404.
13. Almond, A., A. Brass, and J. K. Sheehan. 2000. Oligosaccharides as model
systems for understanding water−biopolymer interaction: Hydrated dynamics of
a hyaluronan decamer. J. Phys. Chem. B 104:5634-5640.
14. Cleland, R. L., J. L. Wang, and D. M. Detweiler. 1982. Polyelectrolyte
properties of sodium hyaluronate. 2. Potentiometric titration of hyaluronic acid.
Macromolecules 15:386-395.
15. Day, A. J., and J. K. Sheehan. 2001. Hyaluronan: polysaccharide chaos to
protein organisation. Curr. Opin. Struct. Biol. 11:617-622.
16. Cleland, R. L. 1977. The persistence length of hyaluronic acid: an estimate from
small-angle x-ray scattering and intrinsic viscosity. Arch. Biochem. Biophys.
180:57-68.
17. Fouissac, E., M. Milas, M. Rinaudo, and R. Borsali. 1992. Influence of the ionic
strength on the dimensions of sodium hyaluronate. Macromolecules 25:5613-
5617.
18. Weigel, P. H., V. C. Hascall, and M. Tammi. 1997. Hyaluronan synthases. J.
Biol. Chem. 272:13997-14000.
19. Fan, Z., F. Zhang, T. Liu, and B. Q. Zuo. 2014. Effect of hyaluronan molecular
weight on structure and biocompatibility of silk fibroin/hyaluronan scaffolds.
Int. J. Biol. Macromol. 65:516-523.
20. Attili, S., O. V. Borisov, and R. P. Richter. 2012. Films of end-grafted
hyaluronan are a prototype of a brush of a strongly charged, semiflexible

References
136
polyelectrolyte with intrinsic excluded volume. Biomacromolecules 13:1466-
1477.
21. Grundelova, L., A. Mracek, V. Kasparkova, A. Minarik, and P. Smolka. 2013.
The influence of quarternary salt on hyaluronan conformation and particle size
in solution. Carbohydr. Polym. 98:1039-1044.
22. Suzuki, T., M. Suzuki, S. Ogino, R. Umemoto, N. Nishida, and I. Shimada.
2015. Mechanical force effect on the two-state equilibrium of the hyaluronan-
binding domain of CD44 in cell rolling. Proc. Natl. Acad. Sci. U. S. A.
112:6991-6996.
23. Wolny, P. M., S. Banerji, C. Gounou, A. R. Brisson, A. J. Day, D. G. Jackson,
and R. P. Richter. 2010. Analysis of CD44-hyaluronan interactions in an
artificial membrane system: insights into the distinct binding properties of high
and low molecular weight hyaluronan. J. Biol. Chem. 285:30170-30180.
24. Hall, C. L., and E. A. Turley. 1995. Hyaluronan: RHAMM mediated cell
locomotion and signaling in tumorigenesis. J. Neurooncol. 26:221-229.
25. Hamilton, S. R., S. F. Fard, F. F. Paiwand, C. Tolg, M. Veiseh, C. Wang, J. B.
McCarthy, M. J. Bissell, J. Koropatnick, and E. A. Turley. 2007. The
hyaluronan receptors CD44 and Rhamm (CD168) form complexes with ERK1,2
that sustain high basal motility in breast cancer cells. J. Biol. Chem. 282:16667-
16680.
26. Baranova, N. S., E. Nileback, F. M. Haller, D. C. Briggs, S. Svedhem, A. J. Day,
and R. P. Richter. 2011. The inflammation-associated protein TSG-6 cross-links
hyaluronan via hyaluronan-induced TSG-6 oligomers. J. Biol. Chem.
286:25675-25686.
27. Baranova, N. S., S. J. Foulcer, D. C. Briggs, V. Tilakaratna, J. J. Enghild, C. M.
Milner, A. J. Day, and R. P. Richter. 2013. Inter-alpha-inhibitor impairs TSG-6-
induced hyaluronan cross-linking. J. Biol. Chem. 288:29642-29653.
28. Baranova, N. S., A. Inforzato, D. C. Briggs, V. Tilakaratna, J. J. Enghild, D.
Thakar, C. M. Milner, A. J. Day, and R. P. Richter. 2014. Incorporation of
pentraxin 3 into hyaluronan matrices is tightly regulated and promotes matrix
cross-linking. J. Biol. Chem. 289:30481-30498.
29. Attili, S., and R. P. Richter. 2013. Self-assembly and elasticity of hierarchical
proteoglycan-hyaluronan brushes. Soft Matter 9:10473-10483.
30. Toole, B. P. 1990. Hyaluronan and its binding proteins, the hyaladherins. Curr.
Opin. Cell Biol. 2:839-844.
31. Chen, W. Y., and G. Abatangelo. 1999. Functions of hyaluronan in wound
repair. Wound Repair Regen. 7:79-89.
32. Koochekpour, S., G. J. Pilkington, and A. Merzak. 1995. Hyaluronic
acid/CD44H interaction induces cell detachment and stimulates migration and
invasion of human glioma cells in vitro. Int. J. Cancer 63:450-454.
33. Hardingham, T. E., and H. Muir. 1972. The specific interaction of hyaluronic
acid with cartilage proteoglycan. Biochim. Biophys. Acta 279:401-405.
34. Watanabe, H., Y. Yamada, and K. Kimata. 1998. Roles of aggrecan, a large
chondroitin sulfate proteoglycan, in cartilage structure and function. J. Biochem.
124:687-693.
35. Wu, Y. J., D. P. L. A. Pierre, J. Wu, A. J. Yee, and B. B. Yang. 2005. The
interaction of versican with its binding partners. Cell Res. 15:483-494.
36. Day, A. J., and C. A. de la Motte. 2005. Hyaluronan cross-linking: a protective
mechanism in inflammation? Trends Immunol. 26:637-643.

References
137
37. Marei, W. F., F. Ghafari, and A. A. Fouladi-Nashta. 2012. Role of hyaluronic
acid in maturation and further early embryo development of bovine oocytes.
Theriogenology 78:670-677.
38. Salustri, A., A. Camaioni, M. Di Giacomo, C. Fulop, and V. Hascall. 1999.
Hyaluronan and proteoglycans in ovarian follicles. Hum. Reprod. Update 5:293-
301.
39. Toole, B. P., and V. C. Hascall. 2002. Hyaluronan and tumor growth. Am. J.
Pathol. 161:745-747.
40. Lu, P., V. M. Weaver, and Z. Werb. 2012. The extracellular matrix: a dynamic
niche in cancer progression. J. Cell Biol. 196:395-406.
41. Plotnikov, S. V., A. M. Pasapera, B. Sabass, and C. M. Waterman. 2012. Force
fluctuations within focal adhesions mediate ECM-rigidity sensing to guide
directed cell migration. Cell 151:1513-1527.
42. Discher, D. E., P. Janmey, and Y. L. Wang. 2005. Tissue cells feel and respond
to the stiffness of their substrate. Science 310:1139-1143.
43. Hadjipanayi, E., V. Mudera, and R. A. Brown. 2009. Close dependence of
fibroblast proliferation on collagen scaffold matrix stiffness. J. Tissue Eng.
Regen. Med. 3:77-84.
44. Lo, C.-M., H.-B. Wang, M. Dembo, and Y.-l. Wang. 2000. Cell movement is
guided by the rigidity of the substrate. Biophys. J. 79:144-152.
45. Pathak, A., and S. Kumar. 2012. Independent regulation of tumor cell migration
by matrix stiffness and confinement. Proc. Natl. Acad. Sci. U. S. A. 109:10334-
10339.
46. Engler, A. J., S. Sen, H. L. Sweeney, and D. E. Discher. 2006. Matrix elasticity
directs stem cell lineage specification. Cell 126:677-689.
47. Wang, H.-B., M. Dembo, and Y.-L. Wang. 2000. Substrate flexibility regulates
growth and apoptosis of normal but not transformed cells. Am. J. Physiol. Cell
Physiol. 279:C1345-C1350.
48. Paszek, M. J., N. Zahir, K. R. Johnson, J. N. Lakins, G. I. Rozenberg, A. Gefen,
C. A. Reinhart-King, S. S. Margulies, M. Dembo, D. Boettiger, D. A. Hammer,
and V. M. Weaver. 2005. Tensional homeostasis and the malignant phenotype.
Cancer Cell 8:241-254.
49. Evanko, S. P., M. I. Tammi, R. H. Tammi, and T. N. Wight. 2007. Hyaluronan-
dependent pericellular matrix. Adv. Drug Deliv. Rev 59:1351-1365.
50. Han, L., A. J. Grodzinsky, and C. Ortiz. 2011. Nanomechanics of the Cartilage
Extracellular Matrix. Annu Rev Mater Res 41:133-168.
51. Talbot, P., C. Geiske, and M. Knoll. 1999. Oocyte pickup by the mammalian
oviduct. Mol. Biol. Cell 10:5-8.
52. Schneider, A., G. Francius, R. Obeid, P. Schwinte, J. Hemmerle, B. Frisch, P.
Schaaf, J. C. Voegel, B. Senger, and C. Picart. 2006. Polyelectrolyte multilayers
with a tunable Young's modulus: influence of film stiffness on cell adhesion.
Langmuir 22:1193-1200.
53. Russell, D. L., and A. Salustri. 2006. Extracellular matrix of the cumulus-oocyte
complex. Semin. Reprod. Med. 24:217-227.
54. Mochizuki, S., H. Vink, O. Hiramatsu, T. Kajita, F. Shigeto, J. A. Spaan, and F.
Kajiya. 2003. Role of hyaluronic acid glycosaminoglycans in shear-induced
endothelium-derived nitric oxide release. Am. J. Physiol. Heart Circ. Physiol.
285:H722-726.

References
138
55. Egeblad, M., M. G. Rasch, and V. M. Weaver. 2010. Dynamic interplay
between the collagen scaffold and tumor evolution. Curr. Opin. Cell Biol.
22:697-706.
56. Kass, L., J. T. Erler, M. Dembo, and V. M. Weaver. 2007. Mammary epithelial
cell: influence of extracellular matrix composition and organization during
development and tumorigenesis. Int. J. Biochem. Cell Biol. 39:1987-1994.
57. Russell, D. L., and R. L. Robker. 2007. Molecular mechanisms of ovulation: co-
ordination through the cumulus complex. Hum. Reprod. Update 13:289-312.
58. Chen, F. H., K. T. Rousche, and R. S. Tuan. 2006. Technology Insight: adult
stem cells in cartilage regeneration and tissue engineering. Nat Clin Pract
Rheum 2:373-382.
59. Esko, J. D., K. Kimata, and U. Lindahl. 2009. Proteoglycans and sulfated
glycosaminoglycans. In Essentials of Glycobiology. A. Varki, R. D. Cummings,
J. D. Esko, H. H. Freeze, P. Stanley, C. R. Bertozzi, G. W. Hart, and M. E.
Etzler, editors. Cold Spring Harbor Laboratory Press, NY.
60. Uyama, T., H. Kitagawa, and K. Sugahara. 2007. Biosynthesis of
Glycosaminoglycans and Proteoglycans. In Comprehensive Glycoscience. J. P.
Kamerling, editor. Elsevier, Oxford. 79-104.
61. Taylor, K. R., and R. L. Gallo. 2006. Glycosaminoglycans and their
proteoglycans: host-associated molecular patterns for initiation and modulation
of inflammation. FASEB J. 20:9-22.
62. Ori, A., M. C. Wilkinson, and D. G. Fernig. 2008. The heparanome and
regulation of cell function: structures, functions and challenges. Front. Biosci.
13:4309-4338.
63. Nap, R. J., and I. Szleifer. 2008. Structure and interactions of aggrecans:
statistical thermodynamic approach. Biophys. J. 95:4570-4583.
64. Cain, S. A., C. Baldock, J. Gallagher, A. Morgan, D. V. Bax, A. S. Weiss, C. A.
Shuttleworth, and C. M. Kielty. 2005. Fibrillin-1 interactions with heparin.
Implications for microfibril and elastic fiber assembly. J. Biol. Chem.
280:30526-30537.
65. Cain, S. A., A. K. Baldwin, Y. Mahalingam, B. Raynal, T. A. Jowitt, C. A.
Shuttleworth, J. R. Couchman, and C. M. Kielty. 2008. Heparan sulfate
regulates fibrillin-1 N- and C-terminal interactions. J. Biol. Chem. 283:27017-
27027.
66. Meyer, K., and J. W. Palmer. 1934. The polysaccharide of the vitreous humor. J.
Biol. Chem. 107:629-634.
67. Weissmann, B., and K. Meyer. 1954. The structure of hyalobiuronic acid and of
haluronic acid from umbilical cord1,2. J. Am. Chem. Soc. 76:1753-1757.
68. Hascall, V. C., and J. D. Esko. 2009. Hyaluronan. In Essentials of Glycobiology.
A. Varki, R. D. Cummings, J. D. Esko, H. H. Freeze, P. Stanley, C. R. Bertozzi,
G. W. Hart, and M. E. Etzler, editors. Cold Spring Harbor Laboratory Press,
NY.
69. Scott, J. E., C. Cummings, A. Brass, and Y. Chen. 1991. Secondary and tertiary
structures of hyaluronan in aqueous solution, investigated by rotary shadowing-
electron microscopy and computer simulation. Hyaluronan is a very efficient
network-forming polymer. Biochem. J. 274 ( Pt 3):699-705.
70. Scott, J. E., and F. Heatley. 1999. Hyaluronan forms specific stable tertiary
structures in aqueous solution: a 13C NMR study. Proc. Natl. Acad. Sci. U. S.
A. 96:4850-4855.

References
139
71. Gribbon, P., B. C. Heng, and T. E. Hardingham. 1999. The molecular basis of
the solution properties of hyaluronan investigated by confocal fluorescence
recovery after photobleaching. Biophys. J. 77:2210-2216.
72. Gribbon, P., B. C. Heng, and T. E. Hardingham. 2000. The analysis of
intermolecular interactions in concentrated hyaluronan solutions suggest no
evidence for chain-chain association. Biochem. J. 350:329-335.
73. DeAngelis, P. L., and P. H. Weigel. 1994. Immunochemical confirmation of the
primary structure of streptococcal hyaluronan synthase and synthesis of high
molecular weight product by the recombinant enzyme. Biochemistry 33:9033-
9039.
74. Markovitz, A., J. A. Cifonelli, and A. Dorfman. 1959. The biosynthesis of
hyaluronic acid by group A Streptococcus. VI. Biosynthesis from uridine
nucleotides in cell-free extracts. J. Biol. Chem. 234:2343-2350.
75. Philipson, L. H., and N. B. Schwartz. 1984. Subcellular localization of
hyaluronate synthetase in oligodendroglioma cells. J. Biol. Chem. 259:5017-
5023.
76. Prehm, P. 1984. Hyaluronate is synthesized at plasma membranes. Biochem. J.
220:597-600.
77. Cyphert, J. M., C. S. Trempus, and S. Garantziotis. 2015. Size matters:
molecular weight specificity of hyaluronan effects in cell biology. Int. J. Cell
Biol. 2015:563818.
78. Prehm, P. 1983. Synthesis of hyaluronate in differentiated teratocarcinoma cells.
Mechanism of chain growth. Biochem. J. 211:191-198.
79. Hascall, V. C., D. K. Heinegård, and T. N. Wight. 1991. Proteoglycans. In Cell
Biology of Extracellular Matrix: Second Edition. E. D. Hay, editor. Springer US,
Boston, MA. 149-175.
80. Prehm, P. 2006. Biosynthesis of hyaluronan: direction of chain elongation.
Biochem. J. 398:469-473.
81. Lidholt, K., J. L. Weinke, C. S. Kiser, F. N. Lugemwa, K. J. Bame, S. Cheifetz,
J. Massagué, U. Lindahl, and J. D. Esko. 1992. A single mutation affects both
N-acetylglucosaminyltransferase and glucuronosyltransferase activities in a
Chinese hamster ovary cell mutant defective in heparan sulfate biosynthesis.
Proc. Natl. Acad. Sci. U. S. A. 89:2267-2271.
82. Lidholt, K., and M. Fjelstad. 1997. Biosynthesis of the escherichia coli K4
capsule polysaccharide. A parallel system for studies of glycosyltransferases in
chondroitin formation. J. Biol. Chem. 272:2682-2687.
83. Salustri, A., C. Garlanda, E. Hirsch, M. De Acetis, A. Maccagno, B. Bottazzi, A.
Doni, A. Bastone, G. Mantovani, P. Beck Peccoz, G. Salvatori, D. J. Mahoney,
A. J. Day, G. Siracusa, L. Romani, and A. Mantovani. 2004. PTX3 plays a key
role in the organization of the cumulus oophorus extracellular matrix and in in
vivo fertilization. Development 131:1577-1586.
84. Eppig, J. J. 1980. Regulation of cumulus oophorus expansion by gonadotropins
in vivo and in vitro. Biol. Reprod. 23:545-552.
85. Salustri, A., M. Yanagishita, C. B. Underhill, T. C. Laurent, and V. C. Hascall.
1992. Localization and synthesis of hyaluronic acid in the cumulus cells and
mural granulosa cells of the preovulatory follicle. Dev. Biol. 151:541-551.
86. Salustri, A., M. Yanagishita, and V. C. Hascall. 1989. Synthesis and
accumulation of hyaluronic acid and proteoglycans in the mouse cumulus cell-
oocyte complex during follicle-stimulating hormone-induced mucification. J.
Biol. Chem. 264:13840-13847.

References
140
87. Fülöp, C., R. V. Kamath, Y. Li, J. M. Otto, A. Salustri, B. R. Olsen, T. T. Glant,
and V. C. Hascall. 1997. Coding sequence, exon–intron structure and
chromosomal localization of murine TNF-stimulated gene 6 that is specifically
expressed by expanding cumulus cell–oocyte complexes. Gene 202:95-102.
88. Fülöp, C., A. Salustri, and V. C. Hascall. 1997. Coding sequence of a
hyaluronan synthase homologue expressed during expansion of the mouse
cumulus-oocyte complex. Arch. Biochem. Biophys. 337:261-266.
89. Schoenfelder, M., and R. Einspanier. 2003. Expression of hyaluronan synthases
and corresponding hyaluronan receptors is differentially regulated during oocyte
maturation in cattle. Biol. Reprod. 69:269-277.
90. Kimura, N., Y. Konno, K. Miyoshi, H. Matsumoto, and E. Sato. 2002.
Expression of hyaluronan synthases and CD44 messenger RNAs in porcine
cumulus-oocyte complexes during in vitro maturation. Biol. Reprod. 66:707-
717.
91. Itano, N., T. Sawai, M. Yoshida, P. Lenas, Y. Yamada, M. Imagawa, T.
Shinomura, M. Hamaguchi, Y. Yoshida, Y. Ohnuki, S. Miyauchi, A. P. Spicer,
J. A. McDonald, and K. Kimata. 1999. Three isoforms of mammalian
hyaluronan synthases have distinct enzymatic properties. J. Biol. Chem.
274:25085-25092.
92. Alho, A. M., and C. B. Underhill. 1989. The hyaluronate receptor is
preferentially expressed on proliferating epithelial cells. J. Cell Biol. 108:1557-
1565.
93. Ohta, N., H. Saito, T. Kuzumaki, T. Takahashi, M. M. Ito, T. Saito, K.
Nakahara, and M. Hiroi. 1999. Expression of CD44 in human cumulus and
mural granulosa cells of individual patients in in-vitro fertilization programmes.
Mol. Hum. Reprod. 5:22-28.
94. Ball, G. D., M. L. Leibfried, R. W. Lenz, R. L. Ax, B. D. Bavister, and N. L.
First. 1983. Factors affecting successful in vitro fertilization of bovine follicular
oocytes. Biol. Reprod. 28:717-725.
95. Laufer, N., B. C. Tarlatzis, and F. Naftolin. 1984. In vitro fertilization: state of
the art. In Semin. Reprod. Endocrinol. Copyright© 1984 by Thieme Medical
Publishers, Inc. 197-219.
96. Foote, R. H. 1987. In vitro fertilization and embryo transfer in domestic animals:
applications in animals and implications for humans. J. In Vitro Fert. Embryo
Transf. 4:73-88.
97. Fatehi, A. N., B. A. J. Roelen, B. Colenbrander, E. J. Schoevers, B. M. Gadella,
M. M. Bevers, and R. van den Hurk. 2005. Presence of cumulus cells during in
vitro fertilization protects the bovine oocyte against oxidative stress and
improves first cleavage but does not affect further development. Zygote 13:177-
185.
98. Davis, B. J., D. E. Lennard, C. A. Lee, H. F. Tiano, S. G. Morham, W. C.
Wetsel, and R. Langenbach. 1999. Anovulation in cyclooxygenase-2-deficient
mice is restored by prostaglandin E2 and interleukin-1beta. Endocrinology
140:2685-2695.
99. Lam, X., C. Gieseke, M. Knoll, and P. Talbot. 2000. Assay and importance of
adhesive interaction between hamster (mesocricetus auratus) oocyte-cumulus
complexes and the oviductal epithelium. Biol. Reprod. 62:579-588.
100. Talbot, P., B. D. Shur, and D. G. Myles. 2003. Cell adhesion and fertilization:
steps in oocyte transport, sperm-zona pellucida interactions, and sperm-egg
fusion. Biol. Reprod. 68:1-9.

References
141
101. Mahi-Brown, C. A., and R. Yanagimachi. 1983. Parameters influencing ovum
pickup by oviductal fimbria in the golden hamster. Gamete Res. 8:1-10.
102. Odor, D. L., and R. J. Blandau. 1973. EGG transport over the fimbrial surface of
the rabbit oviduct under experimental conditions. Fertil. Steril. 24:292-300.
103. Eisenbach, M., and I. Tur-Kaspa. 1999. Do human eggs attract spermatozoa?
Bioessays 21:203-210.
104. Van Soom, A., S. Tanghe, I. De Pauw, D. Maes, and A. de Kruif. 2002.
Function of the cumulus oophorus before and during mammalian fertilization.
Reprod Domestic Anim 37:144-151.
105. Hong, S. J., P. C. Chiu, K. F. Lee, J. M. Tse, P. C. Ho, and W. S. Yeung. 2004.
Establishment of a capillary-cumulus model to study the selection of sperm for
fertilization by the cumulus oophorus. Hum. Reprod. 19:1562-1569.
106. Drahorád, J., J. Tesařík, D. Čechová, and V. Vilím. 1991. Proteins and
glycosaminoglycans in the intercellular matrix of the human cumulus-oophorus
and their effect on conversion of proacrosin to acrosin. Reproduction 93:253-
262.
107. Tesařik, J., L. Pilka, J. Drahorád, D. Čechová, and L. Veselský. 1988. The role
of cumulus cell-secreted proteins in the development of human sperm fertilizing
ability: implication in IVF. Hum. Reprod. 3:129-132.
108. Talbot, P., and G. DiCarlantonio. 1984. Architecture of the hamster oocyte-
cumulus complex. Gamete Res. 9:261-272.
109. Yudin, A. I., G. N. Cherr, and D. F. Katz. 1988. Structure of the cumulus matrix
and zona pellucida in the golden hamster: a new view of sperm interaction with
oocyte-associated extracellular matrices. Cell Tissue Res. 251:555-564.
110. Cherr, G. N., A. I. Yudin, and D. F. Katz. 1990. Organization of the hamster
cumulus extracellular matrix: A hyaluronate-glycoprotein gel which modulates
sperm access to the oocyte. Dev. Growth Differ. 32:353-365.
111. Yokoo, M., Y. Miyahayashi, T. Naganuma, N. Kimura, H. Sasada, and E. Sato.
2002. Identification of hyaluronic acid-binding proteins and their expressions in
porcine cumulus-oocyte complexes during in vitro maturation. Biol. Reprod.
67:1165-1171.
112. Bourguignon, L. Y., H. Zhu, B. Zhou, F. Diedrich, P. A. Singleton, and M. C.
Hung. 2001. Hyaluronan promotes CD44v3-Vav2 interaction with Grb2-
p185(HER2) and induces Rac1 and Ras signaling during ovarian tumor cell
migration and growth. J. Biol. Chem. 276:48679-48692.
113. Misra, S., S. Ghatak, and B. P. Toole. 2005. Regulation of MDR1 expression
and drug resistance by a positive feedback loop involving hyaluronan,
phosphoinositide 3-kinase, and ErbB2. J. Biol. Chem. 280:20310-20315.
114. Ghatak, S., S. Misra, and B. P. Toole. 2005. Hyaluronan constitutively regulates
ErbB2 phosphorylation and signaling complex formation in carcinoma cells. J.
Biol. Chem. 280:8875-8883.
115. Krasilnikov, M. A. 2000. Phosphatidylinositol-3 kinase dependent pathways: the
role in control of cell growth, survival, and malignant transformation.
Biochemistry (Mosc.) 65:59-67.
116. Zheng Shu, X., Y. Liu, F. S. Palumbo, Y. Luo, and G. D. Prestwich. 2004. In
situ crosslinkable hyaluronan hydrogels for tissue engineering. Biomaterials
25:1339-1348.
117. Borzacchiello, A., L. Russo, B. M. Malle, K. Schwach-Abdellaoui, and L.
Ambrosio. 2015. Hyaluronic acid based hydrogels for regenerative medicine
applications. Biomed Res Int 2015:871218.

References
142
118. Vanderhooft, J. L., M. Alcoutlabi, J. J. Magda, and G. D. Prestwich. 2009.
Rheological properties of cross-linked hyaluronan-gelatin hydrogels for tissue
engineering. Macromol. Biosci. 9:20-28.
119. Burdick, J. A., C. Chung, X. Jia, M. A. Randolph, and R. Langer. 2005.
Controlled degradation and mechanical behavior of photopolymerized
hyaluronic acid networks. Biomacromolecules 6:386-391.
120. Jeon, O., S. J. Song, K.-J. Lee, M. H. Park, S.-H. Lee, S. K. Hahn, S. Kim, and
B.-S. Kim. 2007. Mechanical properties and degradation behaviors of hyaluronic
acid hydrogels cross-linked at various cross-linking densities. Carbohydr Polym.
70:251-257.
121. Ouasti, S., R. Donno, F. Cellesi, M. J. Sherratt, G. Terenghi, and N. Tirelli.
2011. Network connectivity, mechanical properties and cell adhesion for
hyaluronic acid/PEG hydrogels. Biomaterials 32:6456-6470.
122. Miller, K., K. Chinzei, G. Orssengo, and P. Bednarz. 2000. Mechanical
properties of brain tissue in-vivo: experiment and computer simulation. J.
Biomech. 33:1369-1376.
123. O'Callaghan, R., K. M. Job, R. O. Dull, and V. Hlady. 2011. Stiffness and
heterogeneity of the pulmonary endothelial glycocalyx measured by atomic
force microscopy. Am. J. Physiol. Lung Cell Mol. Physiol. 301:L353-360.
124. McLane, L. T., P. Chang, A. Granqvist, H. Boehm, A. Kramer, J. Scrimgeour,
and J. E. Curtis. 2013. Spatial organization and mechanical properties of the
pericellular matrix on chondrocytes. Biophys. J. 104:986-996.
125. Prein, C., N. Warmbold, Z. Farkas, M. Schieker, A. Aszodi, and H. Clausen-
Schaumann. 2016. Structural and mechanical properties of the proliferative zone
of the developing murine growth plate cartilage assessed by atomic force
microscopy. Matrix Biol. 50:1-15.
126. Carr, M. E., and N. M. Hadler. 1980. Permeability of hyaluronic acid solutions.
Arthritis Rheum. 23:1371-1375.
127. Gabriel, D. A., and M. E. Carr, Jr. 1989. Calcium destabilizes and causes
conformational changes in hyaluronic acid. Am. J. Med. Sci. 298:8-14.
128. Napier, M. A., and N. M. Hadler. 1978. Effect of calcium on structure and
function of a hyaluronic acid matrix: carbon-13 nuclear magnetic resonance
analysis and the diffusional behavior of small solutes. Proc. Natl. Acad. Sci. U.
S. A. 75:2261-2265.
129. Ghosh, K., X. Z. Shu, R. Mou, J. Lombardi, G. D. Prestwich, M. H. Rafailovich,
and R. A. Clark. 2005. Rheological characterization of in situ cross-linkable
hyaluronan hydrogels. Biomacromolecules 6:2857-2865.
130. Attili, S., and R. P. Richter. 2012. Combining colloidal probe atomic force and
reflection interference contrast microscopy to study the compressive mechanics
of hyaluronan brushes. Langmuir 28:3206-3216.
131. Fujii, T., Y. L. Sun, K. N. An, and Z. P. Luo. 2002. Mechanical properties of
single hyaluronan molecules. J. Biomech. 35:527-531.
132. Nilebäck, E., F. Westberg, J. Deinum, and S. Svedhem. 2010. Viscoelastic
sensing of conformational changes in plasminogen induced upon binding of low
molecular weight compounds. Anal. Chem. 82:8374-8376.
133. Nilebäck, E., L. Feuz, H. Uddenberg, R. Valiokas, and S. Svedhem. 2011.
Characterization and application of a surface modification designed for QCM-D
studies of biotinylated biomolecules. Biosens. Bioelectron. 28:407-413.
134. Rebsdat, S., and D. Mayer. 2000. Ethylene Glycol. In Ullmann's Encyclopedia
of Industrial Chemistry. Wiley-VCH Verlag GmbH & Co. KGaA.

References
143
135. Chen, X., W. W. Qoutah, P. Free, J. Hobley, D. G. Fernig, and D. Paramelle.
2012. Features of thiolated ligands promoting resistance to ligand exchange in
self-assembled monolayers on gold nanoparticles. Aust. J. Chem. 65:266-274.
136. Prime, K. L., and G. M. Whitesides. 1993. Adsorption of proteins onto surfaces
containing end-attached oligo(ethylene oxide): a model system using self-
assembled monolayers. J. Am. Chem. Soc. 115:10714-10721.
137. Hoffmann, J., J. Groll, J. Heuts, H. Rong, D. Klee, G. Ziemer, M. Moeller, and
H. P. Wendel. 2006. Blood cell and plasma protein repellent properties of star-
PEG-modified surfaces. J. Biomater. Sci. Polym. Ed. 17:985-996.
138. Lokanathan, A. R., S. Zhang, V. R. Regina, M. A. Cole, R. Ogaki, M. Dong, F.
Besenbacher, R. L. Meyer, and P. Kingshott. 2011. Mixed poly (ethylene glycol)
and oligo (ethylene glycol) layers on gold as nonfouling surfaces created by
backfilling. Biointerphases 6:180-188.
139. Ostuni, E., L. Yan, and G. M. Whitesides. 1999. The interaction of proteins and
cells with self-assembled monolayers of alkanethiolates on gold and silver.
Colloids Surf. B. Biointerfaces 15:3-30.
140. Chen, S., J. Zheng, L. Li, and S. Jiang. 2005. Strong resistance of
phosphorylcholine self-assembled monolayers to protein adsorption: insights
into nonfouling properties of zwitterionic materials. J. Am. Chem. Soc.
127:14473-14478.
141. Migliorini, E., D. Thakar, R. Sadir, T. Pleiner, F. Baleux, H. Lortat-Jacob, L.
Coche-Guerente, and R. P. Richter. 2014. Well-defined biomimetic surfaces to
characterize glycosaminoglycan-mediated interactions on the molecular,
supramolecular and cellular levels. Biomaterials 35:8903-8915.
142. Altgarde, N., E. Nileback, L. de Battice, I. Pashkuleva, R. L. Reis, J. Becher, S.
Moller, M. Schnabelrauch, and S. Svedhem. 2013. Probing the biofunctionality
of biotinylated hyaluronan and chondroitin sulfate by hyaluronidase degradation
and aggrecan interaction. Acta Biomater. 9:8158-8166.
143. Haeussling, L., H. Ringsdorf, F. J. Schmitt, and W. Knoll. 1991. Biotin-
functionalized self-assembled monolayers on gold: surface plasmon optical
studies of specific recognition reactions. Langmuir 7:1837-1840.
144. Richter, R. P., K. K. Hock, J. Burkhartsmeyer, H. Boehm, P. Bingen, G. Wang,
N. F. Steinmetz, D. J. Evans, and J. P. Spatz. 2007. Membrane-grafted
hyaluronan films: a well-defined model system of glycoconjugate cell coats. J.
Am. Chem. Soc. 129:5306-5307.
145. Binnig, G., C. F. Quate, and C. Gerber. 1986. Atomic force microscope. Phys.
Rev. Lett. 56:930-933.
146. Hutter, J. L., and J. Bechhoefer. 1993. Calibration of atomic force microscope
tips. Rev. Sci. Instrum 64:1868-1873.
147. Franze, K., M. Francke, K. Gunter, A. F. Christ, N. Korber, A. Reichenbach, and
J. Guck. 2011. Spatial mapping of the mechanical properties of the living retina
using scanning force microscopy. Soft Matter 7:3147-3154.
148. Gautier, H. O. B., A. J. Thompson, S. Achouri, D. E. Koser, K. Holtzmann, E.
Moeendarbary, and K. Franze. 2015. Atomic force microscopy based force
measurements on animal cells and tissues. In Methods Cell Biol. K. P. Ewa,
editor. Academic Press. 211-235.
149. Ng, L., H. H. Hung, A. Sprunt, S. Chubinskaya, C. Ortiz, and A. Grodzinsky.
2007. Nanomechanical properties of individual chondrocytes and their
developing growth factor-stimulated pericellular matrix. J. Biomech. 40:1011-
1023.

References
144
150. Staunton, J. R., B. L. Doss, S. Lindsay, and R. Ros. 2016. Correlating confocal
microscopy and atomic force indentation reveals metastatic cancer cells stiffen
during invasion into collagen I matrices. Sci. Rep. 6:19686.
151. Guo, D., J. Li, G. Xie, Y. Wang, and J. Luo. 2014. Elastic properties of
polystyrene nanospheres evaluated with atomic force microscopy: size effect
and error analysis. Langmuir 30:7206-7212.
152. Stolz, M., R. Gottardi, R. Raiteri, S. Miot, I. Martin, R. Imer, U. Staufer, A.
Raducanu, M. Duggelin, W. Baschong, A. U. Daniels, N. F. Friederich, A.
Aszodi, and U. Aebi. 2009. Early detection of aging cartilage and osteoarthritis
in mice and patient samples using atomic force microscopy. Nat. Nanotechnol.
4:186-192.
153. Butt, H.-J. 1991. Electrostatic interaction in atomic force microscopy. Biophys.
J. 60:777-785.
154. Ducker, W. A., T. J. Senden, and R. M. Pashley. 1991. Direct measurement of
colloidal forces using an atomic force microscope. Nature 353:239-241.
155. Feiler, A., M. A. Plunkett, and M. W. Rutland. 2003. Atomic force microscopy
measurements of adsorbed polyelectrolyte layers. 1. Dynamics of forces and
friction. Langmuir 19:4173-4179.
156. Dimitriadis, E. K., F. Horkay, J. Maresca, B. Kachar, and R. S. Chadwick. 2002.
Determination of elastic moduli of thin layers of soft material using the atomic
force microscope. Biophys. J. 82:2798-2810.
157. Butt, H.-J., B. Cappella, and M. Kappl. 2005. Force measurements with the
atomic force microscope: Technique, interpretation and applications. Surf. Sci.
Rep. 59:1-152.
158. Hertz, H. 1881. Ueber die Berührung fester elastischer Körper. J. Reine Angew.
Math. 92:156-171.
159. Poisson, S. D. 1827. Note sur l'Extension des Fils et des Plaques élastiques. Ann.
Chim. Phys. 36:384-387.
160. Greaves, G. N., A. L. Greer, R. S. Lakes, and T. Rouxel. 2011. Poisson's ratio
and modern materials. Nat Mater 10:823-837.
161. Reviakine, I., D. Johannsmann, and R. P. Richter. 2011. Hearing what you
cannot see and visualizing what you hear: interpreting quartz crystal
microbalance data from solvated interfaces. Anal. Chem. 83:8838-8848.
162. Johannsmann, D. 2008. Viscoelastic, mechanical, and dielectric measurements
on complex samples with the quartz crystal microbalance. Phys. Chem. Chem.
Phys. 10:4516-4534.
163. Marx, K. A. 2003. Quartz crystal microbalance: a useful tool for studying thin
polymer films and complex biomolecular systems at the solution-surface
interface. Biomacromolecules 4:1099-1120.
164. Valasek, J. 1921. Piezo-electric and allied phenomena in rochelle salt. Phys.
Rev. 17:475-481.
165. Rodahl, M., F. Höök, A. Krozer, P. Brzezinski, and B. Kasemo. 1995. Quartz
crystal microbalance setup for frequency and Q‐ factor measurements in
gaseous and liquid environments. Rev. Sci. Instrum 66:3924-3930.
166. Sauerbrey, G. 1959. Verwendung von Schwingquarzen zur Wägung dünner
Schichten und zur Mikrowägung. Z. Phys. 155:206-222.
167. Eisele, N. B., F. I. Andersson, S. Frey, and R. P. Richter. 2012. Viscoelasticity
of thin biomolecular films: a case study on nucleoporin phenylalanine-glycine
repeats grafted to a histidine-tag capturing QCM-D sensor. Biomacromolecules
13:2322-2332.
References
145
168. Curtis, A. S. 1964. The mechanism of adhesion of cells to glass. a study by
interference reflection microscopy. J. Cell Biol. 20:199-215.
169. Limozin, L., and K. Sengupta. 2009. Quantitative reflection interference contrast
microscopy (RICM) in soft matter and cell adhesion. Chemphyschem 10:2752-
2768.
170. Weber, I. 2001. Interference reflection microscopy. In eLS. John Wiley & Sons,
Ltd.
171. Kühner, M., and E. Sackmann. 1996. Ultrathin hydrated dextran films grafted on
glass: preparation and characterization of structural, viscous, and elastic
properties by quantitative microinterferometry. Langmuir 12:4866-4876.
172. Raedler, J., and E. Sackmann. 1992. On the measurement of weak repulsive and
frictional colloidal forces by reflection interference contrast microscopy.
Langmuir 8:848-853.
173. Flory, P. J. 1953. Principles of polymer chemistry. Cornell University Press,
Ithaca,.
174. de Gennes, P. G. 1979. Scaling concepts in polymer physics. Cornell University
Press, Ithaca, N.Y.
175. Rubinstein, M., and R. H. Colby. 2003. Polymer physics. Oxford University
Press, Oxford ; New York.
176. de Gennes, P. G. 1976. Scaling theory of polymer adsorption. J. Phys. France
37:1445-1452.
177. Pincus, P. 1991. Colloid stabilization with grafted polyelectrolytes.
Macromolecules 24:2912-2919.
178. Zhulina, E. B., J. Klein Wolterink, and O. V. Borisov. 2000. Screening effects in
a polyelectrolyte brush: self-consistent-field theory. Macromolecules 33:4945-
4953.
179. Borisov, O. V., E. B. Zhulina, and T. M. Birshtein. 1994. Diagram of the states
of a grafted polyelectrolyte layer. Macromolecules 27:4795-4803.
180. Eisele, N. B., A. A. Labokha, S. Frey, D. Gorlich, and R. P. Richter. 2013.
Cohesiveness tunes assembly and morphology of FG nucleoporin domain
meshworks - Implications for nuclear pore permeability. Biophys J 105:1860-
1870.
181. Zhulina, Y. B., V. A. Pryamitsyn, and O. V. Borisov. 1989. Structure and
conformational transitions in grafted polymer chain layers. A new theory.
Polym. Sci. (USSR) 31:205-216.
182. Zhulina, E. B., O. V. Borisov, and V. A. Priamitsyn. 1990. Theory of steric
stabilization of colloid dispersions by grafted polymers. J. Colloid Interface Sci.
137:495-511.
183. Chakrabarti, A., and R. Toral. 1990. Density profile of terminally anchored
polymer chains: a Monte Carlo study. Macromolecules 23:2016-2021.
184. Murat, M., and G. S. Grest. 1989. Structure of a grafted polymer brush: a
molecular dynamics simulation. Macromolecules 22:4054-4059.
185. de Gennes, P. G. 1987. Polymers at an interface; a simplified view. Adv. Colloid
Interface Sci. 27:189-209.
186. Milner, S. T., T. A. Witten, and M. E. Cates. 1988. Theory of the grafted
polymer brush. Macromolecules 21:2610-2619.
187. Milner, S. T. 1991. Polymer brushes. Science 251:905-914.
188. Zhulina, E. B., O. V. Borisov, and T. M. Birshtein. 1992. Structure of grafted
polyelectrolyte layer. J. Phys. II France 2:63-74.

References
146
189. Zhulina, E. B., and O. V. Borisov. 1997. Structure and interaction of weakly
charged polyelectrolyte brushes: Self-consistent field theory. J. Chem. Phys.
107:5952-5967.
190. Chen, L., S. J. Mao, and W. J. Larsen. 1992. Identification of a factor in fetal
bovine serum that stabilizes the cumulus extracellular matrix. A role for a
member of the inter-alpha-trypsin inhibitor family. J. Biol. Chem. 267:12380-
12386.
191. Fülöp, C., S. Szántó, D. Mukhopadhyay, T. Bárdos, R. V. Kamath, M. S. Rugg,
A. J. Day, A. Salustri, V. C. Hascall, T. T. Glant, and K. Mikecz. 2003. Impaired
cumulus mucification and female sterility in tumor necrosis factor-induced
protein-6 deficient mice. Development 130:2253-2261.
192. Zhuo, L., M. Yoneda, M. Zhao, W. Yingsung, N. Yoshida, Y. Kitagawa, K.
Kawamura, T. Suzuki, and K. Kimata. 2001. Defect in SHAP-hyaluronan
complex causes severe female infertility. A study by inactivation of the bikunin
gene in mice. J. Biol. Chem. 276:7693-7696.
193. Scarchilli, L., A. Camaioni, B. Bottazzi, V. Negri, A. Doni, L. Deban, A.
Bastone, G. Salvatori, A. Mantovani, G. Siracusa, and A. Salustri. 2007. PTX3
interacts with inter-alpha-trypsin inhibitor: implications for hyaluronan
organization and cumulus oophorus expansion. J. Biol. Chem. 282:30161-
30170.
194. Rienzi, L., G. Vajta, and F. Ubaldi. 2011. Predictive value of oocyte
morphology in human IVF: a systematic review of the literature. Hum. Reprod.
Update 17:34-45.
195. Dunn, P. F., and B. F. Picologlou. 1976. Viscoelastic properties of cumulus
oophorus. Biorheology 13:379-384.
196. Blandau, R. J., and J. L. Boling. 1973. An experimental approach to the study of
egg transport through the oviducts of mammals. In Regulation of mammalian
reproduction. S. J. Segal, R. Crozier, P. A. Corfman, and P. G. Condliffe,
editors. Springfield, Illinois, Charles C. Thomas, United States. 400-415.
197. Boehm, H., T. A. Mundinger, C. H. J. Boehm, V. Hagel, U. Rauch, J. P. Spatz,
and J. E. Curtis. 2009. Mapping the mechanics and macromolecular organization
of hyaluronan-rich cell coats. Soft Matter 5:4331-4337.
198. Gambini, C., B. Abou, A. Ponton, and Annemiek J. M. Cornelissen. 2012.
Micro- and Macrorheology of Jellyfish Extracellular Matrix. Biophys. J. 102:1-
9.
199. Sokolov, I., S. Iyer, V. Subba-Rao, R. M. Gaikwad, and C. D. Woodworth.
2007. Detection of surface brush on biological cells in vitro with atomic force
microscopy. Appl. Phys. Lett. 91:023902.
200. Lu, Y. B., K. Franze, G. Seifert, C. Steinhauser, F. Kirchhoff, H. Wolburg, J.
Guck, P. Janmey, E. Q. Wei, J. Kas, and A. Reichenbach. 2006. Viscoelastic
properties of individual glial cells and neurons in the CNS. Proc. Natl. Acad.
Sci. U. S. A. 103:17759-17764.
201. Di Giacomo, M., A. Camaioni, F. G. Klinger, R. Bonfiglio, and A. Salustri.
2016. Cyclic AMP-elevating Agents Promote Cumulus Cell Survival and
Hyaluronan Matrix Stability, Thereby Prolonging the Time of Mouse Oocyte
Fertilizability. J. Biol. Chem. 291:3821-3836.
202. Naldini, L., U. Blomer, P. Gallay, D. Ory, R. Mulligan, F. H. Gage, I. M.
Verma, and D. Trono. 1996. In vivo gene delivery and stable transduction of
nondividing cells by a lentiviral vector. Science 272:263-267.

References
147
203. Sneddon, I. N. 1965. The relation between load and penetration in the
axisymmetric boussinesq problem for a punch of arbitrary profile. Int. J. Eng.
Sci. 3:47-57.
204. Liu, C., E. S. Litscher, S. Mortillo, Y. Sakai, R. A. Kinloch, C. L. Stewart, and
P. M. Wassarman. 1996. Targeted disruption of the mZP3 gene results in
production of eggs lacking a zona pellucida and infertility in female mice. Proc.
Natl. Acad. Sci. U. S. A. 93:5431-5436.
205. Rico, F., P. Roca-Cusachs, N. Gavara, R. Farré, M. Rotger, and D. Navajas.
2005. Probing mechanical properties of living cells by atomic force microscopy
with blunted pyramidal cantilever tips. Physical Review E 72:021914.
206. Levental, I., P. C. Georges, and P. A. Janmey. 2007. Soft biological materials
and their impact on cell function. Soft Matter 3:299-306.
207. Velegol, D., and F. Lanni. 2001. Cell traction forces on soft biomaterials. I.
Microrheology of type I collagen gels. Biophys. J. 81:1786-1792.
208. Hu, Y., X. Zhao, J. J. Vlassak, and Z. Suo. 2010. Using indentation to
characterize the poroelasticity of gels. Appl. Phys. Lett. 96:121904.
209. Moeendarbary, E., L. Valon, M. Fritzsche, A. R. Harris, D. A. Moulding, A. J.
Thrasher, E. Stride, L. Mahadevan, and G. T. Charras. 2013. The cytoplasm of
living cells behaves as a poroelastic material. Nat Mater 12:253-261.
210. Lieleg, O., and K. Ribbeck. 2011. Biological Hydrogels as Selective Diffusion
Barriers. Trends Cell Biol. 21:543-551.
211. Dunning, K. R., M. Lane, H. M. Brown, C. Yeo, R. L. Robker, and D. L.
Russell. 2007. Altered composition of the cumulus-oocyte complex matrix
during in vitro maturation of oocytes. Hum. Reprod. 22:2842-2850.
212. Drobnis, E. Z., A. I. Yudin, G. N. Cherr, and D. F. Katz. 1988. Kinematics of
hamster sperm during penetration of the cumulus cell matrix. Gamete Res.
21:367-383.
213. Coticchio, G., M. A. Bonu, R. Sciajno, E. Sereni, V. Bianchi, and A. Borini.
2007. Truths and myths of oocyte sensitivity to controlled rate freezing.
Reproductive BioMedicine Online 15:24-30.
214. Cappella, B., and G. Dietler. 1999. Force-distance curves by atomic force
microscopy. Surf. Sci. Rep. 34:1-104.
215. Johnson, K. L., K. Kendall, and A. D. Roberts. 1971. Surface Energy and the
Contact of Elastic Solids. Proc. R. Soc. London, Ser. A 324:301-313.
216. Bourguignon, L. Y., V. B. Lokeshwar, X. Chen, and W. G. Kerrick. 1993.
Hyaluronic acid-induced lymphocyte signal transduction and HA receptor
(GP85/CD44)-cytoskeleton interaction. J. Immunol. 151:6634-6644.
217. Fraser, S. P. 1997. Hyaluronan activates calcium-dependent chloride currents in
Xenopus oocytes. FEBS Lett. 404:56-60.
218. Jessen, T. E., and L. Odum. 2004. TSG-6 and calcium ions are essential for the
coupling of inter-alpha-trypsin inhibitor to hyaluronan in human synovial fluid.
Osteoarthritis Cartilage 12:142-148.
219. Lenormand, H., and J.-C. Vincent. 2011. pH effects on the hyaluronan
hydrolysis catalysed by hyaluronidase in the presence of proteins: Part II. The
electrostatic hyaluronan – Protein complexes. Carbohydr. Polym. 85:303-311.
220. Morra, M., and C. Cassineli. 1999. Non-fouling properties of polysaccharide-
coated surfaces. J. Biomater. Sci. Polym. Ed. 10:1107-1124.
221. Horkay, F., P. J. Basser, D. J. Londono, A. M. Hecht, and E. Geissler. 2009.
Ions in hyaluronic acid solutions. J. Chem. Phys. 131:184902.

References
148
222. Buhler, E., and F. Boué. 2004. Chain persistence length and structure in
hyaluronan solutions: Ionic strength dependence for a model semirigid
polyelectrolyte. Macromolecules 37:1600-1610.
223. Chakrabarti, B., and E. A. Balazs. 1973. Optical properties of hyaluronic acid:
Ultraviolet circular dichroism and optical rotatory dispersion. J. Mol. Biol.
78:135-141.
224. Winter, W. T., and S. Arnott. 1977. Hyaluronic acid: the role of divalent cations
in conformation and packing. J. Mol. Biol. 117:761-784.
225. Gatej, I., M. Popa, and M. Rinaudo. 2005. Role of the pH on hyaluronan
behavior in aqueous solution. Biomacromolecules 6:61-67.
226. Maleki, A., A. L. Kjøniksen, and N. Bo. 2008. Effect of pH on the behavior of
hyaluronic acid in dilute and semidilute aqueous solutions. Macromol. Symp.
274:131–140.
227. Schilling, J., K. Sengupta, S. Goennenwein, A. R. Bausch, and E. Sackmann.
2004. Absolute interfacial distance measurements by dual-wavelength reflection
interference contrast microscopy. Phys. Rev. E Stat. Nonlin. Soft Matter Phys.
69:021901.
228. Takahashi, R., S. Al-Assaf, P. A. Williams, K. Kubota, A. Okamoto, and K.
Nishinari. 2003. Asymmetrical-flow field-flow fractionation with on-line
multiangle light scattering detection. 1. Application to wormlike chain analysis
of weakly stiff polymer chains. Biomacromolecules 4:404-409.
229. Ligoure, C., and L. Leibler. 1990. Thermodynamics and kinetics of grafting end-
functionalized polymers to an interface. J. Phys. (France) 51:1313-1328.
230. Mohan, C. 2006. Buffers. A guide for the preparation and use of buffers in
biological systems. EMD Bioscience
231. Borisov, O. V., Y. B. Zhulina, and T. M. Birshtein. 1988. Constitutional diagram
and collapse of grafted chain layers. Polym. Sci. (USSR) 30:772-779.
232. Zhulina, E. B., T. M. Birshtein, V. A. Priamitsyn, and L. I. Klushin. 1995.
Inhomogeneous Structure of Collapsed Polymer Brushes Under Deformation.
Macromolecules 28:8612-8620.
233. Gura, E., M. Hückel, and P. J. Müller. 1998. Specific degradation of hyaluronic
acid and its rheological properties. Polym. Degradation Stab. 59:297-302.
234. Sivasankar, S., S. Subramaniam, and D. Leckband. 1998. Direct molecular level
measurements of the electrostatic properties of a protein surface. Proc. Natl.
Acad. Sci. U. S. A. 95:12961-12966.
235. Balazs, E. A., and J. Cui. 2013. The story of “Hyaluronan putty”. Bioact.
Carbohydr. Dietary Fibre 2:143-151.
236. Wu, S., L. Ai, J. Chen, J. Kang, and S. W. Cui. 2013. Study of the mechanism of
formation of hyaluronan putty at pH 2.5: Part II—Theoretical analysis.
Carbohydr. Polym. 98:1683-1688.
237. Israelachvili, J. N. 2011. Chapter 14 - Electrostatic forces between surfaces in
liquids. In Intermolecular and Surface Forces (Third Edition). Academic Press,
San Diego. 291-340.
238. Zhulina, E. B., R. Israels, and G. J. Fleer. 1994. Theory of planar polyelectrolyte
brush immersed in solution of asymmetric salt. Colloids Surf. A: Physicochem.
Eng. Asp. 86:11-24.
239. Zhulina, E. 1996. Equilibrium structure of ionizable polymer brushes. In
Solvents and Self-Organization of Polymers. S. E. Webber, P. Munk, and Z.
Tuzar, editors. Springer Netherlands, Dordrecht. 227-258.

References
149
240. Winter, W. T., and S. Arnott. 1977. Hyaluronic acid: the role of divalent cations
in conformation and packing. J. Mol. Biol. 117:761-784.
241. Fujiwara, H. 2007. Principles of optics. In Spectroscopic Ellipsometry. John
Wiley & Sons, Ltd. 13-48.
242. Fahrenkrog, B., and U. Aebi. 2003. The nuclear pore complex:
nucleocytoplasmic transport and beyond. Nat. Rev. Mol. Cell Biol. 4:757-766.
243. Grossman, E., O. Medalia, and M. Zwerger. 2012. Functional architecture of the
nuclear pore complex. Annual review of biophysics 41:557-584.
244. Fernandez-Martinez, J., and M. P. Rout. 2012. A jumbo problem: mapping the
structure and functions of the nuclear pore complex. Curr. Opin. Cell Biol.
24:92-99.
245. Floch, A. G., B. Palancade, and V. Doye. 2014. Fifty Years of Nuclear Pores
and Nucleocytoplasmic Transport Studies: Multiple Tools Revealing Complex
Rules. In Nuclear Pore Complexes and Nucleocytoplasmic Transport - Methods.
V. Doye, editor. 1-40.
246. Gorlich, D., and U. Kutay. 1999. Transport between the cell nucleus and the
cytoplasm. Annu. Rev. Cell. Dev. Biol. 15:607-660.
247. Keminer, O., and R. Peters. 1999. Permeability of single nuclear pores. Biophys.
J. 77:217-228.
248. Yang, W., and S. M. Musser. 2006. Nuclear import time and transport efficiency
depend on importin beta concentration. J. Cell Biol. 174:951-961.
249. Mohr, D., S. Frey, T. Fischer, T. Guttler, and D. Gorlich. 2009. Characterisation
of the passive permeability barrier of nuclear pore complexes. EMBO J.
28:2541-2553.
250. Denning, D. P., V. Uversky, S. S. Patel, A. L. Fink, and M. Rexach. 2002. The
Saccharomyces cerevisiae nucleoporin Nup2p is a natively unfolded protein. J.
Biol. Chem. 277:33447-33455.
251. Denning, D. P., S. S. Patel, V. Uversky, A. L. Fink, and M. Rexach. 2003.
Disorder in the nuclear pore complex: the FG repeat regions of nucleoporins are
natively unfolded. Proc. Natl. Acad. Sci. U. S. A. 100:2450-2455.
252. Denning, D. P., and M. F. Rexach. 2007. Rapid evolution exposes the
boundaries of domain structure and function in natively unfolded FG
nucleoporins. Mol. Cell. Proteomics 6:272-282.
253. Cronshaw, J. M., A. N. Krutchinsky, W. Zhang, B. T. Chait, and M. J. Matunis.
2002. Proteomic analysis of the mammalian nuclear pore complex. J. Cell Biol.
158:915-927.
254. Schmidt, H. B., and D. Gorlich. 2015. Nup98 FG domains from diverse species
spontaneously phase-separate into particles with nuclear pore-like
permselectivity. eLife 4:e04251.
255. Frey, S., and D. Gorlich. 2007. A saturated FG-repeat hydrogel can reproduce
the permeability properties of nuclear pore complexes. Cell 130:512-523.
256. Frey, S., R. P. Richter, and D. Goerlich. 2006. FG-rich repeats of nuclear pore
proteins form a three-dimensional meshwork with hydrogel-like properties.
Science 314:815-817.
257. Patel, S. S., B. J. Belmont, J. M. Sante, and M. F. Rexach. 2007. Natively
unfolded nucleoporins gate protein diffusion across the nuclear pore complex.
Cell 129:83-96.
258. Hulsmann, B. B., A. A. Labokha, and D. Gorlich. 2012. The permeability of
reconstituted nuclear pores provides direct evidence for the selective phase
model. Cell 150:738-751.

References
150
259. Milles, S., D. Mercadante, I. V. Aramburu, M. R. Jensen, N. Banterle, C.
Koehler, S. Tyagi, J. Clarke, S. L. Shammas, M. Blackledge, F. Grater, and E.
A. Lemke. 2015. Plasticity of an ultrafast interaction between nucleoporins and
nuclear transport receptors. Cell 163:734-745.
260. Bayliss, R., T. Littlewood, and M. Stewart. 2000. Structural basis for the
interaction between FxFG nucleoporin repeats and importin-beta in nuclear
trafficking. Cell 102:99-108.
261. Bayliss, R., S. W. Leung, R. P. Baker, B. B. Quimby, A. H. Corbett, and M.
Stewart. 2002. Structural basis for the interaction between NTF2 and
nucleoporin FxFG repeats. EMBO J. 21:2843-2853.
262. Isgro, T. A., and K. Schulten. 2005. Binding dynamics of isolated nucleoporin
repeat regions to importin-beta. Structure 13:1869-1879.
263. Port, Sarah A., T. Monecke, A. Dickmanns, C. Spillner, R. Hofele, H. Urlaub, R.
Ficner, and Ralph H. Kehlenbach. 2015. Structural and Functional
Characterization of CRM1-Nup214 Interactions Reveals Multiple FG-Binding
Sites Involved in Nuclear Export. Cell Reports 13:690-702.
264. Rout, M. P., and S. R. Wente. 1994. Pores for thought: nuclear pore complex
proteins. Trends Cell Biol. 4:357-365.
265. Peters, R. 2009. Translocation through the nuclear pore: Kaps pave the way.
Bioessays 31:466-477.
266. Rout, M. P., J. D. Aitchison, A. Suprapto, K. Hjertaas, Y. Zhao, and B. T. Chait.
2000. The yeast nuclear pore complex: composition, architecture, and transport
mechanism. J. Cell Biol. 148:635-651.
267. Yamada, J., J. L. Phillips, S. Patel, G. Goldfien, A. Calestagne-Morelli, H.
Huang, R. Reza, J. Acheson, V. V. Krishnan, S. Newsam, A. Gopinathan, E. Y.
Lau, M. E. Colvin, V. N. Uversky, and M. F. Rexach. 2010. A bimodal
distribution of two distinct categories of intrinsically disordered structures with
separate functions in FG nucleoporins. Mol. Cell. Proteomics 9:2205-2224.
268. Zahn, R., D. Osmanović, S. Ehret, C. Araya Callis, S. Frey, M. Stewart, C. You,
D. Görlich, B. W. Hoogenboom, and R. P. Richter. 2016. A physical model
describing the interaction of nuclear transport receptors with FG nucleoporin
domain assemblies. eLife 5:e14119.
269. Vovk, A., C. Gu, M. G. Opferman, L. E. Kapinos, R. Y. Lim, R. D. Coalson, D.
Jasnow, and A. Zilman. 2016. Simple biophysics underpins collective
conformations of the intrinsically disordered proteins of the Nuclear Pore
Complex. eLife 5.
270. Bestembayeva, A., A. Kramer, A. A. Labokha, D. Osmanović, I. Liashkovich,
E. V. Orlova, I. J. Ford, G. Charras, A. Fassati, and B. W. Hoogenboom. 2015.
Nanoscale stiffness topography reveals structure and mechanics of the transport
barrier in intact nuclear pore complexes. Nat Nano 10:60-64.
271. Eisele, N. B., S. Frey, J. Piehler, D. Gorlich, and R. P. Richter. 2010. Ultrathin
nucleoporin phenylalanine-glycine repeat films and their interaction with nuclear
transport receptors. EMBO Rep 11:366-372.
272. Semenov, A. N., and M. Rubinstein. 1998. Thermoreversible Gelation in
Solutions of Associative Polymers. 1. Statics. Macromolecules 31:1373-1385.
273. Frey, S., R. P. Richter, and D. Gorlich. 2006. FG-rich repeats of nuclear pore
proteins form a three-dimensional meshwork with hydrogel-like properties.
Science 314:815-817.

References
151
274. Labokha, A. A., S. Gradmann, S. Frey, B. B. Hulsmann, H. Urlaub, M. Baldus,
and D. Gorlich. 2013. Systematic analysis of barrier-forming FG hydrogels from
Xenopus nuclear pore complexes. EMBO J. 32:204-218.
275. Richter, R. P., K. B. Rodenhausen, N. B. Eisele, and M. Schubert. 2014.
Coupling spectroscopic ellipsometry and quartz crystal microbalance to study
organic films at the solid-liquid interface. In Ellipsometry of Functional Organic
Surfaces and Films. K. Hinrichts, and K.-J. Eichhorn, editors. Springer, Berlin,
Heidelberg.
276. Carton, I., A. R. Brisson, and R. P. Richter. 2010. Label-Free Detection of
Clustering of Membrane-Bound Proteins. Anal. Chem. 82:9275-9281.
277. Lata, S., M. Gavutis, and J. Piehler. 2006. Monitoring the Dynamics of
Ligand−Receptor Complexes on Model Membranes. J. Am. Chem. Soc. 128:6-
7.
278. De Feijter, J. A., J. Benjamins, and F. A. Veer. 1978. Ellipsometry as a tool to
study the adsorption behavior of synthetic and biopolymers at the air-water
interface. Biopolymers 17:1759-1772.
279. Johannsmann, D. QTM Software. http://www2.pc.tu-
clausthal.de/dj/software_en.shtml.
280. Johannsmann, D. 1999. Viscoelastic analysis of organic thin films on quartz
resonators. Macromol. Chem. Phys. 200:501-516.
281. Zahn, R., D. Osmanovic, S. Ehret, C. Araya Callis, S. Frey, M. Stewart, C. You,
D. Gorlich, B. W. Hoogenboom, and R. P. Richter. 2016. A physical model
describing the interaction of nuclear transport receptors with FG nucleoporin
domain assemblies. eLife 5:e14119.
282. Stirnemann, G., D. Giganti, J. M. Fernandez, and B. J. Berne. 2013. Elasticity,
structure, and relaxation of extended proteins under force. Proc. Natl. Acad. Sci.
U. S. A. 110:3847-3852.
283. Tu, L. C., G. Fu, A. Zilman, and S. M. Musser. 2013. Large cargo transport by
nuclear pores: implications for the spatial organization of FG-nucleoporins.
EMBO J. 32:3220-3230.
284. Romeis, D., and M. Lang. 2014. Excluded volume effects in polymer brushes at
moderate chain stretching. J. Chem. Phys. 141:104902.
285. Lang, M., M. Hoffmann, R. Dockhorn, M. Werner, and J. U. Sommer. 2013.
Fluctuation driven height reduction of crosslinked polymer brushes: a Monte
Carlo study. J. Chem. Phys. 139:164903.
286. Hennink, W. E., and C. F. van Nostrum. 2002. Novel crosslinking methods to
design hydrogels. Adv. Drug Del. Rev. 54:13-36.
287. Loveless, D. M., N. I. Abu-Lail, M. Kaholek, S. Zauscher, and S. L. Craig.
2006. Reversibly Cross-Linked Surface-Grafted Polymer Brushes. Angew.
Chem. Int. Ed. 45:7812-7814.

References
152

Appendix Curriculum Vitae
153
Appendix - Curriculum Vitae

Appendix Curriculum Vitae
154


The extracellular matrix (ECM) is the acellular structure of all tissues and essential for multicellular
life. Next to biochemical signals, the physical properties of the ECM provide important signals to cells.
The polysaccharide hyaluronan (HA) is ubiquitous in the extracellular space of vertebrates and an
important structural component of the ECM. HA is a linear, unbranched and regular polymer of the
glycosaminoglycan (GAG) family, and serves as a scaffold that responds dynamically to molecular
stimuli such as HA-binding proteins, or changes in pH or ionic strength. The objective of this PhD
research project is to elucidate physical principles underlying the structure, mechanics and dynamic re-
organization of HA-rich matrices. To address this question, we have studied the mechanical properties
and morphology of HA-rich matrices at distinct levels of complexity. On one hand, we have studied the
cumulus cell-oocyte complex (COC) matrix as an example of complex, native HA-rich tissue. On the
other hand, we have studied so-called HA brushes as a well-defined in vitro reconstituted model of HA-
rich matrices.
The HA-rich matrix in the COC forms around oocytes just before ovulation and plays vital roles in
oocyte biology. We have analyzed the micromechanical response of mouse COC matrix by colloidal
probe atomic force microscopy (AFM). We found the COC matrix to be extremely soft yet elastic,
suggesting a stable gel-like network structure with high porosity and a large mesh size. With a Young’s
modulus around 1 Pa, COC matrices are among the softest elastic biological materials known to date. In
addition, the elastic modulus increased progressively with indentation. Furthermore, using optical
microscopy to correlate these mechanical properties with ultra-structure, we discovered that the COC is
surrounded by a thick matrix shell that is essentially devoid of cumulus cells. We propose that the
pronounced non-linear elastic behaviour of COC matrix is a consequence of structural heterogeneity and
serves important functions in biological processes, such as oocyte transport in the oviduct and sperm
penetration.
To understand more comprehensively the response of HA polymers to changes in their aqueous
environment, the thickness and viscoelastic properties of films of end-grafted HA (also called HA
brushes) as a well defined in vitro model of HA-rich matrices were characterized by reflection
interference contrast microscopy (RICM) and quartz crystal microbalance with dissipation monitoring
(QCM-D) as a function of Ca2+
concentration and pH. Within the physiological range, the thickness of
HA brushes decreased significantly with Ca2+
concentration but did not change with pH. By screening a
large range of Ca2+
concentrations, we discovered that the effect of Ca2+
on HA brush thickness is
virtually identical to the effect of Na+ at 10-fold higher concentrations. HA brushes responded only
weakly to pH changes above pH 6.0, but showed a sharp collapse around pH 3. Our results provide
insights into how HA matrices are affected by solution properties, which is relevant in biological
systems and for the design of synthetic tissues.
Finally, using theoretical computations based on self-consistent mean field theory, we elucidated
how the morphology of polymer brushes is influenced by the formation of physical cross-links between
polymers, such as they would occur in the presence of cross-linking proteins. We find that cross-links
promote a denser and more homogeneous brush morphology. The effect of cross-links is comparable to
the effect of reduced solvent quality when the density of cross-links is low, but unique features
including the retention of solvent even with strong cross-links emerge at high cross-linking densities.
This work provides novel insights into how the supramolecular structure and thus the mechanical
properties of HA-rich matrices can be dynamically regulated by changes in microenvironmental
conditions. This can be linked to different biological functions of native HA-rich extracellular matrices
but is also of interest for the design of tailored, synthetic HA-based materials for applications in tissue
engineering.