Embed Size (px)
Citation preview

ST. ANTHONY FALLS LABORATORY Engineering, Environmental and Geophysical Fluid Dynamics
PROJECT REPORT 471
Physical Model Study of the San Antonio River Lock System
By
Omid Mohseni, Richard Christopher, Todd Barnacle and Heinz Stefan
Prepared for
HDR Engineering and the San Antonio River Authority
October 2005 Minneapolis, Minnesota

i

i
The University of Minnesota is committed to the policy that all persons shall have equal access to its programs, facilities, and employment without regard to race, religion, color, sex, national origin, handicap, age or veteran status.
ii
Abstract
The San Antonio River Authority (SARA) initiated a project to extend tour boat navigation
approximately 7,000 feet upstream on the San Antonio River. To make this section of the river
navigable, a small dam and parallel lock system will be built to transfer vessels between lower
pool elevation of 631.2 feet and upper pool elevation of 640.0 ft. The hydraulic locks must
transfer tour boats quickly, efficiently, comfortably and safely using available river flow. A
physical model study was required to verify and refine the operational suitability of the proposed
side-port lock system. The model was constructed and studied at St. Anthony Falls Laboratory.
The scope of the study was to build a physical model of one lock and its associated filling and
emptying system and to test its operation on a scale model of the design vessel. The model was
built at a scale of 1:8 and included a single lock chamber, a side-port gallery to convey water into
and out of the lock chamber, and the upstream and downstream sluice gates.
Two series of tests were conducted and at least one of the following parameters was modified
during each test: The gate opening height, the gate opening duration, the gate opening as a
function of time, the lock chamber floor level, and the loading of the vessel. For each test,
headwater, tailwater, water surface level in the lock chamber and the opening rate of the sluice
gate were recorded. The performance of the lock chamber was determined qualitatively by
inspection of the vessel reaction and the flow patterns inside the gallery and the lock chamber.
The second and more extensive series of tests were videotaped.
The first test series was conducted to provide an initial assessment of the lock performance.
During the second test series, 14 tests were conducted, of which only one did not provide
acceptable results. In the remaining 13 tests no significant surface turbulence was observed
during filling and emptying of the lock chamber. In addition, no vortex was detected in the lock
chamber. The chamber filling time of all tests was shorter than the design target of 5 minutes.
The only anomaly observed was the slow lateral drift of the front hull of the vessel towards the
gallery wall. This gentle drifting only occurred during the filling cycle and could be prevented
by utilizing the floating mooring bits.

iii
Acknowledgements
The work reported herein was supported by HDR Engineering and the San Antonio River
Authority. Mr. George Waldow was the project officer. We would like to thank Luke Carlson,
Mike Plante, Ben Erickson, Matthew Lueker, Chris Ellis and Alex Ding of St. Anthony Falls
Laboratory for their contribution to the model construction, instrumentation and videotaping of
the experiments.

iv
Table of Contents
Abstract ........................................................................................................................................... ii
Acknowledgements........................................................................................................................ iii
List of Figures ................................................................................................................................. v
List of Tables ............................................................................................................................... viii
List of Tables ............................................................................................................................... viii
1. Introduction................................................................................................................................. 1
2. Model Construction .................................................................................................................... 3
2.1. General Features of the Physical Model .............................................................................. 3
2.2. Navigation Vessel ................................................................................................................ 4
2.3. Instrumentation .................................................................................................................... 5
3. Model Runs and Results ........................................................................................................... 12
3.1. First Test Series ................................................................................................................. 12
3.2. Second Test Series ............................................................................................................. 19
4. Summary ................................................................................................................................... 23
Appendix A. Filling and Emptying Cycles of the Final Test Series............................................. 24
Appendix B. Estimated Time Variant Discharge of the Final Test Series ................................... 37

v
List of Figures
Figure 1. Plan view of the proposed San Antonio River lock and dam..................................... 2 Figure 2. The model layout plan view. The model comprises of a single lock chamber, a
gallery to supply water, a head tank and a tail tank.................................................... 6 Figure 3. A longitudinal profile of the model gallery and the head and tail tanks. ................... 7 Figure 4. The side weir in the head tank to control the headwater. ........................................... 8 Figure 5. The leaf drop gate in the tail tank to control the tailwater.......................................... 8 Figure 6. View of the model structure under construction. ....................................................... 9 Figure 7. A Velmex slide system was utilized to automate the sluice gate opening. ................ 9 Figure 8. The 26-ft Fiesta touring boat. ................................................................................... 10 Figure 9. The 26-ft Fiesta and its draft under different loading conditions. ............................ 10 Figure 10. Model vessel in the lock chamber. ........................................................................... 11 Figure 11. Steel wires and the floatable devices to which the mooring lines of the model vessel
were attached. ........................................................................................................... 11 Figure 12. Headwater, tailwater, water surface level in the lock chamber and the gate opening
during the filling cycle. The sluice gate opened as a cotangent function of time. The gate opening duration was 4.25 minutes, and the lock floor elevation was at 624 ft................................................................................................................................ 15
Figure 13. Headwater, tailwater, water surface level in the lock chamber and the gate opening during the emptying cycle. The sluice gate opened as a cotangent function of time. The gate opening duration was 4.25 minutes, and the lock floor elevation was at 624 ft................................................................................................................................ 15
Figure 14. Headwater, tailwater, water surface level in the lock chamber and the gate opening during the filling cycle. The sluice gate opened as a linear function of time. The gate opening duration was one minute, and the lock floor elevation was at 624 ft.. 16
Figure 15. Headwater, tailwater, water surface level in the lock chamber and the gate opening during the emptying cycle. The sluice gate opened as a linear function of time. The gate opening duration was one minute, and the lock floor elevation was at 624 ft................................................................................................................................ 16
Figure 16. Discharge into the lock chamber during the filling cycle. The sluice gate opened as a cotangent function of time. The gate opening duration was 4.25 minutes, and the lock floor elevation was at 624 ft. ............................................................................ 17
Figure 17. Discharge out of the lock chamber during the emptying cycle. The sluice gate opened as a cotangent function of time. The gate opening duration was 4.25 minutes, and the lock floor elevation was at 624 ft. ................................................. 17
Figure 18. Discharge into the lock chamber during the filling cycle. The sluice gate opened as a linear function of time. The gate opening duration was one minute, and the lock floor elevation was at 624 ft. .................................................................................... 18
Figure 19. Discharge out of the lock chamber during the emptying cycle. The sluice gate opened as a linear function of time. The gate opening duration was one minute, and the lock floor elevation was at 624 ft. ...................................................................... 18
Figure 20. Discharge into the lock chamber during the filling cycle. The sluice gate opened as a tangent function of time (see Figure A.8). The gate opening duration was 3 minutes, the gate opening height was 3 ft, and the lock floor elevation was at 624 ft (Test #8).................................................................................................................... 21

vi
Figure 21. Discharge into the lock chamber during the filling cycle. The sluice gate opened as a linear function of time (see Figure A.1). The gate opening duration was 3 minutes, the gate opening height was 2 ft, and the lock floor elevation was at 624 ft (Test #1).................................................................................................................... 21
Figure 22. Discharge out of the lock chamber during the emptying cycle. The sluice gate opened as a linear function of time (see Figure A.2). The gate opening duration was 3 minutes, the gate opening height was 2 ft, and the lock floor elevation was at 624 ft (Test #2). ............................................................................................................... 22
Figure 23. Discharge into the lock chamber during the filling cycle. The sluice gate opened as a linear function of time (see Figure A.9). The gate opening duration was 2 minutes, the gate opening height was 2 ft, and the lock floor elevation was at 624 ft (Test #9).................................................................................................................... 22
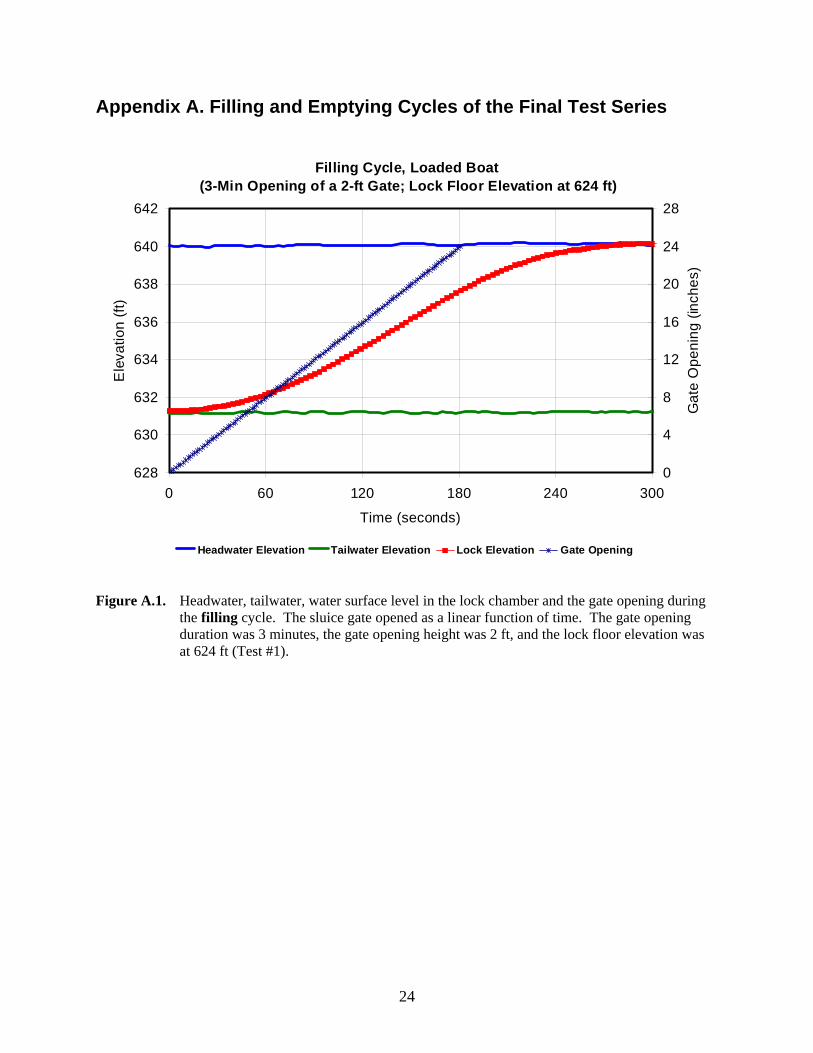
Figure A.1. Headwater, tailwater, water surface level in the lock chamber and the gate opening during the filling cycle. The sluice gate opened as a linear function of time. The gate opening duration was 3 minutes, the gate opening height was 2 ft, and the lock floor elevation was at 624 ft (Test #1)...................................................................... 24
Figure A.2. Headwater, tailwater, water surface level in the lock chamber and the gate opening during the emptying cycle. The sluice gate opened as a linear function of time. The gate opening duration was 3 minutes, the gate opening height was 2 ft, and the lock floor elevation was at 624 ft (Test #2).............................................................. 25
Figure A.3. Headwater, tailwater, water surface level in the lock chamber and the gate opening during the filling cycle. The sluice gate opened as a linear function of time. The gate opening duration was 3 minutes, the gate opening height was 3 ft, and the lock floor elevation was at 624 ft (Test #3)...................................................................... 26
Figure A.4. Headwater, tailwater, water surface level in the lock chamber and the gate opening during the filling cycle. The sluice gate opened as a linear function of time. The gate opening duration was 0.5 minutes, the gate opening height was 3 ft, and the lock floor elevation was at 624 ft (Test #4).............................................................. 27
Figure A.5. Headwater, tailwater, water surface level in the lock chamber and the gate opening during the emptying cycle. The sluice gate opened as a linear function of time. The gate opening duration was 0.5 minutes, the gate opening height was 3 ft, and the lock floor elevation was at 624 ft (Test #5)........................................................ 28
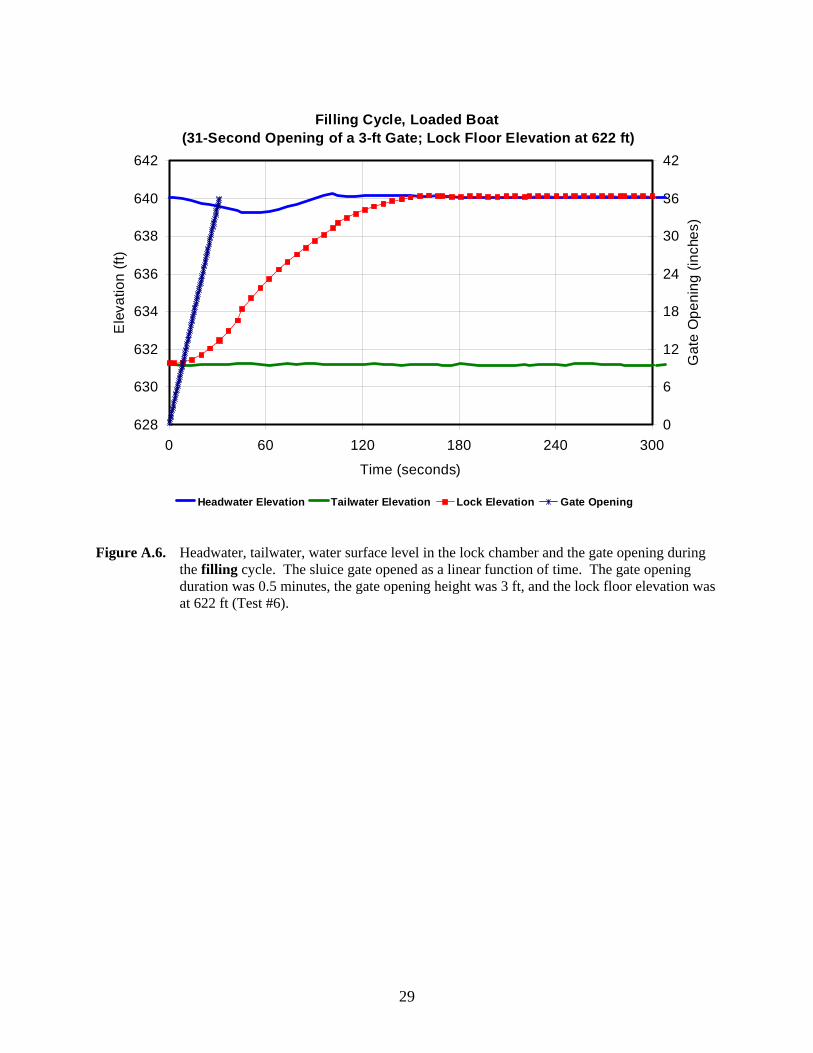
Figure A.6. Headwater, tailwater, water surface level in the lock chamber and the gate opening during the filling cycle. The sluice gate opened as a linear function of time. The gate opening duration was 0.5 minutes, the gate opening height was 3 ft, and the lock floor elevation was at 622 ft (Test #6).............................................................. 29
Figure A.7. Headwater, tailwater, water surface level in the lock chamber and the gate opening during the filling cycle. The sluice gate opened as a linear function of time. The gate opening duration was 0.5 minutes, the gate opening height was 3 ft, and the lock floor elevation was at 624 ft (Test #7).............................................................. 30
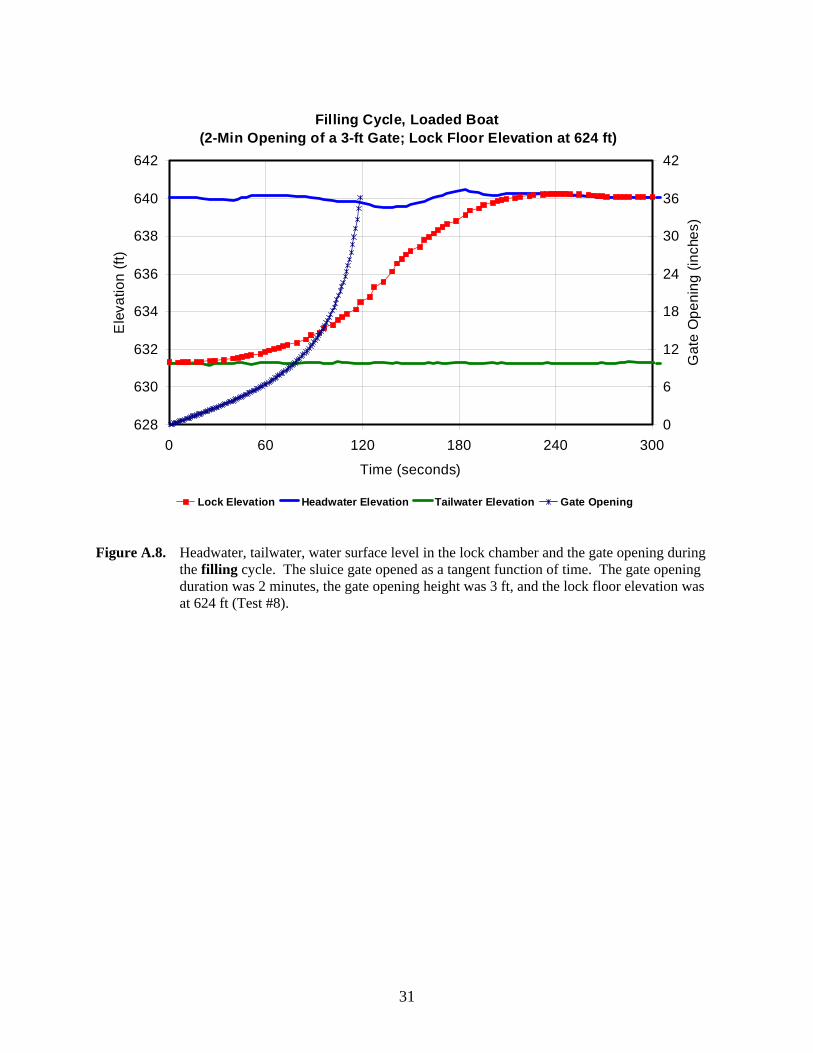
Figure A.8. Headwater, tailwater, water surface level in the lock chamber and the gate opening during the filling cycle. The sluice gate opened as a tangent function of time. The gate opening duration was 2 minutes, the gate opening height was 3 ft, and the lock floor elevation was at 624 ft (Test #8)...................................................................... 31
Figure A.9. Headwater, tailwater, water surface level in the lock chamber and the gate opening during the filling cycle. The sluice gate opened as a linear function of time. The

vii
gate opening duration was 2 minutes, the gate opening height was 2 ft, and the lock floor elevation was at 624 ft (Test #9)...................................................................... 32
Figure A.10. Headwater, tailwater, water surface level in the lock chamber and the gate opening during the filling cycle. The sluice gate opened as a linear function of time. The gate opening duration was 2 minutes, the gate opening height was 3 ft, and the lock floor elevation was at 622 ft (Test #10)............................................................ 33
Figure A.11. Headwater, tailwater, water surface level in the lock chamber and the gate opening during the filling cycle. The sluice gate opened as a linear function of time. The gate opening duration was 2 minutes, the gate opening height was 3 ft, and the lock floor elevation was at 622 ft. This was a repeatability test (Test #11). ........... 34
Figure A.12. Headwater, tailwater, water surface level in the lock chamber and the gate opening during the filling cycle. The sluice gate opened as a linear function of time. The gate opening duration was 2 minutes, the gate opening height was 3 ft, and the lock floor elevation was at 622 ft (Test #12)............................................................ 35
Figure A.13. Headwater, tailwater, water surface level in the lock chamber and the gate opening during the filling cycle. The sluice gate opened as a linear function of time. The gate opening duration was 2 minutes, the gate opening height was 3 ft, and the lock floor elevation was at 622 ft (Test #13)............................................................ 36
Figure B.1. Discharge into the lock chamber during the filling cycle. The sluice gate opened as a linear function of time. The gate opening duration was 3 minutes, the gate opening height was 3 ft, and the lock floor elevation was at 624 ft. (Test #3) ...................... 37
Figure B.2. Discharge into the lock chamber during the emptying cycle. The sluice gate opened as a linear function of time. The gate opening duration was 0.5 minutes, the gate opening height was 3 ft, and the lock floor elevation was at 624 ft. (Test # 4) ....... 38
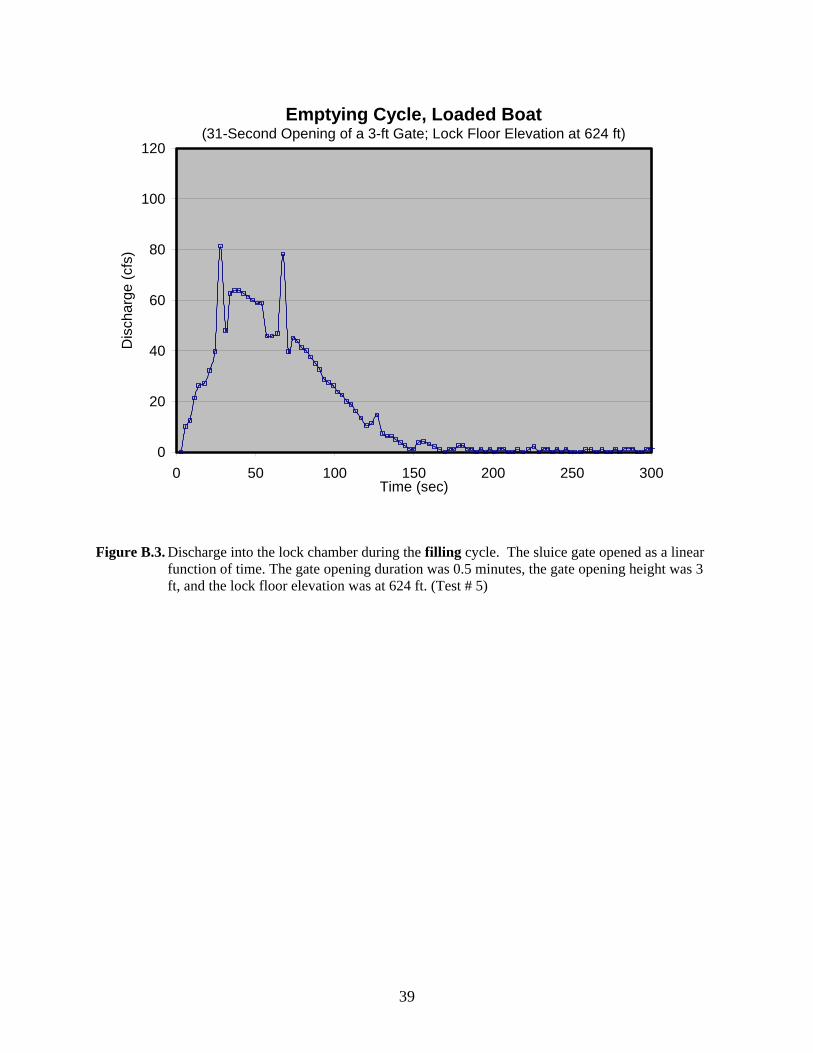
Figure B.3. Discharge into the lock chamber during the filling cycle. The sluice gate opened as a linear function of time. The gate opening duration was 0.5 minutes, the gate opening height was 3 ft, and the lock floor elevation was at 624 ft. (Test # 5) ....... 39
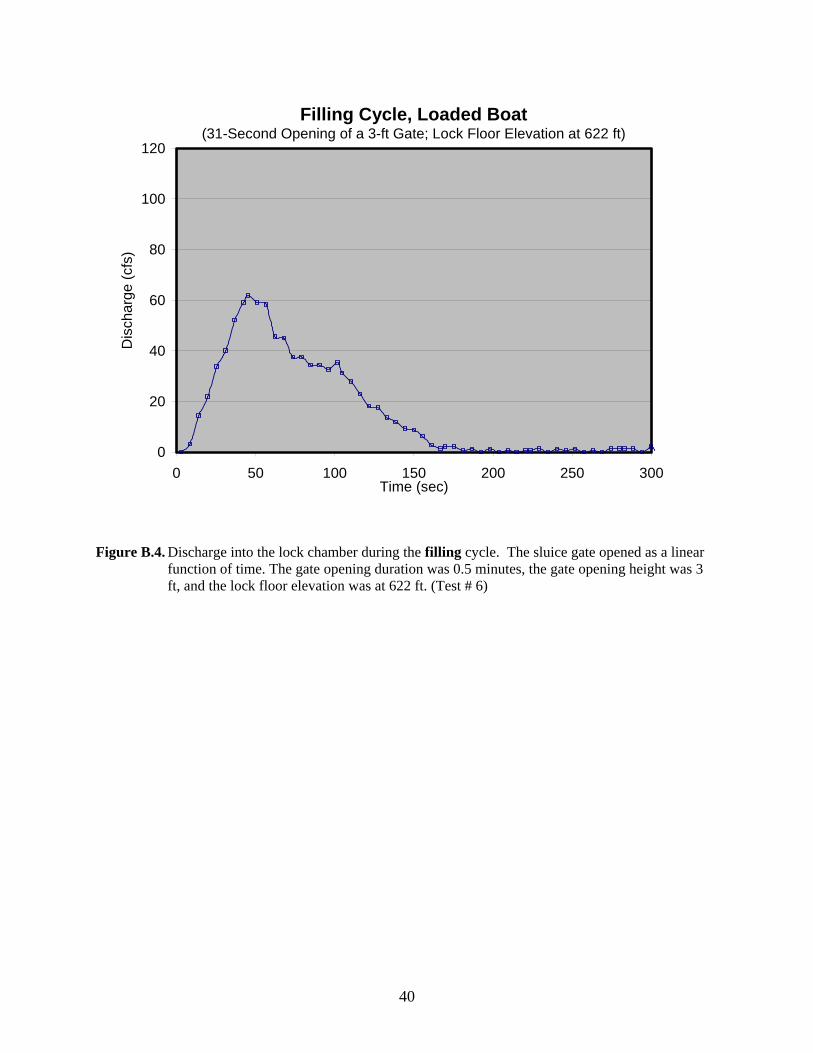
Figure B.4. Discharge into the lock chamber during the filling cycle. The sluice gate opened as a linear function of time. The gate opening duration was 0.5 minutes, the gate opening height was 3 ft, and the lock floor elevation was at 622 ft. (Test # 6) ....... 40
Figure B.5. Discharge into the lock chamber during the filling cycle. The sluice gate opened as a linear function of time. The gate opening duration was 0.5 minutes, the gate opening height was 3 ft, and the lock floor elevation was at 624 ft. (Test # 7) ....... 41
Figure B.6. Discharge into the lock chamber during the filling cycle. The sluice gate opened as a linear function of time. The gate opening duration was 2 minutes, the gate opening height was 3 ft, and the lock floor elevation was at 622 ft. (Test # 10) ................... 42
Figure B.7. Discharge into the lock chamber during the filling cycle. The sluice gate opened as a linear function of time. The gate opening duration was 2 minutes, the gate opening height was 3 ft, and the lock floor elevation was at 622 ft. (Test # 11) ................... 43
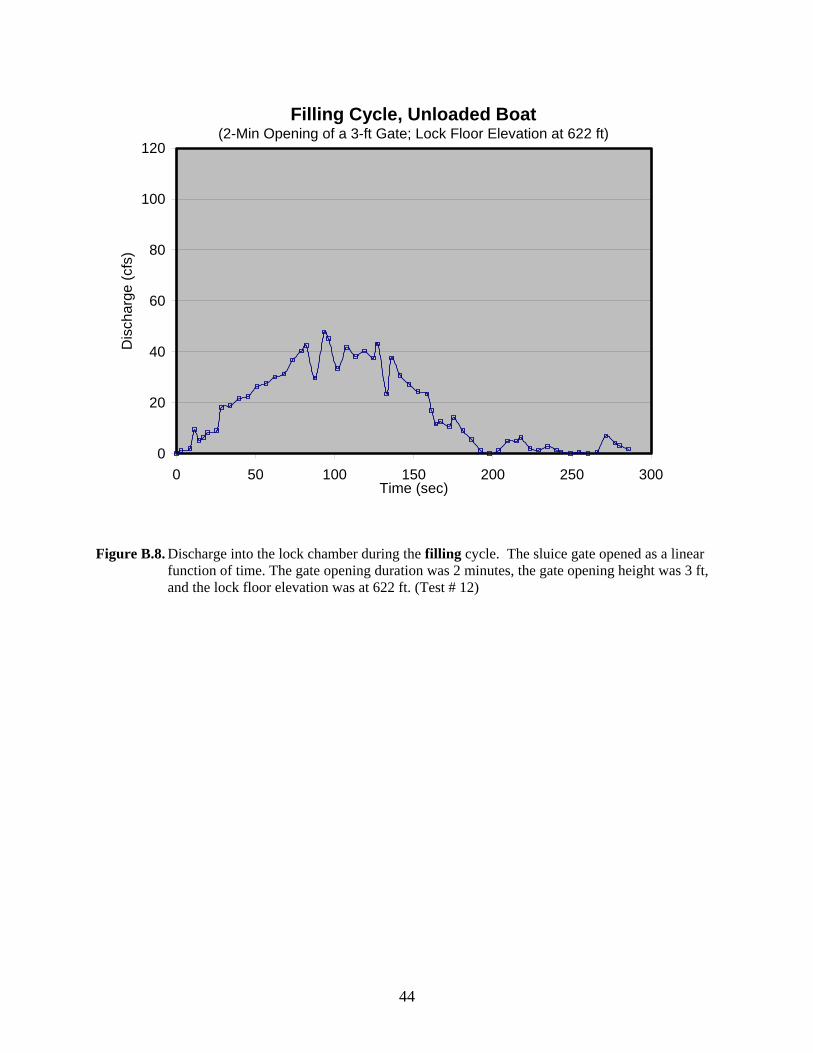
Figure B.8. Discharge into the lock chamber during the filling cycle. The sluice gate opened as a linear function of time. The gate opening duration was 2 minutes, the gate opening height was 3 ft, and the lock floor elevation was at 622 ft. (Test # 12) ................... 44
Figure B.9. Discharge into the lock chamber during the filling cycle. The sluice gate opened as a linear function of time. The gate opening duration was 2 minutes, the gate opening height was 3 ft, and the lock floor elevation was at 622 ft. (Test # 13) ................... 45

viii
List of Tables
Table 1. Results of the first test series. ................................................................................... 12 Table 2. Results of the second test series. .............................................................................. 19
1
1. Introduction
The San Antonio River Authority (SARA) initiated a series of improvements projects along the
San Antonio River. One of these projects is to extend tour boat navigation approximately 7,000
feet upstream of the current head of navigation. A small dam and twin parallel lock system will
be built near Brooklyn Avenue to transfer vessels between a lower pool elevation of 631.2 feet
and an upper pool elevation of 640.0 ft. The entire lock and dam complex is expected to fit
within a total width of less than 100 ft. Design of the dam and lock was commissioned to HDR
Engineering, Inc.
Since the lock system is significantly smaller than the commercial navigation locks typically
designed by the US Army Corps of Engineers, and there is also a constraint on the overall width
of the complex, HDR commissioned a physical model study of the proposed lock chamber and
standard vessel at the St. Anthony Falls Laboratory. The objective was to verify and refine the
operational suitability of the proposed side-port lock system and to optimize certain design
parameters, such as the chamber bed elevation, the gate opening height and duration, and the
water conveyance system into and out of the chamber. The lock system will consist of a gravity-
fed and drained dual-chamber system (Figure 1). The lock system comprises two pairs of
hydraulically actuated miter gates and four hydraulically actuated slide gates for filling and
emptying operations. Each lock chamber will be 12 ft. wide and 43 ft. long (pintle to pintle)
Average base flow of the San Antonio River at the lock location is approximately 20 cfs.
The scope of this study was to build a physical model of the proposed lock chamber, the standard
vessel, the water supply gallery and its sluice gates. The model was to serve as a design aid to
verify necessary assumptions, optimize certain parameters, and demonstrate that efficient
operation can be obtained without objectionable discomfort for tour boat passengers.

2
Figure 1. Plan view of the proposed San Antonio River lock and dam.
Lock Chamber
Gallery Miter Gates
Flow
Sluice Gates Dam

3
2. Model Construction
The goal of this model study was to accurately simulate the flow patterns, including potential
vortices inside the lock chamber and the gallery. To do so, Froude similarity was adequate to
simulate the prototype flow conditions in the model. The model was built at St. Anthony Falls
Laboratory at a scale of 1:8. Using a 1:8 scale Froude similarity, model parameters were scaled
as follows:
Length 1:8
Area 1:64
Volume 1:512
Flow rate 1:181
Velocity 1:2.83
Time 1:2.83
2.1. General Features of the Physical Model The lock model consisted of a single chamber and a side-port gallery, plus a head and a tail tank
to maintain constant headwater and tailwater levels throughout each experiment. For this model
study, only the internal geometry of the chamber, gallery and the sluice gates were of interest.
Therefore, the miter gates were stationary. Figures 2 and 3 show the plan view of the entire
model layout and a longitudinal profile along the gallery, respectively.
The lock chamber and gallery floors were made to move up and down (Figure 3) and stay sealed.
Thus, the model floor level could vary from 629.2 to 635.2 ft elevation above the datum. The
wall between the side-port gallery and the lock chamber was removable for future modifications
of the inflow system if needed.
A head tank was constructed to simulate the ponded water upstream of the dam. To maintain the
upstream water level at a constant elevation a side weir equipped with an adjustable weir was
installed (Figure 4). Since the volume of the head tank was significantly smaller than the scaled
ponded water upstream of the dam, the side weir elevation had to be controlled manually during
the test runs to maintain the water elevation at 640 ft elevation. Mississippi River water was
discharged into a cell upstream of the head tank using a multi-port diffuser.

4
To control tailwater conditions, a leaf drop gate was built and installed at the downstream end of
the model in the tail tank (Figure 5).
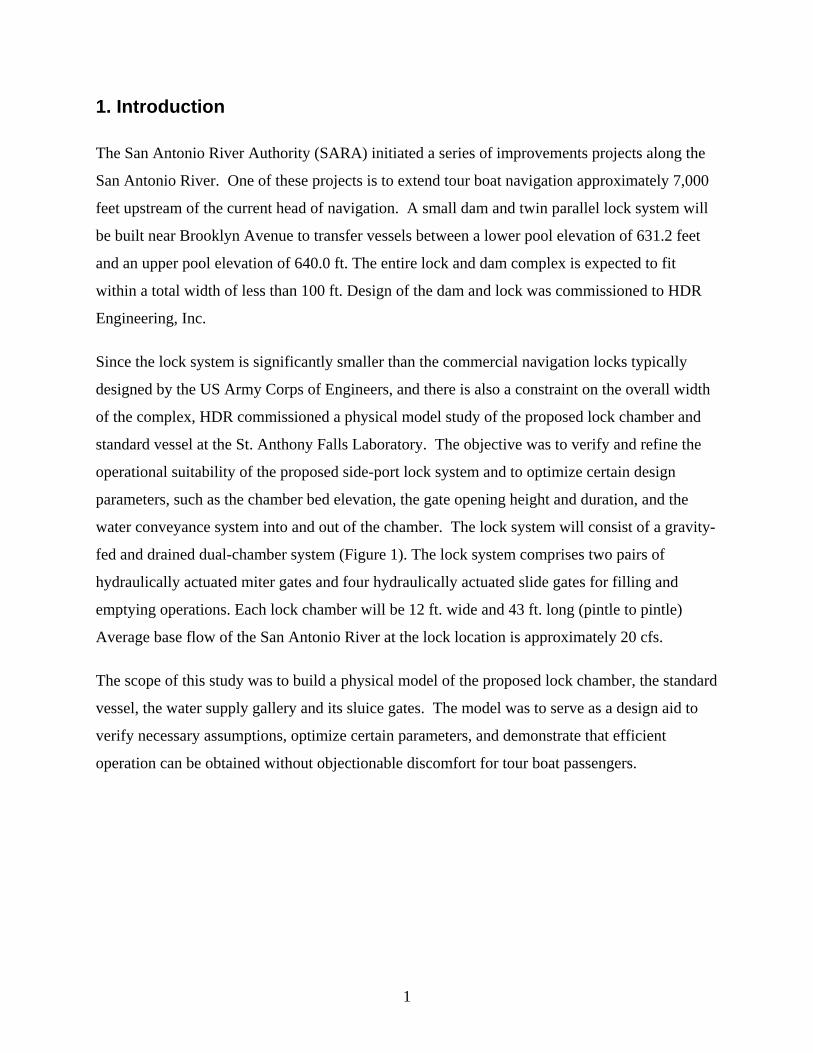
The head and tail tanks were built from plywood and lumber. The lock chamber outside walls
and the gallery outside wall were made from Plexiglas for visualization purposes and placed in a
metal frame to withstand the hydrostatic pressure (Figure 6). The wall between the lock chamber
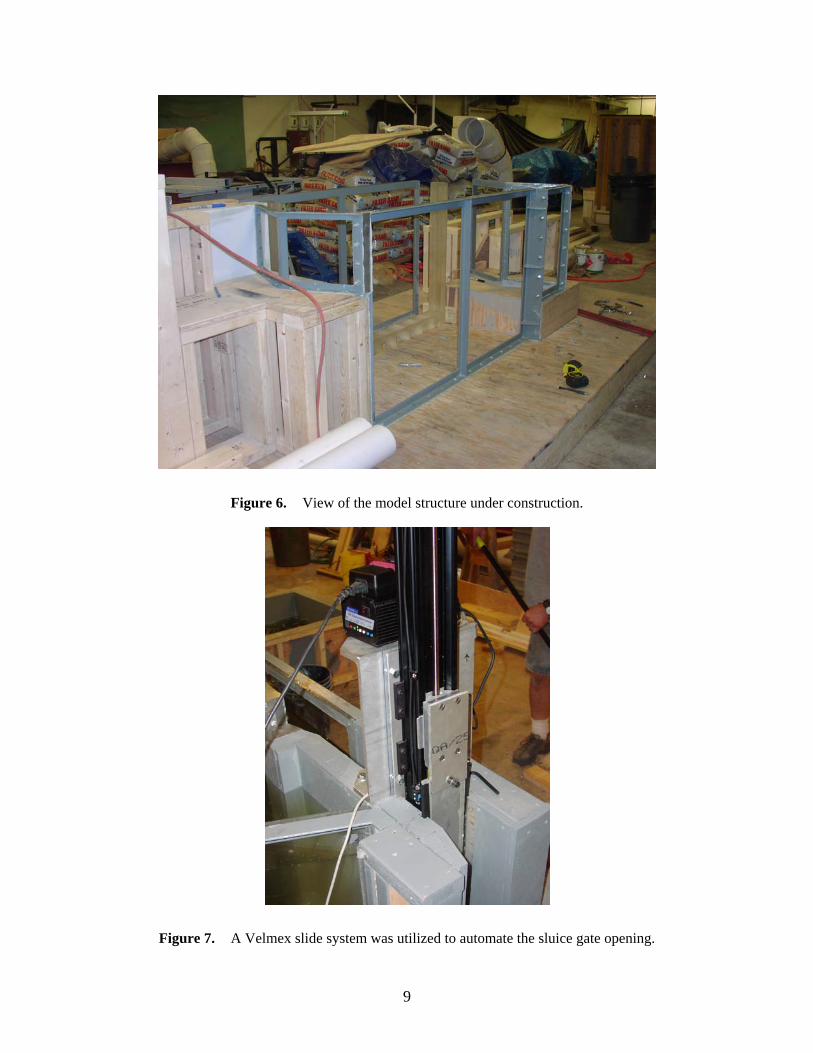
and gallery was opaque. The gates were made from aluminum and controlled by a Velmex slide
system to automate the opening of the gates (Figure 7). Any opening sequence could be
described as a series of step functions using computer software (Microsoft Excel), and applied to
the Velmex slide operating system.
The physical model construction accuracy was maintained at 0.005 feet (one sixteenth of an
inch), which corresponds to 0.04 feet in the prototype.
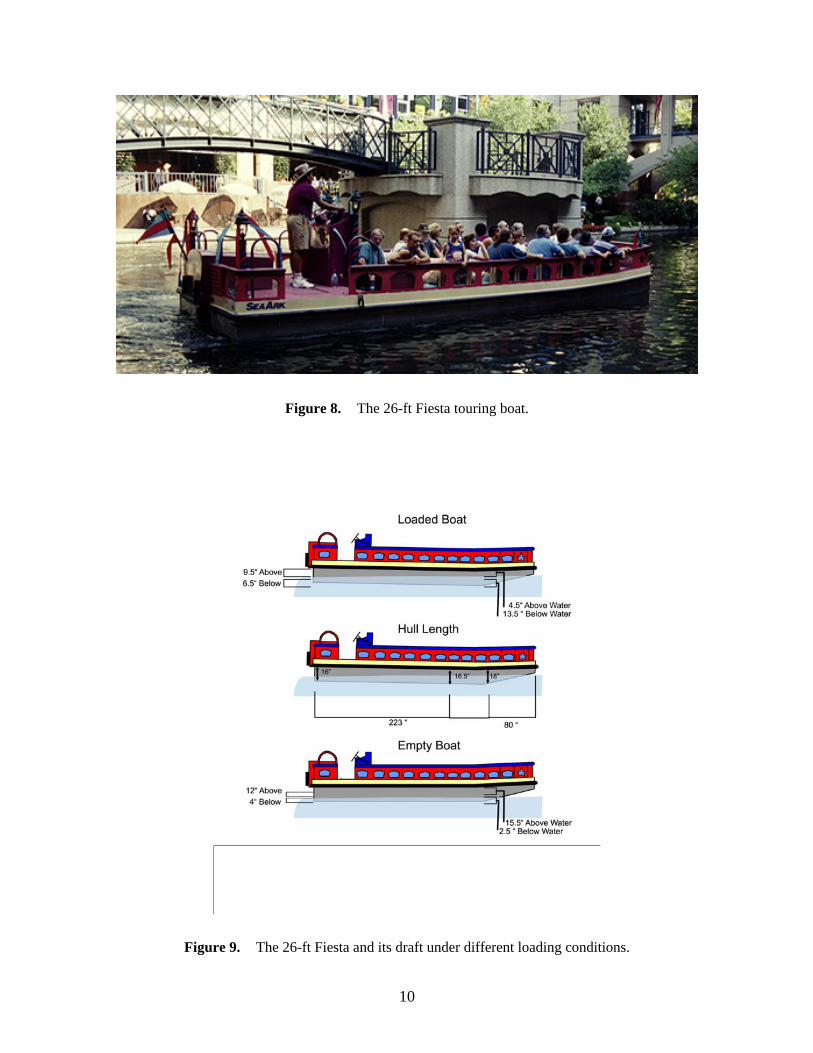
2.2. Navigation Vessel The standard navigation vessel in the San Antonio River is a 26-ft Fiesta tour boat. The vessel is
26 ft long and 9 ft wide (Figure 8). The draft under minimum loading was reported to be 4
inches at the stern and 2.5 inches at the front where the hull bottom curves up. Under maximum
loading, the front hull sinks 13.5 inches into water while the stern is 6.5 inches below water
(Figure 9).
The model vessel was built from light materials, i.e. Styrofoam, while maintaining geometrical
similarity (Figure 10). The weight distribution of the prototype vessel was not incorporated in
the construction of the model vessel. However, the desired draft under minimum and maximum
loads was modeled by placing sheet metal pieces on the vessel floor.
To secure the vessel in the lock chamber during filling and emptying cycles, four vertical steel
wires equipped with floatable devices were installed in the chamber to simulate floating mooring
bits (Figure 11). The floatable devices were to facilitate the vertical movement of the vessel
while the mooring lines were attached to them. The steel wires were located to coincide with the
mooring points on the vessel. Since the vessel crew cannot conveniently access the forward
mooring lines when the vessel is fully loaded, i.e. when passengers occupy all the seats (see
Figure 8), only the rear mooring lines were used during the tests.

5
2.3. Instrumentation To measure water surface elevation in the lock chamber, the headwater and tailwater, two
pressure taps were mounted in the lock chamber, and one each in the head tank and the tail tank.
The pressure taps were connected to a pressure transducer via 1/4 -inch plastic tubes, recording
the instantaneous water level at the three locations and sending it to the computer. The two
water levels recorded in the lock chamber were averaged.
Since the geometry of the lock chamber was known, the instantaneous flow could be estimated
from the water level data.
Flow patterns inside the lock chamber and the gallery were documented using digital video
cameras mounted on the ceiling above the model, and on the sides of the model.

6
Figure 2. The model layout plan view. The model comprises of a single lock chamber, a gallery to supply water, a head tank and a tail tank.
Tail Tank Head Tank
Lock Chamber

7
Figure 3. A longitudinal profile of the model gallery and the head and tail tanks.

8
Figure 4. The side weir in the head tank to control the headwater.
Figure 5. The leaf drop gate in the tail tank to control the tailwater.
9
Figure 6. View of the model structure under construction.
Figure 7. A Velmex slide system was utilized to automate the sluice gate opening.
10
Figure 8. The 26-ft Fiesta touring boat.
Figure 9. The 26-ft Fiesta and its draft under different loading conditions.

11
Figure 10. Model vessel in the lock chamber.
Figure 11. Steel wires and the floatable devices to which the mooring lines of the model vessel were attached.

12
3. Model Runs and Results
The goals of the lock system design were to fill or empty the lock chamber in less than five
minutes (about 100 seconds in the model), and (2) to eliminate any erratic movement of the
vessel during filling and emptying to make it safe and comfortable for the passengers.
Two series of model tests were conducted to establish that the design goals were met. A first test
series was conducted to obtain an initial assessment of the lock operation and its effects on the
vessel during filling and emptying cycles. Initially, the draft provided by the barge manufacturer
was not accurate. Therefore, the draft during the first test series was incorrect.
The impacts of filling and emptying on the model vessel were evaluated qualitatively. Had the
impacts been severe, then the hawser forces on the mooring lines and the tilt of the vessel would
have been measured.
3.1. First Test Series In the first test series, two gate-opening functions with 1 minute and 4.25 minute opening periods
were used. The floor elevation was set at 624 ft, and only the loaded vessel, which was about 2
tons lighter than under the maximum load, was tested. A total of four tests were conducted. The
first gate opening function was a cotangent function of time (Figures 12 and 13). The gate
opening time was set at 4.25 minutes, which was approximately the same as the filling or
emptying duration of the chamber. The second gate opening function was a linear function of
time with a duration of one minute (Figures 14 and 15).
Table 1. Results of the first test series.
Test Cycle Function
Maximum Gate
Opening (ft)
Gate Opening Duration
(min)
Lock Filling or Emptying
Duration (min)
Performance of the lock
1 Fill Cotangent 3 4.25 ~ 4.5 Acceptable 2 Empty Cotangent 3 4.25 ~ 4.5 Acceptable 3 Fill Linear 2 1 ~ 4 Acceptable 4 Empty Linear 2 1 ~ 3.5 Acceptable

13
The results of the initial test series are summarized in Table 1. All tests showed no abrupt
changes in water surface level of the chamber and provided acceptable results. No vortex was
observed in the chamber. The gallery, however, exhibited a hydraulic jump when the sluice gate
started opening. The hydraulic jump was immediately submerged as the gate continued opening.
The gallery acted as a buffer and prevented any abrupt flow into the chamber. As is evident in
Figures 12 to 15, water level in the chamber changed quite steadily.
The only anomaly observed was the slow drifting motion of the front hull of the vessel towards
the gallery wall. The motion occurred during the filling cycle. Two factors caused this motion:
(1) The front mooring lines were never attached during the tests as was mentioned in section 2.2,
which would allow the front hull to move freely towards the side walls, and (2) the jets leaving
the gallery hit the outer wall of the lock, causing an upwelling near the wall which translated to a
horizontal flow from the outer wall towards the gallery wall at the surface. This lateral flow
impacted the metal fin or skeg which projects downward from the keel near the front of the
vessel.
No measurement to quantify the turbulence intensity in the lock chamber was made. Discharge
into and out of the lock chamber was estimated and plotted versus time using water level records.
Infrequent abrupt changes in the estimated discharge into and out of the chamber were evident in
the plots. Water levels in the lock chamber are the average of two locations (two pressure taps
were connected through a T-junction to one pressure transducer). They should therefore reflect
an average water level in the lock chamber, excluding any standing waves (seiches) in the
chamber. The transducer had an accuracy/resolution that would translate into a flow rate of ±4
cfs in the prototype.
The abrupt changes in the estimated discharge into and out of the lock chamber were not
apparent while observing the test runs. A closer examination revealed a discrepancy in the data
recording program. The recorded time intervals were rounded off to the nearest second,
therefore, occasionally a recorded time interval was half of the preceding and subsequent time
steps, thus doubling the estimated discharge. To verify the source of discrepancy three tests
were repeated, and the time intervals were recorded at a higher precision. The infrequent abrupt
changes reduced significantly. In order to provide a more representative discharge time variant

14
plots from the data collected, the time intervals were modified using a 5-step moving average.
The results were plotted in Figures 16 to 19. The remaining spikes evident in Figures 16 and 17
are most likely due to water levels in the head tank and tail tank, which were controlled manually
during the test runs.
15
Filling Cycle (4.25-Min Opening of a 3-ft Gate; Lock Floor Elevation at 624 ft)
628
630
632
634
636
638
640
642
0 60 120 180 240 300Time (seconds)
Ele
vatio
n (ft
)
0
6
12
18
24
30
36
42
Gat
e O
peni
ng (i
nche
s)
Headwater Elevation Tailwater Elevation Lock Elevation Gate Opening
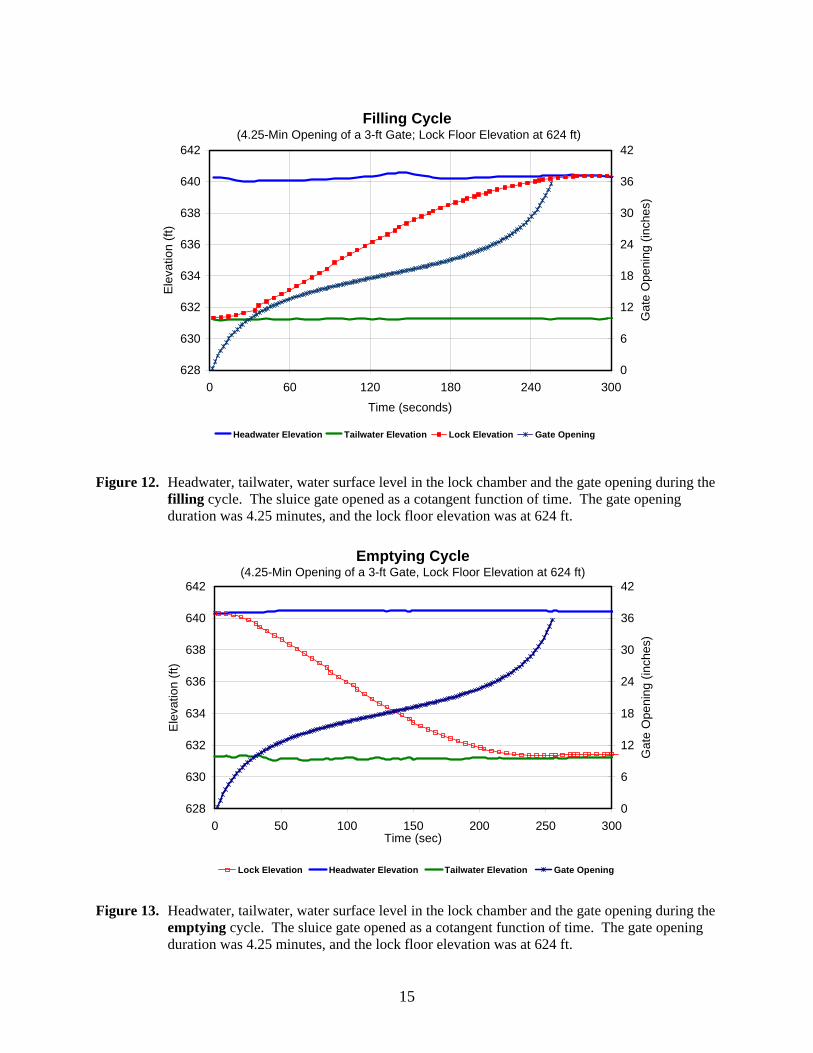
Figure 12. Headwater, tailwater, water surface level in the lock chamber and the gate opening during the filling cycle. The sluice gate opened as a cotangent function of time. The gate opening duration was 4.25 minutes, and the lock floor elevation was at 624 ft.
Emptying Cycle (4.25-Min Opening of a 3-ft Gate, Lock Floor Elevation at 624 ft)
628
630
632
634
636
638
640
642
0 50 100 150 200 250 300Time (sec)
Ele
vatio
n (ft
)
0
6
12
18
24
30
36
42
Gat
e O
peni
ng (i
nche
s)
Lock Elevation Headwater Elevation Tailwater Elevation Gate Opening
Figure 13. Headwater, tailwater, water surface level in the lock chamber and the gate opening during the
emptying cycle. The sluice gate opened as a cotangent function of time. The gate opening duration was 4.25 minutes, and the lock floor elevation was at 624 ft.

16
Filling Cycle (1-Min Opening of a 2-ft Gate; Lock Floor Elevation at 624 ft)
628
630
632
634
636
638
640
642
0 60 120 180 240 300Time (seconds)
Elev
atio
n (ft
)
0
4
8
12
16
20
24
28
Gat
e O
peni
ng (i
nche
s)
Headwater Elevation Tailwater Elevation Lock Elevation Gate Opening
Figure 14. Headwater, tailwater, water surface level in the lock chamber and the gate opening during the filling cycle. The sluice gate opened as a linear function of time. The gate opening duration was one minute, and the lock floor elevation was at 624 ft.
Emptying Cycle (1-Min Opening of a 2-ft Gate; Lock Floor Elevation at 624 ft)
628
630
632
634
636
638
640
642
0 60 120 180 240 300Time (seconds)
Ele
vatio
n (ft
)
-2
4
10
16
22
28
Gat
e O
peni
ng (i
nche
s)
Headwater Elevation Tailwater Elevation Lock Elevation Gate Opening
Figure 15. Headwater, tailwater, water surface level in the lock chamber and the gate opening during the emptying cycle. The sluice gate opened as a linear function of time. The gate opening duration was one minute, and the lock floor elevation was at 624 ft.

17
Filling Cycle (4.25-Min Opening, 3-ft Gate; Lock Floor Elevation at 624 ft)
0
20
40
60
80
100
120
0 50 100 150 200 250 300Time (sec)
Dis
char
ge (c
fs)
Figure 16. Discharge into the lock chamber during the filling cycle. The sluice gate opened as a cotangent function of time. The gate opening duration was 4.25 minutes, and the lock floor elevation was at 624 ft.
Emptying Cycle (4.25-Min Opening, 3-ft Gate; Lock Floor Elevation at 624 ft)
0
20
40
60
80
100
120
0 50 100 150 200 250 300Time (sec)
Dis
char
ge (c
fs)
Figure 17. Discharge out of the lock chamber during the emptying cycle. The sluice gate opened as a cotangent function of time. The gate opening duration was 4.25 minutes, and the lock floor elevation was at 624 ft.
18
Filling Cycle (1-Min Opening, 2-ft Gate; Lock Floor Elevation at 624 ft)
0
20
40
60
80
100
120
0 50 100 150 200 250 300Time (sec)
Dis
char
ge (c
fs)
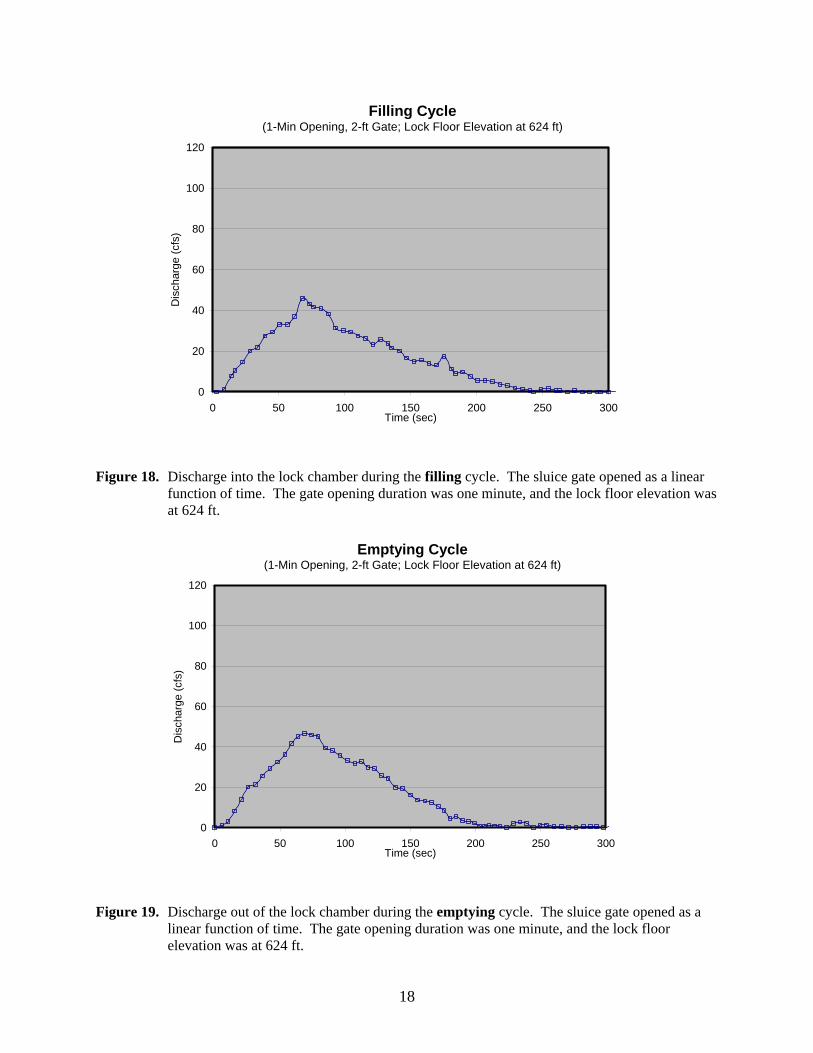
Figure 18. Discharge into the lock chamber during the filling cycle. The sluice gate opened as a linear function of time. The gate opening duration was one minute, and the lock floor elevation was at 624 ft.
Emptying Cycle (1-Min Opening, 2-ft Gate; Lock Floor Elevation at 624 ft)
0
20
40
60
80
100
120
0 50 100 150 200 250 300Time (sec)
Dis
char
ge (c
fs)
Figure 19. Discharge out of the lock chamber during the emptying cycle. The sluice gate opened as a linear function of time. The gate opening duration was one minute, and the lock floor elevation was at 624 ft.

19
3.2. Second Test Series In the second test series, 14 tests were conducted, out of which one test (Test # 11) was a
repeatability test. Thirteen tests were conducted using a linear function for the gate opening and
one using a tangent function. Three tests were conducted with a gate opening duration of 3
minutes, four tests with a duration of 0.5 minutes, and six tests with a duration of 2 minutes. In
addition, the floor level was lowered to elevation 622 ft for five tests, which did not show any
significant changes in the lock operation. The tests specifications and results are summarized in
Table 2. The headwater, tailwater, water level in the lock chamber and the gate opening of all
tests are plotted versus time in Appendix A (Figures A.1 to A.13).
Table 2. Results of the second test series.
Test
Cyc
le
Load
Function
Maximum Gate
Opening height (ft)
Floor Elevation
(ft)
Gate Opening Duration
(min)
Filling or Emptying Duration
(min)
Performance of the lock
1 F† Max Linear 2 624 3 ~ 5 Acceptable 2 E‡ Min Linear 2 624 3 ~ 4 Acceptable 3 F Max Linear 3 624 3 ~ 3.5 Acceptable 4 F Max Linear 3 624 0.5 ~ 2.5 Acceptable 5 E Max Linear 3 624 0.5 ~ 2.5 Acceptable 6 F Max Linear 3 622 0.5 ~ 3 Acceptable 7 F Min Linear 3 624 0.5 ~ 2.5 Acceptable 8 F Max Tangent 3 624 2 ~ 4 Not Acceptable 9 F Max Linear 2 624 2 ~ 4 Acceptable
10 F Max Linear 3 622 2 ~ 3.5 Acceptable 11* F Max Linear 3 622 2 ~ 3.5 Acceptable 12 F Min Linear 3 622 2 ~ 3.5 Acceptable 13 F None Linear 3 622 2 ~ 3.5 Acceptable 14 F None Linear 3 622 2 ~ 3.5 Acceptable
† F stands for filling cycle.
‡ E stands for emptying cycle
* This was a repetition of test 10.
All tests, except the test with a tangent function for the gate opening (Test #8), showed no abrupt
changes in the water surface level of the lock chamber and provided acceptable results. No
vortex was formed in the lock chamber, either. In all filling cycles, the vessel moved towards the
gallery wall as was seen in the initial test series.
The time variant discharge of Test # 8 is displayed in Figure 20. There was an oscillatory flow
into the chamber. The maximum discharge was slightly below 80 cfs, which could have been

20
affected by the computational time step. Nevertheless, unacceptable turbulence was evident
when observing the standard vessel in the chamber.
For three tests, the gate opening was set at two feet (Tests # 1, # 2 and # 9). In those three tests,
the filling/emptying times were the longest, i.e. longer than 4 minutes. Discharge versus time is
plotted in Figures 21 to 23. The maximum discharge was estimated to be 30 cfs for Tests # 1
and # 2. For Test # 9 with a gate opening duration of 2 minutes, the maximum discharge was
estimated to be slightly less than 40 cfs. Discharge versus time for the remaining eight tests is
plotted in Figures B.1 to B.8 (Appendix B). As is evident in Appendix B, Tests # 3, # 4 and # 6
with 0.5-minute gate opening exhibited large spikes in the estimated time variant discharge plots.
Since the gate opening duration was very short (11 seconds at the model scale), it was very
difficult to maintain the water levels in the head tank and tail tank at 640 and 631.2 ft,
respectively (Figures A.3, A.4 and A.6). Therefore, the spikes evident in Figures B.2, B.3 and
B.5 are partially due to unsteady levels of headwater and tailwater. It is noteworthy, that abrupt
changes in the estimated discharge were not evident while observing those tests runs.
Tests # 13 and # 14 were conducted for a filling cycle with no vessel in the lock chamber. The
gate opening height was set at 3 ft with a gate opening duration of 2 minutes. Confetti was
placed in the gallery and the lock chamber to better visualize the flow patterns. In the gallery,
the confetti was re-circulating due to the presence of rollers. In the lock chamber, most confetti
was collected at the downstream end of the chamber between the miter gate and the gallery wall.
All tests of the second test series were videotaped.

21
Filling Cycle, Loaded Boat (2-Min Opening of a 3-ft Gate; Lock Floor Elevation at 624 ft)
0
20
40
60
80
100
120
0 50 100 150 200 250 300Time (sec)
Dis
char
ge (c
fs)
Figure 20. Discharge into the lock chamber during the filling cycle. The sluice gate opened as a tangent function of time (see Figure A.8). The gate opening duration was 3 minutes, the gate opening height was 3 ft, and the lock floor elevation was at 624 ft (Test #8).
Filling Cycle, Loaded Boat(3-Min Opening of a 2-ft Gate; Lock Floor Elevation at 624 ft)
0
20
40
60
80
100
120
0 50 100 150 200 250 300Time (sec)
Dis
char
ge (c
fs)
Figure 21. Discharge into the lock chamber during the filling cycle. The sluice gate opened as a linear function of time (see Figure A.1). The gate opening duration was 3 minutes, the gate opening height was 2 ft, and the lock floor elevation was at 624 ft (Test #1).

22
Emptying Cycle, Unloaded Boat(3-Min Opening of a 2-ft Gate; Lock Floor Elevation at 624 ft)
0
20
40
60
80
100
120
0 50 100 150 200 250 300Time (sec)
Dis
char
ge (c
fs)
Figure 22. Discharge out of the lock chamber during the emptying cycle. The sluice gate opened as a linear function of time (see Figure A.2). The gate opening duration was 3 minutes, the gate opening height was 2 ft, and the lock floor elevation was at 624 ft (Test #2).
Filling Cycle, Loaded Boat(2-Min Opening of a 2-ft Gate; Lock Floor Elevation at 624 ft)
0
20
40
60
80
100
120
0 50 100 150 200 250 300Time (sec)
Dis
char
ge (c
fs)
Figure 23. Discharge into the lock chamber during the filling cycle. The sluice gate opened as a linear function of time (see Figure A.9). The gate opening duration was 2 minutes, the gate opening height was 2 ft, and the lock floor elevation was at 624 ft (Test #9).
23
4. Summary
To help with the design of a dual-chamber lock system on the San Antonio River, a physical
model study was conducted at St. Anthony Falls Laboratory. The model was built at a scale of
1:8 and included a single lock chamber, a gallery to convey water into and out of the lock
chamber, and the upstream and downstream sluice gates. The chamber and gallery floors and the
wall between the gallery and chamber were made removable for future modifications
Two series of tests were conducted during the model study. For each test, headwater, tailwater,
water surface level in the lock chamber and the opening of the sluice were recorded. The
performance of the lock chamber was determined qualitatively; vessel behavior and flow patterns
inside the gallery and the lock chamber were videotaped.
The first test series was conducted to provide an initial assessment of the lock performance. For
the second test series, 14 tests were conducted, of which only one did not provide acceptable
chamber stability results. In the remaining 13 tests no adverse surface turbulence in the lock
chamber was observed. In addition, no vortex was detected in the lock chamber. The filling and
emptying time of all tests was shorter than the design target of 5 minutes.
The only anomaly observed in the lock chamber was the slow drifting motion of the front hull of
the vessel towards the gallery wall. The motion occurred only during the filling cycle. The
motion of the front hull was due to the upwelling caused by the jets entering the lock chamber,
and the absence of mooring lines on the front end of the vessel.
24
Appendix A. Filling and Emptying Cycles of the Final Test Series
Filling Cycle, Loaded Boat (3-Min Opening of a 2-ft Gate; Lock Floor Elevation at 624 ft)
628
630
632
634
636
638
640
642
0 60 120 180 240 300
Time (seconds)
Ele
vatio
n (ft
)
0
4
8
12
16
20
24
28
Gat
e O
peni
ng (
inch
es)
Headwater Elevation Tailwater Elevation Lock Elevation Gate Opening
Figure A.1. Headwater, tailwater, water surface level in the lock chamber and the gate opening during the filling cycle. The sluice gate opened as a linear function of time. The gate opening duration was 3 minutes, the gate opening height was 2 ft, and the lock floor elevation was at 624 ft (Test #1).

25
Emptying Cycle, Unloaded Boat (3-Min Opening of a 2-ft Gate; Lock Floor Elevation at 624 ft)
628
630
632
634
636
638
640
642
0 60 120 180 240 300
Time (seconds)
Ele
vatio
n (ft
)
0
4
8
12
16
20
24
28
Gat
e O
peni
ng (i
nche
s)
Headwater Elevation Tailwater Elevation Lock Elevation Gate Opening
Figure A.2. Headwater, tailwater, water surface level in the lock chamber and the gate opening during the emptying cycle. The sluice gate opened as a linear function of time. The gate opening duration was 3 minutes, the gate opening height was 2 ft, and the lock floor elevation was at 624 ft (Test #2).

26
Filling Cycle, Loaded Boat (3-Min Opening of a 3-ft Gate; Lock Floor Elevation at 624 ft)
628
630
632
634
636
638
640
642
0 60 120 180 240 300
Time (seconds)
Ele
vatio
n (ft
)
0
6
12
18
24
30
36
42
Gat
e O
peni
ng (i
nche
s)
Headwater Elevation Tailwater Elevation Lock Elevation Gate Opening
Figure A.3. Headwater, tailwater, water surface level in the lock chamber and the gate opening during the filling cycle. The sluice gate opened as a linear function of time. The gate opening duration was 3 minutes, the gate opening height was 3 ft, and the lock floor elevation was at 624 ft (Test #3).

27
Filling Cycle, Loaded Boat (31-Second Opening of a 3-ft Gate; Lock Floor Elevation at 624 ft)
628
630
632
634
636
638
640
642
0 60 120 180 240 300
Time (seconds)
Ele
vatio
n (ft
)
0
6
12
18
24
30
36
42
Gat
e O
peni
ng (i
nche
s)
Headwater Elevation Tailwater Elevation Lock Elevation Gate Opening
Figure A.4. Headwater, tailwater, water surface level in the lock chamber and the gate opening during the filling cycle. The sluice gate opened as a linear function of time. The gate opening duration was 0.5 minutes, the gate opening height was 3 ft, and the lock floor elevation was at 624 ft (Test #4).

28
Emptying Cycle, Loaded Boat (31-Second Opening of a 3-ft Gate; Lock Floor Elevation at 624 ft)
628
630
632
634
636
638
640
642
0 60 120 180 240 300
Time (seconds)
Ele
vatio
n (ft
)
0
6
12
18
24
30
36
42
Gat
e O
peni
ng (i
nche
s)
Headwater Elevation Tailwater Elevation Lock Elevation Gate Opening
Figure A.5. Headwater, tailwater, water surface level in the lock chamber and the gate opening during the emptying cycle. The sluice gate opened as a linear function of time. The gate opening duration was 0.5 minutes, the gate opening height was 3 ft, and the lock floor elevation was at 624 ft (Test #5).
29
Filling Cycle, Loaded Boat (31-Second Opening of a 3-ft Gate; Lock Floor Elevation at 622 ft)
628
630
632
634
636
638
640
642
0 60 120 180 240 300
Time (seconds)
Ele
vatio
n (ft
)
0
6
12
18
24
30
36
42
Gat
e O
peni
ng (i
nche
s)
Headwater Elevation Tailwater Elevation Lock Elevation Gate Opening
Figure A.6. Headwater, tailwater, water surface level in the lock chamber and the gate opening during the filling cycle. The sluice gate opened as a linear function of time. The gate opening duration was 0.5 minutes, the gate opening height was 3 ft, and the lock floor elevation was at 622 ft (Test #6).

30
Filling Cycle, Unloaded Boat (31-Second Opening of a 3-ft Gate; Lock Floor Elevation at 624 ft)
628
630
632
634
636
638
640
642
0 60 120 180 240 300
Time (seconds)
Ele
vatio
n (ft
)
0
6
12
18
24
30
36
42
Gat
e O
peni
ng (i
nche
s)
Lock Elevation Headwater Elevation Tailwater Elevation Gate Opening
Figure A.7. Headwater, tailwater, water surface level in the lock chamber and the gate opening during the filling cycle. The sluice gate opened as a linear function of time. The gate opening duration was 0.5 minutes, the gate opening height was 3 ft, and the lock floor elevation was at 624 ft (Test #7).
31
Filling Cycle, Loaded Boat (2-Min Opening of a 3-ft Gate; Lock Floor Elevation at 624 ft)
628
630
632
634
636
638
640
642
0 60 120 180 240 300
Time (seconds)
Ele
vatio
n (ft
)
0
6
12
18
24
30
36
42
Gat
e O
peni
ng (i
nche
s)
Lock Elevation Headwater Elevation Tailwater Elevation Gate Opening
Figure A.8. Headwater, tailwater, water surface level in the lock chamber and the gate opening during the filling cycle. The sluice gate opened as a tangent function of time. The gate opening duration was 2 minutes, the gate opening height was 3 ft, and the lock floor elevation was at 624 ft (Test #8).

32
Filling Cycle, Loaded Boat (2-Min Opening of a 2-ft Gate; Lock Floor Elevation at 624 ft)
628
630
632
634
636
638
640
642
0 60 120 180 240 300
Time (seconds)
Ele
vatio
n (ft
)
0
4
8
12
16
20
24
28
Gat
e O
peni
ng (
inch
es)
Headwater Elevation Tailwater Elevation Lock Elevation Gate Opening
Figure A.9. Headwater, tailwater, water surface level in the lock chamber and the gate opening during the filling cycle. The sluice gate opened as a linear function of time. The gate opening duration was 2 minutes, the gate opening height was 2 ft, and the lock floor elevation was at 624 ft (Test #9).

33
Filling Cycle, Loaded Boat (2-Min Opening of a 3-ft Gate; Lock Floor Elevation at 622 ft)
628
630
632
634
636
638
640
642
0 60 120 180 240 300
Time (seconds)
Ele
vatio
n (ft
)
0
6
12
18
24
30
36
42
Gat
e O
peni
ng (i
nche
s)
Headwater Elevation Tailwater Elevation Lock Elevation Gate Opening
Figure A.10. Headwater, tailwater, water surface level in the lock chamber and the gate opening during the filling cycle. The sluice gate opened as a linear function of time. The gate opening duration was 2 minutes, the gate opening height was 3 ft, and the lock floor elevation was at 622 ft (Test #10).

34
Filling Cycle, Loaded Boat (2-Min Opening of a 3-ft Gate; Lock Floor Elevation at 622 ft)
628
630
632
634
636
638
640
642
0 60 120 180 240 300
Time (seconds)
Ele
vatio
n (ft
)
0
6
12
18
24
30
36
42
Gat
e O
peni
ng (i
nche
s)
Headwater Elevation Tailwater Elevation Lock Elevation Gate Opening
Figure A.11. Headwater, tailwater, water surface level in the lock chamber and the gate opening during the filling cycle. The sluice gate opened as a linear function of time. The gate opening duration was 2 minutes, the gate opening height was 3 ft, and the lock floor elevation was at 622 ft. This was a repeatability test (Test #11).

35
Filling Cycle, Unloaded Boat (2-Min Opening of a 3-ft Gate; Lock Floor Elevation at 622 ft)
628
630
632
634
636
638
640
642
0 60 120 180 240 300Time (seconds)
Ele
vatio
n (ft
)
0
6
12
18
24
30
36
42
Gat
e O
peni
ng (i
nche
s)
Headwater Elevation Tailwater Elevation Lock Elevation Gate Opening
Figure A.12. Headwater, tailwater, water surface level in the lock chamber and the gate opening during the filling cycle. The sluice gate opened as a linear function of time. The gate opening duration was 2 minutes, the gate opening height was 3 ft, and the lock floor elevation was at 622 ft (Test #12).

36
Filling Cycle, No Boat (2-Min Opening of a 3-ft Gate; Lock Floor Elevation at 622 ft)
628
630
632
634
636
638
640
642
0 60 120 180 240 300
Time (seconds)
Ele
vatio
n (ft
)
0
6
12
18
24
30
36
42
Lock Elevation Headwater Elevation Tailwater Elevation Gate Opening
Figure A.13. Headwater, tailwater, water surface level in the lock chamber and the gate opening during the filling cycle. The sluice gate opened as a linear function of time. The gate opening duration was 2 minutes, the gate opening height was 3 ft, and the lock floor elevation was at 622 ft (Test #13).

37
Appendix B. Estimated Time Variant Discharge of the Final Test Series
Filling Cycle, Loaded Boat (3-Min Opening of a 3-ft Gate; Lock Floor Elevation at 624 ft)
0
20
40
60
80
100
120
0 50 100 150 200 250 300Time (sec)
Dis
char
ge (c
fs)
Figure B.1. Discharge into the lock chamber during the filling cycle. The sluice gate opened as a linear function of time. The gate opening duration was 3 minutes, the gate opening height was 3 ft, and the lock floor elevation was at 624 ft. (Test #3)

38
Filling Cycle, Loaded Boat(31-Second Opening of a 3-ft Gate; Lock Floor Elevation at 624 ft)
0
20
40
60
80
100
120
0 50 100 150 200 250 300Time (sec)
Dis
char
ge (c
fs)
Figure B.2. Discharge into the lock chamber during the emptying cycle. The sluice gate opened as a linear function of time. The gate opening duration was 0.5 minutes, the gate opening height was 3 ft, and the lock floor elevation was at 624 ft. (Test # 4)
39
Emptying Cycle, Loaded Boat(31-Second Opening of a 3-ft Gate; Lock Floor Elevation at 624 ft)
0
20
40
60
80
100
120
0 50 100 150 200 250 300Time (sec)
Dis
char
ge (c
fs)
Figure B.3. Discharge into the lock chamber during the filling cycle. The sluice gate opened as a linear function of time. The gate opening duration was 0.5 minutes, the gate opening height was 3 ft, and the lock floor elevation was at 624 ft. (Test # 5)
40
Filling Cycle, Loaded Boat(31-Second Opening of a 3-ft Gate; Lock Floor Elevation at 622 ft)
0
20
40
60
80
100
120
0 50 100 150 200 250 300Time (sec)
Dis
char
ge (c
fs)
Figure B.4. Discharge into the lock chamber during the filling cycle. The sluice gate opened as a linear function of time. The gate opening duration was 0.5 minutes, the gate opening height was 3 ft, and the lock floor elevation was at 622 ft. (Test # 6)

41
Filling Cycle, Unloaded Boat (31-Second Opening of a 3-ft Gate; Lock Floor Elevation at 624 ft)
0
20
40
60
80
100
120
0 50 100 150 200 250 300Time (sec)
Dis
char
ge (c
fs)
Figure B.5. Discharge into the lock chamber during the filling cycle. The sluice gate opened as a linear function of time. The gate opening duration was 0.5 minutes, the gate opening height was 3 ft, and the lock floor elevation was at 624 ft. (Test # 7)

42
Filling Cycle, Loaded Boat(2-Min Opening of a 3-ft Gate; Lock Floor Elevation at 622 ft)
0
20
40
60
80
100
120
0 50 100 150 200 250 300Time (sec)
Dis
char
ge (c
fs)
Figure B.6. Discharge into the lock chamber during the filling cycle. The sluice gate opened as a linear function of time. The gate opening duration was 2 minutes, the gate opening height was 3 ft, and the lock floor elevation was at 622 ft. (Test # 10)

43
Filling Cycle, Loaded Boat(2-Min Opening of a 3-ft Gate; Lock Floor Elevation at 622 ft)
0
20
40
60
80
100
120
0 50 100 150 200 250 300Time (sec)
Dis
char
ge (c
fs)
Figure B.7. Discharge into the lock chamber during the filling cycle. The sluice gate opened as a linear function of time. The gate opening duration was 2 minutes, the gate opening height was 3 ft, and the lock floor elevation was at 622 ft. (Test # 11)
44
Filling Cycle, Unloaded Boat(2-Min Opening of a 3-ft Gate; Lock Floor Elevation at 622 ft)
0
20
40
60
80
100
120
0 50 100 150 200 250 300Time (sec)
Dis
char
ge (c
fs)
Figure B.8. Discharge into the lock chamber during the filling cycle. The sluice gate opened as a linear function of time. The gate opening duration was 2 minutes, the gate opening height was 3 ft, and the lock floor elevation was at 622 ft. (Test # 12)

45
Filling Cycle, No Boat(2-Min Opening of a 3-ft Gate; Lock Floor Elevation at 622 ft)
0
20
40
60
80
100
120
0 50 100 150 200 250 300Time (sec)
Dis
char
ge (c
fs)
Figure B.9. Discharge into the lock chamber during the filling cycle. The sluice gate opened as a linear function of time. The gate opening duration was 2 minutes, the gate opening height was 3 ft, and the lock floor elevation was at 622 ft. (Test # 13)