Embed Size (px)
Citation preview

eISSN: 2672-7226© Penerbit UMT
Journal of Sustainability Science and Management Volume 15 Number 6, August 2020: 85-99
PHYSICAL MODEL OF NATURAL COASTAL PROTECTION SYSTEM: GEOBAG-DYKE PERFORMANCE TO EFFECTIVENESS OF NATURAL
COASTAL PROTECTION SYSTEM
NITA YUANITA*1, ALAMSYAH KURNIAWAN1, MUHAMMAD LUQMAN AL HAKIM2, KRISNA REYNALDI IRAWAN2 AND NOVIANTO WONO SAPUTRA2 1Coastal Engineering Research Group, Faculty of Civil and Environmental Engineering, Institut Teknologi Bandung, Bandung 40132, Republic of Indonesia. 2Ocean Engineering Program, Faculty of Civil and Environmental Engineering, Institut Teknologi Bandung, Bandung 40132, Republic of Indonesia.
*Corresponding author: [email protected] final draft: 29 March 2020 Accepted: 8 June 2020
Introduction A combination of population growth and coastal migration has led to high population densities in many coastal areas. This increase was followed by major investments in infrastructure and the built environment. Coastal environments are continuously reshaped by the natural forces of waves, tides, storm surges, erosion, and deposition. In order to be sustainable, coastal development requires a clear understanding of these natural processes. However, the characteristics of coastal environments and ocean dynamics pose great challenges to human habitation and even pose hazards that are often
unrecognized. Therefore, disaster mitigation in coastal areas is an increasingly important aspect of coastal planning.
One of the coastal hazards that can become a major problem in coastal areas is erosion. Coastal erosion has emerged as a worldwide problem for both natural ecosystems and human communities (Chang et al., 2018). In order to solve this problem, natural coastal protection solutions using vegetation such as mangroves are currently preferred in many places in the world (Othman, 1994; Gedan et al., 2010; Bao, 2011; Verhagen, 2012; Narayan et al. 2016; Parvathy & Bhaskaran, 2017). Natural coastal protection
Abstract: One of the potential hazards that can cause major problems in coastal areas is erosion. In order to solve this problem, the notion of sustainable coastal development has garnered growing attention around the world. Coastal zone management mechanisms aim to ensure the sustainability of resources and the environment. For example, natural coastal protection using vegetation such as mangrove trees is currently preferred in many places in the world. However, there are challenges in the development of this natural form of coastal protection, e.g. mangrove seedling trees can be damaged by the waves or the current before they grow strong enough, and thus require appropriate protection until at least two years after planting. To solve this problem, a natural coastal protection system that combines a main natural protection and a temporary man-made structure is proposed. After a process of weighing temporary man-made-structure alternatives, the geobag dyke was selected. This study aimed to quantify the effects of various geobag dyke configurations and geobag unit weights on wave height reduction. Laboratory experiments were conducted on a narrow wave flume using a mangrove model as main natural protection and geotextile-geobag models as temporary man-made structures. Various wave conditions were generated during the laboratory tests. This paper focuses on the experimental results of wave transmission through the protection system in order to determine the most effective geobag dyke configuration to reduce the wave height. Based on experimental modelling, the most effective geobag dyke configuration uses relatively heavy geobag units with a moderate dyke slope (1:1.5).
Keywords: Natural coastal protection, mangroves, geobags, temporary structure, coastal sustainability.
http://doi.org/10.46754/jssm.2020.08.008

Nita Yuanita et al. 86
Journal of Sustainability Science and Management Volume 15 Number 6, August 2020: 85-99
follows the concept of building with nature, in which sustainability, multifunctionality, and stakeholder involvement are required instead of single-function solutions designed without due consideration of the surrounding system. Single-function solutions are no longer considered acceptable (De Vriend et al., 2015). Only a few studies have examined the combination of a coastal structure and mangrove restoration for coastal protection (Hashim et al., 2010). Detailed studies on combinations of temporary coastal structures with mangroves for coastal protection are scarce. To fill this gap, in the present study, a sustainable coastal solution is developed to have minimal impact on the environment during construction and operation. The present study provides baseline information in support of shoreline management plans toward sustainability and maintaining the natural characteristics and resource capabilities of coastal areas by providing information on a natural coastal protection system.
Planting a mangrove forest as natural coastal protection solution is also suitable for protecting coastlines from erosion in remote areas. Not only is it relatively low-cost (i.e. materials such as seeds and sediment are readily available), but it also can be constructed manually, as the use of heavy equipment is not an option in most remote areas. Extensive laboratory experiments have been carried out on the performance of mangrove forests as coastal protection (Husrin et al., 2012; Strusińska-Correia et al., 2014; Hashim & Catherine, 2013).
However, there are challenges in the development of this type of natural coastal protection. For example, mangrove seedling trees can be damaged by the waves or current before they grow strong enough, and thus require appropriate protection until at least two years after planting. To solve this problem, a natural coastal protection system that combines a main natural protection and temporary man-made structures is proposed (Yuanita et al., 2017; Yuanita et al., 2019). This is illustrated in Figure 1. There are several possible alternatives for the temporary man-made structure that
serves as a breakwater. Based on the structural configuration and material types, the alternatives are permeable brushwood made from bamboo or wood (Ginting, 2018); pile structures made from PVC (Polyvinyl Chloride) material pipe, bamboo (Brown et al., 2014) or wood; and dyke made from stones, precast concrete, or geotextile sandbags.
Since the materials are used in temporary structures and not for long-term protection, expensive options such as precast concrete or stones that require heavy equipment were ruled out. Inexpensive material options such as bamboo and wood, if available near the area, performed well as wave protectors, and the construction method was relatively easy since it did not require any heavy machinery. However, bamboo and wood are sensitive to wet and dry conditions owing to tides. This attracts insects that weaken bamboo and wood. However, according to Janssen (2000), physical bamboo treatment methods can help make bamboo more resilient to organisms. PVC pipe is resilient, but owing to its light weight, it needs to be filled with cement for stability against waves or currents.
There are two types of geotextile sandbags, i.e. geotubes and geobags, used as coastal protection. For example, the application of geotube in sand and muddy environments is presented in Lee et al. (2014). Both the geotube and geobag use geotextile material that is filled with local sediment material. The dimensions of the geotube are much larger than those of the geobag. For construction and installation, the geotube needs heavy equipment such as a mobile crane to properly placed the filled geotube. As for the geobag, it still possible to construct and install it manually. Given the various alternatives of temporary structures, the geobag was indicated as the most suitable temporary structure owing to its relatively low cost, easier mobilization by boat, and easier construction method. Hence, it is suitable to be applied in remote coastal areas.
As mentioned above, the geobag dyke structure fulfils the criteria for remote areas. A geobag is a specially designed sack with a certain

PHYSICAL MODEL OF NATURAL COASTAL PROTECTION SYSTEM: GEOBAG-DYKE 87
Journal of Sustainability Science and Management Volume 15 Number 6, August 2020: 85-99
tensile strength and durability. Each geobag unit is filled with material such as local sand, so no mobilization activities for rock or concrete material are required. Moreover, geobags are flexible to vertical or horizontal deformation. Oumeraci and Kortenhaus (2011) carried out a laboratory experiment related to the application of geobags as rubble mound breakwaters and seawalls.
Design guidelines and references regarding natural coastal protection applications are still lacking. Hence, this study was carried out in an attempt to develop design guidelines for natural coastal protection.
The study aimed to determine the effectiveness of a temporary structure as part of a natural coastal protection system (specifically, a temporary dyke made from geobags) in reducing the wave height. We present preliminary research using a physical laboratory experiment to develop design guidelines for natural coastal protection in a future work based on the results.
Materials and Methods The approach used to achieve the objectives of this research was a laboratory experiment involving a physical model. This physical model experiment followed the method described in the book Physical Models and Laboratory Techniques in Coastal Engineering by Hughes (1993). The methodology used in this study was as follows:
1) Literature study of various research studies on mangrove protection and geobag dyke structures
2) Planning of physical model experiment
3) Model preparation
4) Running of physical model simulation
5) Interpretation of model results
Review of the literatureSeveral research studies have been carried out to study the performance of mangrove forests as a wave reduction solution. The approaches used were as follows: analysing observation data based on mangrove forest applications, performing numerical modelling, and carrying out laboratory experiments.
Othman (1994) discussed various methods of using a mangrove forest as a natural coastal protection system based on experiences at the Department of Irrigation and Drainage in Malaysia, which implemented the system to protect agricultural areas. Gedan et al. (2010) carried out a literature review and analysis of wave attenuation data. They found evidence to support an established theory related to the ability of wetlands to stabilize shorelines and protect coastal communities. They suggested that mangroves and salt marsh vegetation can serve as protection from erosion, storm surges, and potentially small tsunami waves in combination with man-made structures. This is likely to increase coastal protection.
Bao (2011) studied the effect of mangrove forest structures on wave attenuation in the Red River Delta and the Can Gio mangrove forests in Vietnam. They measured mangrove forest structures and wave heights at certain distances.
Figure 1: Typical natural coastal protection consisting of (left) temporary geobag dyke and (right) natural main protection (mangroves)

Nita Yuanita et al. 88
Journal of Sustainability Science and Management Volume 15 Number 6, August 2020: 85-99
It was found that the wave height reduction depends on the initial wave height, cross-shore distance, and mangrove forest structure. The results of this study were used to determine the minimum mangrove bandwidth for coastal protection in Vietnam.
Verhagen (2012) described a design tool for the required width of mangrove belts as well as some guidance for planting mangroves. Design graphs were presented to determine the required mangrove belt as a function of deep-water wave action and mangrove density.
A study of wave attenuation using a numerical mathematical method was carried out by Mei et al. (2011) and Parvathy and Bhaskaran (2017). Mei et al. (2011) highlighted analytical and numerical solutions for wave attenuation for different water depths and coastal forest configurations. Parvathy and Bhaskaran (2017) performed sensitivity experiments to analyse wave attenuation against mangroves while varying the sea-bottom slope using a third-generation numerical wave model. The energy reduction of waves reaching the shoreline through mangroves on mild slopes (1:80, 1:40) was 93 to 98%, nearly 84% for a 1:20 slope, and 67% for a steep slope (1:10). The study found that the wave height decays exponentially for a relatively mild slope of the beach profile, but as the bottom steepness increases, the wave height reduction becomes gradual depending on the water depth variation and wave transformation characteristics associated with different slopes.
Oumeraci and Kortenhaus (2011) carried out a laboratory experiment that applied geobags as the core of rubble mound structures. As expected, the core permeability substantially affected the armour stability on the seaside slope, the wave transmission, and the wave overtopping performance. The wave reflection and hydraulic stability of the rear slope were less affected. Formulae for the armour stability and hydraulic performance of the geocore breakwater were proposed.
Husrin et al. (2012) performed laboratory experiments on the effectiveness of mangroves in reducing the impact of a tsunami. The
complex tree structure of the mangrove (root system and trunk) was parameterized using a stiff structure assumption for different submerged root volume ratios and frontal tree areas. This experiment was continued by Strusińska-Correia et al. (2014); the results indicated the dependence of wave transmission on the wave growth mode and relative forest bandwidth. The highest transmission coefficient was attributed to nonbreaking waves, while the lowest transmission coefficient corresponded to waves breaking in front of/in the forest model.
Another laboratory experiment was conducted by Hashim and Catherine (2013) on a narrow wave flume using artificial mangrove models. Their study aimed to quantify tsunami wave height reduction with various mangrove densities and tree arrangements. The results showed that the wave height reduction in areas with mangroves was about two times greater than that on bare land. It was also found that wave height reduction owing to a staggered arrangement of trees was 10% lower than that owing to tandem arrangement.
Yuanita et al. (2019) carried out a physical model experiment of a natural coastal protection system with a focus on wave transmission over mangrove seedling trees. The results showed that the wave height reduction in areas with mangroves was about two times greater than that on bare land. The study also showed that staggered arrangements of mangrove trees are preferable.
Design consideration of geobags as coastal protection materialThe main concept of the geobag dyke is a temporary structure that protects growing mangrove saplings that will eventually become the main shore protection from the influence of the waves. The structural design has to ensure that the mangroves will receive adequate water to grow for at least two years. The design parameters are the tidal conditions, wave parameters (height and period), and soil characteristics. The structure elevation is selected by taking into account the tidal

PHYSICAL MODEL OF NATURAL COASTAL PROTECTION SYSTEM: GEOBAG-DYKE 89
Journal of Sustainability Science and Management Volume 15 Number 6, August 2020: 85-99
conditions based on the elevation of the mean high water spring (MHWS) so that an adequate amount of seawater can pass through the structure.
Geobags are specially designed sacks with a certain tensile strength and durability. The application of geobags as protection is accomplished by filling them with soil (preferably sandy soil) and stacking them in the form of a dyke. Geobag unit dimensions are selected based on the limited availability of heavy equipment in remote areas. Thus, the construction of a geobag shore/coastal protection structure must be done manually using human resources. The material specification for geobags is a polyester nonwoven geotextile. They are constructed by a double stitch interlocking sewing mechanism in the fabrication process. Design of geobag dyke structure considers stability analysis that depend on the soil capacity condition, in the muddy coast where low capacity of soil is existed additional foundation is normally used.
Planning of Physical Model ExperimentIn the process of finding engineering solutions, there are two approaches, i.e. using physical modelling and using mathematical/numerical modelling. The numerical modelling of hydrodynamics, waves, and sediment transport is widely used for ocean, delta, or river areas (Yuanita and Tingsanchali, 2008). For cases that cannot be solved by numerical modelling, physical modelling is implemented. Physical models are constructed and operated at a reduced scale to examine coastal phenomena beyond the capability of numerical models, such as the optimization of the structure type to meet budgetary constraints and to study wave force responses on structures. The design optimization of coastal structures (e.g. breakwaters and seawalls) in a laboratory flume has been performed by several researchers, e.g. Coastal engineering Manual (CEM) (2003), Oumeraci and Kortenhaus (2011), and Kramer et al. (2005).
A physical modelling experiment was carried out on a wave flume in the Ocean
Engineering Laboratory of the Faculty of Civil and Environmental Engineering (FCEE), Institut Teknologi Bandung (ITB) (Figure 2). The dimensions of the 2D wave flume were as follows: length 40 m, width 1.2 m, and height 1.5 m. Four wave gauges were installed to measure the wave parameters at several points along the flume. The configuration of the physical model experiment is presented in Figure 3. The water depth (d) inside the flume was uniform for all scenarios with a depth of 0.65 m near the wavemaker and 0.4 m in the beach area. The simulation used variations of sinusoidal regular waves generated continuously by the wavemaker (beach slope 1:9). An artificial mangrove model made of iron bars was installed in the beach model, as shown in Figure 3. There were several combinations of mangrove configurations and mangrove densities. The positions of the wave gauges are indicated by CH0, CH1, CH2, and CH3. Based on the wave gauge positions, incoming wave data were determined based on the CH1 wave gauge, and transmitted waves were based on the CH2 wave gauge.
The model’s scale was determined based on the laboratory capacity and model similarity. Based on the laboratory capacity, the selected scale was 1:10. The dimensions of the mangrove prototype were selected with reference to Khazali (1999), Bao (2011), and Lovelock et al. (2005). The kinematics similarity was determined using the Froude number, as follows:
(1)
(2)
The Froude number of the model must be identical to the Froude number of the prototype, hence

Nita Yuanita et al. 90
Journal of Sustainability Science and Management Volume 15 Number 6, August 2020: 85-99
where, Fr = Froude number, V = velocity, L = length, and g = gravity acceleration. m is for model, and p is for prototype.
Model PreparationBased on the similarity between the model and the prototype as indicated in the previous section, the young mangrove trees and geobag dyke models were prepared. Even if this study focused only on the effectiveness of the geobag dyke in protecting young mangroves and the young mangroves only played a modest role in attenuating the waves, the presence of the mangrove model was still important to represent the real conditions of the natural coastal protection system. The mangrove model was
made using iron bars with a diameter of 8 mm and a length of 130 cm with various densities (number of bars per m2) to represent mangrove seedling trees. These iron bars were installed on a board and then positioned in the beach model frame.
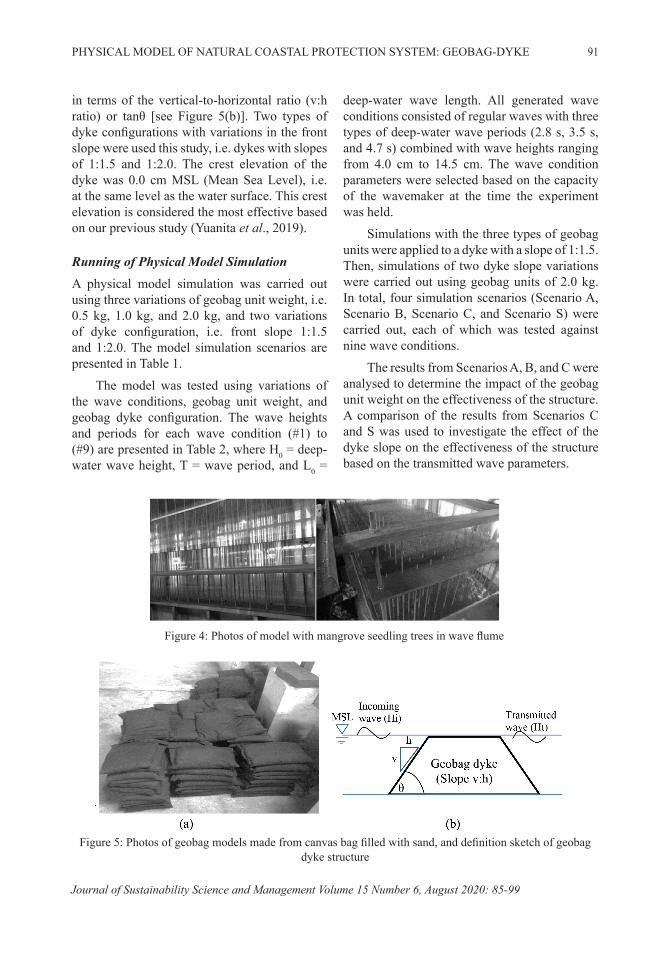
An illustration of the mangrove model is presented in Figure 4. The geobag models were made from canvas sacks that were filled with sand, as illustrated in Figure 5(a). Three types of geobag units were used in this experiment, i.e. geobag units with a weight of 0.5 kg, 1.0 kg, and 2.0 kg. These geobag models were consistent with geobag unit weight of 500 kg, 1000 kg and 2000 kg in real life application. The geobags were arranged in the wave flume, forming a dyke structure with a slope defined
Figure 2: Wave flume in Ocean Engineering Laboratory of Faculty of Civil and Environmental Engineering, Institut Teknologi Bandung
Figure 3: Configuration of physical model experiment on wave flume
PHYSICAL MODEL OF NATURAL COASTAL PROTECTION SYSTEM: GEOBAG-DYKE 91
Journal of Sustainability Science and Management Volume 15 Number 6, August 2020: 85-99
in terms of the vertical-to-horizontal ratio (v:h ratio) or tanθ [see Figure 5(b)]. Two types of dyke configurations with variations in the front slope were used this study, i.e. dykes with slopes of 1:1.5 and 1:2.0. The crest elevation of the dyke was 0.0 cm MSL (Mean Sea Level), i.e. at the same level as the water surface. This crest elevation is considered the most effective based on our previous study (Yuanita et al., 2019).
Running of Physical Model Simulation A physical model simulation was carried out using three variations of geobag unit weight, i.e. 0.5 kg, 1.0 kg, and 2.0 kg, and two variations of dyke configuration, i.e. front slope 1:1.5 and 1:2.0. The model simulation scenarios are presented in Table 1.
The model was tested using variations of the wave conditions, geobag unit weight, and geobag dyke configuration. The wave heights and periods for each wave condition (#1) to (#9) are presented in Table 2, where H0 = deep-water wave height, T = wave period, and L0 =
deep-water wave length. All generated wave conditions consisted of regular waves with three types of deep-water wave periods (2.8 s, 3.5 s, and 4.7 s) combined with wave heights ranging from 4.0 cm to 14.5 cm. The wave condition parameters were selected based on the capacity of the wavemaker at the time the experiment was held.
Simulations with the three types of geobag units were applied to a dyke with a slope of 1:1.5. Then, simulations of two dyke slope variations were carried out using geobag units of 2.0 kg. In total, four simulation scenarios (Scenario A, Scenario B, Scenario C, and Scenario S) were carried out, each of which was tested against nine wave conditions.
The results from Scenarios A, B, and C were analysed to determine the impact of the geobag unit weight on the effectiveness of the structure. A comparison of the results from Scenarios C and S was used to investigate the effect of the dyke slope on the effectiveness of the structure based on the transmitted wave parameters.
Figure 4: Photos of model with mangrove seedling trees in wave flume
Figure 5: Photos of geobag models made from canvas bag filled with sand, and definition sketch of geobag dyke structure

Nita Yuanita et al. 92
Journal of Sustainability Science and Management Volume 15 Number 6, August 2020: 85-99
Results and DiscussionBased on a comparison of the model results recorded by the wave gauges and data that were collected by visual observation, it can be seen that the recorded data were consistent with the visual data. Hence, for the data analysis, the wave gauge data were used. The ranges of the generated initial wave parameters were as follows: wave height 4.0 to 14.5 cm and wave period 2.8 to 4.7 s.
The effect of the geobag dyke structure model was analysed based on the wave transmission coefficient (Kt). The transmission coefficient is the ratio between the transmitted wave height (Ht) and initial wave height (Hi). The transmitted wave height (Ht) was obtained from the data of wave gauge CH2, while the initial wave height (Hi) was obtained from the data of wave gauge CH1.
(3)
where Kt is the transmission coefficient, Ht is the height of the transmitted waves, and Hi is the height of the incoming waves. A lower transmission coefficient indicates a decrease in wave height after passing the structure/system
or, in other words, better performance of the coastal protection.
The simulated transmission coefficient for all scenarios ranged from 0.1 to 0.98. The transmission coefficient results for all settings are presented in Tables 3 and 4. The first column indicates the wave condition type defined by the deep-water wave height (H0) and period (T); the deep-water data were collected from the CH0 wave gauge. The incoming wave height data (Hi) and the transmitted wave height (Ht) data for each scenario (geobag unit weights of 0.5 kg, 1.0 kg, and 2.0 kg) were collected from wave gauges CH1 and CH2. The transmission coefficient (Kt) for each scenario was calculated with Equation (3) using the related values of Hi and Ht.
Table 3 lists the transmission coefficient results for scenarios with variations in the geobag unit weight, while Table 4 lists the results the scenarios with variations in the structure slope. From Table 3, it can be seen that the average transmission coefficient decreased with an increasing geobag unit weight. This result was expected because larger geobags produce a more stable structure, resulting in a smaller transmission coefficient.
Table 1: Simulation scenarios
Scenario Code Geobag weight per unit Dyke slope A 0.5 kg 1:1.5B 1.0 kg 1:1.5C 2.0 kg 1:1.5S 2.0 kg 1:2.0
Table 2: Deep-water wave parameters for each wave condition
#Wave Condition
Deep-water wave #Wave Condition
Deep-water wave
H0 (cm) T (s) L0 (m) H0 (cm) T (s) L0 (m)
1 4 4.7 34.5 6 11.4 2.8 12.2
2 7.8 3.5 19.1 7 8.4 4.7 34.5
3 7.8 2.8 12.2 8 13.8 3.5 19.1
4 6.4 4.7 34.5 9 14.5 2.8 12.2
5 10.8 3.5 19.1

PHYSICAL MODEL OF NATURAL COASTAL PROTECTION SYSTEM: GEOBAG-DYKE 93
Journal of Sustainability Science and Management Volume 15 Number 6, August 2020: 85-99
From Table 4, a comparison of the average transmission coefficients for a geobag dyke slope of 1:1.5 (0.42) and a geobag dyke slope of 1:2.0 (0.49) shows a minor effect of the dyke slope on the transmitted wave height. In this case, the structure’s performance cannot be explained by the average transmission coefficient value. More discussion on this matter is presented in the next section.
The transformation of the wave height along the wave flume is presented in Figure 6.
The x-axis indicates wave gauges CH0, CH1, CH2, and CH3. The wave heights at CH0 indicate deep-water wave height, the wave heights at CH1 indicate incoming waves before they pass through the geobag dyke structure, the wave heights at CH2 indicate the transmitted wave height after passing through the geobag dyke structure and before passing through the mangroves, and the wave heights at CH3 represent the transmitted wave after passing through the mangrove model. The shadow
Table 3: Transmission coefficient for various geobag unit weights
#Wave Condition
Deep-water wave Geobag 0.5 kg Geobag 1 kg Geobag 2 kg
H0 (cm) T (s) Hi
(cm)Ht
(cm) KtHi
(cm)Ht
(cm) KtHi
(cm)Ht
(cm) Kt
1 4.0 4.7 8.21 1.35 0.16 8.43 1.23 0.15 6.90 0.72 0.102 7.8 3.5 5.67 4.53 0.80 5.99 3.47 0.58 6.10 1.87 0.313 7.8 2.8 5.65 5.56 0.98 6.25 5.07 0.81 4.20 1.09 0.264 6.4 4.7 11.27 3.77 0.33 10.51 2.96 0.28 9.18 2.02 0.225 10.8 3.5 7.49 7.32 0.98 8.15 6.69 0.82 8.69 4.39 0.516 11.4 2.8 9.39 8.25 0.88 9.79 7.64 0.78 6.22 3.51 0.567 8.4 4.7 13.22 5.22 0.40 12.79 3.84 0.30 11.03 4.95 0.458 13.8 3.5 10.43 9.61 0.92 10.28 9.51 0.93 11.13 7.29 0.65
9 14.5 2.8 13.77 9.89 0.72 14.04 10.14 0.72 7.76 5.78 0.74 Average 0.69 Average 0.60 Average 0.42
Table 4: Transmission coefficient of geobag dyke slope 1:1.5 and 1:2.0 (geobag unit weight at 2.0 kg)
#Wave Condition
Deep-water wave Geobag 2 kg (1:1.5) Geobag 2 kg (1:2)H0 (cm) T (s) Hi (cm) Ht (cm) Kt Hi (cm) Ht (cm) Kt
1 4.0 4.7 6.90 0.72 0.10 5.68 0.44 0.082 7.8 3.5 6.10 1.87 0.31 6.49 2.56 0.393 7.8 2.8 4.20 1.09 0.26 4.75 1.89 0.404 6.4 4.7 9.18 2.02 0.22 9.23 2.51 0.275 10.8 3.5 8.69 4.39 0.51 9.78 6.78 0.696 11.4 2.8 6.22 3.51 0.56 6.88 5.00 0.737 8.4 4.7 11.03 4.95 0.45 11.66 5.29 0.45
8 13.8 3.5 11.13 7.29 0.65 13.36 8.71 0.659 14.5 2.8 7.76 5.78 0.74 9.34 6.95 0.74
Average 0.42 Average 0.49

Nita Yuanita et al. 94
Journal of Sustainability Science and Management Volume 15 Number 6, August 2020: 85-99
between CH1 and CH2 represents the geobag model’s location, while the shadow between CH2 and CH3 represents the mangrove model.
DiscussionFirst, the wave parameters in relation to the geobag dyke structure for various geobag unit weights were compared based on the decrease in wave height from Scenarios A, B, and C, as indicated in Figure 6.
The general wave height transformation along the wave flume was analysed based on Figure 6. For the waves with the longest period, as represented by cases (#1), (#4), and (#7), the waves increased in height from the deep water in the direction of the coast owing to shoaling. Then, the wave heights were reduced owing to the presence of the structure. The wave height continued to decrease after passing through the mangrove model (waves at CH3). The effects of various geobag unit weights at the shortest wave period (2.8 s) are presented based on the results of the transformation of wave conditions
(#3), (#6), and (#9). Safe wave height for young mangroves is assumed to be 30 cm in real situation or based on model scale it was about 3 cm of wave height in the laboratory. From Figure 6, it is indicated that geobags dyke was successfully protect young mangroves for wave conditions of (#1), (#2), (#3), and (#4). It was observed that transmission coefficient Kt was significantly reduced, especially for a geobag unit weight of 2.0 kg. For the other wave conditions, in general, the wave height after passing through the geobag dyke was also reduced, as indicated by the wave height at CH2.
The effectiveness of the structure was first analysed by comparing the result of transmission coefficient Kt on bare land from our previous study (Yuanita et al., 2019) with transmission coefficient Kt for all scenarios in the current study. This is presented in Table 2 and Figure 7. In our previous study, an experiment using similar wave conditions was performed for bare land conditions (without mangroves or geobag dyke structures), with Kt varying from 0.73 to 1.195. Compared to the present study, as
Figure 6: Wave transformation from CH0 to CH3 along wave flume for nine wave conditions

PHYSICAL MODEL OF NATURAL COASTAL PROTECTION SYSTEM: GEOBAG-DYKE 95
Journal of Sustainability Science and Management Volume 15 Number 6, August 2020: 85-99
indicated in Table 2, where Kt varies from 0.1 to 0.98, it can be concluded that the presence of the geobag dyke structure was effective in reducing the wave height.
Based on Figure 7, it can be seen that transmission coefficient Kt decreased when heavier geobag units were used. The most effective performance occurred in the case of wave condition (#3), where the reduction in Kt was about 75% from the geobag unit weight at 0.5 kg to the geobag unit weight at 2.0 kg. This graph clearly indicates that the geobag unit weight had a significant effect on the performance of the structure, especially for certain wave conditions.
The effect of the structure slope on transmission coefficient Kt is presented in Figure 7, which compares the transformation coefficient points of Scenarios C (slope 1:1.5) and S (slope 1:2). It shows that the differences in transmission coefficient Kt between slopes 1:1.5 and 1:2.0 were not significant. Some wave conditions produced a 20% increase in the transformation coefficient. In other words, in some cases, a geobag dyke slope of 1:1.5 performed better than a geobag dyke slope of 1:2.0, as indicated by the value of the transmission coefficient. A geobag dyke with a slope of 1:2.0 is flatter and thus requires more geobag units than a slope of 1:1.5.
The effectiveness of the structure was also analysed based on the relation between the wave transmission coefficient and the following wave parameters: steepness, width of structure, and surf similarity. The surf similarity and the independent variable that represents the wave steepness are defined as follows (CEM, 2003):
(4)
(5)
Figure 8 presents the relationship between transmission coefficient Kt and the wave steepness for all model settings (Scenarios A, B, C, and S). The linear lines are the regression of the results for each scenario.
The lowest transmission coefficient value occurred in Scenario C, as presented in Figure 8. From the graph, it can be seen that transmission coefficient Kt decreased from Scenarios A to C. The reduction in Kt represents a reduction in the transmitted wave compared to the initial wave owing to the higher weight of the geobag units. The effect of the geobag dyke slope is presented by comparing the curves for Scenario C and Scenario S in Figure 8. It can be seen that Scenario C was more effective than Scenario S even if the difference was insignificant.
Figure 7: Transmission coefficient Kt for each wave condition (#1–9) for all scenarios

Nita Yuanita et al. 96
Journal of Sustainability Science and Management Volume 15 Number 6, August 2020: 85-99
The wave reduction varied with the wave steepness: a higher wave steepness produced a reduction in the transmission coefficient. This is consistent with the assumption that shorter waves are more easily dissipated by coastal structures such as breakwaters and dykes.
The relationship between transmission coefficient Kt and the relative structure bottom width of the geobag dyke (ratio between bottom width and wave height) for various wave periods is presented in Figure 9. The graph shows
the effect of the relative bottom width on the transmission wave, i.e. a wider structure bottom resulted in a greater wave height reduction at the same length of incoming waves.
Figure 10 shows the relationship between transmission coefficient Kt and the surf similarity parameter for different structure slopes (Scenarios C and S). Based on the graph, the regression lines of the values of Kt in Scenarios C and S were similar. In other words, the values of Kt in Scenario C (using slope 1:1.5)
Figure 8: Relationship between transmission coefficient Kt and wave steepness for various geobag unit weights
Figure 9: Relationship between transmission coefficient Kt and relative structure bottom width of geobag dyke (ratio between bottom width and wave height) for various wave periods

PHYSICAL MODEL OF NATURAL COASTAL PROTECTION SYSTEM: GEOBAG-DYKE 97
Journal of Sustainability Science and Management Volume 15 Number 6, August 2020: 85-99
Figure 10: Relationship between transmission coefficient Kt and surf similarity parameter (Irribarren number)
were similar to those in scenario S (slope 1:2.0) even though the value of the surf similarity parameter was different. The surf similarity as described in Formula (4) represents the beach profile slope ratio (indicated in this case by the structure slope) and wave steepness. This result is consistent with the above explanation that the difference in effects of the structure slopes of 1:1.5 and 1:2.0 was insignificant.
ConclusionA natural coastal protection system consisting of a geobag dyke structure and mangroves was tested under various incident wave conditions in the FCEE ITB wave flume to study the effectiveness of the geobag dyke structure as temporary protection for young mangrove trees in terms of the wave height transmitted behind it. The temporary geobag dyke configuration protects the growing young mangroves until they are strong enough to serve as permanent main protection of the coast. The experiment successfully demonstrated the potential use of soft engineering in reducing wave heights to protect coastal environments.
Based on the model results, it was observed that the effectiveness of a temporary geobag dyke structure significantly depends on the incoming wave parameters, especially the wave height and wave steepness. The transmitted wave height that is safe for young mangroves
was existed for several wave conditions in this experiment. Further study by applying specific site wave condition would be investigated. The steeper the waves (in the cases that were generated in this experiment), the more reduction of the transmitted wave height occurred. On the protection side, the geobag dyke configuration, i.e. geobag unit weight, significantly affected the wave reduction, while the effect of the geobag dyke slope in certain scenarios in this experiment was insignificant.
The results of this study showed that the wave height reduction owing to the presence of a geobag dyke structure varied between 2% and 90%. This significantly depended on the wave parameters and the geobag unit weight. Surprisingly, the geobag dyke slope did not contribute significantly to the structure’s performance in the scenarios considered in this study.
Based on the experiment, the most effective geobag dyke configuration used relatively heavy geobag units and a moderate dyke slope of 1:1.5.
Acknowledgements This work was funded by the Bandung Institute of Technology under an ITB Research and Community Service Program (Program Penelitian dan Pengabdian Masyarakat or P3MI) grant through the Coastal Engineering Research Group.

Nita Yuanita et al. 98
Journal of Sustainability Science and Management Volume 15 Number 6, August 2020: 85-99
References Bao, T. Q. (2011). Effect of mangrove forest
structures on wave attenuation in coastal Vietnam. Oceanologia, 53(3), 807-818.
Brown, B., Fadillah, R., Nurdin, Y., Soulsby, I., & Ahmad, R. (2014). CASE STUDY: Community Based Ecological Mangrove Rehabilitation (CBEMR) in Indonesia. S.A.P.I.E.N.S [Online] 7.2, Online since 22 April 2014, connection on 14 November 2019. doi: http://journals.openedition.org/sapiens/1589
CEM. (2003). Coastal Engineering Manual. Engineer Manual 1110-2-1100.Washington, DC, USA: US Army Corps of Engineers,
Chang, Y., Chu K., & Chuang L. Z. H. (2018). Sustainable coastal zone planning based on historical coastline changes: A model from case study in Tainan, Taiwan. Landscape and Urban Planning, 174(2018) 24-32. https://doi.org/10.1016/j.landurbplan.2018.02.012.
De Vriend, H. J., Van Koningsveld, M., Aarninkhof, S. G. J., De Vries, M. B., & Baptistahi, M. J. (2015). Sustainable hydraulic engineering through building with nature. Journal of Hydro-environment Research, 9(2), 159-171. https://doi.org/10.1016/j.jher.2014.06.004
Gedan, K. B., Kirwan, M. L., & Wolanski, E. (2011). The present and future role of coastal wetland vegetation in protecting shorelines: Answering recent challenges to the paradigm. Climatic Change, 106, 7. https://doi.org/10.1007/s10584-010-0003-7
Ginting, J. W. R. (2018). Efisiensi Model Fisik Peredaman Energi Gelombang Dengan Permeable Breakwater. Jurnal Teknik Hidraulik, 9(1). https://doi.org/10.32679/jth.v9i1.420
Harihar, S., & Verhagen, H. J. (2017). Application of Bamboo in Mangrove Rehabilitation Projects. Proceedings of the
Institution of Civil Engineers - Structures and Buildings, ISSN 0965-0911, Volume 170 Issue 4, pp 227-235. https://doi.org/10.1680/jstbu.16.00039
Hashim, R., Kamali, B., Tamin, N. M., & Zakaria, R. (2010). An integrated approach to coastal rehabilitation: Mangrove restoration in Sungai Haji Dorani, Malaysia. Estuarine, Coastal and Shelf Science, 86, 118–124.
Hashim, A. M. & Catherine, S. M. P. (2013). A laboratory study on wave reduction by mangrove forests. APCBEE Procedia, 5, 27-32.
Hughes, S. A. (1993). Physical models and laboratory techniques in coastal engineering (Advanced Series on Ocean Engineering). World Scientific Pub Co Inc.
Husrin, S., Strusínska, A., & Oumeraci, H. (2012). Experimental study on tsunami attenuation by mangrove forest. Journal of Earth Planets Space, 64, 973-989.
Khazali. (1999). Penanaman Mangrove Bersama Masyarakat, Panduan Teknis (Technical Guidance). Wetland International.
Kramer, M., Zanuttigh, B., van der Meer, J. W., Vidal, C., & Gironella, F. X. (2005). Laboratory experiments on low-crested breakwaters. Coastal Engineering, 52(10-11), 867-885. Elsevier. https://doi.org/10.1016/j.coastaleng.2005.09.002
Lee, S. C., Hashim, R., Motamedi, S., & Song, K. I. (2014). Utilization of geotextile tube for sandy and muddy coastal management: A review. TheScientificWorldJournal, 2014, 494020. doi:10.1155/2014/494020
Lovelock, C., Feller, I., McKee, K., & Thompson, R. (2005). Variation in mangrove forest structure and sediment characteristics in Bocas del Toro Panama. Caribbean Journal of Science, 41, 456-464.
Mei, CC., Chan, I-C., & Liu, P.L-F. (2011). Long waves through emergent coastal vegetation. Journal of Fluid Mechanics,

PHYSICAL MODEL OF NATURAL COASTAL PROTECTION SYSTEM: GEOBAG-DYKE 99
Journal of Sustainability Science and Management Volume 15 Number 6, August 2020: 85-99
687, 461–491. https://doi.org/10.1017/jfm.2011.373
Narayan, S., Beck, M. W., Reguero, B. G., Losada, I. J., van Wesenbeeck, B., Pontee, N., et al. (2016). The effectiveness, costs and coastal protection benefits of natural and nature-based defences. PLoS ONE, 11(5), e0154735. https://doi.org/10.1371/journal.pone.0154735
Othman, M. A. (1994). Value of mangroves in coastal protection. In Sasekumar A., Marshall N., Macintosh D. J. (Eds.), Ecology and Conservation of Southeast Asian Marine and Freshwater Environments including Wetlands. Developments in Hydrobiology, Volume 98. Dordrecht: Springer. https://doi.org/10.1007/978-94-011-0958-1_27
Oumeraci, H., & Kortenhaus, A. (2011). Core made of geotextile sand containers for rubble mound breakwaters and seawalls: Effects on armour stability and hydraulic performance. Ocean Engineering Journal, 38(1), 159-170. Elsevier. https://doi.org/10.1016/j.oceaneng.2010.10.014
Parvathy, K. G., & Bhaskaran, P. K. (2017). Wave attenuation in presence of mangroves: A sensitivity study for varying bottom slopes. The International Journal of Ocean and Climate Systems, 1-9.
Strusińska-Correia, A., Husrin, S., & Oumeraci, H. (2014). Attenuation of solitary wave by parametized flexible mangrove models. Coastal Engineering Proceedings, 1-34.
Verhagen, H. (2012). The Use of Mangroves in Coastal Protection. COPEDEC 2012: Proceedings of the 8th International Conference on Coastal and Port Engineering in Developing Countries, Chennai, India, 20-24.
Yuanita, N., Kurniawan, A., Paramashanti, & Laksmi, A. A. (2017). Natural coastal protection system preliminary design. Proceeding of Ocean, Mechanical and Aerospace-Science and Engineering, Volume 4, Padang, Indonesia.
Yuanita, N., Kurniawan, A., Setiawan, H., Hasan, F., & Khasanah, M. (2019). Physical model of natural coastal protection system: Wave transmission over mangrove seedling trees. The 3rd International Water Safety Symposium. Journal of Coastal Research, Special Issue(91), 176-180. Coconut Creek (Florida), ISSN 0749-0208.
Yuanita, N., & Tingsanchali, T. (2008). Development of a River Delta: A case study of Cimanuk river mouth, Indonesia. Hydrological Processes: An International Journal, 22(18), 3785-3801. https://doi.org/10.1002/hyp.6987


![Carley GIS workshop 20101109 [Read-Only] · GIS in Coastal Management Coastal Engineering Physical Model Testings Coastal Processes Climate Change and Sea Level Rise Foreshore Protection](https://img.pdfslide.us/doc/110x75/5e70b53c54818046d600f219/carley-gis-workshop-20101109-read-only-gis-in-coastal-management-coastal-engineering.jpg)