Embed Size (px)
Citation preview

Physical Mapping and Refinement ofthe Painted Turtle Genome (Chrysemys
picta) Inform Amniote GenomeEvolution and Challenge Turtle-Bird Chromosomal Conservation
The Harvard community has made thisarticle openly available. Please share howthis access benefits you. Your story matters
Citation Badenhorst, D., L. W. Hillier, R. Literman, E. E. Montiel, S.Radhakrishnan, Y. Shen, P. Minx, et al. 2015. “Physical Mapping andRefinement of the Painted Turtle Genome (Chrysemys picta) InformAmniote Genome Evolution and Challenge Turtle-Bird ChromosomalConservation.” Genome Biology and Evolution 7 (7): 2038-2050.doi:10.1093/gbe/evv119. http://dx.doi.org/10.1093/gbe/evv119.
Published Version doi:10.1093/gbe/evv119
Citable link http://nrs.harvard.edu/urn-3:HUL.InstRepos:21461792
Terms of Use This article was downloaded from Harvard University’s DASHrepository, and is made available under the terms and conditionsapplicable to Other Posted Material, as set forth at http://nrs.harvard.edu/urn-3:HUL.InstRepos:dash.current.terms-of-use#LAA
Physical Mapping and Refinement of the Painted Turtle
Genome (Chrysemys picta) Inform Amniote Genome
Evolution and Challenge Turtle-Bird Chromosomal
Conservation
Daleen Badenhorst1, LaDeana W. Hillier2, Robert Literman1, Eugenia Elisabet Montiel1,Srihari Radhakrishnan1, Yingjia Shen2, Patrick Minx2, Daniel E. Janes1,3, Wesley C. Warren2,Scott V. Edwards3, and Nicole Valenzuela1,*1Department of Ecology, Evolution, and Organismal Biology, Iowa State University2The Genome Institute at Washington University, St Louis3Department of Organismic and Evolutionary Biology, Harvard University
*Corresponding author: E-mail: [email protected].
Data deposition: This project has been deposited at the DDBJ/EMBL/GenBank database under the accession number AHGY00000000.2
Accepted: June 19, 2015
Abstract
Comparative genomics continues illuminating amniote genome evolution, but for many lineages our understanding remains incom-
plete. Here, we refine the assembly (CPI 3.0.3 NCBI AHGY00000000.2) and develop a cytogenetic map of the painted turtle
(Chrysemys picta—CPI) genome, the first in turtles and in vertebrates with temperature-dependent sex determination. A comparison
of turtle genomes with those of chicken, selected nonavian reptiles, and human revealed shared and novel genomic features, such as
numerous chromosomal rearrangements. The largest conserved syntenic blocks between birds and turtles exist in four macrochro-
mosomes, whereas rearrangements were evident in these and other chromosomes, disproving that turtles and birds retain fully
conservedmacrochromosomesforgreater than300Myr.C-bandingrevealed largeheterochromaticblocks in thecentromeric region
ofonly fewchromosomes.Thenucleolar-organizingregion (NOR)mappedtoasingleCPImicrochromosome,whereas insometurtles
and lizards the NOR maps to nonhomologous sex-chromosomes, thus revealing independent translocations of the NOR in various
reptilian lineages. There was no evidence for recent chromosomal fusions as interstitial telomeric-DNA was absent. Some repeat
elements (CR1-like, Gypsy) were enriched in the centromeres of five chromosomes, whereas others were widespread in the CPI
genome.Bacterial artificial chromosome(BAC)cloneswerehybridized to18of the25CPIchromosomesandanchoredtoaG-banded
ideogram. Several CPI sex-determining genes mapped to five chromosomes, and homology was detected between yet other CPI
autosomes and the globally nonhomologous sex chromosomes of chicken, other turtles, and squamates, underscoring the inde-
pendent evolution of vertebrate sex-determining mechanisms.
Key words: physical molecular cytogenetic BAC clone mapping, chromosomal rearrangements, genome and chromosome
evolution, translocations and inversions, nonmodel vertebrates, turtles, chicken, human, temperature-dependent and
genotypic sex determination.
Introduction
Novel and recalcitrant questions in biology are elucidated at an
increasing pace thanks to the development of new genomic
resources in nonmodel organisms (Janes et al. 2008), such as
the recent release of several chelonian (turtle) genomes: The
western painted turtle Chrysemys picta (CPI) (Shaffer et al.
2013), the Chinese softshell turtle Pelodiscus sinensis, and
the sea turtle Chelonia mydas (Wang et al. 2013). These
turtle genomes complement recent sequencing efforts on
other major reptilian groups including lizards (Alfoldi et al.
2011), crocodilians (St John et al. 2012; Green et al. 2014),
and snakes (Castoe et al. 2013; Vonk et al. 2013).
Phylogenetic analyses enabled by these chelonian genomes
strongly support the hypothesis that turtles are sister to
GBE
� The Author(s) 2015. Published by Oxford University Press on behalf of the Society for Molecular Biology and Evolution.
This is an Open Access article distributed under the terms of the Creative Commons Attribution Non-Commercial License (http://creativecommons.org/licenses/by-nc/4.0/), which permits
non-commercial re-use, distribution, and reproduction in any medium, provided the original work is properly cited. For commercial re-use, please contact [email protected]
2038 Genome Biol. Evol. 7(7):2038–2050. doi:10.1093/gbe/evv119
Archosaurs (birds and crocodilians) (Chiari et al. 2012;
Crawford et al. 2012; Deakin et al. 2013; Shaffer et al.
2013), a result of paramount importance as the accurate
placement of turtles in the tree of life is essential for the re-
construction of the evolutionary history of vertebrate traits
and genomes.
A major aspect of genome organization influencing
genome function and evolution is its compartmentalization
into chromosomes, because changes in the synteny of genes
and gene blocks alter their regulatory environment (Ahituv
et al. 2005), affecting transcription (De et al. 2009) and ad-
aptation (Kirkpatrick and Barton 2006; Hoffmann and
Rieseberg 2008; Loxdale 2010). Genome organization
varies among taxa and coevolves with other traits: An exam-
ple is the coevolution of chromosome number and sex de-
termination in turtles (Valenzuela and Adams 2011), or the
location and types of repeat elements and evolutionary
breakpoints of chromosomes prone to rearrangements
(Flint et al. 1994; Azzalin et al. 2001; Ruiz-Herrera et al.
2005). Additionally, karyological evolution is linked to line-
age diversification in a variety of organisms, including reptiles
(Olmo et al. 2002; Ayala and Coluzzi 2005; Olmo 2005;
Hoffmann and Rieseberg 2008). Thus, evolutionary and
functional genomics benefit not only from sequence data
but also from cytogenetic information that places DNA se-
quences in their physical and phylogenetic context to enable
evolutionary inferences across species.
In particular, comparative cytogenetic and sequence
analyses have illuminated many aspects of vertebrate
genome evolution (Deakin and Ezaz 2014) although
much remains to be learned. For instance, the sequencing
and physical mapping of the chicken genome revealed the
homology between bird and human chromosomes (Nanda
et al. 2000; Schmid et al. 2000), and the high conservation
of the avian genome previously attributed to the scarcity
of repeat elements (Backstrom et al. 2008) was later con-
firmed by additional genome analyses (Dalloul et al. 2010;
but see Griffin et al. 2007). Sequencing of outgroup ge-
nomes is also important for phylogenomics. For example,
the opossum and platypus genomes revealed shared and
unique genomic components in monotremes, birds, and
therian mammals (Mikkelsen et al. 2007; Warren et al.
2008), whereas genome evolution in teleosts and
gnathostomes is anchored by the coelacanth and lamprey
genomes (Kasahara et al. 2007; Amemiya et al. 2013;
Smith et al. 2013). Comparative approaches have also per-
mitted the reconstruction of ancestral karyotypes in line-
ages such as primates, marsupials, amniotes, tetrapods,
and vertebrates (De Leo et al. 1999; Richard et al. 2003;
Kemkemer et al. 2006, 2009; Kohn et al. 2006; Nakatani
et al. 2007; Stanyon et al. 2008; Uno et al. 2012; Deakin
et al. 2013; Romanov et al. 2014), among others.
Although sequence comparisons between the recently se-
quenced turtle genomes and those of other vertebrates
revealed a less prominent GC-rich isochore structure in
turtles than in mammals and birds (Shaffer et al. 2013),
we know less about the chromosomal rearrangements
that have accrued during chelonian evolution.
Turtles are a reptile group reported to have highly con-
served karyotypes when compared with lizards and snakes in
terms of the number, morphology, and G-banding pattern
of their chromosomes (Bickham 1981; Olmo 2008). Within
turtles, this conservation is greater in the suborder
Criptodira—to which all newly sequenced turtles belong—
relative to the suborder Pleurodira. Previous studies have
consistently identified highly conserved homology between
some turtle chromosomes and those of other vertebrates,
most notably between the six largest turtle and chicken chro-
mosomes (Matsuda et al. 2005), including CHICKEN-Z and P.
sinensis turtle chromosome 6 (PELODISCUS-6) (Matsuda
et al. 2005; Kawai et al. 2007); PELODISCUS-Z/W and
CHICKEN-15 (Kawagoshi et al. 2009), and PELODISCUS-6
and Elaphe quadrivirgata snake chromosome 2 (ELAPHE-2)
(Matsuda et al. 2005). Turtles resemble birds and lizards in
the presence of microchromosomes, some of which may also
represent ancient syntenies conserved since the rise of ver-
tebrates 400 Ma (Burt 2002), but which are notably absent in
mammals and crocodilians. Thus, more extensive analyses
encompassing a larger portion of the turtle karyotypes are
still needed to gain a comprehensive understanding of
genome evolution in turtles and vertebrates.
Here, we present an improved genome assembly and
the first physical BAC mapping of the painted turtle (CPI)
genome, the first of any vertebrate with temperature-
dependent sex determination (TSD), and a comparison
with other vertebrates where information is available
(mainly chicken and human). Importantly, we found evi-
dence dispelling the full conservation of several purported
syntenies while supporting the conservation of some sig-
nificant vertebrate gene blocks and the occurrence of nu-
merous chromosomal rearrangements over more than
300 Myr of vertebrate evolution. Specifically, we comple-
ment previous basic cytogenetic data for CPI (Killebrew
1977; De Smet 1978) with detailed G- and C-banded kar-
yotypic and molecular cytogenetic information otherwise
lacking for this emerging model species (Valenzuela
2009), including 1) the distribution of repeat elements,
18S rDNA and telomeres; 2) the first banded ideogram
for this species (diagrammatic representation of the hap-
loid chromosome set); and 3) the mapping of 61 se-
quenced BACs (some containing genes involved in
sexual development). Additionally, using a new set of bio-
informatic algorithms we obtained an improved genome
assembly with fewer and larger scaffolds (see
Supplementary Information) than the original released
CPI genome (Shaffer et al. 2013). Our molecular cytoge-
netic data permit the refinement of the painted turtle
genome assembly by anchoring scaffolds to chromosomes
Painted Turtle Cytomap Informs Amniote Evolution GBE
Genome Biol. Evol. 7(7):2038–2050. doi:10.1093/gbe/evv119 2039
and therefore provide the most detailed picture yet of the
structure of turtle chromosomes.
Materials and Methods
Cell Culture, Chromosome Preparation,and Chromosome Banding
Primary fibroblast cell cultures for cytogenetic analyses were
established using limb tissue from one male and one female
CPI 6-month-old hatchling as well as the adult female
whose genome was sequenced and reported in Shaffer
et al. (2013). The sex of all individuals was assessed by go-
nadal inspection. Briefly, fibroblast cell cultures were estab-
lished from collagenase (Sigma) digests and cultured using a
medium which was composed of 50% RPMI 1640 and
50% Leibowitz media supplemented with 15% fetal
bovine serum, 2 mM L-glutamine, and 1% antibiotic-antimy-
cotic solution (Sigma). Cultures were incubated at 30 �C
with no CO2 supplementation (Badenhorst et al. 2013).
Four hours prior to harvesting 10mg/ml colcemid (Roche)
was added to the cultures. Metaphase chromosomes were
harvested after colcemid arrest (KaryoMAX; Invitrogen), hy-
potonic exposure, and fixed in 3:1 methanol:acetic acid fol-
lowing standard procedures (Ezaz et al. 2006; Martinez
et al. 2008; Badenhorst et al. 2013). G- and C-banding
followed conventional protocols (Seabright 1971; Sumner
1972). The distribution of NORs (the genomic region con-
taining the genes for the 18S, 5.8S, and 28S ribosomal
subunits) was investigated by silver staining (Ag-NOR)
(Goodpasture and Bloom 1975), and by fluorescent in-situ
hybrydization (FISH) using a turtle-specific 18S DNA frag-
ment labeled by nick-translation and coprecipitated with
salmon sperm DNA (Badenhorst et al. 2013). A telomeric
probe containing the repeat motif (TTAGGG)n was gener-
ated and labeled by polymerase chain reaction, starting with
(TTAGGG)4 and (CCCTAA)4 primers in the absence of tem-
plate DNA (Ijdo et al. 1991).
BAC Clone Sequencing and Hybridization
Sets of randomly chosen clones from a CPI BAC library (library
VMRC CHY3 produced by the Joint Genome Institute) were
sequenced (through Illumina) as part of the turtle genome
sequencing project (Shaffer et al. 2013), and others (12
BACs) were screened for the putative presence of genes in
the turtle and vertebrate sex determination network
(Valenzuela 2010; Valenzuela et al. 2013) and sequenced in-
dependently in full (454 platform) or in part (Sanger sequenc-
ing) to confirm the presence of genes of interest. These
sequenced BACs (81 in total) were used to link cytogenetic
and DNA sequence data, to refine the genome assembly, and
to establish the syntenic relationships (relative genome posi-
tion) of functional genes. BAC DNA (~1mg) was extracted and
labeled by standard nick-translation (Abbott Molecular) using
either biotin or digoxingenin dUTPs (Roche) and coprecipitated
with human cot-1 DNA and turtle cot-1 DNA. FISH was carried
out using BAC, telomere, and 18S probes, by dehydrating the
slides through an ethanol series followed by denaturing the
chromosome preparations together with the probe-mix on a
hot plate at 65 �C for 2 min, and hybridization took place
overnight (two nights for 18S rDNA and telomere probes) in
a humid chamber at 37 �C. Posthybridization washes were
comprised of a first wash in 0.4� Saline-Sodium Citrate
(SSC)/0.3% Tween 20 for 2 min at 60�C, followed by a
second wash in 2� SSC/0.1% Tween 20 for 1 min at room
temperature. Fluorochrome detection was performed with
4XT/relevant antibody in a 200-ml final volume at 37�C for
45 min. Slides were subsequently washed thrice in 4XT at
37 �C, counterstained with DAPI (6ml DAPI 2 mg/ml in 50 ml
2� SSC), and mounted using an antifade solution
(Vectashield). Signals were assigned to specific chromosomes
according to their morphology, size, and DAPI-banding. FISH
was repeated after G-banding to improve anchoring of BAC
sequences to chromosomal regions, and two to four BAC FISH
was used to determine relative position within chromosomes.
Images were taken with a Photometrics CoolSnap ES2 Digital
Monochrome camera attached to an Olympus BX41 fluores-
cent microscope, and analyzed using CytoVision cytogenetic
analysis system (Applied Imaging/Genetix).
BAC Bioinformatics for Cytogenetic Analysis
All 61 sequenced BACs were mapped to CPI’s reference
genome assembly 3.0.3 using Geneious v.6.1.6 (Kearse
et al. 2012), as follows. First, Megablast was used to search
for the complete BAC sequence within the annotated CPI
genome. The annotations in the CPI genome were used to
identify putative protein-coding genes that co-occur on the
same genomic scaffold as the mapped BAC (61 in total).
Genomic scaffolding was improved in this study (assembly
3.0.3) with respect to the original genome assembly 3.0.1
(Shaffer et al. 2013) (see Supplementary information). The
genomic location of those genes (1,425 genes in total) in
the human and chicken genomes was determined from a
direct search in the NCBI (National Center for Biotechnology
Information) Database (Assemblies: homSapGRCh38,
galGal4), and information in other vertebrates was obtained
from the published literature.
Results and Discussion
Cytogenetic Data and Ideogram
A combination of classic and molecular cytogenetics allowed a
deeper characterization of the CPI karyotype than was previ-
ously reported for this species (Killebrew 1977; De Smet
1978), and included G- and C-banding, Ag-NOR (nucleolar-
organizing region), 18S rRNA, and telomere DNA mapping
(figs. 1 and 2). At least ten cells per individual were analyzed
Badenhorst et al. GBE
2040 Genome Biol. Evol. 7(7):2038–2050. doi:10.1093/gbe/evv119

for all cytogenetic procedures. The G-banded ideogram of the
haploid genome of CPI presented here depicts 189 defined G-
bands (dark AT-rich heterochromatin and light CG-rich eu-
chromatic bands; fig. 2). The smaller microchromosomes of
CPI were nearly indistinguishable from each other by shape
and were ordered by approximate size and G-banding pattern
where possible. Ours is the first banded ideogram developed
for any turtle and for any vertebrate with TSD and lacking sex
chromosomes (Valenzuela et al. 2014).
All three individuals examined had 2N = 50 chromosomes
with 26 macrochromosomes and 24 microchromosomes (4
metacentric, 18 submetacentric, 28 acrocentric), a result that
differs slightly from the 24 macrochromosomes and 20 meta-
centric/submetacentric chromosomes described by De Smet
(1978), but in agreement with Killebrew (1977). The subtle
difference from the report by De Smet (1978) could be due to
individual or population differences, but is more likely due to
the difficulty of unambiguously identifying the morphology of
FIG. 1.— G-banded (a), C-banded (b), and Ag-NOR stained (c) metaphase chromosomes of CPI, and the distribution of telomeric DNA (d) and 18S rDNA
repeats (e) on CPI metaphase spreads. Arrows indicate C-positive interstitial bands (b) and NOR localization (c).
Painted Turtle Cytomap Informs Amniote Evolution GBE
Genome Biol. Evol. 7(7):2038–2050. doi:10.1093/gbe/evv119 2041
turtle microchromosomes, because they may appear telocen-
tric, making the position of the centromere difficult to discern
(De Smet 1978).
The C-positive material representing constitutive hetero-
chromatin is largely restricted to the centromeric regions
with clearly observable blocks only visible in some chromo-
some pairs. Variation in the abundance of heterochromatin
in the centromeric regions among chromosomes is observed
by C-banding in a variety of taxa including humans, and re-
flects differences in the types and number of repeat elements
and satellite DNA (Sumner 2003). There is, however, intersti-
tial heterochromatin visible in chromosome pair 14 (fig. 1b)
that corresponds to the NOR (containing genes encoding the
three major ribosomal RNA subunits—18S, 5.8S, and 28S
[Shaw and McKeown 2011]). Indeed, a single interstitial
NOR was detected on chromosome pair 14 by both silver
staining, which detects active NORs, and 18S rDNA FISH,
which detects active and inactive NORs (fig. 1c and e),
corresponding to this C-positive band. These results agree
with a previous report using silver staining only (Bickham
and Rogers 1985). Interstitial NORs are not ubiquitous in tur-
tles; only 12 of 28 investigated turtles display interstitial NOR
sites, but they seem widespread in the subfamily Emydinae, to
which CPI belongs (Bickham and Rogers 1985). C-positive
blocks are also found in reptilian sex chromosomes (Kawai
et al. 2007; Singh 2011; Badenhorst et al. 2013; Matsubara
et al. 2014; Rojo et al. 2014) and may colocalize with the NOR
in the W chromosome of some turtles (Kawai et al. 2007;
Badenhorst et al. 2013) and lizards (Matsubara et al. 2014;
Rojo et al. 2014). However, our BAC mapping data rule out
the hypothesis that CPI-14 is homologous to any of these
reptilian sex chromosomes, and instead suggest that the
NOR has undergone translocations to multiple chromosomal
locations independently in various reptilian lineages.
Telomeric repeats localized exclusively to the end of the
chromosome arms (fig. 1d ), as expected given that telomeres
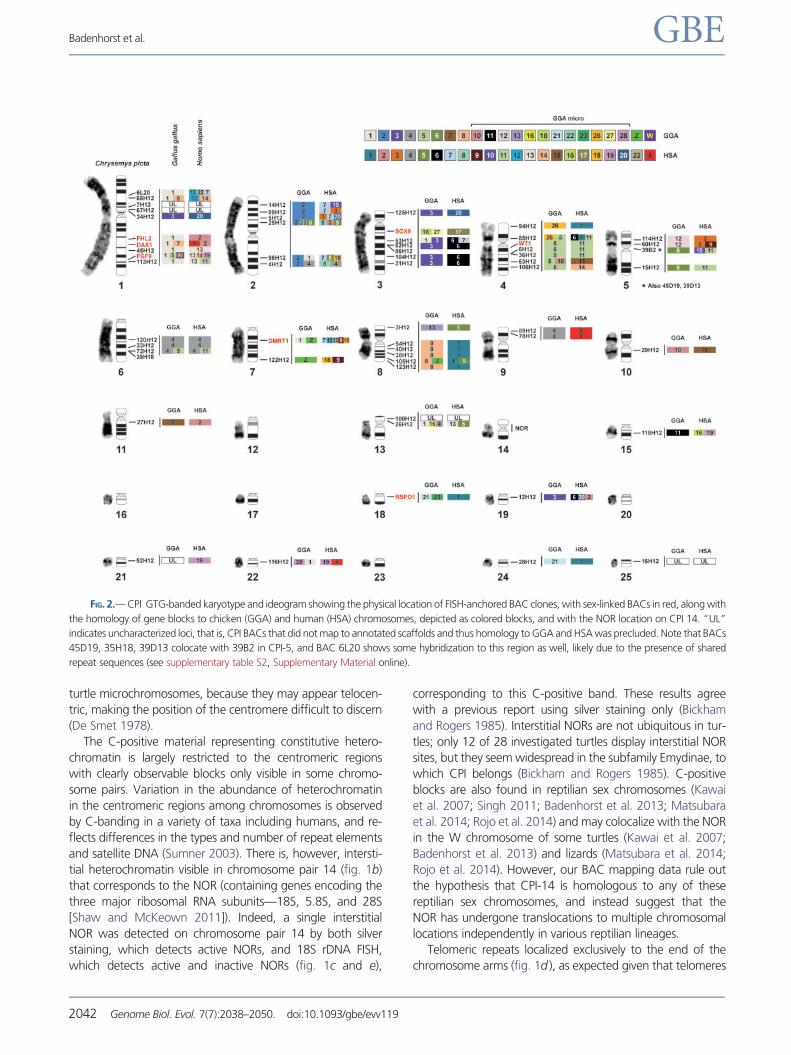
FIG. 2.— CPI GTG-banded karyotype and ideogram showing the physical location of FISH-anchored BAC clones, with sex-linked BACs in red, along with
the homology of gene blocks to chicken (GGA) and human (HSA) chromosomes, depicted as colored blocks, and with the NOR location on CPI 14. “UL”
indicates uncharacterized loci, that is, CPI BACs that did not map to annotated scaffolds and thus homology to GGA and HSA was precluded. Note that BACs
45D19, 35H18, 39D13 colocate with 39B2 in CPI-5, and BAC 6L20 shows some hybridization to this region as well, likely due to the presence of shared
repeat sequences (see supplementary table S2, Supplementary Material online).
Badenhorst et al. GBE
2042 Genome Biol. Evol. 7(7):2038–2050. doi:10.1093/gbe/evv119

play a key role in maintaining chromosome stability [(Bolzan
and Bianchi 2006)]. Interstitial telomeres are indicative of past
chromosomal rearrangements and evolutionary unstable
genome regions (Ruiz-Herrera et al. 2008). The absence of
interstitial telomeric sequences in CPI corresponds with previ-
ous reports in other turtles which also lack them (e.g.,
Trachemys dorbigni and Chelonoidis donosobarrosi
[Martinez et al. 2009]), as well as tuatara (O’Meally et al.
2009). However, these data contrast with lizards where they
are present, for example, in microchromosomes in Pogona
vitticeps (Young et al 2013), macrochromosomes in
Iberolacerta monticola (Rojo et al. 2014) or both in Leiolepis
lizards (Srikulnath et al. 2011). However, additional data on
the chromosomal location of telomeric sequences in a larger
subset of turtle taxa are needed to test whether such contrast-
ing patterns among these major reptilian lineages are
generalizable.
BAC-Mapping and Bioinformatic Analysis
A total of 61 of the 81 fully sequenced BAC clones were
successfully assigned to a unique location in the CPI ideogram
(figs. 2 and 3). BAC clones were assigned to 12 of the 13
macrochromosomes and 7 of the 12 microchromosomes.
Multicolor FISH was used to anchor BACs to microchromo-
somes and to macrochromosomes of similar size and shape.
Thus, 19 of the 25 chromosome pairs have BAC markers as-
signed to them, and chromosome pair 14 is distinguishable by
its C-positive block and by the localization of the NOR detect-
able by silver staining and/or 18S-FISH (fig. 1). This cytogenetic
BAC mapping information was combined with bioinformatics
analyses to refine the painted turtle genome assembly (see
supplementary information, Supplementary Material online)
and resulted in improved ultrascaffolds and chromosomal in-
formation. For instance, chromosomal AGPs were created and
centromeres were positioned using the BAC maps, which lo-
calized 461 Mb of genomic DNA to 18 chromosomes. AGPs
are “A Golden Path” description files of the components of
each chromosome. This is the first chromosomal AGP pro-
duced for a turtle and the second for nonavian reptiles
(Alfoldi et al. 2011). The improved genome sequence of CPI
3.0.3 was deposited in the DDBJ/EMBL/GenBank database
(accession number AHGY00000000.2). There were a few
mapped BACs containing DNA sequences with no annotation
and are referred to as “uncharacterized loci” in the figures
and tables.
An additional subset of 18 BAC clones produced too much
background during FISH to permit accurate localization
(fig. 3). Interestingly, these problematic BACs contained a
large proportion of various repeat elements indicating that
repeats are abundant and widespread throughout the turtle
genome (supplementary table S2, Supplementary Material
online; fig. 3d), consistent with the sequenced genome anal-
ysis (Shaffer et al. 2013). In contrast, the hybridization signal
from four BACs enriched for CR1-like and Gypsy repeat se-
quences exhibited a clustered pattern in the centromeric
region of five chromosome pairs, including a macrochromo-
some (CPI-5) and four microchromosomes (fig. 3c). These
repeat elements are also shared by four additional BACs
that map uniquely to the same region in CPI-5. These results
indicate that unlike other simpler repeat types, these transpos-
able elements are not randomly distributed in the CPI genome
but instead predominate on five chromosome pairs. This is the
first indication that turtle centromeric and pericentromeric re-
gions are not uniform in their composition, similar to what is
observed in chicken (Shang et al. 2010), humans, and other
metazoans (Maddox et al. 2012; Fukagawa and Earnshaw
2014). These results are also important because these repeats
may affect the evolution and regulation of these genomic
regions disproportionately (Kudla et al. 2006), and transpos-
able elements have played a significant role in the evolution of
other vertebrate genomes, such as in mammals (Mikkelsen
et al. 2007).
Bioinformatic analyses of the BAC sequences and the CPI
genome scaffolds to which they map permitted the first as-
sessment of homology between the painted turtle chromo-
somes and those of chicken (Gallus gallus [CHICKEN]) and
human (Homo sapiens [HUMAN]), as well as a few other
reptiles where partial genome or cytogenetic information
was available (fig. 4, table 1), specifically the turtle P. sinensis
(PELODISCUS), the snake E. quadrivirgata (ELAPHE), and sev-
eral lizards (Varanus salvator [VARANUS], Leiolepsis reevesii,
(LEIOLEPSIS) Po. vitticeps [POGONA]) (Matsuda et al. 2005;
Matsubara et al. 2006; Srikulnath et al. 2013; Young et al.
2013). In general, our data challenge the previously reported
conservation of macrochromosomes between birds and tur-
tles (Matsuda et al. 2005; Kasai et al. 2012). Specifically, by
using a much larger gene data set from our BAC clones and
the scaffolds to which they map in the CPI genome (1,425
genes) we identified numerous putative chromosomal rear-
rangements that passed undetected when using fewer mar-
kers in other turtles (e.g., 57 genes in Matsuda et al. [2005]).
Additionally, our data set allowed inferences of homologies
for over 70% of the turtle chromosome pairs (18 of 25) for
the first time, including intermediate sized and microchromo-
somes. Specifically, we found that CPI and chicken macro-
chromosomes 1, 2, and 3 represent the highest conserved
synteny. However, this is not a fully conserved synteny be-
cause they contain regions orthologous to at least four and
six chicken chromosomes; this number is a conservative es-
timate as our BAC coverage is not complete on the CPI
genome. Furthermore, CPI-4 contains larger gene block re-
gions that are orthologous to at least five chicken chromo-
somes compared with the smaller blocks that interrupt the
synteny of CPI-1, CPI-2 and CPI-3 and CHICKEN-1,
CHICKEN-2 and CHICKEN-3, respectively. The gene blocks
identified in CPI-1 to CPI-4 are orthologous to numerous
human chromosomes including HUMAN-X (figs. 2 and 4,
Painted Turtle Cytomap Informs Amniote Evolution GBE
Genome Biol. Evol. 7(7):2038–2050. doi:10.1093/gbe/evv119 2043
supplementary table S1, Supplementary Material online).
Homology to three chicken chromosomes was also detected
in CPI-8 and CPI-13, and homology to two chicken chromo-
somes was identified in CPI-5, CPI-6, CPI-7, and CPI-18. All
these CPI chromosomes exhibited homology to between two
and five human macrochromosomes. The contrast of gene
blocks among species permitted the detection of interchro-
mosomal translocations and inversions in turtle alone, some
only in chicken, and others in both turtle and chicken and
thus possibly shared across turtles and archosaurs, although
tests in crocodilians are needed to confirm this hypothesis
(fig. 4).
Our data also revealed syntenic blocks between painted
turtle autosomes and amniote sex chromosomes, and the cor-
respondence is not always one to one. For instance, macro-
chromosomes CPI-7 and CPI-8 harbor gene blocks that are
syntenic in CHICKEN-Z, whereas macrochromosomes CPI-1,
CPI-9, and microchromosome CPI-22 contain gene blocks
orthologous to HUMAN-X (fig. 4). In contrast, CPI-2 contains
genes that mapped to snake ELAPHE-Z and ELAPHE-W
(table 1). Although available data are scarce for other reptiles,
other regions of homology and rearrangements were also
detected, involving autosomes and sex chromosomes.
Namely, macrochromosome CPI-2 contains a gene block
homologous to VARANUS-4, POGONA-6, and ELAPHE-Z
(table 1). CPI-2 also shows partial homology to ELAPHE-3,
whereas ELAPHE-3 contains another gene block located in
CPI-8, and CPI-8 harbors a different gene block that maps
to ELAPHE-2, revealing several chromosomal rearrangements
between snakes and turtles (table 1). A CPI-4 region appears
homologous to PELODISCUS-5 (both macrochromosomes),
whereas a gene in CPI-8 (macrochromosome) maps to micro-
chromosome PELODISCUS-13. Some microchromosomes
appear to be syntenic across reptiles, as genes in CPI-15 and
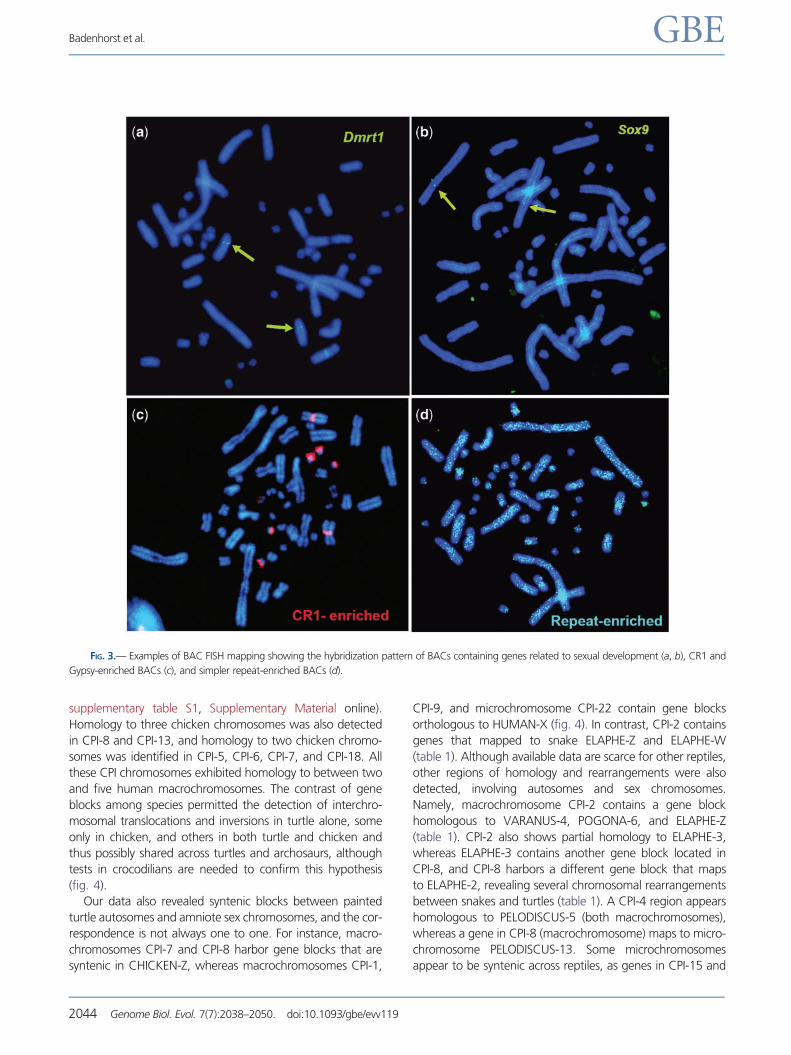
FIG. 3.— Examples of BAC FISH mapping showing the hybridization pattern of BACs containing genes related to sexual development (a, b), CR1 and
Gypsy-enriched BACs (c), and simpler repeat-enriched BACs (d).
Badenhorst et al. GBE
2044 Genome Biol. Evol. 7(7):2038–2050. doi:10.1093/gbe/evv119
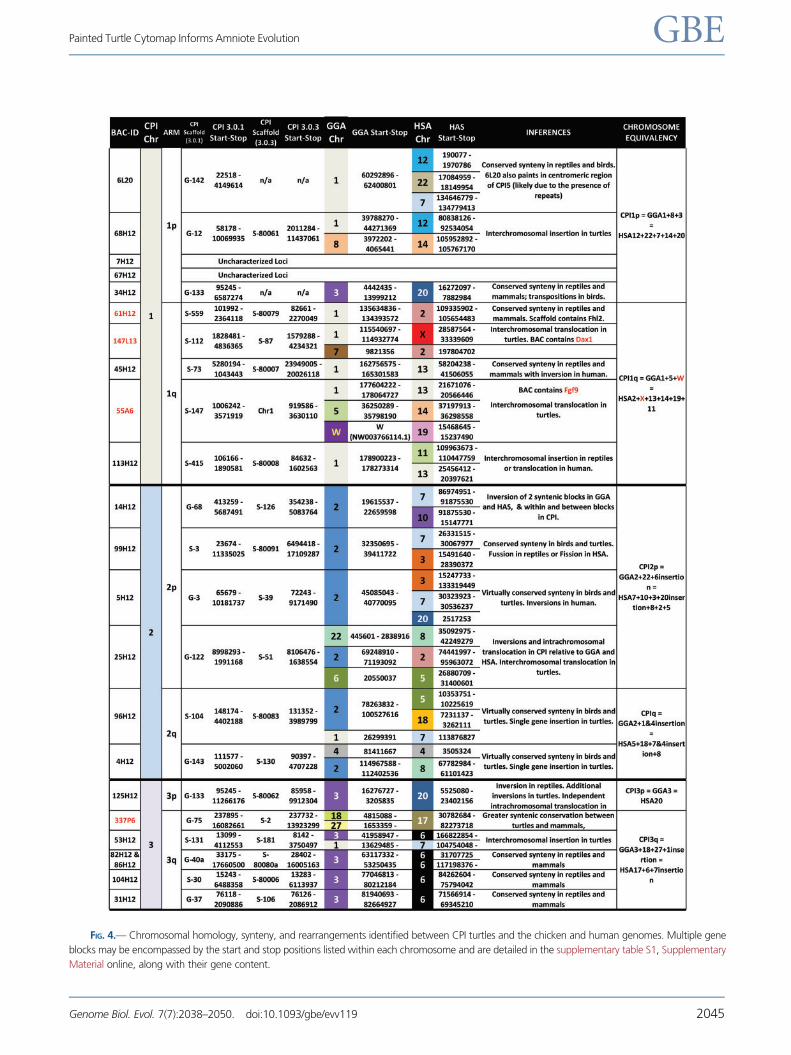
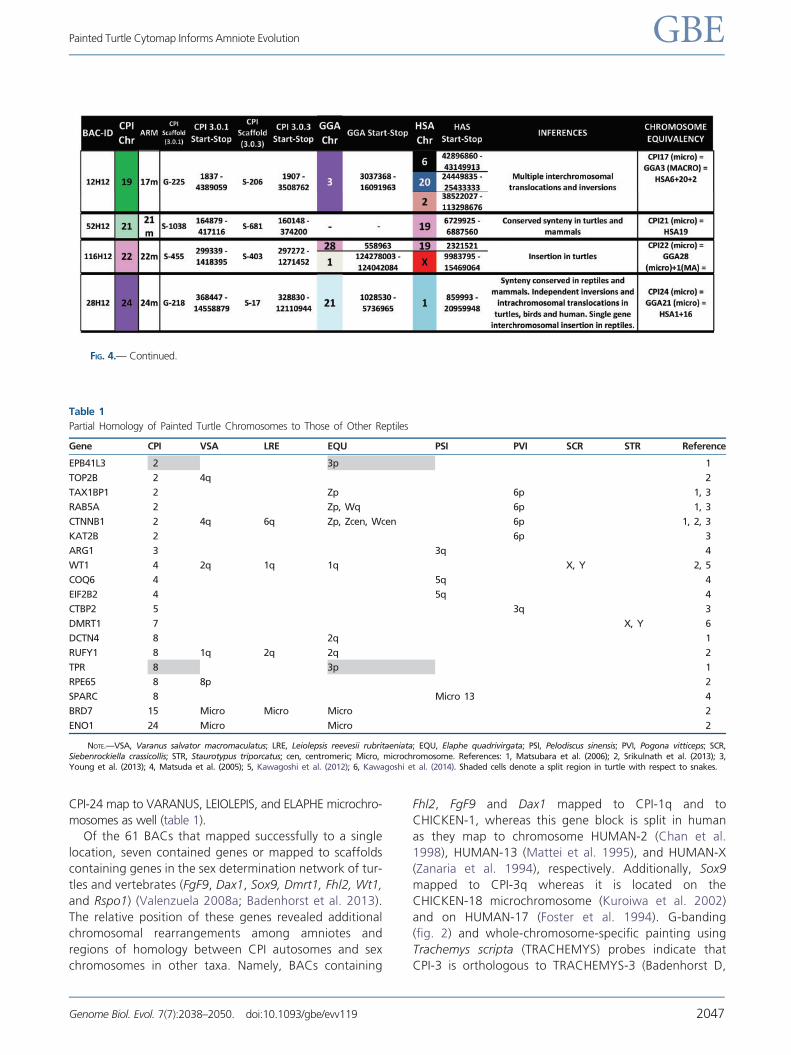
FIG. 4.— Chromosomal homology, synteny, and rearrangements identified between CPI turtles and the chicken and human genomes. Multiple gene
blocks may be encompassed by the start and stop positions listed within each chromosome and are detailed in the supplementary table S1, Supplementary
Material online, along with their gene content.
Painted Turtle Cytomap Informs Amniote Evolution GBE
Genome Biol. Evol. 7(7):2038–2050. doi:10.1093/gbe/evv119 2045

FIG. 4.— Continued.
Badenhorst et al. GBE
2046 Genome Biol. Evol. 7(7):2038–2050. doi:10.1093/gbe/evv119
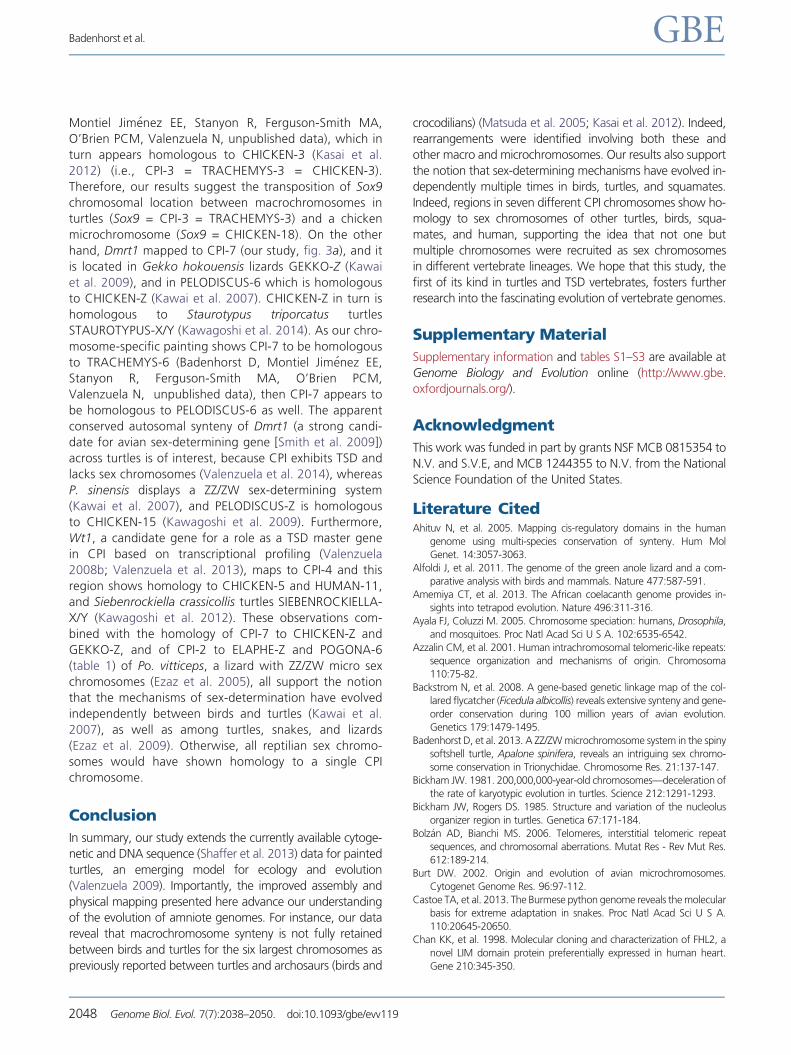
CPI-24 map to VARANUS, LEIOLEPIS, and ELAPHE microchro-
mosomes as well (table 1).
Of the 61 BACs that mapped successfully to a single
location, seven contained genes or mapped to scaffolds
containing genes in the sex determination network of tur-
tles and vertebrates (FgF9, Dax1, Sox9, Dmrt1, Fhl2, Wt1,
and Rspo1) (Valenzuela 2008a; Badenhorst et al. 2013).
The relative position of these genes revealed additional
chromosomal rearrangements among amniotes and
regions of homology between CPI autosomes and sex
chromosomes in other taxa. Namely, BACs containing
Fhl2, FgF9 and Dax1 mapped to CPI-1q and to
CHICKEN-1, whereas this gene block is split in human
as they map to chromosome HUMAN-2 (Chan et al.
1998), HUMAN-13 (Mattei et al. 1995), and HUMAN-X
(Zanaria et al. 1994), respectively. Additionally, Sox9
mapped to CPI-3q whereas it is located on the
CHICKEN-18 microchromosome (Kuroiwa et al. 2002)
and on HUMAN-17 (Foster et al. 1994). G-banding
(fig. 2) and whole-chromosome-specific painting using
Trachemys scripta (TRACHEMYS) probes indicate that
CPI-3 is orthologous to TRACHEMYS-3 (Badenhorst D,
FIG. 4.— Continued.
Table 1
Partial Homology of Painted Turtle Chromosomes to Those of Other Reptiles
Gene CPI VSA LRE EQU PSI PVI SCR STR Reference
EPB41L3 2 3p 1
TOP2B 2 4q 2
TAX1BP1 2 Zp 6p 1, 3
RAB5A 2 Zp, Wq 6p 1, 3
CTNNB1 2 4q 6q Zp, Zcen, Wcen 6p 1, 2, 3
KAT2B 2 6p 3
ARG1 3 3q 4
WT1 4 2q 1q 1q X, Y 2, 5
COQ6 4 5q 4
EIF2B2 4 5q 4
CTBP2 5 3q 3
DMRT1 7 X, Y 6
DCTN4 8 2q 1
RUFY1 8 1q 2q 2q 2
TPR 8 3p 1
RPE65 8 8p 2
SPARC 8 Micro 13 4
BRD7 15 Micro Micro Micro 2
ENO1 24 Micro Micro 2
NOTE.—VSA, Varanus salvator macromaculatus; LRE, Leiolepsis reevesii rubritaeniata; EQU, Elaphe quadrivirgata; PSI, Pelodiscus sinensis; PVI, Pogona vitticeps; SCR,Siebenrockiella crassicollis; STR, Staurotypus triporcatus; cen, centromeric; Micro, microchromosome. References: 1, Matsubara et al. (2006); 2, Srikulnath et al. (2013); 3,Young et al. (2013); 4, Matsuda et al. (2005); 5, Kawagoshi et al. (2012); 6, Kawagoshi et al. (2014). Shaded cells denote a split region in turtle with respect to snakes.
Painted Turtle Cytomap Informs Amniote Evolution GBE
Genome Biol. Evol. 7(7):2038–2050. doi:10.1093/gbe/evv119 2047
Montiel Jim �enez EE, Stanyon R, Ferguson-Smith MA,
O’Brien PCM, Valenzuela N, unpublished data), which in
turn appears homologous to CHICKEN-3 (Kasai et al.
2012) (i.e., CPI-3 = TRACHEMYS-3 = CHICKEN-3).
Therefore, our results suggest the transposition of Sox9
chromosomal location between macrochromosomes in
turtles (Sox9 = CPI-3 = TRACHEMYS-3) and a chicken
microchromosome (Sox9 = CHICKEN-18). On the other
hand, Dmrt1 mapped to CPI-7 (our study, fig. 3a), and it
is located in Gekko hokouensis lizards GEKKO-Z (Kawai
et al. 2009), and in PELODISCUS-6 which is homologous
to CHICKEN-Z (Kawai et al. 2007). CHICKEN-Z in turn is
homologous to Staurotypus triporcatus turtles
STAUROTYPUS-X/Y (Kawagoshi et al. 2014). As our chro-
mosome-specific painting shows CPI-7 to be homologous
to TRACHEMYS-6 (Badenhorst D, Montiel Jim �enez EE,
Stanyon R, Ferguson-Smith MA, O’Brien PCM,
Valenzuela N, unpublished data), then CPI-7 appears to
be homologous to PELODISCUS-6 as well. The apparent
conserved autosomal synteny of Dmrt1 (a strong candi-
date for avian sex-determining gene [Smith et al. 2009])
across turtles is of interest, because CPI exhibits TSD and
lacks sex chromosomes (Valenzuela et al. 2014), whereas
P. sinensis displays a ZZ/ZW sex-determining system
(Kawai et al. 2007), and PELODISCUS-Z is homologous
to CHICKEN-15 (Kawagoshi et al. 2009). Furthermore,
Wt1, a candidate gene for a role as a TSD master gene
in CPI based on transcriptional profiling (Valenzuela
2008b; Valenzuela et al. 2013), maps to CPI-4 and this
region shows homology to CHICKEN-5 and HUMAN-11,
and Siebenrockiella crassicollis turtles SIEBENROCKIELLA-
X/Y (Kawagoshi et al. 2012). These observations com-
bined with the homology of CPI-7 to CHICKEN-Z and
GEKKO-Z, and of CPI-2 to ELAPHE-Z and POGONA-6
(table 1) of Po. vitticeps, a lizard with ZZ/ZW micro sex
chromosomes (Ezaz et al. 2005), all support the notion
that the mechanisms of sex-determination have evolved
independently between birds and turtles (Kawai et al.
2007), as well as among turtles, snakes, and lizards
(Ezaz et al. 2009). Otherwise, all reptilian sex chromo-
somes would have shown homology to a single CPI
chromosome.
Conclusion
In summary, our study extends the currently available cytoge-
netic and DNA sequence (Shaffer et al. 2013) data for painted
turtles, an emerging model for ecology and evolution
(Valenzuela 2009). Importantly, the improved assembly and
physical mapping presented here advance our understanding
of the evolution of amniote genomes. For instance, our data
reveal that macrochromosome synteny is not fully retained
between birds and turtles for the six largest chromosomes as
previously reported between turtles and archosaurs (birds and
crocodilians) (Matsuda et al. 2005; Kasai et al. 2012). Indeed,
rearrangements were identified involving both these and
other macro and microchromosomes. Our results also support
the notion that sex-determining mechanisms have evolved in-
dependently multiple times in birds, turtles, and squamates.
Indeed, regions in seven different CPI chromosomes show ho-
mology to sex chromosomes of other turtles, birds, squa-
mates, and human, supporting the idea that not one but
multiple chromosomes were recruited as sex chromosomes
in different vertebrate lineages. We hope that this study, the
first of its kind in turtles and TSD vertebrates, fosters further
research into the fascinating evolution of vertebrate genomes.
Supplementary Material
Supplementary information and tables S1–S3 are available at
Genome Biology and Evolution online (http://www.gbe.
oxfordjournals.org/).
Acknowledgment
This work was funded in part by grants NSF MCB 0815354 to
N.V. and S.V.E, and MCB 1244355 to N.V. from the National
Science Foundation of the United States.
Literature CitedAhituv N, et al. 2005. Mapping cis-regulatory domains in the human
genome using multi-species conservation of synteny. Hum Mol
Genet. 14:3057-3063.
Alfoldi J, et al. 2011. The genome of the green anole lizard and a com-
parative analysis with birds and mammals. Nature 477:587-591.
Amemiya CT, et al. 2013. The African coelacanth genome provides in-
sights into tetrapod evolution. Nature 496:311-316.
Ayala FJ, Coluzzi M. 2005. Chromosome speciation: humans, Drosophila,
and mosquitoes. Proc Natl Acad Sci U S A. 102:6535-6542.
Azzalin CM, et al. 2001. Human intrachromosomal telomeric-like repeats:
sequence organization and mechanisms of origin. Chromosoma
110:75-82.
Backstrom N, et al. 2008. A gene-based genetic linkage map of the col-
lared flycatcher (Ficedula albicollis) reveals extensive synteny and gene-
order conservation during 100 million years of avian evolution.
Genetics 179:1479-1495.
Badenhorst D, et al. 2013. A ZZ/ZW microchromosome system in the spiny
softshell turtle, Apalone spinifera, reveals an intriguing sex chromo-
some conservation in Trionychidae. Chromosome Res. 21:137-147.
Bickham JW. 1981. 200,000,000-year-old chromosomes—deceleration of
the rate of karyotypic evolution in turtles. Science 212:1291-1293.
Bickham JW, Rogers DS. 1985. Structure and variation of the nucleolus
organizer region in turtles. Genetica 67:171-184.
Bolzan AD, Bianchi MS. 2006. Telomeres, interstitial telomeric repeat
sequences, and chromosomal aberrations. Mutat Res - Rev Mut Res.
612:189-214.
Burt DW. 2002. Origin and evolution of avian microchromosomes.
Cytogenet Genome Res. 96:97-112.
Castoe TA, et al. 2013. The Burmese python genome reveals the molecular
basis for extreme adaptation in snakes. Proc Natl Acad Sci U S A.
110:20645-20650.
Chan KK, et al. 1998. Molecular cloning and characterization of FHL2, a
novel LIM domain protein preferentially expressed in human heart.
Gene 210:345-350.
Badenhorst et al. GBE
2048 Genome Biol. Evol. 7(7):2038–2050. doi:10.1093/gbe/evv119

Chiari Y, et al. 2012. Phylogenomic analyses support the position of turtles
as the sister group of birds and crocodiles (Archosauria). BMC Biol.
10:1-14.
Crawford NG, et al. 2012. More than 1000 ultraconserved elements pro-
vide evidence that turtles are the sister group of archosaurs. Biol Lett.
8:783-786.
Dalloul RA, et al. 2010. Multi-platform next-generation sequencing of the
domestic turkey (Meleagris gallopavo): genome assembly and analysis.
PLoS Biol. 8:e1000475.
De Leo AA, et al. 1999. Comparative chromosome painting between
marsupial orders: relationships with a 2n=14 ancestral marsupial kar-
yotype. Chromosome Res. 7:509-517.
De S, et al. 2009. The impact of genomic neighborhood on the evolu-
tion of human and chimpanzee transcriptome. Genome Res.
19:785-794.
De Smet WHO. 1978. Chromosomes of 22 species of Chelonia (Reptilia).
Acta Zool Pathol Antverp. 70:15-34.
Deakin JE, et al. 2013. Reconstruction of the ancestral marsupial karyotype
from comparative gene maps. BMC Evol Biol. 13:1-15.
Deakin JE, Ezaz T. 2014. Tracing the evolution of amniote chromosomes.
Chromosoma 123:201-216.
Ezaz T, et al. 2005. The dragon lizard Pogona vitticeps has ZZ/ZW micro-sex
chromosomes. Chromosome Res. 13:763-776.
Ezaz T, et al. 2006. An XX/XY sex microchromosome system in a fresh-
water turtle, Chelodina longicollis (Testudines : Chelidae) with genetic
sex determination. Chromosome Res. 14:139-150.
Ezaz T, et al. 2009. The ZW sex microchromosomes of an Australian
dragon lizard share no homology with those of other reptiles or
birds. Chromosome Res. 17:965-973.
Flint J, et al. 1994. Healing of broken human chromosomes by the addition
of telomeric repeats. Am J Hum Genet. 55:505-512.
Foster JW, et al. 1994. Campomelic dysplasia and autosomal sex reversal
caused by mutations in an Sry-related gene. Nature 372:525-530.
Fukagawa T, Earnshaw WC. 2014. The centromere: chromatin foundation
for the kinetochore machinery. Dev Cell. 30:497-509.
Goodpasture C, Bloom SE. 1975. Visualization of nucleolar organizer re-
gions im mammalian chromosomes using silver staining.
Chromosoma 53:37-50.
Green RE, et al. 2014. Three crocodilian genomes reveal ancestral patterns
of evolution among archosaurs. Science 346 :1254449-1–1254449-9.
Griffin DK, et al. 2007. The evolution of the avian genome as revealed by
comparative molecular cytogenetics. Cytogenet Genome Res. 117:64-
77.
Hoffmann AA, Rieseberg LH. 2008. Revisiting the impact of inversions in
evolution: from population genetic markers to drivers of adaptive
shifts and speciation? Annu Rev Ecol Evol Syst. 39:21-42.
Ijdo JW, et al. 1991. Improved telomere detection using a telomere repeat
probe (TTAGGG)n generated by PCR. Nucleic Acids Res. 19:4780-
4780.
Janes DE, et al. 2008. New resources inform study of genome size, content
and organization in non-avian reptiles. Integr Comp Biol. 48:447-453.
Kasahara M, et al. 2007. The medaka draft genome and insights into
vertebrate genome evolution. Nature 447:714-719.
Kasai F, et al. 2012. Extensive homology of chicken macrochromosomes in
the karyotypes of Trachemys scripta elegans and Crocodylus niloticus
revealed by chromosome painting despite long divergence times.
Cytogenet Genome Res. 136:303-307.
Kawagoshi T, et al. 2009. The ZW micro-sex chromosomes of the Chinese
soft-shelled turtle (Pelodiscus sinensis, Trionychidae, Testudines) have
the same origin as chicken chromosome 15. Cytogenet Genome Res.
125:125-131.
Kawagoshi T, et al. 2012. The origin and differentiation process of X and Y
chromosomes of the black marsh turtle (Siebenrockiella crassicollis,
Geoemydidae, Testudines). Chromosome Res. 20:95-110.
Kawagoshi T, et al. 2014. The Staurotypus turtles and Aves share the same
origin of sex chromosomes but evolved different types of heteroga-
metic sex determination. PLoS One 9:e105315.
Kawai A, et al. 2007. Different origins of bird and reptile sex chromosomes
inferred from comparative mapping of chicken Z-linked genes.
Cytogenet Genome Res. 117:92-102.
Kawai A, et al. 2009. The ZW sex chromosomes of Gekko hokouensis
(Gekkonidae, Squamata) represent highly conserved homology with
those of avian species. Chromosoma 118:43-51.
Kearse M, et al. 2012. Geneious basic: an integrated and extendable
desktop software platform for the organization and analysis of
sequence data. Bioinformatics 28:1647-1649.
Kemkemer C, et al. 2006. Reconstruction of the ancestral ferungulate
karyotype by electronic chromosome painting (E-painting).
Chromosome Res. 14:899-907.
Kemkemer C, et al. 2009. Gene synteny comparisons between different
vertebrates provide new insights into breakage and fusion events
during mammalian karyotype evolution. BMC Evol Biol. 9:84.
Killebrew FC. 1977. Mitotic chromosomes of turtles. IV. Emydidae. Texas J
Sci. 29:245-253.
Kirkpatrick M, Barton N. 2006. Chromosome inversions, local adaptation
and speciation. Genetics 173:419-434.
Kohn M, et al. 2006. Reconstruction of a 450-My-old ancestral vertebrate
protokaryotype. Trends Genet. 22:203-210.
Kudla G, et al. 2006. High guanine and cytosine content increases mRNA
levels in mammalian cells. PLoS Biol. 4:933-942.
Kuroiwa A, et al. 2002. Chromosome assignment of eight SOX family
genes in chicken. Cytogenet Genome Res. 98:189-193.
Loxdale HD. 2010. Rapid genetic changes in natural insect populations.
Ecol Entomol. 35:155-164.
Maddox PS, et al. 2012. Structure, assembly and reading of centromeric
chromatin. Curr Opin Genet Dev. 22:139-147.
Martinez P, et al. 2008. An XX/XY heteromorphic sex chromosome system
in the Australian chelid turtle Emydura macquarii, a new piece in the
puzzle of sex chromosome evolution in turtles. Chromosome Res.
16:815-825.
Martinez PA, et al. 2009. Karyotypic characterization of Trachemys dor-
bigni (Testudines: Emydidae) and Chelonoidis (Geochelone) donoso-
barrosi (Testudines: Testudinidae), two species of Cryptodiran turtles
from Argentina. Genetica 137:277-283.
Matsubara K, et al. 2006. Evidence for different origin of sex chromosomes
in snakes, birds, and mammals and step-wise differentiation of snake
sex chromosomes. Proc Natl Acad Sci U S A. 103:18190-18195.
Matsubara K, et al. 2014. Highly differentiated ZW sex microchromosomes
in the Australian Varanus species evolved through rapid amplification
of repetitive sequences. PLoS One. 9:e95226.
Matsuda Y, et al. 2005. Highly conserved linkage homology between birds
and turtles: bird and turtle chromosomes are precise counterparts of
each other. Chromosome Res. 13:601-615.
Mattei MG, et al. 1995. The human fgf9 gene maps to chromosomal
region 13q11-q12. Genomics 29:811-812.
Mikkelsen TS, et al. 2007. Genome of the marsupial Monodelphis domes-
tica reveals innovation in non-coding sequences. Nature 447:167-177.
Nakatani Y, et al. 2007. Reconstruction of the vertebrate ancestral
genome reveals dynamic genome reorganization in early vertebrates.
Genome Res. 17:1254-1265.
Nanda I, et al. 2000. Conserved synteny between the chicken Z sex chro-
mosome and human chromosome 9 includes the male regulatory
gene DMRT1: a comparative (re)view on avian sex determination.
Cytogenet Cell Genet. 89:67-78.
Olmo E. 2005. Rate of chromosome changes and speciation in reptiles.
Genetica 125:185-203.
Olmo E. 2008. Trends in the evolution of reptilian chromosomes. Integr
Comp Biol. 48:486-493.
Painted Turtle Cytomap Informs Amniote Evolution GBE
Genome Biol. Evol. 7(7):2038–2050. doi:10.1093/gbe/evv119 2049
Olmo E, et al. 2002. Different genomic evolutionary rates in the various
reptile lineages. Gene 295:317-321.
O’Meally D, et al. 2009. The first cytogenetic map of the tuatara,
Sphenodon punctatus. Cytogenet Genome Res. 127:213-223.
Richard F, et al. 2003. Reconstruction of the ancestral karyotype of euthe-
rian mammals. Chromosome Res. 11:605-618.
Rojo V, et al. 2014. Karyological characterization of the endemic Iberian
rock lizard, Iberolacerta monticola (Squamata, Lacertidae): insights into
sex chromosome evolution. Cytogenet Genome Res. 142:28-39.
Romanov MN, et al. 2014. Reconstruction of gross avian genome
structure, organization and evolution suggests that the chicken line-
age most closely resembles the dinosaur avian ancestor. BMC
Genomics 15. 1060:1-17.
Ruiz-Herrera A, et al. 2005. Evolutionary breakpoints are co-localized with
fragile sites and intrachromosomal telomeric sequences in primates.
Cytogenet Genome Res. 108:234-247.
Ruiz-Herrera A, et al. 2008. Telomeric repeats far from the ends: mecha-
nisms of origin and role in evolution. Cytogenet Genome Res.
122:219-228.
Schmid M, et al. 2000. First report on chicken genes and chromosomes.
Cytogenet Cell Genet. 90:171-218.
Seabright M. 1971. A rapid banding technique for human chromosomes.
Lancet 2:971-972.
Shaffer HB, et al. 2013. The western painted turtle genome, a model for
the evolution of extreme physiological adaptations in a slowly evolving
lineage. Genom Biol. 14:R28.
Shang WH, et al. 2010. Chickens possess centromeres with both extended
tandem repeats and short non-tandem-repetitive sequences. Genome
Res. 20:1219-1228.
Shaw PJ, McKeown PC. 2011. The structure of rDNA chromatin. In: Olson
MOJ, editor. The nucleolus. New York: Springer. p. 43-55.
Singh L. 2011. The charms of sex chromosomes in snakes. J Biosci
(Bangalore). 36:17-21.
Smith CA, et al. 2009. The avian Z-linked gene DMRT1 is required for
male sex determination in the chicken. Nature (London) 461:267-
271.
Smith JJ, et al. 2013. Sequencing of the sea lamprey (Petromyzon marinus)
genome provides insights into vertebrate evolution. Nat Genet.
45:415-421.
Srikulnath K, et al. 2011. Chromosomal localization of the 18S-28S and 5S
rRNA genes and (TTAGGG)n sequences of butterfly lizards (Leiolepis
belliana belliana and Leiolepis boehmei, Agamidae, Squamata). Genet
Mol Biol. 34:583-586.
Srikulnath K, et al. 2013. Karyotype evolution in monitor lizards: cross-
species chromosome mapping of cDNA reveals highly conserved syn-
teny and gene order in the Toxicofera clade. Chromosome Res.
21:805-819.
St John JA, et al. 2012. Sequencing three crocodilian genomes to
illuminate the evolution of archosaurs and amniotes. Genom Biol.
13:1-12.
Stanyon R, et al. 2008. Primate chromosome evolution: ancestral
karyotypes, marker order and neocentromeres. Chromosome Res.
16:17-39.
Sumner AT. 1972. Simple technique for demonstrating centromeric het-
erochromatin. Exp Cell Res. 75:304.
Sumner AT. 2003. Chromosomes: organization and function. Oxford
(United Kingdom): Blackwell Publishing. p. 287.
Uno Y, et al. 2012. Inference of the protokaryotypes of amniotes and
tetrapods and the evolutionary processes of microchromosomes
from comparative gene mapping. PLoS One 7:e53027.
Valenzuela N. 2008a. Evolution of the gene network underlying gonado-
genesis in turtles with temperature-dependent and genotypic sex de-
termination. Integr Comp Biol. 48:476-485.
Valenzuela N. 2008b. Relic thermosensitive gene expression in genotypi-
cally-sex-determined turtles. Evolution 62:234-240.
Valenzuela N. 2009. The painted turtle, Chrysemys picta: a model system
for vertebrate evolution, ecology, and human health. Cold Spring Harb
Protoc. 4. 10.1101/pdb.emo124: 1-9.
Valenzuela N. 2010. Multivariate expression analysis of the gene network
underlying sexual development in turtle embryos with temperature-
dependent and genotypic sex determination. Sex Dev. 4:39-49.
Valenzuela N, Adams DC. 2011. Chromosome number and sex determi-
nation co-evolve in turtles. Evolution 65:1808-1813.
Valenzuela N, et al. 2013. Transcriptional evolution underlying vertebrate
sexual development. Dev Dyn. 242:307-319.
Valenzuela N, et al. 2014. Molecular cytogenetic search for cryptic sex chro-
mosomes in painted turtles Chrysemys picta. Cytogenet Genome Res.
144:39-46
Vonk FJ, et al. 2013. The king cobra genome reveals dynamic gene evo-
lution and adaptation in the snake venom system. Proc Natl Acad Sci U
S A. 110:20651-20656.
Wang Z, et al. 2013. The draft genomes of soft-shell turtle and green sea
turtle yield insights into the development and evolution of the turtle-
specific body plan. Nat Genet. 45:701-706.
Warren WC, et al. 2008. Genome analysis of the platypus reveals unique
signatures of evolution. Nature 453:175-183.
Young MJ, et al. 2013. Molecular cytogenetic map of the central bearded
dragon, Pogona vitticeps (Squamata: Agamidae). Chromosome Res.
21:361-374.
Zanaria E, et al. 1994. An unusual member of the nuclear hormone-
receptor superfamily responsible for X-linked adrenal hypoplasia
congenita. Nature 372:635-641.
Associate editor: Esther Betran
Badenhorst et al. GBE
2050 Genome Biol. Evol. 7(7):2038–2050. doi:10.1093/gbe/evv119