Embed Size (px)
Citation preview
81
Name______________________
Physical Geography Lab Activity #11 Due date___________
Topographic Maps COR Objective 3, SLO 3
11.1. Introduction Not all maps are created equally. As we’ve seen with scale, having the wrong map can make your job a lot more difficult. If you need to do something in the wilderness or rural parts of the country, be it hiking, hunting, fighting wildfires, or looking for a rare animal species, a simple road map won’t do you much good. You would want a topographic map. Topographic maps are those that show elevation (relief) of the Earth’s surface along with natural and cultural features. We will specifically be using maps from the United States Geological Survey (USGS). The USGS was created by an act of Congress in 1879 which made the agency responsible for “classification of the public lands, and examination of the geological structure, mineral resources, and products of the natural domain.” Part of their mission involved mapping the relief features of the country and creating the predecessors of the maps we’ll use today. The topographic maps have several other names: topo maps, quad maps, and quadrangles. They all refer to the same thing. 11.2. Accuracy The maps have evolved over the years. Standards have been maintained, especially when it comes to accuracy. For the 7 ½ Minute Quadrangles:
Horizontal: No more than 10% of the well defined map points may be more than 40 feet from their true position.
Vertical: No more than 10% of the elevations derived from contour lines may be more than ½ contour interval off. That means that 90% of elevations in the mountains must be with 20 feet of their actual height, and 90% within flatter regions must be within 5 feet.
Now these standards are great for elevation, but keep in mind that cultural features on the map may be horribly inaccurate, or at least out of date. For example, the Lancaster West quadrangle that we will use quite a bit was last updated in 1974. Topography hasn’t
82
changed much over the last few decades, but the housing developments, roads, and buildings certainly have. 11.3. Symbology All modern USGS topographic maps are drawn using a standardized symbology, i.e. the same pictures and colors mean the same things on every topographic map. Roads, buildings, rivers, etc. are always drawn the same way. Look at one or more of the quadrangles in the lab to answer the following questions. You can also visit http://pubs.usgs.gov/gip/TopographicMapSymbols/topomapsymbols.pdf for more help.
1. What is shown in black ink? 2. What is shown in blue ink? 3. What is shown in brown ink? 4. What is shown in green ink? 5. What is shown in red/pink ink? 6. What is shown in purple ink?
83
11.4. The Map Collar Some of the most important information on a topographic map isn’t on the map itself, but on the Map Collar the area between the neatline and edge of the paper. Select a topographic map to answer the following questions.
7. The map title is located in the upper right of the map. USGS maps are typically named for the largest town or city shown on the map itself. What is the title of the map you are using?
8. The minute series refers to how much longitude and latitude is covered on the map.
a. What is the latitude (to the minute and second) at the bottom of the map?
b. What is the latitude at the top of the map? c. What is the difference between the two?
9. Now do the same with the longitude a. What is the longitude on the west side of the map? b. What is the longitude on the east side of the map? c. What is the difference between the two?
10. The map you are using covers _______ minutes of latitude and longitude. a. This would make it a ________ minute series map.
11. The topographic maps we are using are either 7.5 minute or 15 minute series. How many 7.5 minutes does it take to cover the area shown on a 15 minute series map? And no, it’s not two…
The bottom left corner of the map collar has specific details about how the map was made and the information was collected. This information is crucial if you are using multiple maps from different sources. You’ll learn more about this data when you sign up for Geography 205 (you know you want to).
12. Who published this map? 13. Who provided the controls? 14. What projection was used to make this map? 15. What datum was used to make this map? 16. What years were the aerial photos taken? 17. Was data field checked? If so, when?
Another useful piece of information in the map collar is the north arrow, which displays three separate north values. The line with the star represents geographic, or true, north. GN stands for grid north which follows the UTM coordinate system, and MN stands for magnetic north which points toward the north pole of Earth’s magnetic field. The
84
magnetic declination for the area depicted in the map is labeled in degrees. The “mils” number refers to a military system of navigation.
18. What is the declination of the map you are currently using? Be sure to include direction (east or west of true north).
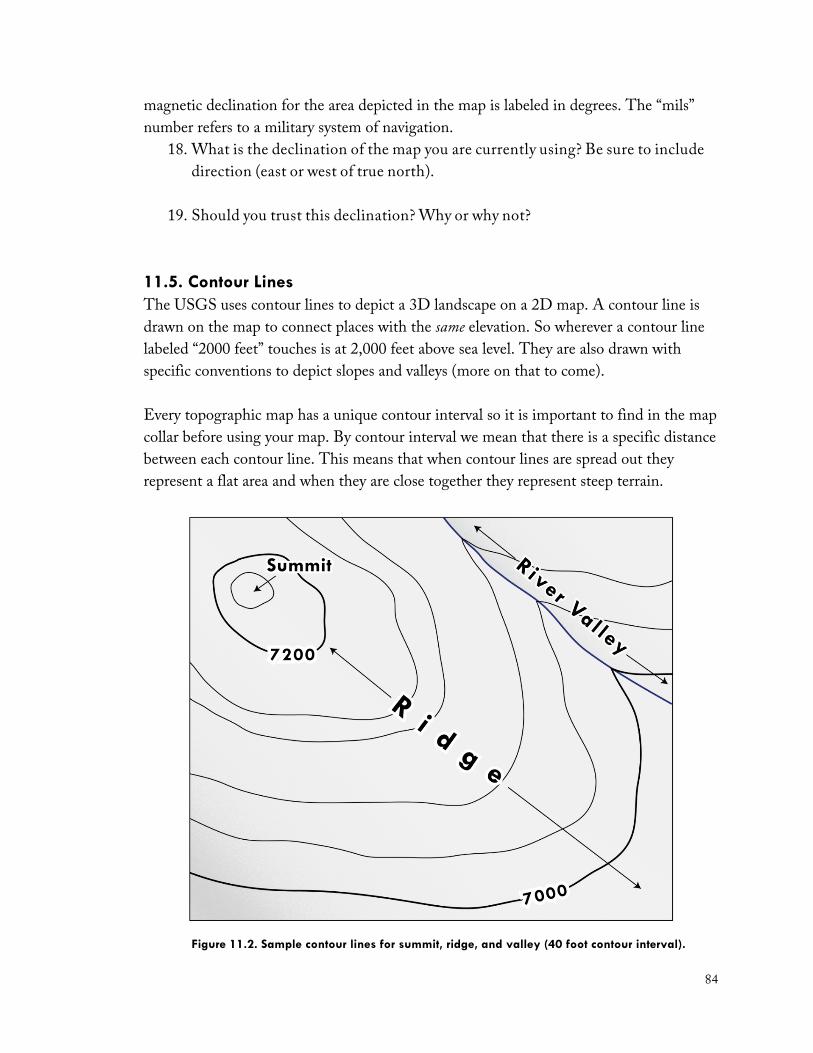
19. Should you trust this declination? Why or why not? 11.5. Contour Lines The USGS uses contour lines to depict a 3D landscape on a 2D map. A contour line is drawn on the map to connect places with the same elevation. So wherever a contour line labeled “2000 feet” touches is at 2,000 feet above sea level. They are also drawn with specific conventions to depict slopes and valleys (more on that to come). Every topographic map has a unique contour interval so it is important to find in the map collar before using your map. By contour interval we mean that there is a specific distance between each contour line. This means that when contour lines are spread out they represent a flat area and when they are close together they represent steep terrain.
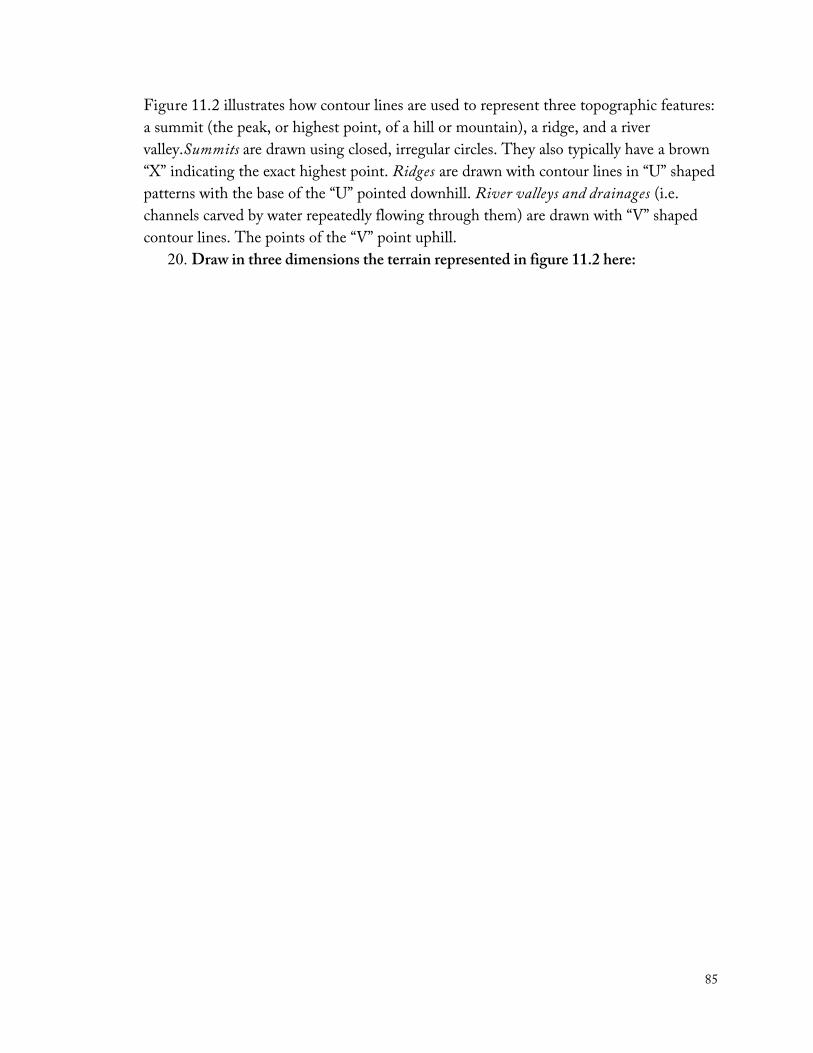
Figure 11.2. Sample contour lines for summit, ridge, and valley (40 foot contour interval).
85
Figure 11.2 illustrates how contour lines are used to represent three topographic features: a summit (the peak, or highest point, of a hill or mountain), a ridge, and a river valley.Summits are drawn using closed, irregular circles. They also typically have a brown “X” indicating the exact highest point. Ridges are drawn with contour lines in “U” shaped patterns with the base of the “U” pointed downhill. River valleys and drainages (i.e. channels carved by water repeatedly flowing through them) are drawn with “V” shaped contour lines. The points of the “V” point uphill.
20. Draw in three dimensions the terrain represented in figure 11.2 here:
86
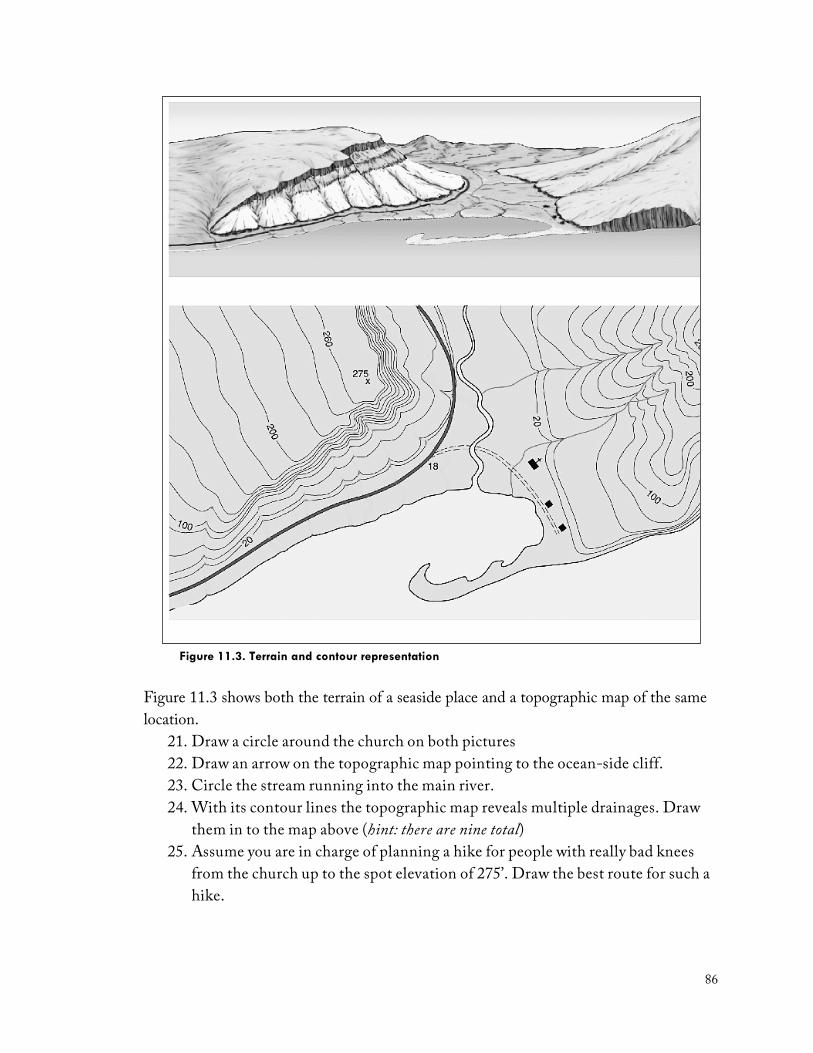
Figure 11.3. Terrain and contour representation
Figure 11.3 shows both the terrain of a seaside place and a topographic map of the same location.
21. Draw a circle around the church on both pictures 22. Draw an arrow on the topographic map pointing to the ocean-side cliff. 23. Circle the stream running into the main river. 24. With its contour lines the topographic map reveals multiple drainages. Draw
them in to the map above (hint: there are nine total) 25. Assume you are in charge of planning a hike for people with really bad knees
from the church up to the spot elevation of 275’. Draw the best route for such a hike.
87
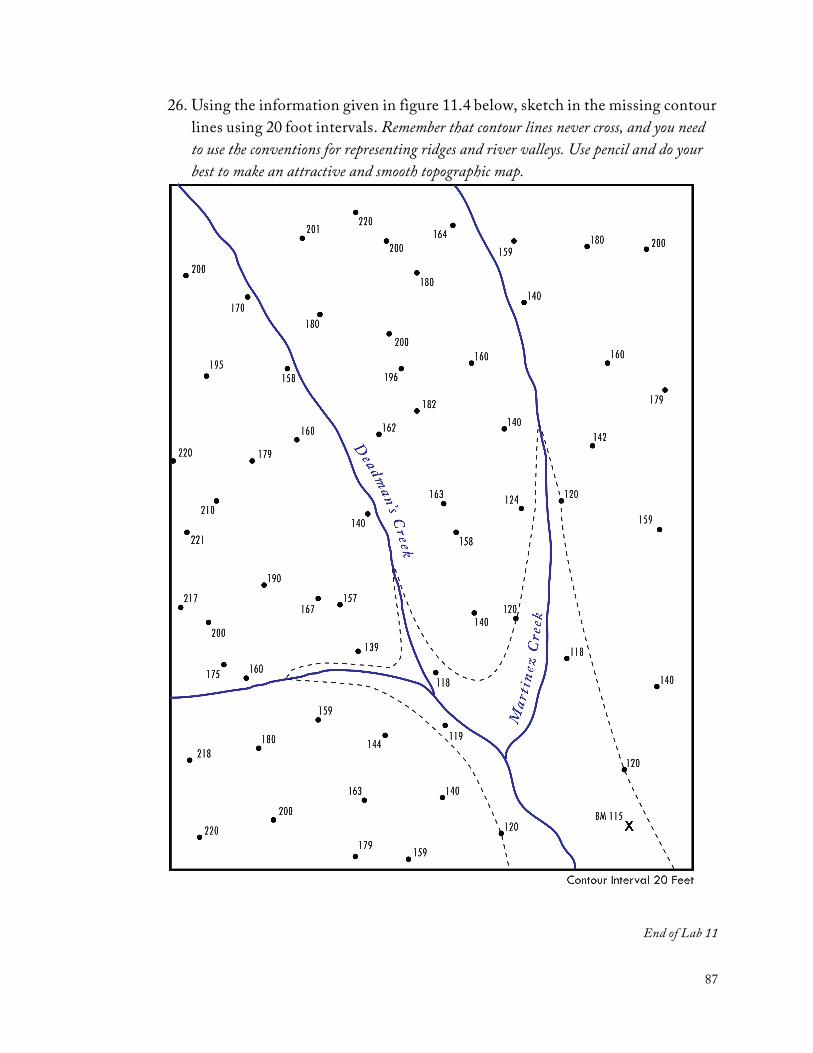
26. Using the information given in figure 11.4 below, sketch in the missing contour lines using 20 foot intervals. Remember that contour lines never cross, and you need to use the conventions for representing ridges and river valleys. Use pencil and do your best to make an attractive and smooth topographic map.
End of Lab 11