Embed Size (px)
Citation preview
Properties of Umass Boston
Analytical Chemistry Lab(CHEM313)
Drs. Robert Carter and Deyang QuChemistry Department
Properties of Umass Boston
Objectives: Bridging the basic the analytical chemistry concepts with hand-on experimental work
• Review the basic analytical chemistry theories.
• Introduce analytical methods and statistical means
• Develop the skill of design, carrying out analytical experiments, most importantly the ability to extract information
Properties of Umass Boston
Course Materials
• http://alpha.chem.umb.edu/chemistry/ch313/– Syllabus– Lab Schedule– Lab Manual
• Grading– Lab reports (due in two weeks)– Notebooks, bound– Final Exam

Properties of Umass Boston
Before the laboratory
• Review the analytical chemical concepts involved in the experiment
• Be familiar with the experimental procedures.
• Bring your lab book
Properties of Umass Boston
While in the lab
• Safety! Safety! Safety!• On time.• Work with your partner.• Record the experimental procedures and
obtained data in detail.• Keep the working bench clean.• Clean the glassware.
Properties of Umass Boston
After Laboratory
• Analysis YOUR data carefully with proper tools (e.g. software).
• Finish and hand in your report on time by email ([email protected]).
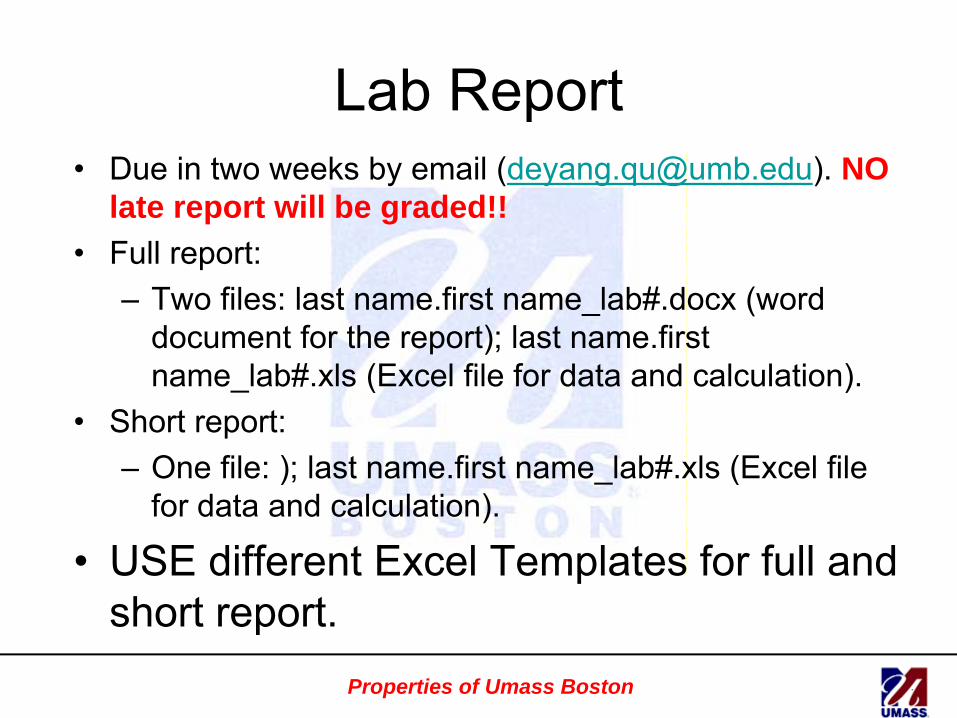
Lab Report• Due in two weeks by email ([email protected]). NO
late report will be graded!!• Full report:
– Two files: last name.first name_lab#.docx (word document for the report); last name.first name_lab#.xls (Excel file for data and calculation).
• Short report:– One file: ); last name.first name_lab#.xls (Excel file
for data and calculation).
• USE different Excel Templates for full and short report.
Properties of Umass Boston
Properties of Umass Boston
Introduction of the Evaluation of Experimental Error and Statistics
(1)
Properties of Umass Boston
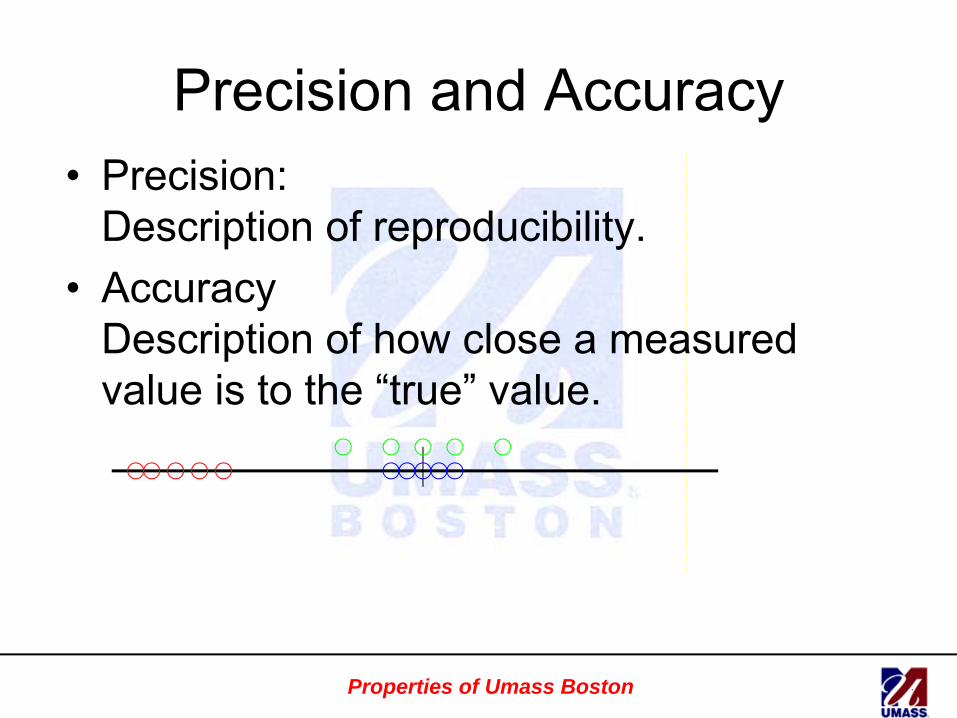
Precision and Accuracy• Precision:
Description of reproducibility.• Accuracy
Description of how close a measured value is to the “true” value.

Properties of Umass Boston
Types of Error• Random or indeterminate error:
– Resulting from the impact of the environment e.g. operator, fluctuation of air flow, temperature etc.
– The value can not be predict at any given time, random and non-reproducible.
– Treated with statistical methods.• Systematic or determinate error:
– Sources• Instrument Error.• Method Error.• Personal Error.
– Predicable and reproducible.– Can not be treated with statistical method

Properties of Umass Boston
Mean and Standard Deviation
1)()(tan
)()(tan
)(
))((
2
2
−−
=
−=
=
=
∑
∑
∑
∑
nmxsorssampleofdeviationdards
Nxsorpopulationofdeviationdards
n
xmorxmeansample
N
xmeantrueormeanpopulation
ie
i
ii
ii
ησ
ημ
•Population: a very large of N observations from which the sample can be imagined to com
•Sample: a small group of observation actually available
Population mean can well represent true value. Does the Population Mean=True Value? Depends on the accuracy

Properties of Umass Boston
Estimating μ and σ
• But I do not usually know μ or σ. • Instead I measure a small sample of an
infinite distribution and calculate m and se (sample mean and SD).
• m ≈ μ; se ≈ σ• se is a reasonable estimate of σ.
Properties of Umass Boston
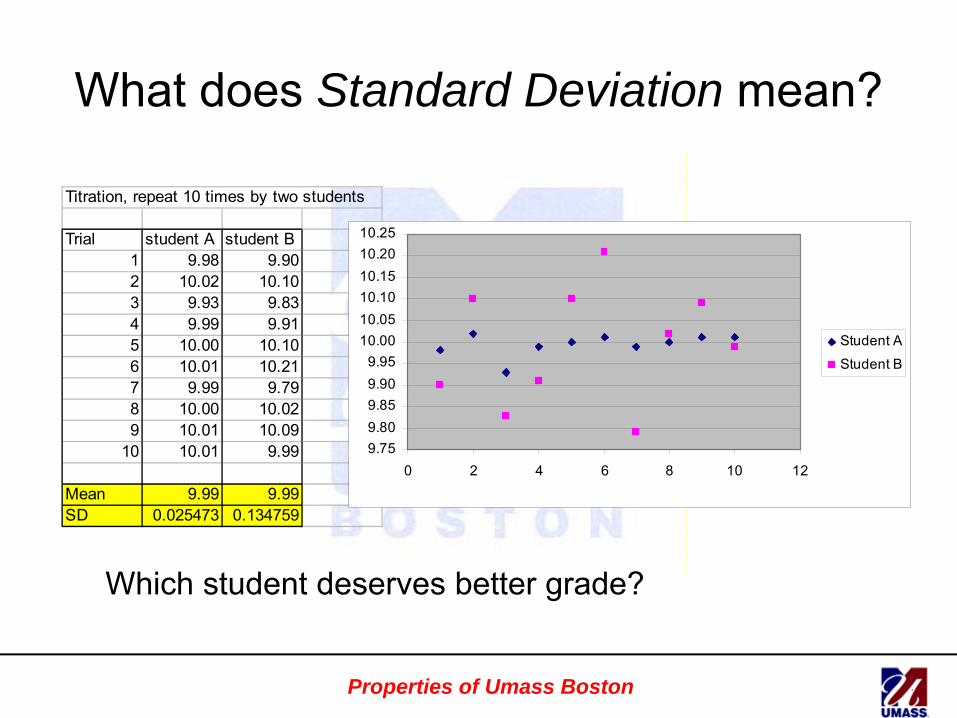
What does Standard Deviation mean?
Titration, repeat 10 times by two students
Trial student A student B1 9.98 9.902 10.02 10.103 9.93 9.834 9.99 9.915 10.00 10.106 10.01 10.217 9.99 9.798 10.00 10.029 10.01 10.09
10 10.01 9.99
Mean 9.99 9.99SD 0.025473 0.134759
9.759.809.859.909.95
10.0010.0510.1010.1510.2010.25
0 2 4 6 8 10 12
Student A
Student B
Which student deserves better grade?
Properties of Umass Boston
Gaussian DistributionFr
eque
ncy
10.0
410
.02
10.0
09.
989.96
9.94
3.0
2.5
2.0
1.5
1.0
0.5
0.0
10.3
10.2
10.1
10.0
9.9
9.8
9.7
3.0
2.5
2.0
1.5
1.0
0.5
0.0
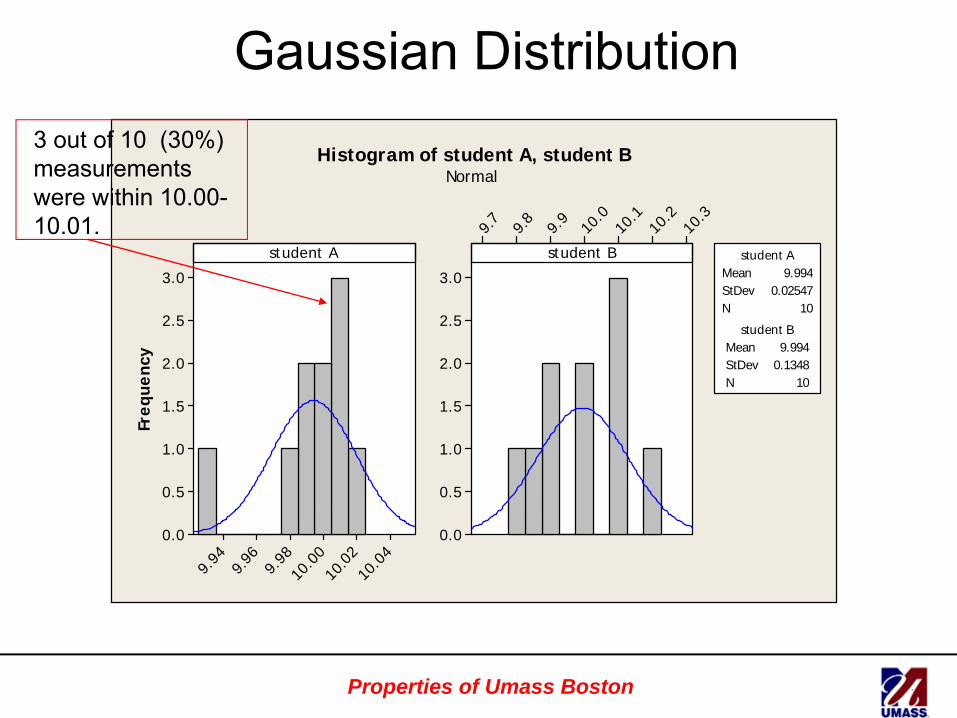
student A student BMean 9.994StDev 0.02547N 10
student A
Mean 9.994StDev 0.1348N 10
student B
Histogram of student A, student BNormal
3 out of 10 (30%) measurements were within 10.00-10.01.

Properties of Umass Boston
After a lot of measurements
Data
Freq
uenc
y
10.310.210.110.09.99.89.7
8
7
6
5
4
3
2
1
0
9.994 0.02547 109.994 0.1348 10
Mean StDev N
student Astudent B
Variable
Histogram of student A, student BNormal
μ
The area represents the fraction of measurements expected between 9.80-9.90
Properties of Umass Boston
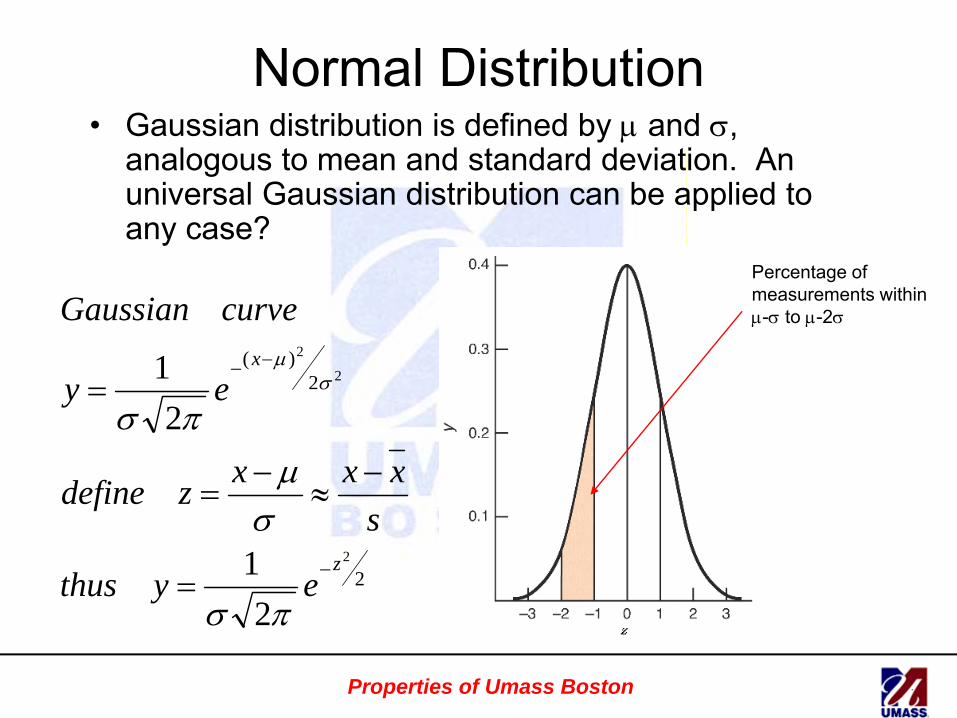
Normal Distribution• Gaussian distribution is defined by μ and σ,
analogous to mean and standard deviation. An universal Gaussian distribution can be applied to any case?
2
2)(
2
2
2
21
21
z
x
eythus
sxxxzdefine
ey
curveGaussian
−
−−
=
−≈
−=
=
πσ
σμ
πσσ
μ
Percentage of measurements within μ-σ to μ-2σ
Properties of Umass Boston
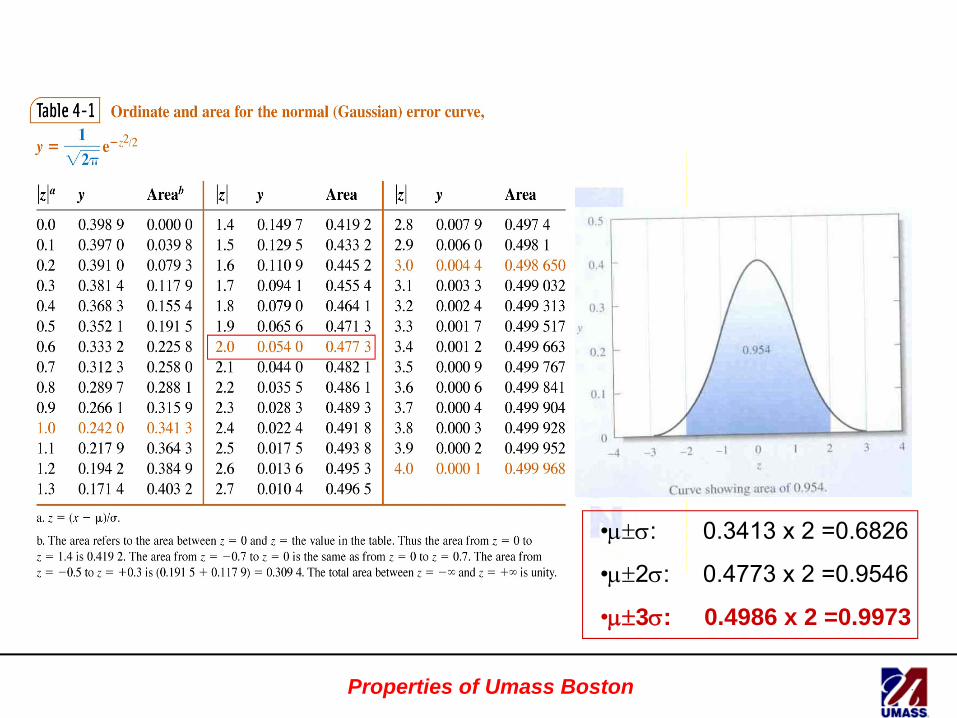
•μ±σ: 0.3413 x 2 =0.6826
•μ±2σ: 0.4773 x 2 =0.9546
•μ±3σ: 0.4986 x 2 =0.9973

Properties of Umass Boston
Confidence Intervals• Most often we want to report the mean and the
statistical error in the mean to a certain level of confidence
tsx
meantheoferrordardsn
ss
tablefromtsstudenttnobservatioofnumbern
deviationdardssamplesn
tsx
ernalconfidence
m
m
±=
=
±=
μ
μ
tan
'::
tan:
int

Properties of Umass Boston
Student’s t table
Degrees of Freedom: n-1

Properties of Umass Boston
What level of confidence I have for students A and B?
Bstudent
Astudent
ntsx
−±=×
±=
−±=×
±=
±=
096.099.910
134759.0262.299.9
018.099.910
025472.0262.299.9
μ
• 10 observations: n=10• Degrees of freedom: n-1=9• For 95% CL, check t table
t=2.262•
• Student A: 10.01 – 9.97Student B: 10.09 – 9.89
Titration, repeat 10 times by two students
Trial student A student B1 9.98 9.902 10.02 10.103 9.93 9.834 9.99 9.915 10.00 10.106 10.01 10.217 9.99 9.798 10.00 10.029 10.01 10.09
10 10.01 9.99
Mean 9.99 9.99SD 0.025473 0.134759