Embed Size (px)
Citation preview

PHYSICAL, CHEMICAL AND BIOLOGICAL TREATMENT OF
RICE HUSK TO IMPROVE ITS NUTRITIVE VALUE
RAHAT NASEER
2003-VA-196
A THESIS SUBMITTED IN PARTIAL FULFILMENT OFTHE
REQUIREMENT FOR THE DEGREE
OF
DOCTOR OF PHILOSOPHY
IN
BIOCHEMISTRY
FACULTY OF BIO-SCIENCES
UNIVERSITY OF VETERINARY AND ANIMAL SCIENCES,
LAHORE
2015

To
The Controller of Examinations
University of Veterinary and Animal Sciences
Lahore
We, the Supervisory Committee, certify that the contents and form of the thesis,
submitted by Mr. Rahat Naseer, have been found satisfactory and recommend it to be processed
for evaluation by the External Examiners for the award of degree.
SUPERVISOR DR. ABU SAEED HASHMI
MEMBER DR. MUHAMMAD TAYYAB
MEMBER PROF. DR. HABIB-UR-REHMAN

In the Name of ALLAH
The Most Beneficent, The Most Merciful

i
DEDICATION
THIS ACHIEVEMENT OF LIFE IS DEDICATED TO MY MOTHER
Khalida Saleem
WHO ALWAYES PRAYED FOR ME, SUPPORTED ME AND INSPIRED ME
TO GO FOR HIGHER IDEALS

ii
ACKNOWLEDGEMENTS
In the name of almighty ALLAH, the inspirer of truth. All praise and gratitude is to
almighty “ALLAH” Who provided ease on my way, and gave me will, strength and health to
accomplish this research, who gave me the power to do, the right to observe and mind to think,
judge and analyze.
I bow my head before the HOLY PROPHET (P.B.U.H) who are a light of guidance and
role model for entire mankind.
I would like to extend my heartfelt gratitude to my respected supervisor, Dr. Abu Saeed
Hashmi, Eminent Professor, Faculty of Biosciences, UVAS whose excellent guidance,
constructive criticism, encouragement, learning me professional and applicable matters of field
and moral support that enabled me to develop an understanding of the subject.
I am grateful to the members of my Supervisory Committee Prof. Dr. Habib-ur-Rehman
Dean faculty of Biosciences and Dr. Muhammad Tayyab, Assistant Professor, Institute of
Biochemistry and Biotechnology Vice Chancellor, University of Veterinary and Animal Sciences,
Lahore for their patronage, valuable inputs, encouragement and unabated advice throughout the
study period and they gave moral support that enabled me to develop an understanding of the
subject.
I am also grateful to Dr. Saima Naveed for her technical assistance and contribution to
the fibre analysis and conducting in vivo trials and to Dr. Erum Hussain assistant professor
LCWU for her help in the characterization experiments with FT/IR. I would also like to express
my thanks to Dr. Toseef Hussain for his collaboration through the ultramicroscopic Studies.
I will always remember Faiza Masood, for our friendly PhD pep-talks and for the
technical and moral support in designing the fermentation experiments. Finally, my huge
appreciation for all the faculty members of the Biochemistry department for their cooperation,
and for accepting me as a relatively inert member of the department, especially during the final
stages of my Ph.D

iii
I am very grateful to my mentors Prof Dr. Makhdoomm Abdul Jabbar and DR.
SUALEHA RIFFAT for their unconditional support.
My loving thanks to my niece, Shanza and Samiya for adding a fresh breathe of non-
academic humor to my sometimes humdrum life.
I am indebted to my husband, Zulfiqar-ul-Hassan, for his never-ending patience, gentle
encouragement, kind technical assistance and acceptance of all sloppy standards at home and to
all my dearest Son Taha Hassan, whose company made dull moments bright and bearable.
Finally my heartfelt gratitude to all my spiritual teachers and mentors those have carved
on my heart determination and faith.
Rahat Naseer

iv
TABLE OF CONTENTS
DEDICATION--------------------------------------------------------- (i)
ACKNOWLEDGEMENT ------------------------------------------ (ii)
TABLE OF CONTENTS -------------------------------------------- (iv)
LIST OF TABLES --------------------------------------------------- (v)
LIST OF FIGURES -------------------------------------------------- (vi)
Sr. No. CHAPTERS Page No.
1 Introduction 1
2 Review of Literature 5
3 Effect of various treatment on chemical composition of rice
husk 46
4 Nutritive enhancement of Rice husk with Pleurotusflorida
through Solid state fermentation 58
5 Effect of acid and alkali on surface modification of rice husk 70
6 To investigate the feeding value of processed rice husk in
growing Lohi sheep 83
7 Summary 95
8 Annexures 97

v
LIST OF TABLES
Table No. Title Page No.
1.1 Chemical composition of untreated rice husk 53
1.2 Effect of acid on chemical composition of rice husk 53
1.3 Effect of alkali on chemical composition of rice husk 54
1.4 Effect of hydrothermal treatment on chemical composition of rice
husk
54
2.1 Composition of Basal medium for fungus growth 63
2.2 Rice husk composition after 7,14,21 & 30 day of SSF 63
3.1. Reference table showing group frequencies of respective function
groups
74
3.2. Absorbance of treated and untreated samples (SS1=untreated husk
SS2= 2%NaOH treated, SS3 =.5 N H2SO4 treated,SS4 = 4%NaOH
treated husk)
75
4. 1. Ration formulations of different experimental groups of lohi sheep 89
4.2. Nutritional Profile of different experimental Rations 89
4.3. Growth performance of Lohi sheep fed on differently treated rice
husk as a wheat straw replacer
90
4.4 Daily Feed intake of different experimental groups 92

vi
LIST OF GRAPH
Sr. No. Title Page No.
2.1 Chemical composition of untreated Basmati rice husk 64
2.2. Effect of incubation period on crude protein content of rice husk 64
2.3. Effect of incubation period on NDF content of rice husk 65
2.4. Effect of incubation period on ADF content of rice husk 66
2.5. Effect of incubation period on ADL content of rice husk 66
4.1. Weekly Weight Gain of Lohi sheep fed on different experimental rations 91
4.2. Weekly average feed intake of Lohi sheep fed on different experimental
rations
91
vii
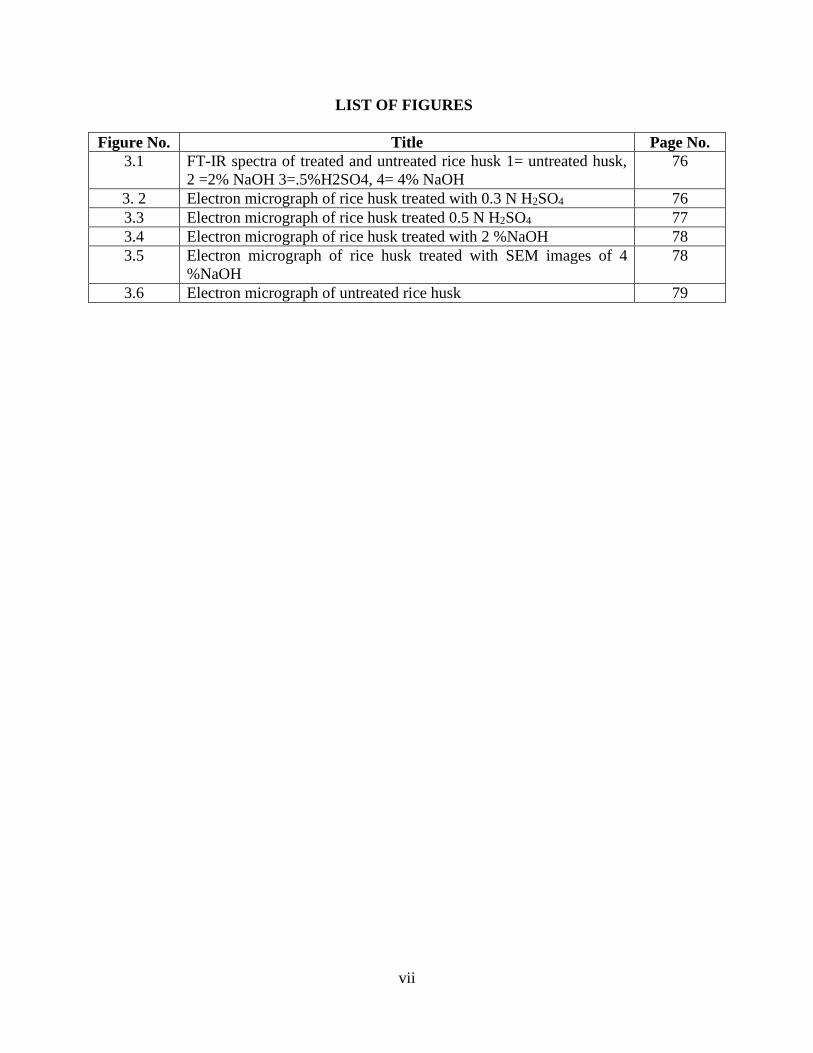
LIST OF FIGURES
Figure No. Title Page No.
3.1 FT-IR spectra of treated and untreated rice husk 1= untreated husk,
2 =2% NaOH 3=.5%H2SO4, 4= 4% NaOH
76
3. 2 Electron micrograph of rice husk treated with 0.3 N H2SO4 76
3.3 Electron micrograph of rice husk treated 0.5 N H2SO4 77
3.4 Electron micrograph of rice husk treated with 2 %NaOH 78
3.5 Electron micrograph of rice husk treated with SEM images of 4
%NaOH
78
3.6 Electron micrograph of untreated rice husk 79

1
CHAPTER 1
INTRODUCTION
Rice grain (Oryza sativa) contains a rough and hard outer covering, called rice husk
which is inedible for human consumption and is also not being fully incorporated in livestock
feeding. Total production of rice is 6160 thousand tons in Pakistan (Pakistan economic survey
2014). As rice husk comprises 20% of the paddy rice, production of rice husk comes to 1540
thousand tons annually. Rice husk contains 35 percent cellulose, 20 percent hemi cellulose, 30
percent lignin, 18 percent pentose and 17 percent ash (Kumar, 2010). The silica embedded in the
matrix of lignin present in the outer wall of plant cell makes it a rigid structure (Park et al, 2003).
Rice husk is one of the by-products of rice threshing process. The husk is produced in the
first stage of the threshing process, when paddy rice undergoes threshing process the husk is
removed along other parts like rice polishing and bran. The percentage of rice husk in paddy rice
varies across different countries and this is influenced by various factors such as rice species,
cultivation area, soil fertility, weather, irrigation efficiency and farming practices (Bhattacharya,
et al. 1999). However, 20 percent is generally considered as a fair average for general rice husk.
Traditionally, rice husk obtained from rice thresher has been used as ingredient in
ruminant and poultry feeds but the problem of low nutrients digestibility, high silica/ash content
and abrasive characteristics are limiting factors in its utilization. According to Chun-Yang Yin
(2011) rice husk is composed of crude protein 5-6% oil, 8-12%, crude fiber 39-42% and ash
12%. Rice husk is underutilized and highly available resource. According to the International
Rice Research Institute, rice is one of the important staple food crops, daily food for more than

INTRODUCTION
2
3.5 billion people of the world. FAO (Food and Agriculture Organization of the United Nations)
has estimated world rice production of 700 million tons in 2010 (Binod et al, 2010). Since the
husk constitutes 20% of rice, vast quantities of rice husk is disposed of as waste, or burned in
open fields, polluting the environment (Kim et al, 2004).
The average composition of rice residues which includes straw and hulls is 32–47%, 19–
27% ,5–24%, cellulose hemicelluloses and lignin respectively (Binod et al, 2010), whereas in
rice hulls the percentage of cellulose is 36-40 % and hemi-cellulose is that of 12–19%
(Banerjeeet al., 2009; Saha et al., 2005; Saha and Cotta, 2007, 2008). Composition has fats
essential oils waxes, resins alkaloids, and other cellular components. The ash is 12% of total
residue mainly composed of silica (80–90%), trace amounts of Mg, Fe, Na, K2O, P2O5 (5%)
and CaO (4–1.2%) can be detected (Balconi Bevilaqua, 2010; Diel Rambo, 2009). This highly
complex nature of rice husk actually presents a potential hazard for the release of
polysaccharides.
Biochemical conversion of agricultural wastes into value added products is a subject of
great interest. To achieve this purpose it is required to modify the structure of non-digestible
carbohydrates such as cellulose and lignin to make them more vulnerable to the enzymes which
can hydrolyze into monomeric sugars. Various chemical and biological treatments can modify
the structure of agricultural residues in such an efficient manner so that ruminal enzymes can
hydrolysis embedded polysaccharides efficiently (Vadiveloo, 2000; 2003).
Several studies have been reported on utilization of rice straw as ruminant feed with or
without chemical treatment. (Shen et al., 1998, Abou-El-Enin et al., 1999) Supplementation of
rice straw with other feed stuffs or components and fermented rice husk in order to increase its

INTRODUCTION
3
utilization were employed. Treatment regime includes various physical, chemical and biological
methods. Various methods were optimized and recommended but acceptance of these
techniques is less at farm level (Karunanandaa et al, 1992 b; Shen et al, 1999; Liu and Ørskov,
2000). Unfortunately rice husk received little attention and few studies are available. In general,
the use of rice straw and husk as an animal feed as well as its treatment is always cost
dependent for farmer (Selim et al., 2004)
Hydrothermal process proved to be an effective method of bioconversion of biomass. The
process has no environmental hazards and can be carried out even at the ambient temperatures.
(Hisaya et al. 2014)
The feeding value of the poor quality rice husk can be improved through various
physical, chemical and biotechnological methods (Selim et al, 2004).Now-a-days
biotechnological method due to their specificity and simplicity became a method of choice for
treating low quality roughages. This approach uses the appropriate microorganisms which have
ability to grow aerobically by solid state fermentation (SSF).Fungi are good candidate for this
purpose. These organisms have the capacity to grow using aerobic conditions moderately moist
substrate and optimum temperature. Solid state fermentation is an advantageous method to
degrade lignin and improve the digestibility. As fungi can secrete lignin degrading enzymes
which enhance the accessibility of hemi-cellulose and cellulose results in improved digestibility.
Fermentation of rice husk can be used as a vital source of energy for the production of cheap and
good quality biomass for poultry/livestock. At present, efforts are being made all over the world
by this method. The modern technological information regarding their culture, inoculation &
harvest has provided sufficient understanding and working tools for the mass production of
biomass protein for poultry and livestock.

INTRODUCTION
4
The aim of this study was to explore the effect of various treatments on surface and
composition of rice husk. The study was conducted using a narrow range of concentrations of
reagents so that their feeding value in small ruminants can be evaluated. Emphasis was placed on
developing a practical approach using water, acid, alkali and fungi to make it convenient for
farm use.

5
CHAPTER 2
REVIEW OF LITERATURE
Physical and Chemical Characteristics of Rice husk
Paddy rice (Oryza sativa) is grown on every continent, with the exception of Antarctica,
and the extent of paddy cultivation covers about 1 percent of the earth’s surface. Studies suggest
that more than half of the world’s population employ rice as a staple food and it is considered
second to wheat in terms of cultivation area and production. The quantum of global production
of paddy is close to 650 million tons per annum (www.maps of world.com).
Predominantly, Asia is the only continent, where rice can be cultivated during the rainy
season in the waterlogged tropical areas. Asia generates over 90 percent of world rice production
(Table 1 annexure attached). In Pakistan during 2013-14 the total production of rice was
cultivated on an area of 2789 thousand hectors with the yield of 5536 thousand tons. (Economic
survey of Pakistan 2014)
Rice husk can be defined as the outermost layer, which encases and protects a rice grain.
It is yellowish in color and has a convex shape. Typical dimensions are 4mm by 6mm.It is light
weight having a ground bulk density of 340 kg/m3 to 400 kg/m3. The exterior of rice husk is
composed of dentate rectangular elements (Mansaray and Ghaly, 2007).
The rice husk share almost same biochemical composition as that of other lingo-cellulose
wastes, that it has 40-50 % 25-30 % 15-20 % cellulose lignin and ash respectively. The moisture
content is 8- 15 percent (Prasad et al., 1998).

REVIEW OF LITERATURE
6
Longitudinal section of rice husk (www.fao.org/docrep/t0567e/t0567E07.htm.)
Traditionally, rice husk obtained from rice thresher has been used as ingredient in
ruminant and poultry feeds but the problem of low nutrients digestibility, high silica/ash content
and abrasive characteristics are limiting factors in its utilization.
Cellulose
Anselme Payen in1839 discovered and isolated cellulose some 150 years ago. It is
abundantly available and largest polysaccharide on earth. It is the main structural component of
plants, providing support and shape to plants. It is major component of rice husk. Cellulose is
also present in bacteria, fungi, algae and even in animals. Cellulose is one of the principle
components of cell walls, which provide mechanical and chemical strength to plants. Cellulose is

REVIEW OF LITERATURE
7
synthesized during photosynthesis through metabolism(van Kuijk et al. 2014). Cellulose is also
main fibrous substance of plant cell wall.
Cellulose is a polymer of glucose. Glucose is present in the form of a disaccharide known
as cellobiose courtesy to β-1, 4-polyacetal linkage. The empirical formula of cellulose is
(C6H10O5) n.
Several characteristics of cellulose depends on its extent of polymerization (DP), means
how many glucose units are involved in making one polymer molecule. Generally the DP of
cellulose is between 800-10000 units; however, this number may extend to 17,000 units in some
cases (Kirk-Othmer, 2001).
The polymer is arranged in the form of long chains due to the nature of the β-
1,4glucosidic linkage that exists between the glucose molecules. The hydrogen bonds are present
on (Hussain et al. 1996)either sides of the structural monosaccharide which allow the formation
of hydrogen bonding. Consequently, the hydrogen bonds are responsible for the making a
polysaccharide composed of more than one parallel chains linked to each other (Faulon et al.,
1994).
Cellulose can exist in two forms crystalline and non-crystalline. The joining of several
polymer chains leads to the formation of micro fibrils. These microfibers are then joined to form
fibers which give cellulose a crystalline form.
Carbohydrates are the primary energy source for ruminants; due to its utilization as
ruminant feed, cellulose is an important and abundant carbohydrate. Cellulose comprises 20-40%
of dry matter of higher plants. The nutritional utilization of cellulose varies from totally
REVIEW OF LITERATURE
8
indigestible to completely digestible, depending largely upon lignifications. However, in addition
to lignifications, there are other inhibitors and limiting factors and intrinsic properties which alter
its digestibility. Because of these limiting factors and its intrinsic properties, digestibility of
cellulose in the digestive system is still not clear.
Hemi-cellulose
Hemi-cellulose is one of the major components of rice husk. It is a complex
polysaccharide that is composed of different sugars like xylose, glucose, mannose, arabinose and
sugar acids. The major portion of hemi-cellulose extracted from hardwood is xylan and from soft
wood is glucomannan respectively. Cropresidues composition is similar to hard wood.
Agricultural plants like grasses and straw also has xylan as a major component (Fengel and
Wegener, 1984 and Saha, 2003). In addition C6 and C5 sugars copolymer with hemi-cellulose
were also found in the plant cell wall.
Cellulose has higher molecular weight than hemi-cellulose. Hemicellulose has branches
with short side chains that consist of hydrolysable sugars (Fengel and Wegener, 1984).
Hemicellulose serves as a connection between the lignin and the cellulose fibers, making a
cellulose–lignin–hemicellulose network stronger and rigid (Laureano-Perez et al, 2005).
Temperature has a significant effect on solubility of the various hemicellulose
compounds. Solubility tends to increase with rising temperature. Galactose is the least soluble
whereas mannose is the most. Xylose glucose and arabinose occupy the middle tier. However,
the solubility of very higher molecular polysaccharide could not be estimated due to the
unknown melting points. The complete dissolution of hemicellulose in aqueous conditions starts
from 180 °C if conditions are neutral as described by(Bledzki et al. 2010). However some

REVIEW OF LITERATURE
9
hemicellulose solubilizesat 150 °C is also reported (Garrote et al. 1999). The breakdown of
lignocellulose material depends on temperature, water activity and pH (Fengel and Wegener,
1984).
Acidic or Alkaline environment can facilitate the extraction of xylan from hemicellulose
whereas strong alkaline medium is required for the extraction of glucomannan (Fengel and
Wegener, 1984). Comparatively Xylan can be extracted easily.
Hemicelluloses if subjected to thermal-chemical treatment exhibit sensitivity(Isa et al.
2011)During the treatment the lateral groups of hemicellulose react first leading to the
breakdown of hemicellulose backbone
Lignin
Lignin after cellulose and hemicellulose is the abundant carbohydrate in nature and also
the part of rice husk. Lignin is a hetero polymer amorphous compound consisting of three
phenylpropane units namely p-coumaryl, coniferyl and sinapyl alcohol. All these units are linked
through different linkages mainly ß-O-4 and α-O-4ether linkage. Other linkages include 4-O-5
ether and carbon-carbon bond. The main function of lignin is to provide impermeability
structural support, oxidative stress and resistance against microbial attack to plants. The lignin
iswater insoluble and devoid of optical activity, unable to rotate the plane polarized light. All
these complex linkages make lignin a hard and resistant material for ruminal degradation (Fengel
and Wegener, 1984).
Lignin starts to dissolve into water at 180 C if conditions are neutral ((Isa et al. 2011).
The solubility of the lignin in different reagents like acid, alkaline or even in neutral conditions
REVIEW OF LITERATURE
10
rests upon its precursor from which they are formed which could be either p-coumaryl or
coniferyl, or sinapyl alcohol or all of them ((Bazargan et al. 2014).
Lignin is a polymer of aromatic ring containing compounds which can be formed through
a metabolic pathway and functions as a protective layer for the plant cell walls. In nature across
the year these substances grow and decay. It is estimated that around 7.5x10¹⁰ of cellulose are
consumed and then regenerated every year (Kirk-Othmer, 2001), thereby, making it the most
usable organic compound in the world.
Apart from the three basic chemical compounds, cellulose hemicellulose and lignin,
water is also part of rice husk. In addition to these small amounts of proteins, minerals and other
components can be found in the rice husk composition.
Fiber is a nutritional entity which is defined as much by its biological properties as its
chemical composition (Van Soest et al. 1993). With regard to forages, it has been traditionally
defined as the complex of dietary nutrients that are relatively resistant to digestion and are slowly
and only partially degraded by herbivores (Van Soest 1982). By this definition, fiber is
composed of structural polysaccharides, wall proteins, and lignin. The main anti quality role of
lignin in forages is in limiting digestion of the structural polysaccharides cellulose and
hemicellulose (Moore and Hatfield 1994).
Lignification controls the amount of fiber that can be digested and, therefore, has a linear
and mostly significant effect on the digestible energy (DE) and importance of the agricultural
residue (Jung and Allen 1995). Lignification also influences the amount of dry matter that can be
consumed by an animal (Mertens, 1994). The undigested portion of the forage passes slowly
through the digestive system and contributes to the fill effect of the diet. The greater the

REVIEW OF LITERATURE
11
concentration of degradable fiber in the diet the less dry matter an animal can consume.
Therefore, lignifications impacts forage nutritive value by both decreasing DE concentration and
limiting dry matter intake (Moore et al. 1993).
Lignin is a distinct chemical entity of plant cell walls and has been recognized for over
100 years (Sjostrom 1981) however research is still in progress regarding its structure,
biosynthesis, and measurement. Anabolism of lignin is a complex process which is manifested in
the resultant complexity of lignin molecules. While generalized structures for lignin have been
drawn, it is not yet possible to definitely determine the complete structure of any isolated lignin
molecule, let alone the structure of lignin in the plant cell wall. Because there is no well-defined
and standard reference lignin structure is available measurement of lignin concentration is
relative and very much depends on methodology. All of these ambiguities have made it very
difficult to clarify the roles of lignin in plant growth and development, and the mechanism by
which lignin limits cell wall digestibility.
Lignin can be characterized as a polymer formed in phenyl-propanoid pathway derived
from mono-lignols in vascular plants. Some reviews provide excellent coverage of the process
and biochemistry of lignification (Baucher et al. 1991). Lignin is deposited in the plant cell walls
as part of the cell maturation process after cell elongation has ceased. Based on difficulty of
lignin extraction from the cell wall, it has been concluded that lignin is chemically bonded to
carbohydrates and probably to proteins in the cell wall to form complex macromolecules. The
only cross-linking structure of lignin to other cell-wall components that has been definitively
characterized is the bonding of lignin to arabinoxylans in grasses via ferulic acid molecules
(Ralph et al. 1995), even though chemical extraction information does indicate ∝-ether bond of
REVIEW OF LITERATURE
12
lignin directly to polysaccharides (Watanabe 1989). Undoubtedly there are other lignin cross-
linked structures that involve polysaccharides and proteins both.
Lignin found in gymnosperms is 95 % Guaiacyl-type lignin whereas angiosperms
generally deposit significant amounts of both guaiacyl- and syringyl-type lignins. Small amounts
of p-hydroxyphenol lignin are present in most plants (Lapierre et al. 1988). As more lignin
mutants and transgenic plants involving the lignin pathway have been characterized, it has
become apparent that this pathway is actually more of a web than linear (Sewall et al. 1997b).
Because of this web structure and the ability of plants to incorporate non-typical
phenylpropanoid precursor molecules, the results of biotechnological manipulation of the
pathway have yielded unexpected results and unique lignin structures (Orlandi et al. 2014).
Apparently lignin plays such an important role in plant development that alternative
routes and precursors can be used to provide the amount of lignin necessary for normal
development. When lignin concentration has been significantly reduced through biotechnology,
nonviable plants result. Deposition of lignin in the cell wall of grasses appears to involve ferulate
esters of arabinoxylans as nucleation sites. In annual ryegrass (Loliummultiflorum Lam.), lignin
cross-links to ferulates consisted only of structures that would form if monolignols reacted with
the ferulates directly rather than polymeric lignin reacting with ferulate esters (Orlandi et al.
2014).
Unlike ferulic acid, p-coumarate (the other major cell wall hydroxycinnamic acid
ingrasses is esterified to lignin as compare to other polysaccharide which has
lignin/polysaccharide cross-linkage. Because of complex lignin structure and linkage to other
cell-wall polymers, analysis of lignin concentration in forages is difficult. The standard method

REVIEW OF LITERATURE
13
used in animal and agronomic sciences is the acid detergent lignin (ADL) method, of which there
are sulfuric acid hydrolysis and permanganate oxidation versions of the method (Van Soest 1967,
Goering and Van Soest 1970). The traditional lignin method used in wood chemistry, Klason
lignin, was long believed to give inaccurate results with forages because of perceived
contamination (Van Soest 1967). It has now been shown that the Klason lignin method does not
suffer from contamination when applied to forages and that the ADL method under-estimates
lignin concentration (Lowry et al. 1990).
Several mechanisms have been suggested for how lignin may inhibit cell-wall digestion,
however, it is now generally agreed that lignin simply acts as a physical barrier to the microbial
enzymes reaching their target polysaccharides (Chesson 1993, Jung and Deetz 1993). Questions
still remain as to how lignin can cross-linked to other cell-wall carbohydrate, and deposition and
distribution in the wall may modify the impact of lignin as a physical barrier to cell-wall
digestion. This is perhaps best illustrated by the fact that while the negative relationship of lignin
concentration is always observed when examined across forage samples of different maturities,
when plant maturity is similar large differences in lignin concentration and cell-wall digestibility
are observed but lignin and digestibility are often not correlated (Jung and Deetz 1993).
Obviously there must be modifying factors which influence the inhibition caused by lignin on the
digestion of cell wall, especially severe for grasses.
The relationship between lignin degradation and temperature was investigated. Horwath
and Elliott (1996) conducted an experiment using ryegrass for 45 days at 25°C and 50°C. The
amount of lignin degraded after compositing was 7% and 27%, respectively Klason method was
used. Although the elemental ratio will remain unchanged at 25°C and 50°C a change is

REVIEW OF LITERATURE
14
observed in residual lignin and it was calculated that 6% of the residual Klason lignin was
remained unchanged after composting (Horwath and Elliott, 1996).
Silica/Lignin interaction
Primarily silica and lignin are the major drawback of rice husk. Silica is an inert element,
frequently found in earth crust. Silicon is a nutrient and plays variety of roles in rice formation
ranging from carbohydrate and phenol synthesis to cell wall protection. All these factors
ultimately affect the grain yield. The interactions between these factors minimize association of
digestibility between silica and lignin when different varieties were compared. Grain yield is
highly related to amount of silica in straw which is in turn associated with its availability in soil.
There are no thorough investigations on rice straw and rice husk lignin is conducted so far
especially in India and Pakistan. Lignin reported is actually acid-detergent, lignin the terms can
be used interchangeably, if estimated through the sulfuric acid or permanganate forms. Soluble
phenols in straw needs further study. It is reported that ammonia and urea can crack the silica
studded cuticle. Although silica shows solubility in sodium hydroxide but not in urea and
ammonia is does not get dissolved in these reagents in comparison to the action of sodium
hydroxide (Van Soest 2006).

REVIEW OF LITERATURE
15
Digestibility
Different treatments with rice straw and on other lingo cellulosic materials were reported
but very few studies were available on rice husk. Urea is used most frequently followed by
ammonia and sodium hydroxide. Steam and pressure treatments along with acid and white rot
fungi were also reported (Beg & Shah 1986). Feed supplementation and growth studies with
young animals were conducted. Traditionally use of urea in India and other Southeast Asian
countries is more popular than ammonia, although urea is less effective than ammonia (Hussain
1996). Farmer approval depends on expenses, manual labor, tools, health and safety. The various
studies involving animal digestion using in sacco, in vitro digestions techniques with rumen
microorganisms or cellulase, or in blend with pepsin has been reported. Gas formation during in
vitro rumen fermentation has also been used. Outcomes are stated in terms of total dry matter
rather on organic matter. It is hard to relate the results because techniques require
standardization. However, most of the treatments with ammonia and urea display little rise in
digestibility and feed consumption when determined in vivo trials. It is noticed that in vitro and
in sacco assessments show exaggerated enhancement in digestibility (Khanum 2010).
White- rot Fungi
The white-rot fungi are categorized in the major division named Eumycota means true
fungi first subdivision is Basidiomycotina, Hymenomycetes, Holobasidiomycetidae are class and
subclass respective(Rodr et al. 2011).This subclass encompasses almost all the wood-decay fungi
for example mycorrhizal, litter, mushrooms, puffballs, decomposer fungi, conks and other crust
like fungi. It is found that at one step below the subclass, the biological difference among
representatives is less, particularly in functional variability; nevertheless, at the level of family
REVIEW OF LITERATURE
16
occasional cases of functional variability have been recorded. Within a genus very less diversity
is found as far as biological function is concerned.
Fungi are the primary agents that degrade lignocellulose (Sanchez 2009) however
species in the genus can differ in their ability to perform specific functions. Additionally, not
only do they secrete enzymes that are vital for the decomposition of lignocellulose material, but
fungal growth using lignocellulose as a substrate is encouraged by the formation of structure
called mycelia that permit filamentous fungi to carry nutrients like nitrogen and iron, to the
polysaccharide portion of lingo-cellulosic substrate or rice husk (Hammel 1997).
Many fungi are also more resistant to wood-derived biocides that limit bacterial growth.
These compounds include tannins and various phenolic compounds (terpenes, stilbenes,
flavonoids and tropolones) that are particularly abundant in the hardwood of fallen trees. The
majority of wood-degrading fungi that have been characterized to date are members of the
phylum Basidiomycota and are characterized by either brown-rot or white-rot decay.
White-rot fungi secrete enzymes that breakdown lignin, hemicellulose and cellulose,
giving residual wood fiber a decolorized appearance. White-rot decay can follow two patterns of
decay have been differentiated by microscopic and structural investigations (Liese 1970). One
pattern is called simultaneous white-rot or “corrosion rot”. It causes a collective degradation of
polysaccharide and lignin at start and end of the wood decay process. Examples of fungi which
show simultaneous white-rot include Phellinus robustus, Fomesfomentarius, andTrametes
versicolor (Blanchette 1984, Blanchette 1994). By contrast selective (sequential) white-rot decay
follow the early degradation of lignin and hemicelluloses and then that of cellulose.
Ceriporiopsissubvermispora and Phlebiaradiata are perhaps the best studied fungi to elicit
REVIEW OF LITERATURE
17
selective white-rot decay (Blanchette, 1991)). Sequential white-rot fungi “selectively” degrade
lignin and hemicellulose in small tubules within a wood tissue such that decayed areas found
inside and intact tissues are found in periphery (Blanchette 1984). Wood acquires a fibrous
texture by progressive decay and delignification of primary cell wall (Schmidt 2006).
Importantly, whether it is simultaneous or sequential white-rot decay decisive factors will be
wood type, stage of wood decay, and fungal strain being used in the study (Messner and
Srebotnik, 1994). For example some strains of Phanerochaete chrysosporium (e.g. BKM-F-
1767), produce selective decay of major deciduous wood plant while few strains can cause
simultaneous wood decay (Blanchette 1992).
Lignocellulose-active enzymes that are produced by white-rot fungi are particularly
valuable for biomass conversion, since theycan be used to selectively transform both lignin and
polysaccharides (Kirk and Cullen 1998). The enzymes that contribute to this activity can be
broadly classified as Carbohydrate-Active enzymes (CAZymes) and oxidative fungal Lignin
enzymes (FOLymes) (Cantarel et al. 2009, Levasseur et al. 2008).
Carbohydrate Active Enzymes
A sequence-based classification scheme for carbohydrate-active enzymes was developed
in 1991, called the CAZy database (CArbohydrateen ZYme database) (Cantarel et al. 2009;
Henrissat 1991). At present, this database is comprised of 125 glycoside hydrolase families, 92
glycoside transfer families, 22 polysaccharide lyase families and 16 carbohydrate esterase
families. Glycoside hydrolases hydrolyze the glycosidic bonds between α-linked or β-linked
sugars, using a retaining or inverting mechanism (Davies and Henrissat 1995). Polysaccharide
lyases break polysaccharide form a double bond at non-reducing end by β-elimination whereas

REVIEW OF LITERATURE
18
carbohydrate esterases catalyze the deacetylation and demethylation of substituted
polysaccharides. Efficient disaggregation of carbohydrates requires collective interactions
between enzymes responsible for breaking the different linkages. Significant research has been
done to demonstrate and understand synergy between various isolated enzymes for degradation
of microcrystalline cellulose (Avicel) and commercial xylans (de Vries and Visser 2000). For
instance, hydrolysis of xylan by an Aspergillus xylanase was increased in the presence of
accessory enzymes that catalyze the hydrolysis of xylan side chains (Paszczynski et al. 1988).
Cellobiohydrolases, endoglucanases and β-glucosidases act on cellulose hydrolyze it and
form glucose molecules. All the three enzymes worked at different locations endo-cellulases act
on the internal position by hydrolyzing glycosidic cellulose molecules, Cellobiose is released
from the reducing or non-reducing end of cellulose by the action of cellobio-hydrolases and
further hydrolyzed into glucose by β-glucosidases. These enzymes when work together is
efficient enough to break amorphous and crystalline form of cellulose. To act upon polymeric
substrate two enzymes namely endo-cellulases or cellobiohydrolases are often linked with
cellulose-linking module to enhance their activity on polymeric substrates (Kirk and Cullen
1998). Of the 125 GH families, fungal cellulases belong to GH families 5, 6, 7, 9, 12, 44, 45, 48,
61 and 74 (Dashtban et al. 2009).
Oxidative enzymes also take part in cellulose degradation along with hydrolytic enzymes
(Kirk and Cullen 1998). Quinones radicals and phenoxy radicals reduces themselves in to
cellobiono-δ-lactone in the presence of cellobiose, enzyme is quinone oxidoreductase.
Respective acids were formed from cellobiose and longer cello-oligomers using molecular
oxygen and cellobiose oxidase. Wood hemicelluloses include xylan, (gluco) galactomannan, and
xyloglucan. Many polysaccharides have a linkage β-1-4 in its carbohydrate backbone with

REVIEW OF LITERATURE
19
acetylation or substitution in sugar branches. Given the diversity of hemicelluloses some
glycoside hydrolases and carbohydrate esterases participate in their disaggragation. (Scheller and
Ulvskov, 2010). For instance, xylan breaking that involves the activity of various enzymes for
example galactosidases, arabinofuranosidases, deacetylases, glucuronylesterases,
feruloylesterases and xylanases. Like cellulases, most of the actions work in collaborations
produces a collective effect associated with carbohydrate linkage modules that enhance enzyme
activity on substrates (de Vries et al. 2000; 14 Hervé et al. 2010). So far, fungal hemicellulases
were identified in nineteen GH families: 1, 2, 3,5, 10, 11, 26, 27, 36, 39, 43, 51, 53, 54, 62, 67,
74,115, and 116, and nine CE families: 1, 2, 3, 4,5, 6, 12, 15 and 16.
Fungal Oxidative Lignin Enzymes
Similar to carbohydrate-active enzymes, enzymes involved in lignin catabolic enzymes
can be divided into sequence-based classes, named the Fungal Lignin Oxidative enzymes
(FOLy) (Levasseur et al. 2008).Important enzymes for lignin degradation are Laccases and
peroxidases which are extracellular, lingo-lytic enzymes (ten Have and Teunissen, 2001). The
peroxidases include one is lignin peroxidase (LiPs) and second is manganese-dependent
peroxidase (MnP). Substrate is oxidized in two step reaction one electron oxidation step at a
time.The intermediate cation radical is formed. Enzymes for the reaction are Both LiP and MnP
(Sanchez 2009). LiP break down 90 % of non-phenolic lignin polymer whereas MnP produce
Mn3+, which can diffuse into phenolic and non -phenolic units of lignin. This diffusion is
facilitated by peroxidation of lipid (Cullen and Kersten 2004; Moen and Hammel, 1994).
Laccases are also called blue copper oxidases. These enzymes catalyze reduction of O2 to
H2O by oxidizing the phenols or aromatic amines or various electron-rich substrates. (d'Souza et

REVIEW OF LITERATURE
20
al. 1999). Laccases oxidize the phenolic units present in lignin and converting it into to phenoxy
radicals resulting into aryl-C cleavage (Kawai et al. 1988).Some phenolic substrates, xylan,
(galacto) glucomann, can also be oxidized by laccases but presence of some auxiliary substances
like 2,2´-azino-bis-3- ethylthiazoline-6- sulfonate is mandatory(Call and Muncke 1997).
We can categories fungal decay types according to their mode of degradation into three
groups. Namely brown rot, white rot and soft rot fungal decay. White rot is further divided into
two classes one is simultaneous rot and other is selective delignification whereas soft rot is
further divided into two classes’ types 1 and 2.White rot and brown rot can be differentiated on
the basis of their capacity to oxidize phenolic compounds extracellular.
During selective delignification, lignin is first to be degraded followed by cellulose and
hemicellulose degradation. As the hyphae grows into the cell luminary lignin oozes out of the
adjacent cell walls. Hyphae can also go into the cell walls separating the cells and then de-lignify
them. Selective delignification in some cases can decompose large volume of lignin leaving
cellulose almost unchanged, generally in the initial stages of decay white rot fungi that
selectively de-lignify the parenchyma tissue in contrast to brown rot (Schwarze 1995; Schwarze
et al. 2004).
A specific type of decay by fungi reported in chili named as “palopodrido’’where
residual lignin after decay is 0.9 % and cellulose is 97 %.So palopodrido became a general term
for all the selective and non-selective removal of lignin by white rot decay, however advanced
delignification is termed as paloblanco (Blanchette 1984). The structural changes in lignin during
white rot examined by thioacidolysis showed structural changes in lignin syringyl unit which
have ß-aryl ether-linkage.

REVIEW OF LITERATURE
21
Among the different types of the Genus Pleurotus, oyster mushrooms, consist of range of
edible mushrooms for example P.sajor-caju, P. citrinopileatus, P. ostreatus, 5and p. florida
available in the market believedto have some antitumor substances. The white oyster mushroom,
P. florida, is commercially available at the local markets during moderate temperature periods of
year. The analysis of fruiting body of P. florida show 37.19% protein, 3.72% fat, and 10.98%
ash on dry matter basis. This mushroom also contains neutral lipids, glycolipids, and
phospholipids making almost 0.5 % total lipids. Supplemented rice straw can act as a substrate
for fruit bodies of P. florida (Zhao, 2010).
Scanning Electron Microscopy
Scanning electron microscopy and other analytical techniques provided useful
information about husk surface features, organizational pattern and distribution of silica. It is
apparent that rice husk topology share a peculiar features with irregular boarders studded with
silica.
The outer and the inner epidermis of rice husk differ greatly in their topology and
composition which effect their interaction with each other as well as with reagents. From the
standpoint of topography and composition of cell walls the two surfaces of husk, i.e. the outer
epidermis and inner epidermis are likely to differ markedly in their interaction with each other as
well as with other reagents (Ang et al, 2012).
Rice husk has a complex structure in which outer epidermis and lignified fiber provide
stiffness strength and rigidity to husk. These properties help the husk to withstand harsh
environmental conditions like high wind. Treatments like grinding and steam explosion can
expose the husk internal tissues, although these tissues vary greatly in thickness and

REVIEW OF LITERATURE
22
composition. Thick walled fibers are less flexible than thin walled fibers. Thus, physical
properties and composition are important factors to be considered while designing treatment
strategies for rice husk (Schwarze, 2007).
Silica distribution in rice husk suggests that silica is either exposed on the surface or
embedded in the internal tissues. Surface silica require coupling agent like silane compounds,
however if internal silica is involved agents like maleic anhydride propylene will be used.
Fourier transform infrared spectroscopy (FT/IR) is a molecular vibrational spectroscopic
technique. This technique optically investigates the molecular changes of the substance. This
method provides a reliable and conservative way to investigate the bonding molecular
conformation and functional group presence in tissues cells and any other substance. That can be
used to optically probe the molecular changes associated with the tissues. The method is
employed to find more conservative ways of analysis to measure characteristics within tissue and
cells that would allow accurate and precise assignment of the functional groups, bonding types,
and molecular conformations. Specific bands in vibrational spectra are indicative of biochemical
composition. FTIR peaks express the vibration or bending of specific chemical bond of
functional group in a molecule (Coates, 2000). FTIR mainly used for dehydrated samples due to
strong absorption bands of water. It records the changes in dipole moment during molecular
vibration.

REVIEW OF LITERATURE
23
Treatments of rice husk
The composition of different lignocellulose material depends on its source. The lignin
and (hemi) cellulose component vary greatly with respect to its source.
Biochemical conversion of lignocellulose biomass into value added products is a subject
of great interest. To achieve this purpose it is required to modify the structure in such a manner
that accessibility of cellulose towards enzymes can be increased resulting in the conversion of
carbohydrate polymers into fermentable sugars (Mosier et al., 2005). Various chemical and
biological treatments involve the modification of lignocellulose biomass for rapid and easy
enzymatic hydrolysis of cellulose and hemicellulose.
Chemicals which can enhance the use of rice straw and rice husk can be either alkali, acid
or oxidative agents. Alkaline agents are most studied and enjoy greater acceptance at farm
level(Shreck 2013). The mechanism of alkaline action is the absorption of alkali through cell
wall breaking the ester bonding between cellulose/hemi cellulose will result in the swelling of
the tissues. This process facilitates the ruminal microflora action on polysaccharides enhancing
the digestibility and palatability. Alkaline agents of common use are ammonia, urea and sodium
hydroxide. (Prasad et al., 1998; Shen et al., 1998) There are several advantages of chemicals for
on farm use. Chemicals are cheap, easy to handle and no specialized equipment is required. This
advantage includes safety precautions and toxicity. Sodium hydroxide treatment is in practice
since a long time (Selim et al., 2004). Treated straws show remarkably increased digestibility
but for a small scale farmer, it’s still an expensive choice. High concentrations can cause
environmental hazards due to high discharge of sodium into the environment (Vadiveloo, 2000;
Sundstøl and Coxworth, 1984).
REVIEW OF LITERATURE
24
Biological treatment includes the use of fungi on their enzymes for the selective
delignification of ligno cellulose material that will enhance the digestibility. Although in the
developing country it is difficult to implement these strategies on farm level, however the
scenario is becoming bright day by day. The use of fungi and/or their enzymes that metabolize
lignocelluloses is a potential biological treatment to improve the nutritional value of agricultural
residues by selective delignification, as mentioned in the review by (Wang et al. 2014). The
Problems faced with use of fungi are toxic production and difficulty in optimizing the growth
conditions like temperature, pH, pressure, O2 and CO2 for the treatment of fodder (Schiere and
Ibrahim, 1989). Latest developments in fermentation technology and development of alternative
enzyme production system promises a key roles in future ruminant production systems(Soccol &
Vandenberghe 2003).
White-rot fungi treatment: White-rot fungi can be used to treat lingo cellulosic material.
(Eriksson et al., 1969).Its degradation potential was utilized to increase the nutritive value of
fodder for ruminant nutrition (Howard et a, 2003). Decomposition of free phenolic monomers
and degradation of lignin polysaccharides cross linkage in rice straw can be carried out white rot
fungi (Chen et al, 1996), enhancing IVDMD (Karunanadaa and Varga, 1996). Reports suggest
that 30 day incubation with white rot enhance the IVDMD of rice straw both for leaves and stem.
Comparative studies suggest highest IVDMD when treated with Cyathusstercoreus (Soest,
2006).The mechanism of action is same for almost all the species (Chen et al., 1996,
Karunanadaa and Varga, 1996a).
Crop residues usually have poor digestibility. This limit the use of crop residues as fodder
hence has a negative impact on animal production. Pond et al. (1980) Using white-rot fungi to
increase the degradability of straw is often at the expense of easy assessable carbohydrates, such

REVIEW OF LITERATURE
25
as cellulose and hemicellulose, resulting in less degradable feed for ruminant. Chemical
treatments can increase digestibility of poor quality crop (Anderson, 1978). Many studies are
conducted despite poor acceptability (Klopfenstein, 1978; Ben-Ghedalia, et al., 1983).
Cellulose is found in both primary and secondary cell walls. The monomeric unit is
glucose, which is linked by β1-4 glycosidic bonds in a linear polymer. Extent of polymerization,
or the measure of number of glucose molecule that make up one polymer molecule, ranges from
2,000 to 6,000 in the primary cell wall and can increase to greater than 10,000 in secondary cell
walls (Delmer, 1987). As a plant matures, the increase in polymerization leads to greater strength
and lower digestibility. In contrast to cellulose, xylans are more heterogeneous. In a forage cell
wall, polymers12 of linked β1-4 xylose are found, as well as arabinose, glucuronic acid, and
galactose residues (Wilkie, 1979). Bailey (1973) defined hemicelluloses as structural
carbohydrates that are not pectin or cellulose based. Determination of xylans and cellulose can
be determined by gravimetric, enzymatic-gravimetric, and enzymatic chemical methods. The
detergent fiber system, originally proposed by Van Soest (1963), is a gravimetric based analysis
that is the standard for fiber quantification for ruminants.
Neutral detergent fiber (NDF) solution solubilizes non -structural plant polysaccharides,
leaving hemicellulose, cellulose, and lignin. The disadvantages of NDF system include: all that is
solubilized is not structural carbohydrate, as well as interference from starch, fat (Buckner et al.,
2013), or protein. Acid detergent fiber (ADF) solution solubilizes hemicellulose and the
remaining residue is composed of lignin and cellulose.
Van Soest (1982) characterized polysaccharides in the plant cell wall as belonging to two
classes based on biological associations and nutrient availability. One class includes
polysaccharides covalently bonded to core lignin and partially fermented and other includes

REVIEW OF LITERATURE
26
those that are not bonded, soluble, and completely fermentable. The association of
polysaccharides with lignin was also considered as the primary factor limiting cell wall
digestibility. Additionally, it was proposed that the crystalline nature of cellulose and low surface
area for cellulose attachment as other impairments to fiber utilization (Sarnklong et al. 2010).
Forage digestibility
Silica can increase depression in digestibility and this phenomenon is studied in oat
plants grown hydroponically with different levels of silica (Van Soest and Jones 1968). Early
studies by (Smith et al, 1971) revealed that silica lowers organic matter by one unit. The study
was conducted using eight different species of grasses. A study was conducted using Bermuda
grass, reed canary grass, and rice straw with neutral detergent by Van Soest (1981) revealed that
removal of silica can increase NDF digestibility of organic matter per unit of silica removed.
Silica was dissolved in significantly high concentration and alfalfa was used as a negative
control. Two preliminary reports from the International rice institute (IRRI) in the Philippines
issued two preliminary reports indicated no effect of silica upon digestibility of rice straw (Lim
et al. 2012). Studies by Enishi (2002) showed that each unit of silica reduces organic matter
digestibility about one unit or more which is in agreement with NDF digestibility. The data was
not precise but showed a definite relationship between silica and digestibility
Studies by Hasan et al, 1993 compared straws with different lodging reaction in relation
to silica content and digestibility. In one study four varieties were studied and in another study
twelve varieties were studied.
Several studies report silica and digestibility on whole straws with little correlation. An
inverse relationship was found when rice was grown hydroponically with and without silica

REVIEW OF LITERATURE
27
addition. Silica with ash content was also directly proportional (Abou-El-Enin et al., 1999;
Agbagla-Dohnani et al, 2001).
Treatment with ammonia can form silicic acid but its polymerization and precipitation at
physiological pH is very slow (Van Soest et, 1971). Studies have investigated the inhibitory
effects of silicic acid upon cellulose and also on in vitro digestibility (Hartley, 1981; Smith and
Nelson, 1975; Smith and Urquhart, 1975).
Soluble silica whose nature is not well under stood can produce negative effects on
animal health. The intake of soluble silica has been linked with urinary siliceous stones mostly in
drier regions where water shortage may occur (Mahgoub et al, 2000). There have been no
definitive studies in India and Pakistan regarding the formation of urinary calculi
(Krishnamoorthy, personal communication). However, oxalate is known to be fermented in the
rumen and not thought to present a problem for ruminants. Vadivelloo and Fadel (1992) report
90 g/kg ytterbium which is a perceptible phenolic in rice straw. Ytterbium can also precipitate
oxalate.
Lignin contains guaiacyl groups which plays role in solubility. This cleaved lignin
although indigestible in ruminant but due to water solubility offers no resistance to digestion
(McBurney and Van Soest, 1984;Van Soest, 1994).Urea is also able to break lignin to
polysaccharide ester bond .It is different to show relation between lignin and digestibility in
untreated straw samples however Agbagla-Dohnani et al. (2003) conducted experiments with 14
samples and significant relationship between lignin and digestibility was found whereas Abou-
El-Enin et al. (1999) El emin with 53 samples showed non-significant results. It is postulated
that lignin is also exhibiting varietal variation just like silica.

REVIEW OF LITERATURE
28
The maturity of the plants is also found to be major player in determining the
digestibility. It is also emphasized that at maturity less variation is found (Lapierre et al., 1989).

REVIEW OF LITERATURE
29
STATEMENT OF PROBLEM
Using the crop residue like rice resources as a substrate to produce biomass through
chemical/biochemical treatments will substantiate fodder deficiency gap in Pakistan. Structural
modifications will pave the way for other value added products. The present study will be
conducted under the following main objectives:
1. To optimize the different conditions of hydrothermal treatment and its evaluation.
2. To improve the quality of rice husk by physical & chemical procedures.
3. Production of quality fungal protein using white rot fungus for quality fungal from rice
husk under standard laboratory conditions.
4. Production of different treated husk at large scale
To determine efficacy of different husks in small ruminants in terms of growth performance

REVIEW OF LITERATURE
30
LITERATURE CITED
Abou-El-Enin et al. 1999; Abou-el-Enin, O.H. ; Fadel J. G. ; Mackill D. J., 1999. Differences in
chemical composition and fibre digestion of rice straw, with and without
anhydrous ammonia from 53 rice varieties. Anim. Feed Sci. Technol., 79 (1-2):
129–136
Agbagla-Dohnani A, Cornu A, Broudiscou LP. Rumen digestion of rice straw structural
polysaccharides: Effect of ammonia treatment and lucerne extract
supplementation in vitro. Animal.2012;6:1642–1647.
Anderson, D.C. 1978. Use of cereal residues in beef cattle production systems. J. Anim. Sci.
46:849-861.
Agosin F, Odier E (1985). Solid state fermentation, lignin degradation and resulting digestibility
of wheat straw fermented by selected white-rot fungi. Appl. Microbiol.
Biotechnol. 21:397-403.
Ang TN, Ngoh GC, Chua ASM, Lee MG. 2012.Elucidation of the effect of ionic liquid
pretreatment on rice husk via structural analyses.Biotechnol Biofuels 5, 67-77.
Ang, T.N., Ngoh, G.C. & Chua, A.S.M., 2013. Comparative study of various pretreatment
reagents on rice husk and structural changes assessment of the optimized pretreated rice
husk. Bioresource technology, 135, pp.116–9.
Beg, S., Zafar, S.I. & Shah, F.H., 1986. Rice husk biodegradation by Pleurotusostreatus to
produce a ruminant feed. Agricultural Wastes, 17(1), pp.15–21. Available at:
Bailey, R.W. 1973.Structural carbohydrates. In: G.W. Butler and R.W. Bailey (Eds.) Chemistry
and Biochemistry of Herbage.(Vol. 1). pp 157-211. Academic PressNew York

REVIEW OF LITERATURE
31
Binod P, Sindhu R, Rani R, Surender S, Lalitha V.D. Satya N, Noble K, Rajeev K. S and Ashok
P. 2010 Bioethanol production from rice straw: An overview Biosource
technology 11/2009; 101(13):4767-74.
Ben-Ghedalia, D. and G. Shefet. 1983. Chemical treatments for increasing digestibility of cotton
straw. J. Agr. Sci., Camb.100:401.
Bannerjee GC. 2002. Dry roughages, soaking of straws. A textbook of Animal Husbandry. 8
(1): 383-385
Bazargan, A. et al., 2014. The effect of alkali treatment on rice husk moisture content and drying
kinetics. Biomass and Bioenergy, 70, pp.468–475
Bhattacharya, A., Sudha, S., Chandra, H.S., Steward, R. (1999).flex, an X-linkedfemale-lethal
mutation in Drosophila melanogaster controls the expression of Sex-lethal.
Development 126(23): 5485--5493
Blanchette RA (1991) Delignification by wood-decay fungi. Annual Reviews of Phytopathology
29:381-398
Blanchette, R.A., Burnes, T.A., Eerdmans, M.M. and Akhtar, M. (1992) Evaluating isolates of
Phanerochaete chrysosporium and Cerzporiopsissubz: errnispora for use in
biological pulping processes. Holzforschung 46, 109-115. 645-662
Blanchette RA (1984) Screening wood decayed by white rot fungi for preferential lignin
degradation. Applied and Environmental Microbiology. 48 (3):647-653
Blanchette, R.A, Obst JR, Timell, TE (1994) Biodegradation of compression wood and tension
wood by white and brown-rot fungi. Holzforschung 48: 34-42.

REVIEW OF LITERATURE
32
Blanchette RA (1991) Delignification by wood-decay fungi. Annual Reviews of Phytopathology
29:381-398
Balconi Bevilaqua, D., 2010. Production of levulynic acid trough acid hydrolysis of rice husk.
Master Thesis. University Federal de Santa Maria, Natural and Exact Sciences
Center
Bledzki, A.K., Mamun, A.A. & Volk, J., 2010. Physical, chemical and surface properties of
wheat husk, rye husk and soft wood and their polypropylene composites.
Composites Part A: Applied Science and Manufacturing, 41(4), pp.480–488.
Buckner, C.D., G.E. Erickson, and T.J. Klopfenstein. 2013. Evaluation of modification to the
neutral detergent-fiber analysis procedure for corn and distillers grains plus
solubles. Prof. Anim. Sci. Vol 29. No. 3. 252-259
Bouchard, J.; Nguyen, T. S.; Chornet, E.; Overend, R. P.Analytical methodology for biomass
pretreatment. Part 2.Characterization of the filtrates and cumulative product
distribution as a function of treatment severity.Biores. Technol. 1991, 36, 121
Call HP, Muncke I (1997) History, overview and applications of mediated lignolyticsystems,
especially laccase-mediator systems (lignozyme (R)-process). Journal of
Biotechnology 53:163-202
Cantarel BL, Coutinho PM, Rancurel C, Bernard T, Lombard V, Henrissat B (2009) The
Carbohydrate-Active Enzymes database (CAZy): an expert resource for
Glycogenomics. Nucleic Acids Research 37 (suppl 1):D233-D238.
Chesson, A. and E.R. Orskov. 1984. Microbial degradation in the digestive tract. P. 305-339. In:
Straw and fibrous by-products as feed. F. SundstØl and E. Owen (ed.) Elsevier.
Sci. Pub. Co. New York, NY.

REVIEW OF LITERATURE
33
Chen J, Fales SL, Varga GA and Royse DJ. 1996. Biodegradability of free monomeric cell wall
bound phenoliacids in maize stover by two strains of white rot fungi. J Sci Food
Agric. 71(2): 145-150.
Coates JP. 2000. A practical approach to the interpretation of infrared spectra. Encyclopedia of
analytical chemistry. Chichester: Wiley 10815-37.
Cullen D, Kersten PJ (2004) Enzymology and molecular biology of lignin degradation. In:
Brambl R, Marzluf GA (eds) The Mycota III Biochemistry and Molecular
Biology. Springer-Verlag, Berlin-Heidelberg
Chung, Y. Y. (2011). Production of higher heating values of biomass from proximate and
ultimate analyses, Feul. 9(3): 1128-1132
Davies G, Henrissat B (1995) Structures and mechanisms of glycosylhydrolases. Structure
3:853-859
D’eVries RP, Kester HCM, Poulsen CH, Benen JAE, Visser J (2000) Synergy between enzymes
from Aspergillus involved in the degradation of plant cell wall polysaccharides.
Carbohydrate Research 327 (4):401-410
D'Souza TM, Merritt CS, Reddy AC (1999) Lignin modifying enzymes of the white rot
basidiomycete Ganodermalucidum. Applied and Environmental Microbiology 65
(12):5307-5313
Dashtban M, Schraft H, Qin W (2009) Fungal bioconversion of lignocellulosic residues -
opportunities and perspectives. International Journal of Biological Sciences
5:578-595
Delmer, D. P. 1987. Cellulose biosynthesis. Ann. Rev. of plant Physiol. 38(1): 259-290.

REVIEW OF LITERATURE
34
De Vries RP, Visser J (2001) Aspergillus enzymes involved in degradation of plant cell wall
polysaccharides. Microbiology and Molecular Biology Reviews 65 (4):497-522
Diel Rambo, M.K., 2009. Use of rice husk for xylitol and silica gel production. Master Thesis.
University Federal de Santa Maria, Natural and Exact Sciences Center
Eriksson KE, Rzedowski W (1969) Extracellular enzyme systems utilized by the fungus
Chrysosporiumlignorum for the breakdown of cellulose. Archives of
Biochemistry andBiophysics 129:683-688
Enishi, O., 2002. Reevaluation on feed characteristics of rice straw. J. Jap. Grassl. Sci. 48, 371–
378 (In Japanese).
Erickson, G.E., T.J. Klopfenstein, C.T. Milton, R.A. Mass. 2000. Effect of increasing dietarycorn
silage on performance, digestibility, and nitrogen mass balance in feedlot.
Nebraska Beef Cattle Report MP73-A. Univ. of Nebraska-Lincoln.
Fackler K, Stevanic J, Ters T, Hinterstoisser B, Schwanninger M, Salmén L (2010) Localisation
and characterization of incipient brown-rot decay within spruce wood cell walls
using FTIR imaging microscopy. Enzyme and Microbial Technology 47
(6):257-267
Faulon JL, Carlson GA, Hatcher PG. 1994. A three-dimensional model for lignocellulose from
gymnospermous wood. Organic geochemistry, 21(12): 1169-1179.
Fengel, D., Wegener, G., 1984. Wood: Chemistry, Ultrastructure, Reactions. Walter de Gruyter,
Berlin–New York.
Garrett, W.N., H. G. Walker, Jr., G. O. Kohler, M. R. Hart, and R. P. Graham. 1980. Steam
treatment of crop residue for increased ruminant digestibility. II. Lamb feeding
studies. J. Anim. Sci. 51:409-413.

REVIEW OF LITERATURE
35
Goering, H.K., L.W. Smith, P.J. Van Soest, C.H. Gordon. 1973. Digestibility of roughage
materials ensiled with sodium chlorite. J. Dairy. Sci. 56:223.
Garrote, G.; Domı´nguez, H.; Parajo´, J. C. Mild autohydrolysis: an environmentally friendly
technology for xylooligosaccharide production from wood. J. Chem. Technol.
Biotechnol. 1999,74, 1101
Hasan, S., Shimogo, M., Goto, I., 1993a.Improvement in the nutritive value of rice straw by
treatment with the urine of goats.Asian–Austral. J. Anim. Sci. 6, 37–40.
Hammel KE (1997) Fungal Degradation of Lignin. In: Cadisch G, Gillier KE (eds) Driven by
Nature: Plant litter quality and decomposition. CAB International, pp 33-45
Hartely, R.D. and A.S. Keene. 1984. Aromatic aldehyde constituents of graminaceous cell walls.
Phytochemistry 23:1305-1307.
Hussain, I., Cheeke, P.R. & Johnson, D.E., 1996. Evaluation of grass straw: corn juice silage as a
ruminant feedstuff: digestibility, straw ammoniation and supplementation with
by-pass protein. Animal Feed Science and Technology, 57(1-2), pp.1–13.
Hisaya.T, Limsuwan. P, Hirajima. T et al, 2014. Recovery of Furfural Produced by
Hydrothermal Treatment with Biomass Charcoal. , 4(1), pp.11–17.
Hervé C, Rogowski A, Blake A, Marcus S, Gilbert H, Knox J (2010) Carbohydrate-binding
modules promote the enzymatic deconstruction of intact plant cell walls by
targeting and proximity effects. Proc Natl Acad Sci U S A 107 (34):15293-15298

REVIEW OF LITERATURE
36
Hussain, I., Cheeke, P.R. & Johnson, D.E., 1996. Evaluation of grass straw: corn juice silage as a
ruminant feedstuff: digestibility, straw ammoniation and supplementation with
by-pass protein. Animal Feed Science and Technology, 57(1-2), pp.1–13.
Howard RL, Abotsi E, Jansen van Rensburg EL, Howard S (2003) Lignocellu biotechnology:
issue of bioconversion and enzyme production. African Journal of Biotechnology
2 (12):602-619
Hasan, S., Shimogo, M., Goto, I., 1993a.Improvement in the nutritive value of rice straw by
treatment with the urine of goats.Asian–Austral. J. Anim. Sci. 6, 37–40.
Isa, K.M. et al., 2011. Thermogravimetric analysis and the optimisation of bio-oil yield from
fixed-bed pyrolysis of rice husk using response surface methodology (RSM).
Industrial Crops and Products, 33(2), pp.481–487.
Jung, H.G. and G.C. Fahey, Jr. 1983. Interactions among phenolic monomers and in vitro
fermentation. J. Dairy Sci. 66:1255-1263.
Jung, H.G. and D.A. Deetz. 1993. Cell wall lignifications and degradability. P.315-346 in Forage
Cell Wall Structure and Digestbility. H.G. Jung, D.R. Buxton, R.D. Hatfield and
J. Ralph, ed. ASA-CSSA-SSSA, Madison, WI.
Jung, H.G. and M.S. Allen. 1995. Characteristics of cell walls affecting intake and digestibility
of forages. J. Anim. Sci. 73:2774-2790.
Karunanandaa, K., S. L. Fales, G. A. Varga and D. J. Royse (1992).Chemical composition and
biodegradability of crop residues colonized by white-rot fungi. J Sci Food Agric.
60, 105–11

REVIEW OF LITERATURE
37
Kim, S.B. et al., 2013. Pretreatment of rice straw with combined process using dilute sulfuric
acid and aqueous ammonia. Biotechnology for biofuels, 6(1), p.109.
Kirk, T. K. & Cullen, D. (1998). Enzymology and Molecular Genetics of Wood Degradation by
White-Rot Fungi. Environmentally Friendly Technologies for the Pulp and Paper
industry. Hoboken, NJ: John Wiley & Sons
Khanum, S.A. et al., 2010. Digestibility studies in sheep fed sorghum, sesbania and various
grasses grown on medium saline lands. Small Ruminant Research, 91(1), pp.63–
68.
Klopfenstein, T. 1978. Chemical treatment of crop residues. J. Anim. Sci. 46:841:848.
Lapierre, C., Jouin, D., Monties, B., 1989. On the molecular origin of the alkali solubility of
Gramineaelignins. 28, 1401–1403
Liu, J. X., E. R. Orskov and X. B. Chen (1999).Optimization of steam treatment as a method for
upgrading rice straw as feeds. Anim. Feed Sci Technol. 76, 345–357.
Laureano-Perez L, Teymouri F, Alizadeh H, Dale BE. Understanding factors that limit
enzymatic hydrolysis of biomass: characterization of pretreated corn
stover. Applied Biochemistry and Biotechnology. 2005;121–124:1081–1099.
Levasseur A, Piumi F, Coutinho P, Rancurel C, Asther M, Delattre M, Henrissat B, PontarottiP,
Asther M, Record E (2008) FOLy: an integrated database for the classification
and functional annotation of fungal oxidoreductases potentially involved in the
degradation of lignin and related aromatic compounds. Fungal Genetic Biology
45 (5):638-645
Liu, J. X., E. R. Orskov and X. B. Chen (1999). Optimization of steam treatment as a method for
upgrading rice straw as feeds. Anim. Feed Sci Technol. 76, 345–357.

REVIEW OF LITERATURE
38
Lim, J.S. et al., 2012. A review on utilisation of biomass from rice industry as a source of
renewable energy. Renewable and Sustainable Energy Reviews, 16(5), pp.3084–
3094.
Lowry, J.B. 1990. Metabolic and nutritional significance of the cell wall phenolic acidfraction. P.
119-126. In: D.E. Akin et al. (ed.) Microbial and plant opportunities to improve
lignocelluloses utilization by ruminants. Elsevier Sci. Publ. Co., New York.
Mosier, N., Wyman, C., Dale, B., Elander, R., Lee, Y., Holtzapple, M., Ladisch, M.,
2005.Features of promising technologies for pretreatment of lignocellulosic
biomass. Bioresource Technology 96, 673–686.
Mahgoub, O., Lu, C. & Early1, R., 2000. Effects of dietary energy density on feed intake, body
weight gain and carcass chemical composition of Omani growing lambs. Small
ruminant research : the journal of the International Goat Association, 37, pp.35–
42.
Mansaray, K.G. & Ghaly, A.E., 1999. Determination of kinetic parameters of rice husks in
oxygen using thermogravimetric analysis. Biomass and Bioenergy, 17(1), pp.19–
31.
McBurney, M.I., 1985. Physicochemical and nutritive evaluation of chemically treated feeds for
ruminants. Ph.D. Thesis. Cornell University, Ithaca, NY.
Malherbe, S., Cloete, T. E., Rev. Environ. Sci. Biotechnol.1 (2002) 105.
McBurney, M.I., P.J. Van Soest, and L.E. Chase. 1981. Cation exchange capacity of various
feedstuffs in ruminant rations. P. 16-23. In: Proc. Cornell Nutr. Conf.

REVIEW OF LITERATURE
39
Moore, J. A., M. H. Poore, and R. S. Swingle. 1990. Influence of roughage source on kinetics of
digestion and passage, and on calculated extents of ruminal digestion
Mertens, D. R. 1994. Regulation of forage intake. Pages 450-493 in Forage Quality, Evaluation,
and Utilization.
G. C. Fahey, Jr., M. Collins, D. R. Mertens, and L. E. Moser, ed. American Society of Agronomy,
Crop Science Society of and Soil Science Society of America, Madison, WI.
Moen MA, Hammel KE (1994) Lipid peroxidation by the manganese peroxidase of
Phanerochaete chrysosporiumis the basis for phenanthrene oxidation by the inact
fungus. Applied and Environmental Microbiology. 60: 1956-61.
Moore, J. A., M. H. Poore, and R. S. Swingle. 1990. Influence of roughage source on kinetics of
digestion and passage, and on calculated extents of ruminal digestion in beef
steers fed 65% concentrate diets. J. Anim. Sci. 68:3412–3420.
Orlandi, M. Elegir, G. F.Zanini, A.Salanti.chemical characterization of lignin from annual
plant.Dipartimento di Scienza dell Ambient e del territono,University di Milano-
Bicocca, Piazza dellaScienza 1, 20126 Milano,Italy.
Paul, S.S. et al., 2004. Deriving nutrient requirements of lactating indian cattle under tropical
condition using performance and intake data emanated from feeding trials
conducted in different research institutes. Asian-Australasian Journal of Animal
Sciences, 17, pp.769–776.
Park BD, Wi SG, Lee KH, Singh AP, Yoon TH, Kim YS. 2003. Characterization of anatomical
features and silica distribution in rice husk using microscopic and micro-
analytical techniques. Biomass Bioenergy, 25: 319–327.

REVIEW OF LITERATURE
40
Paszczynski A, Crawford RL, Blanchette RA (1988) Delignification of wood chips and pulps by
using natural and synthetic porphyrins: models of fungal Decay. Applied and
Environmental Microbiology 54 (1):62-68
Prasad, R.D.D., Reddy, M.D., Reddy, G.V.N., 1998. Effect of feeding baled and stacked urea
treated rice straw on the performance of crossbred cows. Anim. Feed Sci.
Technol. 73, 347–352.
Park, B. D., S. G. Wi, K. H. Lee, A. P. Singh, T. H. Yoon and Y. S. Kim (2003).
Characterization of anatomical features and silica distribution in rice husk using
microscopic and micro-analytical techniques. Biomass Bioenergy 25: 319–327.
Pond, W.G., R.A. Merkel, L.D. McGilliard, and V.J. Rhodes. 1980. Feed production. In: Animal
Agriculture: Research to meet human needs in the 21st Century. pp. 165
Prasad CS, Sampath KT, Shivaramaiah MT, Walli TK (1993). Dry matter intake, digestibility
and supplementation of slender and coarse straws-A review. In: K Singh, JB
Schiere (Eds.) Feeding of ruminants on fibrous crop residues. Indian Council of
Agricultural Research, New Delhi.pp.188-203.
Rodr, S., Osma, J.F. & Moilanen, U., 2011. Morphology and laccase production of white-rot
fungi grown on wheat bran £akes under semi-solid-state fermentation conditions.
Sarnklong, C. et al., 2010. Utilization of Rice Straw and Different Treatments to Improve Its
Feed Value for Ruminants: A Review. Asian-Australasian Journal of Animal
Sciences, 23(5), pp.680–692.
Shreck, A.L., 2013. Use of alkaline treated crop residues as partial grain replacements for
finishing cattle.ph.D thesis ,University of Nebrsaka

REVIEW OF LITERATURE
41
Soccol, C.R. & Vandenberghe, L.P.., 2003. Overview of applied solid-state fermentation in
Brazil. Biochemical Engineering Journal, 13(2-3), pp.205–218.
Saha BC. 2003. Hemicellulose bioconversion. J Indian Microbiol Biotechnol. 30: 279–299.
Saha CBadal, Loren B Iten, Michael A Cotta, Y Victor Wu (2005). Dilute acid pretreatment,
saccharification and fermentation of wheat straw to ethanol. Journal of Industrial
Microbiology and Biotechnology Volume30 Issue 5 279-291
Saha, B., Cotta, M., 2007. Enzymatic saccharification and fermentation of alkaline peroxide
pretreated rice hulls to ethanol. Enzyme and Microbial Technology 4, 1528–1532.
Selim, A.S.M., J. Pan, T. Takano, T. Suzuki, S. Koike, Y. Kobayashi and K. Tanaka
(2004).Effect of ammonia treatment on physical strength of rice straw,
distribution of strawparticles and particle-associated bacteria in sheep
rumen.Anim Feed Sci Technol.115: 117–128.
Shen et al. 1998; Shen, H. S.; Sundstol, F. ; Ni, D. B., 1998. Studies on untreated and urea-
treated rice straw from three cultivation seasons. 2. Evaluation of straw quality
through in vitro gas production and in sacco degradation measurements. Anim.
Feed Sci. Technol., 74 (3): 193-212
Sanchez C (2009) Lignocellulosic Residues - Biodegradation and bioconversion by fungi.
Biotechnology Advances 27:185-194
Schwarze, Francis WMR Wood decay under the microscope, Fungal Biology Reviews (2007),
doi:10.1016/j.fbr.2007.09.001
Sewell, J.R., L.L. Berger, T.G. Nash, M.J. Cecava, P.H. Doane, J.L. Dunn, M.K. Dyer, N.A.
Pyatt. 2008. Nutrient digestion and performance by lambs and steers fed
thermochemically treated crop residues. J. Anim. Sci. 87:1024-1033.
REVIEW OF LITERATURE
42
Schmidit O (2006) Wood and Tree Fungi. Biology, Damage, Protection and Use. Springer-
Verlag, New York
Scheller HV, Ulvskov P (2010) Hemicelluloses. Annual Review of Plant Biology 61 (1):263-
289.
Sjostrom E (1983) Wood Chemistry, Second Edition: Fundamentals and Applications. Academic
Press.
Schiere, J.B., Ibrahim, M.N.M., Sewalt, V.J.H., Zemmelink, G., 1989. Response of growing
cattle given rice straw to lickblocks containing urea and molasses. Anim. Feed.
Sci. Technol. 26, 179–189.
Schiere, J. B., M. M. Ibrahm and H. Van Keulen, 2000. The role of livestock for sustainability in
mixed farming: criteria and scenario studies under varying resource allocation.
Agri., Ecosyst. Eniron., 90(2):139-153.
Shen, H.Sh., Ni, D.B., Sundstøl, F., 1998a. Studies on untreated and urea-treated rice straw from
three cultivation seasons: 1. Physical and chemical measurements in straw and
straw fractions. Anim. Feed Sci. Technol. 73, 243–261.
Smith, G.S., Nelson, A.B., Boggino, E.J.A., 1971. Digestibility of forages in vitro as affected by
content of “silica”. J. Anim. Sci. 33, 466–471.
Smith, G.S., Urquhart, N.S., 1975. Effect of sodium silicate added to rumen cultures on digestion
of siliceous forages. J. Anim. Sci. 41, 882–890.
Schwarze FWMR, Lonsdale D, Fink S, 1995a. Soft rot and multiple T-branching by the
basidiomycete Inonotushispidus in ash and London plane. Mycological Research
99: 813–820.

REVIEW OF LITERATURE
43
Schwarze FWMR, Mattheck C, Engels J, 2004. Fungal strategies of wood decay in trees.
Springer, Heidelberg
Srebotnik E, Messner K, 1994. A simple method that uses differential staining and light
microscopy to assess the selectivity of wood delignification by white rot fungi.
Applied and Environmental Microbiology 60: 1383–1386.
SundstØl, F. and E.M. Coxworth. 1984. Ammonia treatment. p. 196-247. In: Straw and fibrous
by-products as feed. F. SundstØl and E. Owen (ed.). Elsevier. Sci. Pub. Co. New
York, NY.in beef steers fed 65% concentrate diets. J. Anim. Sci. 68:3412–3420.
Sandeep Kumar, Seema Dhankhar, Ved Priya Arya, Sanjay Yadav and J. P. Yadav.(2010)
Antimicrobial activity of Salvadoraoleoides Decne. against some microorganisms
Journal of Medicinal Plants Research Vol. 6(14), pp. 2754-2760,
Ten Have R, Teunissen P (2001) Oxidative mechanisms involved in lignin degradation by white
rot fungi. Chemical Reviews 11:3397-3414
Van Soest, P.J. 1993. Cell wall matrix interactions. P. 77-395 in Forage Cell Wall Structure and
Digestibility. H.G. Jung, D.R. Buxton, R.D. Hatfield, and J. Ralph, ed. ASA-
CSSA-SSSA, Madison, WI.
Vadiveloo, J. (2000). Cellulase degradation of whole rice straw. J Anim Feed Sci. 9: 157–166.
Vadiveloo, J. (2003a). Solid-state fermentation of fibrous residues. J Anim Feed Sci. 12, 665–
676.
Van-Soest, P. J., J. B. Robertson and B. A. Lewis (1991).Method for dietary fiber, neutral
detergent fiber and non-starch polysaccharides in relation to animal nutrition.J
Dairy Sci. 74, 3583–3597.

REVIEW OF LITERATURE
44
Van Soest, P.J. 1993. Cell wall matrix interactions. P. 77-395 in Forage Cell Wall Structure and
Digestibility. H.G. Jung, D.R. Buxton, R.D. Hatfield, and J. Ralph, ed. ASA-
CSSA-SSSA, Madison, WI.
Van Soest, P. J. 1963. The use of detergents in the analysis of fibrous feeds: II. A rapid method
for the determination of fiber and lignin. J. Assn. Official Agr. Chem.46:829.
Van Soest, P.J. 1982. Nurtitional ecology of the ruminant. Comstock, Cornell Univ. Press,
Ithaca, NY
Van Soest, P.J., 2006. Rice straw, the role of silica and treatments to improve quality. Animal
Feed Science and Technology, 130(3-4), pp.137–171.
van Kuijk, S.J.A. et al., 2014. Fungal treated lignocellulosic biomass as ruminant feed ingredient:
A review. Biotechnology advances. 180. Westview Press, Boulder, CO.
Vadiveloo J, Fadel JG. 1992. Compositional analyses and rumen degradability of selected
tropical feeds. Anim. Feed Sci Technol. 37: 265–279
Vadiveloo, J., Nurfariza, B. &Fadel, J.G., 2009. Nutritional improvement of rice husks. Animal
Feed Science and Technology, 151(3-4), pp.299–305.
Watanabe Y, Shinzato N, Fukatsu T. (2003) Isolation of actinomycetes from termites' guts.
Biosci Biotechnol Biochem. 67(8):1797-801.
Wang, Z.Y. et al., 2014. Influence of whole hulled rice and rice husk feeding on the
performance, carcass yield and digestive tract development of geese. Animal Feed
Science and Technology, 194, pp.99–105.
Wilkie, K.C.B. 1979. The hemicelluloses of grasses and cereals. Adv. Carbohydr. Chem. 36:215

REVIEW OF LITERATURE
45
Zhao, Y.C. et al., 2010. Fundamental study of degradation of dichlorodiphenyltrichloroethane in
soil by laccase from white rot fungi.International Journal of Environmental
Science & Technology, 7(2), pp.359–366.

46
CHAPTER 3
EXPERIMENT 1
EFFECT OF VARIOUS TREATMENT ON CHEMICAL COMPOSITION OF RICE
HUSK
ABSTRACT
Rice husk obtained from the local threshing mill was first analyzed for total fiber contents, silica
and ash contents. Three reagents acid (sulphuric acid), alkali, (sodium hydroxide) and water were
selected. Three different concentrations of acid (0.1N,0.3N,0.5N) and alkali (2%,4%,6%) at three
different temperatures(25°C,70°C,100°C) were used having same reaction duration(24 hour).
Hydrothermal treatment was carried out with three different time duration (30 min, 60min, and
90min) and temperature (25°C, 70°C, 100°C).Reagent loading was optimized. All the samples of
rice husk after the acid, alkali and hydrothermal treatment were analyzed for fiber content, silica
and ash. The results show that temperature has a significant effect on the fiber content. After the
alkali treatment a significant reduction in the neutral detergent fiber (NDF)was observed (p ≤
0.005). All these treatments had little effect on lignin & silica content.
INTRODUCTION
Rice husk is mainly composed of cellulose, hemicellulose and lignin. In order to utilize
these carbohydrate moieties as fermentable sugars one need to breakdown or modify them. These
modifications can provide an easy access to reticulo-rumen microflora. Traditionally, rice husk
obtained from rice thresher has been used as ingredient in donkeys and horse feeds but the
problem of low nutrients digestibility, high silica/ash content and abrasive characteristics are
limiting factors in its utilization.

EXPERIMENT 1
47
Acid treatment can hydrolyze cell wall specially its hemicellulose component. This hydrolysis
facilitates the release of cellulose and lignin component. Alkalis have great potential to modify
the cell wall. Solvation and saponification are the main reactions involved.
Previously several studies have been reported on the physical and chemical properties
rice straw and rice husk (Shen et al., 1998). Moreover, various methods of physical, chemical
and biological treatments have been investigated to upgrade its utilization. These strategies
including supplementation with other feed stuffs or component (Selim et al., 2004). These three
components require cellulase, hemicellulase andligninase for their breakdown (Schiere and
Ibrahim, 1989). Animals cannot produce these enzymes but in the rumen they maintain the
population of microorganism which can produce cellulose and hemicellulose. Lignin will remain
undigested due to the lack of ligninase. Lignin impacts the livestock production through effects
on digestibility and feed intake. Lignin and its associated Phenolic monomers reduce microbial
carbohydrate degradation dramatically (Van Soest 1965, Jung & Deet3 93, Allen95). Both
concentration and composition of lignin appears to affect digest ability. Lignin can be classified
as core and noncore lignin. Core lignin is described as three dimensional structures composed of
condensed phenyl propanoid units that limit digestibility by encrustation. Non-core lignin, which
is the part of the total phenolic content, is soluble in alkali. A more likely factor reducing fiber
degrade ability is the stearic hindrance caused by lignin and polysaccharide linkages which limit
access of fibro lytic enzymes. As non-core lignin is soluble in alkali, the success of chemical
treatment by hydrolytic agents would be partially attributed to reducing polysaccharide-lignin
associations.
Silica is one of the elements of husk; present in relatively high concentrations can range
from 5% to 15%, depending on the variety of rice and type of soil (Agbagla-Dohnani et al.,
EXPERIMENT 1
48
2003). Silica acts as a barrier to the digestibility of rice straw or rice husk in the rumen by
reducing palatability.
Technology for the chemical treatment of crop residues likely comes from paper making
techniques which were introduced as early as 12th century. Since that time, a variety of methods
have been developed to improve the treatment through hydrolytic or oxidative means. Physical
treatments such as particle size reduction, steam treatment have also been used. A combination
of both is possible. Ideal chemical treatment must be asked to be increase intake or digestibility,
non-toxic or non-hazarders to handle and benefits that outweigh the costs associated with
treatment. Hydrolytic agents improve the digestibility by action of OH group disrupting cell wall
structure and increased swelling resulting in increased microbial attachment. Core lignin is
usually not affected by hydrolytic treatments but bonds between lignin and hemi-cellulose can be
broken and hemicellulose solubilization can likely to be occurred.
Treatment with water is also called Auto hydrolysis or hydrothermal processing. Water is
the cheapest reagent for these treatments and can be used under farm conditions easily. Only
hemicellulose degradation is expected resulting into sugar monomers and oligomers.
Alkali agents have the capacity to get absorbed making structural fibers to swell. This
process will chemically break down the ester bonds between lignin, hemicellulose and cellulose
(lanetal 2001). These processes provide enabling environment to rumen microflora to attach
them self easily with structural carbohydrates increasing digestibility and palatability of the
agricultural residues (Selim et al 2004).
Dilute acid hydrolytic is a common method used to treat lingo, cellulosic wastes. The
treatment with dilute (0.1-1%) H2SO4 at high temperature results degradation of hemicellulose,
while it has little effect on lignin. However treatment can disrupt interactions between lignin and
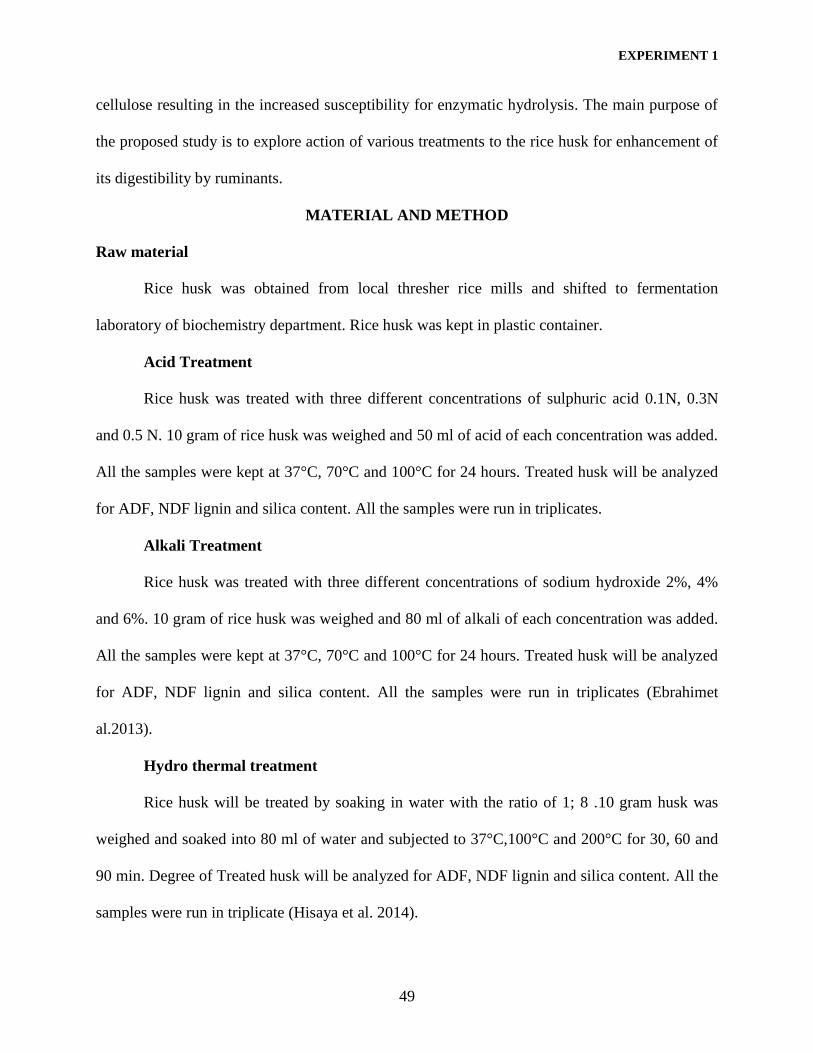
EXPERIMENT 1
49
cellulose resulting in the increased susceptibility for enzymatic hydrolysis. The main purpose of
the proposed study is to explore action of various treatments to the rice husk for enhancement of
its digestibility by ruminants.
MATERIAL AND METHOD
Raw material
Rice husk was obtained from local thresher rice mills and shifted to fermentation
laboratory of biochemistry department. Rice husk was kept in plastic container.
Acid Treatment
Rice husk was treated with three different concentrations of sulphuric acid 0.1N, 0.3N
and 0.5 N. 10 gram of rice husk was weighed and 50 ml of acid of each concentration was added.
All the samples were kept at 37°C, 70°C and 100°C for 24 hours. Treated husk will be analyzed
for ADF, NDF lignin and silica content. All the samples were run in triplicates.
Alkali Treatment
Rice husk was treated with three different concentrations of sodium hydroxide 2%, 4%
and 6%. 10 gram of rice husk was weighed and 80 ml of alkali of each concentration was added.
All the samples were kept at 37°C, 70°C and 100°C for 24 hours. Treated husk will be analyzed
for ADF, NDF lignin and silica content. All the samples were run in triplicates (Ebrahimet
al.2013).
Hydro thermal treatment
Rice husk will be treated by soaking in water with the ratio of 1; 8 .10 gram husk was
weighed and soaked into 80 ml of water and subjected to 37°C,100°C and 200°C for 30, 60 and
90 min. Degree of Treated husk will be analyzed for ADF, NDF lignin and silica content. All the
samples were run in triplicate (Hisaya et al. 2014).

EXPERIMENT 1
50
RESULTS AND DISCUSSION
Rice husk is predominantly composed of cellulose, hemicellulose lignin & silica. They
are amorphous in nature and connected with each other via 1-4 B bonding in cellulose. Lignin is
present between the cellulose chains making it more compact. Analysis results of husk as shown
in table 1 shows the cellulose content in rice husk is more than lignin and hemicellulose.
The results of acid treatments showed (Table 1.2) a significant change in percentage of NDF(p≤
.000),ADF(p≤.000) and ash(p≤.000) whereas non-significant results was shown with the
lignin(p≤.09) due to mild temperature conditions and silica(p≤.987) content.
This acid hydrolysis is in line with the other studies carried out earlier(Sun and Cheng,
2002).The sulphuric acid has dissolved most of the hemicellulose, increasing the susceptibility of
cellulose and no effect on lignin. Hydrolysis of cellulose and hemi cellulose would be converted
to their monomers. This ultimately would reduce the percentage of neutral detergent fiber (NDF)
and acid detergent fiber (ADF) as suggested by Bazargan and colleagues (2014).The major
disadvantage is the cost of the acid used and its corrosive character.
Effect of hydro thermal treatment on biochemical composition of rice husk was investigated.
Results showed (Table 1.4) a significant change in percentage of NDF (p≤ .000),ADF
(p≤.000),silica and ash(p≤.000) whereas non-significant results was shown with the
lignin(p≤.936) for time duration and (p≤0.008) for temperature. The decrease in silica content is
perhaps due to excessive washing by water. The results were in line with the results of previous
studies (Taherzadeh and Karim 2008).
Hydrothermal treatment can increase swelling of the cell wall resulting in the increased
microbial attachment. Core lignin is usually not affected by the treatment but bonds between
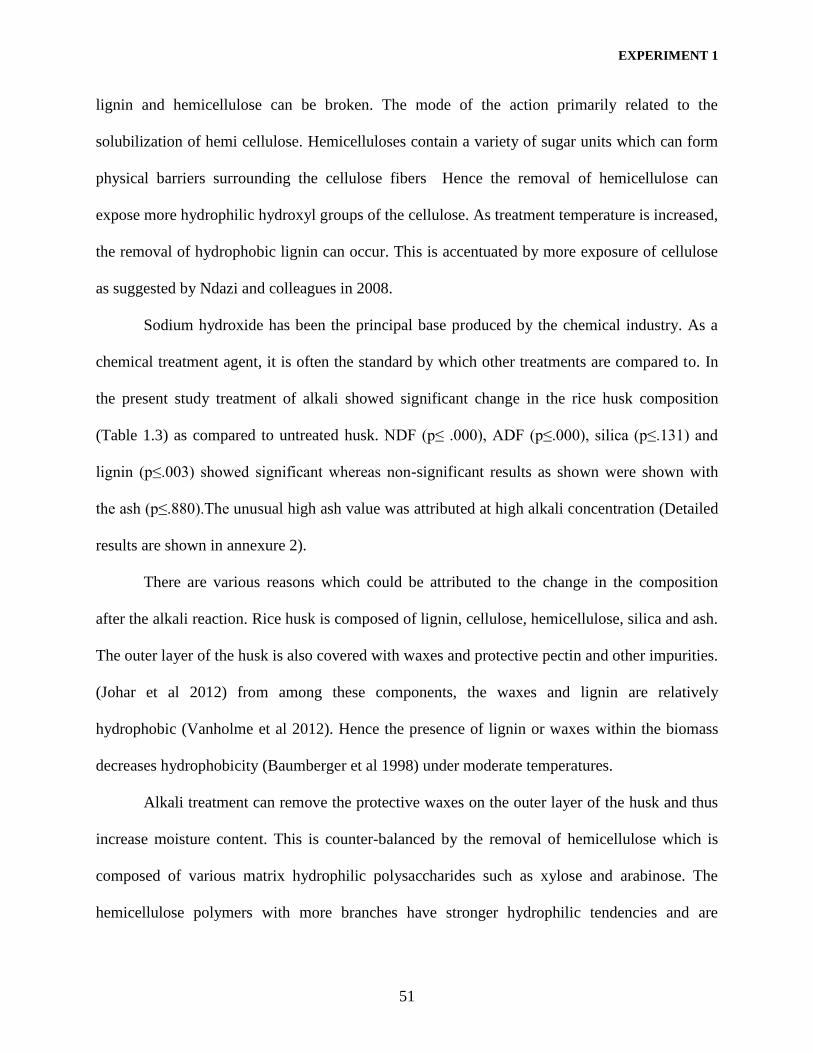
EXPERIMENT 1
51
lignin and hemicellulose can be broken. The mode of the action primarily related to the
solubilization of hemi cellulose. Hemicelluloses contain a variety of sugar units which can form
physical barriers surrounding the cellulose fibers Hence the removal of hemicellulose can
expose more hydrophilic hydroxyl groups of the cellulose. As treatment temperature is increased,
the removal of hydrophobic lignin can occur. This is accentuated by more exposure of cellulose
as suggested by Ndazi and colleagues in 2008.
Sodium hydroxide has been the principal base produced by the chemical industry. As a
chemical treatment agent, it is often the standard by which other treatments are compared to. In
the present study treatment of alkali showed significant change in the rice husk composition
(Table 1.3) as compared to untreated husk. NDF (p≤ .000), ADF (p≤.000), silica (p≤.131) and
lignin (p≤.003) showed significant whereas non-significant results as shown were shown with
the ash (p≤.880).The unusual high ash value was attributed at high alkali concentration (Detailed
results are shown in annexure 2).
There are various reasons which could be attributed to the change in the composition
after the alkali reaction. Rice husk is composed of lignin, cellulose, hemicellulose, silica and ash.
The outer layer of the husk is also covered with waxes and protective pectin and other impurities.
(Johar et al 2012) from among these components, the waxes and lignin are relatively
hydrophobic (Vanholme et al 2012). Hence the presence of lignin or waxes within the biomass
decreases hydrophobicity (Baumberger et al 1998) under moderate temperatures.
Alkali treatment can remove the protective waxes on the outer layer of the husk and thus
increase moisture content. This is counter-balanced by the removal of hemicellulose which is
composed of various matrix hydrophilic polysaccharides such as xylose and arabinose. The
hemicellulose polymers with more branches have stronger hydrophilic tendencies and are

EXPERIMENT 1
52
dissolved more easily in alkali media (Yang Het al 2013).. Moreover treating rice husk with
dilute solutions of NaOH will wash the impurities and also purifies the cellulose moiety present
in the rice husk. It has concluded that all the three treatments effect the composition of rice husk.
Hemicellulose is first to hydrolyze changing the percentage of NDF and ADF significantly.
However higher temperatures, longer treatment, and higher concentration of reagents can remove
some of the lignin content, whereas at lower temperatures the lignin will not degrade
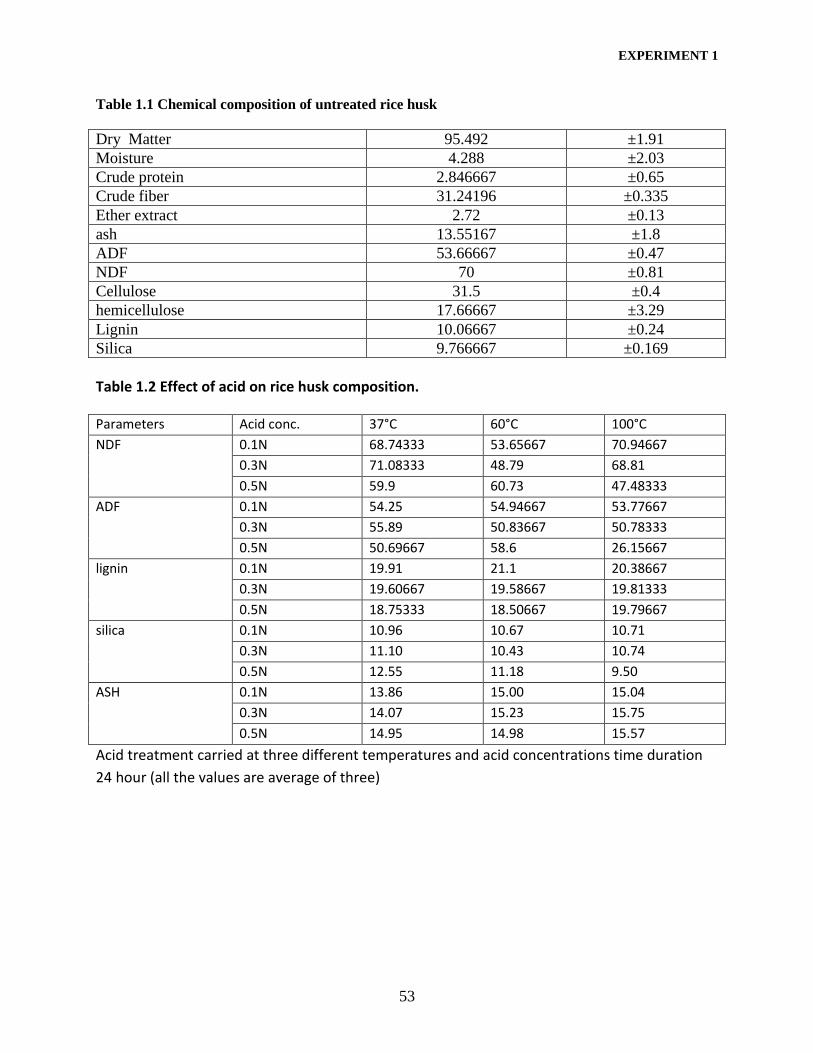
EXPERIMENT 1
53
Table 1.1 Chemical composition of untreated rice husk
Dry Matter 95.492 ±1.91
Moisture 4.288 ±2.03
Crude protein 2.846667 ±0.65
Crude fiber 31.24196 ±0.335
Ether extract 2.72 ±0.13
ash 13.55167 ±1.8
ADF 53.66667 ±0.47
NDF 70 ±0.81
Cellulose 31.5 ±0.4
hemicellulose 17.66667 ±3.29
Lignin 10.06667 ±0.24
Silica 9.766667 ±0.169
Table 1.2 Effect of acid on rice husk composition.
Parameters Acid conc. 37°C 60°C 100°C
NDF 0.1N 68.74333 53.65667 70.94667
0.3N 71.08333 48.79 68.81
0.5N 59.9 60.73 47.48333
ADF 0.1N 54.25 54.94667 53.77667
0.3N 55.89 50.83667 50.78333
0.5N 50.69667 58.6 26.15667
lignin 0.1N 19.91 21.1 20.38667
0.3N 19.60667 19.58667 19.81333
0.5N 18.75333 18.50667 19.79667
silica 0.1N 10.96 10.67 10.71
0.3N 11.10 10.43 10.74
0.5N 12.55 11.18 9.50
ASH 0.1N 13.86 15.00 15.04
0.3N 14.07 15.23 15.75
0.5N 14.95 14.98 15.57
Acid treatment carried at three different temperatures and acid concentrations time duration
24 hour (all the values are average of three)

EXPERIMENT 1
54
Table 1.3 Effect on alkali on rice husk composition
Parameters Alkali Conc. 37°C 70°C 100°C
NDF 2% 70.93333 73 71.15
4 % 69.6 52.65667 66.56667
6 % 74.01333 70.33333 53.70667
ADF 2 % 55.44 41.41667 55.66667
4% 43.25667 39.05 43.45
6 % 58.11667 61.58333 39.82333
LIGNIN 2 % 18.875 18.675 15.175
4 % 18.19667 18.65 17.53667
6 % 18.88333 20.36667 15.93667
SILICA 2 % 10 9.5 12.175
4 % 9.256667 10.03333 11.08
6 % 10 10.20667 11.73
ASH 2% 14.33333 22.89 23.77667
4% 21.12 35.98333 33.71667
6% 44.75667 48.12333 44.86667
Alkali treatments carried at three different temperatures and alkali concentrations time duration
24 hour (all the values are average of three)
Table 1.4 Effect of hydrothermal treatment on rice husk composition.
Parameter Time (min) 37°C 180°C 200°C
NDF 30 71.18 76 54.47333
60 66.03667 67.46667 52.91667
90 69.34 56.45667 58.66667
ADF 30 54.86667 51.78333 57.82333
60 53.1 47.33333 58.6
90 55.6 42.35 58.85
Lignin 30 20.21667 19.70333 18.01333
60 20.13333 17.90667 19.91
90 20.35 18.15 21.5
silica 30 9.7 9.116667 8.423333
60 9.95 8.44 10.28333
90 9.25 7.6 12.45
Ash 30 14.91 14.04 11.48
60 15.28 12.37 11.28
90 15.23 11.80 10.45
Hydrothermal treatment carried at three different temperatures for three different time
duration pH of tap water 6.5 (all the values are average of three)

EXPERIMENT 1
55
REFERENCES
Agbagla, A.D. P. Noziere, G. Clement and M. Doreau, In sacco degradability, chemical and
morphological composition of 15 varieties of European rice straw, Anim Feed SciTechnol,
94, 15 (2001).
AOAC. 1990. Official Methods of Analysis. Association of Analytical Chemists (15th Ed.)
Artington Virginia, USA.
Baumberger S, Lapierre C, Monties B, Della Valle G. 1998. Use of kraft lignin as filler for starch
films. Polymer Degradation and Stability, 59(1), 273-277.
Bazargan A, Gebreegziabher T, C. Hui. 2014. The effect of alkali treatment on rice husk
moisture content and drying kinetics. Biomass and Bioenergy. 70: 468-475.
Bioethanol (2010) http://bluefirethanol.com
Chung YY. 2011. Production of higher heating values of biomass from proximate and ultimate
analyses, Fuel. 9(3): 1128-1132
Johar N, Ahmad I, Dufresne A. 2012. Extraction, preparation and characterization of cellulose
fibers and nanocrystals from rice husk. Industrial Crops and Products, 37(1), 93-99.
Ju X, Engelhard M, Zhang X. 2013. An advanced understanding of the specific effects of xylan
and surface lignin contents on enzymatic hydrolysis of lignocellulosic
biomass. Bioresource technology, 132: 137-145.
Kim TH, Kim JS, Sunwoo C, Lee YY. 2003. Pretreatment of corn stover by aqueous ammonia.
Bioresource Technology, 90(1): 39-47.
Ndazi BS, Nyahumwa CW, Tesha J. 2008. Chemical and thermal stability of rice husks against
alkali treatment. Bio Resources, 3(4), 1267-1277.

EXPERIMENT 1
56
Pasha TN. 1998. Feed resources for livestock and poultry in Punjab, Punjab, Pakistan. Germany
agency for technical cooperation (GTZ), Livestock and Dairy Development Department,
Government of the Punjab, Lahore.C.
Sarnklong, Cone JW, Pellikaan W, Hendriks WH. 2010. Utilization of rice straw and different
treatment to improve its feed value for ruminants.A review.Asian.Aust J Anim. 23(5):
680-692.
Selim ASM, Pan J, Takano T, Suzuki T, Koike S, Kobayashi Y, Tanaka K. 2004. Effect of
ammonia treatment on physical strength of rice straw, distribution of straw particles and
particle-associated bacteria in sheep rumen. Anim Feed Sci Technol. 115:117-128.
Srubar WV, Frank CW, Billington SL. 2012. Modeling the kinetics of water transport and
hydroexpansion in a lignocellulose-reinforced bacterial copolyester. Polymer, 53(11),
2152-2161.
Taherzadeh MJ, Karimi K. 2008. Pretreatment of lignocellulosic wastes to improve ethanol and
biogas production: a review. Int J Mol Sci. 9 (9): 1621–1651
Vanholme R, Morreel K, Darrah C, Oyarce P, Grabber JH, Ralph J, Boerjan W. 2012. Metabolic
engineering of novel lignin in biomass crops.New Phytologist, 196(4): 978-1000.
Vimal K, Tripathi L, Iatinder P, Sehgal, Puniya AK, Singh K. 2007. Effect of administration of
anaerobic fungi isolated from cattle and wild blue bull (Boselaphustragocamelus) on
growth rate and fiber utilization in buffalo calves. Arch AnimNutr. 61: 416- 423.
Yang H, Chen Q, Wang K, Sun RC. 2013. Correlation between hemicelluloses-removal-induced
hydrophilicity variation and the bioconversion efficiency of lignocelluloses. Bioresource
technology, 147: 539-544.

EXPERIMENT 1
57
Yu J, Zhang J, Liu Z, Yu Z. 2009. Combinations of mild physical or chemical pretreatment with
biological pretreatment for enzymatic hydrolysis of rice hull. Bioresource Tech. 100,
903–908.
H.S. Shen, F. Sundstol and D.B. Ni, Studies on untreated and urea-treated rice straw from three
cultivation seasons, Evaluation of straw quality through in vitro gas production and in
sacco degradation measurements, Anim. Feed Sci. Technol, 74, 193 (1998)
S. Van and P.J, Use of detergents in analysis of fibrous feeds. III. Study of effects of heating and
drying on yield of fiber and lignin in forages. J. Assoc. Off. Anal.Chem, 48,785 (1965)
H.G. Jung, and D.A. Deetz, Cell wall lignification and degradability, In H.G. Jung, D.R. Buxton,
R.D. Hatfield, and J. Ralph, eds. Forage Cell Wall Structure and Digestibility. ASA-CSSA-
SSSA, Madison, WI, USA, 315 (1993)
Y. Sun and J. Cheng, Hydrolysis of lignocellulosic materials for ethanol production, Department
of Biological and Agricultural Engineering, North Carolina State University, Bioresource
Technology 83, 1 (2002)

58
CHAPTER 4
EXPERIMENT 2
Nutritive enhancement of Rice husk with Pleurotusflorida through Solid state fermentation
ABSTRACT
Rice husk is one of the abundantly available agricultural wastes in Pakistan. It is always
desirable to use rice husk in ruminant or poultry feed but low protein content and high degree
lignifications are major hazards. In this study we will try to overcome these barriers. Solid state
fermentation (SSF)was the technique employed to ferment rice husk. The strain of white rot
fungi, Pleurotus florida, was provided by fermentation lab of institute of Biochemistry and
Biotechnology (IBBt). The Tien and Kirk basal media was used and sample were taken after
7,14,21 and 30 days. Other experimental conditions like temperature (28C), pH(5.4),water
substrate ratio(35%) were pre-optimized. Analysis for crude protein (CP), neutral detergent fiber
(NDF), acid detergent fiber (ADF) and acid detergent lignin (ADL) was carried out.All the
samples were run in triplicate. An increase of 400% in protein content and 70 % decrease in
lignin was achieved after 21 days of incubation.
INTRODUCTION
Rice paddy (Oryza sativa) contains a rough and hard outer covering, called rice husk
which is inedible for human consumption and is also not being fully incorporated in livestock
feeding (Kumar et al 2010).
Traditionally, rice husk obtained from rice thresher has been used as ingredient in
donkey feeds but the problem of low nutrients digestibility, high silica/ash content and abrasive
characteristics are limiting factors in its utilization. Rice husk is underutilized and highly
available resource. The composition of rice residues including straw and husk has 32-47%, 19-

EXPERIMENT 2
59
27% and 5-24% cellulose, hemicellulose and lignin respectively (Beg et al, 2010). It also have
considerable high amount of silica almost 80% in addition to that 5% of K2O & P2O5 , 4% of
CaO and small amounts of Mg, Fe, and Na is present (Mansary&Galy 1999). The highly
complex nature of rice husk is a barrier for its potential usage.
The feeding value of the poor quality rice husk can be improved through various
biotechnological methods (Selimet al., 2004). Biotechnological methods are simple and specific.
Hence they are methods of choice for improving the quality of poor agricultural residues (Mosier
et al, 2005). The use of appropriate microbe using Solid State Fermentation (SSF) is one of them.
Microbes like fungi are able to degrade lignin, hence increasing rumen microbial accessibility
which in-turn enhance the digestibility. Fermented rice husk can be used for the production of
cheap and good quality protein for poultry/livestock. At present, efforts are being made all over
the world by this method. The modern technological information regarding their culture,
inoculation & harvest has provided sufficient understanding and working tools for the mass
production of biomass protein for poultry and livestock.
White rot fungi are composed of a group of fungus that are capable of degrading
heterogeneous polyphenolic compound called lignin, which is present in huge amount within the
lignocellulose wastes including rice husk (Hendriks 2008). The degeneration of lignin does not
provide net energy so the polysaccharides and carbohydrates complexes present in lignin are
generated during secondary metabolism, which are inaccessible to organisms (Sanchez 2009).
White rot fungi secrete one or more three extracellular enzymes namely manganese peroxidase,
lignin peroxidase and laccase that are fundamental for degradation of lignin, and they are
generally mentioned as lignin modifying enzymes LMEs (Hammel 1997).

EXPERIMENT 2
60
Solid state fermentation (SSF) can use rice husk and straw, wheat bran, fruit and
vegetable wastes, bagasse, synthetic media, coconut coir and paper pulp as substrate. It requires
low water content than the submerged fermentation (Ikram, 2003). All the substrates which can
be utilized are nutrient rich waste materials. So this slow and steady technique not only utilize
rice husk well, but also made it possible to release the nutrients in a controlled manner.
Fungi are the best choice for solid state fermentation due to less requirement of water as
compared to bacteria, which require high water activity (Jahromi, 2010).
The aim of the present study is to explore the rice husk nutritional enhancement attained
through solid state with white rot fungus.
MATERIALS AND METHODS
2.1 Source of microorganism:
Pleurotus florida strain of white rot fungus was obtained from Fermentation Laboratory
of IBBt UVAS, Lahore.
2.2 Maintenance of organism:
The fungus was maintained on Kirks and Tein media slants.
2.3 Inoculum preparation:
The inoculum prepared for the fermentation media was through inoculation of Pleurotus
florida from a slant into autoclaved 100mL Kirk’s and Tein liquid broth. The inoculated flask
was placed on shaker at 130 rmp at 28°C till the OD reached 1.6 at 620 nm. It was used further
to inoculate fermentation batch (Bakkiyaraj et al. 2013).
The fiber and crude protein analysis of substrate
The proximate analysis (crude protein, ash content, NDF, ADF and ADL) of rice husk
was carried out according to AOAC (1990) methods.

EXPERIMENT 2
61
2.4. Solid state fermentation
Basal media was prepared by adding components enlisted in table 1. The procedure was
carried out by optimizing various components of the fermentation process. 100 grams of rice
husk was added in all the twelve flasks. Flasks were sealed with cotton plugs and aluminum foil.
The flasks were autoclaved for 15 min at 121ºC. After autoclaving the flasks were cooled down
and inoculums was added under sterilized conditions Fermentation was carried out using pre
optimized conditions of temperature 28°C and pH 5.5 with 35 % water substrate ratio. The
samples were collected after 7, 14, 21, and 30 days and subjected to crude protein and fiber
analysis.
RESULTS AND DISCUSSION
The experiment conducted showed mycelium covered the husk after 10 days. Fruiting
bodies were not observed after 27 days which is in line with the previous studies.Highest CP
content was after 21 days which showed a decreased trend onward due to the utilization of
available sugars. Fungal treatment reduces the NDF, ADF non-significantly and ADL
significantly. The percentage of NDF and ADF is not the direct measure of digestibility. The
voluntary intake of feed decreased as the percentage of hemicellulose increased.
Up to 27 days very small change in total ash content was observed, which shows little organic
matter loss. Organic matter loss was observed in other studies when rice straw, Sago fiber or
sawdust was fermented using white rot fungus (Vadiveloo 2003a). However this loss is attributed
due to the Primary metabolism and secondary metabolism of the soluble and structural
carbohydrates respectively. Studies with rice straw using Pleurotussajor-caju, (Cohen et al.
2002) suggested that microorganism got accessible to the hemicellulose as the fungus degrade

EXPERIMENT 2
62
lignin and facilitate the digestion (Karunanandaa et al. 1992),significant increase in crude protein
is due to fungal biomass (Hadar et al. 1992) which can be a good source of protein, if
incorporated in lambs diet (Cobos et al., 2002).
White-rot fungi (WRF) are capable of degrading lignin without affecting much of cellulose and
hemicelluloses (Vadiveloo et al 2009) thus causing decayed residue to turn white. WRF attack
unaltered lignin polymers causing cleavage of inter lignol bonds and aromatic ring cleavage,
which ultimately results in an increase in in vitro digestibility (Vadiveloo et al 2009). They
mainly degrade poly-saccharides by hydrolytic enzymes like cellulases and xylanases, and lignin
by oxidative ligninolytic enzymes such as lignin peroxidase (LiP), manganese peroxidase (MnP)
and laccase. White-rot fungi are the most efficient degraders of lignocellulose as they can
degrade cellulose and hemicellulose, as well as lignin (Schmidt 2006).
Lignocellulose-active enzymes that are produced by white-rot fungi are particularly
valuable for biomass conversion, since they can be used to selectively transform both lignin and
polysaccharides (Kirk and Cullen 1998). Using ligninolytic fungi, including their enzymes, can
be a potential alternative to provide more practical and environmental-friendly approach for
enhancing the nutritive value of rice husk.

EXPERIMENT 2
63
Table 2.1 Composition of Basal media for fungus growth.
Sr. No Components (g/100 ml)
1 KH2PO4 0.21
2 CaCl2 0.04
3 MgSO4 0.03
4 Glucose 1.5
5 (NH4)2SO4 0.2
6 Yeast Extract 0.4
Table 2.2 Rice husk composition after 7, 14, 21 and 30 day
of solid state fermentation (SSF) with Pleurotus florida
Day CP NDF ADF ADL
0 3.11± 0.02 69.89±0.84 54.68±0.50 9.73±0.32
7 5.4±0.12 68.62±0.86 53.54±0.33 8.93±0.06
14 7.11±0.09 66.07±0.20 52.65±0.51 7.24±0.2
21 12.98±0.08 63.96±0.61 50.9±0.85 6.87±0.13
30 9.25±0.28 67.13±1.27 51.06±0.62 6.52±0.34
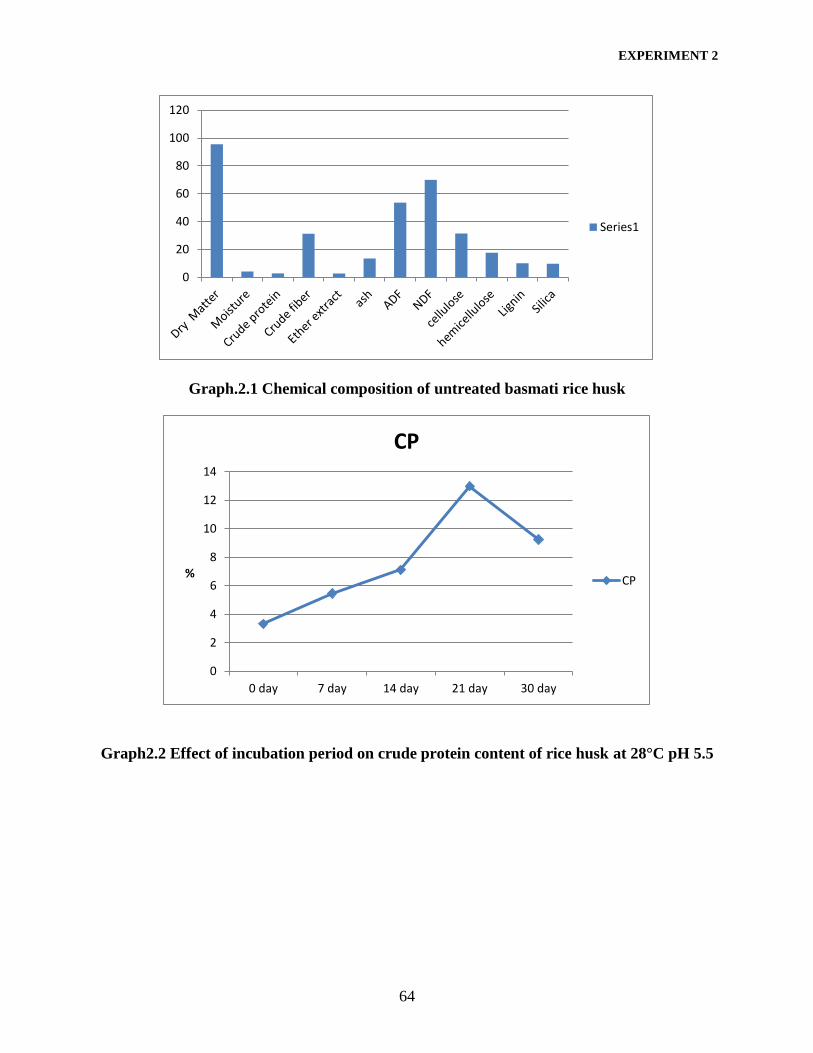
EXPERIMENT 2
64
Graph.2.1 Chemical composition of untreated basmati rice husk
Graph2.2 Effect of incubation period on crude protein content of rice husk at 28°C pH 5.5
0
20
40
60
80
100
120
Series1
0
2
4
6
8
10
12
14
0 day 7 day 14 day 21 day 30 day
%
CP
CP

EXPERIMENT 2
65
Graph2.3.Effect of incubation period on NDF content of rice huskrice husk at 28°C pH5.5
60
61
62
63
64
65
66
67
68
69
70
71
0 day 7 day 14 day 21 day 30 day
%
NDF
NDF

EXPERIMENT 2
66
Graph2.4 Effect of incubation period on ADF content of rice huskrice husk at 28°C pH 5.5
Graph2.5 Effect of incubation period on ADL content of rice huskrice husk at 28°C pH 5.5
49
50
51
52
53
54
55
0 day 7 day 14 day 21 day 30 day
%
ADF
ADF
0
2
4
6
8
10
12
0 day 7 day 14 day 21 day 30 day
%
ADL
ADL

EXPERIMENT 2
67
REFERENCES
Akinfemi A, Adu OA, Doherty F. 2010. Conversion of sorghum stover into animal feed with
white-rot fungi: Pleura/us ostreatus and Pleura/us pulmonarius. Afr J Biotechnol.
9: 1706-1712.
AOAC. 1984. Official Methods of Analysis, 14th ed.Washington, DC.
Beg S, Zafar SI, Shah FH. 1986. Rice husk biodegradation by Pleurotusostreatusto produce a
ruminant feed. Agric.Wastes 17:15–21.
Bakkiyaraj S, Aravindan R, Arrivukkarasan S, Viruthagiri T. 2013. Enhanced laccase production
by Trameteshirusta using wheat bran under submerged fermentation.Int J Chem
Tech Res. 5: 1224-1238.
Cohen R, Persky L, Hadar Y. 2002. Biotechnological applications and potential of wood-
degrading mushrooms of the genus Pleurotus. ApplMicrobiol. Biotechnol. 58:
582–594.
Cobos MA, Garcia LE, Gonzalez SS, Barcena JR, Hernandez DS, Perez-Sato M. 2002.The effect
of shrimp shell waste on ruminal bacteria and performance of lambs.Anim Feed
Sci Technol. 95, 179–187.
Hadar Y, Kerem Z, Gorodecki B, Ardon O. 1992. Utilization of lignocellulosic waste by the
edible mushroom, Pleurotus. Biodegradation 3: 189–205.
Ikram UH, Barque. 2003. Optimization of growth conditions of Arachniotus species on rice
polishings for its protein enrichment. JAnimPlant Sci. 13: 73-77.
Karunanandaa K, Fales SL, Varga GA, Royse DJ. 1992. Chemical composition and
biodegradability of crop residues colonized by white-rot fungi. J Sci Food Agric.
60, 105–112

EXPERIMENT 2
68
Kirk, T. K. & Cullen, D. (1998).Enzymology and molecular Genetics of Wood degradation by
White-Rot Fungi. Environmentally Friendly Technologies for the Pulp and Paper
lndustry. Hoboken, NJ: John Wiley & Sons
Hendriks ATWM, Zeeman G. 2008. "Pretreatments to enhance the digestibility of lignocellulosic
biomass."Bioresource Technology 100(1): 10-18.
Hammel KE (1997) Fungal Degradation of Lignin. In: Cadisch G, Gillier KE (eds) Driven by
Nature: Plant litter quality and decomposition. CAB International, pp 33-45
Jahromi MF, Liang JB, Rosfarizan M, Goh YM, Shokryazdan P, Eo YW. 2010. Effects of
Aspergillus Niger on nutritive value of rice straw African J Biotech. 9: 7043-7047
Mansaray, K.G. &Ghaly, a. E., 1997. Physical and Thermochemical Properties of Rice
Husk.Energy Sources, 19(9), pp.989–1004.
Mosier N, Wyman C, Dale B, Elander R, Lee YY, Holtzapple M, Ladisch M. 2005.Features of
promising technologies for pretreatment of lignocellulosic biomass.Bioresource
Technology 96 (6):673-686
Park BD, Wi SG, Lee KH, Singh AP, Yoon TH, Kim YS. 2003. Characterisation of anatomical
features and silica distribution in rice husk using microscopic and micro-
analytical techniques. Biomass Bioenergy 25: 319–327.
Ramos LP. 2003. The chemistry involved in the steam treatment of lignocellulosic materials.
Quim. Nova 26, 863–871.
Selim, A.S.M., J. Pan, T. Takano, T. Suzuki, S. Koike, Y. Kobayashi and K. Tanaka
(2004).Effect of ammonia treatment on physical strength of rice straw, distribution of
strawparticles and particle-associated bacteria in sheep rumen.Anim Feed Sci
Technol.115: 117–128.

EXPERIMENT 2
69
Sanchez C (2009) Lignocellulosic Residues - Biodegradation and bioconversion by fungi.
Biotechnology Advances 27:185-194
Schmidit O (2006) Wood and Tree Fungi. Biology, Damage, Protection and Use. Springer-
Verlag, New York
Vadiveloo, J. (2003a). Solid-state fermentation of fibrous residues. J Anim Feed Sci. 12, 665–
676.
Vadiveloo, J., B. Nurfariza and J. G. Fadel (2009). Nutritional improvement of rice
husks. Animal Feed Sci Tech. 151(3): 299-305.

70
CHAPTER 5
EXPERIMENT 3
Effect of acid and alkali on surface modification of rice husk
ABSTRACT
Rice husk is a notable fraction of lingo-cellulosic waste, abundantly available in rice producing
countries. Its utilization in ruminant feed is always center of interest in agricultural communities.
Various methods of its utilization are adopted in far and near past. In the present study the acid
(H2SO4) and alkali (NaOH) were used to treat the rice husk. The dissolved sugars were not
recovered. The objective of the study was to explore implication of the acid and alkali treatments
on rice husk composition and structure that will ultimately have an impact on the rice husk
digestibility. The treatment was carried out using two reagents: sulphuric acid (H2SO4) and
sodium hydroxide (NaOH), in three different concentration (0.1N, 0.3N, 0.5N and 2%,4%,6%
respectively) and temperature ranges(25°C,70°C,100°C). Compositional analysis of untreated
and treated rice husk was carried out. Surface modification was assessed using Fourier transform
infrared spectroscopy (FT/IR) and Scanning electron microscopy (SEM). The results showed that
even a mild treatment with acid and alkali produces visible changes in the topology. Certain
bond vibrations were also demonstrated, although little variation was observed in compositions.
This study showed that a mild treatment, which is otherwise harmless for ruminant consumption,
can be used to alter the topology and bond vibrations of rice husk, making it an easy target for
ruminal micro flora.
INTRODUCTION
Rice husk is one of the important agricultural wastes, abundantly available and has the
potential to be converted into various value added products. As the production of rice is
increasing in developing industries, the amount of husk is also increasing causing disposal
problem for farmers. (Lim et al. 2012).Both acid and alkali act as a reagent of choice for treating
lingo-cellulosic residues for the simple reason of being cheap and easy. Plant cell wall is
susceptible to acid particularly their hemicellulose component. To attain the desirable hydrolysis
it is important to determine the optimum concentration, temperature and amount of reagent used.

EXPERIMENT 3
71
Alkali has also the potential of modifying cell wall, which is well documented. Alkali acts by
two mechanisms, one is solvation and other is saponification. These two process results in the
swelling of biomass, which make inner space, access an easy task. (Bazargan 2014)Alkali
treatments also reduce lignin partially. The other constituents of cell wall namely xylan and
lignin supports the cellulosic backbone of cell wall, forming a stable matrix. As xylan and lignin
support the cellulose back bone that constitutes the cell wall biomass. Although ammonia has
been widely used leading to environmental issues. In the present study we used NaOH which is a
cheaper source than ammonia. (Selim et al 2002).
The composition of rice husk is 32.24%, 21.44% and 21.34% of cellulose, hemicellulose and
lignin. Although composition varies from one variety to another, and even seasonally in a single
variety (Isa et al 2011) the cellulose and hemicellulose and lignin are associated with each other
forming a very stable matrix structure. The structure of rice husk reveals the presence of wax and
natural fat on its inner surface. Their presence on the other hand provides protection for the
grain, but also effect quality of husk both physically and biologically (Agbagla-dohnani et al
2001).
Chemical modifications of rice husk surface can upgrade or improve the rice husk quality
utilization (Vadiveloo 2009) Treatment of rice husk with organic and inorganic acids has been
established to improve its quality by delignification and reducing the silica content. The present
work focuses on the development of low cost acid, alkali treatments to change the surface
properties of rice husk for their subsequent use in animal feed stuffs, energy production and as
adsorbents. The effect of treatments on surface function groups were also investigated, along the
topology of rice husk (LiC 2010, LiQ 2009).
Material and methods
Treatment of rice husk with acid and alkali
The rice husk was obtained from local threshing mill, it was washed using distilled water and
then air dried. To modify the surface characteristic chemical treatment was carried out using acid
(H2So4) and alkali (NaOH). The two different concentrations of sulphuric acid (0.3, and 0.5N)
were used. The rice husk was treated for 15 minutes at 100°C. Reagent loading was optimized as
10 gram husk was soaked is 50ml of acid. There different cone of alkali NaOH (2%, 4%, and
6%) were used. Treatment duration and temperature was 24 hours and 70C0the pre-optimized
reagent loading was 10 gram husk to 80ml of NaOH. All the five samples along with one control

EXPERIMENT 3
72
untreated sample was subjected to scanning electron microscopy and FT/IR for the study of
structural and functional group modifications.
Fourier Transform Infrared (FT/IR) Spectroscopy Procedure
KBr salt was mixed with sample in 3:1 ratio. Mixture was grinded to get homogenous
powder.Small amount placed in pellet assembly and pressed very firmly to form transparent
pellet. Fourier transform infrared spectroscopy (Midac Corporation Model 2000) was done by
giving command of 32 scans. Structural changes were analyzed in the region of 600-400cm-1.
Scanning Electron microscopy (SEM)
SEM microscopy was done using electron microscope JSM 648 operated at 10 KV under low
vacuum. Samples were devoid of any moisture content.
Results and discussion
The treated rice husk was characterized in terms of compositional analysis and morphological
characteristic by FT/ IR and scanning electron microscopy.
Structural characterization
FT-IR and SEM analysis
Rice husk is predominantly composed of cellulose hemicellulose and lignin. It also has a
significant percentage of silica. Cellulose chains cemented by lignin and reinforced by silica
make it a harder choice for digestion, but if these linkages were hydrolyzed up-till certain extent
digestibility can be increased. The effect of various concentrations of acid and alkali on the
dissolution of rice husk was investigated in this experiment, results showed that acid and alkali
treatments did not completely dissolute the rice husk. Alkali treatment at 70C0 for 24 hours
dissolves hemicellulose more effectively with 4% alkali. As the concentration of alkali increases
no further degradation takes place rather the increased concentration of alkali leads to the
increased ash content. However it is concluded acid and alkali treatments did not show many
changes in lingo cellulosic composition of rice husk.
Analysis by FT-IR and SEM was done for the closer look on the effect of acid and alkali on rice
husk. Two techniques were employed for the detailed impact of chemical treatment. Analysis
was done by FT/IR spectroscopy by using the range of 600-4000cm-1. The structural changes in
the treated rice husk and untreated rice husk were studied. The reagent showed higher intensity
band at 799 cm-1 indicated our productivity. Treated samples shows reduced absorbance at

EXPERIMENT 3
73
1033cm-1 (graph 1).The absorption bands at 794, 1033, 1457, 1511, 1635, 2916, 3312, 3748
798, 1035, 1457, 1513, 1637, 2919, 3312, and 3750 Cm-1 in the untreated rice husk samples
corresponds to lignocellulosic region. The group frequencies are shown in Table 3.1, along with
their respective role. The banding present shows the presence of strong lignin carbohydrate
matrix in all the treated samples corresponds to asymmetric bending present of CH3 and OCH3
present in lignin which is in line with the studies carried by Angand colleagues in 2012.The
spectra of treated and untreated husk samples are shown in Graph 3.1.
The results also showed that treatment also reduces -H stretching at 2896cm-1 and OH stretching
at 3312. The disappearance of absorption bands at 1457cm-1alsosuggested some removal of
lignin reported by Labbe 2005. The chemical composition of rice husk mainly corresponds in the
region ranges from 800-1513cm-1 and 2995-4000. The most distinct peak at 1388 in our study
corresponds to asymmetric bonding present in lignin, emphasizing the fact as rice husk has the
highest lignin contact in agriculture residues. The peaks lies in the region corresponding to C-O
stretch vibration in cellulose, hemi- cellulose and lignin of untreated husk showed a shift after
the treatment, 617, 725, 1157, 1141, 2800, 2969, has been shifted to disappearance in treated
samples to 717, 1133, 1419, 1434, 2784, and 2946 repetitively as depicted in Table 3.2.The
shifting banding pattern also showed the structural disruption.
Images taken from SEM are shown in fig 3.1The images show significant surface modifications
of rice husk residue. The image of untreated rice husk show a smooth and even texture, on the
other hand the topology of the treated husk changed. The SEM image shows that the surface
appeared to be swollen comparatively to untreated. Epidermis cracks are clearly visible in alkali
treated husk. In acid treated swelled husk is visible along with shiny silica particles which are in
line with previous studies (Coates 2000).
This study found that mild treatment of rice husk with acid and alkali (NaOH) can alter the
surface structure significantly, although little changes in chemical composition are recorded. The
suggested treatment is beneficial for the conversion of rice husk into value added products.

EXPERIMENT 3
74
Table 3.1 Reference table for group frequencies of respective function groups
Cm-1 Functional
group
Corresponding bonding Ref
800-950 OH Free and hydrogen bonded OH-stretching Labbe et al 2005
950-
1035
C-H Stretching in cellulose rich material Guo et al 2008
1035-
1457
OH O-H bonding vibration of observed water
molecule
Hurtubise&Krassing
1960
1457-
1513
C=C-cx Aromatic skeleton stretch in lignin Hsu.T et al 2010
1513-
1637
C-H Asymmetric bending present in CH3 and
O-CH3 present in lignin
Liu et al 2007
1637-
2919
C-O C-O stretch vibration in cellulose hemi
cellulose and OH in lignin
Lee et al 2009
2919-
4000
C-H Deformation vibration in cellulose Ang et al 2012

EXPERIMENT 3
75
Table 3.2 Absorbance of treated and untreated samples (SS1=untreated husk SS2=
2%NaOH treated, SS3 =.5 N H2SO4 treated, SS4 = 4%NaOH treated husk)
Absorbance
band
Absorbance
SS1 SS2 SS3 SS4
794.53 70.8 60.48 62.99 57
1033 61.5 47.49 52.73 49.38
1457 41.6 25.9 28.9 21.36
1511 49.05 39.18 42.17 34.44
1635 51.98 41.96 43.4 42.3
2916 39.65 38.9 35.7 36.7
3312 45.39 31.38 33.45 33.83
3748 46.29 .0003 17.09 69.009

EXPERIMENT 3
76
Figure 3.1 FT-IR spectra of treated and untreated rice husk 1= untreated husk, 2 =2%
NaOH 3=.5%H2SO4, 4= 4% NaOH
Figure 3.2 Electron micrograph of rice husk treated with 0.3 N sulphuric acid

EXPERIMENT 3
77
Figure 3.3 Electron micrograph of rice husk treated with 0.5 N sulphuric acid

EXPERIMENT 3
78
Figure 3.4 Electron micrograph of rice husk treated with 2 % sodium hydroxide
Figure 3. 5 Electron micrograph of rice husk treated with 4 % sodium hydroxide

EXPERIMENT 3
79
Figure 3.6 Electron micrograph of untreated rice husk

EXPERIMENT 3
80
REFERENCES
Ang TN, Ngoh GC, Chua ASM, Lee MG. 2012.Elucidation of the effect of ionic liquid
pretreatment on rice husk via structural analyses.Biotechnol Biofuels5, 67-77.
Ang TN, Ngoh GC, Chua ASM. 2009. Pre-treatment of rice husks for fungalfermentation. Int J
Chem Eng. 2:197–202.
Bazargan A, Gebreegziabher T, Hui CW, McKay G. 2014. The effect of alkali treatment on rice
husk moisture content and drying kinetics. Biomass and Bioenergy. 70: 468-475.
Chung YY. 2011. Production of higher heating values of biomass from proximate and ultimate
analyses, Fuel. 9(3): 1128-1132
Coates J. 2000.Interpretation of infrared spectra, a practical approach.Chichester:John Wiley &
Sons Ltd.
Guo GL, Chen WH, Chen WH, Men LC, Hwang WS.2008. Characterization ofdilute acid
pretreatment of silvergrass for ethanol production. BioresourceTechnol. 99:6046–
6053.
Hsu TC, Guo GL, Chen WH, Hwang WS.2010. Effect of dilute acid pretreatmentof rice straw on
structural properties and enzymatic hydrolysis.Bioresource Technol. 101:4907–
4913.
Hurtubise FG, Krassig H. 1960.Classification of fine structural characteristics incellulose by
infrared spectroscopy. Anal Chem. 32:177–181.
Kuo CH, Lee CK. 2009.Enhancement of enzymatic saccharication of celluloseby cellulose
dissolution pretreatments.Carbohydr Polymer. 77:41–46.

EXPERIMENT 3
81
Labbe N, Rials TG, Kelley SS, Cheng ZM, Kim JY, Li Y. 2005.FTIR Imaging andpyrolysis-
molecular beam mass spectrometry: new tools to investigatewood tissues. Wood
Sci Tech. 39:61–77.
Lee SH, Doherty TV, Linhardt RJ, Dordick JS.2009. Ionic liquid-mediated selectiveextraction of
lignin from wood leading to enhanced enzymatic cellulosehydrolysis.
BiotechnolBioeng. 102:1368–1376.
Li C, Knierim B, Manisseri C, Arora R, Scheller HV, Auer M, Vogel KP, Simmons BA, Singh
S. 2010. Comparison of dilute acid and ionic liquid pretreatment of switchgrass:
biomass recalcitrance, delignification and enzymatic saccharification. Bioresource
Technol. 101:4900–4906.
Li Q, He Y, Xian M, Jun G, Xu X, Yang J, Li L. 2009.Improving enzymatic hydrolysis of wheat
straw using ionic liquid 1-ethyl-3-methyl imidazolium diethyl phosphate
pretreatment.Bioresource Technol. 100:3570–3575.
Liu CF, Sun RC, Zhang AP, Ren JL.2007. Preparation of sugarcane bagassecellulosic phthalate
using an ionic liquid as reaction medium. CarbohydrPolymer 68:17–25.
Mansaray, K.G. &Ghaly, a. E., 1997. Physical and Thermochemical Properties of Rice
Husk.Energy Sources, 19(9), pp.989–1004.
Selim ASM, Pan J, Takano T, Suzuki T, Koike S, Kobayashi Y, Tanaka K. 2004. Effect of
ammonia treatment on physical strength of rice straw, distribution of
strawparticles and particle-associated bacteria in sheep rumen.Anim Feed Sci
Technol.115, 117–128.

EXPERIMENT 3
82
Vadiveloo J, Nurfariza B, Fadel JG. 2009. Nutritional improvement of rice husks. Ani Feed
SciTech.151 (3-4): 299-305

83
CHAPTER 6
EXPERIMENT 4
To investigate the feeding value of processed rice husk in growing Lohi sheep
ABSTRACT
Rice husk was subjected to different processing techniques using acid, alkali, water treatment
and fermentation to prepare various processed moiety on pilot scale. All these processed
materials were included in experimental ration up to 20 % level. All iso-caloric and iso-
nitrogenous rations were offered to experimental animals having almost uniform body weight
(BW). During 60 days of trial, weekly weight gain daily feed intake and weekly FCR was
calculated. Result revealed maximum weight gain and best feed conversion ratio (FCR) was of
group consuming fermented husk. No mortality was observed.
Key words: Fermentation, FCR, Acid, Alkali, crude protein.
INTRODUCTION
Rice is the staple food for more than half of the world population. Pakistan produces
6748 million tons rice annually, almost 20 % of which is husk Pakistan economic survey (2014).
Pakistan is an agricultural country and its economy is mainly based on agriculture and livestock
production. Green and dry roughages are the most important livestock feed in the country. The
dry roughages are comparatively much cheaper as compared to green fodders and are usually the
cereal crops residues in the form of straws, stover and husk. The present forage production is not
coping with the feeding requirements of livestock in Pakistan. Pakistan is deficient by 40% in
forages and 80% in concentrate feed Pasha (1998). Stresses for the exploitation of new feed
resources and the interest for utilization of low quality crop residues like rice husk as an animal
feed have been increased.

EXPERIMENT 4
84
This crop residues have poor nutritive value (low CP, high lignin content), characterized
by poor digestibility and hence their intake is also low. Energy is limited due to lignocellulosic
bonds Sarwaret al. (1994). The silica present in the rice husk is a major barrier to its digestion,
Agbagla-Dohnaniet al. (2003) explained that silica prevent parenchymal tissue from degradation.
The rice husk has 20% silica presents in outer epidermal wall, which increases the abrasive
character of rice husk Park et al. (2003), silica exists as highly compact carbon-silicon
composite. Lignin has bonding with cellulose which further makes it hard for digestion. The
higher lignin content further makes it a harder choice. Although rice husk is potential animal
feed very few studies on its varietal differences, chemical treatment effects, response to solid
state fermentation and in vivo feeding trials were conducted in Pakistan.
Biochemical conversion of lingo-cellulosic biomass into value added products is a
subject of great interest. To achieve this purpose it is important that structure of the cellulosic
biomass should be modified in such a manner, that they become accessible to enzymatic
degradation Mosier et al. (2005). Various chemical and biological treatments involve these
structural changes, which result in high yields in less time.
Physical and chemical treatments with acid, alkali and steam under pressure break
covalent and non-covalent bonds between lingo-cellulosic components; it has the capacity to
hydrolyze hemicellulose and to some extent de-lignified the rice husk. Biological treatment of
lingo-cellulosic material, solid state fermentation using white fungi improve its protein content
and digestibility. This degradation is mentioned by the enzymes secreted by white rot fungi
mainly consist of lignin degrading enzymes and auxiliary enzymes Ang et al. (2009)
The livestock of Pakistan is producing below their optimum potential because of poor
availability of fodder in terms of quantity as well as quality. By using the value added crop

EXPERIMENT 4
85
residues in the diet of cattle, it will enhance the production (milk/ meat) of animals resultantly a
solution to overcome the shortage of green fodder in lean periods and ensure consistent supply of
feed for the livestock, consequently improved health of the under nourished people Sarnklonget
al. (2010).
The objective of the present studies is to explore the prospectus of chemical and
biologically treated husk as a small ruminant feed.
MATERIAL AND METHODS
Alkali and acid treatment
The husk of Basmati rice (Oryza sativa) was procured from local threshing mill and
brought to fermentation lab of Biochemistry at UVAS. Alkali treatment was carried using 4 %
NaOH for 24 hours at the ambient temperature of 25°C. Husk to NaOH pre-optimized ratio was
2:1. After 24 hours no residual alkali was present in mixture.
In the second treatment rice husk was treated with 0.5N H2SO4 for 24 hours at same
temperature as that of alkali treatment. The pre-optimized ratio of husk to acid was 3:1. Both
acid and alkali treated samples were dried and analyzed for the fiber content, CP, and total Ash
content AOAC 1990.
Hydro thermal treatment
For this application water was added to the husk. pre-optimized husk to water ratio was
1:3.Husk was kept boiling for 60 minutes Very little residual water was present after the boiling,
which was then air dried for two days at 25°C (room temp).
Solid state fermentation
Untreated rice husk was fermented by Pleurotus florida at 28°C in the dark for 21 days
without supplementation. Conditions for fermentation were pre-optimized. A mixed mixture

EXPERIMENT 4
86
(turn which basal media) was added to ensure moisture content of 35%. The fermentation was
carried out in wide mouth plastic containers with once in 24 hour agitation. Containers were
sterilized using ethanol before the commencement of fermentation process. Fermentation
duration in this study was 30 days.
All treated samples were subjected to chemical composition for CP, NDF, ADF, TDN (total
digestible nutrients), E,E (ether extract).and ash contents and large scale preparation of total
mixed ration was carried out.
To determine feeding value of all above treated rice husk, a biological trial of 60 days
was conducted at Ravi campus Pattoki. Before the trial 10 days were given as preliminary
period.
Feeding trials of Lohi sheep
The objective of this study was to use treated rice husk as a cheap source of dietary ingredient of
small ruminant feed. As rice husk has poor nutritive value and abrasive texture leading to limited
utility as a ruminant feed. All processed rice husks were included in concentrate ration to
determine nutritive ability and digestibility. For this purpose 36 sheep of mixed sexes but of
uniform weight and age were randomly divided into 6 groups each having three replicates.
Experimental animals and their management
All the experimental lohi sheep with 8-9 months age and average body weight (24±5) kg
at the beginning of the experiment. Sheep were fed ad libitum twice daily (09.00 and 16.00
hours) in cemented managers. After the morning feeding all sheep were let loose in open
paddock throughout the experimental period except during extreme weather. Sheep were housed
and managed in replicates in well ventilated shed with concrete floor. Daily sweeping and
cleaning of floors was practiced to provide good hygienic environment. Fresh water was

EXPERIMENT 4
87
provided. Replicate feed intake was recorded daily by measuring the amount of refused before
the morning feeding. Composition of experimental rations is depicted in table 1.
Parameters studied
Daily Feed intake was recorded daily. This was done by subtracting the amount of refusal
from the feed offered before the morning feeding. Sheep were weighed weekly to monitor the
growth rate after restriction of feed and water intake for 16 hours throughout the experimental
period by using an electronic scale. Data thus collected were used to calculate feed efficiency.
RESULTS AND DISCUSSION
Weekly intake and weight gain of Lohi sheep is illustrated in Table 3.The total DM
intake of all the six groups ranged between 975± 68to 1092±77 grams per day and weekly
weight gain ranges from 0.7±0.1 to 0.977±.052 Kg/week. Highest intake was found with the
water treated husk and lowest with the untreated husk. This intake is in line with the results
obtained earlier fattening trials of lohi sheep Jabbar and Anjum (2008). Although for some
foreigner breeds an exceptional high intake of 6.4±7.4% of body weight was reported El Hag and
Al-Shargi (1998). Initial weight gains of animals were significantly high but the subsequent
weight gain followed the uniform pattern as shown in graph 1. This is perhaps due to the shifting
of animals from grazing and consequently average daily gains follow the pattern which is in line
with previous studies. Growth rate followed the linear pattern for all the six groups. Lambs
growth rate depends upon feed intake rather than the duration of the intake Butter®eld (1988). In
the present study growth rates obtained were almost the same as that of tropical breeds Gatenby
(1986); Kusinaet al. (1991), although they are slightly lower than those using conventional
rations for the same breed Jabbar and Anjum (2008).

EXPERIMENT 4
88
It is also found that high energy diets were more efficient, as efficiency is the function of
weight gain and dry matter intake. Interpretation is difficult as energy used for maintenance is
not distinguished from energy used for weight gain. It is found that increased protein content
results in the better values of feed conversion ratio (FCR), supported by the studies of Kusina et
al. (1991); Butter®eld (1988). The FCR found in the current study were better than previously
reported, for the same breed. The treatments increased the digestibility and palatability of rice
husk which is proved in in vitro digestibility trials, although DM intake was reduced. Previous
study using agricultural by products showed 11.5 and 12.4 FCR in sheep El Hag and Al-Shargi
(1995). Whereas diets based on Rhodes grass hay Chesworth et al. (1996) showed a remarkably
good FCR of 5.48 and 6.02.This study found significant difference between the groups shown in
table 3. As far as the economy of rice husk was concerned it is comparable to the conventional
ration. Water treated husk due to large intake and poor FCR placed it most expensive in the
group .Current study fully support the use of rice husk as a convenient replacer of conventional
wheat straw.

EXPERIMENT 4
89
Table 4.1 Ration formulations of various groups
Ingredients (%)
positive
Control
(PC)
Alkali
treated
(B T)
Acid
treated
(AT)
Hydrothermal
Treated
(HT)
Fermented
(FT)
Negative
Control
(NC)
Corn, Grain 21.00 21.00 22.00 22 22.00 20.00
Wheat Bran 14.00 15.00 15.00 15 15.00 16.00
Rice Polish 10.00 11.00 11.00 10 12.00 10.00
Molasses (S Cane) 7.00 7.00 7.00 7.00 7.00 7.00
Canola Meal 8.00 8.00 8.00 8.00 8.00 8.00
Sunflower Ml 8.00 8.00 8.00 8.00 7.00 8.00
Corn Gluten Ml
30%
10.00 8.00 7.00 8.00 7.00 9.00
Cmn Salt NaCl 0.50 0.50 0.50 0.50 0.50 0.50
Sodium Bi
Carbonate
0.50 0.50 0.50 0..50 0.50 0.50
Min Mix
(Ruminants)
1.00 1.00 1.00 1 1.00 1.00
Wheat Straw 20.00 20.00(RH) 20.00
(RH)
20 (RH) 20.00
(RH)
20.00
(RH)
Table 4.2: Nutritional Profile of various Rations
Parameter PC NC AT B T HT Fermented
husk
CP 14.95 14.99 15.22 15.28 15.31 15.36
C.F 14.77 13.03 13 11.08 12.20 12.83
NDF 14.59 14.75 9.57 10.41 14.54 14.06
ADF 9.45 11.29 5.30 7.66 11.87 12.22
TDN 64.65 62.72 64.75 65.15 65.02 66.07
E.E 3.91 3.77 3.91 3.95 3.88 4.04
M.E 2.30 2.21 2.26 2.28 2.15 2.29
ASH 6.57 7.06 7.41 7.60 7.05 7.23

EXPERIMENT 4
90
Table 4.3: Growth performance and economics of Lohi sheep fed on differently treated rice
husk a wheat straw replacer
PC FT NC BT AT HT
Daily feed
intake g
1040.91±91
7
1061.08±9
6
975.68±68.
7
1058.66±7
1
1040.91±9.
7
1092.61±7.
5
weekly
weight
gain Kg
0.977±.052 0.972±0.18 0.729±0.11 0.922±0.18 0.935±0.19 0.7±0.10
Feed
conversio
n ratio
11.69±1.401 7.679±0.89 9.924±1.2 8.09±1.26 8.008±1.5 11.131±1.4
4

EXPERIMENT 4
91
Graph 4.1. Weekly Weight Gain
Graph 4.2 weekly average feed intake
0.00
10.00
20.00
30.00
40.00
week1
week2
week3
week4
week5
week6
week7
week8
week9
Bo
dy
Wei
ght(
Kg)
Weekly Weight Gain
Control
Husk
Fermented
Alkali
Acid
Water

EXPERIMENT 4
92
Table 4.4 No. Daily Feed intake per week
1st Week 2nd Week 3rd Week 4rth Week 5th Week 6th Week 7th Week 8th Week 9th Week
C 871.5 975.9167 984.0833 941.5 1059.917 1098.417 1080.333 1150.917 1174.833
H 884.3333 1061.667 999.25 943.25 1087.917 1120 1139.833 1143.917 1206.917
F 792.1667 888.4167 896 842.9167 984.0833 1044.167 1015.583 1044.167 1157.333
B 903.5833 1024.333 957.8333 964.25 1094.333 1180.667 1171.333 1162.583 1269.333
A 866.8333 987 1008.583 936.8333 1071.583 1148 1129.333 1162 1235.5
W 926.9167 1041.25 1036.583 1020.25 1123.5 1229.667 1257.083 1288.583 1331.167

EXPERIMENT 4
93
REFERENCES
Agbagla- D., Noziere P., Gaillard.M.,Puard.M., and Doreau. M (2003). Effect of silica on rice
straw ruminal degradation The.JAgriSci 140(2) 183-192
Ang TN, Ngoh GC, Chua ASM. 2009. Pre-treatment of rice husks for fungal fermentation. Int J
Chem Eng. 2:197–202.
AOAC. 1990. Official Methods of Analysis. Association of Analytical Chemists (15th (Ang et
al. 2013)(Ang et al. 2013)Ed.) Artington Virginia, USA.
Butter®eld, RM. 1988.New Concepts in Sheep Growth. University of Sydney, Australia, 168.
Chesworth JM, Byerley DJ, Mahgoub O. 1996. Evaluation of whole date palm frond as a forage
source for sheep, Anim. Sci 62, 664, (Abstr.).
El-Hag MG, Al-Shargi KM. 1998. Comparative performance of goats and sheep fed on high-
®ber pelleted diets supplemented with different nitrogen sources. J ApplAnim
Res. 13, 179±184.
Gatenby RM. 1986.Sheep Production in the Tropics and the Sub- Tropics. Longman, New York,
USA, p. 351
Jabbar MA. Anjum1 MI. 2008.Effect of diets with different forage to concentrate ratio
forfattening of lohi lambs. Pak Vet J. 28(3): 150-152.
Kusina NT, Hale DH, Chesworth JM, Mutisi C. 1991.Effect of the amount of dietary energy on
growth and body composition of Sabi lambs. In: Isotope Aided Studies on Goat
and Sheep Production in the Tropics. International Atomic Energy Agency,
Vienna, pp. 13±27.

EXPERIMENT 4
94
Mosier N, Wyman C, Dale B, Elander R, Lee YY, Holtzapple M, Ladisch M. 2005. Features of
promising technologies for pretreatment of lignocellulosic biomass.Bioresource
technology, 96(6), 673-686.
Park, B. D., S. G. Wi, K. H. Lee, A. P. Singh, T. H. Yoon and Y. S. Kim (2003).
Characterisation of anatomical features and silica distribution in rice husk using
microscopic and micro-analytical techniques. Biomass Bioenergy 25: 319–327.
Pasha TN. 1998. Feed resources for livestock and poultry in Punjab, Punjab, Pakistan. Germany
agency for technical cooperation (GTZ), Livestock and Dairy Development
Department, Government of the Punjab, Lahore.
Sarnklong C, Cone JW, Pellikaan W, Hendriks WH. 2010. Utilization of Rice Straw and
Different Treatments to Improve Its Feed Value for Ruminants: A Review. Asian-
Australasian J Anim J Anim Sci.23(5), 680–692. doi:10.5713/ajas.2010.80619.
Sarwar M, Iqbal MA, Ali CS and Khaliq T. 1994. Growth performance of buffalo male calves as
affected by using cowpeas and soybean seeds as a source of urease during urea
treated wheat straw ensiling process. Egyptian J Anim Prod.2: 179.
Van-Soest, P. J., J. B. Robertson and B. A. Lewis (1991).Method for dietary fiber, neutral
detergent fiber and non-starch polysaccharides in relation to animal nutrition.J Dairy Sci.
74, 3583–3597.

95
CHAPTER 6
SUMMARY
Pakistan is mainly an agriculture country. Livestock is an integral part of the Agricultural
economy unfortunately Livestock in Pakistan is producing for below its full potential. The main
reason this poor performance is the shortage of fodder quantitatively and qualitative. Therefore,
to overcome the shortage of green fodder, we have to export the conventional and non-
conventional sources of feed. Pakistan is one of the major producer of rice in Asia, that’s shy rice
husk which is a by-product of rice threshing process in frequently and cheaply available. In this
study we study this underutilized source, by applying various treatments, evaluating their impact
on husk topology and itsimpart on husk topology and its impact on ruminant feeding.
In the first two experiments, the rice husk was subjected to acid, alkali, and water
treatment at various temperature and concentration, we found a significant effect of temperature
on rice husk (P>0.001). Whereas concentration in case of alkali treatment produced significant
results (P?0.001). Topology of rice husk 4 bond specific bond vibrations was studied with the
help of FT/IR and scanning electron microscopy.
Electron micrographs showed swelling and even cracking of the epidermises. FT/IR results
demonstrate a change in the absorbance in the polysaccharide bonding region.
The third experiments deals with the enhancement of nutritive value of rice husk by SSF
using Pleurotusflonda. Experiment shows significant increase in the CP and decrease in the total
lignin content (P> 0001.
Finally in the fourth experiment a ration having 20% differently procured husk were
feeded to the small ruminant (Lohi Sheep) and the an average weekly weight gain comparable
feed intake and FCR were found comparable with control.

SUMMARY
96
The data was analyzed using Mintab version 20:01. It is concluded that improving the
quality of certain under utilized agricultural residue can minimize the feed gap in Pakistan. Rice
husk is a valuable and acceptable source of fed for ruminant and there is need to educate the
small farmer to break this myth.

97
Annexure 1
Table 1. Projections of Population in Major Rice Producing and Consuming Countries in Asia, 1995 to 2025
Country Population (mill.) 1995
Annual Growth Rate (% per year)
Projected Population
(mill.) in 2025
Percent Increase
1995-2025 1995-2000 2020-2025
China 1199 0.9 0.5 1471 23
India 934 1.7 1.0 1370 47
Indonesia 192 1.4 0.8 265 38
Bangladesh 121 1.8 1.1 182 50
Vietnam 74.1 2.0 1.2 117 58
Thailand 60.5 1.3 0.7 80.8 34
Myanmar 46.8 2.1 1.1 72.9 56
Japan 125 0.3 -0.3 124 -1
Philippines 69.2 2.2 1.2 115 66
Rep. of Korea 44.8 0.8 0.3 52.9 18
Pakistan 130 2.7 1.6 243 87
Asia (excluding China) 2244 1.8 1.1 3389 51
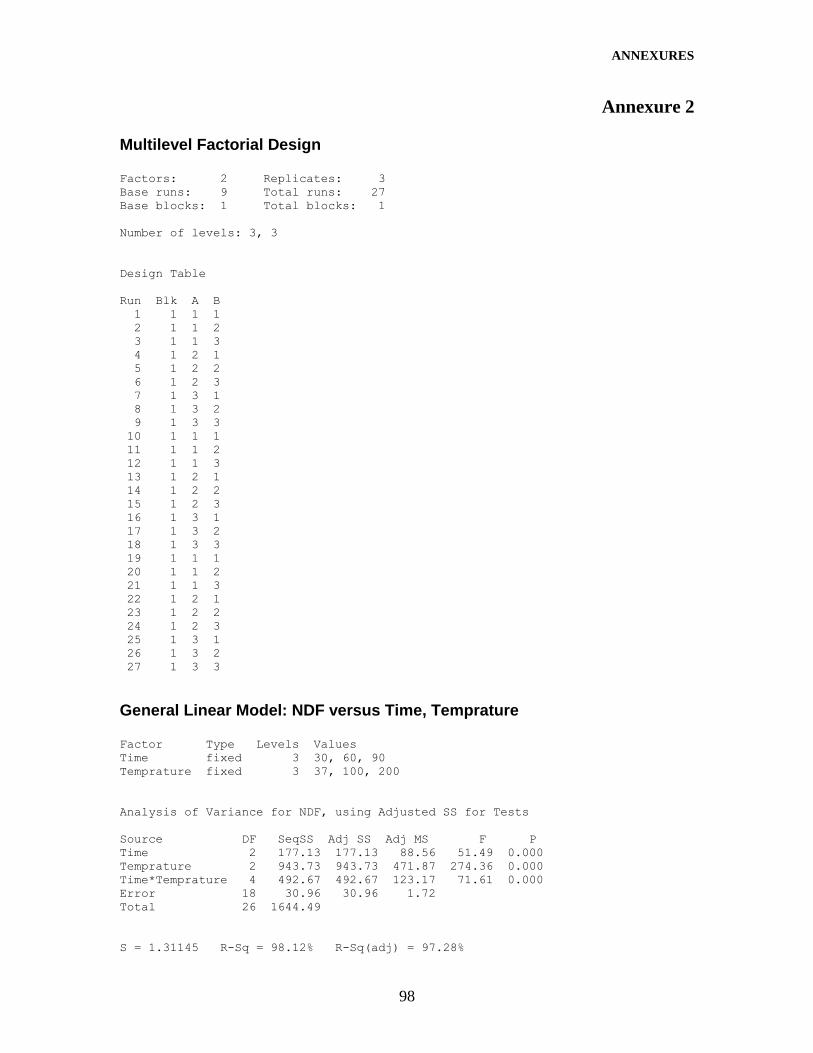
ANNEXURES
98
Annexure 2 Multilevel Factorial Design Factors: 2 Replicates: 3
Base runs: 9 Total runs: 27
Base blocks: 1 Total blocks: 1
Number of levels: 3, 3
Design Table
Run Blk A B
1 1 1 1
2 1 1 2
3 1 1 3
4 1 2 1
5 1 2 2
6 1 2 3
7 1 3 1
8 1 3 2
9 1 3 3
10 1 1 1
11 1 1 2
12 1 1 3
13 1 2 1
14 1 2 2
15 1 2 3
16 1 3 1
17 1 3 2
18 1 3 3
19 1 1 1
20 1 1 2
21 1 1 3
22 1 2 1
23 1 2 2
24 1 2 3
25 1 3 1
26 1 3 2
27 1 3 3
General Linear Model: NDF versus Time, Temprature Factor Type Levels Values
Time fixed 3 30, 60, 90
Temprature fixed 3 37, 100, 200
Analysis of Variance for NDF, using Adjusted SS for Tests
Source DF SeqSS Adj SS Adj MS F P
Time 2 177.13 177.13 88.56 51.49 0.000
Temprature 2 943.73 943.73 471.87 274.36 0.000
Time*Temprature 4 492.67 492.67 123.17 71.61 0.000
Error 18 30.96 30.96 1.72
Total 26 1644.49
S = 1.31145 R-Sq = 98.12% R-Sq(adj) = 97.28%

ANNEXURES
99
Unusual Observations for NDF
Obs NDF Fit SE Fit Residual St Resid
14 65.1500 67.4667 0.7572 -2.3167 -2.16 R
R denotes an observation with a large standardized residual.
Least Squares Means for NDF
Time Mean SE Mean
30 67.22 0.4371
60 62.14 0.4371
90 61.49 0.4371
Temprature
37 68.85 0.4371
100 66.64 0.4371
200 55.35 0.4371
Time*Temprature
30 37 71.18 0.7572
30 100 76.00 0.7572
30 200 54.47 0.7572
60 37 66.04 0.7572
60 100 67.47 0.7572
60 200 52.92 0.7572
90 37 69.34 0.7572
90 100 56.46 0.7572
90 200 58.67 0.7572
Residual Plots for NDF
210-1-2
99
90
50
10
1
Residual
Pe
rce
nt
7570656055
2
1
0
-1
-2
Fitted Value
Re
sid
ua
l
210-1-2
8
6
4
2
0
Residual
Fre
qu
en
cy
2624222018161412108642
2
1
0
-1
-2
Observation Order
Re
sid
ua
l
Normal Probability Plot Versus Fits
Histogram Versus Order
Residual Plots for NDF

ANNEXURES
100
General Linear Model: ADF versus Time, Temprature Factor Type Levels Values
Time fixed 3 30, 60, 90
Temprature fixed 3 37, 100, 200
Analysis of Variance for ADF, using Adjusted SS for Tests
Source DF Seq SS Adj SS Adj MS F P
Time 2 66.773 66.773 33.387 21.55 0.000
Temprature2 266.001 266.001 133.000 85.85 0.000
Time*Temprature4 227.380 227.380 56.845 36.69 0.000
Error 18 27.888 27.888 1.549
Total 26 588.041
S = 1.24471 R-Sq = 95.26% R-Sq(adj) = 93.15%
Unusual Observations for ADF
Obs ADF Fit SE Fit Residual St Resid
4 49.6000 52.1000 0.7186 -2.5000 -2.46 R
13 54.5000 52.1000 0.7186 2.4000 2.36 R
R denotes an observation with a large standardized residual.
Least Squares Means for ADF
Time Mean SE Mean
30 56.20 0.4149
60 54.14 0.4149
90 52.36 0.4149
Temprature
37 55.27 0.4149
100 49.98 0.4149
200 57.46 0.4149
Time*Temprature
30 37 59.47 0.7186
30 100 54.44 0.7186
30 200 54.71 0.7186
60 37 52.10 0.7186
60 100 51.50 0.7186
60 200 58.83 0.7186
90 37 54.23 0.7186
90 100 44.00 0.7186
90 200 58.83 0.7186

ANNEXURES
101
Residual Plots for ADF
210-1-2
99
90
50
10
1
Residual
Pe
rce
nt
60555045
2
1
0
-1
-2
Fitted Value
Re
sid
ua
l
2.41.20.0-1.2-2.4
8
6
4
2
0
Residual
Fre
qu
en
cy
2624222018161412108642
2
1
0
-1
-2
Observation Order
Re
sid
ua
l
Normal Probability Plot Versus Fits
Histogram Versus Order
Residual Plots for ADF
General Linear Model: lignin versus Time, Temprature Factor Type Levels Values
Time fixed 3 30, 60, 90
Temprature fixed 3 37, 100, 200
Analysis of Variance for lignin, using Adjusted SS for Tests
Source DF Seq SS AdjSS Adj MS F P
Time 2 0.0407 0.0407 0.0203 0.07 0.936
Temprature 2 4.7791 4.7791 2.3895 7.86 0.004
Time*Temprature4 29.8207 29.8207 7.4552 24.54 0.000
Error 18 5.4689 5.4689 0.3038
Total 26 40.1093
S = 0.551207 R-Sq = 86.36% R-Sq(adj) = 80.30%
Unusual Observations for lignin
Obs lignin Fit SE Fit Residual St Resid
21 17.1500 18.1300 0.3182 -0.9800 -2.18 R
R denotes an observation with a large standardized residual.
Least Squares Means for lignin
Time Mean SE Mean
30 19.49 0.1837

ANNEXURES
102
60 19.43 0.1837
90 19.52 0.1837
Temprature
37 20.07 0.1837
100 19.19 0.1837
200 19.17 0.1837
Time*Temprature
30 37 19.30 0.3182
30 100 21.03 0.3182
30 200 18.13 0.3182
60 37 20.82 0.3182
60 100 18.70 0.3182
60 200 18.76 0.3182
90 37 20.10 0.3182
90 100 17.84 0.3182
90 200 20.62 0.3182
Residual Plots for lignin
1.00.50.0-0.5-1.0
99
90
50
10
1
Residual
Pe
rce
nt
21201918
1.0
0.5
0.0
-0.5
-1.0
Fitted Value
Re
sid
ua
l
1.00.50.0-0.5-1.0
8
6
4
2
0
Residual
Fre
qu
en
cy
2624222018161412108642
1.0
0.5
0.0
-0.5
-1.0
Observation Order
Re
sid
ua
l
Normal Probability Plot Versus Fits
Histogram Versus Order
Residual Plots for lignin
General Linear Model: Si versus Time, Temprature Factor Type Levels Values
Time fixed 3 30, 60, 90
Temprature fixed 3 37, 100, 200
Analysis of Variance for Si, using Adjusted SS for Tests
Source DF Seq SS AdjSS Adj MS F P
Time 2 12.5988 12.5988 6.2994 12.45 0.000
Temprature 2 6.4692 6.4692 3.2346 6.40 0.008
Time*Temprature4 20.6625 20.6625 5.1656 10.21 0.000
Error 18 9.1039 9.1039 0.5058

ANNEXURES
103
Total 26 48.8345
S = 0.711178 R-Sq = 81.36% R-Sq(adj) = 73.07%
Least Squares Means for Si
Time Mean SE Mean
30 10.510 0.2371
60 8.841 0.2371
90 9.780 0.2371
Temprature
37 10.161 0.2371
100 9.030 0.2371
200 9.940 0.2371
Time*Temprature
30 37 11.117 0.4106
30 100 10.450 0.4106
30 200 9.963 0.4106
60 37 9.950 0.4106
60 100 8.450 0.4106
60 200 8.123 0.4106
90 37 9.417 0.4106
90 100 8.190 0.4106
90 200 11.733 0.4106
Residual Plots for Si
10-1
99
90
50
10
1
Residual
Pe
rce
nt
12111098
1.0
0.5
0.0
-0.5
-1.0
Fitted Value
Re
sid
ua
l
1.00.50.0-0.5-1.0
8
6
4
2
0
Residual
Fre
qu
en
cy
2624222018161412108642
1.0
0.5
0.0
-0.5
-1.0
Observation Order
Re
sid
ua
l
Normal Probability Plot Versus Fits
Histogram Versus Order
Residual Plots for Si
General Linear Model: Ash versus Time, Temprature Factor Type Levels Values
Time fixed 3 30, 60, 90

ANNEXURES
104
Temprature fixed 3 37, 100, 200
Analysis of Variance for Ash, using Adjusted SS for Tests
Source DF Seq SS Adj SS Adj MS F P
Time 2 5.3305 5.3305 2.6652 13.82 0.000
Temprature2 68.1867 68.1867 34.0933 176.74 0.000
Time*Temprature 4 5.9868 5.9868 1.4967 7.76 0.001
Error 18 3.4721 3.4721 0.1929
Total 26 82.9761
S = 0.439200 R-Sq = 95.82% R-Sq(adj) = 93.96%
Unusual Observations for Ash
Obs Ash Fit SE Fit Residual St Resid
27 9.7500 10.6333 0.2536 -0.8833 -2.46 R
R denotes an observation with a large standardized residual.
Least Squares Means for Ash
Time Mean SE Mean
30 13.70 0.1464
60 13.08 0.1464
90 12.62 0.1464
Temprature
37 15.13 0.1464
100 13.02 0.1464
200 11.24 0.1464
Time*Temprature
30 37 15.00 0.2536
30 100 14.32 0.2536
30 200 11.78 0.2536
60 37 15.05 0.2536
60 100 12.87 0.2536
60 200 11.31 0.2536
90 37 15.35 0.2536
90 100 11.87 0.2536
90 200 10.63 0.2536

ANNEXURES
105
Residual Plots for Ash
1.00.50.0-0.5-1.0
99
90
50
10
1
Residual
Pe
rce
nt
16141210
0.5
0.0
-0.5
-1.0
Fitted Value
Re
sid
ua
l
0.60.40.20.0-0.2-0.4-0.6-0.8
6.0
4.5
3.0
1.5
0.0
Residual
Fre
qu
en
cy
2624222018161412108642
0.5
0.0
-0.5
-1.0
Observation Order
Re
sid
ua
l
Normal Probability Plot Versus Fits
Histogram Versus Order
Residual Plots for Ash

ANNEXURES
106
Multilevel Factorial Design Factors: 2 Replicates: 3
Base runs: 9 Total runs: 27
Base blocks: 1 Total blocks: 1
Number of levels: 3, 3
Design Table
Run Blk A B
1 1 1 1
2 1 1 2
3 1 1 3
4 1 2 1
5 1 2 2
6 1 2 3
7 1 3 1
8 1 3 2
9 1 3 3
10 1 1 1
11 1 1 2
12 1 1 3
13 1 2 1
14 1 2 2
15 1 2 3
16 1 3 1
17 1 3 2
18 1 3 3
19 1 1 1
20 1 1 2
21 1 1 3
22 1 2 1
23 1 2 2
24 1 2 3
25 1 3 1
26 1 3 2
27 1 3 3
General Linear Model: NDF versus Concentration, Temprature Factor Type Levels Values
Concentration fixed 3 0.1, 0.3, 0.5
Temprature fixed 3 37, 70, 100
Analysis of Variance for NDF, using Adjusted SS for Tests
Source DF Seq SS AdjSS Adj MS F P
Concentration 2 360.53 360.53 180.27 651.23 0.000
Temprature 2 690.29 690.29 345.14 1246.87 0.000
Concentration*Temprature4 1074.42 1074.42 268.60 970.36 0.000
Error 18 4.98 4.98 0.28
Total 26 2130.22
S = 0.526125 R-Sq = 99.77% R-Sq(adj) = 99.66%

ANNEXURES
107
Unusual Observations for NDF
Obs NDF Fit SE Fit Residual St Resid
4 72.0000 71.0833 0.3038 0.9167 2.13 R
9 48.3500 47.4833 0.3038 0.8667 2.02 R
R denotes an observation with a large standardized residual.
Least Squares Means for NDF
ConcentratioMean SE Mean
0.1 64.45 0.1754
0.3 62.89 0.1754
0.5 56.04 0.1754
Temprature
37 66.58 0.1754
70 54.39 0.1754
100 62.41 0.1754
Concentratio*Temprature
0.1 37 68.74 0.3038
0.1 70 53.66 0.3038
0.1 100 70.95 0.3038
0.3 37 71.08 0.3038
0.3 70 48.79 0.3038
0.3 100 68.81 0.3038
0.5 37 59.90 0.3038
0.5 70 60.73 0.3038
0.5 100 47.48 0.3038
Residual Plots for NDF
1.00.50.0-0.5-1.0
99
90
50
10
1
Residual
Pe
rce
nt
7065605550
1.0
0.5
0.0
-0.5
Fitted Value
Re
sid
ua
l
0.80.40.0-0.4-0.8
4.8
3.6
2.4
1.2
0.0
Residual
Fre
qu
en
cy
2624222018161412108642
1.0
0.5
0.0
-0.5
Observation Order
Re
sid
ua
l
Normal Probability Plot Versus Fits
Histogram Versus Order
Residual Plots for NDF

ANNEXURES
108
General Linear Model: ADF versus Concentration, Temprature Factor Type Levels Values
Concentration fixed 3 0.1, 0.3, 0.5
Temprature fixed 3 37, 70, 100
Analysis of Variance for ADF, using Adjusted SS for Tests
Source DF Seq SS AdjSS Adj MS F P
Concentration 2 424.56 424.56 212.28 510.84 0.000
Temprature 2 684.41 684.41 342.21 823.49 0.000
Concentration*Temprature4 1086.53 1086.53 271.63 653.66 0.000
Error 18 7.48 7.48 0.42
Total 26 2202.98
S = 0.644636 R-Sq = 99.66% R-Sq(adj) = 99.51%
Unusual Observations for ADF
Obs ADF Fit SE Fit Residual St Resid
19 53.1800 54.2500 0.3722 -1.0700 -2.03 R
R denotes an observation with a large standardized residual.
Least Squares Means for ADF
ConcentratioMean SE Mean
0.1 54.32 0.2149
0.3 52.50 0.2149
0.5 45.15 0.2149
Temprature
37 53.61 0.2149
70 54.79 0.2149
100 43.57 0.2149
Concentratio*Temprature
0.1 37 54.25 0.3722
0.1 70 54.95 0.3722
0.1 100 53.78 0.3722
0.3 37 55.89 0.3722
0.3 70 50.84 0.3722
0.3 100 50.78 0.3722
0.5 37 50.70 0.3722
0.5 70 58.60 0.3722
0.5 100 26.16 0.3722

ANNEXURES
109
Residual Plots for ADF
1.00.50.0-0.5-1.0
99
90
50
10
1
Residual
Pe
rce
nt
60504030
1.0
0.5
0.0
-0.5
-1.0
Fitted Value
Re
sid
ua
l
0.750.500.250.00-0.25-0.50-0.75-1.00
8
6
4
2
0
Residual
Fre
qu
en
cy
2624222018161412108642
1.0
0.5
0.0
-0.5
-1.0
Observation Order
Re
sid
ua
l
Normal Probability Plot Versus Fits
Histogram Versus Order
Residual Plots for ADF
General Linear Model: ADL versus Concentration, Temprature Factor Type Levels Values
Concentration fixed 3 0.1, 0.3, 0.5
Temprature fixed 3 37, 70, 100
Analysis of Variance for ADL, using Adjusted SS for Tests
Source DF SeqSS Adj SS Adj MS F P
Concentration 2 9.4501 9.4501 4.7250 12.61 0.000
Temprature 2 1.4931 1.4931 0.7465 1.99 0.165
Concentration*Temprature 4 3.5670 3.5670 0.8918 2.38 0.090
Error 18 6.7471 6.7471 0.3748
Total 26 21.2573
S = 0.612239 R-Sq = 68.26% R-Sq(adj) = 54.15%
Unusual Observations for ADL
Obs ADL Fit SE Fit Residual St Resid
2 20.0000 21.1000 0.3535 -1.1000 -2.20 R
15 18.7800 19.8133 0.3535 -1.0333 -2.07 R
R denotes an observation with a large standardized residual.
Least Squares Means for ADL
ConcentratioMean SE Mean

ANNEXURES
110
0.1 20.47 0.2041
0.3 19.67 0.2041
0.5 19.02 0.2041
Temprature
37 19.42 0.2041
70 19.73 0.2041
100 20.00 0.2041
Concentratio*Temprature
0.1 37 19.91 0.3535
0.1 70 21.10 0.3535
0.1 100 20.39 0.3535
0.3 37 19.61 0.3535
0.3 70 19.59 0.3535
0.3 100 19.81 0.3535
0.5 37 18.75 0.3535
0.5 70 18.51 0.3535
0.5 100 19.80 0.3535
Residual Plots for ADL
1.00.50.0-0.5-1.0
99
90
50
10
1
Residual
Pe
rce
nt
212019
1.0
0.5
0.0
-0.5
-1.0
Fitted Value
Re
sid
ua
l
1.00.50.0-0.5-1.0
6.0
4.5
3.0
1.5
0.0
Residual
Fre
qu
en
cy
2624222018161412108642
1.0
0.5
0.0
-0.5
-1.0
Observation Order
Re
sid
ua
lNormal Probability Plot Versus Fits
Histogram Versus Order
Residual Plots for ADL
General Linear Model: Si versus Concentration, Temprature Factor Type Levels Values
Concentration fixed 3 0.1, 0.3, 0.5
Temprature fixed 3 37, 70, 100
Analysis of Variance for Si, using Adjusted SS for Tests
Source DF Seq SS AdjSS Adj MS F P
Concentration 2 52.995 52.995 26.498 3.25 0.062
Temprature 2 1.815 1.815 0.907 0.11 0.895
Concentration*Temprature 4 2.631 2.631 0.658 0.08 0.987

ANNEXURES
111
Error 18 146.807 146.807 8.156
Total 26 204.248
S = 2.85586 R-Sq = 28.12% R-Sq(adj) = 0.00%
Unusual Observations for Si
Obs Si Fit SE Fit Residual St Resid
17 18.4500 12.9333 1.6488 5.5167 2.37 R
18 19.8900 13.2967 1.6488 6.5933 2.83 R
R denotes an observation with a large standardized residual.
Least Squares Means for Si
ConcentratioMean SE Mean
0.1 10.397 0.9520
0.3 10.757 0.9520
0.5 13.532 0.9520
Temprature
37 11.919 0.9520
70 11.456 0.9520
100 11.311 0.9520
Concentratio*Temprature
0.1 37 10.623 1.6488
0.1 70 10.667 1.6488
0.1 100 9.900 1.6488
0.3 37 10.767 1.6488
0.3 70 10.767 1.6488
0.3 100 10.737 1.6488
0.5 37 14.367 1.6488
0.5 70 12.933 1.6488
0.5 100 13.297 1.6488

ANNEXURES
112
Residual Plots for Si
5.02.50.0-2.5-5.0
99
90
50
10
1
Residual
Pe
rce
nt
1413121110
5.0
2.5
0.0
-2.5
-5.0
Fitted Value
Re
sid
ua
l
6.04.53.01.50.0-1.5-3.0-4.5
16
12
8
4
0
Residual
Fre
qu
en
cy
2624222018161412108642
5.0
2.5
0.0
-2.5
-5.0
Observation Order
Re
sid
ua
l
Normal Probability Plot Versus Fits
Histogram Versus Order
Residual Plots for Si
General Linear Model: Ash versus Concentration, Temprature Factor Type Levels Values
Concentration fixed 3 0.1, 0.3, 0.5
Temprature fixed 3 37, 70, 100
Analysis of Variance for Ash, using Adjusted SS for Tests
Source DF Seq SS AdjSS Adj MS F P
Concentration 2 1.7568 1.7568 0.8784 5.41 0.014
Temprature2 11.8303 11.8303 5.9151 36.44 0.000
Concentration*Temprature 4 3.7374 3.7374 0.9344 5.76 0.004
Error 18 2.9215 2.9215 0.1623
Total 26 20.2460
S = 0.402869 R-Sq = 85.57% R-Sq(adj) = 79.16%
Unusual Observations for Ash
Obs Ash Fit SE Fit Residual St Resid
11 15.7200 15.0267 0.2326 0.6933 2.11 R
20 14.1400 15.0267 0.2326 -0.8867 -2.70 R
21 14.0000 14.7100 0.2326 -0.7100 -2.16 R
R denotes an observation with a large standardized residual.
Least Squares Means for Ash

ANNEXURES
113
ConcentratioMean SE Mean
0.1 14.52 0.1343
0.3 15.04 0.1343
0.5 15.08 0.1343
Temprature
37 14.02 0.1343
70 15.00 0.1343
100 15.62 0.1343
Concentratio*Temprature
0.1 37 13.82 0.2326
0.1 70 15.03 0.2326
0.1 100 14.71 0.2326
0.3 37 13.68 0.2326
0.3 70 15.21 0.2326
0.3 100 16.23 0.2326
0.5 37 14.55 0.2326
0.5 70 14.77 0.2326
0.5 100 15.93 0.2326
Residual Plots for Ash
1.00.50.0-0.5-1.0
99
90
50
10
1
Residual
Pe
rce
nt
16.015.515.014.514.0
0.5
0.0
-0.5
-1.0
Fitted Value
Re
sid
ua
l
0.60.40.20.0-0.2-0.4-0.6-0.8
8
6
4
2
0
Residual
Fre
qu
en
cy
2624222018161412108642
0.5
0.0
-0.5
-1.0
Observation Order
Re
sid
ua
l
Normal Probability Plot Versus Fits
Histogram Versus Order
Residual Plots for Ash
Multilevel Factorial Design Factors: 2 Replicates: 3
Base runs: 9 Total runs: 27

ANNEXURES
114
Base blocks: 1 Total blocks: 1
Number of levels: 3, 3
Design Table
Run Blk A B
1 1 1 1
2 1 1 2
3 1 1 3
4 1 2 1
5 1 2 2
6 1 2 3
7 1 3 1
8 1 3 2
9 1 3 3
10 1 1 1
11 1 1 2
12 1 1 3
13 1 2 1
14 1 2 2
15 1 2 3
16 1 3 1
17 1 3 2
18 1 3 3
19 1 1 1
20 1 1 2
21 1 1 3
22 1 2 1
23 1 2 2
24 1 2 3
25 1 3 1
26 1 3 2
27 1 3 3
General Linear Model: NDF versus Concentration, Temrature Factor Type Levels Values
Concentration fixed 3 2, 4, 6
Temrature fixed 3 37, 70, 100
Analysis of Variance for NDF, using Adjusted SS for Tests
Source DF SeqSS Adj SS Adj MS F P
Concentration 2 354.93 354.93 177.47 70.17 0.000
Temrature 2 299.96 299.96 149.98 59.30 0.000
Concentration*Temrature 4 899.89 899.89 224.97 88.95 0.000
Error 18 45.52 45.52 2.53
Total 26 1600.31
S = 1.59031 R-Sq = 97.16% R-Sq(adj) = 95.89%
Unusual Observations for NDF
Obs NDF Fit SE Fit Residual St Resid
13 64.8500 69.6000 0.9182 -4.7500 -3.66 R
22 73.9500 69.6000 0.9182 4.3500 3.35 R

ANNEXURES
115
R denotes an observation with a large standardized residual.
Least Squares Means for NDF
ConcentratioMean SE Mean
2 71.69 0.5301
4 62.94 0.5301
6 66.02 0.5301
Temrature
37 71.52 0.5301
70 65.33 0.5301
100 63.81 0.5301
Concentratio*Temrature
2 37 70.93 0.9182
2 70 73.00 0.9182
2 100 71.15 0.9182
4 37 69.60 0.9182
4 70 52.66 0.9182
4 100 66.57 0.9182
6 37 74.01 0.9182
6 70 70.33 0.9182
6 100 53.71 0.9182
Residual Plots for NDF
5.02.50.0-2.5-5.0
99
90
50
10
1
Residual
Pe
rce
nt
7570656055
5.0
2.5
0.0
-2.5
-5.0
Fitted Value
Re
sid
ua
l
420-2-4
20
15
10
5
0
Residual
Fre
qu
en
cy
2624222018161412108642
5.0
2.5
0.0
-2.5
-5.0
Observation Order
Re
sid
ua
l
Normal Probability Plot Versus Fits
Histogram Versus Order
Residual Plots for NDF
General Linear Model: ADF versus Concentration, Temrature Factor Type Levels Values
Concentration fixed 3 2, 4, 6
Temrature fixed 3 37, 70, 100

ANNEXURES
116
Analysis of Variance for ADF, using Adjusted SS for Tests
Source DF Seq SS AdjSS Adj MS F P
Concentration 2 635.21 635.21 317.61 497.00 0.000
Temrature 2 182.36 182.36 91.18 142.68 0.000
Concentration*Temrature4 1074.66 1074.66 268.67 420.42 0.000
Error 18 11.50 11.50 0.64
Total 26 1903.74
S = 0.799403 R-Sq = 99.40% R-Sq(adj) = 99.13%
Unusual Observations for ADF
Obs ADF Fit SE Fit Residual St Resid
22 41.6500 43.2567 0.4615 -1.6067 -2.46 R
R denotes an observation with a large standardized residual.
Least Squares Means for ADF
ConcentratioMean SE Mean
2 50.84 0.2665
4 41.92 0.2665
6 53.17 0.2665
Temrature
37 52.27 0.2665
70 47.35 0.2665
100 46.31 0.2665
Concentratio*Temrature
2 37 55.44 0.4615
2 70 41.42 0.4615
2 100 55.67 0.4615
4 37 43.26 0.4615
4 70 39.05 0.4615
4 100 43.45 0.4615
6 37 58.12 0.4615
6 70 61.58 0.4615
6 100 39.82 0.4615

ANNEXURES
117
Residual Plots for ADF
210-1-2
99
90
50
10
1
Residual
Pe
rce
nt
6055504540
1
0
-1
Fitted Value
Re
sid
ua
l
1.00.50.0-0.5-1.0-1.5
4.8
3.6
2.4
1.2
0.0
Residual
Fre
qu
en
cy
2624222018161412108642
1
0
-1
Observation Order
Re
sid
ua
l
Normal Probability Plot Versus Fits
Histogram Versus Order
Residual Plots for ADF
General Linear Model: Lignin versus Concentration, Temrature Factor Type Levels Values
Concentration fixed 3 2, 4, 6
Temrature fixed 3 37, 70, 100
Analysis of Variance for Lignin, using Adjusted SS for Tests
Source DF SeqSS Adj SS Adj MS F P
Concentration 2 6.887 6.887 3.443 8.07 0.003
Temrature 2 56.696 56.696 28.348 66.43 0.000
Concentration*Temrature 4 39.692 39.692 9.923 23.25 0.000
Error 18 7.682 7.682 0.427
Total 26 110.956
S = 0.653265 R-Sq = 93.08% R-Sq(adj) = 90.00%
Least Squares Means for Lignin
ConcentratioMean SE Mean
2 17.38 0.2178
4 18.52 0.2178
6 18.37 0.2178
Temrature
37 18.67 0.2178
70 19.51 0.2178
100 16.10 0.2178
Concentratio*Temrature
2 37 18.62 0.3772

ANNEXURES
118
2 70 18.45 0.3772
2 100 15.07 0.3772
4 37 17.87 0.3772
4 70 18.98 0.3772
4 100 18.70 0.3772
6 37 19.50 0.3772
6 70 21.08 0.3772
6 100 14.52 0.3772
Residual Plots for Lignin
1.00.50.0-0.5-1.0
99
90
50
10
1
Residual
Pe
rce
nt
2220181614
1.0
0.5
0.0
-0.5
-1.0
Fitted Value
Re
sid
ua
l
1.00.50.0-0.5-1.0
4.8
3.6
2.4
1.2
0.0
Residual
Fre
qu
en
cy
2624222018161412108642
1.0
0.5
0.0
-0.5
-1.0
Observation Order
Re
sid
ua
l
Normal Probability Plot Versus Fits
Histogram Versus Order
Residual Plots for Lignin
General Linear Model: Si versus Concentration, Temrature Factor Type Levels Values
Concentration fixed 3 2, 4, 6
Temrature fixed 3 37, 70, 100
Analysis of Variance for Si, using Adjusted SS for Tests
Source DF Seq SS AdjSS Adj MS F P
Concentration 2 1.8978 1.8978 0.9489 2.44 0.115
Temrature2 16.8074 16.8074 8.4037 21.61 0.000
Concentration*Temrature 4 3.1761 3.1761 0.7940 2.04 0.131
Error 18 6.9997 6.9997 0.3889
Total 26 28.8811
S = 0.623598 R-Sq = 75.76% R-Sq(adj) = 64.99%
Unusual Observations for Si

ANNEXURES
119
Obs Si Fit SE Fit Residual St Resid
10 9.0000 10.0433 0.3600 -1.0433 -2.05 R
R denotes an observation with a large standardized residual.
Least Squares Means for Si
ConcentratioMean SE Mean
2 10.569 0.2079
4 10.039 0.2079
6 10.629 0.2079
Temrature
37 9.736 0.2079
70 9.982 0.2079
100 11.519 0.2079
Concentratio*Temrature
2 37 10.043 0.3600
2 70 9.583 0.3600
2 100 12.080 0.3600
4 37 8.963 0.3600
4 70 10.073 0.3600
4 100 11.080 0.3600
6 37 10.200 0.3600
6 70 10.290 0.3600
6 100 11.397 0.3600
Residual Plots for Si
1.00.50.0-0.5-1.0
99
90
50
10
1
Residual
Pe
rce
nt
1211109
1.0
0.5
0.0
-0.5
-1.0
Fitted Value
Re
sid
ua
l
1.00.50.0-0.5-1.0
8
6
4
2
0
Residual
Fre
qu
en
cy
2624222018161412108642
1.0
0.5
0.0
-0.5
-1.0
Observation Order
Re
sid
ua
l
Normal Probability Plot Versus Fits
Histogram Versus Order
Residual Plots for Si

ANNEXURES
120
General Linear Model: Ash versus Concentration, Temrature Factor Type Levels Values
Concentration fixed 3 2, 4, 6
Temrature fixed 3 37, 70, 100
Analysis of Variance for Ash, using Adjusted SS for Tests
Source DF Seq SS Adj SS Adj MS F P
Concentration 2 915.1 915.1 457.6 3.19 0.065
Temrature 2 392.9 392.9 196.4 1.37 0.279
Concentration*Temrature 4 166.4 166.4 41.6 0.29 0.880
Error 18 2578.6 2578.6 143.3
Total 26 4053.1
S = 11.9690 R-Sq = 36.38% R-Sq(adj) = 8.10%
Unusual Observations for Ash
Obs Ash Fit SE Fit Residual St Resid
25 9.8500 33.2667 6.9103 -23.4167 -2.40 R
26 10.1200 35.7467 6.9103 -25.6267 -2.62 R
27 10.8900 33.4633 6.9103 -22.5733 -2.31 R
R denotes an observation with a large standardized residual.
Least Squares Means for Ash
ConcentratioMean SE Mean
2 20.33 3.990
4 30.27 3.990
6 34.16 3.990
Temrature
37 22.91 3.990
70 31.54 3.990
100 30.32 3.990
Concentratio*Temrature
2 37 14.33 6.910
2 70 22.89 6.910
2 100 23.78 6.910
4 37 21.12 6.910
4 70 35.98 6.910
4 100 33.72 6.910
6 37 33.27 6.910
6 70 35.75 6.910
6 100 33.46 6.910

ANNEXURES
121
Residual Plots for Ash
20100-10-20
99
90
50
10
1
Residual
Pe
rce
nt
3530252015
10
0
-10
-20
-30
Fitted Value
Re
sid
ua
l
100-10-20
20
15
10
5
0
Residual
Fre
qu
en
cy
2624222018161412108642
10
0
-10
-20
-30
Observation Order
Re
sid
ua
l
Normal Probability Plot Versus Fits
Histogram Versus Order
Residual Plots for Ash