Embed Size (px)
Citation preview
Physical Behavior and Geologic Control of Radon in Mountain
GEOLOGICAL SURVEY BULLETIN 1052-E
Prepared on behalf of the United States Atomic Energy Commission and published with the permission of the Commission


Physical Behavior and Geologic Control of Radon in Mountain StreamsBy ALLEN S. ROGERS
EXPERIMENTAL AND THEORETICAL GEOPHYSICS
GEOLOGICAL SURVEY BULLETIN 1052-E
Prepared on behalf of the United States Atomic Energy Commission and published with the permission of the Commission
UNITED STATES GOVERNMENT PRINTING OFFICE, WASHINGTON : 1958
UNITED STATES DEPARTMENT OF THE INTERIOR
FRED A. SEATON, Secretary
GEOLOGICAL SURVEY
Thomas B. Nolan, Director
The U. S. Geological Survey Library has cataloged this publication as follows:
Rogers, Alien Stuart, 1922-Physical behavior and geologic control of radon in moun
tain streams. Prepared on behalf of the U. S. Atomic Energy Commission. Washington, U. S. Govt. Print. Off. r 1958.
iii, 187-212 p. illus., plates (1 in pocket) maps. 23 cm. (U. S. Geological Survey. Bulletin 1052-E. Experimental and theoretical geophysics)
Bibliography: p. 20&-210.1. Radon. 2. Water Analysis. 3. Rivers Utah. i. Title, n.
Title: Geologic control of radon in mountain streams. (Series: U. S. Geological Survey. Bulletin 1052-E. Series: U. S. Geological Survey. Experimental and theoretical geophysics)
551.48
For sale by the Superintendent of Documents, U. S. Government Printing Office Washington 25, D. C. - Price 40 cents (paper cover)

CONTENTS
PageAbstract______________________________________ 187Introduction. ___ _____________ __________________________ 187
Physical properties of radon_________________ ___________ 187Radon in natural waters_____________________________________ 188-
Previous work_____ __ _________ _ ________ 188-Purpose and scope of present investigation_________________ 190"
Acknowledgments.-. ________________ __ ____ 190Methods of study _____________ ___________________ 19O
Instruments and methods of measurement._______________________ 190*Sampling techniques. _ __ ________________ _________ 193Field procedure._______________________________ 194
Radon distribution in surface waters draining parts of the WasatchMountains.._____________________________________ 194
Geologic seiting____________________________________ 194Drainage. ___________________________________________ 196Observations in the Red Butte Canyon and Pinecrest areas_________ 198Observations in the Mill Creek area_______________________ 203Observations in the City Creek area_________________________ 203Radium in streams and springs________________________________ 203
Application to a surface-water problem in the Weber River drainage area. 205Summary of conclusions____________________________________________ 209Literature cited.__________________________________________ 209Index_______________________________________ 211
ILLUSTRATIONS
PLATE 6. Radon-measurement apparatus__________________ facing 1927. Sampling tube. __ ______________ facing 1938. Geologic map and section of part of the lower Weber River
area, north-central Utah_-______________________---_ In pocketFIGUKE 44. Radon distribution ratios in a gas-water system.____ _____ 189
45. Diagrammatic sketch of radon-measuring apparatus-_______ 19346. Index map of area near Salt Lake City, showing location of
radon surveys______________________________________ 19547. Geologic map of Red Butte Canyon and Pinecrest areas show
ing radon distribution in streams and springs-___________ 19748. Geologic map of part of Mill Creek area, showing radon dis
tribution- ___________________________________________ 19849. Geologic map of part of City Creek area, showing radon dis
tribution. ___________________________________ 19950. Radon loss from streams and springs in Red Butte and Pine-
crest areas______________-_________________-__-------- 20151. Radon loss from part of Mill Greek-.____________ 20452. Cross section of Mill Creek, showing radon distribution.___. 20553. Radon loss from part of Weber River.______-__-_-_ _____ 207
m


PHYSICAL BEHAVIOR AND GEOLOGIC CONTROL OF RADON IN MOUNTAIN STREAMS
By ALLEN S. KOGEKS
ABSTRACT
Radon measurements were made in several small turbulent mountain streams in the Wasatch Mountains near Salt Lake City and Ogden, Utah, to determine the relation between the distribution of radon and its geologic environment.
In this area, the distribution of radon in streams can be used to locate points where relatively large amounts of radon-bearing ground water enter a stream, even though other evidence of springs may be lacking. These points of influent ground water are marked by abrupt increases (of as much as 2 orders of mag nitude within a distance of 50 feet) in the radon content of the stream waters.
This excess radon is rapidly lost to the atmosphere through stream turbulence. The rate of radon dissipation with distance of streamflow, is an exponential function, of different slopes, depending on the rate and volume of streamflow, and the gradient and nature of the stream channel.
Higher radon concentrations generally can be related to specific stratigraphic horizons in the several drainage areas studied. Thus, lithologic units that act as the primary aquifers can be identified. In one area, thrust faults were found to control the influx of ground water into the stream.
Based on radon concentrations in streams and related spring waters, esti mates of major increments of ground water to streamflow can be made, where conventional methods such as stream gaging are not practical.
The radon in the waters studied was found to be almost completely unsup ported by radium in solution.
INTRODUCTION
PHYSICAL PKOPEKTIES OF RADON
Eadon (called "radium emanation" and "niton" by early investi gators) belongs to the family of inert noble gases and is the only radioactive gas occurring naturally in appreciable amounts al though traces of radioactive xenon and krypton occur naturally as products of spontaneous and neutron fission. As an element, radon is comprised of three isotopes, each of which disintegrates through alpha emission: En222 (radon), with a half life of 3.825 days; En220 (thoron), with a half life of 54.5 seconds; and En219 (actinon), with a half life of 3.92 seconds. These isotopes are members of the U238,
187

188 EXPERIMENTAL AND THEORETICAL GEOPHYSICS
Th232 and U235, families, respectively. Of the three isotopes, the half life of radon (En222 ) is the most convenient for measurement, and this is the only isotope investigated in this report.
The interrelations of half lives of the parent radium and the im mediate daughters of radon add to the convenience of radon measure ments. The half life of radium (Ea226 ) is 1,620 years, and can be considered infinite compared to the 3.825-day half life of radon. Approximately 99 percent equilibrium is established between radon and radium within 25 days.
Radon disintegrates through a series of 4 short-lived daughter products, with which equilibrium is established in about 4 hours (Jennings and Russ, 1948, p. 42, 210-211). The next (fifth) daugh ter product, Pb210 (RaD), has a half life of 22 years. Compared to 4 hours, this is sufficiently long to make the effect of Pb210 in radon measurements negligible within the range of radon concentrations discussed in this report.
Being an inert gas, radon is quite susceptible to migration, accom plished either by gaseous diffusion or solution. The distance of mi gration depends on the 3.825-day half life, the rate and medium of mi gration, and possibly on such other factors as the adsorption of radon on carbonaceous material.
Radon is soluble in many liquids; the solubility depends upon the nature of the liquid and its temperature. The distribution ratio or solubility coefficient of radon (Rn water/Rn gas) in a gas-water system of equal volumes at various temperatures is shown and com pared with selected published data in figure 44. Radon is less soluble in aqueous solutions of electrolytes than in pure water. The distri bution ratio of radon in an aqueous solution of NaCl (sp gr 1.215) at 17° C. is 0.042 (Kofler, 1913). Radon is highly soluble in organic liquids. The distribution ratio may be as large as 23 in some liquids (Wahl and Bonner, 1951, p. 157).
This ability of radon to migrate allows it to be used as a tracer in uranium exploration. Perhaps more important are the potential applications to ground-water problems of studies of radon concen trations in natural waters.
RADON IN NATURAL WATERS
PREVIOUS WORK
Very little is known concerning the relation of radon in natural waters to geologic conditions. Arndt and Kuroda (1953) made a reconnaissance survey of radon in streams and lakes in parts of Garland and Hot Springs Counties, Ark. Where the same rock type crops out over a wide area, a correlation was suggested between radon

RADON IN MOUNTAIN STREAMS 189
0.5
0.4
">" 01
E|0.3
o3a-o> 0.2
O.I
\
\\
-^
^̂xS^
NX,
^-^
o AIR AIR
(KOFLER.IS (HEVESY A
13)
NO PANETH,
X AIR NITROGEN
+ NATURAL GAS
0 - - . _ . _
I >this repo
1926)
t
30 40 . 50 Temperature °C
60 70 80 90
FIGURE 44. Radon distribution ratios in a gas-water system.
in streams and the rock types over which, the streams flow: the radon content of streams and springs proved higher near known uranium- bearing materials.
An abundance of literature on the radioactivity of spring waters is available. Perhaps the most intensive and complete studies in this country were those by Kuroda and his coworkers in Hot Springs National Park and vicinity in Arkansas. Here radon concentrations in both hot and cold springs and in streams are related to geologic features and to known uranium-radium minerals (Arndt and Kuroda, 1953; Kuroda, Damon, and Hyde, 1954). At Yellowstone National Park, radon determinations of gases and waters, and radium determi nations of spring deposits, were made by Schlundt and Moore (1909).
Miholic (1952) analyzed water from 26 springs in Yugoslavia and found that waters from Carboniferous and Cretaceous strata contain more radon than waters from sedimentary rock of other periods.
A detailed investigation of radon and helium in the West Pan handle gas field of Texas (Faul and others, 1954), the Hugoton gas field of Kansas, and other gas fields in the Mid-Continent region was made (Pierce, Mytton and Gott, 1956). It was found that natural hydrocarbon gases may contain as much as 104 micromi- crocuries of radon per liter (at reservoir pressure).
Kovach (1944, 1945, 1946) has described a series of measurements of radon in soil gas at Fordham University. He noted variations in

190 EXPERIMENTAL AND THEORETICAL GEOPHYSICS
r,adon content that are attributable to depth and such meteorological elements as rain, snow cover, barometric pressure, and wind velocity. A similar study by Norinder, Metnieks, and Siksna (1952) was made at Uppsala, Sweden. A relation between the radon content of soil gas and the heavy mineral content of the soil was observed by Clark and Botset( 1932).
PURPOSE AND SCOPE OF PRESENT INVESTIGATION
In the spring of 1953 a few preliminary radon determinations were made in several streams that drain the Wasatch Mountains near Salt Lake City, Utah. These samples showed sufficient range in radon content to warrant further investigation. This was postponed until summer, when the streams reached a stable condition and were not affected by melting snow. At that time another series of pre liminary radon measurements were taken periodically over an interval of one week at several places. Since there was, in general, little vari ation in the radon content found at each place, it seemed reasonable to assume that significant interpretations concerning the distribution of radon in stream waters were possible.
The distribution of radon in stream waters and related springs, and the relation of this distribution to both geologic and nongeologic conditions, was then investigated in several drainage areas of the Wasatch Mountains adjacent to Salt Lake City, Utah. The results were then applied to a definite ground- and surface-water problem in a part of the lower Weber River drainage area near Ogden, Utah.
ACKNOWLEDGMENTS
The work described in this report was part of a program of investi gations carried on by the U. S. Geological Survey on behalf of the Division of Research of the U. S. Atomic Energy Commission. Space and other facilities were made available by the University of Utah, where, during part of the time the writer was studying under a Shell Oil Company Research Fellowship in Geophysics. John H. Feth and Herbert A. Waite of the Geological Survey cooperated in the investi gation in the lower Weber River area. Data on quality of water were supplied by J. A. Conner of the Geological Survey.
METHODS OF STUDY
INSTRUMENTS AND METHODS OF MEASUREMENT
Radon can be measured by the ionization produced by alpha emis sion in an ionization chamber. The degree of ionization is a measure of the radon present in the chamber and can be determined by the rate of fall of a charged gold leaf of an electroscope, or by a device capable
RADON IN MOUNTAIN STREAMS 191
of counting individual pulses, or by measuring the total ionization current produced by the alpha emission. ; s
The unit of measurement most commonly used in radon determina tions is the curie, but because the curie is a very large unit, the milli- microcurie (Kh9 curie) or micromicrocurie (10~12 curie) is conven tionally used. The curie is defined as the amount of radon in equi librium with one gram of radium. It has been further defined as 3.700 X10¹⁰ radioactive disintegrations per second. A curie, in terms of volume of radon at standard temperature and pressure, is 0.66 mm3 ; 0.66X10"12 mm3 of radon gas, therefore, is equivalent to one micromicrocurie. Thus the quantities of radon that can be accurately measured are minute. Other units that have been used are the Mache unit, which is equal to 3.6X10"10 curie per liter, and the Eman unit, which is equal to 1X10'10 curie per liter. (Hevsey and Paneth, 1926,p.m.)
For the radon measurements given in this paper, a slow ionization chamber collecting positive ions was used, with an attached vibrating- reed electrometer to measure total ionization current. Kadon was boiled out of liquid samples into an evacuated ionization chamber, while argon was simultaneously bubbled through the boiling liquid sample in order to carry the radon from the sample into the chamber. The radon was isolated in the chamber for a 4-hour period. During this time equilibrium was established with its short-lived daughter products, and the total ionization current then measured by the vibrat ing reed electrometer. A continuous record of the amplified current was recorded on a one-milliampere graphic strip-chart recorder.
The currents produced by the unknown samples were compared di rectly with the current produced by a known amount of radon evolved from a standard radium solution. The radon content of the 10.5X10~12g standard radium solution, obtained from the National Bureau of Standards, is measured periodically for calibration. The average of 20 such measurements is 25.7 millivolts (standard deviation, 0.6) and gives a conversion factor, in terms of micromicrocuries per millivolt.
Background measurements using nonradioactive argon were made periodically, and substracted from all measurements. The smallest amount of radon that can be measured by this apparatus is about one micromicrocurie per liter.
Kadium contents of liquids are determined in a similar fashion, except that two boilings of the liquid sample are necessary. First, all radon is driven from the sample either by making a radon determina tion, or by boiling it to the atmosphere. The sample is sealed in its original boiler and several days later, the radon which evolved from
467830 59 2 -

192 EXPERIMENTAL AND THEORETICAL GEOPHYSICS
the radium in the sample is driven into an ionization chamber and measured. The amount of radon evolved gives a measure of the amount of the .radium in the sample.
Time is an important factor in both radon and radium determina tions. The amount of radon that decayed during the time between sampling and determination must be determined. Because of the 3.825-day half life, radon determinations are generally made within a day or two after sampling. In radium measurements, the time of radon evolution or buildup must be accurately known.
The equipment (pi. 6 and fig. 45) consists of a bank of three 500- milliliter reflux boilers and two 4.2-liter stainless-steel ionization chambers with a connecting gas-transfer system. The system consists of two parts: the intake line from the boilers, with attached U-tube desiccator and vacuum gage, and the exhaust line with its vacuum pump and thermocouple vacuum gage. The ionization chambers are connected to both lines. The two lines are connected by a "bridge" stopcock. When the bridge is closed, it is possible to fill one chamber while evacuating the other.
The gas-transfer system is made entirely of tygon tubing (%6 inch inside diameter X y^ inch outside diameter) with glass joints and stopcocks. Tygon tubing has certain advantages over the con ventional all-glass or copper tubing systems. It is cheap, and easy to construct and maintain. Changes in the system can be made easily. The cleaning of a contaminated glass or copper tubing system can be a tedious job; but if the tygon tubing becomes contaminated, it may be discarded and replaced by new tubing. Although the equipment was originally set up as a semipermanent installation in a laboratory, the tygon system was constructed with the idea that the equipment will eventually be installed as a mobile truck-mounted unit.
No leaks formed in the tygon tubing-glass connections during 1 year of almost daily use. A low-vapor-pressure silicone grease is used as a seal and lubricant in the connections. No organic greases or black rubber should be used because they tend to adsorb radon.
A few limited experiments showed that no appreciable radon is lost in the tygon system by adsorption or diffusion. Radon was al lowed to expand freely from a full ionization chamber through about 20 feet of tygon tubing into an evacuated chamber. The radon was then measured in each chamber and generally there was less than 1 percent difference. R. D. Evans (personal communication) has in vestigated radon losses in black rubber, gum rubber, and tygon tubing. His results indicate that the loss of radon to gum rubber or tygon tubing in a breath-collecting system is negligible if the volume of the

GEOLOGICAL SURVEY BULLETIN 1052 PLATE 6
RADON-MEASUREMENT APPARATUS
Only one reflux boiler and ionization chamber are shown on this plate. See figure 45 for layout of apparatus actually used.

GEOLOGICAL SURVEY BULLETIN 1052 PLATE 7
Ofi
1w
e eo <0H5
SAMPLING TUBE

RADON IN MOUNTAIN STREAMS 193
TOVACUUM
PUMP Not fo scale Electrical connections solid black
A-ARGON AND SAMPLE INTAKE8- 500-MILLILITER REFLUX BOILEJRC - U-TUBE DESICCATORD-"BRIDGE" STOPCOCKE - VACUUM GAGEF - IONIZATION CHAMBERS6 - THERMOCOUPLE VACUUM.-CASE,H-THERMOCOUPLE GAGE CONTROL UNITI - INTAKE LINEJ- EXHAUST LINEK- VIBRATING-REED ELECTROMETERL- VIBRATING-REED ELECTROMETER AMPLIFIERM -ONE-MILLIAMPERE STRIP-CHART RECORDERN-TO TWO ADDITIONAL REFLUX BOILERS
FIGUKB 45. Diagrammatic sketch of radon-measuring apparatus.
radon-air (radon-argon in this report) enclosed by the tubing at any time is small compared to the total volume collected.
SAMPLING TECHNIQUES
Samples of waters were collected in glass tubes of approximately 300 ml volume, with pressure-adapted stopcocks at each end (pi. 7).

194 EXPERIMENTAL AND THEORETICAL GEOPHYSICS
The tubes were first flushed with argon in the laboratory and then filled by gently applying suction with the mouth to one end of the tube, with the other end immersed in the stream or spring. The radon content of water from sample tubes thus filled by suction, and that of comparable water collected in tubes evacuated in the laboratory differed by only 1 or 2 percent, which was considered negligible in this work. The water samples, after collection, were never again exposed to the air, as radon is rapidly flushed from any water sample that is allowed to mix with the atmosphere. It has been found that about 45 percent of the radon is dissipated to the atmosphere when a water sample is collected in a bottle, a volume measured out into a graduate, and the measured volume then poured into a reflux boiler. Kuroda, Damon, and Hyde (1954) report the same phenomenon.
FIELD PROCEDURES
At the start of the first radon survey, stream samples were taken at widely spaced intervals, chiefly near prominent outcrops and changes in lithology. When a large amount of radon was found in the stream, samples were taken both upstream and downstream from that point.
It soon became evident that the source of the radon could be estab lished accurately if the sample intervals were short.
All samples were usually taken from the center of the stream at a depth of about 1 inch, and primarily in fast-flowing parts of the streams. All stagnant pools and beaver ponds were avoided. The samples were returned to the laboratory for radon determination, usually within 3 days.
RADON DISTRIBUTION IN SURFACE WATERS DRAINING PARTS OF THE WASATCH MOUNTAINS
GEOLOGIC SETTING
The Wasatch Mountains extend from Nephi, in central Utah, north ward into Idaho. Their western face forms part of the eastern limit of the Basin and Range province. Salt Lake City is in the northeast part of Jordan Valley near the steep front of the central Wasatch Mountains.
The area adjacent to Salt Lake City (fig. 46), which includes Red Butte Canyon, City Creek, and Mill Creek, has a relief of 2,500 to 5,000 feet above the floor of the valley.
Near Salt Lake City, the major structural element of the Wasatch Mountains is a broad eastward-trending syncline, which is modified by smaller folds along its trough. The syncline is flanked on the south by the Cottonwood uplift and on the north by the northern Utah

RADON IN MOUNTAIN STREAMS 195
uplift. The sedimentary rocks range in age from Precambrian to early Tertiary.
FIGURE 46. Index map of area near Salt Lake City, showing location of radon surveys.

196 EXPERIMENTAL AND THEORETICAL GEOPHYSICS
The sedimentary rocks in the Red Butte Canyon and Pinecrest area range in age from Pennsylvanian to Tertiary (fig. 47). The oldest formation is the Weber quartzite of Pennsylvanian age with an esti mated thickness of 1,200 feet. Apparently conformably overlying the "Weber quartzite is the Park City formation, of Permian age. Granger (1953) measured a thickness of 974 feet of Park City formation at the head of Red Butte Canyon. For the most part, the Park City formation is made up of limestone with a thick, somewhat phosphatic, shale member in the middle of the formation.
Approximately 3,600 feet of Triassic sedimentary rocks overlie the Park City formation, and include red shale of the Woodside shale, marine limestone and shale of the Thaynes formation, and red shale, siltstone, and sandstone of the Ankareh shale. The Thaynes forma tion, which is of particular interest in the present investigation, has a thickness of 1,931 feet (Granger, 1953) and consists primarily of shale, sandy and shaly limestone, and one or more beds of gray lime stone, which form prominent ridges.
The Triassic sedimentary rocks are overlain by approximately 4,700 feet of Jurassic sandstone, argillaceous limestone, and red siltstone beds.
The conglomerate and red siltstone of the Kelvin formation of Cre taceous age overlie the Jurassic strata with apparent conformity and total about 1,500 feet thick.
Unconf ormably overlapping the older rocks in the northern part of the area is the Almy( ?) conglomerate, of Tertiary age.
The lithology in the Mill Creek area (fig. 48) is similar to that of the Red Butte Canyon and Pinecrest area. The lower half of the Thaynes formation includes 3 rather thick limestone ridge-forming strata.
In the City Creek area there is sequence of vertically dipping Paleo zoic sedimentary rocks (fig. 49) that is an entirely different section than that in the Red Butte Canyon and Mill Creek areas. Here the Paleozoic strata are unconf ormably overlain by Tertiary conglomerate and volcanic rocks.
DRAINAGE
The streams in the Red Butte Canyon and Pinecrest area are small, with steep gradients. The flow at points A, <7, and E (fig. 47) is probably about 1 cubic foot per second. The average stream gradients, which were approximated from topographic maps, are: B to A, about 300 feet per mile; D to <7, including headwaters, about 850 feet per mile; and from either F or G to Pinecrest, about 800 feet per mile.
The average stream gradient of Mill Creek (fig. 48) between A and O is about 300 feet per mile. About 3 miles downstream from point <7,

RADON IN MOUNTAIN STREAMS 197

198 EXPERIMENTAL AND THEORETICAL GEOPHYSICS
Ar
Thay
Wo
0 l/i , , , .
fia
ikareh shale
Tit
nes formation
TJw
odside shale .
IMH.
11
Ppc
0 Park City a formationV)
S tri-
IPw
Weber quartzite
\IPw
Ppc
Geology from A.E. Granger and B.J. Sharp, 1952
EXPLANATION
ContactDashed where approxi- Radon content
matety located Micromicrocuries
FaultDashed where approxi-
mofely located
Jt-
per liter*
Spring
mPoint location
Strike and dip of beds Described in text
FIGURE 48. Geologic map of part of Mill Creek area, showing radon distribution instreams and springs.
the streamflow was approximately 12 cubic feet per second. Because of water diversion, the streamflow between A and #, perhaps 8 or 10 cubic feet per second, is probably twice the flow between B and C.
The average stream gradient of City Creek (fig. 49) between D and B is about 800 feet per mile. At point A the streamflow, based on 1950 measurements, is probably about 2 cubic feet per second in each fork.
OBSERVATIONS IN RED BUTTE CANYON AND PINECREST AREAS
The radon contents of stream waters and springs in these areas are shown in figure 47 in micromicrocuries per liter. All repeat samples at the same localities are shown in brackets.

RADON ESP MOUNTAIN STREAMS 199
EXPLANATION
ContoctDashed where approxi
mately located
Fou ItDashed where approxi
mately located
/ Geology from A.E. Gronger / IPW / ond B.J. Shorp, 1952 / /
FIGURE 49. Geologic map of part of City Creek area, showing radon distribution Instreams and springs.
The distribution of radon in the stream waters was found to follow a definite pattern. In each case relatively high radon contents are found in springs at the sources of the various streams. As the water moves downstream, the radon content decreases rapidly, in some places almost to zero within 500 feet. Further downstream other zones of high radon concentrations are* noted in the stream waters. These concentrations also decrease rapidly as the water moves downstream.
This pattern of radon distribution in stream waters apparently depends upon the influx of radon-bearing ground water into the stream, and, in turn, upon the loss of radon from the stream water to the atmosphere. As air usually contains less than one micro- microcurie per liter, any radon exceeding one micromicrocurie per

200 EXPERIMENTAL AND THEORETICAL GEOPHYSICS
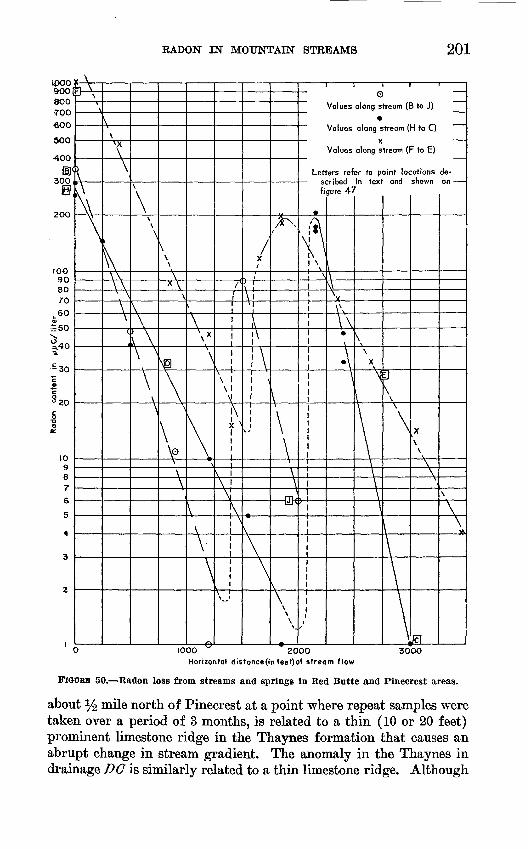
liter in the stream water is out of equilibrium with that in the at mosphere and will therefore decrease and approach equilibrium (fig. 44). After a large amount of radon has been introduced into the stream by ground water, it is quickly released to the atmosphere at a rate governed by the volume and gradient of the stream, and the nature of the stream channel. Eadon content plotted against distance of streamflow shows the loss of radon to the atmosphere to be an exponential function with somewhat different slopes in different drain age areas (fig. 50).
The anomalously high radon concentrations indicate areas where ground water, in large amounts relative to the stream volume, is being added to the stream, even though, in most places, no evidence of springs is apparent.
This ground-water source for the anomalous radon concentrations in stream waters is postulated for the following reasons:
1. The springs in the area generally contain more radon than the stream waters and seem to be the logical source. A water-saturated sedimentary rock with a density of 2.5, a 10-percent porosity, uranium content of 1 ppm (3.3X 10~13 grams of radium per gram of rock), and an emanating power of 10 percent can theoretically contribute 825 micromicrocuries of radon per liter to the enclosed ground water under static conditions. If ground water, under dynamic conditions, con taining about 800 micromicrocuries of radon per liter enters and con tributes 10 percent to the total volume of streamflow, the radon con centration in the stream water will increase by about 80 micromicro curies per liter at the point of ground-water entrance.
2. The decay constant for radon is 0.007551 per hour or 0.000126 per minute. This shows the fraction of radon per unit of time that will form from a radium source. Hence, it seems unlikely that the radium content of the rocks and detritus exposed in the stream channel itself will contribute much radon to the stream's waters, because the radon will be continuously and swiftly swept downstream and dissipated to the atmosphere.
3. Surveys with a scintillation counter showed no abnormally high radioactivity in the rocks along the stream channels. On the con trary, the limestone beds in the area, with which most radon anomalies in the stream waters are related, show a normal, lower background than that of the adjacent shale.
4. A definite relation has been found between some high radon content in stream waters and adjacent radon-bearing springs.
The areas of relatively large amounts of ground-water influx thus marked by radon anomalies can be related to rather definite strati- graphic horizons. The anomaly of 126 micromicrocuries per liter
RADON IN" MOUNTAIN STREAMS 201
ipoo900 1 800 700 00
500
400H(
300
0,
2OO
fOO 90 80 70
U 60 «-50
S,<o
£30"c
-2"c°2O
& D
OK
IO 9 8 7 6
5
4
3
2
1
It \P=
\
)
\\
\\\X
\
\"\\~\\
x \
-Vc
\
\\ \\
\\\\\ ^
T-N
\\ \
\x \\
\p
\\
\\°\
\_A
\V
\
k\
T\
// iii
\ \ \\
:: ^
\\-V\
\
\ _ ̂>
X/'
) i \\
A-J,
^
\
\\
£\
V \ \
=i B}<
\\ \ \ \
X.
Let
fi
l/*AV
\i
/
oValues along stream (B to J)
Values along stream (H to C)
XValues along stream (F to E)
ers refer to point locations :ribed in text and shown jure 47
SFI-H\\
4\\
X Vr
N
\\\\\
\
Ej
\ \\
\
J\
X \ \
\\
Jcl
de-
\
\\ ^
3 1000 w ~ 200O 3OOOHorizontal distonce(in fee*)of stream flow
FIGURE 50. Radon loss from streams and springs In Red Butte and Pinecrest areas.
about y2 mile north of Pinecrest at a point where repeat samples were taken over a period of 3 months, is related to a thin (10 or 20 feet) prominent limestone ridge in the Thaynes formation that causes an abrupt change in stream gradient. The anomaly in the Thaynes in drainage DO is similarly related to a thin limestone ridge. Although

202 EXPERIMENTAL AND THEORETICAL GEOPHYSICS
no prominent limestone ridge was noted in the Thaynes formation in drainage BA, there is an anomaly of 89 micromicrocuries per liter at a point of abrupt change in stream gradient, which suggests that the limestone is also present at the point of the anomaly in drainage BA. Another limestone ridge occurs near the base of the Thaynes formation north of Pinecrest, where an anomaly of 100 micromi crocuries per liter is found.
The upper limestone member of the Park City formation also acts as an aquifer, particularly near its contact with the Woodside shale. Radon anomalies that are generally small are associated with the middle part of the Ankareh shale. This part of the Ankareh is the Suicide grit of local usage and may be equivalent to the Shinarump member of the Chinle formation.
A somewhat perplexing difference in radon distribution exists be tween drainage FE and GE, which are parallel and only about 1,500 feet apart. Drainage FE contains a higher level of radon concentra tion than drainage GE, and there is a large radon anomaly near th& Park City-Woodside contact in drainage FE; yet no anomaly waa found in drainage GE. This marked difference may be due to th& differences in the two stream channels. The channel of drainage FE is partly bedrock, and partly soil derived from bedrock, and has considerable vegetation. Whether the vegetation is supported by water from the stream or by spring water is not known, although there is presumably some influx of ground water into the stream to maintain the relatively high radon content.
Channel GE is choked .with cobbles and boulders of Weber quartzite and Almy (?) conglomerate at least 15 feet thick near the Park City- Woodside contact. Increased turbulence probably contributes to the low radon concentrations. It is also possible that any ground water that enters the channel does so at depth, and then emerges to mix with the stream water in the area of the Woodside shale, where the layer of cobbles and boulders is thinner or absent.
In the summer of 1954 a more detailed study was made of the anomaly associated with a small limestone ridge in the ; Thaynes formation in drainage DG (see inset on fig. 47). By sampling at very close intervals, the radon anomaly was pinpointed to within 50 feet of its source. The source was traced to a small spring containing 1,300 micromicrocuries of radon per liter issuing from a small lime stone cavern under a small waterfall. This spring had not been noticed during the 1953 survey. A spring flowing about 50 gallons per minute from the bottom of the stream channel and containing 550 micromicrocuries of radon per liter was found about 50 feet upstream from the radon anomaly in the Thaynes formation y2 mile

RADON IN MOUNTAIN STREAMS 203
north of Pinecrest. The entire streamflow had been diverted for domestic purposes and the stream channel upstream from the spring was completely dry.
OBSERVATIONS IN THE MILL CHEEK AREA
Large increases in radon content were found in the stream waters near limestone beds in the Park City and Thaynes formations. These limestone beds apparently act as aquifers in a manner similar to that found in the Red Butte Canyon and Pinecrest area. The spring at point A (fig. 48) also acts as a source of radon in the stream water.
A plot of radon content versus distance of streamflow between A and C is shown in figure 51. This plot also shows that the rate of radon loss is an exponential function with respect to distance of stream-flow. The slope of the curve between A and B is much flatter than those for drainages in the Red Butte Canyon and Pinecrest area (note the difference in the distance scale), probably owing to the greater stream volume and lower gradient in the Mill Creek area. The exponential function has a flatter slope between A and B than near point O. This is probably due to the smaller stream volume near point 0. The slope of the function near point O is almost identical to those in the Red Butte Canyon and Pinecrest area.
As Mill Creek is a fairly wide stream, a series of samples were taken near point A at various positions in the stream to determine whether sampling position is a critical factor. The stream at this point is about 7 feet wide. The radon content, on the basis of this one experiment, varies only about 5 percent with respect to stream position. The results shown in figure 52 indicate that the maximum radon content is in the center of the stream, and is apparently constant with depth.
OBSERVATIONS IN THE CITY CHEEK AREA
The results of the radon survey in the City Creek area (fig. 49) are similar to those in the other two areas, although City Creek flows over an entirely different sequence of rocks than those exposed in the Red Butte and Mill Creek areas. Many small springs maintain a higher level of radon concentration along the fork GB than in fork DB.
RADIUM IN STREAMS AND SPRINGS
Several radium determinations of stream- and spring-water samples show that the radon is almost completely unsupported by its parent radium in solution. The radium content in each sample is of the order of 1 micromicrocurie per liter. As this small amount ap-

204 EXPERIMENTAL AND THEORETICAL GEOPHYSICS
90O 800 700
600
500
400
30O
ZOO
too9O 80
fc 70 fff\^CO
^50=l c 40
| 30 "c o u
g 20 o o fc
IO 9 8 7
6
5
4
3
2
1
Al:u
\\\
\\\ '
\V\
\\\k .^\
\\\
\
Lettsc fit
m \\ \.
ers refer to point locotions ribed in text and shown ure48
r^
3
\\
4 //
II/ i/ 1/ 1
11
1
1
de-00
tm
500O W.OOO Horizontal distance(infeet)of stream flow
51. Radon loss from part of Mill Creek.
proaches the limit of the sensitivity of the instrument, the radium content may be less. No uranium analyses of the samples were made.
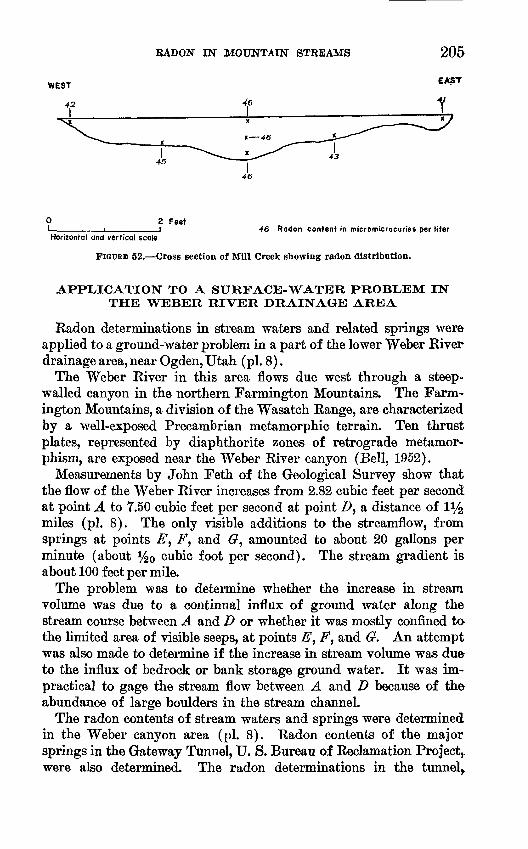
RADON EST MOUNTAIN STREAMS
0 2 FeetI________i________i 46 Radon content in micromtcrocuries per liler Horizontal and vertical scale
FIGURE 52. Cross section of Mill Creek showing radon distribution.
APPLICATION TO A SURFACE-WATER PROBLEM IN THE WEBER RIVER DRAINAGE AREA
Eadon determinations in stream waters and related springs were applied to a ground-water problem in a part of the lower Weber Kiver drainage area, near Ogden, Utah (pi. 8).
The Weber Kiver in this area flows due west through a steep- walled canyon in the northern Farmington Mountains. The Farm- ington Mountains, a division of the Wasatch Eange, are characterized by a well-exposed Precambrian metamorphic terrain. Ten thrust plates, represented by diaphthorite zones of retrograde metamor- phism, are exposed near the Weber Kiver canyon (Bell, 1952).
Measurements by John Feth of the Geological Survey show that the flow of the Weber Kiver increases from 2.82 cubic feet per second at point A to 7.50 cubic feet per second at point Z>, a distance of li/2 miles (pi. 8). The only visible additions to the streamflow, from springs at points E, F, and G, amounted to about 20 gallons per minute (about ^0 cubic foot per second). The stream gradient i& about 100 feet per mile.
The problem was to determine whether the increase hi stream volume was due to a continual influx of ground water along the stream course between A and D or whether it was mostly confined to- the limited area of visible seeps, at points E, F, and 6r. An attempt was also made to determine if the increase in stream volume was due to the influx of bedrock or bank storage ground water. It was im practical to gage the stream flow between A and D because of the abundance of large boulders in the stream channel.
The radon contents of stream waters and springs were determined in the Weber canyon area (pi. 8). Radon contents of the major springs in the Gateway Tunnel, U. S. Bureau of Reclamation Project^ were also determined. The radon determinations in the tunnel,.

206 EXPERIMENTAL AND THEORETICAL GEOPHYSICS
which are underlined on the map, were collected from galvanized troughs or drips from the back, and are considered to have been low ered at least 50 percent, and possibly more, by loss of radon to the air.
No abnormal radioactivity was detected by a scintillation counter traverse through the tunnel except in a small area 1,000 feet from the east portal. A sample was collected by John Powers, U. S. Geological Survey, Salt Lake City, Utah, who made the scintillation-counter traverse. The sample, which was taken from a podlike mass of pegmatitic material, contained 0.003 percent equivalent uranium.
Quality-of-water measurements were made on 3 spring and 4 stream samples, at points A through 6r, by J. G. Connor, U. S. Geological Survey, Salt Lake City, Utah. These measurements were made partly to aid in ground- and surface-water studies in the Ogden, Utah, area, and partly to determine if any relation can be established be tween quality-of-water and radon measurements. The results of the quality tests are listed in the following table. There is no ap parent direct relation between quality of water and radon content.
Data on quality of water, Weber River, Feb. 15,1954
[Datagram J. G. Connor, Quality of Water Branch, U. S. Geological Survey, Salt Lake City, Utah]
Samplelocation
Temp.(°F.)
pH HCOj(PPm)
SO4(ppm)
Cl(ppm)
Hardness(CaCOs-
ppm)
Noncar-bonate
hardness(ppm)
Specificconductance (mi-cromhos)
Radoncontent/1
Stream samples
A.. ........B.............C. ... ... ...D..... ........
39354242
8.1S 4
ao8.2
280977OKfl
O1 fi
32QO
QO
28
26262220
257256234200
27902421
554549512AAP,
155
15678
Spring samples
E .. .....F_. ...........G... .... ...N
474645
7.67.87.7
243248228
193228
1Q
1819
220222210
211923
482487465
532516756
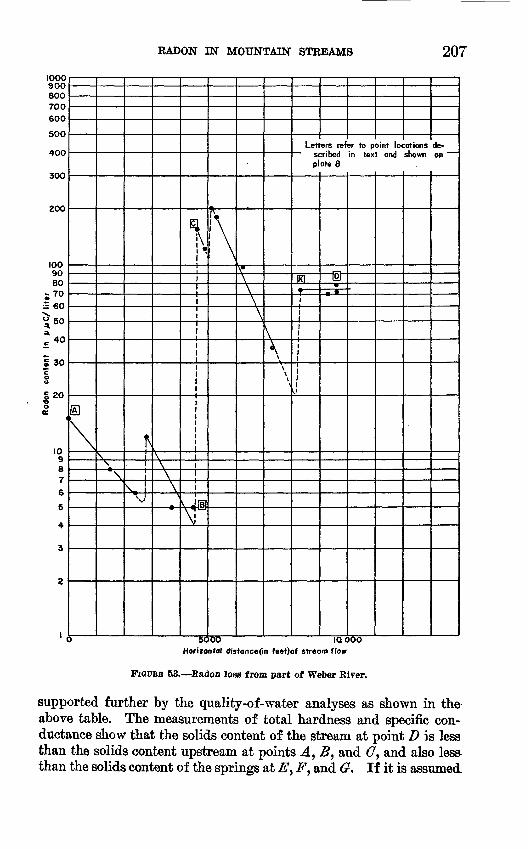
A clear relation was found between the distribution of high radon concentrations in the Weber Biver and the radon-bearing springs at E, F, and G, The distribution pattern is similar to that found in the streams in the Wasatch Mountains near Salt Lake City, Utah. When radon is ploted against distance of streamflow (fig. 53), the loss of radon again is an exponential function of distance.
Because other high radon concentrations in the stream waters are related to springs, it is believed that ground water contributes a small amount to the streamflow below the railroad bridge in the S-shaped part of the stream, and a larger amount in a zone between D and K. The large addition of ground water in the zone between D and K is
RADON IN MOUNTAIN STREAMS 207
9OO 800 700
600
500
400
300
200
100 90 80
t 70
= 60
*»A £ 4°
£ 30"c
o o
§ 20 o o at
(
10 9 87
6
5
4
3
Z
'.
B
\\-^
f
i1
vtV
\\\\
\
il[5|
\!
3 5C
1 \"\\\\\\
\ \\
Let) se
pl
IR1-S
iii
ers refer to point locotions ribed in text and shown ate 8
-bn
de- on
OO IQ OOOHorizontal distance(in feet)of stream flow
FIGURE 58. Radon loss from part of Weber River.
supported further by the quality-of-water analyses as shown in the above table. The measurements of total hardness and specific con ductance show that the solids content of the stream at point D is less than the solids content upstream at points J., B, and <7, and also les& than the solids content of the springs at #, F, and G. If it is assumed

208 EXPERIMENTAL AND THEORETICAL GEOPHYSICS
that the stream is not precipitating part of its solid content, then an addition of better quality water occurs between G and D.
The area of visible springs at E, F, and G, as well as at D and /T, which are the other areas of large gound-water influx, show a marked relation to the surface expression of thrust plates in the canyon. If hank storage is the controlling factor in the movement of ground water in this area, the entrance of ground water into the stream, and the resultant radon anomalies in the stream, would probably be in the areas where a large amount of alluvial material is present.
An attempt was made to use the radon measurements of stream and spring waters to calculate the increments of stream volume between points A and Z>, where intermediary stream gaging was impractical because of the many large boulders in the channel.
The following assumptions were made in the calculations:1. The stream does not lose or gain in volume between the points
of radon anomalies; that is, the streamflow at B is 2.82+0.04 cubic feet per second. Similarly, the streamflow at point K is assumed to be 2.82+0.4+1.2+0.75 cubic feet per second.
2. Eadon contents of the springs are representative of all ground water entering the stream at the particular point.
3. Complete mixing of radon occurs in the stream waters.4. The rate of radon loss in the stream is constant. For instance,
at a point just upstream from K^ the stream is assumed to contain about 20 micromicrocuries per liter, based on the exponential rate of radon dissipation between G and K (fig. 53).
5. In the area DK, the radon content of the ground water entering the stream is assumed to be 600 micromicrocuries per liter, based on the average radon content of known springs at E, F, and G.
The results of the calculations, which are believed to be reasonable estimates, are shown on plate 8 at points F, G, the zone between D and K, and the small radon anomaly in the S-shaped part of the stream. At point F, for instance, the amount of influx of ground water, con taining approximately 500 micromicrocuries per liter, was determined to be 1.2 cubic feet per second, since it raised the radon concentration in the stream from 5 (at point B) to 156 (at point O) micromicrocuries per liter. The calculations thus account for about 65 percent of the streamflow increase between A and D.
In summary, the bulk of the ground water that enters and increases the flow of the Weber Eiver can be considered bedrock rather than bank storage ground water. The movement of ground water in the area is apparently controlled by the diaphthorite thrust plates. On the basis of radon concentrations in the stream waters and related springs, calculations were made which accounted for about 65 percent of the total increase in streamflow between points A and D.

RADON IN MOUNTAIN STREAMS 209
SUMMARY OF CONCLUSIONS
Radon concentrations in stream waters can be used to determine areas where relatively large amounts of radon-bearing water enter small turbulent streams. These areas of influent ground water are marked by abrupt increases in the radon content of the stream waters and can be determined acurately, provided short intervals of sample spacing are used. The high radon concentration in the stream water is then rapidly dissipated to the atmosphere as an expontential func tion, of various slopes, with respect to distance of streamflow. The rate of radon dissipation is dependent upon the radon distribution ratio, the rate and volume of streamflow, the gradient of the stream, and the nature of the stream channel.
In the Wasatch Mountains adjacent to Salt Lake City, Utah, the high radon concentration in stream waters can generally be related to definite stratigraphic horizons in several drainage areas. Thus, lithologic units which act as the primary aquifers can be determined.
The technique of locating areas of ground-water influx into streams by radon determinations was applied to a definite ground-and surface- water problem in a part of the lower Weber River area. The prob lem was to determine the points of streamflow increase and whether this was due to the addition of bedrock or bank-storage ground water. Conventional methods, such as stream gaging, were not prac tical in this instance. The increase in stream flow was found pri marily in three areas apparently associated with thrust faults. Cal culations, based on radon concentrations in stream waters and adjoin ing springs, were made to determine the amount of ground water entering the Weber River at each zone of increase.
The radon content of both stream and spring waters was found to be almost completely out of equilibrium with its parent radium.
The results of the present investigation on the distribution of radon in streams and related springs should have applications to ground- water studies.
LITERATURE CITED
Arndt, R. H., and Kuroda, P. K., 1953, Radioactivity of rivers and lakes inparts of Garland and Hot Spring Counties, Arkansas: Econ. Geology, v.48 no. 7, p. 551-567.
Bell, G. L/., 1952, Geology of the central Wasatch Mountains, Utah: Utah Geol.Soc. Guidebook, 8th Ann. Field Conf., p. 38-51.
Boyle, R. W., 1911, The solubility of radium emanation: Philos, Mag., v. 22,p. 840-854.
Clark, R. W., and Botset, H. G., 1932, Correlation between radon and heavymineral content of soils: Am. Assoc. Petroleum Geologists Bull., v. 16,p. 1349-56.

210 EXPERIMENTAL AND THEORETICAL GEOPHYSICS
Faul, Henry, and others, 1954, Radon and helium in natural gas: Internal Geol. Gong., 19th, Algiers 1952, Comptes rendus, sec. 9, fasc. 9, p. 339-348.
Granger, A. B., 1953, Stratigraphy of the Wasatch range near Salt Lake City, Utah: U. S. Geol. Survey Circ. 296.
Granger, A. B., and Sharp, B. J., 1952, Geology of the central Wasatch Moun tains, Utah: Utah Geol. Soc. Guidebook, 8th Ann. Field Conf., p. 1-37.
Hevesy, G., and Paneth, F., 1926, A manual of radioactivity: London, Oxford Univ. Press, 252 p.
Jennings, W. A., and Russ, S., 1948, Radon: its technique and use: London, Middlesex Hosp. Press, 220 p.
Kofler, M., 1913, Loslichkeit der Ra-Emanation in WasserigensalzlQsungen: Akad. Wiss. Wien, Math.-naturwiss, KL, Sitzungsber, Abt. Ha, Band 122, p. 1473-1479.
Kovach, B. M., 1944, An experimental study of the radon-content of soil-gas: Am. Geophys. Union Trans. v. 25, p. 563-571.
1945, Meteorological Influences upon the radon content of soil-gas: Am. Geophys. Union Trans., v. 26, no. 2, p. 241-248.
1946, Diurnal variations of the radon-content of soil-gas: Terrestrial, Magnetism and Atmospheric Electricity, March 1946, p. 45-56.
Kuroda, P. K., Damon, P. B., and Hyde, H. I., 1954, Radioactivity of the spring water of Hot Springs National Park vicinity in Arkansas: Am. Jour, ScL, v. 252, no. 2, p. 76-86.
Miholic, S., 1952, Radioactivity of waters issuing from sedimentary rocks; Econ. Geology, v. 47, no. 5, p. 543-547.
Norinder, H., Metnieks, A., and Siksna, R., 1953, Radon content of the air in the soil at Uppsala: Arkiv Geofysik, Band II, Hafte 5-6, p. 571-579.
Pierce, A. P., Mytton, J. W., and Gott G. B., 1956, Radioactive elements and their daughter products in the Texas Panhandle and other oil and gas field in the United States, in Page, L. R., Stocking, H. E., and Smith, H. B., Contributions to the geology of uranium and thorium by the United States Geological Survey and Atomic Energy Commission for the United Nations International Conference on Peaceful Uses of Atomic Energy, Geneva, Switzerland, 1955: U. S. Geol. Survey Prof. Paper 300, p. 527-532.
Schlundt, H., and Moore, R. B., 1909, Radioactivity of the thermal waters of Yellowstone National Park: U. S. Geol. Survey Bull. 395.
Wahl, A. C. and Bonner, A. N. (editors), 1951, Radioactivity applied to chem istry : p. 157, Wiley & Sons, Inc.

INDEX
PageAbstract__________________ 187 Acknowledgments _ _ __ 190 Almy conglomerate__ ___ 196, 202 Ankareh shale_____ __ _ 196, 202 Anomalous radon concentrations_ 200-203
City Creek area, radon survey in___ 203rocks _ _ _ __ 196
Conclusions 209Connor, J. G., analyses by 206
Distribution of radon in stream wa ters, pattern__ 199-200
Drainage 196-198
Farmington Mountains _______ 205 Field procedures __ __ 194
Instruments for measurement ofradon __ ______ 190-193
Introduction______ ______ 187-190
Kelvin formation. 196
Literature cited __ _____ 209-210Losses of radon 192-193,
199-200, 207,208
Measurements of radon, instrumentsfor ___________ 190-193
loss of radon in_ __ 192-193methods __ _ 190-193time factor. 192units _ 191
Methods of study 190-194MiH Creek area, radon content in
waters- _ 203 rocks __ __ __ 196
PagePark City formation_____ 196, 202, 203 Physical properties of radon____ 187-188 Pinecrest area, radon content in
waters _______ 198-203sedimentary rocks in 196
Previous investigations-__ _ 188-190Purpose of the report- 190
Quality-of-water measurements___, 206
Radium in surface water- 203-204Radon, losses 192-193, 199-200, 207, 208
measurements of _ _ 190-193physical properties _ 187-188solubility ______________ 188solubility coefficient 188
Red Bntte Canyon, radon contentin water ___ 198-203
sedimentary rocks in 196
Sampling techniques 193-194 Scope of the investigation 190 Sedimentary rocks, age__ 194-196 Springs_____ 200, 208 Suicide grit. See Ankareh shale. Surface waters, radon distribution
in____________ 194-205
Thanes formation ____ 196, 200-203
Wasatch Mountains, radon distribu tion in streams___ 194-205
Weber quartzite 196, 202Weber River, quality of water 206
radon content in waters 205-208 streamflow 205-208
Woodside shale. 196,202
211S. GOVERNMENT PRPNTIN6 OFFICE: 1958