Embed Size (px)
Citation preview
___________________________________________________________________________
PHYSICAL AND VIRTUAL EVALUATION OF OPERATORS’
IMPACT ON GEOMETRY QUALITY FAILURE
Master’s thesis in
Production Engineering
SOFIA WIKSTRAND
___________________________________________________________________________ Department of Product and Production Development
CHALMERS UNIVERSITY OF TECHNOLOGY
Gothenburg, Sweden 2016

Physical and virtual evaluation of operators’ impact
on geometry quality failure
Master’s thesis in Production Engineering
SOFIA WIKSTRAND
Department of Product and Production Development
CHALMERS UNIVERSITY OF TECHNOLOGY
Gothenburg, Sweden 2016

Physical and virtual evaluation of operators’ impact on geometry quality failure
SOFIA WIKSTRAND
© SOFIA WIKSTRAND, 2016
Department of Product and Production Development
Chalmers University of Technology
SE-412 96 Gothenburg
Sweden
Telephone: + 46 (0)31-772 10 00
Abstract
From an industrial perspective, competitiveness call for superior quality and aesthetically
appealing products. Quality and aesthetics can be affected by variation, which is consistently
occurring in manufacturing processes. The department of Robust Design & Tolerancing at
Volvo Car Corporation (VCC) create predictions of variation and in order for the department
to create accurate predictions, all factors causing variation needs to be acknowledged. One
unexplored contributor to the total variation is the variation caused by operators’ during manual
assemblies.
With a desire of wanting to take operator related variation during manual assemblies into
account in the concept phase, physical and virtual tests have been performed making it possible
to compare the results as a first step of research in this area. The future goal is to be able to
quantify this contribution virtually, to avoid the need of creating prototypes and perform
physical tests. To get to this point is a long road. It was also of interest to investigate whether
it was possible to quantify operator related contribution to variation and to learn if it was
possible to evaluate concepts virtually with regards to sensitivity in terms of assembly
variation.
The results revealed that it was possible to quantify operator related contribution to variation,
that there was no correlation between the physical and the virtual tests performed but that it
was possible to evaluate the sensitivity of design concepts with regards to manual assembly.
Keywords: Geometrical variation, Robust design, RD&T, Manual assembly
Acknowledgement
This master’s thesis was conducted at the department of Robust Design and Tolerancing at
Volvo Car Corporation (VCC) and at the department of Product and Production development
at Chalmers University of Technology. The author of the thesis, Sofia Wikstrand, has attended
the master’s programme in Production Management Engineering and the project was
conducted during the spring of 2016.
Several obstacles have been encountered during this project, making this project educational
in many ways. Support from both VCC and Chalmers made the obstacles possible to overcome.
I would like to express my gratitude to my supervisors for the support given. Dag Johansson,
supervisor at VCC, has throughout the entire process been available for questions, discussions
and pep talks when needed. Lars Lindkvist, supervisor at Chalmers, contributed to this project
by providing help with simulations, by always being able to answer questions on short notice
and by providing food for thought, enhancing the thesis. I would also like to express my
gratitude to the personnel at VCC that in some way or another has provided me with material
or expertise needed.
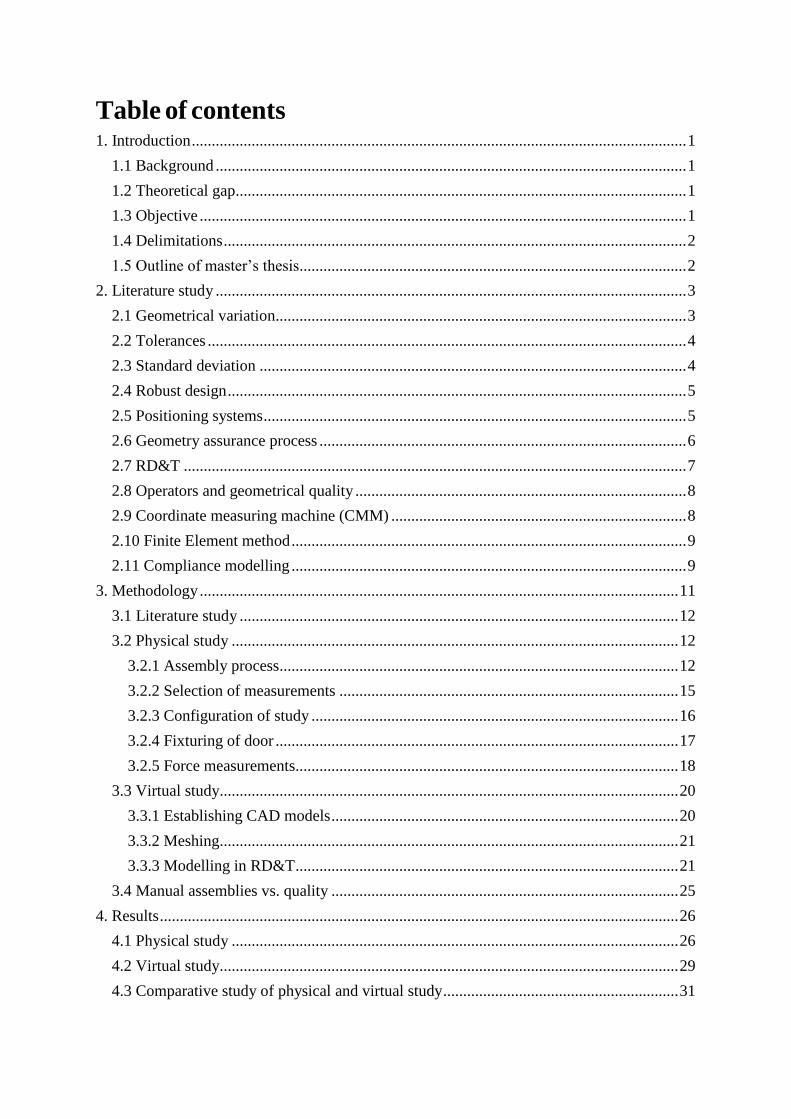
Table of contents
1. Introduction ............................................................................................................................ 1
1.1 Background ...................................................................................................................... 1
1.2 Theoretical gap................................................................................................................. 1
1.3 Objective .......................................................................................................................... 1
1.4 Delimitations .................................................................................................................... 2
1.5 Outline of master’s thesis................................................................................................. 2
2. Literature study ...................................................................................................................... 3
2.1 Geometrical variation....................................................................................................... 3
2.2 Tolerances ........................................................................................................................ 4
2.3 Standard deviation ........................................................................................................... 4
2.4 Robust design ................................................................................................................... 5
2.5 Positioning systems .......................................................................................................... 5
2.6 Geometry assurance process ............................................................................................ 6
2.7 RD&T .............................................................................................................................. 7
2.8 Operators and geometrical quality ................................................................................... 8
2.9 Coordinate measuring machine (CMM) .......................................................................... 8
2.10 Finite Element method ................................................................................................... 9
2.11 Compliance modelling ................................................................................................... 9
3. Methodology ........................................................................................................................ 11
3.1 Literature study .............................................................................................................. 12
3.2 Physical study ................................................................................................................ 12
3.2.1 Assembly process.................................................................................................... 12
3.2.2 Selection of measurements ..................................................................................... 15
3.2.3 Configuration of study ............................................................................................ 16
3.2.4 Fixturing of door ..................................................................................................... 17
3.2.5 Force measurements................................................................................................ 18
3.3 Virtual study................................................................................................................... 20
3.3.1 Establishing CAD models ....................................................................................... 20
3.3.2 Meshing................................................................................................................... 21
3.3.3 Modelling in RD&T ................................................................................................ 21
3.4 Manual assemblies vs. quality ....................................................................................... 25
4. Results .................................................................................................................................. 26
4.1 Physical study ................................................................................................................ 26
4.2 Virtual study................................................................................................................... 29
4.3 Comparative study of physical and virtual study ........................................................... 31
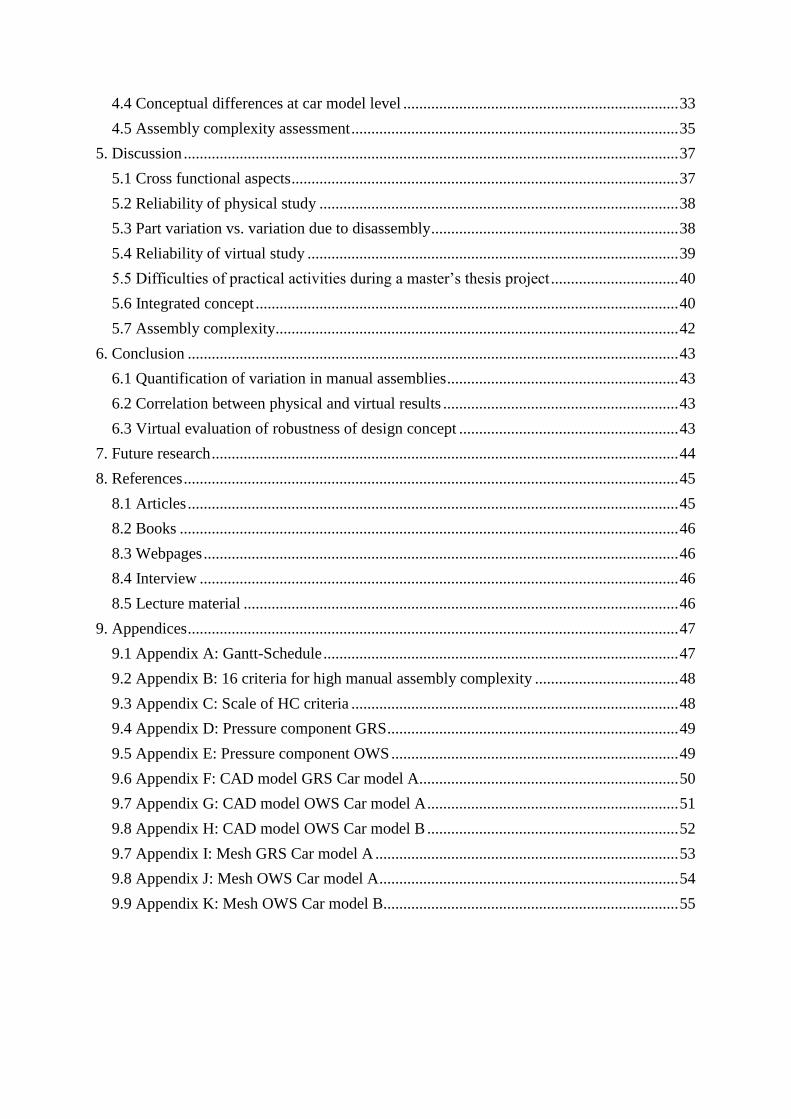
4.4 Conceptual differences at car model level ..................................................................... 33
4.5 Assembly complexity assessment .................................................................................. 35
5. Discussion ............................................................................................................................ 37
5.1 Cross functional aspects ................................................................................................. 37
5.2 Reliability of physical study .......................................................................................... 38
5.3 Part variation vs. variation due to disassembly .............................................................. 38
5.4 Reliability of virtual study ............................................................................................. 39
5.5 Difficulties of practical activities during a master’s thesis project ................................ 40
5.6 Integrated concept .......................................................................................................... 40
5.7 Assembly complexity..................................................................................................... 42
6. Conclusion ........................................................................................................................... 43
6.1 Quantification of variation in manual assemblies .......................................................... 43
6.2 Correlation between physical and virtual results ........................................................... 43
6.3 Virtual evaluation of robustness of design concept ....................................................... 43
7. Future research ..................................................................................................................... 44
8. References ............................................................................................................................ 45
8.1 Articles ........................................................................................................................... 45
8.2 Books ............................................................................................................................. 46
8.3 Webpages ....................................................................................................................... 46
8.4 Interview ........................................................................................................................ 46
8.5 Lecture material ............................................................................................................. 46
9. Appendices ........................................................................................................................... 47
9.1 Appendix A: Gantt-Schedule ......................................................................................... 47
9.2 Appendix B: 16 criteria for high manual assembly complexity .................................... 48
9.3 Appendix C: Scale of HC criteria .................................................................................. 48
9.4 Appendix D: Pressure component GRS ......................................................................... 49
9.5 Appendix E: Pressure component OWS ........................................................................ 49
9.6 Appendix F: CAD model GRS Car model A................................................................. 50
9.7 Appendix G: CAD model OWS Car model A ............................................................... 51
9.8 Appendix H: CAD model OWS Car model B ............................................................... 52
9.7 Appendix I: Mesh GRS Car model A ............................................................................ 53
9.8 Appendix J: Mesh OWS Car model A ........................................................................... 54
9.9 Appendix K: Mesh OWS Car model B.......................................................................... 55
1
1. Introduction
This section will briefly describe the reasons for initiating this project, what the intentions are
and the delimitations encountered.
1.1 Background
Today, the rivalry in the automotive industry requires supreme quality to stay competitive. The
quality of the final product is greatly affected by the variation accumulated in the development
process, making this an important aspect to consider. Manufacturing activities consistently
cause variation, implying that variation is inevitable (Söderberg, et.al., 2006). Volvo Car
Corporation (VCC) has to work proactively in this field in order to provide their customers
with high quality products. The causes of variation are part variation, assembly variation and
variation caused by the design concept (Söderberg, 1998). One of the main issues caused by
variation regards aesthetical flaws since variation can cause unappealing split-lines, affecting
perceived quality negatively (Forslund et.al., 2011). To manage variation, robust solutions are
established aiming at developing concepts that are insensitive regarding variation (Söderberg
and Lindkvist, 1999). By developing robust design concepts, the geometrical quality can be
improved.
VCC has a specific department working with establishing robust designs, called Robust Design
and Tolerancing. The department is responsible for the geometry assurance work performed at
R&D level by working solely in the software RD&T (Robust Design & Tolerancing), a
software enabling variation simulation.
1.2 Theoretical gap
The accuracy of the predictions of variation performed by the department of Robust Design
and Tolerancing could be improved by being able to quantify the operators’ influence on
variation during manual assemblies virtually. Hence, there is no method of doing this today
indicating great potentials of improvement. During manual assemblies operators’ can affect the
position of the ingoing components, which can cause variation in the final product. Today, the
department evaluate concepts virtually using part as well as process tolerances. The process
variation is a collection of factors that can influence variation, and one of the factors is the
variation caused during manual assemblies. At macro level the process variation is known, but
each factor’s influence at micro level is generally unknown. The variation caused during
manual assemblies is estimated approximately, which affects the accuracy of the predictions
negatively (Johansson, 2016). Being able to anticipate this variation with high accuracy in early
phases virtually could enable ruling out concepts that are likely to be sensitive to assembly
variation without having to create expensive prototypes to verify concepts physically. It would
also enable improved accuracy of the predictions of the accumulated variation in the final
product.
1.3 Objective
In a long term perspective, for VCC, the objective is to improve the concordance between the
variation present in the final product and the variation estimated virtually in early stages of
development by making more accurate predictions of variation stemming from manual
assemblies. The objective of this master’s thesis is to investigate whether it is possible to
2
quantify operator related variation in manual assembles and to develop methods to perform
physical and virtual tests to investigate whether a correlation of the physical and virtual results
can be identified. By measuring how the position of articles deviates from their nominal
position during repeated manual assembly and performing a virtual study, based on the results
from the physical study, it is possible to investigate whether a correlation between the practical
and the theoretical tests can be detected, which could be an important step in the development
of being able to consider variation caused by operators’ during manual assemblies in an early
stage of product development. In addition to this, it is of interest to investigate whether it is
possible to evaluate the robustness of the design concepts in an early stage of development
when it comes to assembly variation.
The research questions can therefore be expressed as:
Can operator related variation in manual assemblies be quantified?
Is it possible to distinguish a correlation between virtual simulations of manual
assemblies and actual manual assemblies?
Can a virtual software be used to predict the robustness of a design concept, with
regards to manual assemblies?
1.4 Delimitations
The master’s thesis project was in progress during 20 weeks and began 18th of January 2016, a
Gantt-schedule can be viewed in Appendix A.
During the physical and virtual tests performed in the project, the number of articles studied
was limited by the resources given. Two different articles, for two car models, were studied.
The methods used during the project was also limited by the resources available.
This project considers one specific approach of comparing virtual and physical results
regarding manual assemblies. Hence, there are many alternative ways of performing such tests.
1.5 Outline of master’s thesis
The first section of this report describes the background and the objective of this project. The
following section, the literature study, provides the reader with relevant facts supporting the
project. The literature study includes explanations of geometrical variation, tolerances,
standard deviation, robust design, positioning systems, the geometrical assurance process,
RD&T, operators and geometrical quality, coordinate measuring machines, the finite element
method and compliance modelling. The third section explains the methodology used during
the master’s thesis. The fourth section reveals the results, followed by the fifth section that aims
at discussing the results and the methods used. At last, conclusions and future research are
presented.
3
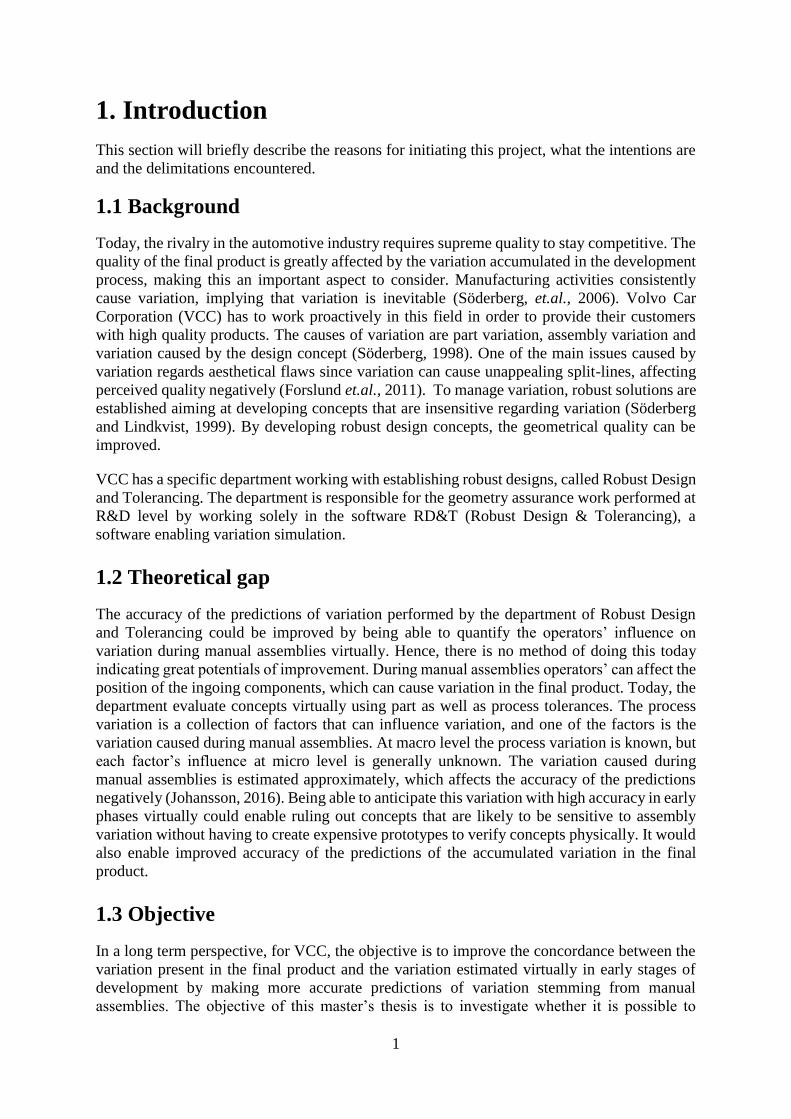
Figure 1. Main contributors to variation (Söderberg, 1998)
2. Literature study
The literature study includes a description of geometrical variation, tolerances and standard
deviation. It also aims at describing what characterizes a robust design and the importance of
appropriately designed positioning systems. The geometry assurance process will be described
as well as the software RD&T. Operators in relation to geometrical quality will be included
and how a Coordinate Measuring Machine (CMM) operates will be presented shortly, since
one have been used during the master thesis. A short and basic description of the Finite Element
(FE) method is also included followed by a section describing compliance.
2.1 Geometrical variation
Manufacturing activities will to some extent always generate variation, causing items produced
to vary from their nominal state (Söderberg et.al., 2006). Reaching competitiveness in the
industry today requires taking this into consideration since geometrical variation greatly
influence quality and cost. The cost of geometry related errors propagate throughout the
product development phases since small errors in an early phase can have severe consequences
as the development progress (Chang and Gossard, 1997). The propagation of geometrical errors
can also cause manufactured components not being able to reach the aesthetical or functional
demands (Söderberg et.al., 2006).
The main causes of variation are component variation, assembly variation as well as variation
due to the design concept, see Figure 1 (Söderberg, 1998). Variation can thus stem from both
shape and positioning of the components. Variation due to the shape of a component,
component variation, implies the disparity among the nominal form and the form which it
actually adopts. Variation stemming from the positioning of a component, assembly variation,
involve the disparity among the nominal position and the positioning that actually takes place
(Chang and Gossard, 1997). Assembly variation can also be explained as the deviation
bounded by the ingoing components in the assembly (Cai, et. al., 2015).
Variation can cause issues regarding the visual relation among components, known as split-
lines. Variation related to split-lines can have an unfavourable impact on the perceived quality
of the product. To manage split-lines effectively, part tolerances and robust solutions are
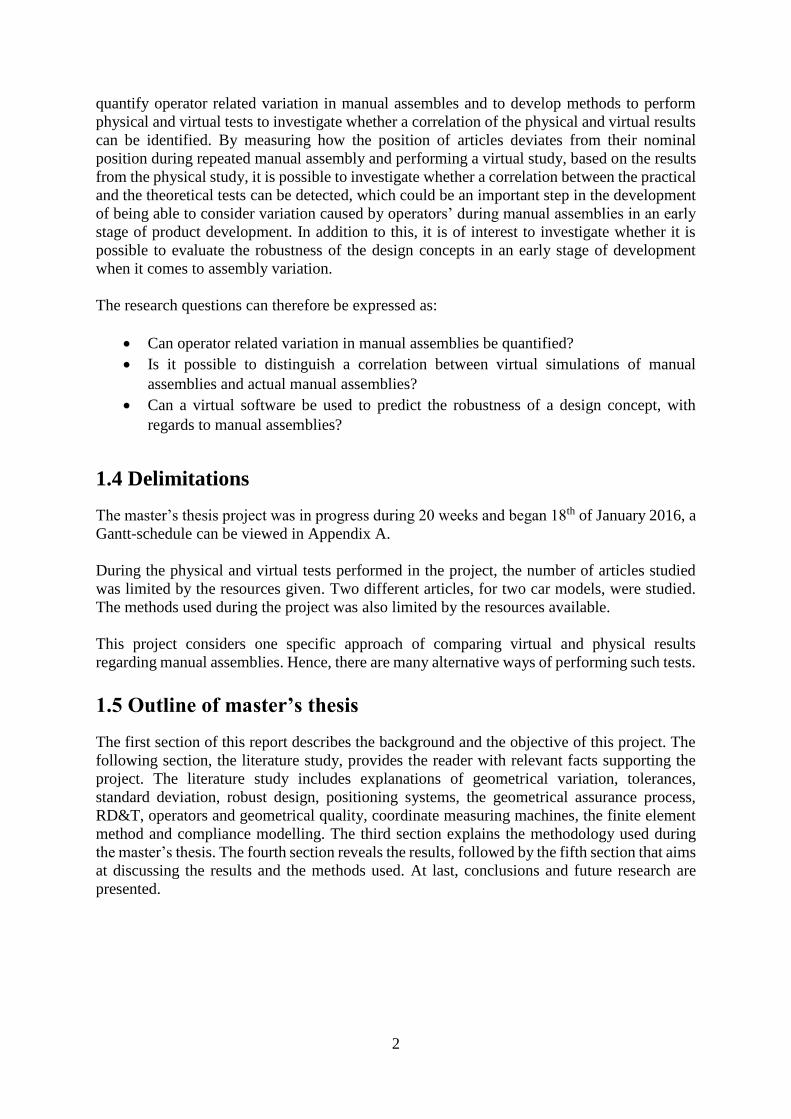
adopted (Forslund et.al., 2011). The two main defects that can occur in the split-line are gap
and flush. Gap is the distance among two parts while flush is the distance among two parts in
normal direction, see Figure 2. Issues with e.g. gaps can have severe consequences for
4
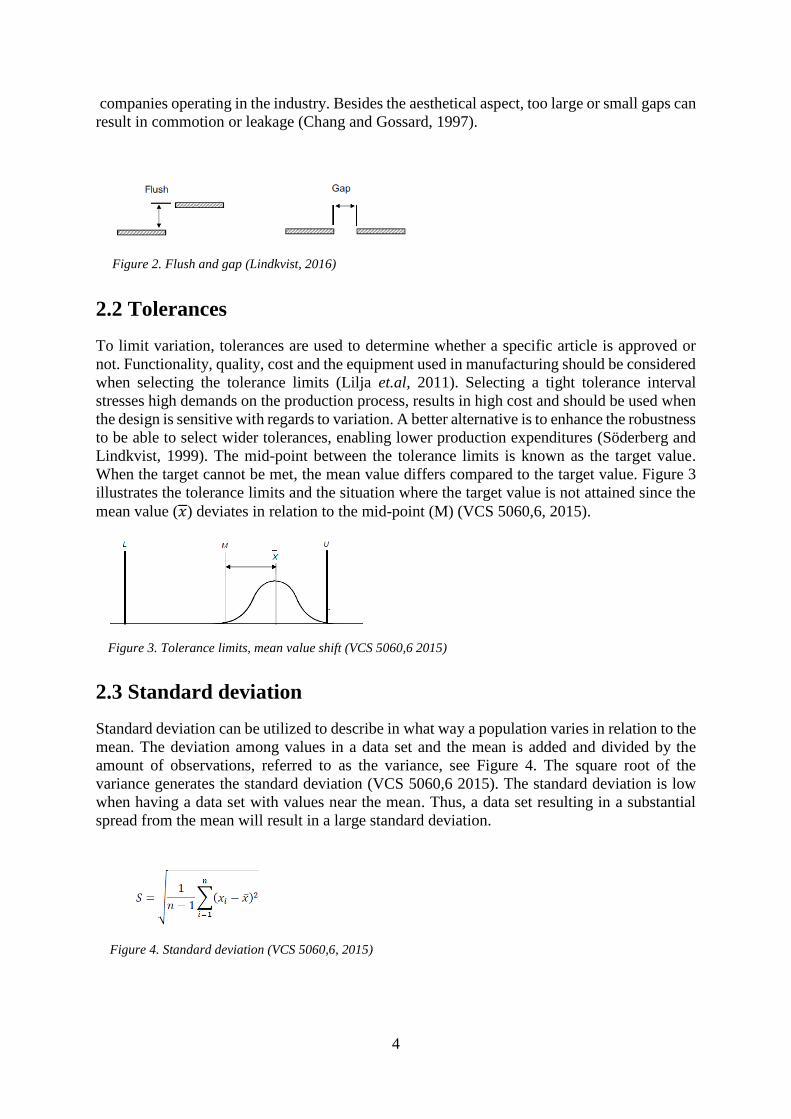
Figure 4. Standard deviation (VCS 5060,6, 2015)
companies operating in the industry. Besides the aesthetical aspect, too large or small gaps can
result in commotion or leakage (Chang and Gossard, 1997).
2.2 Tolerances
To limit variation, tolerances are used to determine whether a specific article is approved or
not. Functionality, quality, cost and the equipment used in manufacturing should be considered
when selecting the tolerance limits (Lilja et.al, 2011). Selecting a tight tolerance interval
stresses high demands on the production process, results in high cost and should be used when
the design is sensitive with regards to variation. A better alternative is to enhance the robustness
to be able to select wider tolerances, enabling lower production expenditures (Söderberg and
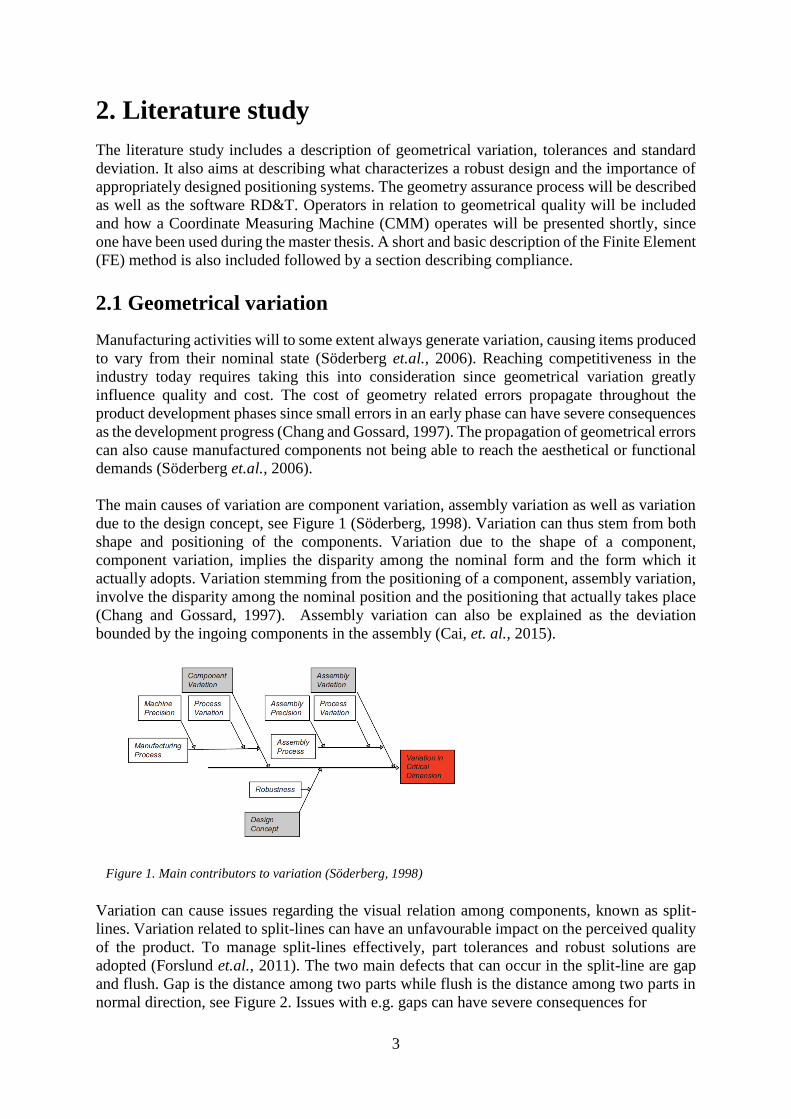
Lindkvist, 1999). The mid-point between the tolerance limits is known as the target value.
When the target cannot be met, the mean value differs compared to the target value. Figure 3
illustrates the tolerance limits and the situation where the target value is not attained since the
mean value (𝑥) deviates in relation to the mid-point (M) (VCS 5060,6, 2015).
2.3 Standard deviation
Standard deviation can be utilized to describe in what way a population varies in relation to the
mean. The deviation among values in a data set and the mean is added and divided by the
amount of observations, referred to as the variance, see Figure 4. The square root of the
variance generates the standard deviation (VCS 5060,6 2015). The standard deviation is low
when having a data set with values near the mean. Thus, a data set resulting in a substantial
spread from the mean will result in a large standard deviation.
Figure 2. Flush and gap (Lindkvist, 2016)
Figure 3. Tolerance limits, mean value shift (VCS 5060,6 2015)
5
2.4 Robust design
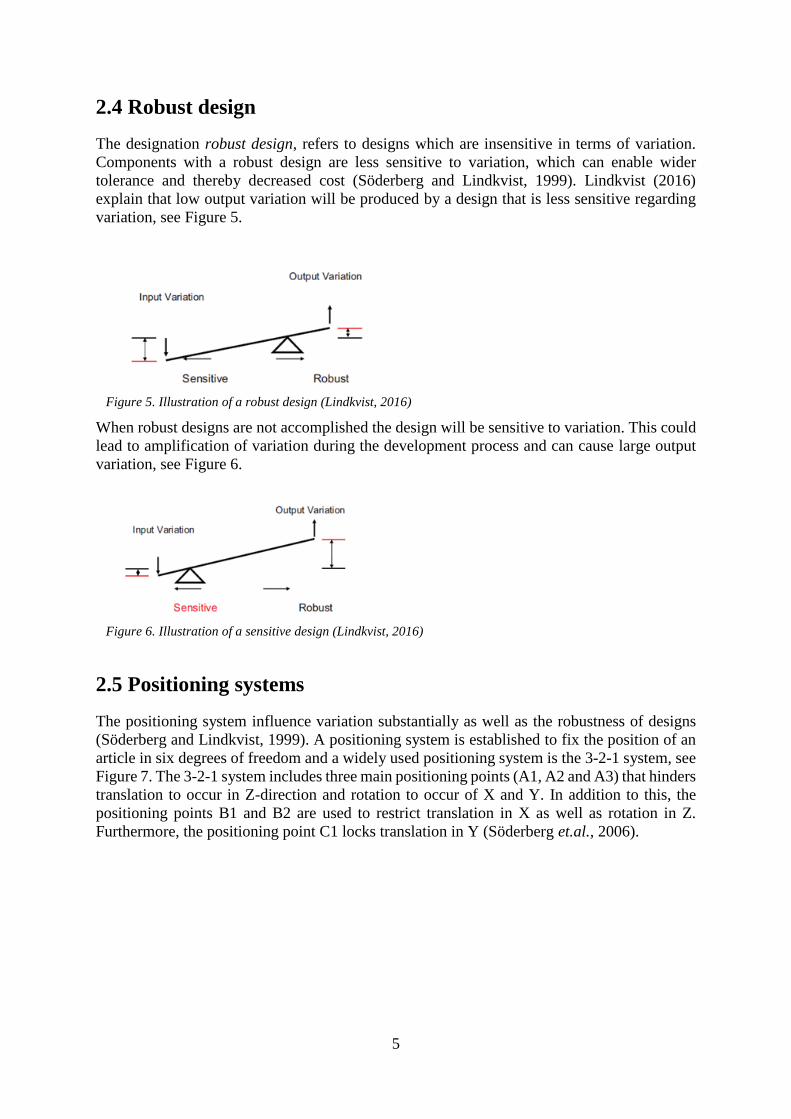
The designation robust design, refers to designs which are insensitive in terms of variation.
Components with a robust design are less sensitive to variation, which can enable wider
tolerance and thereby decreased cost (Söderberg and Lindkvist, 1999). Lindkvist (2016)
explain that low output variation will be produced by a design that is less sensitive regarding
variation, see Figure 5.
When robust designs are not accomplished the design will be sensitive to variation. This could
lead to amplification of variation during the development process and can cause large output
variation, see Figure 6.
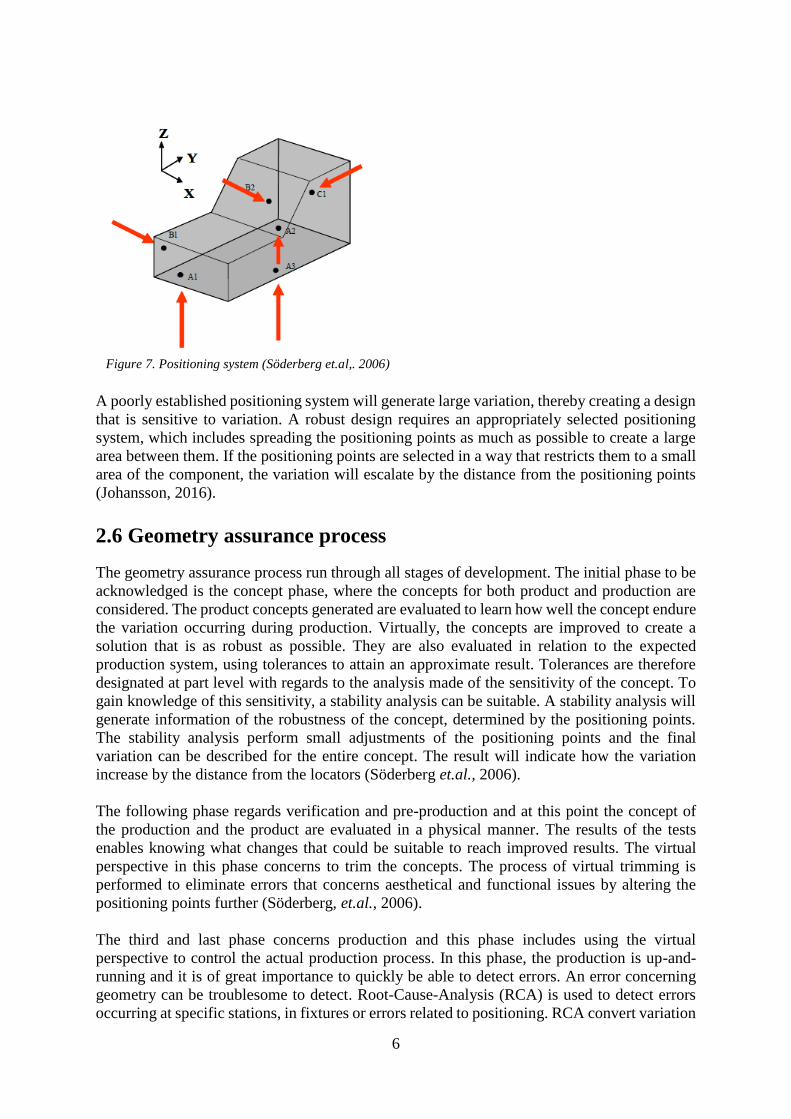
2.5 Positioning systems
The positioning system influence variation substantially as well as the robustness of designs
(Söderberg and Lindkvist, 1999). A positioning system is established to fix the position of an
article in six degrees of freedom and a widely used positioning system is the 3-2-1 system, see
Figure 7. The 3-2-1 system includes three main positioning points (A1, A2 and A3) that hinders
translation to occur in Z-direction and rotation to occur of X and Y. In addition to this, the
positioning points B1 and B2 are used to restrict translation in X as well as rotation in Z.
Furthermore, the positioning point C1 locks translation in Y (Söderberg et.al., 2006).
Figure 5. Illustration of a robust design (Lindkvist, 2016)
Figure 6. Illustration of a sensitive design (Lindkvist, 2016)
6
.
A poorly established positioning system will generate large variation, thereby creating a design
that is sensitive to variation. A robust design requires an appropriately selected positioning
system, which includes spreading the positioning points as much as possible to create a large
area between them. If the positioning points are selected in a way that restricts them to a small
area of the component, the variation will escalate by the distance from the positioning points
(Johansson, 2016).
2.6 Geometry assurance process
The geometry assurance process run through all stages of development. The initial phase to be
acknowledged is the concept phase, where the concepts for both product and production are
considered. The product concepts generated are evaluated to learn how well the concept endure
the variation occurring during production. Virtually, the concepts are improved to create a
solution that is as robust as possible. They are also evaluated in relation to the expected
production system, using tolerances to attain an approximate result. Tolerances are therefore
designated at part level with regards to the analysis made of the sensitivity of the concept. To
gain knowledge of this sensitivity, a stability analysis can be suitable. A stability analysis will
generate information of the robustness of the concept, determined by the positioning points.
The stability analysis perform small adjustments of the positioning points and the final
variation can be described for the entire concept. The result will indicate how the variation
increase by the distance from the locators (Söderberg et.al., 2006).
The following phase regards verification and pre-production and at this point the concept of
the production and the product are evaluated in a physical manner. The results of the tests
enables knowing what changes that could be suitable to reach improved results. The virtual
perspective in this phase concerns to trim the concepts. The process of virtual trimming is
performed to eliminate errors that concerns aesthetical and functional issues by altering the
positioning points further (Söderberg, et.al., 2006).
The third and last phase concerns production and this phase includes using the virtual
perspective to control the actual production process. In this phase, the production is up-and-
running and it is of great importance to quickly be able to detect errors. An error concerning
geometry can be troublesome to detect. Root-Cause-Analysis (RCA) is used to detect errors
occurring at specific stations, in fixtures or errors related to positioning. RCA convert variation
Figure 7. Positioning system (Söderberg et.al,. 2006)
7
existing in production into actions to alter the factors affecting the variation (Söderberg, et.al.,
2006).
2.7 RD&T
The software RD&T, Robust Design & Toleracing, can be used to simulate variation. The
software enables deviations accumulated during manufacturing to be known in advance.
Therefore, RD&T makes it possible to evaluate design concepts without having to create
physical products or perform physical tests. RD&T can be used in the entire geometry
assurance chain, starting with early development phases all the way to actual production.
Positioning systems can be created and stability analysis can be performed to study the
robustness based on the placement of the positioning points. Monte Carlo simulation enables
the software to perform variation analysis. RD&T can also be used for compliance modelling
and the software has a specific module for compliant modelling. The software has a Finite
Element (FE) function, making this possible (RD&T Technology, 2016).
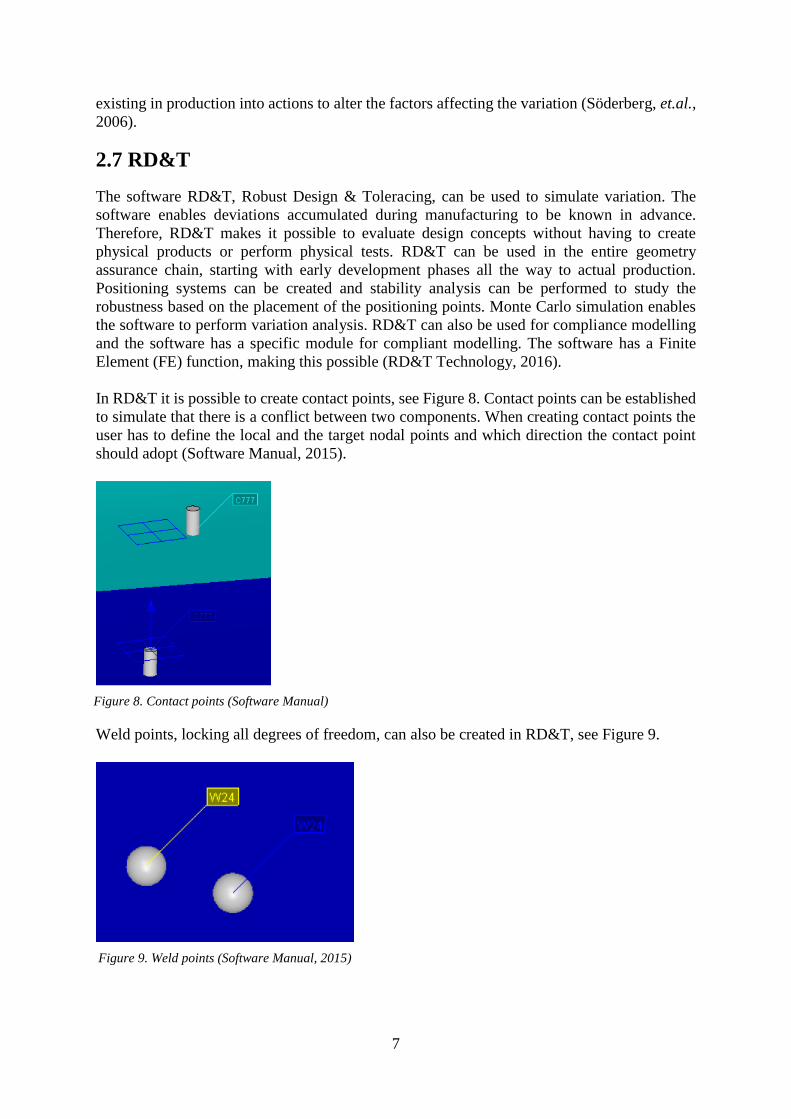
In RD&T it is possible to create contact points, see Figure 8. Contact points can be established
to simulate that there is a conflict between two components. When creating contact points the
user has to define the local and the target nodal points and which direction the contact point
should adopt (Software Manual, 2015).
Weld points, locking all degrees of freedom, can also be created in RD&T, see Figure 9.
Figure 8. Contact points (Software Manual)
Figure 9. Weld points (Software Manual, 2015)

8
2.8 Operators and geometrical quality
Calculations in CAT software’s do not take variation stemming from manual assembly into
account, which affect the accuracy of the predictions of variation. Since the operators during
manual assemblies are not consistently able to lock all positioning points as intended, it is
challenging to estimate the variation stemming from the manual assembly process (Falck,
et.al., 2014). If the operator cannot position a part as expected, the geometrical outcome of the
virtual and the actual world will differ. To improve the CAT simulations, this aspect needs to
be taken into consideration. In order for the operators to succeed to position the component as
expected, it is important that they are given the proper conditions. In assemblies where the
operator is given no feedback when having reached the locating point or where it is hidden, it
is difficult for the operator to succeed (Rosenqvist et.al., 2013). If the production process is not
being acknowledged in the development phase, geometrical issues can occur that later on can
affect the product. The variation can lead to e.g. fitting related issues in further assemblies.
Therefore, it is essential to reduce variation during the manufacturing process (Camelio, et.al.,
2003).
Rosenqvist et.al. (2014) claims that the quality of a product is greatly influenced by the
assembly complexity. The authors use the word “assemblability”, referring to ease of assembly.
Assemblability includes advantageous conditions concerning e.g. positioning. To evaluate
whether an assembly process is complex or not, the authors established “16 criteria for high
manual assembly complexity (HC) considered as tricky and demanding operations”, see
Appendix B. To be able to classify the outcome of this evaluation there is a scale based on the
answers of the questions, which divide the degree of complexity into five categories, see
Appendix C.
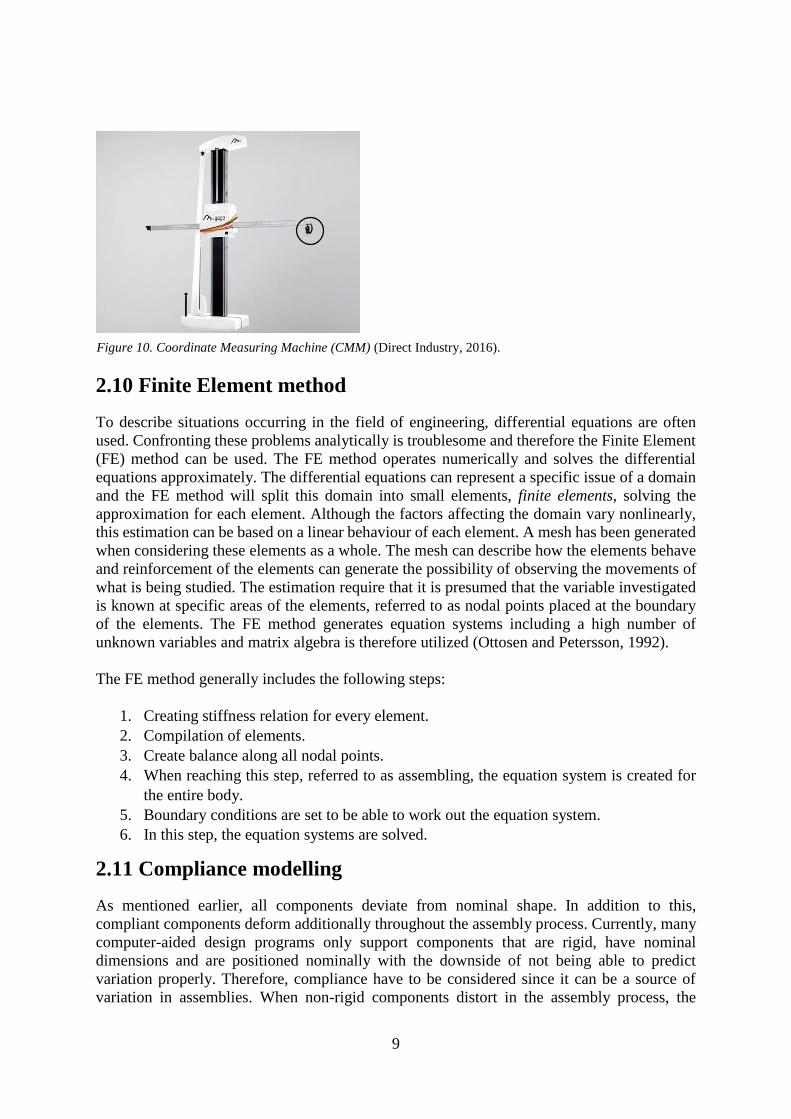
2.9 Coordinate measuring machine (CMM)
Due to an increased importance of producing high-quality products, Coordinate Measuring
Machines (CMMs) are commonly used in the industry today to judge the geometrical quality
of a product. (Agapiou and Du, 2007). CMMs are entire systems, aiming at measuring
coordinates of specific points using a moveable probe. In Figure 10 a CMM is shown and the
black circle indicates the position of the probe. The general parts of a CMM are the actual
machine, the probe used to measure and the software used for the measurements. The software
receives information from the probe, which runs automatically, and the probe registers the
position of the point to be measured in x-, y- and z-direction. The resolution of the CMM
determines the accuracy of the measurements (Globalspec, 2016). To ensure that the CMM
measures with high accuracy the machines have to be recertified every year (Agapiou and Du,
2007).
9
2.10 Finite Element method
To describe situations occurring in the field of engineering, differential equations are often
used. Confronting these problems analytically is troublesome and therefore the Finite Element
(FE) method can be used. The FE method operates numerically and solves the differential
equations approximately. The differential equations can represent a specific issue of a domain
and the FE method will split this domain into small elements, finite elements, solving the
approximation for each element. Although the factors affecting the domain vary nonlinearly,
this estimation can be based on a linear behaviour of each element. A mesh has been generated
when considering these elements as a whole. The mesh can describe how the elements behave
and reinforcement of the elements can generate the possibility of observing the movements of
what is being studied. The estimation require that it is presumed that the variable investigated
is known at specific areas of the elements, referred to as nodal points placed at the boundary
of the elements. The FE method generates equation systems including a high number of
unknown variables and matrix algebra is therefore utilized (Ottosen and Petersson, 1992).
The FE method generally includes the following steps:
1. Creating stiffness relation for every element.
2. Compilation of elements.
3. Create balance along all nodal points.
4. When reaching this step, referred to as assembling, the equation system is created for
the entire body.
5. Boundary conditions are set to be able to work out the equation system.
6. In this step, the equation systems are solved.
2.11 Compliance modelling
As mentioned earlier, all components deviate from nominal shape. In addition to this,
compliant components deform additionally throughout the assembly process. Currently, many
computer-aided design programs only support components that are rigid, have nominal
dimensions and are positioned nominally with the downside of not being able to predict
variation properly. Therefore, compliance have to be considered since it can be a source of
variation in assemblies. When non-rigid components distort in the assembly process, the
Figure 10. Coordinate Measuring Machine (CMM) (Direct Industry, 2016).
10
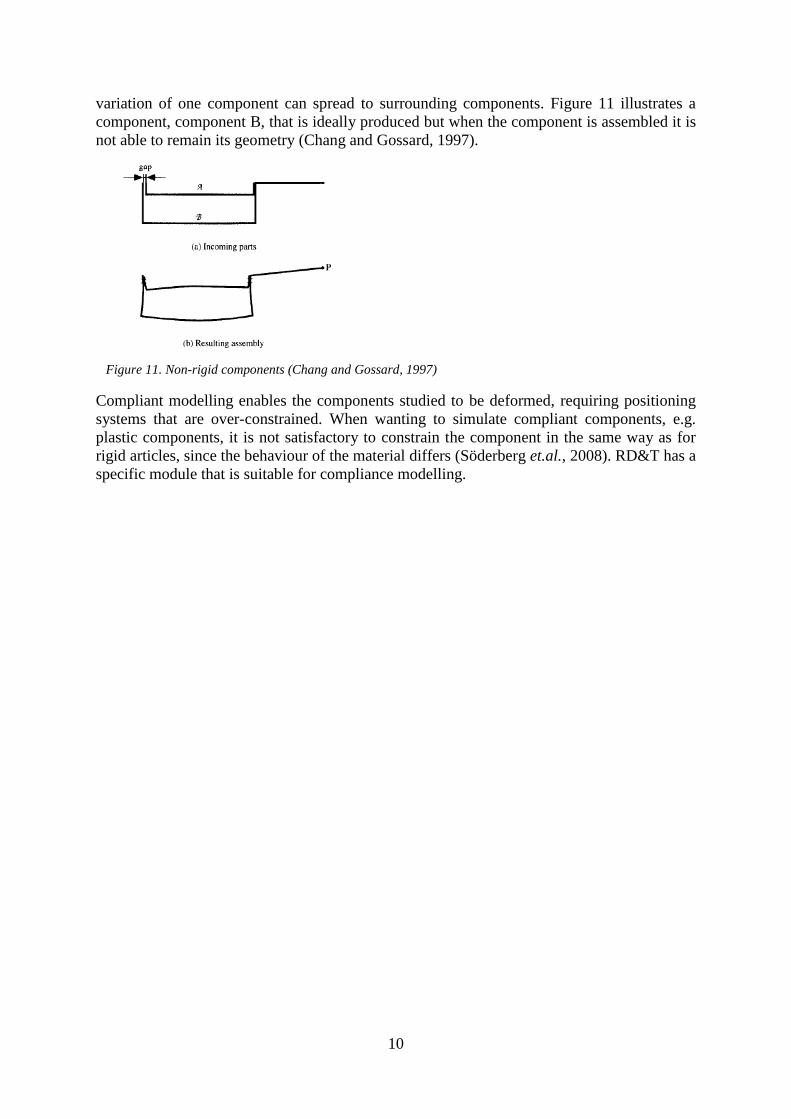
variation of one component can spread to surrounding components. Figure 11 illustrates a
component, component B, that is ideally produced but when the component is assembled it is
not able to remain its geometry (Chang and Gossard, 1997).
Compliant modelling enables the components studied to be deformed, requiring positioning
systems that are over-constrained. When wanting to simulate compliant components, e.g.
plastic components, it is not satisfactory to constrain the component in the same way as for
rigid articles, since the behaviour of the material differs (Söderberg et.al., 2008). RD&T has a
specific module that is suitable for compliance modelling.
Figure 11. Non-rigid components (Chang and Gossard, 1997)
11
3. Methodology
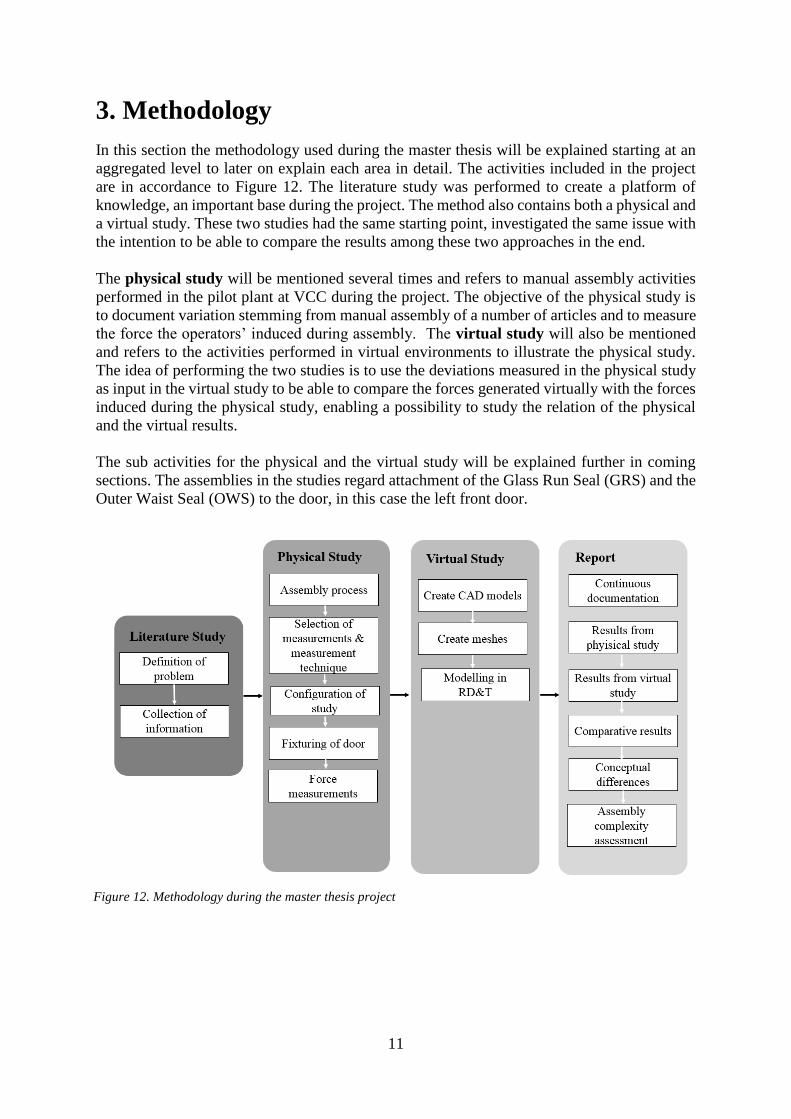
In this section the methodology used during the master thesis will be explained starting at an
aggregated level to later on explain each area in detail. The activities included in the project
are in accordance to Figure 12. The literature study was performed to create a platform of
knowledge, an important base during the project. The method also contains both a physical and
a virtual study. These two studies had the same starting point, investigated the same issue with
the intention to be able to compare the results among these two approaches in the end.
The physical study will be mentioned several times and refers to manual assembly activities
performed in the pilot plant at VCC during the project. The objective of the physical study is
to document variation stemming from manual assembly of a number of articles and to measure
the force the operators’ induced during assembly. The virtual study will also be mentioned
and refers to the activities performed in virtual environments to illustrate the physical study.
The idea of performing the two studies is to use the deviations measured in the physical study
as input in the virtual study to be able to compare the forces generated virtually with the forces
induced during the physical study, enabling a possibility to study the relation of the physical
and the virtual results.
The sub activities for the physical and the virtual study will be explained further in coming
sections. The assemblies in the studies regard attachment of the Glass Run Seal (GRS) and the
Outer Waist Seal (OWS) to the door, in this case the left front door.
Figure 12. Methodology during the master thesis project
12
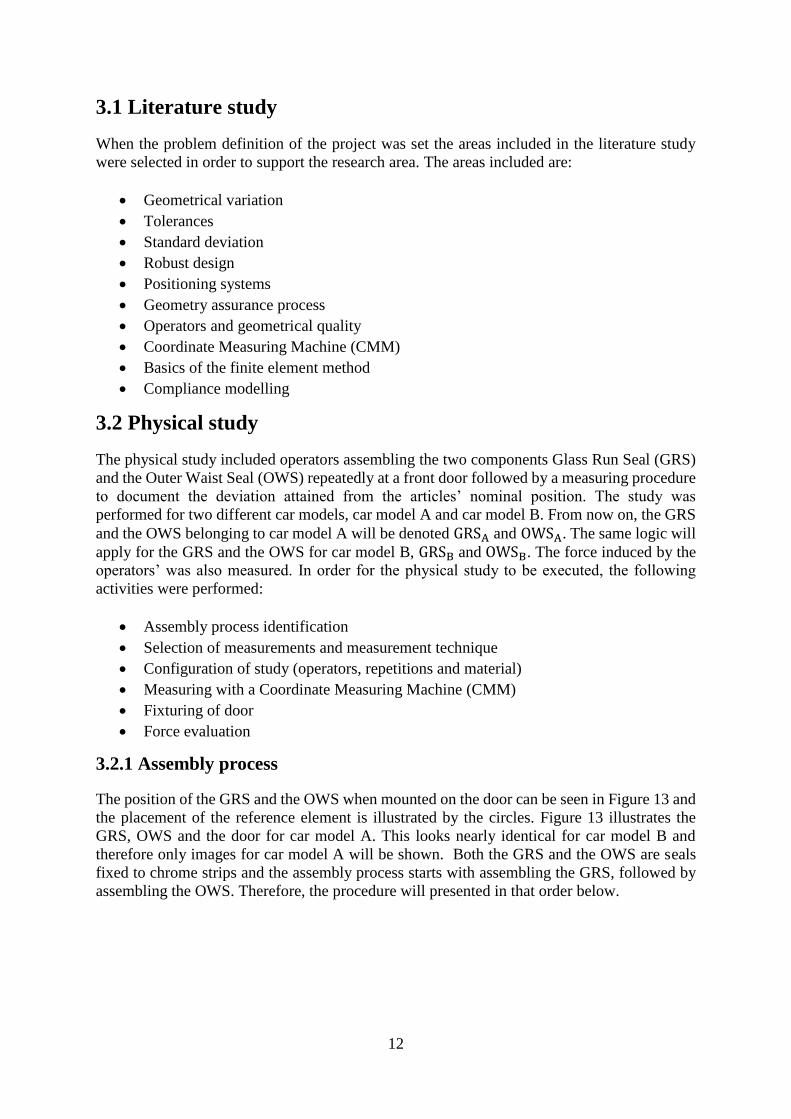
3.1 Literature study
When the problem definition of the project was set the areas included in the literature study
were selected in order to support the research area. The areas included are:
Geometrical variation
Tolerances
Standard deviation
Robust design
Positioning systems
Geometry assurance process
Operators and geometrical quality
Coordinate Measuring Machine (CMM)
Basics of the finite element method
Compliance modelling
3.2 Physical study
The physical study included operators assembling the two components Glass Run Seal (GRS)
and the Outer Waist Seal (OWS) repeatedly at a front door followed by a measuring procedure
to document the deviation attained from the articles’ nominal position. The study was
performed for two different car models, car model A and car model B. From now on, the GRS
and the OWS belonging to car model A will be denoted GRSA and OWSA. The same logic will
apply for the GRS and the OWS for car model B, GRSB and OWSB. The force induced by the
operators’ was also measured. In order for the physical study to be executed, the following
activities were performed:
Assembly process identification
Selection of measurements and measurement technique
Configuration of study (operators, repetitions and material)
Measuring with a Coordinate Measuring Machine (CMM)
Fixturing of door
Force evaluation
3.2.1 Assembly process
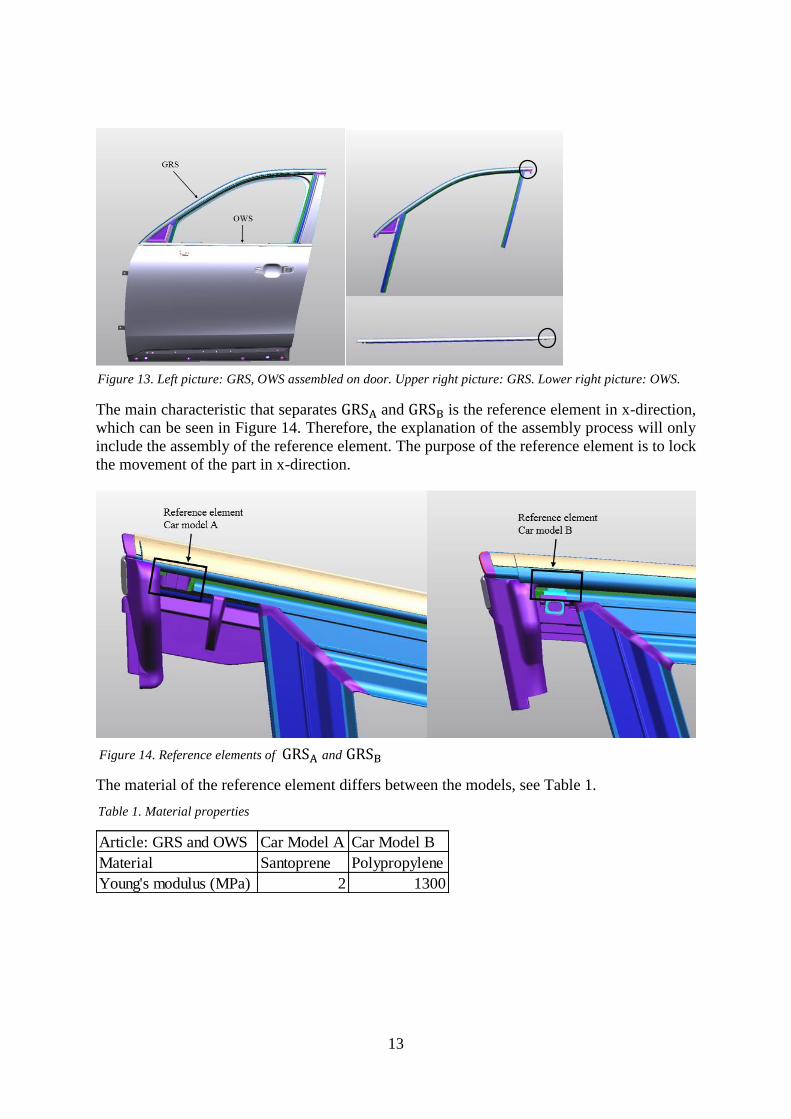
The position of the GRS and the OWS when mounted on the door can be seen in Figure 13 and
the placement of the reference element is illustrated by the circles. Figure 13 illustrates the
GRS, OWS and the door for car model A. This looks nearly identical for car model B and
therefore only images for car model A will be shown. Both the GRS and the OWS are seals
fixed to chrome strips and the assembly process starts with assembling the GRS, followed by
assembling the OWS. Therefore, the procedure will presented in that order below.
13
The main characteristic that separates GRSA and GRSB is the reference element in x-direction,
which can be seen in Figure 14. Therefore, the explanation of the assembly process will only
include the assembly of the reference element. The purpose of the reference element is to lock
the movement of the part in x-direction.
The material of the reference element differs between the models, see Table 1.
Article: GRS and OWS Car Model A Car Model B
Material Santoprene Polypropylene
Young's modulus (MPa) 2 1300
Figure 14. Reference elements of GRSA and GRSB
Figure 13. Left picture: GRS, OWS assembled on door. Upper right picture: GRS. Lower right picture: OWS.
Table 1. Material properties
14
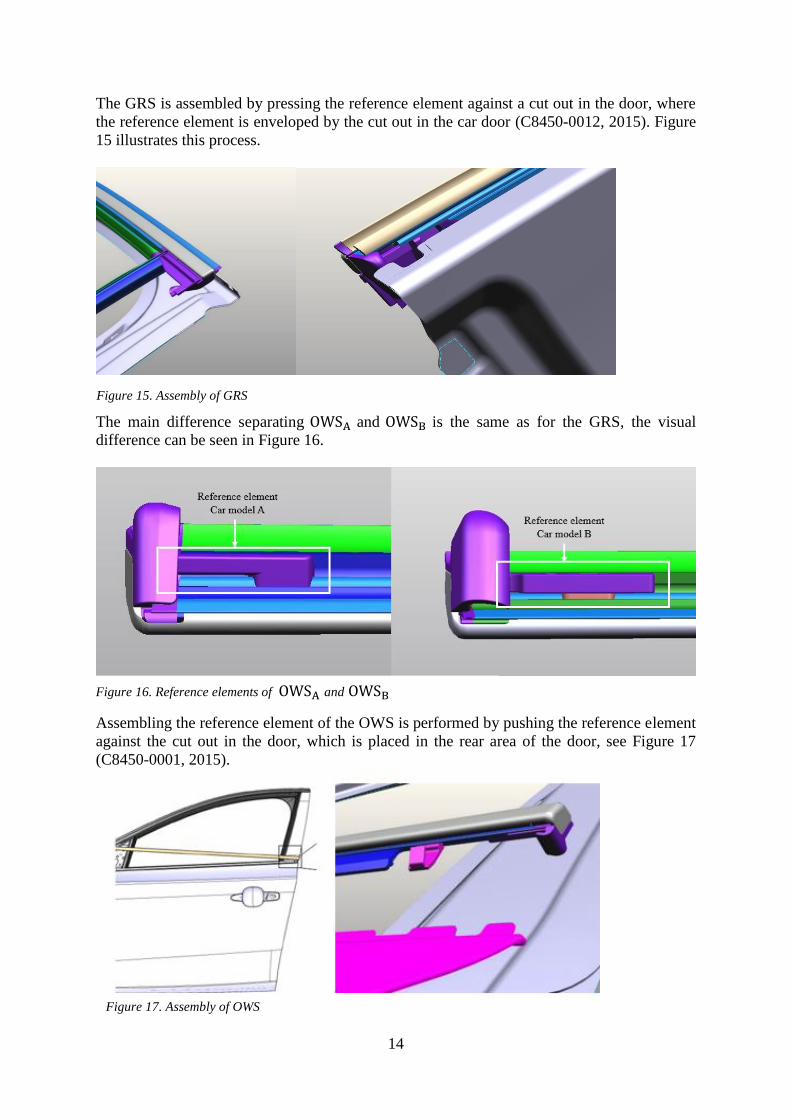
The GRS is assembled by pressing the reference element against a cut out in the door, where
the reference element is enveloped by the cut out in the car door (C8450-0012, 2015). Figure
15 illustrates this process.
The main difference separating OWSA and OWSB is the same as for the GRS, the visual
difference can be seen in Figure 16.
Assembling the reference element of the OWS is performed by pushing the reference element
against the cut out in the door, which is placed in the rear area of the door, see Figure 17
(C8450-0001, 2015).
Figure 15. Assembly of GRS
Figure 16. Reference elements of OWSA and OWSB
Figure 17. Assembly of OWS
15
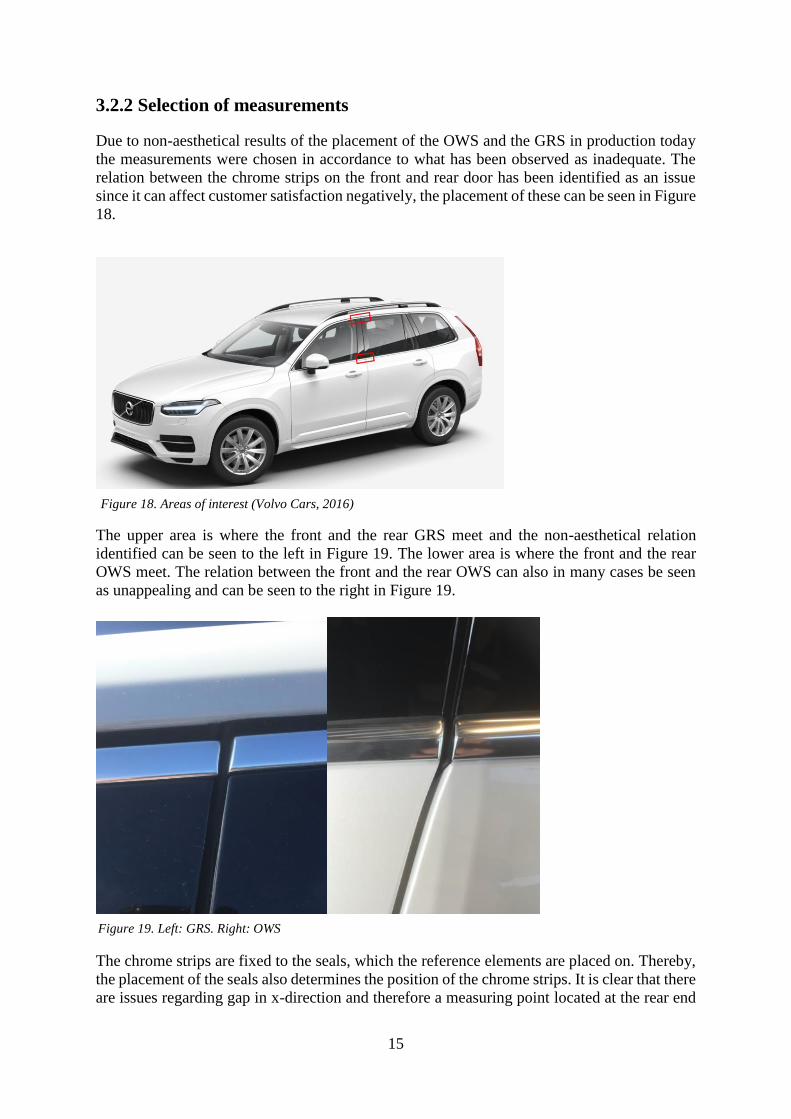
3.2.2 Selection of measurements
Due to non-aesthetical results of the placement of the OWS and the GRS in production today
the measurements were chosen in accordance to what has been observed as inadequate. The
relation between the chrome strips on the front and rear door has been identified as an issue
since it can affect customer satisfaction negatively, the placement of these can be seen in Figure
18.
The upper area is where the front and the rear GRS meet and the non-aesthetical relation
identified can be seen to the left in Figure 19. The lower area is where the front and the rear
OWS meet. The relation between the front and the rear OWS can also in many cases be seen
as unappealing and can be seen to the right in Figure 19.
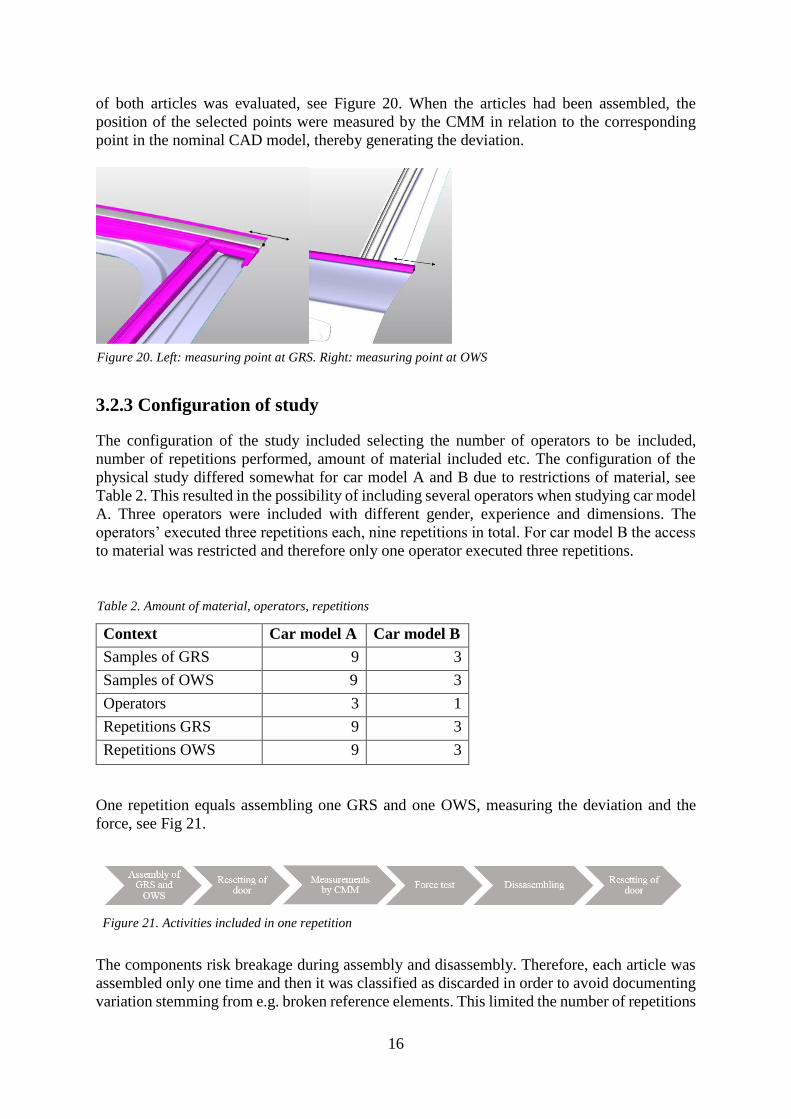
The chrome strips are fixed to the seals, which the reference elements are placed on. Thereby,
the placement of the seals also determines the position of the chrome strips. It is clear that there
are issues regarding gap in x-direction and therefore a measuring point located at the rear end
Figure 18. Areas of interest (Volvo Cars, 2016)
Figure 19. Left: GRS. Right: OWS
16
of both articles was evaluated, see Figure 20. When the articles had been assembled, the
position of the selected points were measured by the CMM in relation to the corresponding
point in the nominal CAD model, thereby generating the deviation.
3.2.3 Configuration of study
The configuration of the study included selecting the number of operators to be included,
number of repetitions performed, amount of material included etc. The configuration of the
physical study differed somewhat for car model A and B due to restrictions of material, see
Table 2. This resulted in the possibility of including several operators when studying car model
A. Three operators were included with different gender, experience and dimensions. The
operators’ executed three repetitions each, nine repetitions in total. For car model B the access
to material was restricted and therefore only one operator executed three repetitions.
One repetition equals assembling one GRS and one OWS, measuring the deviation and the
force, see Fig 21.
The components risk breakage during assembly and disassembly. Therefore, each article was
assembled only one time and then it was classified as discarded in order to avoid documenting
variation stemming from e.g. broken reference elements. This limited the number of repetitions
Context Car model A Car model B
Samples of GRS 9 3
Samples of OWS 9 3
Operators 3 1
Repetitions GRS 9 3
Repetitions OWS 9 3
Figure 20. Left: measuring point at GRS. Right: measuring point at OWS
Table 2. Amount of material, operators, repetitions
Figure 21. Activities included in one repetition
17
performed. Since part variation could contribute to the variation attained during the
measurements, this was examined. The distance between the reference elements and the
placement of the force was measured six times for all samples of the GRSA, OWSA, GRSB and
OWSB. This enabled an average value of the distance for each sample and they could then be
compared to the average among all samples.
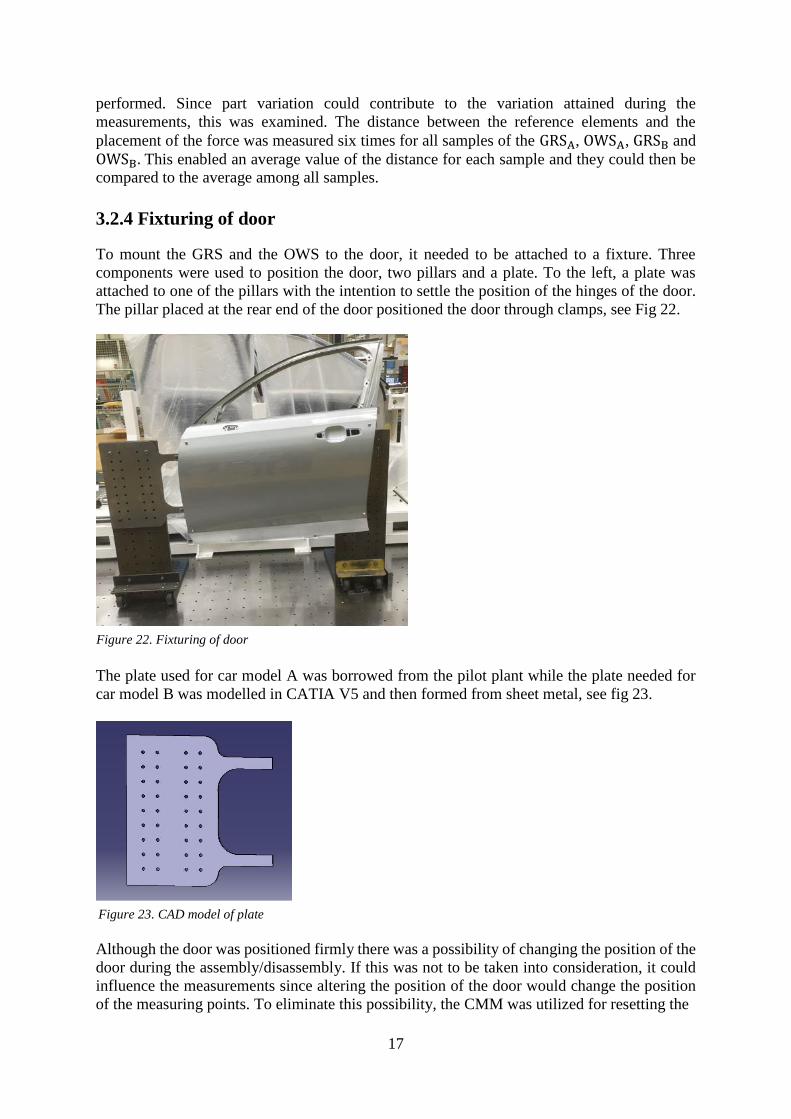
3.2.4 Fixturing of door
To mount the GRS and the OWS to the door, it needed to be attached to a fixture. Three
components were used to position the door, two pillars and a plate. To the left, a plate was
attached to one of the pillars with the intention to settle the position of the hinges of the door.
The pillar placed at the rear end of the door positioned the door through clamps, see Fig 22.
The plate used for car model A was borrowed from the pilot plant while the plate needed for
car model B was modelled in CATIA V5 and then formed from sheet metal, see fig 23.
Although the door was positioned firmly there was a possibility of changing the position of the
door during the assembly/disassembly. If this was not to be taken into consideration, it could
influence the measurements since altering the position of the door would change the position
of the measuring points. To eliminate this possibility, the CMM was utilized for resetting the
Figure 22. Fixturing of door
Figure 23. CAD model of plate
18
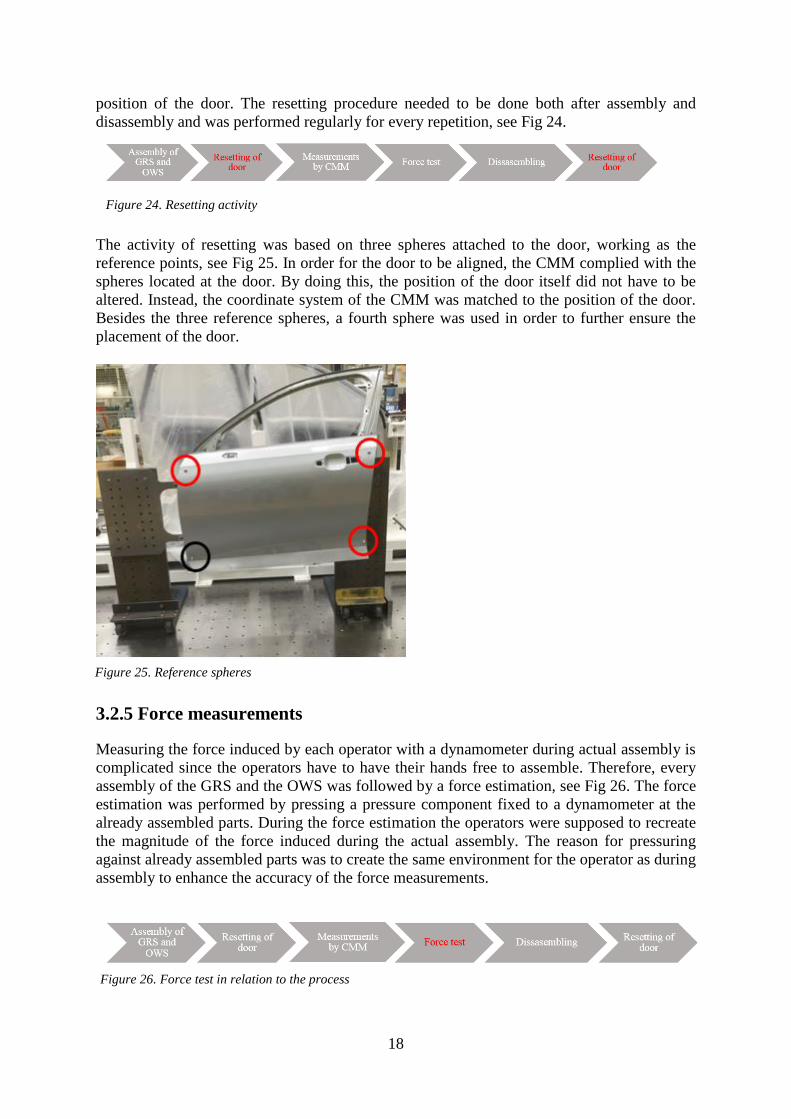
position of the door. The resetting procedure needed to be done both after assembly and
disassembly and was performed regularly for every repetition, see Fig 24.
The activity of resetting was based on three spheres attached to the door, working as the
reference points, see Fig 25. In order for the door to be aligned, the CMM complied with the
spheres located at the door. By doing this, the position of the door itself did not have to be
altered. Instead, the coordinate system of the CMM was matched to the position of the door.
Besides the three reference spheres, a fourth sphere was used in order to further ensure the
placement of the door.
3.2.5 Force measurements
Measuring the force induced by each operator with a dynamometer during actual assembly is
complicated since the operators have to have their hands free to assemble. Therefore, every
assembly of the GRS and the OWS was followed by a force estimation, see Fig 26. The force
estimation was performed by pressing a pressure component fixed to a dynamometer at the
already assembled parts. During the force estimation the operators were supposed to recreate
the magnitude of the force induced during the actual assembly. The reason for pressuring
against already assembled parts was to create the same environment for the operator as during
assembly to enhance the accuracy of the force measurements.
Figure 24. Resetting activity
Figure 25. Reference spheres
Figure 26. Force test in relation to the process
19
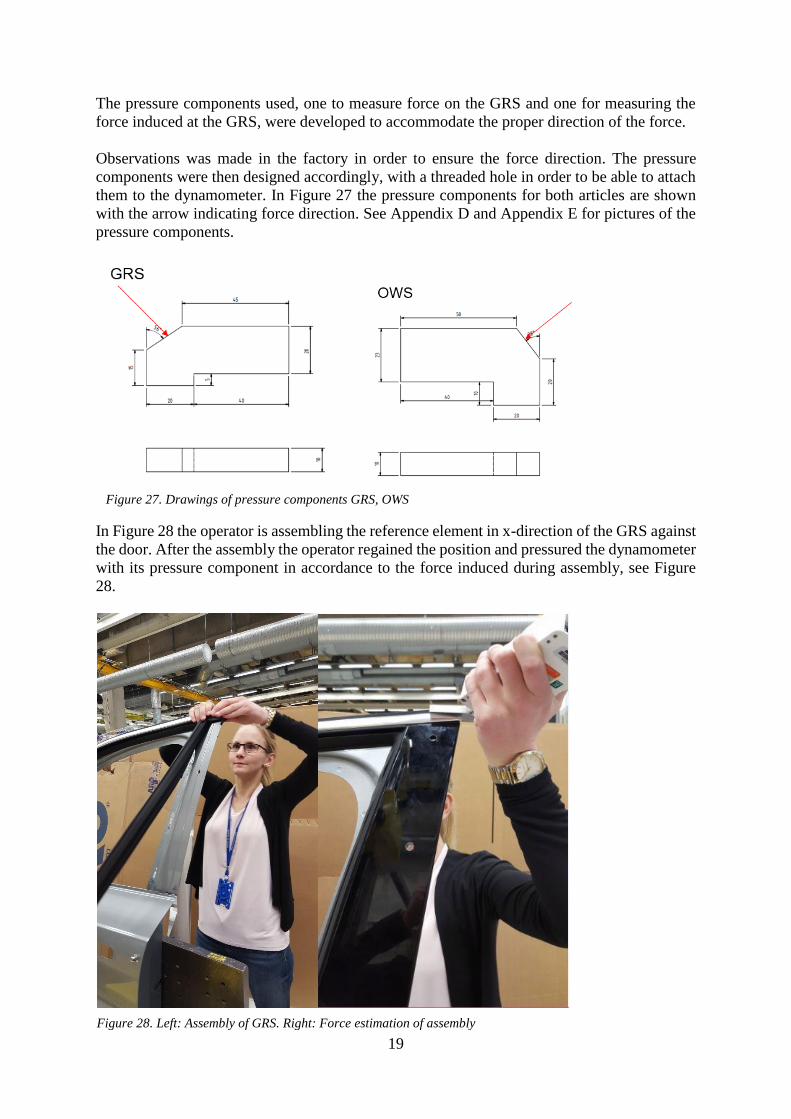
The pressure components used, one to measure force on the GRS and one for measuring the
force induced at the GRS, were developed to accommodate the proper direction of the force.
Observations was made in the factory in order to ensure the force direction. The pressure
components were then designed accordingly, with a threaded hole in order to be able to attach
them to the dynamometer. In Figure 27 the pressure components for both articles are shown
with the arrow indicating force direction. See Appendix D and Appendix E for pictures of the
pressure components.
In Figure 28 the operator is assembling the reference element in x-direction of the GRS against
the door. After the assembly the operator regained the position and pressured the dynamometer
with its pressure component in accordance to the force induced during assembly, see Figure
28.
Figure 27. Drawings of pressure components GRS, OWS
Figure 28. Left: Assembly of GRS. Right: Force estimation of assembly
20
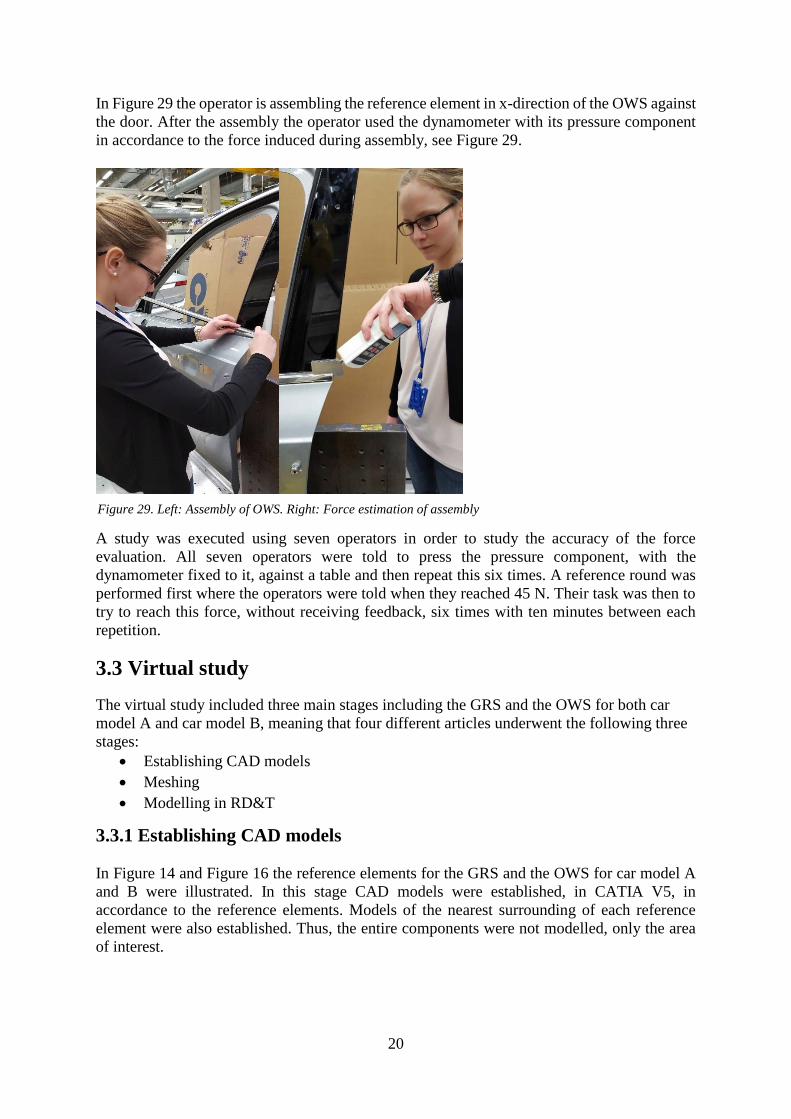
In Figure 29 the operator is assembling the reference element in x-direction of the OWS against
the door. After the assembly the operator used the dynamometer with its pressure component
in accordance to the force induced during assembly, see Figure 29.
A study was executed using seven operators in order to study the accuracy of the force
evaluation. All seven operators were told to press the pressure component, with the
dynamometer fixed to it, against a table and then repeat this six times. A reference round was
performed first where the operators were told when they reached 45 N. Their task was then to
try to reach this force, without receiving feedback, six times with ten minutes between each
repetition.
3.3 Virtual study
The virtual study included three main stages including the GRS and the OWS for both car
model A and car model B, meaning that four different articles underwent the following three
stages:
Establishing CAD models
Meshing
Modelling in RD&T
3.3.1 Establishing CAD models
In Figure 14 and Figure 16 the reference elements for the GRS and the OWS for car model A
and B were illustrated. In this stage CAD models were established, in CATIA V5, in
accordance to the reference elements. Models of the nearest surrounding of each reference
element were also established. Thus, the entire components were not modelled, only the area
of interest.
Figure 29. Left: Assembly of OWS. Right: Force estimation of assembly
21
3.3.2 Meshing
After creating CAD models the work bench “Analysis and Simulation” in CATIA V5 was used
to create meshes. The element size was decreased iteratively until it was no longer possible to
implement the mesh in RD&T.
3.3.3 Modelling in RD&T
The idea of modelling in RD&T was to investigate whether it was possible to attain similar
results virtually, as during the physical study, using the deviations attained during the
assemblies as input and comparing the output in RD&T (force) to the forces documented in the
physical study. This was performed for both car model A and car model B, enabling a
comparison of the two. The young’s modulus for the material of the reference elements of the
articles differ and will therefore be set for each article in RD&T. To reach this state in RD&T
the following steps were performed:
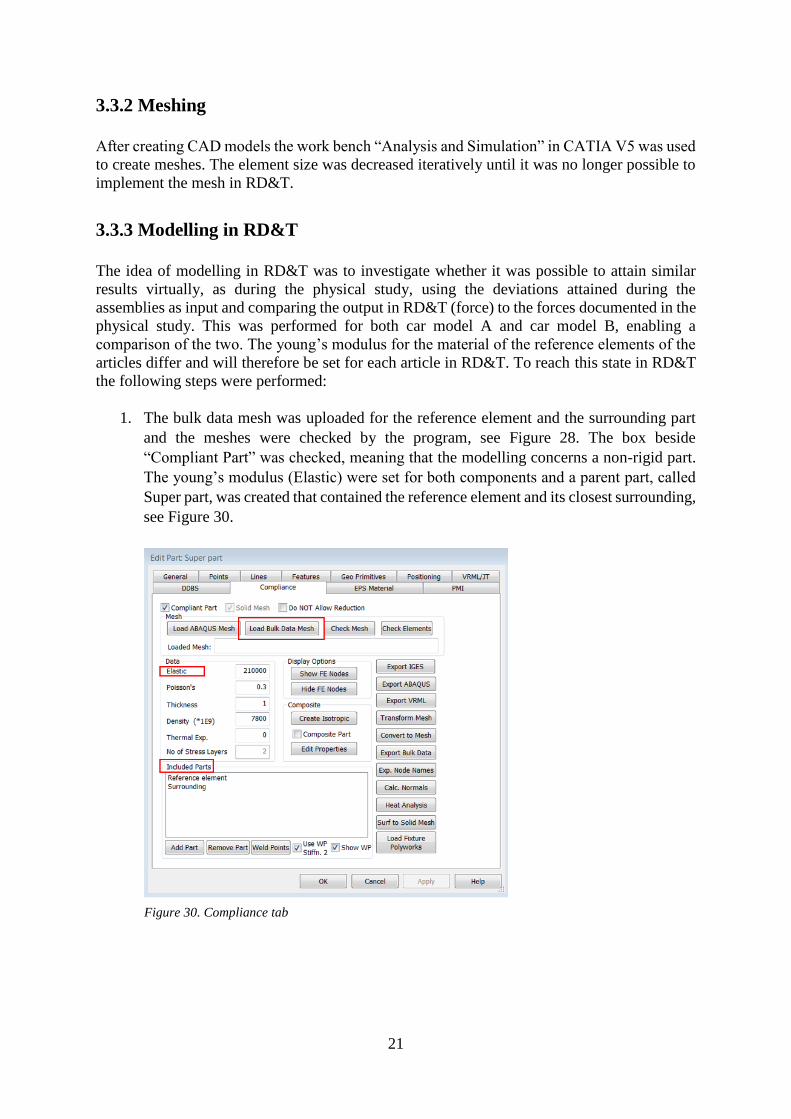
1. The bulk data mesh was uploaded for the reference element and the surrounding part
and the meshes were checked by the program, see Figure 28. The box beside
“Compliant Part” was checked, meaning that the modelling concerns a non-rigid part.
The young’s modulus (Elastic) were set for both components and a parent part, called
Super part, was created that contained the reference element and its closest surrounding,
see Figure 30.
Figure 30. Compliance tab
22
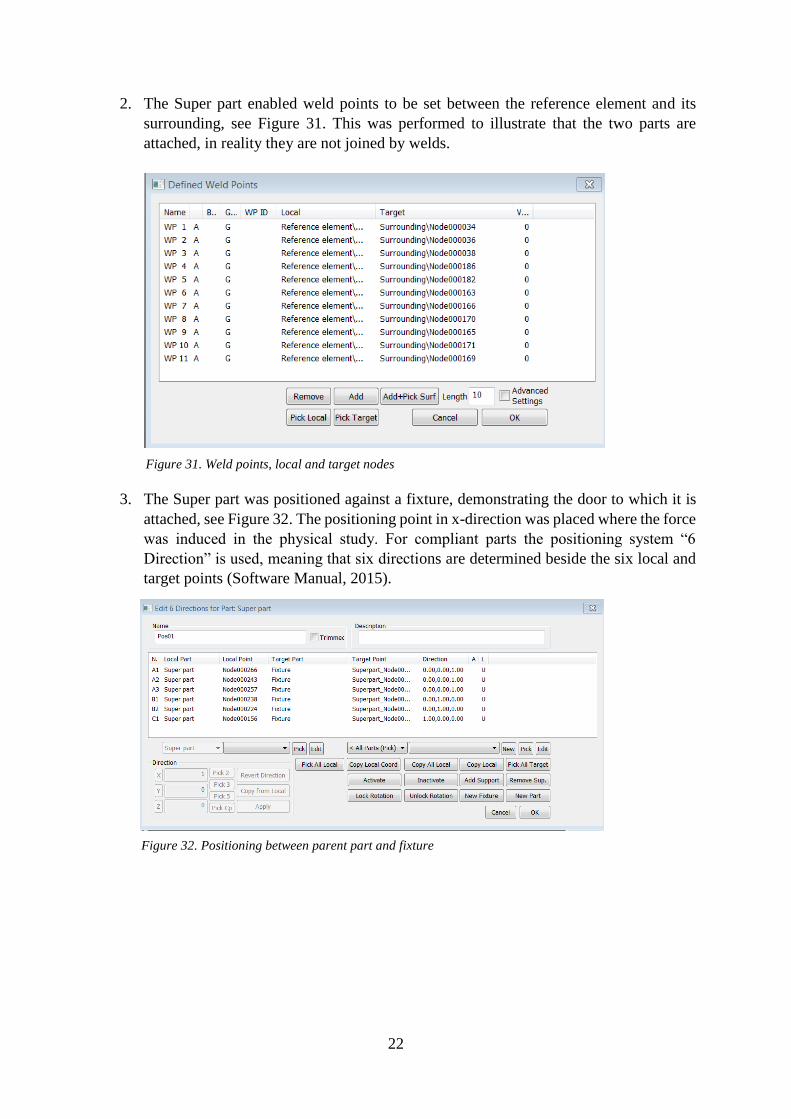
2. The Super part enabled weld points to be set between the reference element and its
surrounding, see Figure 31. This was performed to illustrate that the two parts are
attached, in reality they are not joined by welds.
3. The Super part was positioned against a fixture, demonstrating the door to which it is
attached, see Figure 32. The positioning point in x-direction was placed where the force
was induced in the physical study. For compliant parts the positioning system “6
Direction” is used, meaning that six directions are determined beside the six local and
target points (Software Manual, 2015).
Figure 31. Weld points, local and target nodes
Figure 32. Positioning between parent part and fixture
23
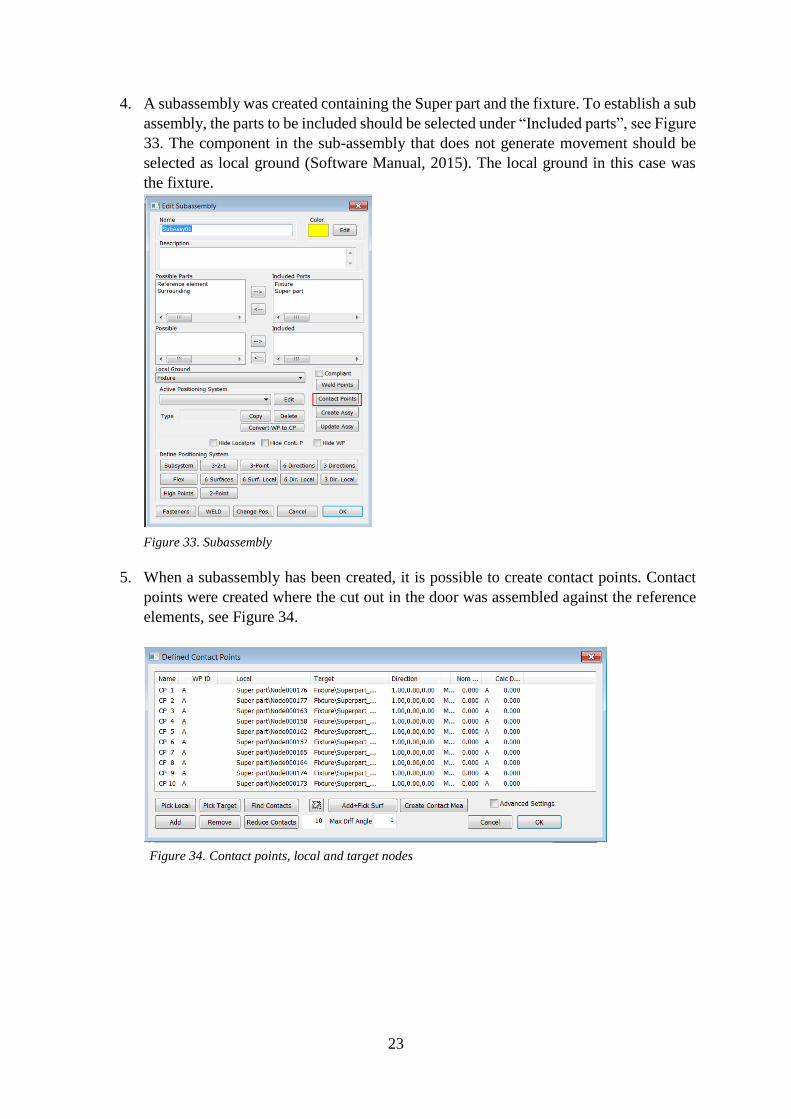
4. A subassembly was created containing the Super part and the fixture. To establish a sub
assembly, the parts to be included should be selected under “Included parts”, see Figure
33. The component in the sub-assembly that does not generate movement should be
selected as local ground (Software Manual, 2015). The local ground in this case was
the fixture.
5. When a subassembly has been created, it is possible to create contact points. Contact
points were created where the cut out in the door was assembled against the reference
elements, see Figure 34.
Figure 34. Contact points, local and target nodes
Figure 33. Subassembly
24
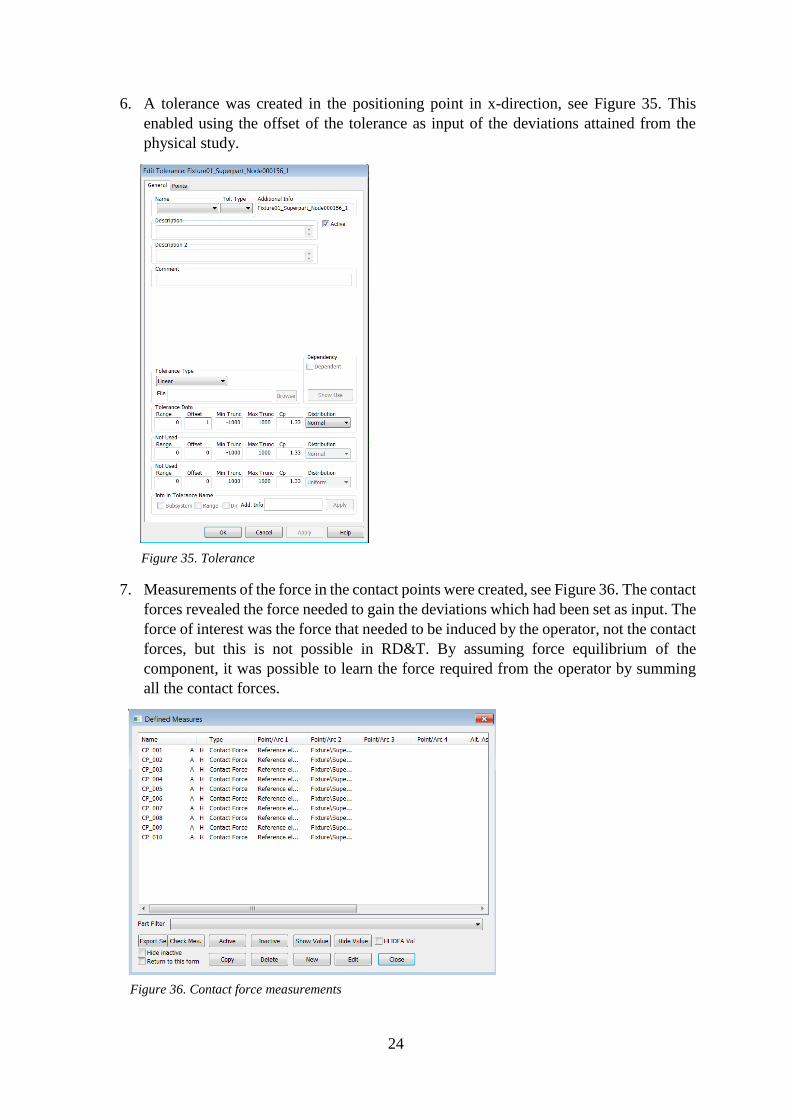
6. A tolerance was created in the positioning point in x-direction, see Figure 35. This
enabled using the offset of the tolerance as input of the deviations attained from the
physical study.
7. Measurements of the force in the contact points were created, see Figure 36. The contact
forces revealed the force needed to gain the deviations which had been set as input. The
force of interest was the force that needed to be induced by the operator, not the contact
forces, but this is not possible in RD&T. By assuming force equilibrium of the
component, it was possible to learn the force required from the operator by summing
all the contact forces.
Figure 35. Tolerance
Figure 36. Contact force measurements
25
8. The variation simulation was performed and the results were visualised.
3.4 Manual assemblies vs. quality
To learn whether the assemblies performed in this project are in themselves contributing to
poor quality, an assessment based on the 16 criteria for high manual assembly complexity was
performed, view Appendix B. The assessment was performed for the assemblies related to car
model A and B.

26
4. Results
This section will present the results of the master thesis project. First off, the results from the
physical study will be presented, aiming at illustrating the deviations measured from the
articles’ nominal position after manual assemblies. The part variation for each article will also
be presented to learn whether the variation measured during the assembly actually stems from
the assemblies alone or not. This will be followed by a presentation of the results generated
during the virtual study and a comparison of the physical and the virtual study is then possible.
Then, a comparison of the conceptual differences of the articles will be performed at car model
level. At last, the results of the assembly complexity assessment will be presented.
4.1 Physical study
During the physical study the placement of the seals were measured after every assembly. The
results gained from the measures will be presented at article level (GRS, OWS) and car model
level (A, B). The deviation from the nominal position of the GRS during repeated assembly is
illustrated in Figure 37. The x-axis represents the number of assemblies and the y-axis
represents the deviation. The chart indicates a substantial spread of the placement of GRSA.
The position of GRSB also varies, but not the same extent. Unfortunately, the articles belonging
to car model B were damaged during transportation from the supplier, which makes it difficult
to proceed with the comparison of this result. Therefore, the results connected to GRSB will
not be considered further.
The same comparison for the OWS is illustrated in Figure 38. Since the Outer Waist Seals were
transported together with the Glass Run Seals there is a possibility that they were damaged as
well, even though this was not visually identifiable. The chart below indicates that the spread
of the placement of OWSA differs largely compared to OWSB B. The underlying cause of the
great spread for OWSA is mainly due to the weak reference element of the component. The
young’s modulus of the reference element attached to the GRS and OWS is much lower for car
model A compared to car model B. A low young’s modulus can generate deformation of the
reference elements, creating greater spread of the placement of the articles. Having such an
0
0,5
1
1,5
2
2,5
3
3,5
4
4,5
0 1 2 3 4 5 6 7 8 9 10
(mm
)
Assembly
Physical study - Assembly vs. mm GRS
Car Model A Car Model B
Figure 37. Deviation from the nominal position of the GRS
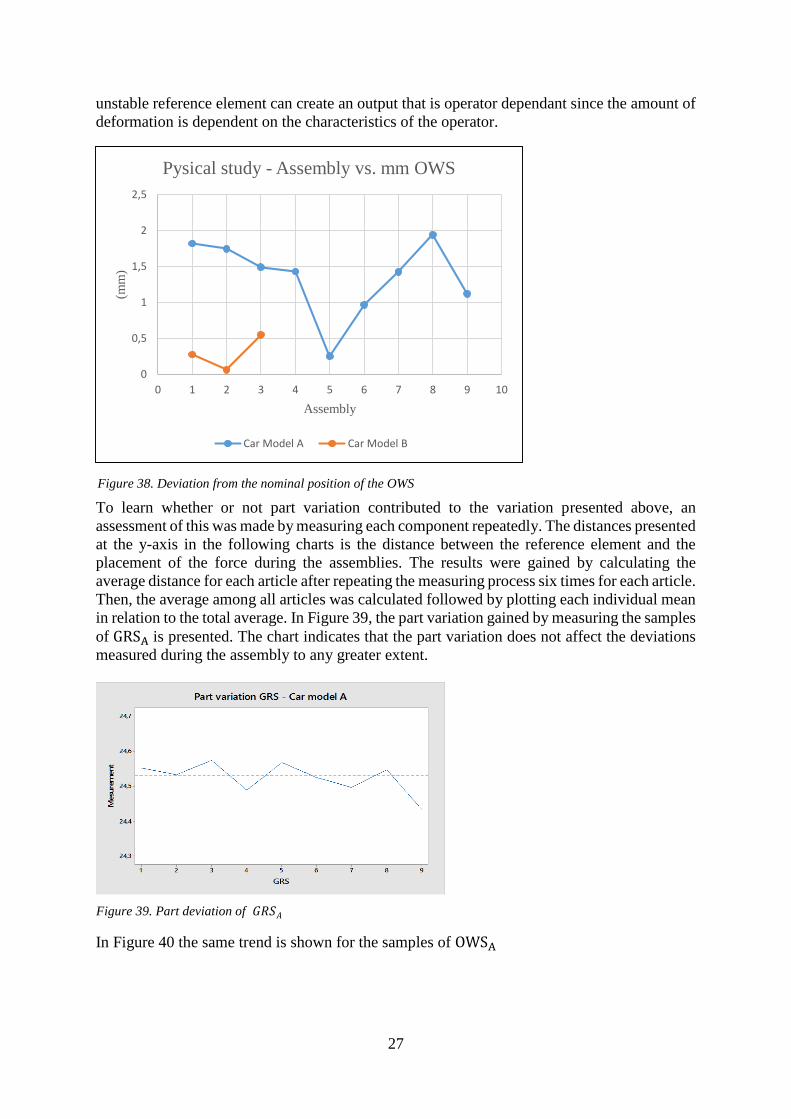
27
unstable reference element can create an output that is operator dependant since the amount of
deformation is dependent on the characteristics of the operator.
To learn whether or not part variation contributed to the variation presented above, an
assessment of this was made by measuring each component repeatedly. The distances presented
at the y-axis in the following charts is the distance between the reference element and the
placement of the force during the assemblies. The results were gained by calculating the
average distance for each article after repeating the measuring process six times for each article.
Then, the average among all articles was calculated followed by plotting each individual mean
in relation to the total average. In Figure 39, the part variation gained by measuring the samples
of GRSA is presented. The chart indicates that the part variation does not affect the deviations
measured during the assembly to any greater extent.
In Figure 40 the same trend is shown for the samples of OWSA
0
0,5
1
1,5
2
2,5
0 1 2 3 4 5 6 7 8 9 10
(mm
)
Assembly
Pysical study - Assembly vs. mm OWS
Car Model A Car Model B
Figure 38. Deviation from the nominal position of the OWS
Figure 39. Part deviation of 𝐺𝑅𝑆𝐴
Figure XX. Methodology during the master thesis project
28
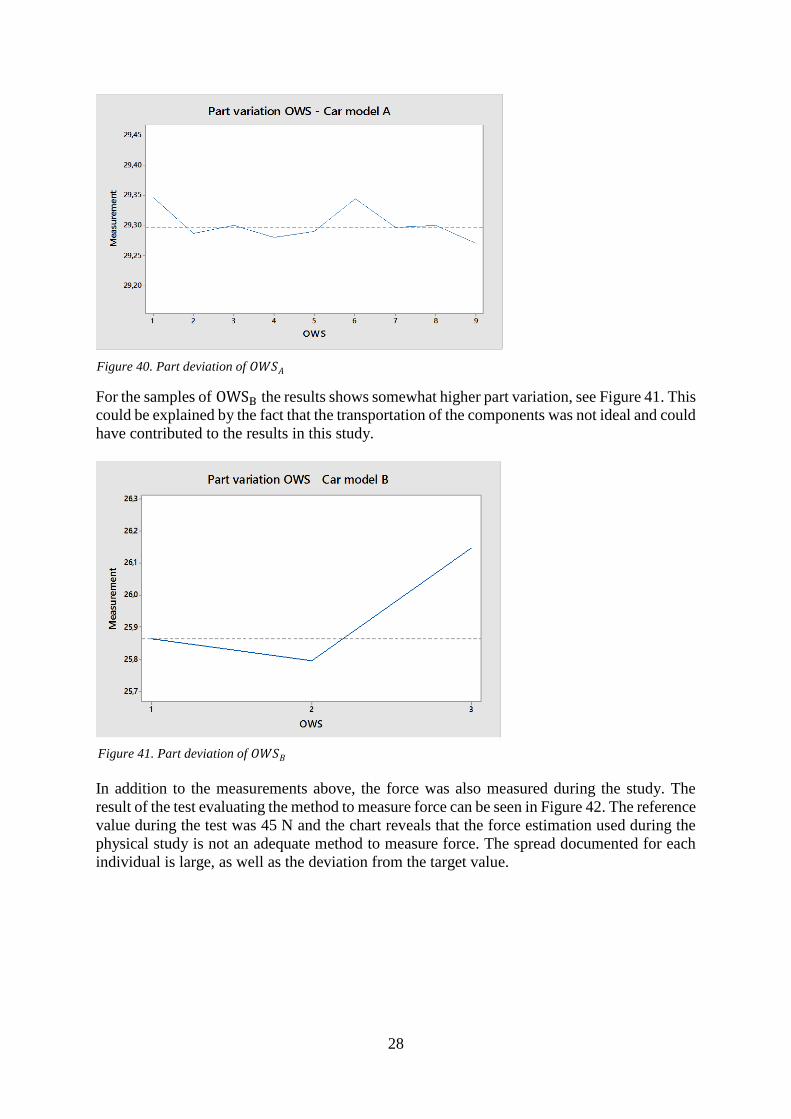
For the samples of OWSB the results shows somewhat higher part variation, see Figure 41. This
could be explained by the fact that the transportation of the components was not ideal and could
have contributed to the results in this study.
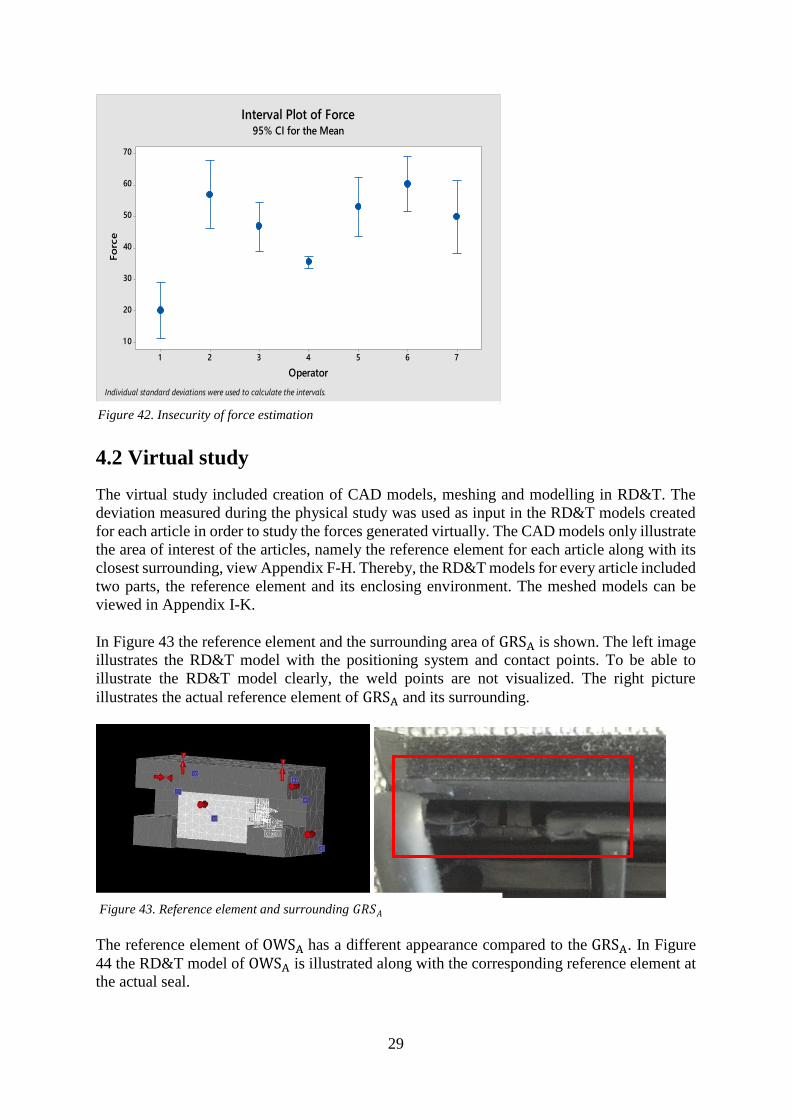
In addition to the measurements above, the force was also measured during the study. The
result of the test evaluating the method to measure force can be seen in Figure 42. The reference
value during the test was 45 N and the chart reveals that the force estimation used during the
physical study is not an adequate method to measure force. The spread documented for each
individual is large, as well as the deviation from the target value.
Figure 40. Part deviation of 𝑂𝑊𝑆𝐴
Figure 41. Part deviation of 𝑂𝑊𝑆𝐵
29
4.2 Virtual study
The virtual study included creation of CAD models, meshing and modelling in RD&T. The
deviation measured during the physical study was used as input in the RD&T models created
for each article in order to study the forces generated virtually. The CAD models only illustrate
the area of interest of the articles, namely the reference element for each article along with its
closest surrounding, view Appendix F-H. Thereby, the RD&T models for every article included
two parts, the reference element and its enclosing environment. The meshed models can be
viewed in Appendix I-K.
In Figure 43 the reference element and the surrounding area of GRSA is shown. The left image
illustrates the RD&T model with the positioning system and contact points. To be able to
illustrate the RD&T model clearly, the weld points are not visualized. The right picture
illustrates the actual reference element of GRSA and its surrounding.
The reference element of OWSA has a different appearance compared to the GRSA. In Figure
44 the RD&T model of OWSA is illustrated along with the corresponding reference element at
the actual seal.
7654321
70
60
50
40
30
20
1 0
Operator
Fo
rce
Interval Plot of Force95% CI for the Mean
Individual standard deviations were used to calculate the intervals.
Figure 42. Insecurity of force estimation
Figure 43. Reference element and surrounding 𝐺𝑅𝑆𝐴
30
The reference element of OWSB is more rigid and its RD&T model and correspondance to the
actual seal is shown in Figure 45.
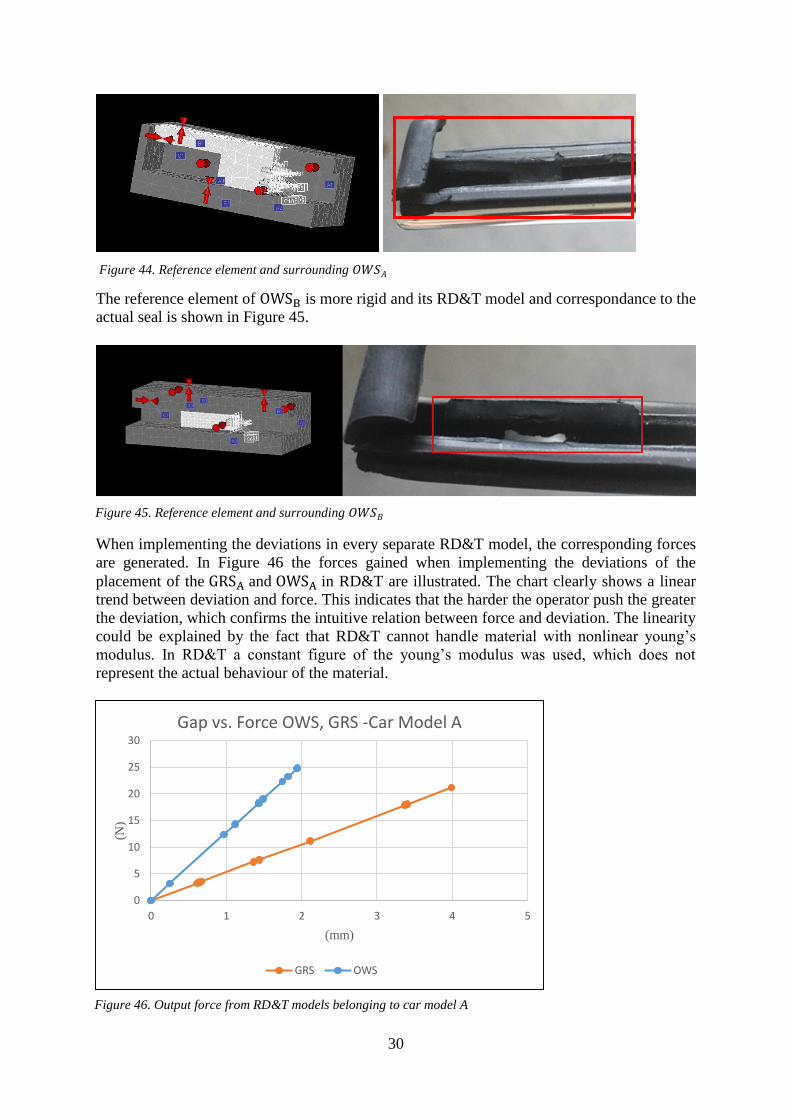
When implementing the deviations in every separate RD&T model, the corresponding forces
are generated. In Figure 46 the forces gained when implementing the deviations of the
placement of the GRSA and OWSA in RD&T are illustrated. The chart clearly shows a linear
trend between deviation and force. This indicates that the harder the operator push the greater
the deviation, which confirms the intuitive relation between force and deviation. The linearity
could be explained by the fact that RD&T cannot handle material with nonlinear young’s
modulus. In RD&T a constant figure of the young’s modulus was used, which does not
represent the actual behaviour of the material.
0
5
10
15
20
25
30
0 1 2 3 4 5
(N)
(mm)
Gap vs. Force OWS, GRS -Car Model A
GRS OWS
Figure 44. Reference element and surrounding 𝑂𝑊𝑆𝐴
Figure 45. Reference element and surrounding 𝑂𝑊𝑆𝐵
Figure 46. Output force from RD&T models belonging to car model A
31
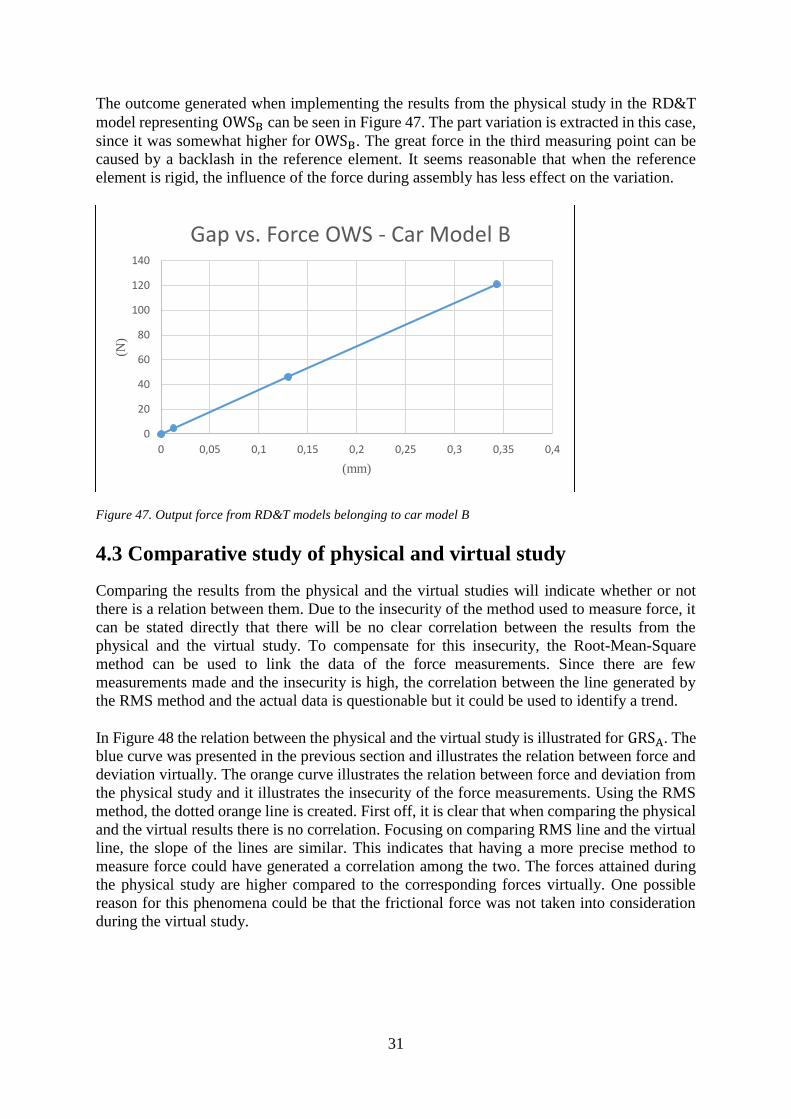
The outcome generated when implementing the results from the physical study in the RD&T
model representing OWSB can be seen in Figure 47. The part variation is extracted in this case,
since it was somewhat higher for OWSB. The great force in the third measuring point can be
caused by a backlash in the reference element. It seems reasonable that when the reference
element is rigid, the influence of the force during assembly has less effect on the variation.
4.3 Comparative study of physical and virtual study
Comparing the results from the physical and the virtual studies will indicate whether or not
there is a relation between them. Due to the insecurity of the method used to measure force, it
can be stated directly that there will be no clear correlation between the results from the
physical and the virtual study. To compensate for this insecurity, the Root-Mean-Square
method can be used to link the data of the force measurements. Since there are few
measurements made and the insecurity is high, the correlation between the line generated by
the RMS method and the actual data is questionable but it could be used to identify a trend.
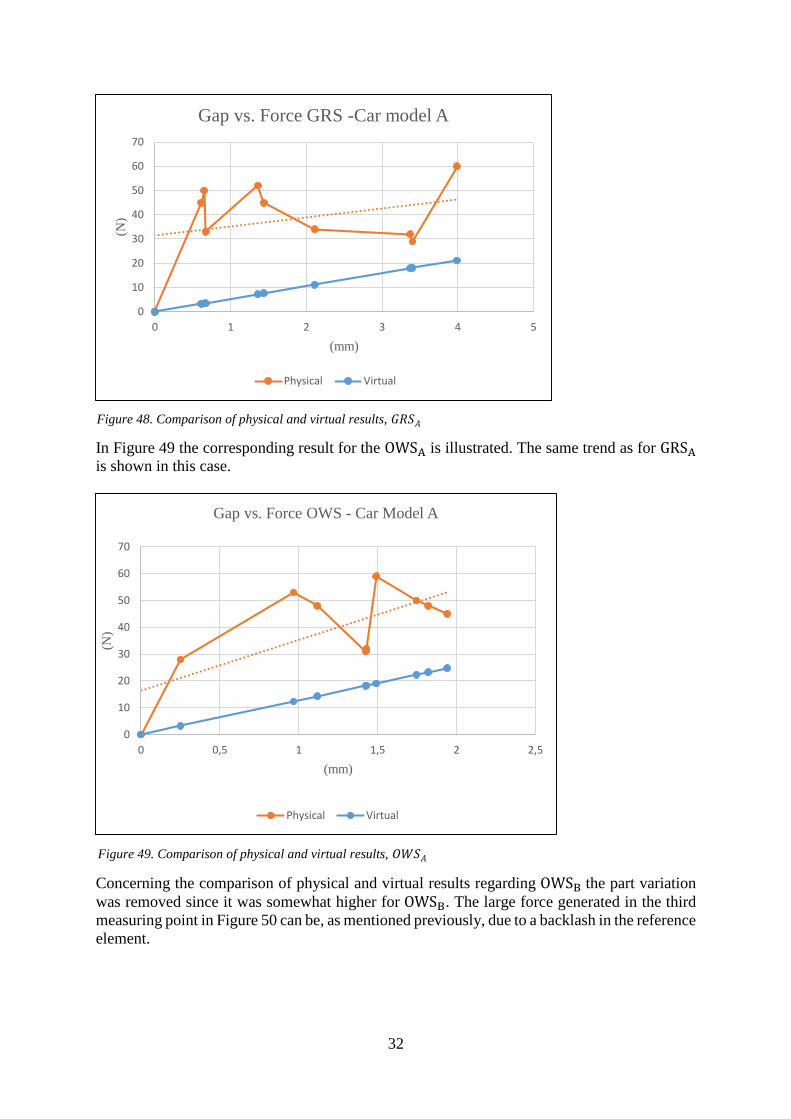
In Figure 48 the relation between the physical and the virtual study is illustrated for GRSA. The
blue curve was presented in the previous section and illustrates the relation between force and
deviation virtually. The orange curve illustrates the relation between force and deviation from
the physical study and it illustrates the insecurity of the force measurements. Using the RMS
method, the dotted orange line is created. First off, it is clear that when comparing the physical
and the virtual results there is no correlation. Focusing on comparing RMS line and the virtual
line, the slope of the lines are similar. This indicates that having a more precise method to
measure force could have generated a correlation among the two. The forces attained during
the physical study are higher compared to the corresponding forces virtually. One possible
reason for this phenomena could be that the frictional force was not taken into consideration
during the virtual study.
0
20
40
60
80
100
120
140
0 0,05 0,1 0,15 0,2 0,25 0,3 0,35 0,4
(N)
(mm)
Gap vs. Force OWS - Car Model B
Figure 47. Output force from RD&T models belonging to car model B
32
In Figure 49 the corresponding result for the OWSA is illustrated. The same trend as for GRSA
is shown in this case.
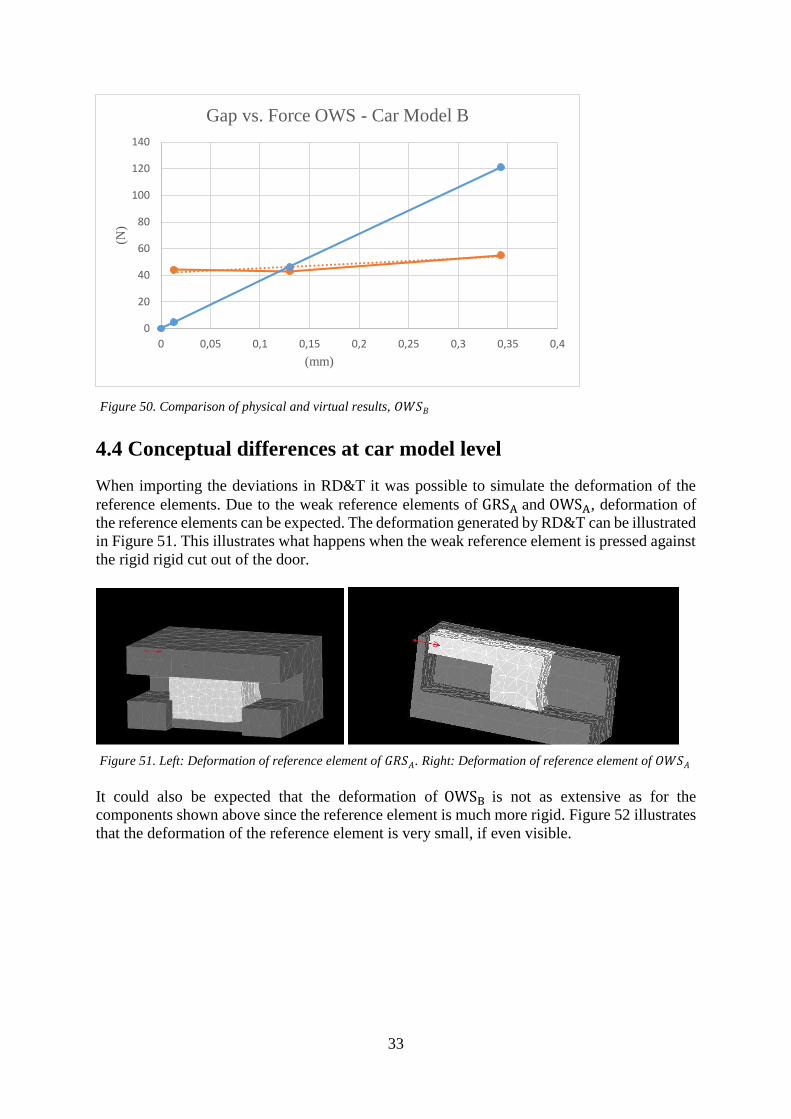
Concerning the comparison of physical and virtual results regarding OWSB the part variation
was removed since it was somewhat higher for OWSB. The large force generated in the third
measuring point in Figure 50 can be, as mentioned previously, due to a backlash in the reference
element.
0
10
20
30
40
50
60
70
0 1 2 3 4 5
(N)
(mm)
Gap vs. Force GRS -Car model A
Physical Virtual
0
10
20
30
40
50
60
70
0 0,5 1 1,5 2 2,5
(N)
(mm)
Gap vs. Force OWS - Car Model A
Physical Virtual
Figure 48. Comparison of physical and virtual results, 𝐺𝑅𝑆𝐴
Figure 49. Comparison of physical and virtual results, 𝑂𝑊𝑆𝐴
33
4.4 Conceptual differences at car model level
When importing the deviations in RD&T it was possible to simulate the deformation of the
reference elements. Due to the weak reference elements of GRSA and OWSA, deformation of
the reference elements can be expected. The deformation generated by RD&T can be illustrated
in Figure 51. This illustrates what happens when the weak reference element is pressed against
the rigid rigid cut out of the door.
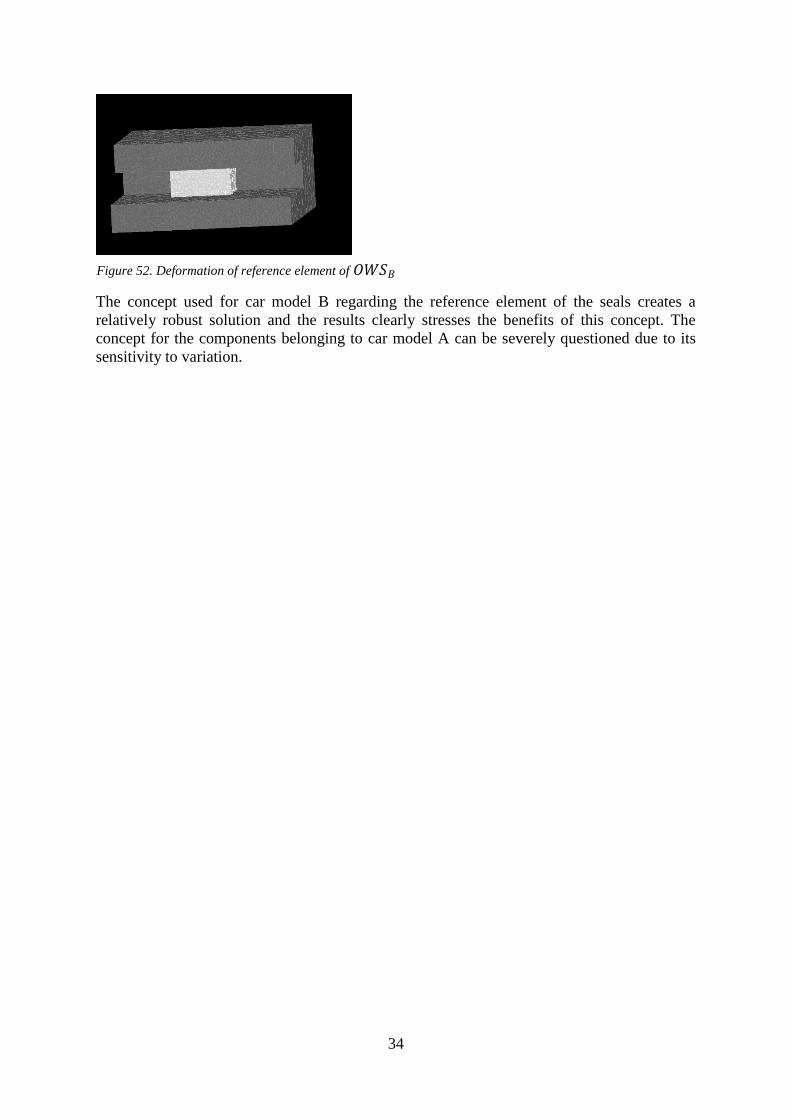
It could also be expected that the deformation of OWSB is not as extensive as for the
components shown above since the reference element is much more rigid. Figure 52 illustrates
that the deformation of the reference element is very small, if even visible.
0
20
40
60
80
100
120
140
0 0,05 0,1 0,15 0,2 0,25 0,3 0,35 0,4
(N)
(mm)
Gap vs. Force OWS - Car Model B
Figure 50. Comparison of physical and virtual results, 𝑂𝑊𝑆𝐵
Figure 51. Left: Deformation of reference element of 𝐺𝑅𝑆𝐴. Right: Deformation of reference element of 𝑂𝑊𝑆𝐴
34
¨
The concept used for car model B regarding the reference element of the seals creates a
relatively robust solution and the results clearly stresses the benefits of this concept. The
concept for the components belonging to car model A can be severely questioned due to its
sensitivity to variation.
Figure 52. Deformation of reference element of 𝑂𝑊𝑆𝐵
35
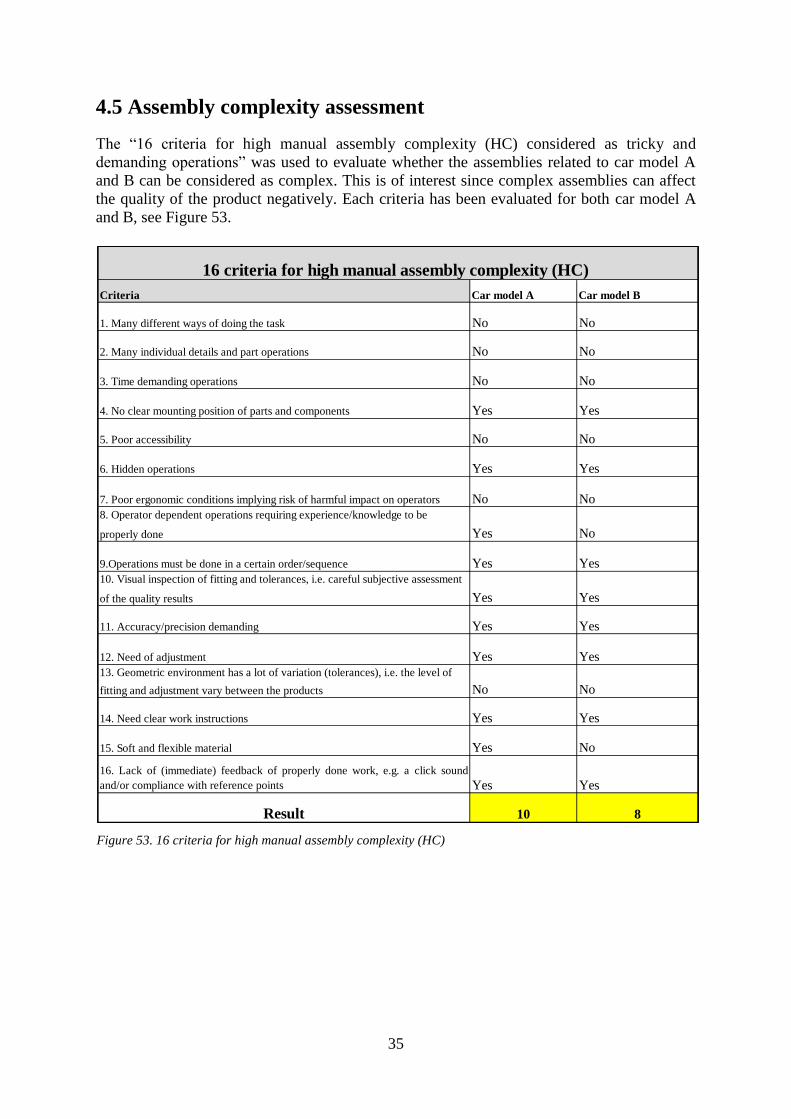
4.5 Assembly complexity assessment
The “16 criteria for high manual assembly complexity (HC) considered as tricky and
demanding operations” was used to evaluate whether the assemblies related to car model A
and B can be considered as complex. This is of interest since complex assemblies can affect
the quality of the product negatively. Each criteria has been evaluated for both car model A
and B, see Figure 53.
Criteria Car model A Car model B
1. Many different ways of doing the task No No
2. Many individual details and part operations No No
3. Time demanding operations No No
4. No clear mounting position of parts and components Yes Yes
5. Poor accessibility No No
6. Hidden operations Yes Yes
7. Poor ergonomic conditions implying risk of harmful impact on operators No No
8. Operator dependent operations requiring experience/knowledge to be
properly done Yes No
9.Operations must be done in a certain order/sequence Yes Yes
10. Visual inspection of fitting and tolerances, i.e. careful subjective assessment
of the quality results Yes Yes
11. Accuracy/precision demanding Yes Yes
12. Need of adjustment Yes Yes
13. Geometric environment has a lot of variation (tolerances), i.e. the level of
fitting and adjustment vary between the products No No
14. Need clear work instructions Yes Yes
15. Soft and flexible material Yes No
16. Lack of (immediate) feedback of properly done work, e.g. a click sound
and/or compliance with reference points Yes Yes
Result 10 8
16 criteria for high manual assembly complexity (HC)
Figure 53. 16 criteria for high manual assembly complexity (HC)
36
The result show that the assemblies can be considered as having a moderate degree of
complexity, which could affect the quality negatively. An assembly is considered as having a
moderate degree of complexity when the score of the test is in the range of 8-11. The
problematic criteria’s identified will be described further.
Criteria 6 – Hidden operations
Since the view is blocked when pressing the reference element of the articles against the cut
out in the door the operations can be considered to be hidden.
Criteria 8 – Operator dependent operations requiring experience/knowledge to be
properly done
An experienced operator is more likely to be able to place the reference elements correctly.
Many experienced operators’ are aware of the sensitivity stemming from the weak reference
elements and have thereby learned ways to compensate for this. However, this is only the case
for the components of car model A. For the components belonging to car model B, the
experience does not matter as much since the reference elements are more robust.
Criteria 9 – Operations must be done in a certain order
The operations of attaching the seals to the car door always has to start by aligning the reference
element against the cut out in the door. After this operation, the rest of the seal is assembled.
Criteria 10 – Visual inspection of fitting and tolerances, i.e. careful subjective assessment
of the quality results
When having assembled the seal the operator checks that the chrome strip is properly aligned.
This allow subjectivity, which could generate varying outcome.
Criteria 11 – Accuracy/precision demanding
The fitting between the reference element and the cut out in the door require precision in order
to attach the seal correctly. Since the reference element is very small, it hampers precision.
Criteria 12 – Need of adjustment
Due to the obvious problems with the assembly of these components there is a clear need of
adjustment after the assembly.
Criteria 14 – Need clear work instructions
It is of great importance that the operator know how to assemble the reference element since
this affect the final position of the component. Therefore, clear work instructions are needed
that describe the process in detail.
Criteria 15 – Soft and flexible material
The reference element of GRSA and OWSA is soft and flexible, but this is not the case for GRSB
and OWSB.
Criteria 16 – Lack of (immediate) feedback of properly done work, e.g. a click sound
and/or compliance with reference points
When or if the operator complies with the reference points there is no feedback given to the
operator, leaving them unaware of the actual placement of the component.
37
5. Discussion
The master’s thesis indicate that there is no evident correlation between the virtual and the
physical tests performed in this project. However, using the RMS method there are implications
of a matching trend between the virtual and the physical tests. When studying the comparative
results of this trend, it is clear that the slope from the virtual tests and the RMS slope coincides.
The magnitude of them, however, differs. This could be explained by, as mentioned in the
result, that the frictional force was not taken into consideration in the virtual study. Since the
correlation between the line generated by the RMS method and the actual data from the
physical study is questionable there are still uncertainties regarding the identified matching
trend. Therefore, there are several aspects that need to be further discussed that could have
affected the result attained during this project.
5.1 Cross functional aspects
This project has pinpointed the importance of being able to take operator influence during
manual assemblies into consideration in the geometry assurance process. Competitiveness can
be negatively affected if this is not done, since small geometrical errors in early phases of
development can lead to severe consequences downstream (Chang and Gossard, 1997). To
overcome this, using a concept that is sensitive with respect to assembly variation, would
require tight tolerances which would generate high expenditures (Söderberg and Lindkvist,
1999). Due to the tough competition in the automotive industry today, this would lead to a
snowball effect generating low quality (both functionally and aesthetically), long lead times
and high cost. Customer satisfaction would not be met, risking setbacks for the manufacturer.
Therefore, it is of great importance to create robust designs.
This project aimed to contribute to the process of making assembly variation acknowledged in
early phases of development. The approach used in this project was evaluated in that purpose
and obstacles using this approach have incurred. Hence, the human factor and the human
movements are not easily translatable when entering the virtual world, nor is it simple to
perform physical tests and create reliable ways to measure without including noise. The project
has also identified an example of a disparity among concept developers and the assembly
process. It is one thing to determine positioning points virtually, and optimizing them based on
only one perspective. However, it is a completely different task when wanting to create a
positioning system that is not only successful virtually. The linkage among physical and virtual
work is lost when the optimizations made in early phases do not accommodate to what is
practicable. It does not matter how well a positioning system works virtually if it is nearly
impossible for the operator to perform the positioning correctly. According to Rosenqvist et.al.
(2013) assemblies where the positioning points are hidden can cause this problem. The
reference elements of car model A are great examples of this. The results clearly indicate a
substantial spread of the position of 𝐺𝑅𝑆𝐴 and 𝑂𝑊𝑆𝐴. Working virtually, it is easy to forget
what impact material selection of reference elements can have on the geometrical variation of
the final product. In the virtual software the type of material is not visually portrayed, which
could contribute to making people less likely to react. Intuitively, one would realize that a
reference element similar to rubber is likely to cause problems. Therefore, it is of great
importance to make a concept robust regarding assembly in early phases of development and
doing so requires an integrated way of working where the assembly variation is considered in
parallel to part variation.
38
During this project, the difficulties of performing physical tests and correlating the results with
simulations have been evident. The project has required fluctuating between two different
worlds, the physical and the virtual. During the project, support have been given by people
working solely in the practical field and by people that are mainly focusing on theoretical
aspects. Sometimes the advice from the two perspectives have been opposing, making it a part
of this master’s thesis to create a linkage between them. Working with people from different
departments means working with personnel with varying perspectives. Being a middle hand
between different departments can be demanding since it requires a lot of discussions to reach
an understanding. To take a stand based on two different sources of information can be difficult
and it is not always easy to foresee the obstacles to come. An illustrating example can be the
direction of force in the physical and the virtual study. In the physical study, which was
performed before the virtual study, the force was directed with a 45 degree angle against the
GRS and the OWS. Meanwhile, when performing the virtual study it was not possible to
simulate this and the deviations were set horizontally. Simplifications had to be made to make
the comparison possible, which could have affected the accuracy of the result. This can, in one
perspective, be viewed as a troublesome simplification but in another perspective it can be
taken lightly with the attitude that adjustments between physical movements often have to be
adjusted when implemented virtually.
5.2 Reliability of physical study
The CMM measures with high accuracy and it is controlled regularly. In contrast to the
measurements generated by the CMM, the method to measure force is questionable. To
measure a parameter in retrospect is an insecure method since it is based on an impression and
it is difficult to recreate the accurate value. One could question that the method was used when
the evaluation of the force assessment showed large spread and low accuracy. The force
assessment revealed that when the target value was 45 N the spread for each individual in some
cases measured up to 20 N. If the spread of the measurements can be approximately half of the
magnitude of the target value, it is difficult to generate reliable results. The decision to use this
method was due to scarce resources. There are force transducers available at the market, which
could have increased the accuracy of the force measurements by being able to measure force
during ongoing assembly.
The reason for selecting three operators was to evaluate how the result differed among varying
operators. It was of interest to investigate whether it was possible to detect different patterns
depending on different characteristics of the operators. This comparison was unfortunately not
possible due to a measurement error detected after the physical study.
5.3 Part variation vs. variation due to disassembly
Another aspect that is important to mention is the number of observations made. Due to
restrictions of material, the number of assemblies were limited. During the tests of car model
A, nine repetitions were possible but only three repetitions were possible when studying car
model B. It is of course difficult to make extensive conclusions based on such a limited number
of observations.
One crossroad during the project regarded this issue and it concerned whether or not the
components should be reused after they had been assembled once or if they should be discarded
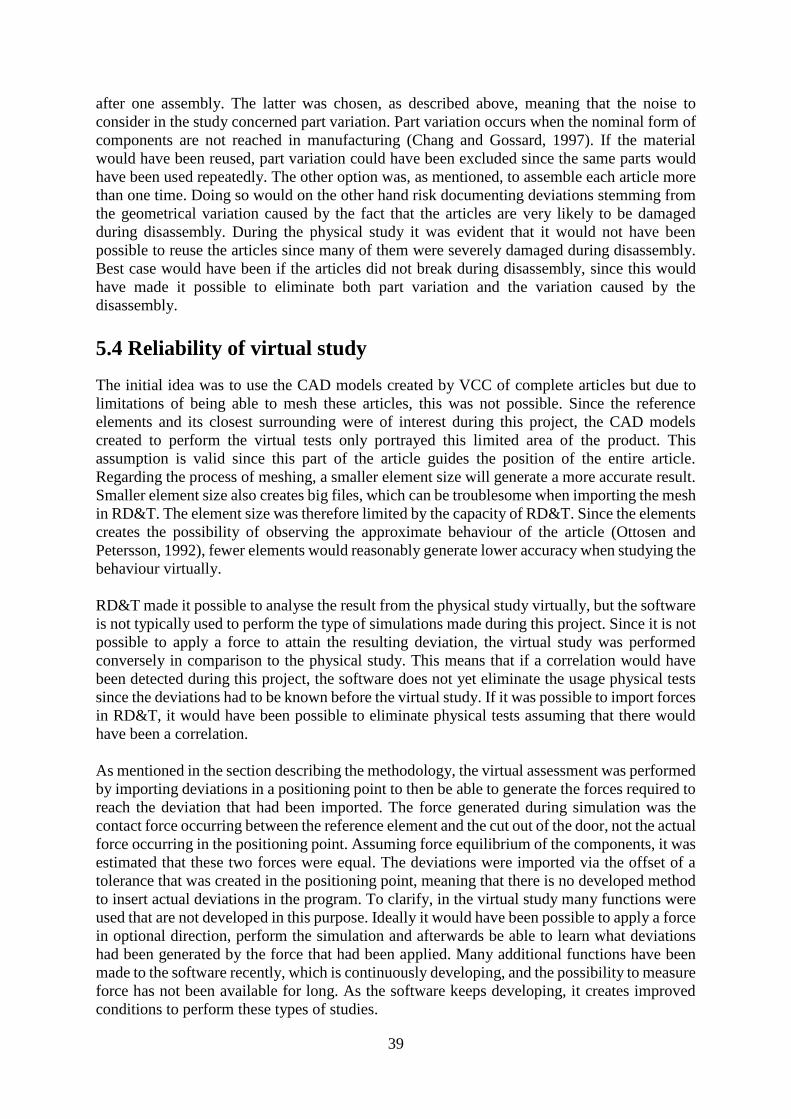
39
after one assembly. The latter was chosen, as described above, meaning that the noise to
consider in the study concerned part variation. Part variation occurs when the nominal form of
components are not reached in manufacturing (Chang and Gossard, 1997). If the material
would have been reused, part variation could have been excluded since the same parts would
have been used repeatedly. The other option was, as mentioned, to assemble each article more
than one time. Doing so would on the other hand risk documenting deviations stemming from
the geometrical variation caused by the fact that the articles are very likely to be damaged
during disassembly. During the physical study it was evident that it would not have been
possible to reuse the articles since many of them were severely damaged during disassembly.
Best case would have been if the articles did not break during disassembly, since this would
have made it possible to eliminate both part variation and the variation caused by the
disassembly.
5.4 Reliability of virtual study
The initial idea was to use the CAD models created by VCC of complete articles but due to
limitations of being able to mesh these articles, this was not possible. Since the reference
elements and its closest surrounding were of interest during this project, the CAD models
created to perform the virtual tests only portrayed this limited area of the product. This
assumption is valid since this part of the article guides the position of the entire article.
Regarding the process of meshing, a smaller element size will generate a more accurate result.
Smaller element size also creates big files, which can be troublesome when importing the mesh
in RD&T. The element size was therefore limited by the capacity of RD&T. Since the elements
creates the possibility of observing the approximate behaviour of the article (Ottosen and
Petersson, 1992), fewer elements would reasonably generate lower accuracy when studying the
behaviour virtually.
RD&T made it possible to analyse the result from the physical study virtually, but the software
is not typically used to perform the type of simulations made during this project. Since it is not
possible to apply a force to attain the resulting deviation, the virtual study was performed
conversely in comparison to the physical study. This means that if a correlation would have
been detected during this project, the software does not yet eliminate the usage physical tests
since the deviations had to be known before the virtual study. If it was possible to import forces
in RD&T, it would have been possible to eliminate physical tests assuming that there would
have been a correlation.
As mentioned in the section describing the methodology, the virtual assessment was performed
by importing deviations in a positioning point to then be able to generate the forces required to
reach the deviation that had been imported. The force generated during simulation was the
contact force occurring between the reference element and the cut out of the door, not the actual
force occurring in the positioning point. Assuming force equilibrium of the components, it was
estimated that these two forces were equal. The deviations were imported via the offset of a
tolerance that was created in the positioning point, meaning that there is no developed method
to insert actual deviations in the program. To clarify, in the virtual study many functions were
used that are not developed in this purpose. Ideally it would have been possible to apply a force
in optional direction, perform the simulation and afterwards be able to learn what deviations
had been generated by the force that had been applied. Many additional functions have been
made to the software recently, which is continuously developing, and the possibility to measure
force has not been available for long. As the software keeps developing, it creates improved
conditions to perform these types of studies.
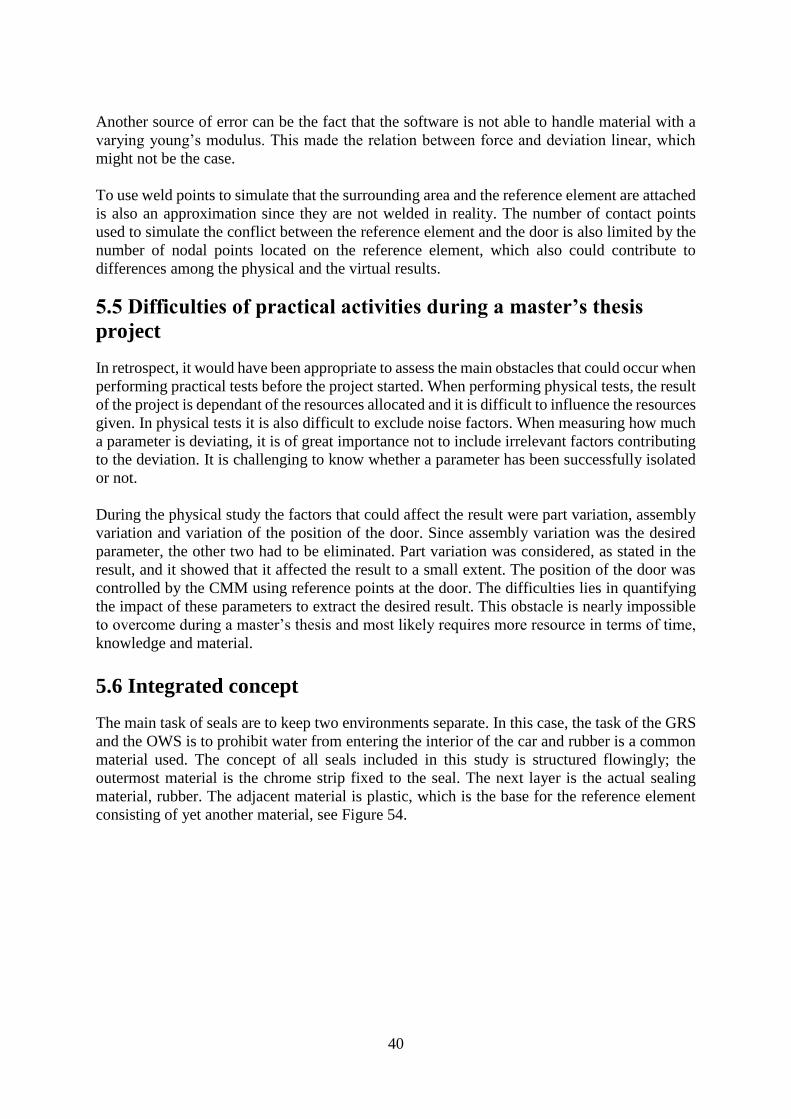
40
Another source of error can be the fact that the software is not able to handle material with a
varying young’s modulus. This made the relation between force and deviation linear, which
might not be the case.
To use weld points to simulate that the surrounding area and the reference element are attached
is also an approximation since they are not welded in reality. The number of contact points
used to simulate the conflict between the reference element and the door is also limited by the
number of nodal points located on the reference element, which also could contribute to
differences among the physical and the virtual results.
5.5 Difficulties of practical activities during a master’s thesis
project
In retrospect, it would have been appropriate to assess the main obstacles that could occur when
performing practical tests before the project started. When performing physical tests, the result
of the project is dependant of the resources allocated and it is difficult to influence the resources
given. In physical tests it is also difficult to exclude noise factors. When measuring how much
a parameter is deviating, it is of great importance not to include irrelevant factors contributing
to the deviation. It is challenging to know whether a parameter has been successfully isolated
or not.
During the physical study the factors that could affect the result were part variation, assembly
variation and variation of the position of the door. Since assembly variation was the desired
parameter, the other two had to be eliminated. Part variation was considered, as stated in the
result, and it showed that it affected the result to a small extent. The position of the door was
controlled by the CMM using reference points at the door. The difficulties lies in quantifying
the impact of these parameters to extract the desired result. This obstacle is nearly impossible
to overcome during a master’s thesis and most likely requires more resource in terms of time,
knowledge and material.
5.6 Integrated concept
The main task of seals are to keep two environments separate. In this case, the task of the GRS
and the OWS is to prohibit water from entering the interior of the car and rubber is a common
material used. The concept of all seals included in this study is structured flowingly; the
outermost material is the chrome strip fixed to the seal. The next layer is the actual sealing
material, rubber. The adjacent material is plastic, which is the base for the reference element
consisting of yet another material, see Figure 54.
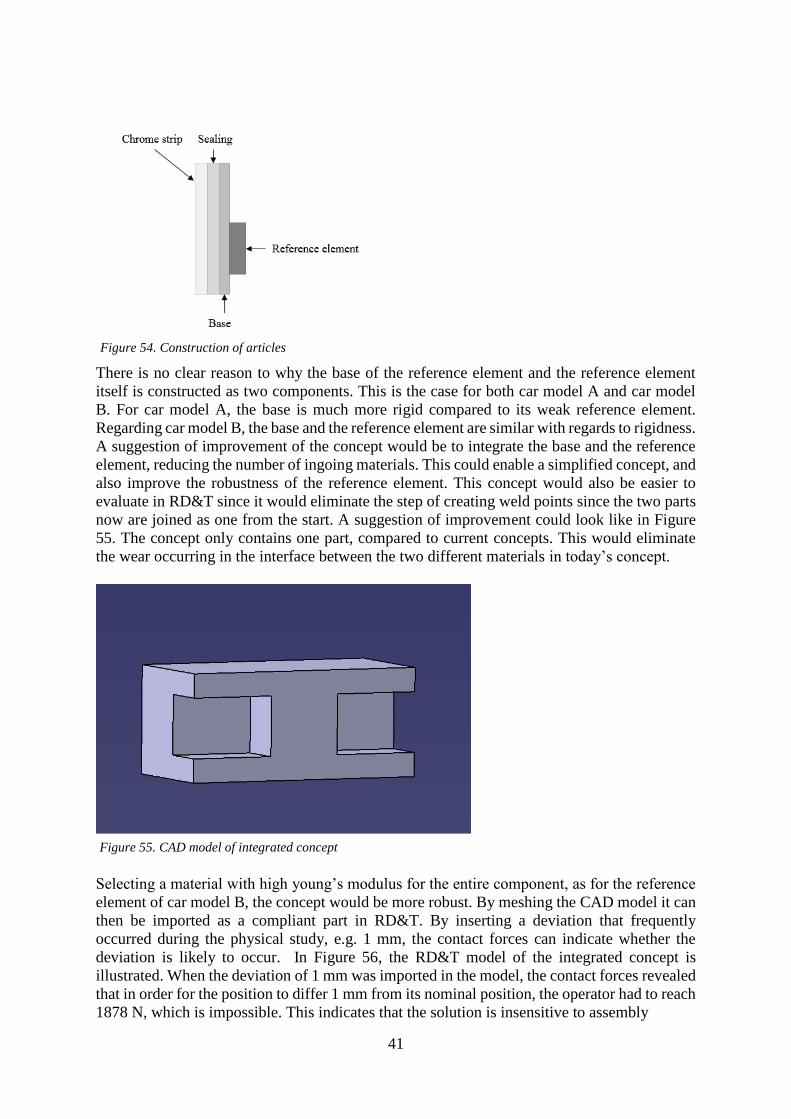
41
There is no clear reason to why the base of the reference element and the reference element
itself is constructed as two components. This is the case for both car model A and car model
B. For car model A, the base is much more rigid compared to its weak reference element.
Regarding car model B, the base and the reference element are similar with regards to rigidness.
A suggestion of improvement of the concept would be to integrate the base and the reference
element, reducing the number of ingoing materials. This could enable a simplified concept, and
also improve the robustness of the reference element. This concept would also be easier to
evaluate in RD&T since it would eliminate the step of creating weld points since the two parts
now are joined as one from the start. A suggestion of improvement could look like in Figure
55. The concept only contains one part, compared to current concepts. This would eliminate
the wear occurring in the interface between the two different materials in today’s concept.
Selecting a material with high young’s modulus for the entire component, as for the reference
element of car model B, the concept would be more robust. By meshing the CAD model it can
then be imported as a compliant part in RD&T. By inserting a deviation that frequently
occurred during the physical study, e.g. 1 mm, the contact forces can indicate whether the
deviation is likely to occur. In Figure 56, the RD&T model of the integrated concept is
illustrated. When the deviation of 1 mm was imported in the model, the contact forces revealed
that in order for the position to differ 1 mm from its nominal position, the operator had to reach
1878 N, which is impossible. This indicates that the solution is insensitive to assembly
Figure 54. Construction of articles
Figure 55. CAD model of integrated concept
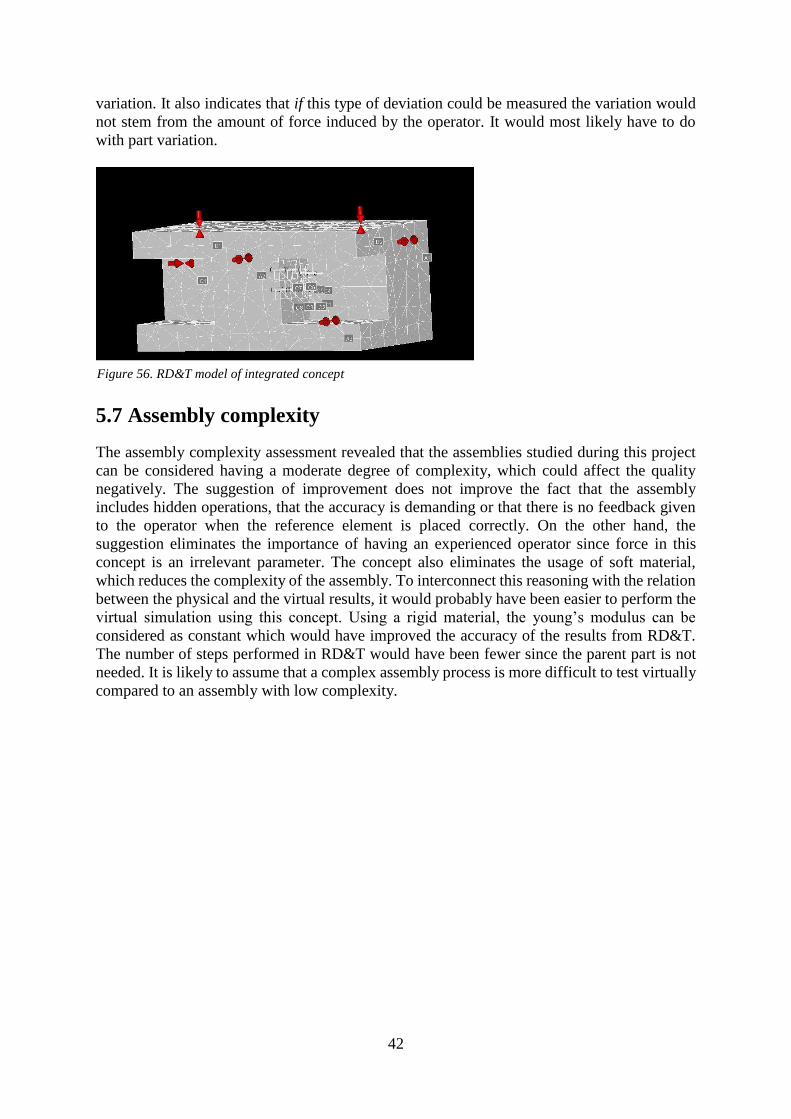
42
variation. It also indicates that if this type of deviation could be measured the variation would
not stem from the amount of force induced by the operator. It would most likely have to do
with part variation.
5.7 Assembly complexity
The assembly complexity assessment revealed that the assemblies studied during this project
can be considered having a moderate degree of complexity, which could affect the quality
negatively. The suggestion of improvement does not improve the fact that the assembly
includes hidden operations, that the accuracy is demanding or that there is no feedback given
to the operator when the reference element is placed correctly. On the other hand, the
suggestion eliminates the importance of having an experienced operator since force in this
concept is an irrelevant parameter. The concept also eliminates the usage of soft material,
which reduces the complexity of the assembly. To interconnect this reasoning with the relation
between the physical and the virtual results, it would probably have been easier to perform the
virtual simulation using this concept. Using a rigid material, the young’s modulus can be
considered as constant which would have improved the accuracy of the results from RD&T.
The number of steps performed in RD&T would have been fewer since the parent part is not
needed. It is likely to assume that a complex assembly process is more difficult to test virtually
compared to an assembly with low complexity.
Figure 56. RD&T model of integrated concept
43
6. Conclusion
In this section the research questions will be concisely answered. The research questions
regarded if it is possible to quantify operator related variation in manual assemblies, whether
it is possible to detect a correlation between virtual simulations of manual assemblies and actual
manual assemblies and it if a virtual software can be used to predict the robustness of a design
concept with regards to manual assemblies.
6.1 Quantification of variation in manual assemblies
The master’s thesis project concludes that it is possible to quantify variation in manual
assemblies. The variation measured during the physical tests revealed that although the same
operator is assembling repeatedly, the position of the article assembled will differ. The fact that
the components with a rigid reference element generated less spread compared to the articles
with a weak reference element also indicates that the quantification of the variation from the
manual assemblies are accurate. Due to difficulties of isolating parameters contributing to the
variation, the values attained could to a small extent be influenced by other factors.
6.2 Correlation between physical and virtual results
There is no correlation between the virtual and the physical tests performed, mainly due to the
method to measure force. An additional factor contributing to the low correlation is that RD&T
is not fully equipped to handle the type of simulation performed, as discussed. Improving the
test methods used and developing RD&T for this purpose could enable a correlation.
6.3 Virtual evaluation of robustness of design concept
The simulations in RD&T enabled evaluation of the design concepts and it can be concluded
that it is possible to evaluate the robustness of a design concept virtually. The simulation of
GRSA and OWSA showed that they deform greatly during the assemblies and the simulation of
OWSB illustrated that a rigid reference element will not deform to the same extent. Since the
reference elements are hidden during the assembly, it was not possible to visually see this
deformation during the physical study but the variation attained indicates that large
deformations emerge when assembling GRSA and OWSA. It can also be concluded that the
variation can be amplified by the fact that the assembly processes studied can be regarded as
having a moderate degree of complexity.
44
7. Future research
This master’s thesis has only scratched the surface of the work that lies ahead to be able to
quantify operators’ contribution to variation during manual assemblies in the concept phase. A
lot more research and tests need to be made before it is possible to enable a way of working
where the predictions of variation are reliable enough to eliminate the need of prototypes or
physical tests. To be able to quantify operators’ contribution to variation during manual
assemblies virtually, there are several aspects that need to be considered.
One recommendation for further research concerns performing the same study with a different
approach of measuring force. By establishing a method to measure force that enables the
measurement process to be done during ongoing assembly could lead to detecting a correlation
between the physical and the virtual results. This should be done in addition to increasing the
number of observations, to generate increased reliability of the results.
Regarding the virtual test methods, more research should be put into evaluating what software
to use when evaluating manual assemblies. RD&T is an appropriate software to use if
continuous development of the compliance module is achieved, making it possible to induce
forces.
More effort should, in future research, be put into isolating the parameter of interest and the
behaviour of rubber also needs to be further investigated. In this project it was possible to
evaluate the design concept virtually based on visual results. Future research could concern the
possibility of quantifying the deformation that was visualised.
45
8. References
8.1 Articles
Agapiou, J. S., & Du, H. (2007). Assuring the day-to-day accuracy of coordinate measuring
machines—a comparison of tools and procedures. Journal of Manufacturing Processes, 9(2),
109-120.
Cai, N., Qiao, L., & Anwer, N. (2015). Assembly Model Representation for Variation Analysis.
Procedia CIRP, 27, 241-246.
Camelio, J., Hu, S. J., & Ceglarek, D. (2003). Modeling variation propagation of multi-station
assembly systems with compliant parts. Journal of Mechanical Design, 125(4), 673-681.
Chang, M., & Gossard, D. C. (1997). Modelling the assembly of compliant, non-ideal parts.
Computer-Aided Design, 29(10), 701-708.
Falck, A-C., Rosenqvist, M., Lindkvist, L. & Söderberg, R. (2014). Geometrical robustness
analysis considering manual assembly complexity. Procedia CIRP, 23, 98-103
Forslund, K., Wagersten, O., Tafuri, S., Segerdahl, D., Carlsson, J. S., Lindkvist, L., &
Soderberg, R. (2011). Parameters Influencing the Perception of Geometrical Deviations in a
Virtual Environment. In ASME 2011 International Design Engineering Technical Conferences
and Computers and Information in Engineering Conference (pp. 1105-1114). American
Society of Mechanical Engineers.
Rosenqvist, M., Örtengren, R. & Falck, A-C. (2014). Assembly failures and action cost in
relation to complexity level and assembly ergonomics in manual assembly (part 2).
International Journal of Industrial Ergonomics, 44(3), 455-459.
Rosenqvist, M., Falck, A-C., Wärmefjord, K. & Söderberg, R. (2013). Operator related causes
for low correlation between CAT simulations and physical results. Proceedings of the ASME
2013 International Mechanical Engineering Congress & Exposition – November 13-21, San
Diego, California, USA.
Söderberg, R., Lindkvist, L., & Carlson, J. (2006). Virtual geometry assurance for effective
product realization. In First Nordic Conference on Product Lifecycle Management-NordPLM
(Vol. 6, pp. 25-26).
Söderberg, R., & Lindkvist, L. (1999). Computer aided assembly robustness evaluation.
Journal of Engineering Design, 10(2), 165-181.
Söderberg, R. (1998). Robust design by support of CAT tools. In Proceedings of the ASME
Design Automation Conference, September 13-16, Atlanta, GA, USA DETC98/DAC-5633
Söderberg, R., Wickman, C., & Lindkvist, L. (2008). Improving decision making by simulating
and visualizing geometrical variation in non-rigid assemblies. CIRP Annals-Manufacturing
Technology, 57(1), 175-178.
46
8.2 Books
Ottosen, N. & Petersson, H. (1992). Introduction to the FINITE ELEMENT METHOD.
University of Lund, Sweden.
Lilja., Olsson. & Wickström. (2011). Ritteknik faktabok. Produkt- och produktionsutveckling
Chalmers Tekniska Högskola.
8.3 Webpages
Directindustry. (2016). Innovalia metrology. Avaliable at:
http://www.directindustry.com/prod/innovalia-metrology/product-161330-
1655730.html#product-item_1655718 [Accessed May 1, 2016].
Globalspec. (2016). Engineering 360 Powered by IEEE GlobalSpec. Available at:
http://www.globalspec.com/learnmore/manufacturing_process_equipment/inspection_tools_i
nstruments/coordinate_measuring_machines_cmm [Accessed May 1, 2016].
RD&T Technology. (2016). The RD&T main steps to Geometrical Robustness. Available at:
http://rdnt.se/steps.html. [Accessed May 5, 2016].
Software Manual. (2015). Robustness evaluation and tolerance analysis, RD&T.
VCC. (2015). Standard VCS 5060,6. Available from http://www.volvocars.net. [Accessed
2016-02-10].
Volvo Cars. (2016). Bygg din Volvo. Available from
http://byggdinvolvo.volvocars.se/#/configurator?_ga=1.45144804.1913995781.1447683312.
[Accessed 2016-05-16].
8.4 Interview
Johasson, Dag. (2016). Technical Expert at Robust Design and Tolerancing Volvo Car
Corporation.
8.5 Lecture material
Lindkvist, L. (2016). Advanced Computer Aided Design: Geometry Assurance 1 Robust
Design & Variation Simulation. Chalmers University of Technology.
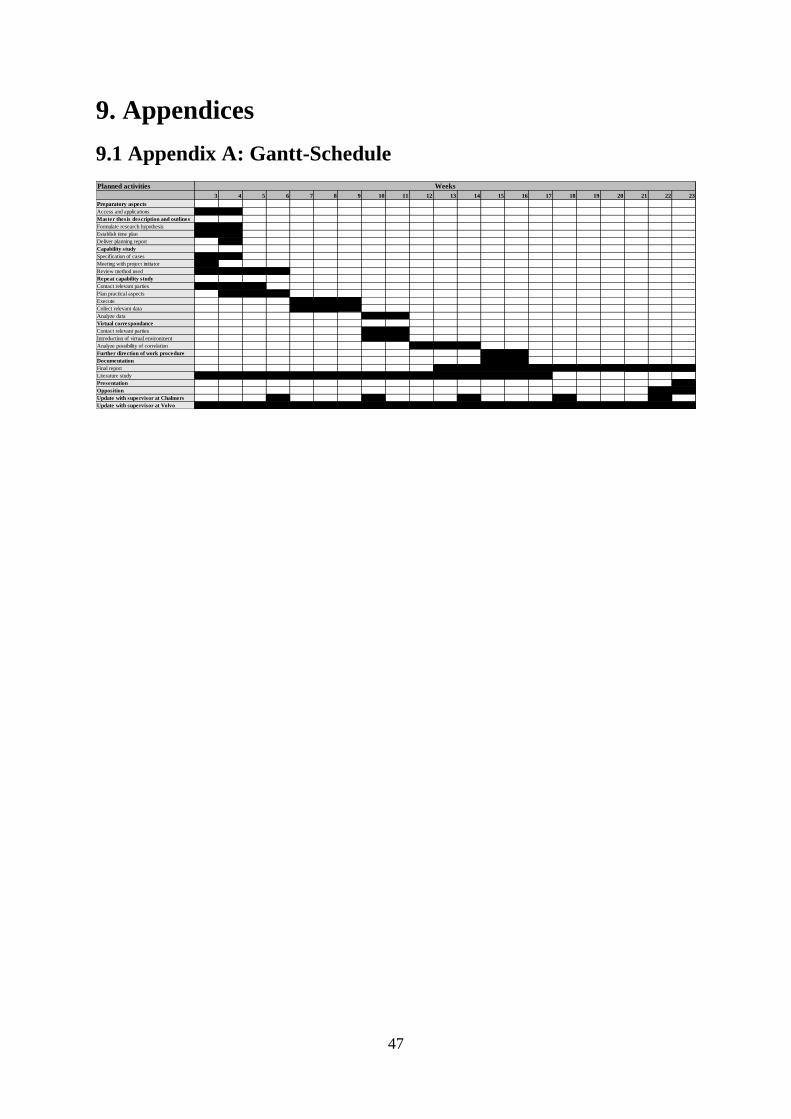
47
9. Appendices
9.1 Appendix A: Gantt-Schedule
Planned activities
3 4 5 6 7 8 9 10 11 12 13 14 15 16 17 18 19 20 21 22 23
Preparatory aspects
Access and applications
Master thesis description and outlines
Formulate research hypothesis
Establish time plan
Deliver planning report
Capability study
Specification of cases
Meeting with project initiator
Review method used
Repeat capability study
Contact relevant parties
Plan practical aspects
Execute
Collect relevant data
Analyze data
Virtual correspondance
Contact relevant parties
Introduction of virtual environment
Analyze possibility of correlation
Further direction of work procedure
Documentation
Final report
Literature study
Presentation
Opposition
Update with supervisor at Chalmers
Update with supervisor at Volvo
Weeks
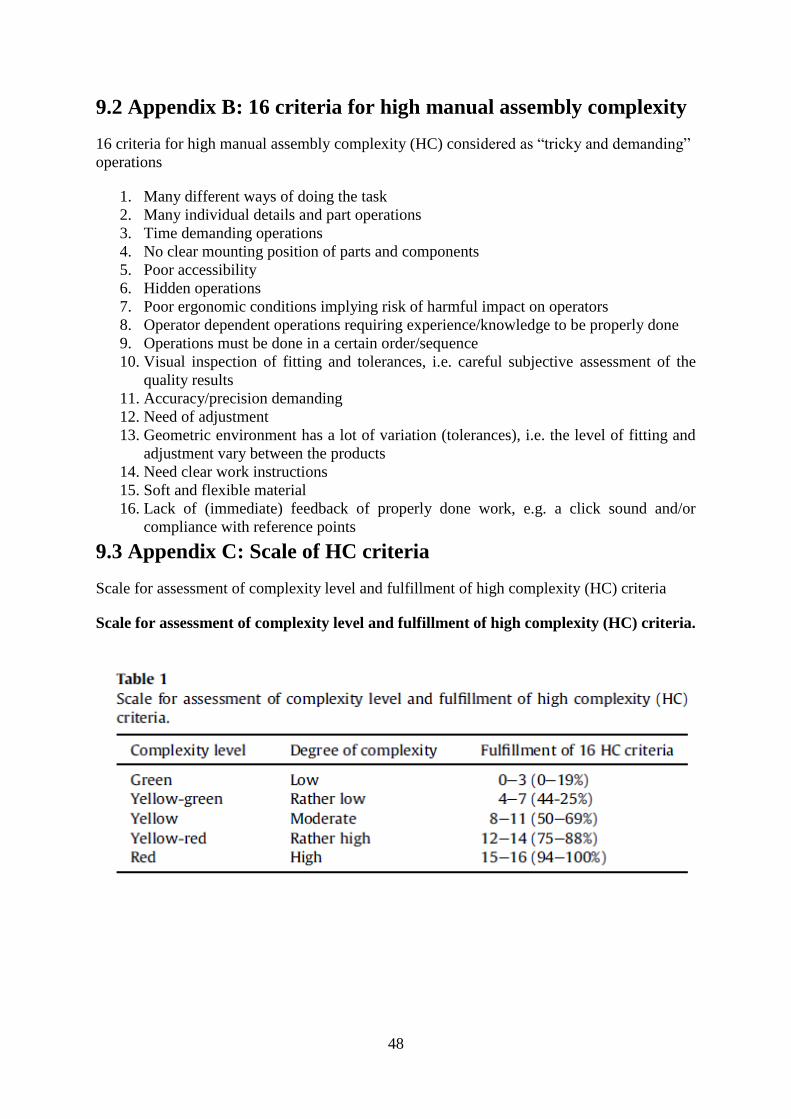
48
9.2 Appendix B: 16 criteria for high manual assembly complexity
16 criteria for high manual assembly complexity (HC) considered as “tricky and demanding”
operations
1. Many different ways of doing the task
2. Many individual details and part operations
3. Time demanding operations
4. No clear mounting position of parts and components
5. Poor accessibility
6. Hidden operations
7. Poor ergonomic conditions implying risk of harmful impact on operators
8. Operator dependent operations requiring experience/knowledge to be properly done
9. Operations must be done in a certain order/sequence
10. Visual inspection of fitting and tolerances, i.e. careful subjective assessment of the
quality results
11. Accuracy/precision demanding
12. Need of adjustment
13. Geometric environment has a lot of variation (tolerances), i.e. the level of fitting and
adjustment vary between the products
14. Need clear work instructions
15. Soft and flexible material
16. Lack of (immediate) feedback of properly done work, e.g. a click sound and/or
compliance with reference points
9.3 Appendix C: Scale of HC criteria
Scale for assessment of complexity level and fulfillment of high complexity (HC) criteria
Scale for assessment of complexity level and fulfillment of high complexity (HC) criteria.
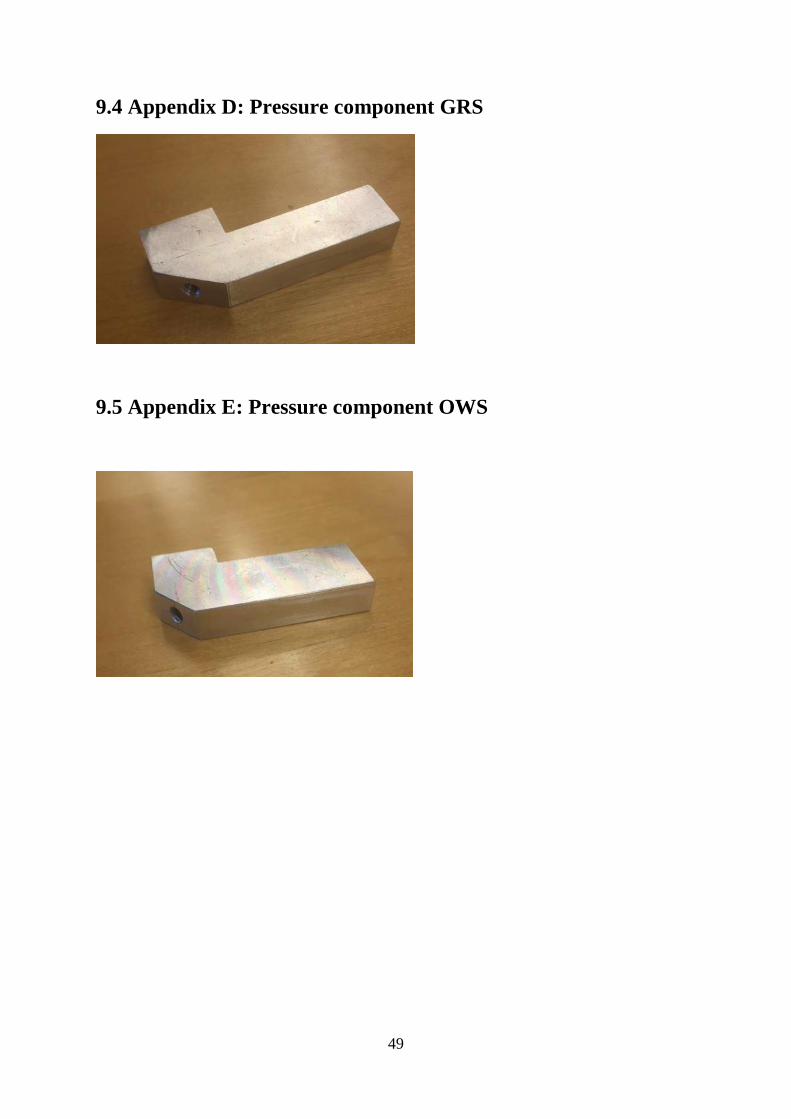
49
9.4 Appendix D: Pressure component GRS
9.5 Appendix E: Pressure component OWS

50
9.6 Appendix F: CAD model GRS Car model A
Car model A GRS – surrounding and reference element
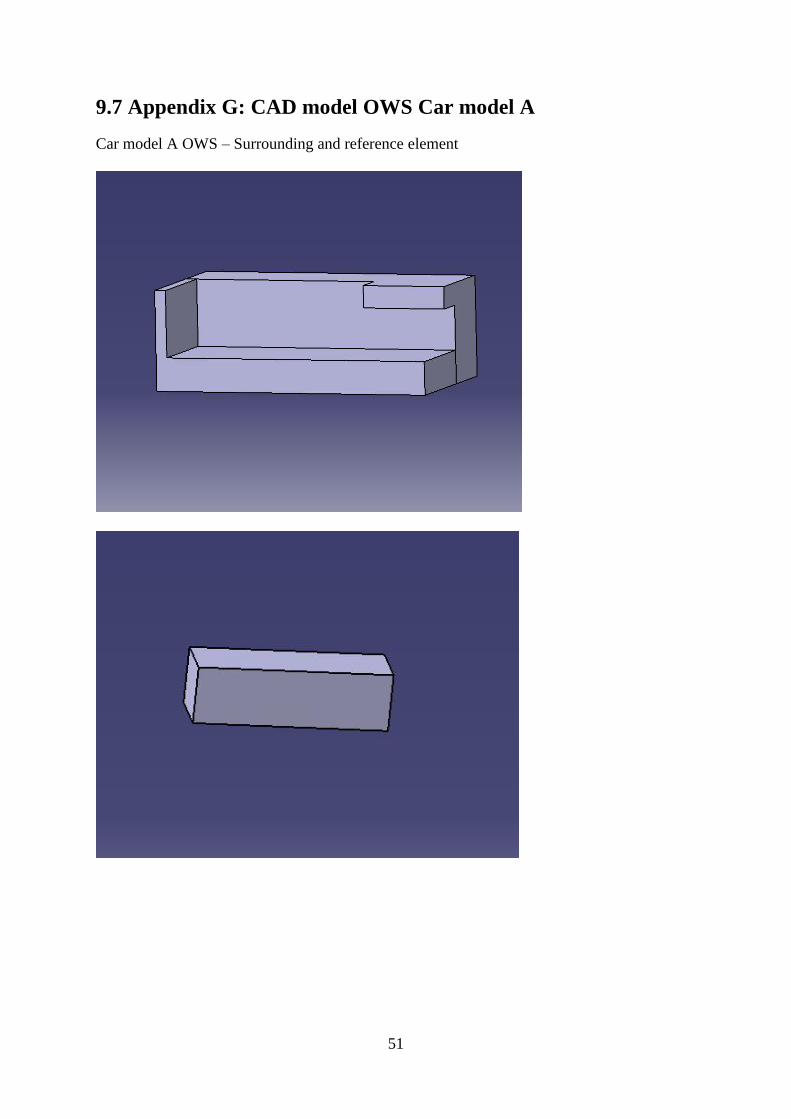
51
9.7 Appendix G: CAD model OWS Car model A
Car model A OWS – Surrounding and reference element
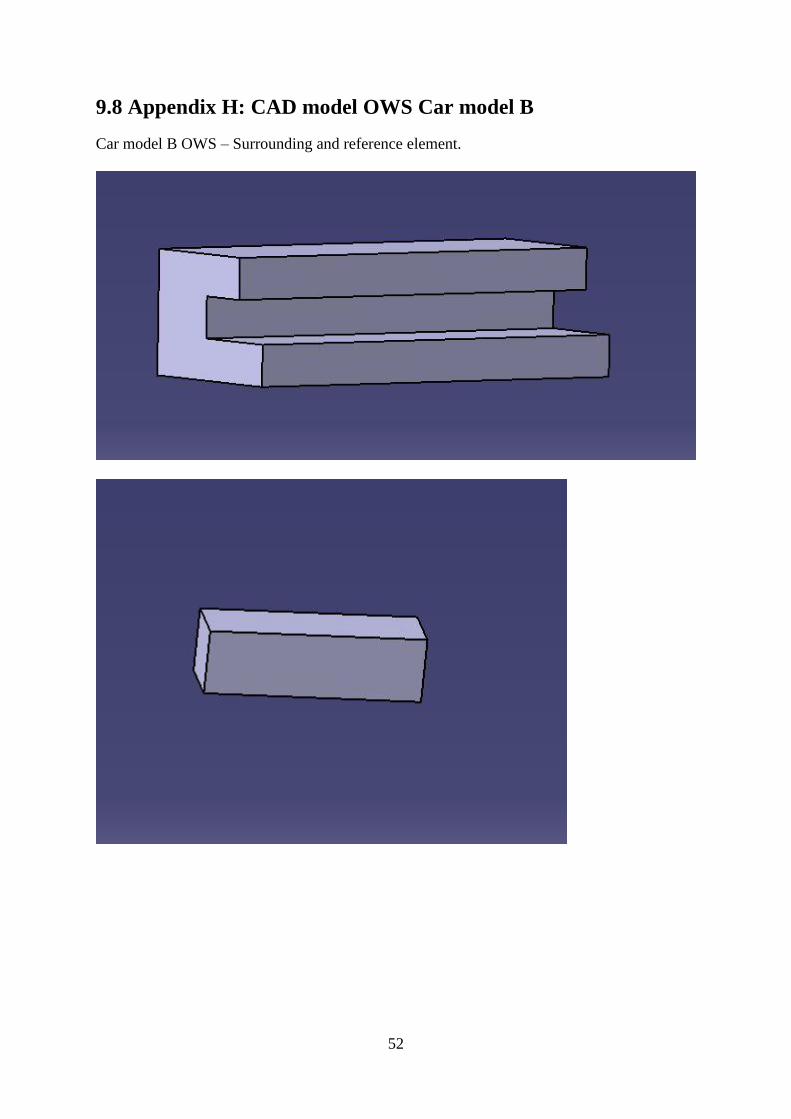
52
9.8 Appendix H: CAD model OWS Car model B
Car model B OWS – Surrounding and reference element.
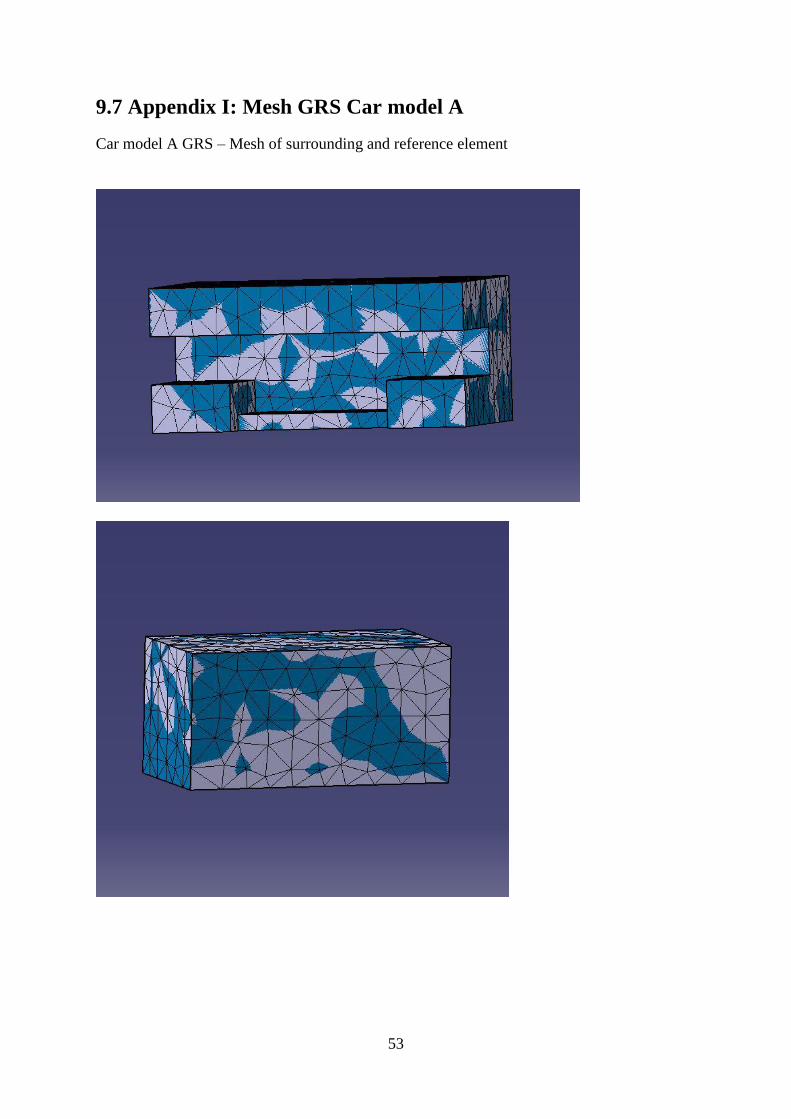
53
9.7 Appendix I: Mesh GRS Car model A
Car model A GRS – Mesh of surrounding and reference element
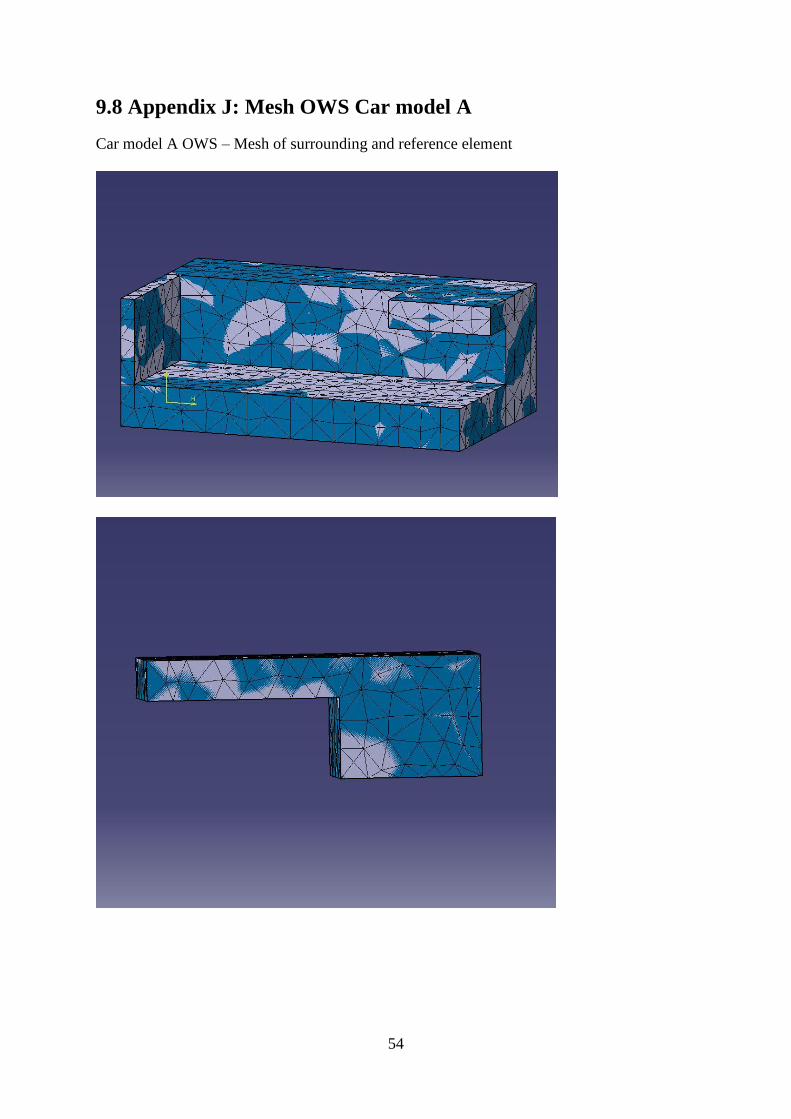
54
9.8 Appendix J: Mesh OWS Car model A
Car model A OWS – Mesh of surrounding and reference element
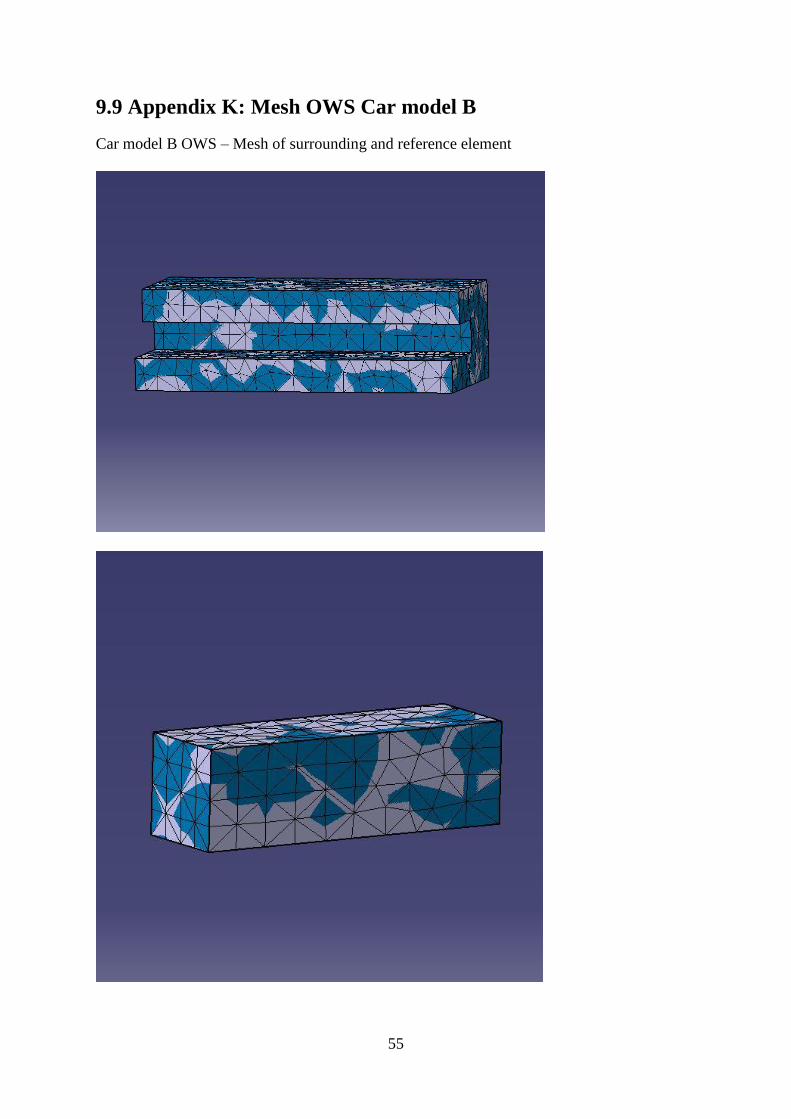
55
9.9 Appendix K: Mesh OWS Car model B
Car model B OWS – Mesh of surrounding and reference element