Embed Size (px)
Citation preview

PHYSICAL AND OPERATING CONDITIONS EFFECTS ON SILICA GEL/WATER
ADSORPTION CHILLER PERFORMANCE
Ahmed Rezk
Raya Al-Dadah
PRO-TEM NetworkSustainable Thermal Energy Management Conference (SusTEM2010)
© Sustainable Energy and Refrigeration Group, 2010(1/25)
School of Mechanical Engineering
Raya Al-Dadah

Presentation outlinePresentation outline•• BackgroundBackground
•• Chiller modelingChiller modeling
– Simulated chiller– Modeling technique– Governing equations – Performance indicators– Validation study
•• Fin spacingFin spacing
– Bed physical performance– Bed thermal performance
© Sustainable Energy and Refrigeration Group, 2010(2/25)
School of Mechanical Engineering
– Bed thermal performance– Chiller performance
•• Operation temperatureOperation temperature
– Cooling capacity and GT lift– Efficiency and GT lift– COP and GT lift
•• Cycle timeCycle time
– Operation modes– Cooling capacity– Optimum timing combination
•• ConclusionConclusion

BackgroundBackground
•• Advantages of adsorption refrigeration systemsAdvantages of adsorption refrigeration systems
– Environmentally friendly system.
– Large energy saving potential when it is applied in:
• Combined Cooling, Heating and Power (CCHP) system
• Sustainable Building Climatisation (SBC) using solar energy as heat source.
– Durability, long life time and low maintenance cost.
•• Advantages of silica gel/water adsorption systemAdvantages of silica gel/water adsorption system
© Sustainable Energy and Refrigeration Group, 2010(3/25)
School of Mechanical Engineering
•• Advantages of silica gel/water adsorption systemAdvantages of silica gel/water adsorption system
– Silica gel/water adsorption cycle can be powered using low grade heat sources (55-
100°C).
– Silica gel/water pair has relatively high equilibrium Ads/Des rate.
– Water has high latent heat of evaporation.
– Water is thermally stable within wide range of operating temperatures.
– Water is combatable with wide range of materials
TWOTWO--BED SILICA GEL/WATER BED SILICA GEL/WATER ADSORPTION CHILLER ADSORPTION CHILLER SIMULATION MODELSIMULATION MODEL
© Sustainable Energy and Refrigeration Group, 2010(4/25)
School of Mechanical Engineering
ADSORPTION CHILLER ADSORPTION CHILLER SIMULATION MODELSIMULATION MODEL

Chiller modeling: Simulated chillerChiller modeling: Simulated chillerThe simulated two-bed silica gel/water adsorption chiller is produced by Weatherite HoldingLtd, UK
© Sustainable Energy and Refrigeration Group, 2010(5/25)
School of Mechanical Engineering
Schematic diagram for the adsorption chillier produced by Weatherite
Adsorption chillier produced by Weatherite
Bed design of the adsorption chillierOne module construction One module covered by fine mesh
Chiller modeling: Modeling technique (1)Chiller modeling: Modeling technique (1)
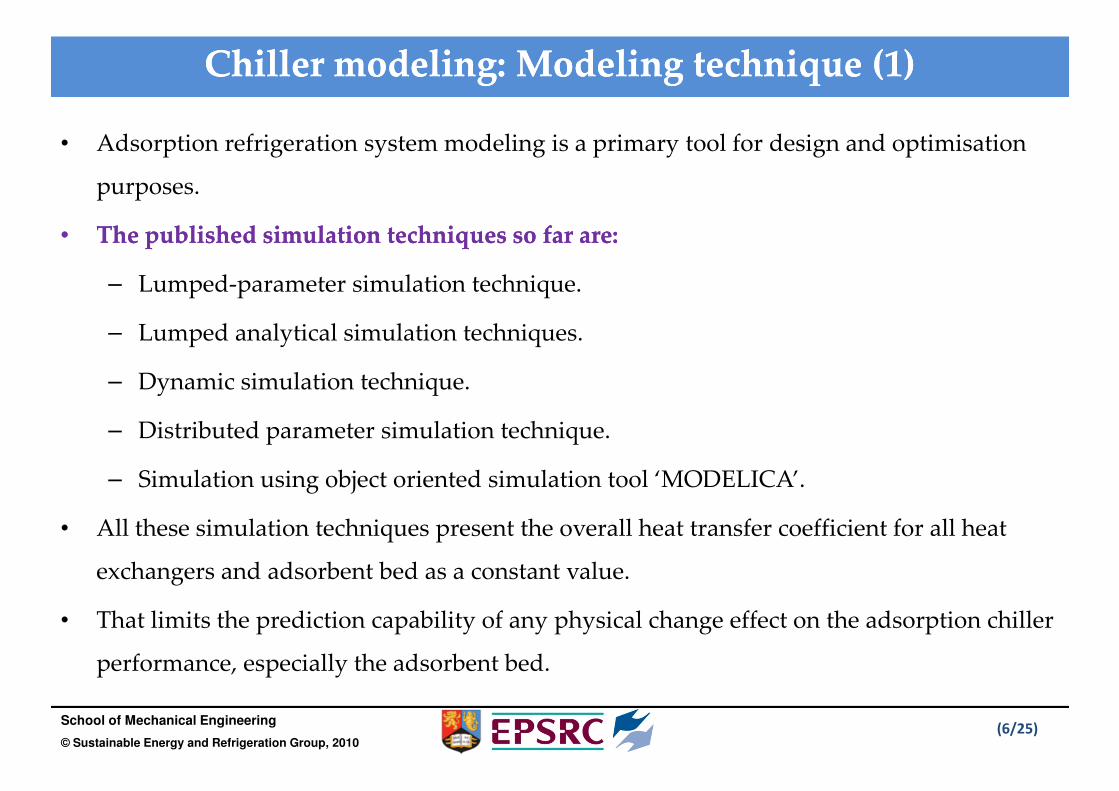
• Adsorption refrigeration system modeling is a primary tool for design and optimisation
purposes.
•• The published simulation techniques so far are:The published simulation techniques so far are:
– Lumped-parameter simulation technique.
– Lumped analytical simulation techniques.
– Dynamic simulation technique.
© Sustainable Energy and Refrigeration Group, 2010(6/25)
School of Mechanical Engineering
Dynamic simulation technique.
– Distributed parameter simulation technique.
– Simulation using object oriented simulation tool ‘MODELICA’.
• All these simulation techniques present the overall heat transfer coefficient for all heat
exchangers and adsorbent bed as a constant value.
• That limits the prediction capability of any physical change effect on the adsorption chiller
performance, especially the adsorbent bed.

Chiller modeling: Modeling technique (2)Chiller modeling: Modeling technique (2)
• This paper presents a new adsorption chiller simulation technique ‘Empirical lumpedanalytical simulation model’.
• Empirical lumped analytical sub-models were constructed for evaporator, condenser,adsorber and desorber based on their physical characteristics. They were integrated toform the chiller simulation model.
PC
MATLAB
© Sustainable Energy and Refrigeration Group, 2010(7/25)
School of Mechanical Engineering
The governing equations were
solved by MATLAB platform and
materials thermophysical properties
are calculated using REFPROP
CondenserDesorber
Evaporator
AdsorberEqn
REFPROP

Chiller modeling: Modeling governing equationsChiller modeling: Modeling governing equations
•• Energy balanceEnergy balance
– Adsorbent bed
– Evaporator
( )( ) ( )
( ) ( ) ( ){ } ( ) ( ) ( ){ }[ ] dtdwHMdtdwMTPhTPhTPhTh
LMTDdUAdtdTCMCMTCpwMTCM
sgsgsgsgsgbedbedgHexHexgbedHexgHexg
Nn
nbednbedbedmetbedmetbedsgsgbedrefsgsgbedwwbed
bed
∆+−−+−∂•+
×−=+++ ∑=
=−−−−
φγγφ
ζζ
,,1,
1)(1
( )[ ][ ] dtdEdtdwMhh
LMTDUAdtdTMCMTCp
pumpsgsgoutevaprefinevapref
evapevapevapmetevapmetevapevaprefevapfref
+−+
×=+ −−
,,,,
,,
φ
© Sustainable Energy and Refrigeration Group, 2010(8/25)
School of Mechanical Engineering
– Condenser
•• Refrigerant mass balanceRefrigerant mass balance
•• Water vapor adsorption rateWater vapor adsorption rate
( )[ ]( ) ( )[ ] dtdwMTTCphh
LMTDUAdtdTMCMTCp
sgsgbedcondrefgcondreflcondref
condcondcondmetcondmetcondcondrefcondlref
−+−+
×=+ −−
,,,,
,,
φ
( )dtdwdtdwMdtdM adsdessgevapfref +⋅−= φ,,
( ) ( )( )wwRTERDdt
dwapso −−= *2 exp15
Chiller modeling: Performance indicatorsChiller modeling: Performance indicators
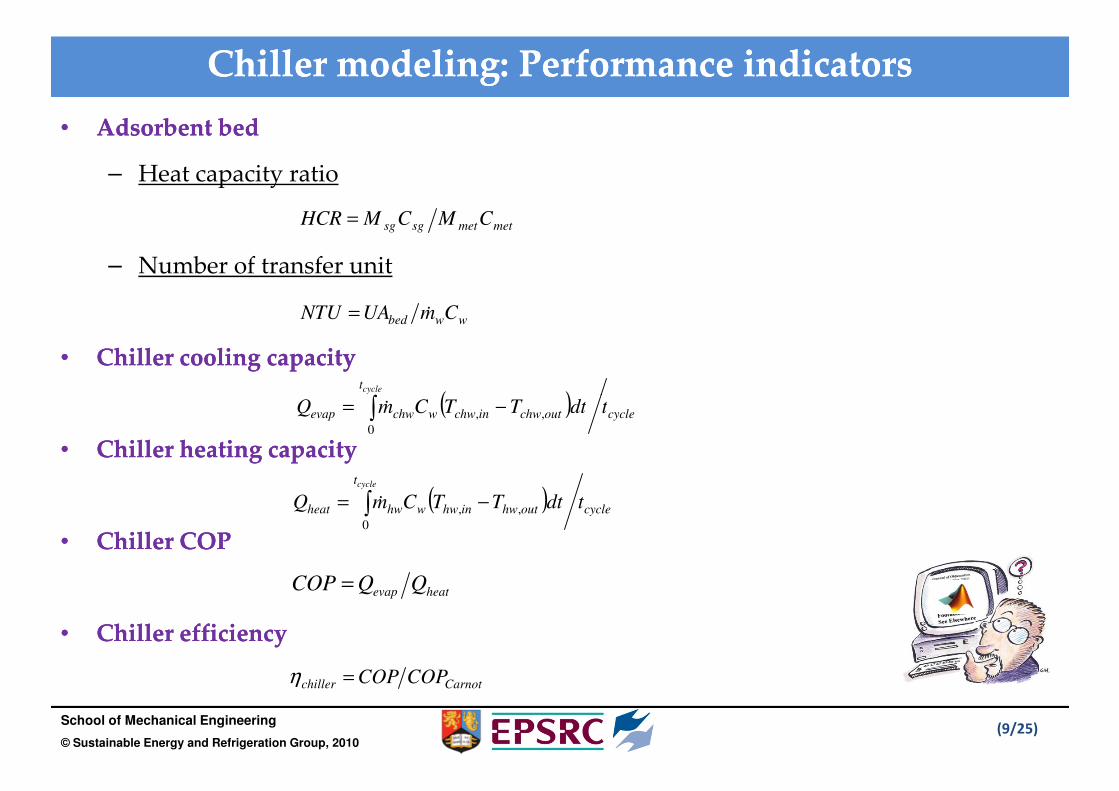
•• Adsorbent bedAdsorbent bed
– Heat capacity ratio
– Number of transfer unit
•• Chiller cooling capacityChiller cooling capacity
metmetsgsg CMCMHCR =
wwbed CmUANTU &=
( )t
tdtTTCmQcycle
−= ∫
© Sustainable Energy and Refrigeration Group, 2010(9/25)
School of Mechanical Engineering
•• Chiller heating capacityChiller heating capacity
•• Chiller COPChiller COP
•• Chiller efficiencyChiller efficiency
( ) cycleoutchwinchwwchwevap tdtTTCmQ ,,
0
−= ∫ &
( ) cycleouthwinhww
t
hwheat tdtTTCmQcycle
,,
0
−= ∫ &
heatevap QQCOP =
Carnotchiller COPCOP =η

Chiller modeling: Chiller modeling: validation study (1)validation study (1)
40
50
60
70
80
90
100
Wate
r O
utl
et T
emp
eratu
res
[ oC
]
Tchwi_ModTchwo_PredTcwi_ModTcwo_PredThwo_PredThwi_ActThwo_ActTcwi_ModTcwo_ActTchwi_ActTchwo_ActThwi_Mod
© Sustainable Energy and Refrigeration Group, 2010(10/25)
School of Mechanical Engineering
Based on the Comparison between predicted and actual heating, cooling and chilled wateroutlet temperature, there are a good agreement.
0
10
20
30
0 240 480 720 960 1200 1440 1680 1920
Wate
r O
utl
et T
emp
eratu
res
[
Cycle Time [ S ]Comparison between predicted and actual heating, cooling and chilled water outlet temperature
Chiller modeling: Chiller modeling: validation study (2)validation study (2)
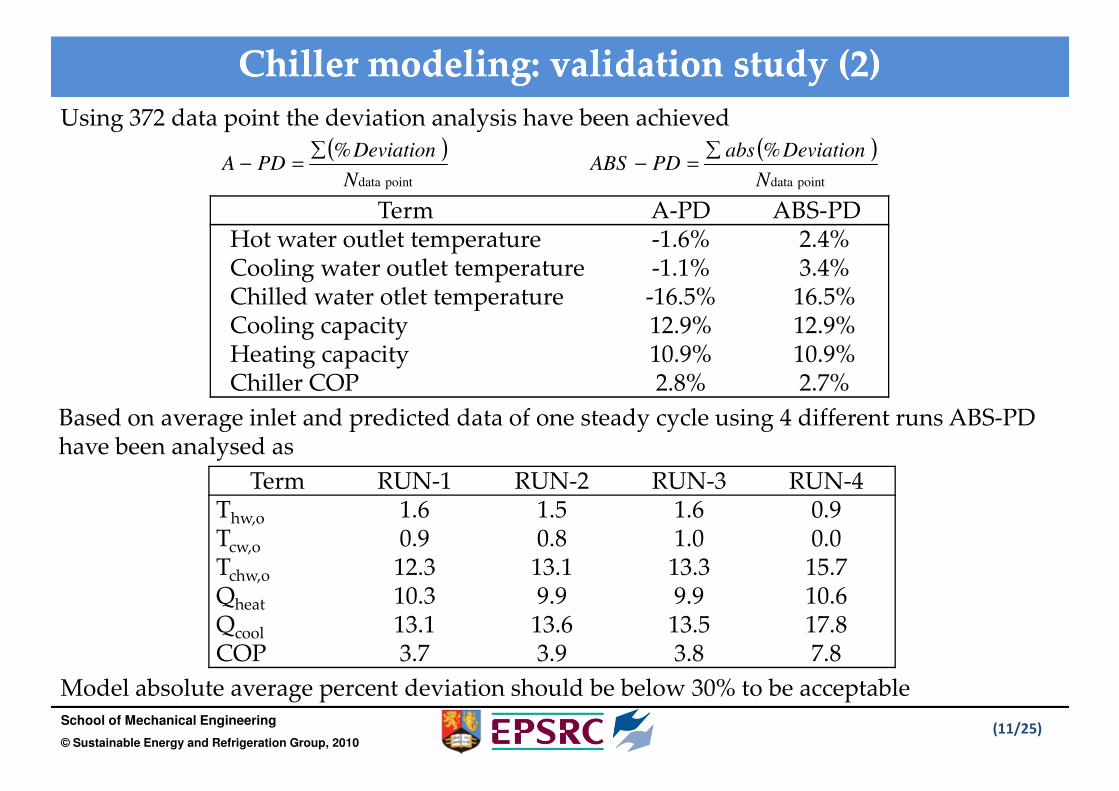
Term A-PD ABS-PDHot water outlet temperature -1.6% 2.4%Cooling water outlet temperature -1.1% 3.4%Chilled water otlet temperature -16.5% 16.5%Cooling capacity 12.9% 12.9%Heating capacity 10.9% 10.9%Chiller COP 2.8% 2.7%
( )point data
%
N
DeviationPDA
∑=−
( )point data
%
N
DeviationabsPDABS
∑=−
Using 372 data point the deviation analysis have been achieved
© Sustainable Energy and Refrigeration Group, 2010(11/25)
School of Mechanical Engineering
Chiller COP 2.8% 2.7%
Model absolute average percent deviation should be below 30% to be acceptable
Term RUN-1 RUN-2 RUN-3 RUN-4Thw,o 1.6 1.5 1.6 0.9Tcw,o 0.9 0.8 1.0 0.0Tchw,o 12.3 13.1 13.3 15.7Qheat 10.3 9.9 9.9 10.6 Qcool 13.1 13.6 13.5 17.8COP 3.7 3.9 3.8 7.8
Based on average inlet and predicted data of one steady cycle using 4 different runs ABS-PD have been analysed as
FIN SPACING AND CHILLER FIN SPACING AND CHILLER PERFORMANCEPERFORMANCE
© Sustainable Energy and Refrigeration Group, 2010(12/25)
School of Mechanical Engineering
PERFORMANCEPERFORMANCE

Tight fins arrangementLoose arrangement
Fin spacing: Bed physical performanceFin spacing: Bed physical performance
© Sustainable Energy and Refrigeration Group, 2010(13/25)
School of Mechanical Engineering
• HCR is the ratio between heat capacity of silica gel and adsorbent bed heat exchangermetal.
• Higher HCR means higher heat absorbed by silica gel relative to metal which is necessaryto improve adsorption chiller heat transfer performance.
The effect of fin configuration on fin height The effect of fin configuration on HCR
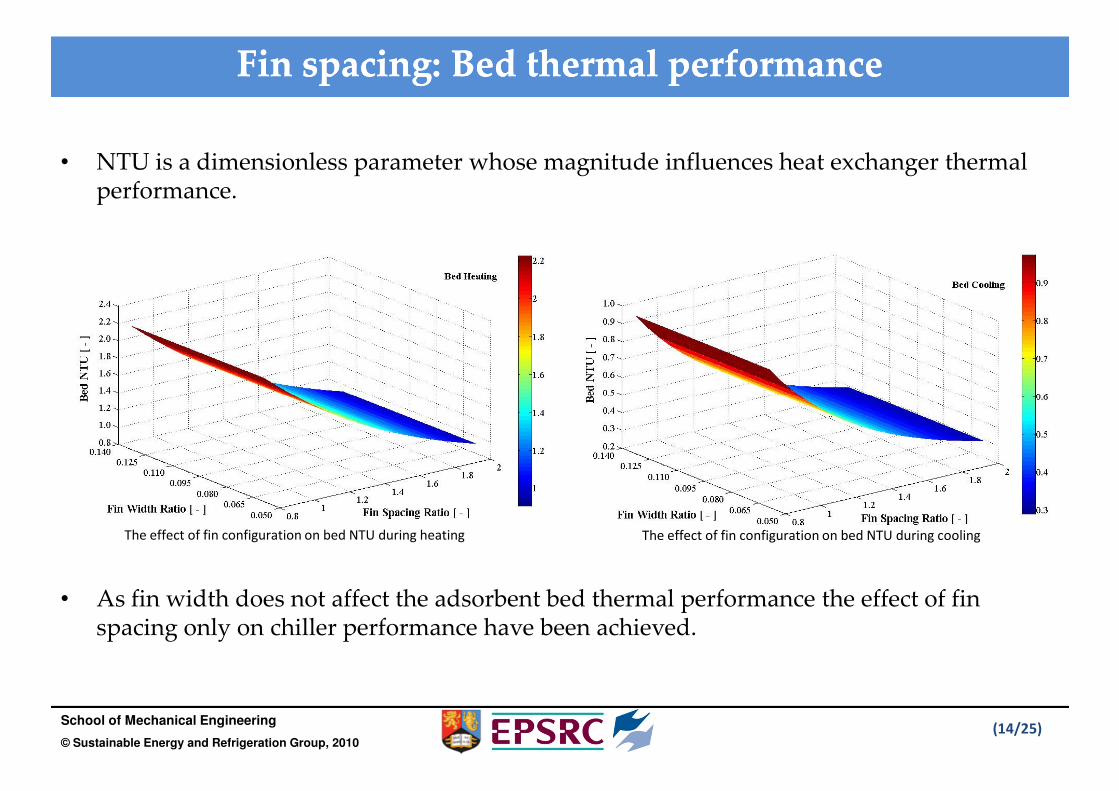
Fin spacing: Bed thermal performanceFin spacing: Bed thermal performance
• NTU is a dimensionless parameter whose magnitude influences heat exchanger thermal performance.
© Sustainable Energy and Refrigeration Group, 2010(14/25)
School of Mechanical Engineering
• As fin width does not affect the adsorbent bed thermal performance the effect of fin spacing only on chiller performance have been achieved.
The effect of fin configuration on bed NTU during heating The effect of fin configuration on bed NTU during cooling
0.60
0.65
0.70
0.75
600
650
700
750C
hil
ler C
ooli
ng a
nd
Heati
ng C
ap
acit
y [
kW
]Heating Capacity
Cooling Capacity
Chiller COP
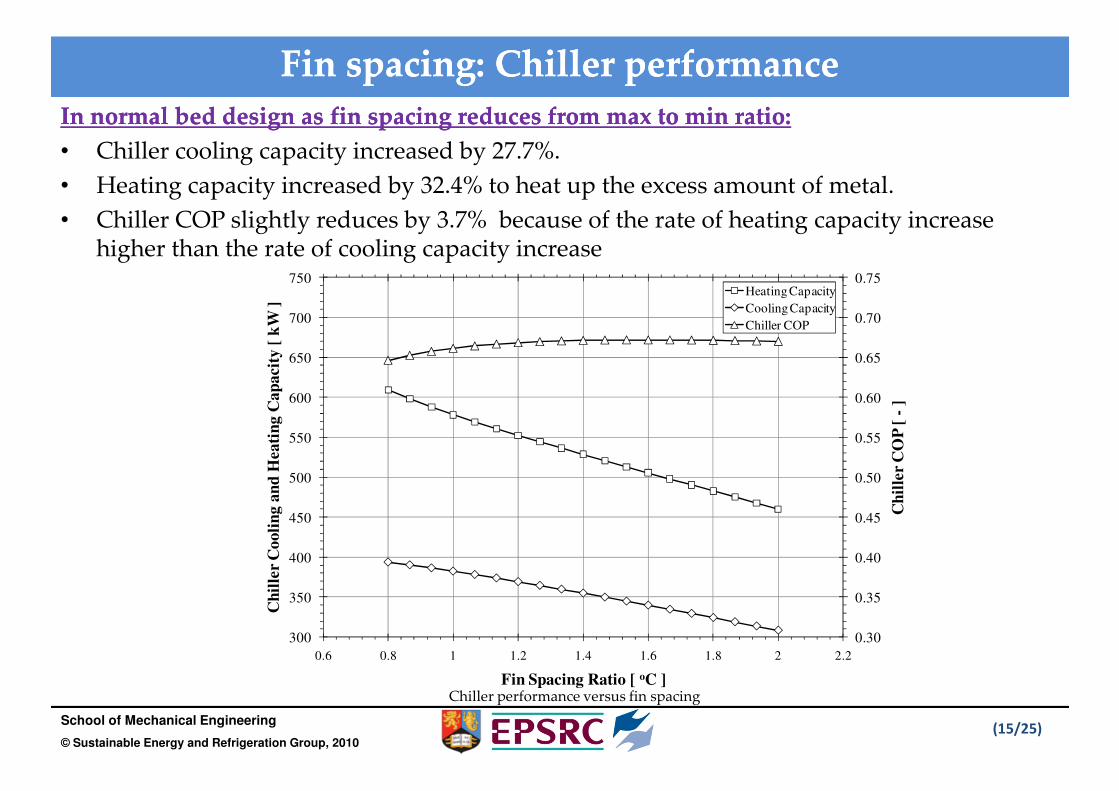
Fin spacing: Chiller performance Fin spacing: Chiller performance
In normal bed design as fin spacing reduces from max to min ratio:In normal bed design as fin spacing reduces from max to min ratio:
• Chiller cooling capacity increased by 27.7%.
• Heating capacity increased by 32.4% to heat up the excess amount of metal.
• Chiller COP slightly reduces by 3.7% because of the rate of heating capacity increase higher than the rate of cooling capacity increase
© Sustainable Energy and Refrigeration Group, 2010(15/25)
School of Mechanical Engineering
0.30
0.35
0.40
0.45
0.50
0.55
0.60
300
350
400
450
500
550
600
0.6 0.8 1 1.2 1.4 1.6 1.8 2 2.2
Ch
ille
r C
OP
[ -
]
Ch
ille
r C
ooli
ng a
nd
Heati
ng C
ap
acit
y [
kW
]
Fin Spacing Ratio [ oC ]Chiller performance versus fin spacing

OPERATING TEMPERATURES OPERATING TEMPERATURES AND CHILLER PERFORMANCEAND CHILLER PERFORMANCE
© Sustainable Energy and Refrigeration Group, 2010(16/25)
School of Mechanical Engineering
AND CHILLER PERFORMANCEAND CHILLER PERFORMANCE

350
400
450
500
550
Ch
ille
r C
oo
lin
g C
ap
acit
y [
kW
]
Tcw_in = 25.0
Tcw_in = 30.0
Tcw_in = 35.0
Tcw_in = 40.0
Experiments
• To evaluate the influence of operating temperatures on chiller performance a term namedGeneration Temperature Lift (GTL) is used which is the difference between heating andcooling water inlet temperatures.
• Chilled water inlet temperature is mainly based on zone load, where it is kept constant.
Operation temperature: Cooling capacity and GT liftOperation temperature: Cooling capacity and GT lift
• As generation temperaturelift increases chiller coolingcapacity increases graduallyfor all cooling water inlet
© Sustainable Energy and Refrigeration Group, 2010(17/25)
School of Mechanical Engineering
0
50
100
150
200
250
300
20 25 30 35 40 45 50 55 60 65 70 75 80
Ch
ille
r C
oo
lin
g C
ap
acit
y [
kW
]
Generation Temperature Lift [ K ]
420
430
440
450
460
470
59.1 59.2 59.3 59.4 59.5 59.6 59.7
Chiller cooling capacity versus generation temperature lift
for all cooling water inlettemperature.
• At fixed generationtemperature, as coolingwater inlet temperaturereduces chiller coolingcapacity increases.

0.7
0.8
0.9
1.0
Ch
ille
r E
ffic
ien
cy [
CO
P/C
OP
carn
ot ]
Tcw_in = 25.0
Tcw_in = 30.0
Tcw_in = 35.0
Tcw_in = 40.0
Operation temperature: Efficiency and GT liftOperation temperature: Efficiency and GT lift
• At low cooling water inlet temperature, the chiller efficiency decreases with increasing thegeneration temperature lift over the tested range.
• At higher cooling water temperature (Tcw>30oC), the chiller COP initially increases to acertain point and then reduces with increasing the generation temperature lift.
DroppingDropping chillerchiller efficiencyefficiency
• The first reason of droppingchiller efficiency is theinsufficient refrigerantcirculation to generate
© Sustainable Energy and Refrigeration Group, 2010(18/25)
School of Mechanical Engineering
0.2
0.3
0.4
0.5
0.6
0.7
20 23 26 29 32 35 38 41 44 47 50 53 56 59 62 65 68 71 74 77
Ch
ille
r E
ffic
ien
cy [
CO
P/C
OP
Generation Temperature Lift [ K ]Chiller efficiency versus generation temperature lift
circulation to generatecooling power. That can berecognised while chilleroperates under lowgeneration temperature liftaccompanied with highcooling water temperature.
• The second one is thesignificant heat losses in caseof high generationtemperature lift.
( )[ ] ( )[ ]evapadsevapdesdesadsCarnot TTTTTTCOP −×−=
Carnotchiller COPCOP =ηheatevap QQCOP =
0.7
0.8
0.9
1.0
Ch
ille
r C
OP
[ -
]
Tcw_in = 25.0
Tcw_in = 30.0
Tcw_in = 35.0
Tcw_in = 40.0
Experiments
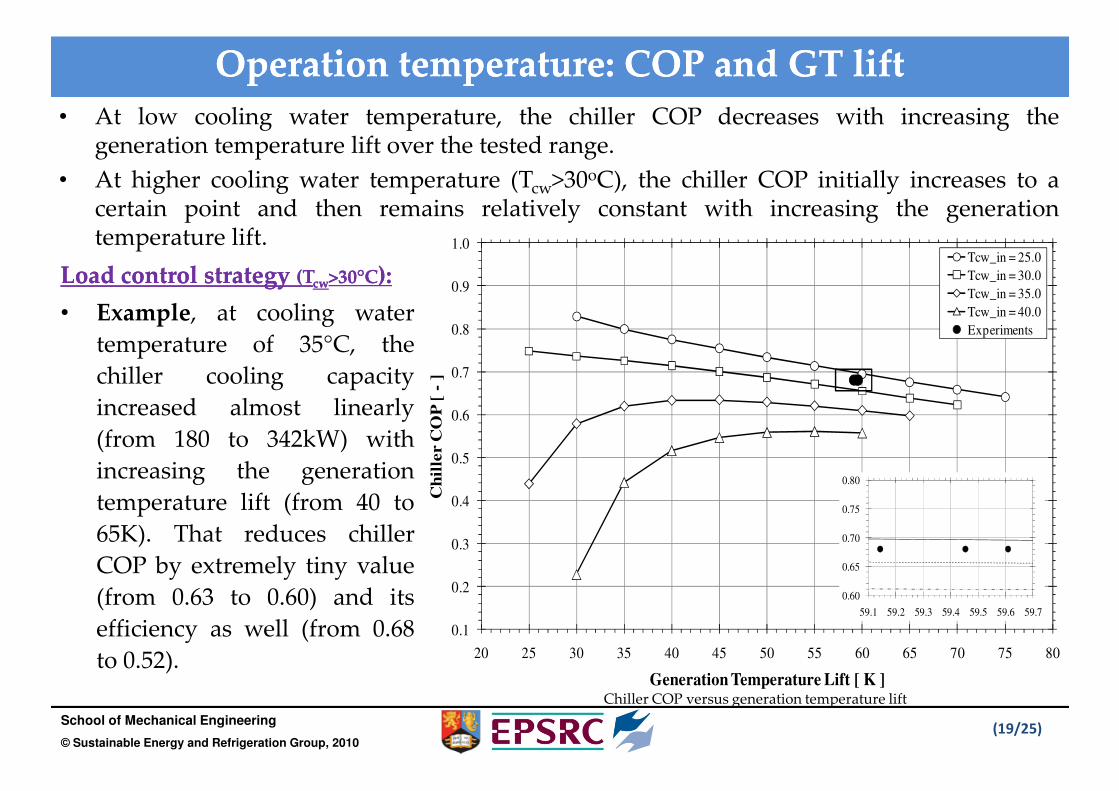
Operation temperature: COP and GT liftOperation temperature: COP and GT lift
• At low cooling water temperature, the chiller COP decreases with increasing thegeneration temperature lift over the tested range.
• At higher cooling water temperature (Tcw>30oC), the chiller COP initially increases to acertain point and then remains relatively constant with increasing the generationtemperature lift.
LoadLoad controlcontrol strategystrategy (T(Tcwcw>>3030°°CC))::
• Example, at cooling water
temperature of 35°C, the
chiller cooling capacity
increased almost linearly
© Sustainable Energy and Refrigeration Group, 2010(19/25)
School of Mechanical Engineering
0.1
0.2
0.3
0.4
0.5
0.6
20 25 30 35 40 45 50 55 60 65 70 75 80
Ch
ille
r C
OP
[
Generation Temperature Lift [ K ]
0.60
0.65
0.70
0.75
0.80
59.1 59.2 59.3 59.4 59.5 59.6 59.7
Chiller COP versus generation temperature lift
increased almost linearly
(from 180 to 342kW) with
increasing the generation
temperature lift (from 40 to
65K). That reduces chiller
COP by extremely tiny value
(from 0.63 to 0.60) and its
efficiency as well (from 0.68
to 0.52).

CYCLE TIME AND CHILLER CYCLE TIME AND CHILLER PERFORMANCEPERFORMANCE
© Sustainable Energy and Refrigeration Group, 2010(20/25)
School of Mechanical Engineering
PERFORMANCEPERFORMANCE

Cycle time: Operation modes (1)Cycle time: Operation modes (1)
Mode [ A ] – Ads/Des Mode [ B ] - Mass recovery
© Sustainable Energy and Refrigeration Group, 2010(21/25)
School of Mechanical Engineering
Mode [ A ] – Ads/Des Mode [ B ] - Mass recovery
Mode [ C ] - heat recovery
Ads/Des
Mode
425 second
Mass Rec
Mode
35 secondHeat Rec
Mode
20 second
Total cycle time
480 second
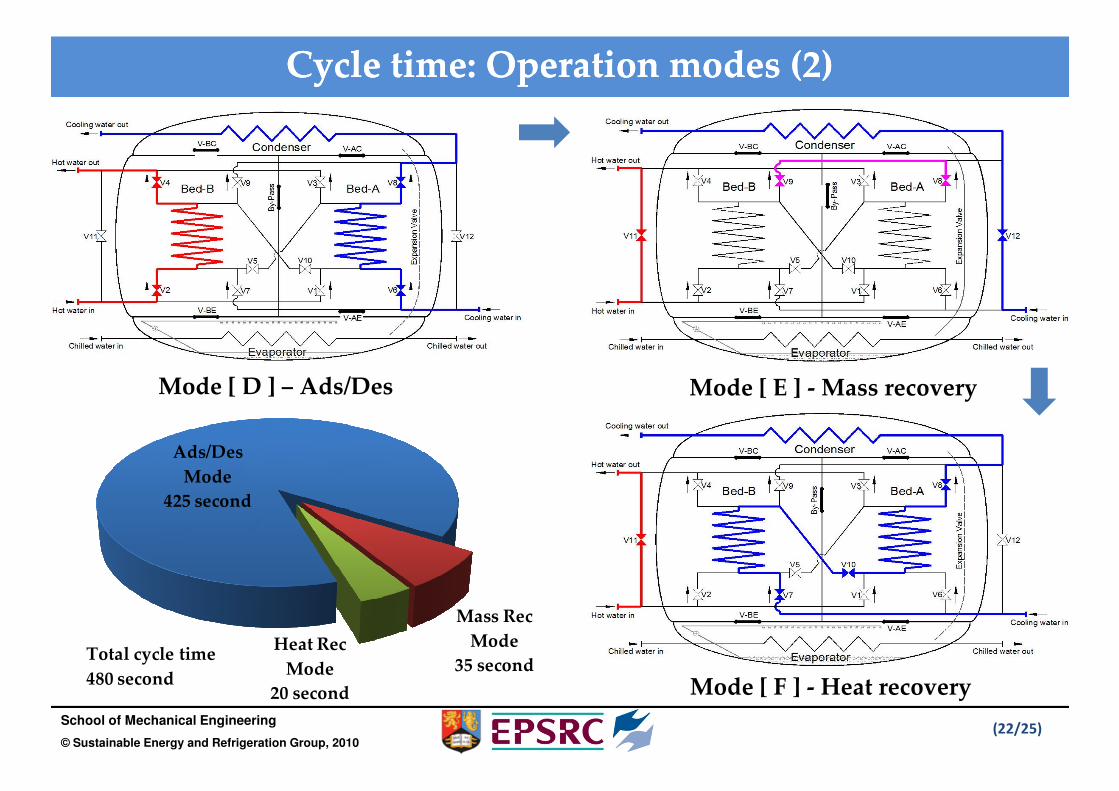
Cycle time: Operation modes (2)Cycle time: Operation modes (2)
Mode [ D ] – Ads/Des Mode [ E ] - Mass recovery
© Sustainable Energy and Refrigeration Group, 2010(22/25)
School of Mechanical Engineering
Mode [ D ] – Ads/Des Mode [ E ] - Mass recovery
Mode [ F ] - Heat recovery
Ads/Des
Mode
425 second
Mass Rec
Mode
35 secondHeat Rec
Mode
20 second
Total cycle time
480 second
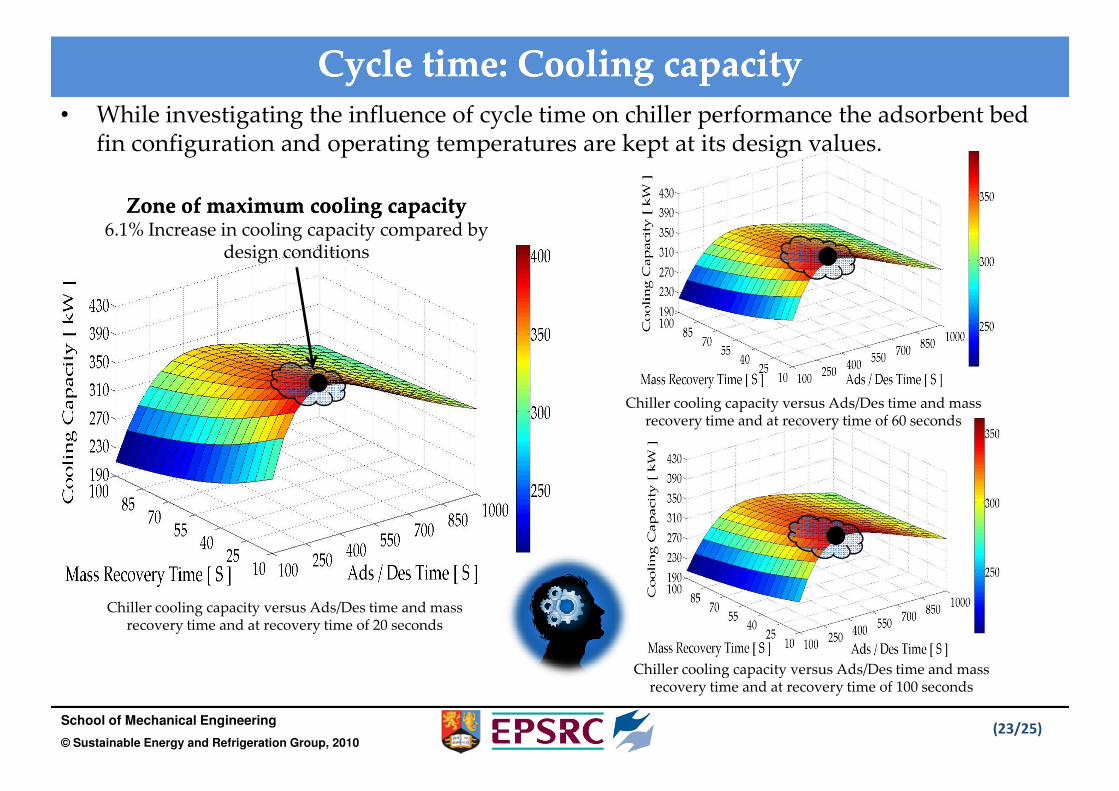
Cycle time: Cooling capacityCycle time: Cooling capacity
Zone of maximum cooling capacityZone of maximum cooling capacity6.1% Increase in cooling capacity compared by
design conditions
• While investigating the influence of cycle time on chiller performance the adsorbent bed fin configuration and operating temperatures are kept at its design values.
Chiller cooling capacity versus Ads/Des time and mass
© Sustainable Energy and Refrigeration Group, 2010(23/25)
School of Mechanical Engineering
Chiller cooling capacity versus Ads/Des time and mass recovery time and at recovery time of 20 seconds
Chiller cooling capacity versus Ads/Des time and mass recovery time and at recovery time of 60 seconds
Chiller cooling capacity versus Ads/Des time and mass recovery time and at recovery time of 100 seconds
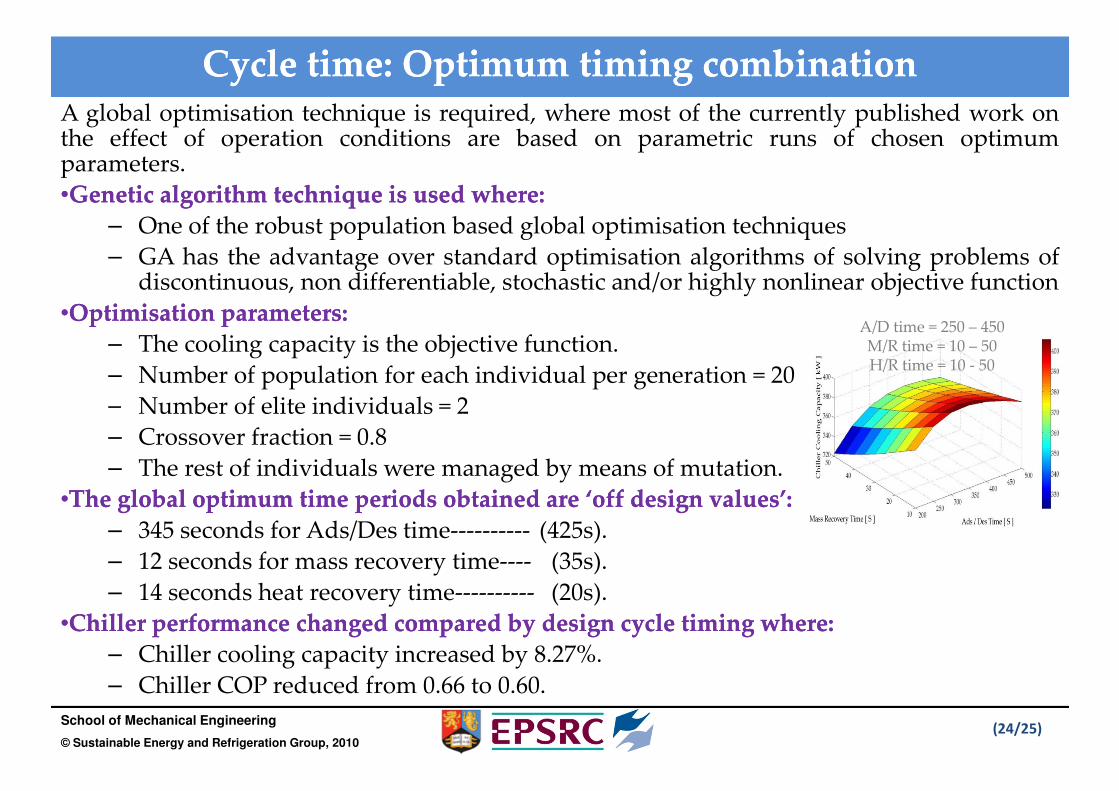
Cycle time: Optimum timing combinationCycle time: Optimum timing combinationA global optimisation technique is required, where most of the currently published work onthe effect of operation conditions are based on parametric runs of chosen optimumparameters.
••GeneticGenetic algorithmalgorithm techniquetechnique isis usedused wherewhere::
– One of the robust population based global optimisation techniques
– GA has the advantage over standard optimisation algorithms of solving problems ofdiscontinuous, non differentiable, stochastic and/or highly nonlinear objective function
••OptimisationOptimisation parametersparameters::
– The cooling capacity is the objective function.
– Number of population for each individual per generation = 20
– Number of elite individuals = 2
A/D time = 250 – 450M/R time = 10 – 50H/R time = 10 - 50
© Sustainable Energy and Refrigeration Group, 2010(24/25)
School of Mechanical Engineering
– Number of elite individuals = 2
– Crossover fraction = 0.8
– The rest of individuals were managed by means of mutation.
••TheThe globalglobal optimumoptimum timetime periodsperiods obtainedobtained areare ‘off‘off designdesign values’values’::
– 345 seconds for Ads/Des time---------- (425s).
– 12 seconds for mass recovery time---- 0(35s).
– 14 seconds heat recovery time---------- 0(20s).
••ChillerChiller performanceperformance changedchanged comparedcompared byby designdesign cyclecycle timingtiming wherewhere::
– Chiller cooling capacity increased by 8.27%.
– Chiller COP reduced from 0.66 to 0.60.

ConclusionConclusion
TheThe followingfollowing pointspoints cancan bebe concludedconcluded::
• The presented simulation model predicted the performance of actual 450kW adsorption
water chiller with good accuracy.
• The model is a global model that has the ability to investigate the effect of various physical
and operation parameters on the performance of the adsorption chiller.
• Reducing fin spacing can increase the cooling capacity but can reduce the chiller COP due
© Sustainable Energy and Refrigeration Group, 2010(25/25)
School of Mechanical Engineering
• Reducing fin spacing can increase the cooling capacity but can reduce the chiller COP due
to increasing the metal content of the chiller.
• Using cooling water inlet temperature over 30, generation temperature lift can be used as a
load control tool.
• Using optimal cycle time, chiller cooling capacity can be increased by 8% and the COP
reduces from 0.66 to 0.6.

© Sustainable Energy and Refrigeration Group, 2010(26/25)
School of Mechanical Engineering