Embed Size (px)
Citation preview

Int. J. Electrochem. Sci., 8 (2013) 257 - 273
International Journal of
ELECTROCHEMICAL SCIENCE
www.electrochemsci.org
Physical and Electrochemical Properties of Supercapacitor
Electrodes Derived from Carbon Nanotube and Biomass
Carbon
R. Farma1,2
, M. Deraman1,*
, Awitdrus1,2
, I.A. Talib1, R. Omar
1, J.G. Manjunatha,
1M.M. Ishak
1,
N.H. Basri1 and B.N.M. Dolah
1
1 School of Applied Physics, Faculty of Science and Technology, Universiti Kebangsaan Malaysia,
43600 Bangi, Selangor, Malaysia 2
Department of Physics, Faculty of Mathematics and Natural Sciences, University of Riau, 28293
Pekanbaru, Riau, Indonesia *E-mail: [email protected]
Received: 29 October 2012 / Accepted: 29 November 2012 / Published: 1 January 2013
Green monoliths (GMs) were prepared from mixtures of KOH (5% by weight), carbon nanotubes (5%)
and self-adhesive carbon grains (90%) from oil palm empty fruit bunch fibers. The GMs were
carbonized up to 600, 700 and 800°C under an N2 gas environment, and activated by CO2 gas at 800°C
for one hour to produce activated carbon monoliths (ACMs), designated as ACM6, ACM7 and ACM8,
respectively. The characterization of the ACMs showed a notable effect of the carbonization
temperature on the structure, microstructure, electrical conductivity and porosity of the ACMs.
Consequently, three independent methods, galvanostatic charge-discharge, cyclic voltammetry and
electrochemical impedance spectroscopy, used for the electrochemical characterization of
supercapacitor cells fabricated using the ACMs as their electrodes, consistently found that the ACM7
and ACM8 cells have higher specific capacitance (77 Fg-1
and 85 Fg-1
, respectively), specific energy
(2.2 Wh kg-1
and 2.1 Wh kg-1
, respectively) and specific power (156 W kg-1
and 161 W kg-1
,
respectively) compared to the ACM6 cell. These results suggest that carbonization should be
performed at temperatures closer or equal to the activation temperature for the preparation of
supercapacitor electrodes composed of biomass precursors.
Keywords: Self-adhesive carbon grains, Activated carbon monolith, Carbon nanotube, Porosity,
Supercapacitor electrode
1. INTRODUCTION
Supercapacitors are electrochemical storage devices whose range of energy and power densities
can complement the function of batteries and conventional capacitors for storing energy and delivering

Int. J. Electrochem. Sci., Vol. 8, 2013
258
power [1]. The most common types of supercapacitor electrodes include activated carbon (AC), and
the carbon-based supercapacitor is widely developed because of its low cost, large capacitance and
long cycling life [2]. The electrostatic charges stored at the AC electrode/electrolyte double layer
interface produce a high capacitance because of the high specific surface area of the AC electrodes.
However, a relatively low electronic conductivity of the AC results in the supercapacitor having a high
equivalent series resistance (ESR) and hence lower specific energy (E) and power (P) during charge
and discharge. This shortcoming can be resolved by mixing AC with carbon nanotubes (CNTs), which
have a higher electronic conductivity [3,4]. Because the CNTs have a lower specific capacitance (Csp)
than the AC, the mixture was subjected to physical/chemical activation in an attempt to increase the
surface area and specific capacitance (Csp) of the electrode [4,5].
Here, the preparation and characterization of binderless AC monolith (ACM) electrodes from
the mixture of self-adhesive carbon grains (SACG) from oil palm empty fruit bunch (EFB) fibers,
CNTs and potassium hydroxide (KOH) is reported. KOH is a typical alkaline metal compound that is
widely used for the chemical activation of coal precursors, chars and petroleum coke. It has been
reported that the chemical reactions between hydroxides (KOH or NaOH) and carbon during the
activation process play an important role in the porosity development of the activated carbon [6].
Green monoliths (GMs) of the aforementioned mixtures were carbonized in a N2 environment up to
various carbonization temperatures to produce carbon monoliths (CMs) prior to the CO2 activation
process used to produce the ACMs. The physical activation is usually carried out by treating the
carbonized sample within an oxidizing gas atmosphere (such as CO2 and water vapor) under a
moderately high temperature (800-100°C) to improve the internal porosity [7].
In the present study, a new procedure for preparing electrodes by varying the carbonization
temperature during the preparation of ACMs from CNTs and AC from EFB fibers based on a
combination of chemical (KOH) and physical activation agent (CO2) is examined. The combination of
chemical and physical activation methods has been reported for carbon electrodes from other types of
biomass precursors, for example, coffee endocarp [8] and sun flower seed shell [9] precursors. The
ACMs were characterized by investigating their density, electrical conductivity, porosity,
microstructure and structure with respect to carbonization temperature. The electrochemical behaviors
of the supercapacitor cells fabricated using these ACM electrodes were investigated using three
different electrochemical characterization techniques. Recent related work has been reported by our
research group in references [10-12].
2. EXPERIMENTAL
2.1 Electrode preparation and cell fabrication
SACGs with an average particle size less than 106 µm were prepared from EFB fibers by pre-
carbonization (Furnace CTMSB46), milling for 36 hours (ball mill AC Motor BS 500-110) and sieving
(Matest 24030 Brembate Sopra (BG)). The mixture was prepared by pouring 27.0 g SACG and 1.5 g
of KOH (5% by weight) and CNT (5% by weight) into 300 ml boiling water; the mixture was stirred
Int. J. Electrochem. Sci., Vol. 8, 2013
259
for 1 hour and then dried in an oven at 100°C for 48 hour. Approximately 10 g of the dried mixture
was milled for 20 min to obtain a homogeneous composition. Following this step, 0.75 g of the
mixture was placed inside a mold with a diameter of 20 mm and converted into a GM using a press
pelletizing machine (VISITEC 2009-Malaysia).
The GMs were carbonized into CMs in a carbonization furnace (Vulcan Box Furnace 3-1750)
under a 1.5 L min-1
flow of N2 gas, up to 600, 700 and 800°C using our previous multi-step heating
profile [13] to produce CM6, CM7 and CM8, respectively. ACM6, ACM7 and ACM8 were produced
from these respective CMs via CO2 (1.0 L min-1
) activation at 800°C for 1 hour with a heating rate of
5°C min-1
. After being polished to a thickness of 0.4 mm, the ACMs were used as electrodes in
symmetrical supercapacitor cells using 316L stainless steel (0.02 mm thick) as current collector, 1 M
H2SO4 as electrolyte and a Teflon ring as separator (0.1 mm thick).
2.2 Physical and electrical characterizations
The dimensions (Mitutoyo 193-253) and masses (Mettler Toledo AB204) of the monoliths
were measured to determine the density of the GMs, CMs and ACMs. The four-point-probe technique
(Jandel Universal Probe & Keithley Micro-Ohmeter 220) was used to determine the electrical
conductivity of the ACMs. A field emission scanning electron microscope (FESEM) (Zeiss SUPRA
55VP) was used to study the microstructures of the ACMs. An X-ray diffractometer (Bruker AXS:
model D8 Advance, wavelength of 1.5406 Å) was used to record the X-ray diffraction (XRD) patterns
of the ACMs. The liquid nitrogen (77 K) adsorption-desorption isotherm experiments (Micromeretic
ASAP 2010) were conducted to characterize the porosity of the ACMs.
2.3 Electrochemical characterization
The performance of the supercapacitor cells using ACMs as their electrodes was studied by
electrochemical impedance spectroscopy (EIS), cyclic voltammetry (CV) and galvanostatic charge-
discharge (GCD) methods using an electrochemical instrument-interface (Solartron SI 1286 and
Solartron 1255HF Frequency Response Analyzer). All of the measurements were carried out at room
temperature (25°C). Using the EIS data, the Csp of the electrodes was determined using the equation
(1):
(1)
where fl is the lowest frequency, Zl” is the imaginary impedance at fl and m is the weight of
electrode.
The EIS data as a function of the frequency were analyzed using equations (2), (3) and (4):
C(ω) = C’(ω) – jC”(ω) (2)

Int. J. Electrochem. Sci., Vol. 8, 2013
260
C”(ω) = Z’(ω) / ω│Z(ω)│2 (3)
C’(ω) = -Z”(ω) / ω│Z(ω)│2 (4)
where Z(ω) is equal to 1/jωC(ω), C’(ω) is the real capacitance, C” (ω) is the imaginary
capacitance, Z’(ω) is the real impedance and Z” (ω) is the imaginary impedance [14].
From the voltammograms, the Csp of the electrodes was determined using equation (5):
(5)
where i is the electric current, S is the scan rate and m is the weight of electrode.
From the GCD data (charge-discharge curve) recorded at a selected current density, the Csp of
the electrodes was determined using equation (6):
(6)
where i is the discharge current, ΔV is the voltage and Δt is the discharge time [15-17]. The
values of the specific power (P) and specific energy (E) were also calculated from the GCD data using
the following equations (7) and (8), respectively:
(7)
(8)
where i is the discharge current, V is the voltage (excluding the iR drop occurring at the
beginning of the discharge) and t is the time [18].
3. RESULTS AND DISCUSSION
3.1 Physical and electrical properties
Table 1 shows the weight (w), thickness (t), diameter (d) and density (ρ) of the GMs, CMs and
ACMs, along with the electrical conductivity (σ) of the ACMs. Analysis of the ACM data reveals that
the samples experienced 52.70% to 55.54% weight loss and 22.43% to 27.06% dimensional shrinkage
after carbonization. These effects are due to the release of the non-carbon material and rearrangement
of the carbon atoms during the carbonization and activation processes. A small difference between the
weight loss and dimensional shrinkage percentages has been observed elsewhere [13,19] and is a major
factor contributing to the small differences in the sample densities before and after carbonization. The

Int. J. Electrochem. Sci., Vol. 8, 2013
261
density of the ACMs is slightly higher compared to the density of the bamboo carbon electrode, 0.63 to
0.95 g cm-3
[20], and rubber wood sawdust carbon electrode, 0.63 to 0.85 g cm-3
[21]. The electrical
conductivity of the ACMs seems to change slightly with the carbonization temperature, which
corresponds to a small change in the densities of the ACMs. According to percolation theory and the
granular model, the electrical conductivity of the carbon sample is proportional to its density [22].
Table 1. Weight, dimensions and density of the GMs, CMs and ACMs, and electrical conductivity of
the ACMs.
Samples w (g) d (mm) t (mm) ρ (g cm-3
) σ (S cm-1
)
GM6 0.7351 2.19 20.15 1.053 -
GM7 0.7443 2.22 20.17 1.050 -
GM8 0.7283 2.18 20.12 1.051 -
CM6 0.3485 1.64 15.63 1.108 -
CM7 0.3295 1.62 15.39 1.094 -
CM8 0.3158 1.59 15.14 1.104 -
ACM6 0.3129 1.59 14.68 1.163 14.31
ACM7 0.3259 1.59 15.00 1.160 13.82
ACM8 0.3192 1.59 14.97 1.141 13.49
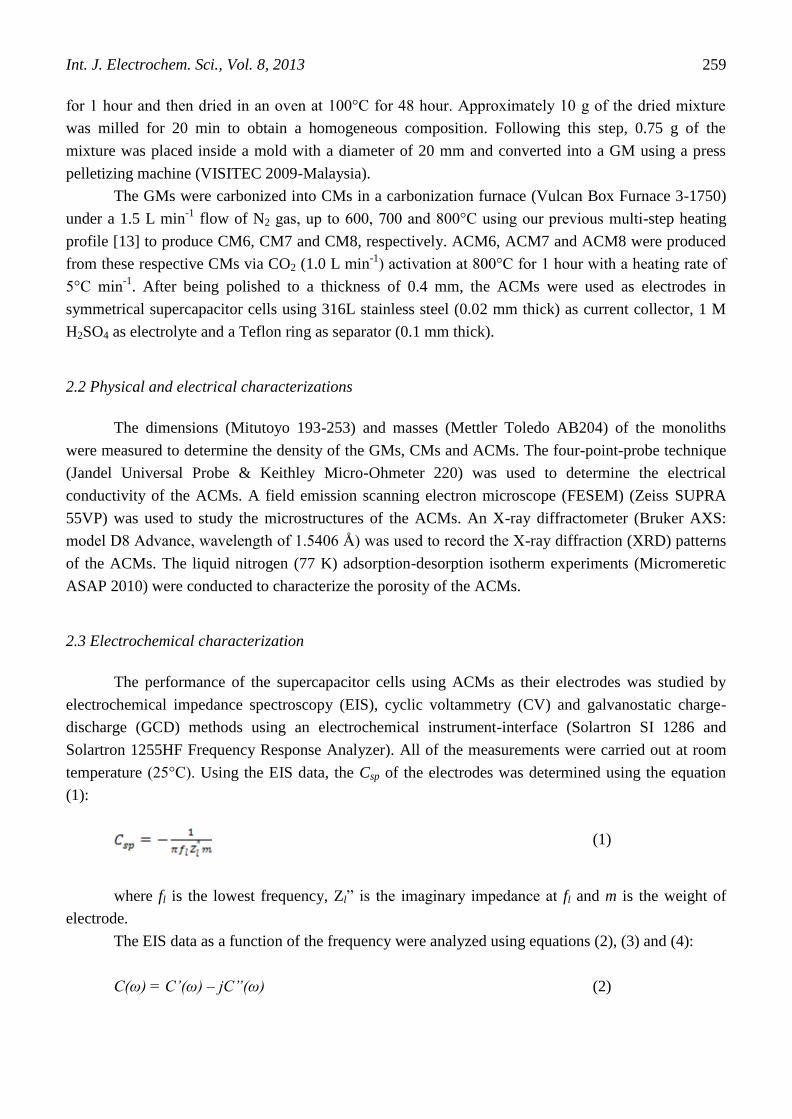
Figure 1 shows the XRD data of the ACM6, ACM7 and ACM8 specimens. These data show
that all of the ACMs have a turbostratic structure, which implies that the building blocks of the ACMs
are composed of graphitic-like microcrystallites that are randomly oriented and distributed throughout
the samples [23-25]. All of the ACMs shows a similar diffraction pattern with two broad peaks at
diffraction angles of 25° and 41.6°, corresponding to the (002) and (100) peaks, respectively. The
intense peaks around 25.6° are due to the addition of CNT. From these peaks, the values of the
structural parameters, such as the interlayer spacing, d002 and d100, and microcrystallite dimensions, Lc
(stack height) and La (stack width), were determined. The values of d002 and d100 were calculated using
Bragg’s equation (nλ = 2dsinθ, where n = 1, λ is the wave length (1.5406 Å) of the X-ray radiation and
θ is the Bragg angle representing the position of the (002) and (100) diffraction peaks). The values of
Lc, determined from the (002) peak, and La, determined from the (100) peak, were calculated using the
Debye-Scherrer equation (Lc,a = Kλ/βc,a cosθ, where K is the shape factor equal to 0.89 and 1.84 for Lc
and La, respectively, and βc,a is the full width at half maximum of the symmetrically shaped diffraction
peaks).
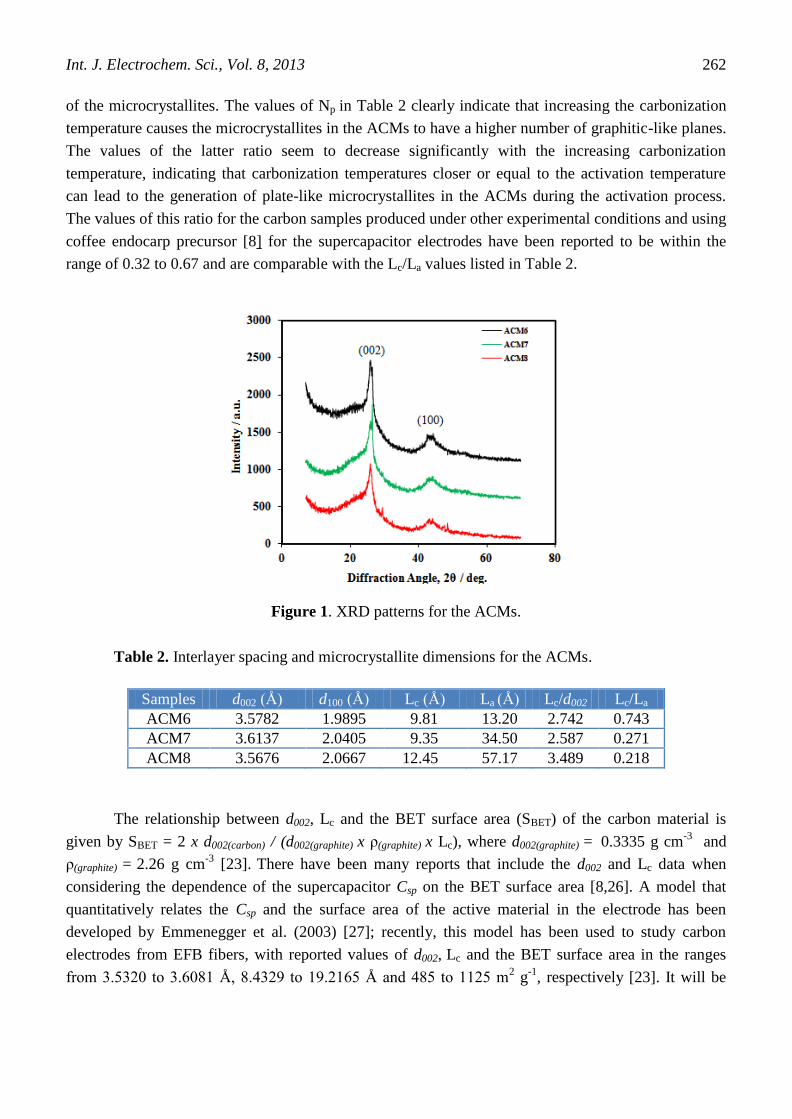
The calculated values of the structural parameters are shown in Table 2. The change in the d002
and d001 values is very small and does not have a systematic trend to be correlated with the change of
the carbonization temperature. However, the microcrystallite dimensions (Lc and La) in the ACMs
seem to change significantly with carbonization temperature. These results could be further analyzed
in terms of the ratios of Lc/d002 and Lc/La. The former ratio represents the mean number of planes in the
microcrystallites (Np), while the later ratio represents the relative density of edge and basal planes in
the microcrystallites. The relative density of edge and basal planes is a measure of the edge orientation
Int. J. Electrochem. Sci., Vol. 8, 2013
262
of the microcrystallites. The values of Np in Table 2 clearly indicate that increasing the carbonization
temperature causes the microcrystallites in the ACMs to have a higher number of graphitic-like planes.
The values of the latter ratio seem to decrease significantly with the increasing carbonization
temperature, indicating that carbonization temperatures closer or equal to the activation temperature
can lead to the generation of plate-like microcrystallites in the ACMs during the activation process.
The values of this ratio for the carbon samples produced under other experimental conditions and using
coffee endocarp precursor [8] for the supercapacitor electrodes have been reported to be within the
range of 0.32 to 0.67 and are comparable with the Lc/La values listed in Table 2.
Figure 1. XRD patterns for the ACMs.
Table 2. Interlayer spacing and microcrystallite dimensions for the ACMs.
Samples d002 (Å) d100 (Å) Lc (Å) La (Å) Lc/d002 Lc/La
ACM6 3.5782 1.9895 9.81 13.20 2.742 0.743
ACM7 3.6137 2.0405 9.35 34.50 2.587 0.271
ACM8 3.5676 2.0667 12.45 57.17 3.489 0.218
The relationship between d002, Lc and the BET surface area (SBET) of the carbon material is
given by SBET = 2 x d002(carbon) / (d002(graphite) x ρ(graphite) x Lc), where d002(graphite) = 0.3335 g cm-3
and
ρ(graphite) = 2.26 g cm-3
[23]. There have been many reports that include the d002 and Lc data when
considering the dependence of the supercapacitor Csp on the BET surface area [8,26]. A model that
quantitatively relates the Csp and the surface area of the active material in the electrode has been
developed by Emmenegger et al. (2003) [27]; recently, this model has been used to study carbon
electrodes from EFB fibers, with reported values of d002, Lc and the BET surface area in the ranges
from 3.5320 to 3.6081 Å, 8.4329 to 19.2165 Å and 485 to 1125 m2 g
-1, respectively [23]. It will be

Int. J. Electrochem. Sci., Vol. 8, 2013
263
revealed in a later section that the surface area data collected in this study also change with the Lc
values shown in Table 2.
For the FESEM investigation, the ACMs were fractured, and the FESEM micrographs of these
fractured surfaces are shown in Figures 2 (a-c). These micrographs show the porous characteristics of
the ACM6, ACM7 and ACM8 electrodes. The rough texture represents the grain boundary surfaces,
while the smooth texture represents the fractured grain surfaces. The ACM8 electrode seems to have a
larger grain size than the other electrodes, which is consistent with the dimensional data of
microcrystallites listed in Table 2.
Figure 2. FESEM micrographs for (a) ACM6, (b) ACM7 and (c) ACM8.
Figure 3 demonstrates that all of the samples exhibit a typical I-type isotherm [28], indicating
that all of the electrodes are microporous solids with low external and high internal surface areas. The
rounded knee in the low relative pressure indicates that the samples possess a wide pore size
distribution that varies from the micropore to mesopore range. The flat curve over a wide range of
relative pressures indicates the existence of much more widely distributed and heterogeneous
microporosity. The presence of the pronounced upward tail as the relative pressure approaches unity
indicates that there are a larger amount of porous spaces and ink bottle pores shaped [29,30]. Although
all of the curves show similar features, the adsorption-desorption capacity for ACM8 is significantly
higher than for ACM6 and ACM7, indicating that the 800°C carbonization temperature is
advantageous in converting CMs into ACMs.
Quantitative interpretation of the isotherms, shown in Figure 3, is listed in Table 3. The
quantitative interpretation includes the BET surface area (SBET), surface area of the mesopores (SMeso)
and micropores (SMicro), volume of the mesopores (VMeso) and micropores (VMicro) and the average pore
diameter (Dp). As revealed through these results, the preparation of the electrodes with a carbonization
temperature equal to the activation temperature can play a significant role in promoting higher
volumes of micropores relative to the mesopores and hence promote a higher surface area for electric-
double layer formation in the electrodes, which is needed for enhancing the Csp. This dependency on
the carbonization temperature can also be highlighted by comparing the SMicro/SMeso ratios of ACMs;
the SMeso/SMicro ratios for ACM8, ACM7 and ACM6 are 0.1358, 0.1468 and 0.1481, respectively. It
should be noted that there have been many studies that consider the Csp in terms of this ratio variation;

Int. J. Electrochem. Sci., Vol. 8, 2013
264
a recent report on bamboo-based activated carbon electrodes observed that the ratios of SMeso/SMicro can
vary from 0.09 to 0.45, corresponding to Csp values from 55 to 67 F g-1
at the current density of 1 mA
cm-2
[20].
100
120
140
160
180
200
0 0.2 0.4 0.6 0.8 1
Ads.
/Des.
Vo
lum
e /
cm
3 g
-1 S
TP
Relative Pressure (P/Po)
ACM6ACM7ACM8
Figure 3. The adsorption-desorption capacity versus relative pressure for the ACMs.
Table 3. Porosity data for the ACMs.
Samples ACM6 ACM7 ACM8
SBET (m2g
-1) 434 415 485
SMeso (m2g
-1) 56 53 58
SMicro (m2g
-1) 378 361 427
VMeso (cm3g
-1) 0.0501 0.0492 0.0538
VMicro (cm3g
-1) 0.1988 0.1898 0.2241
Dp (nm) 2.2912 2.3019 2.2903
3.2 Electrochemical properties
3.2.1 Electrochemical impedance spectroscopy
The EIS data expressed as Nyquist plots over the frequency range of 10-1
to 106
Hz for the
ACM based supercapacitor cells are given in Figure 4. This figure, particularly the inset, clearly shows
the effects of changing the carbonization temperature on the small semicircle (first segment), Waburg
diffusion line (second segment) and capacitive line (third segment). A relatively small semicircle in the
high frequency region represents the dominant resistive nature of the supercapacitor system consisting

Int. J. Electrochem. Sci., Vol. 8, 2013
265
of electrode/electrolyte/current-collector. The beginning of the semicircle line (left-intercept of Z’’ at
the Z’ axis) represents the resistance (Rs) of the electrolyte in contact with the current collector and
electrode. The termination of the semicircle line (right-intercept of Z’’ at the Z’ axis) represents the
internal resistance (Rp) of the electrode. The diameter of the semicircle (Rp-Rs) is equal to the ESR
value. The values of Rs, Rp and ESR for all the cells determined from the data in Figure 4 are listed in
Table 4. These results do not show any specific trend with respect to changing the carbonization
temperature, but the magnitude of the ESR values are typical for carbon based supercapacitors. For
example, Kim et al. (2006) have reported the ESR values of 0.134 to 1.149 Ω for the bamboo based
activated carbon electrodes [20].
The second segment (straight line with a slope of approximately 45°) in the middle frequency
region represents the combination of resistive and capacitive behaviors of the ions penetrating into the
electrode pores. The length, slope and position of this segment appear to be affected by changes in the
carbonization temperature. A steep slope corresponding to electrodes that efficiently allow ions to
penetrate pores has been observed in another study on carbon electrodes from porous carbon powder
[31].
The third segment (straight lines sharply increasing at the low-frequency region) represents the
dominance of capacitive behavior from the formation of ionic and electronic charges of the electric
double layer system at the micropore surfaces; at this frequency, the ions can more easily diffuse into
the micropores [31-34]. The initiation point of this third segment line corresponds to the knee
frequency (fk), and its corresponding resistance (Rk) is given by Z’k. The values of fk and Rk are given
in Table 4. These results seem to show that carbonization at 800°C may change the capacitive region to
begin at a relatively higher frequency value with a lower resistance. The length of this straight line is
shorter for the ACM8 cell compared to the other two cells; furthermore, the line for the ACM8 cell
leans more towards the vertical Z” axis, indicating that the ACM8 cell has a better capacitive
performance. The values of the Csp calculated from the EIS data using equation (1) are shown in Table
5 and reveal that this ACM8 cell has the highest Csp.
Figure 4. Nyquist plots for the ACM cells.

Int. J. Electrochem. Sci., Vol. 8, 2013
266
Table 4. The values of Rs, Rp, ESR, fk and Rk for the ACM cells.
Figures 5 (a) and (b) show the specific, imaginary (C”) and real (C’) capacitance portions of
the ACM cells calculated using equations (1), (3) and (4) as a function of frequency. In Figure 5 (a),
the Csp strongly depends on the frequency below 1 Hz, particularly for the ACM8 cell, which shows a
higher Csp throughout the entire frequency region. A similar frequency dependency is also exhibited by
the C’ and C” curves in Figure 5 (b). For the C” curve, there is a peak frequency value (fp). This
frequency value is associated with the relaxation time constant, τo, which defines the boundary
between the regions of capacitive and resistive behaviors for the supercapacitor. It is well known that
higher power delivery corresponds to lower τo values.
Figure 5. (a) Specific capacitance versus frequency, (b) Evolution of imaginary and real portions of
capacitance for the ACM cells.
Based on the fp values in Figure 5 (b), the value of τo was estimated using the equation τo = 1/fp,
the results of which are 25.12 and 50.13 s for the ACM7 and ACM8 cells, respectively. The τo value
for the ACM6 cell cannot be calculated because the peak lies below the detection limit of the
instrument. These calculated τo values are within the same order of magnitude as that reported by
Garcia-Gomes et al. (2010); 3.8 to 62 s for the CM electrodes based on another type of precursor [35].
Cells Rs
(Ohm)
Rp
(Ohm)
ESR
(Ohm)
fk
(Hz)
Rk
(Ohm)
ACM6 0.877 1.084 0.207 5 1.522
ACM7 0.749 1.064 0.315 10 1.344
ACM8 0.860 1.063 0.203 40 1.138
(a) (b)
Int. J. Electrochem. Sci., Vol. 8, 2013
267
Other investigations showed values of τo in the range of 3 to 68 s for carbon electrodes prepared from
micro/mesoporous carbon C(Mo2C) [36].
3.2.2 Cyclic voltammetry
The supercapacitive properties of the ACM6, ACM7 and ACM8 cells were determined using
cyclic voltammetry because this method provides valuable information on the charge-discharge
behavior of the cells. The measurements were performed at room temperature within the potential
range of 0 to 1 V and over a scan rate of 1 to 100 mVs−1
. Fig 6 (a) shows the measured cyclic
voltammograms recorded at 1 mVs−1
for the ACM6, ACM7 and ACM8 cells. The shape of the
voltammograms for all the cells is rectangular, representing a typical voltammogram for electric
double-layer capacitance [37]. Comparing the voltammograms of the ACM6, ACM7 and ACM8 cells
in Figure 6 (a), it can be observed that the ACM8 cell has a broader voltammogram area. These results
indicate that the ACM8 cell has a better cycle reversibility and higher electric double-layer capacitance
stability during the charge and discharge processes compared with the other cells. Ultimately, these
effects correspond to a higher Csp for the ACM8 cell. The Csp of the ACM6, ACM7, and ACM8
electrodes were calculated using the equation (5) from the voltammograms (Figure 6) recorded with a
scan rate of 1 mVs−1
. These results are shown in Table 5 and are in good agreement with the obtained
EIS results.
It is also observed that the voltammograms (scan rate of 1 mVs−1
) in Figure 6 (a) do not have
any peaks, which indicates that the supercapacitive behavior is free from redox reactions or is purely
based on the electrostatic mechanism. It was also found that this behavior was exhibited by all of the
cells when the scan rate was varied up to 100 mVs−1
. To observe such a supercapacitive behavior over
a range of scan rate, Figure 6 (b) shows the voltammograms for the ACM8 cell at five different scan
rates (1, 5, 25, 50, and 100 mVs−1
). Figure 6 (b) demonstrates that the current response increased with
the scan rate. Furthermore, as the scan rate increased above 5 mVs−1
, the voltammograms ‘window’
tended to tilt toward the vertical axis, thereby becoming a quasi-rectangle. This result indicates the
dominance of the double layer formation in the energy storage process at lower scan rates.
Figure 6 (c) shows the Csp values determined using equation (5) and the voltammograms
obtained at different scan rates for all the ACM cells. All cells show a common trend of decreasing Csp
values against an increasing scan rate. It is well known that for very low scan rates, the Csp values are
higher because the ions have a much longer time to penetrate and reside in all the available electrode
pores and form electric double layers, which are needed to generate higher capacitance. Despite this
common trend, the ACM8 cell displays higher Csp values throughout the whole scan region, clearly
indicating its superiority over the other two cells. This result is in agreement with the EIS results
discussed in the preceding section. In the scan rate region above 5 mVs−1
, the Csp for the ACM8
seemed to decrease faster than that for the ACM6 and ACM7 cells as the scan rate increased; these
results are evidence of the increasing diffusion resistance towards the ionic motion into the electrode
pores, which is not linear with respect to the change in the carbonization temperature during electrode
preparation. This non-linear effect has also been observed in investigations assessing the dependence
of electrode Csp on the quantity of binder used during electrode preparation [38].

Int. J. Electrochem. Sci., Vol. 8, 2013
268
Figure 6. (a) CV curves at the scan rate 1 mVs-1
for the ACM cells, (b) CV curves with various scan
rates for the ACM8 cell, and (c) Specific capacitance versus scan rate for the ACM cells.
3.2.3 Galvanostatic charge-discharge
The GCD curves for all the ACM cells recorded in the potential range of 0 – 1 V and at a
current density of 10 mA cm-2
are shown in Figure 7. As seen in this figure, all the cells show a similar
symmetrical triangular curve with a nearly linear variation of voltage as a function of time during
charge and discharge. This type of curve is typical for carbon-based supercapacitors, and the data
shows that all the three cells have a good supercapacitive performance. However, despite having a

Int. J. Electrochem. Sci., Vol. 8, 2013
269
similar shape, the curves for the ACM7 and ACM8 cells, particularly the latter, show significantly
higher charge and discharge times, as shown in Figure 7; these observations indicate that a higher
number of electrons and electrolyte ions are participating in the charge and discharge processes of
these electrodes compared to the ACM6 electrode. This is further evidence supporting the results
obtained by the EIS and CV methods that determined carbonization temperatures closer or equal to the
activation temperature can produce better electrodes for supercapacitor application. Put more directly,
the carbonization temperature of 600°C is too low to be compatible with the 800°C activation
temperature used during electrode preparation.
Figure 7. GCD curves for the ACM cells.
As revealed in Figure 7, a sharp drop in the initial voltage upon discharge is evident and results
from diffusion-limited mobility of the electrolyte ions in the electrode pores. This limitation is
associated with the equivalent series resistance (ESR) of the supercapacitor cells. The ESR value is
calculated from this voltage drop using the equation ESR = iRdrop/2i. The ESR values for the ACM6,
ACM7 and ACM8 cells are 2.615, 4.852 and 2.437 Ohm, respectively, clearly indicating that the
ACM8 cell offers the lowest ESR value. These ESR values are comparable with the results of other
researchers who observed ESR values ranging from 1.17 to 3.69 Ohm for carbon electrode mixtures
composed of activated carbon, graphite and polytetrafluoroethylene (PTFE) [39] and from 9.7 to 16.7
Ohm for carbon electrodes derived from activated carbon powder [40]. These literature ESR values
derived from the GCD data are higher than those derived from the EIS data. This trend is also observed
in the ESR results reported here.
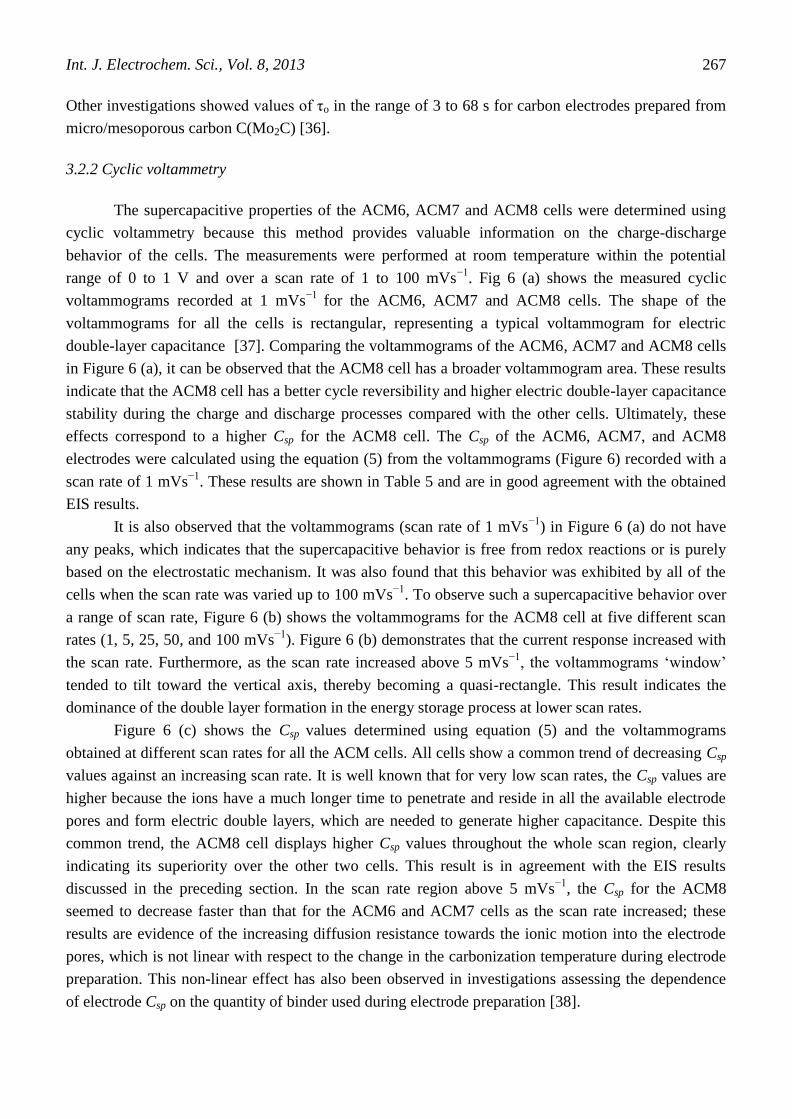
The Csp values of the supercapacitor cells based on ACM electrodes were calculated from the
data in Figure 7 using equation (6) and are shown in Table 5. As expected, these values follow the
trend of Csp values calculated from the EIS and CV data, i.e., showing a good trend of overall change
Int. J. Electrochem. Sci., Vol. 8, 2013
270
in magnitude with respect to the change in carbonization temperature. For comparison, some of the Csp
values reported in the literature for other types of carbon electrodes used in supercapacitors are also
included in Table 5.
Table 5. Specific capacitance (Csp) for the ACMs cells (x = EIS, y = GCD, z = CV).
Cells xCsp
(Fg-1
)
yCsp
(Fg-1
)
zCsp
(Fg-1
)
ACM6 28 55 27
ACM7 44 77 78
ACM8 61 85 80
Ref. [2] - 235-319 226-339
Ref. [8] 38-90 2-176 -
Ref. [9] - - 244-311
Ref. [28] - 135-329 228-358
Ref. [29] - 230-300 -
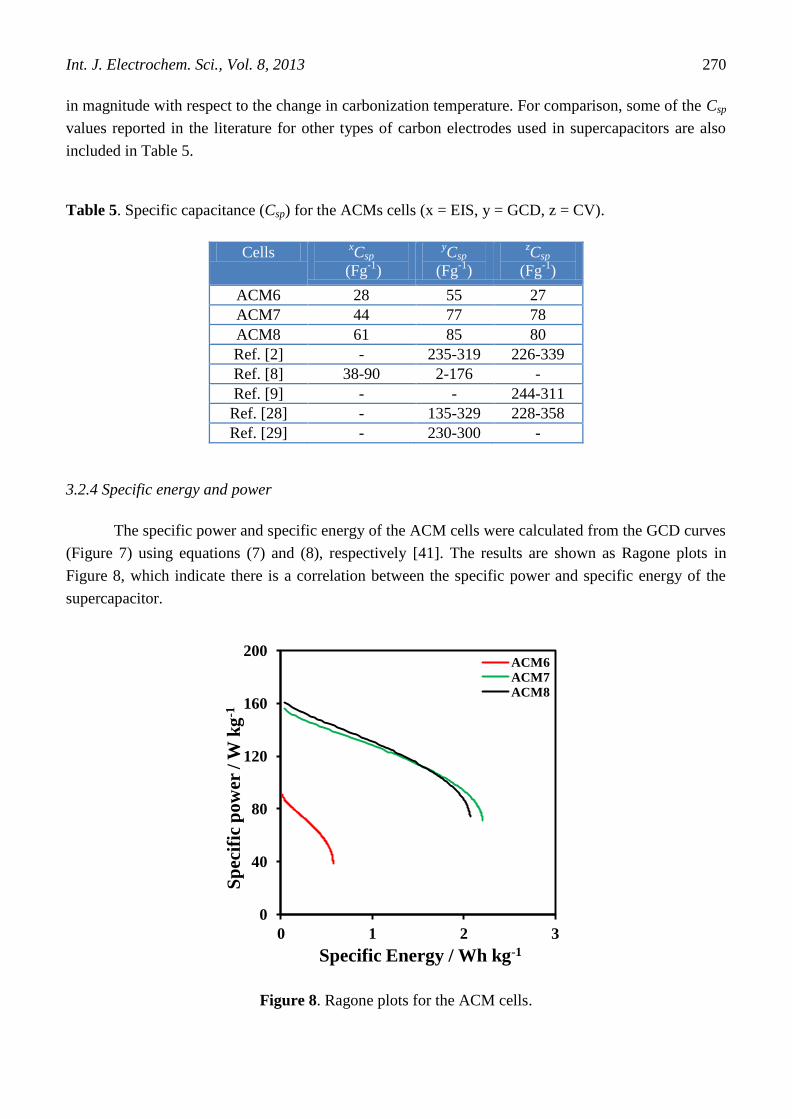
3.2.4 Specific energy and power
The specific power and specific energy of the ACM cells were calculated from the GCD curves
(Figure 7) using equations (7) and (8), respectively [41]. The results are shown as Ragone plots in
Figure 8, which indicate there is a correlation between the specific power and specific energy of the
supercapacitor.
0
40
80
120
160
200
0 1 2 3
Sp
ecif
ic p
ow
er /
W k
g-1
Specific Energy / Wh kg-1
ACM6
ACM7
ACM8
Figure 8. Ragone plots for the ACM cells.

Int. J. Electrochem. Sci., Vol. 8, 2013
271
The specific power linearly decreases with increasing specific energy for all the cells, which
means that less energy is released at higher power output. However, as shown in Figure 8, the power-
energy relationship for the ACM7 and ACM8 cells seem to be much better than that of the ACM6 cell;
again demonstrating that the carbonization temperature closer or equal to the activation temperature
may help producing better performance of the ACM electrodes for supercapacitor application (also
shown by the EIS and CV data in the preceding sections). The maximum specific energy and specific
power determined were 2.2 Wh kg-1
and 156 W kg-1
, respectively, for the ACM7 cells and 2.1 Wh kg-1
and 161 W kg-1
, respectively, for the ACM8 cells. These results are comparable to the typical ranges of
specific energy and specific power values for supercapacitor electrodes derived from other types of
biomass precursors, i.e., cherry stones fell within the range of 3.5 to 5 Wh kg-1
and 700 to 1900 W kg-
1, respectively [29]. A similar range of specific energy and specific power values was observed
between 2.6 to 3.3 Wh kg-1
and 580 to 620 W kg-1
, respectively, for carbon electrodes prepared from
rubberwood sawdust precursor [29] and between 0.5 to 3.5 Wh kg-1
and 150 to 160 W kg-1
,
respectively, for carbon electrodes from oil palm empty fruit bunch fibers precursor [11].
4. CONCLUSION
GMs consisting of SACG EFB fibers (95% by weight), CNTs (5%) and KOH (5%) were
heated to 600, 700 and 800°C carbonization temperatures (CTs), respectively, to produce CM6, CM7
and CM8. These CMs were activated by CO2 at 800°C to produce ACM6, ACM7 and ACM8, which
were used as electrodes in supercapacitor cells. We observed that the changes in the density, electrical
conductivity, porosity, microstructure and structure of the ACMs due to the change in the CT notably
affected the electrochemical behaviors of the supercapacitor cells. Characterization by EIS, CV and
GCD methods consistently found that the cells using the ACMs from the CMs (CT = 700, 800°C)
exhibit better specific capacitance, specific energy and specific power than that from the CM (CT =
600°C). These results lead to the conclusive recommendation that the CT value should be closer or
equal to the activation temperature for the production of higher quality ACM electrodes from CMs.
ACKNOWLEDGMENTS
We acknowledge grants from the Universiti Kebangsaan Malaysia (UKM-GUP-216-2011, UKM-
DLP-2012-022, and UKM-DLP-2012-023), and the support of CRIM (Centre for Research and
Innovation Management). The authors also thank Mr. Saini Sain for helping with the laboratory work.
References
1. Y. Liu, Z. Hu, K. Xu, X. Zheng and Q. Gao, Acta Phys. Chim. Sin., 24(7) (2008) 1143.
2. B. Xu, Y. Chen, G. Wei, G. Cao, H. Zhang and Y. Yang, Mater. Chem. Phys., 124 (2010) 504.
3. P.L. Taberna, G.C. Chevallier, P. Simon, D. Plee and T. Aubert, Mater. Res. Bull., 41 (2006) 478.

Int. J. Electrochem. Sci., Vol. 8, 2013
272
4. Q.Y. Li, Z.S. Li, L. Lin, X.Y. Wang, Y.F. Wang, C.H. Zhang and H.Q. Wang, Chem. Eng. J., 156
(2010) 500.
5. J.M. Ko and K.M. Kim, Mater. Chem. Phys., 114 (2009) 837.
6. L. Chunlan, X. Shaoping, G. Yixiong, L. Shuqin and L. Changhou, Carbon, 43 (2005) 2295.
7. C. Grini, Bioresour. Technol., 97 (2006) 1061.
8. J.M. Valente Nabais, J.G. Teixeira and I. Almeida, Bioresour. Technol., 102 (2011) 2781.
9. X. Li, W. Xing, S. Zhuo, J. Zhou, F. Li, SZ. Qiao and G.Q. Lu, Bioresour. Technol., 102 (2011)
1118.
10. Awitdrus, M. Deraman, I.A. Talib, R. Farma, R. Omar, M.M. Ishak, N.H. Basri and B.N.M. Dolah,
Adv. Mater. Res., 501 (2012) 13.
11. R. Farma, M. Deraman, R. Omar, Awitdrus, M.M. Ishak, E. Taer and I.A. Talib, AIP Proceeding,
1415 (2011) 180.
12. M. Deraman, M.M. Ishak, R. Farma, Awitdrus, E. Taer, I.A. Talib and R. Omar, AIP Proceeding,
1415 (2011) 175.
13. M. Deraman, R. Omar, S. Zakaria, I.R. Mustapa, M. Talib, N. Alias and R. Jaafar, J. Mater. Sci.,
37 (2002) 3329.
14. C. Portet, O.L. Taberna, P. Simon, E. Flahaut and C. Laberty Robert, Electrochim. Acta, 50 (2005)
4174.
15. M. Beidaghi, W. Chen and C. Wang, J. Power Sources, 196 (2011) 2403.
16. K.C. Tsay, L. Zhang and J. Zhang, Electrochim. Acta, 60 (2012) 428.
17. A.B. Fuertes, G. Lota, T.A. Centeno and E. Frackowiak, Electrochim. Acta, 50 (2005) 2799.
18. S.R.S. Prabaharan, R.Vimala and Z. Zainal, J. Power Sources, 161 (2006) 730.
19. M. Deraman, S. Zakaria, R. Omar and A.A. Aziz, Jpn. J. Appl. Phys., 39 (2000) L1236.
20. Y.J. Kim, B-J Lee, H. Suezaki, T. Chino, Y. Abe, T. Yanagiura, K.C. Park, M. Endo, Carbon, 44
(2006) 1592.
21. E. Taer. M. Deraman, I.A. Talib, A.A. Umar, M. Oyama and R.M. Yunus, Curr. Appl Phys., 10
(2013)1071.
22. M. Deraman, J. Phys D: Appl. Phys., 27 (1994) 1060.
23. Awitdrus, M. Deraman, I.A. Talib, R. Omar, M.H. Jumali, E. Taer and M.M. Saman, Sains
Malaysiana, 39 (2010) 83.
24. A.R. Coutinho, J.D. Rocha and C.A. Luengo, Fuel Process. Technol., 67 (2000) 93.
25. M. Deraman, S.K.M. Saat, M.M. Ishak, Awitdrus, E. Taer, I.A. Talib, R. Omar and M.H. Jumali,
AIP Proceeding, 1284 (2010) 179.
26. D. Qu, J. Power Sources, 109 (2002) 403.
27. Ch. Emmenegger, Ph. Mauron, P. Sudan, P. Wenger, V. Herman, R. Gallay and A. Zuttel, J.
Power Sources, 124 (2003) 321.
28. M. Khalfaoui, S. Knani, M.A. Hachicha and A. Ben Lamine, J. Colloid Interface Sci., 263 (2003)
350.
29. E. Taer, M. Deraman, I.A. Talib, S.A. Hashmi and A.A. Umar, Electrochim. Acta, 56 (2011)
10217.
30. F-C. Wu, R-L. Tseng, C-C. Hu, C-C. Wang, J. Power Sources, 159 (2006) 1532.
31. W.C. Chen, T.C. Wen and H. Teng, Electrochim. Acta, 48 (2003) 641.
32. F. Rafik, H. Guolous, R. Gallay, A. Crausaz and A. Berthon, J. Power Source, 165 (2007) 928.
33. Y.R. Nian and H. Teng, J. Electroanal. Chem., 540 (2003) 119.
34. J. Gamby, P.L. Taberna, P. Simon, J.F. Fauvarque and M. Chesneau, J. Power Sources, 101 (2001)
109.
35. A. Garcia-Gomez, P. Miles, T.A. Centeno and J.M. Rojo, Electrochim. Acta, 55 (2010) 8539.
36. T. Thomberg, A. Janes and E. Lust, Electrochim. Acta, 55 (2010) 3138.
37. A.I. Inamdar, Y.S. Kim, S.M. Pawar, J.H. Kim, H. Im, H. Kim, J. Power Sources, 196 (2011)
2393.

Int. J. Electrochem. Sci., Vol. 8, 2013
273
38. J. Yan, T. Wei, B. Shao, Z. Fan, W. Qian, M. Zhang, F. Wei, Carbon, 48 (2010) 487.
39. H. Yu, J. Wu, L. Fan, K. Xu, X. Zhong, Y. Lin and J. Lin, Electrochim. Acta, 56 (2011) 6881.
40. K.M. Kim, J.W. Hur, S. I. Jung and A.S. Kang, Electrochim. Acta, 50 (2004) 863.
41. M. Olivares-Marin, J.A. Fernandez, M.J. Lazaro, C. Fernandez-Gonzalez, A. Macias-Garcia, V.
Gomez-Serrano, F. Stoeckli and T.A. Centeno, Mater. Chem. Phys., 114 (2009) 323.
© 2013 by ESG (www.electrochemsci.org)