Embed Size (px)
Citation preview
OCS Study BOEM 2016-062
Physical and Chemical Analyses of
Crude and Refined Oils: Laboratory and
Mesoscale Oil Weathering
Final Report
US Department of the Interior Bureau of Ocean Energy Management Alaska OCS Region

Physical and Chemical Analyses of Crude and
Refined Oils: Laboratory and Mesoscale Oil
Weathering
Final Report
Author Kristin. R. Sørheim Prepared under BOEM Award M14PC00012 by SEA Consulting Group 325 Mason Ave. Cape Charles, VA 23310
AND
SINTEF Materials and Chemistry
Postboks 4760 Sluppen
7465 Trondheim, NORWAY
i
DISCLAIMER Study concept, oversight, and funding were provided by the US Department of the Interior, Bureau of Ocean
Energy Management (BOEM) Bureau of Ocean Energy Management, Environmental Studies Program,
Washington, DC, under Contract Number M14PC00012. This report has been technically reviewed by
BOEM and it has been approved for publication. The views and conclusions contained in this document are
those of the authors and should not be interpreted as representing the opinions or policies of the US
Government, nor does mention of trade names or commercial products constitute endorsement or
recommendation for use.
REPORT AVAILABILITY To download a PDF file of this BOEM Alaska OCS Region report, go to the US Department of the
Interior, Bureau of Ocean Energy Management, Environmental Studies Program Information System
website and search on OCS Study BOEM 2016-062.
This report can be viewed at select Federal Depository Libraries. It can also be obtained from the National
Technical Information Service; the contact information is below.
http://www.ntis.gov/products/publications.aspx OR US Department of Commerce National Technical Information Service
5301 Shawnee Road
Alexandria, VA 22312
Phone: (703) 605-6040 Fax: (703) 605-6900
CITATION Sorheim, K.R. 2016. Physical and Chemical Analyses of Crude and Refined Oils: Laboratory and
Mesoscale Oil Weathering. OCS Study BOEM 2016-062. Prepared by SINTEF Materials and Chemistry
and SEA Consulting Group for USDOI, Bureau of Ocean Energy Management, Alaska OCS Region,
Anchorage, AK. 106 pp.
CONTRIBUTING AUTHORS
Per Daling – SINTEF Materials and Chemistry
Jon Olav Bjørgum – SINTEF Materials and Chemistry
CJ Beegle-Krause – SINTEF Materials and Chemistry
Ann Hayward Walker – SEA Consulting Group
Melinda McPeek – SEA Consulting Group
ABOUT THE COVER
Cover photo courtesy of SINTEF Materials and Chemistry.
ii
EXECUTIVE SUMMARY
Spilled oils undergo changes when weathering on the sea surface that affect behavior and oil spill
countermeasures in various ways. Oil weathering varies over time and with different
environmental conditions. The objectives of this study were to:
(1) To obtain weathering characteristics of crude oils representative of the Alaska OCS (Outer
Continental Shelf) and typical refined products transported in offshore waters;
(2) To expand libraries of oil compositions of existing weathering models such as the SINTEF
Oil Weathering Model (OWM) and the Automated Data Inquiry for Oil Spills (ADIOS) model
from the National Oceanic and Atmospheric Administration (NOAA).
This report covers the physical and chemical analyses of six oils including:
Three crude oils from Alaska North Slope: Alpine, Kuparuk and Northstar, and
Three refined products of ADO (Automotive Diesel Oil, also called Ultra-Low-Sulphur
Diesel (ULSD)) and MGO (Marine Gas Oil) from the Esso Slagen Refinery Norway, and
a WRG (Wide Range Gasoil) from Mongstad Refinery Norway.
The six oils from this study were analyzed for their weathering properties in a standardized bench-
scale methodology. In addition, the weathering was studied in the meso-scale flume basin as a
supplement to the bench-scale testing for all oils. Dispersant effectiveness testing was beyond this
study’s scope, however, SINTEF added Corexit 9500 to the emulsified oils at the end of the testing
to obtain a visual assessment of potential dispersibility in their weathered state. The resulting
laboratory data from this study will be input into oil weathering models, i.e., the OWM and
ADIOS, to predict the weathering properties of oils at sea. Including the data in these models will
enable evaluation of the experimental data generated both by the bench-scale and meso-scale
experiments to consider the most robust oil weathering predictions.
Properties of crude oils from Alaska North Slope:
Alpine is a paraffinic crude oil with a density of 0.832 g/mL (corresponds to API° 38.4). The fresh
unweathered oil has a very low pour point (<-36 °C), but increases rapidly with the evaporative
loss. The oil has a medium to low wax content of 2.1 wt. %, and has asphaltene content of 0.46
wt. %. The laboratory study showed that the oil forms stable water-in-oil (w/o) emulsions when
weathered. However, the emulsion effectively released water when adding the emulsion breaker
(Alcopol O 60 %) with a concentration of 2000 ppm. Emulsion breaker may be used during an oil
spill operation to remove or reduce water from the emulsion, normally applied after recovery, prior
to transfer to storage tank to minimize the storage volume. After three days weathering in the flume
basin (meso-scale experiments) Corexit 9500 (in-situ application) was added to the emulsion to
finalize the testing. The oil/emulsion showed a significant potential for dispersant use as a response
option. However, effectiveness testing and determining the specific time-window, or window of
opportunity, for dispersant use was not part of this project.
Kuparuk is categorized as a high-density 0.917 g/mL (API° 22.7) asphaltenic (4.7 wt. %) crude oil
with a relatively low wax content of 1.3 wt. %. Kuparuk has a low pour point and solidification on
the sea surface is not anticipated since solidification typically arises with pour points 10-15 °C
above the sea temperature. The crude oil formed stable w/o-emulsions particularly for the 200 and
250°C+ residues with high viscosities. In general, the emulsions require a high dosage of emulsion
breaker (Alcopol O 60 % at 2000 ppm) in cases where emulsion breaker might be added as part of
a mechanical recovery operation to settle out water and decrease the storage volume needed. After
iii
three days of weathering in the meso-scale flume basin Corexit 9500 (in-situ application) with a
cumulative dosage Dispersant-to-Oil (DOR) ratio of 1:50 was added to the oil/emulsion. The
findings indicate that a higher dosage (DOR > 1:50) is recommended to be applied to a slick in an
oil spill situation for higher effect, since the efficiency of adding dispersant (DOR 1:50) was not
optimal. However, the window of opportunity for use of dispersant as a function of effectiveness
and viscosities, and dosage testing for optimal DOR, was not determined in this study.
Northstar is a very light paraffinic crude oil with a density of 0.779 g/ml (API° 50), and exhibits
low content of wax (1.7 wt. %) and asphaltenes (0.03 wt. %). The oil is a low-emulsifying crude
oil that forms loose emulsions and easily released water with the addition of a concentration of
500 ppm of the emulsion breaker (Alcopol O 60 %). The oil showed high potential for application
of dispersant agent (Corexit 9500) based on the results from the meso-scale flume basin. However,
no laboratory study was conducted to assess the window of opportunity for using chemical
dispersant on this oil.
Properties of refined products:
The ADO (Automotive Diesel Oil) has a density of 0.830 g/mL (corresponds to API° 38.8). The
ADO oil has a very low content of wax and asphaltenes; less than 0.05 wt. %. The diesel oil has a
very low pour point (<-36 °C) and remained low with evaporative loss. The weathered oil residue
did not emulsify during the bench-scale emulsifying testing and showed no water uptake. Based
on visual inspection during the meso-scale flume experiment a great majority of the oil was
naturally dispersed into the water column, and only a minor amount of the oil was observed on the
surface after three days of weathering (~ 3 % of the total released oil into the flume). The remaining
oil on the surface became darker with a "slimy" characteristic. The dispersant Corexit 9500 (in-
situ application) was added and visually showed that the dispersant was effective.
The MGO (Marine Gasoil) has a density of 0.849 g/mL (corresponds to API° 35). The MGO oil
has a higher wax content (1.96 wt. %) compared with the ADO. The asphaltene content of the
diesel oil is less than 0.05 wt. %. The MGO has a low pour point similar to the ADO. The oil did
not emulsify (no significant water uptake) in the bench-scale laboratory testing. During the meso-
scale testing, most of the oil was easily naturally dispersed and diluted into the water column
during the two days of weathering, and no dispersant agent was therefore applied onto the surface
in the flume due to insignificant amount of available surface oil.
The WRG (Wide Range Gasoil) has a density of 0.892 g/mL (corresponds to API° 27) with a
medium content of wax (4.8 wt. %) and with low content of asphaltenes (0.05 wt. %). The WRG
oil has a low pour point (<-24 °C). Due to lack of lighter compounds, less than 250 °C, the fresh
oil was assumed to have similar weathering properties as for the 250°C+ residue. The oil showed
emulsifying properties during the bench-scale testing, but the emulsions were very unstable and
easily broke up after standing less than an hour. Based on the meso-scale flume experiment a larger
amount of the oil was naturally dispersed into the water column, and only a minor amount of the
oil was observed on the surface after two days weathering. However, the dispersant agent Corexit
9500 (in-situ application) was added on the surface slick and visually showed high efficiency.
iv
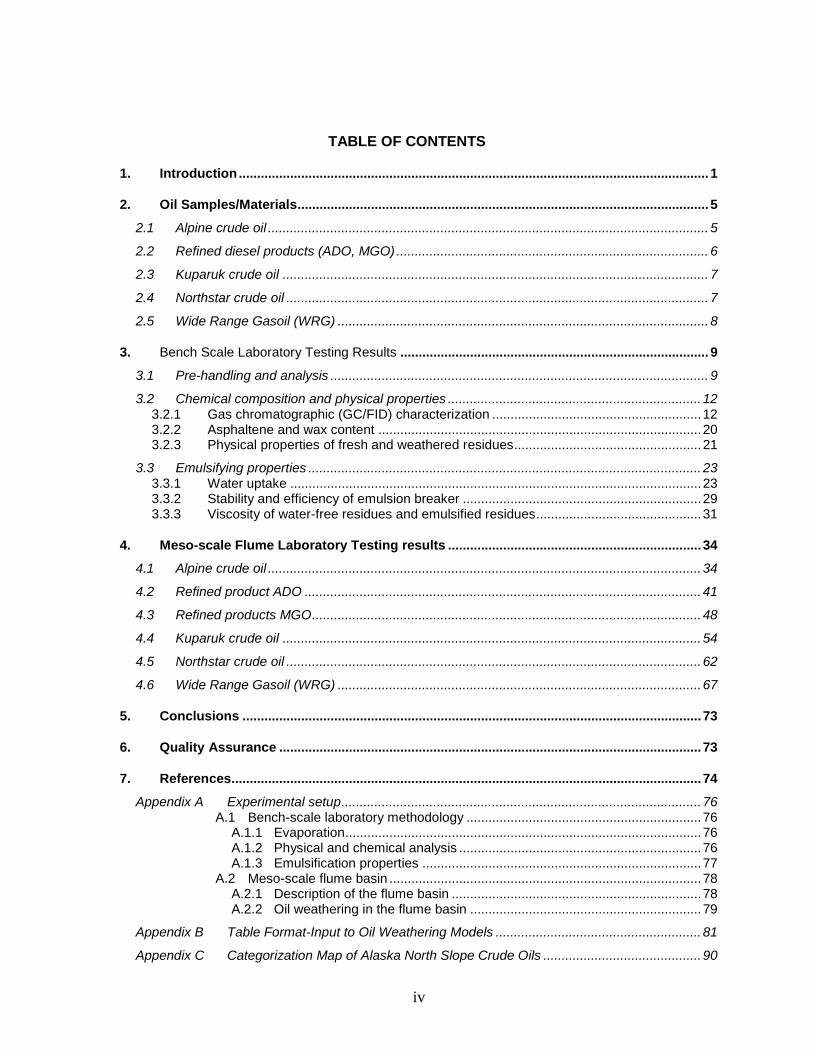
TABLE OF CONTENTS
1. Introduction ................................................................................................................................ 1
2. Oil Samples/Materials ................................................................................................................ 5
2.1 Alpine crude oil ........................................................................................................................ 5
2.2 Refined diesel products (ADO, MGO) ..................................................................................... 6
2.3 Kuparuk crude oil .................................................................................................................... 7
2.4 Northstar crude oil ................................................................................................................... 7
2.5 Wide Range Gasoil (WRG) ..................................................................................................... 8
3. Bench Scale Laboratory Testing Results .................................................................................... 9
3.1 Pre-handling and analysis ....................................................................................................... 9
3.2 Chemical composition and physical properties ..................................................................... 12 3.2.1 Gas chromatographic (GC/FID) characterization ......................................................... 12 3.2.2 Asphaltene and wax content ........................................................................................ 20 3.2.3 Physical properties of fresh and weathered residues ................................................... 21
3.3 Emulsifying properties ........................................................................................................... 23 3.3.1 Water uptake ................................................................................................................ 23 3.3.2 Stability and efficiency of emulsion breaker ................................................................. 29 3.3.3 Viscosity of water-free residues and emulsified residues ............................................. 31
4. Meso-scale Flume Laboratory Testing results ..................................................................... 34
4.1 Alpine crude oil ...................................................................................................................... 34
4.2 Refined product ADO ............................................................................................................ 41
4.3 Refined products MGO .......................................................................................................... 48
4.4 Kuparuk crude oil .................................................................................................................. 54
4.5 Northstar crude oil ................................................................................................................. 62
4.6 Wide Range Gasoil (WRG) ................................................................................................... 67
5. Conclusions ............................................................................................................................. 73
6. Quality Assurance ................................................................................................................... 73
7. References................................................................................................................................ 74
Appendix A Experimental setup .................................................................................................. 76 A.1 Bench-scale laboratory methodology ................................................................ 76
A.1.1 Evaporation ................................................................................................. 76 A.1.2 Physical and chemical analysis .................................................................. 76 A.1.3 Emulsification properties ............................................................................ 77
A.2 Meso-scale flume basin ..................................................................................... 78 A.2.1 Description of the flume basin .................................................................... 78 A.2.2 Oil weathering in the flume basin ............................................................... 79
Appendix B Table Format-Input to Oil Weathering Models ........................................................ 81
Appendix C Categorization Map of Alaska North Slope Crude Oils ........................................... 90

v
vi
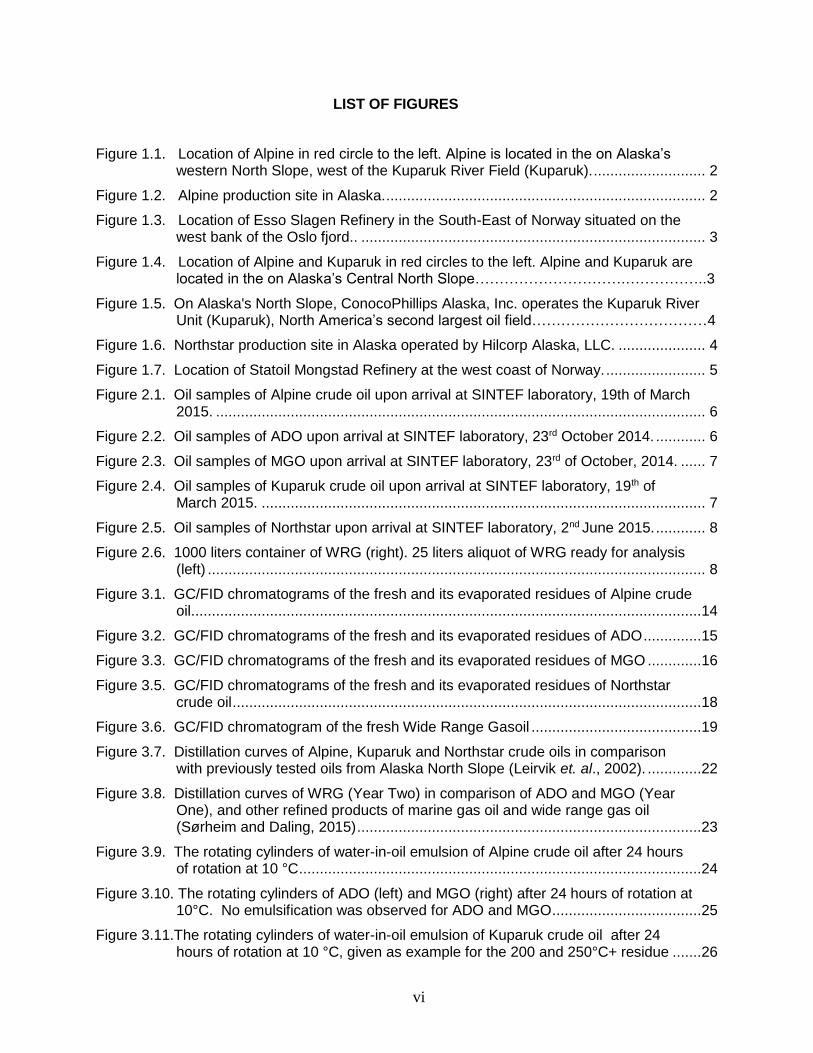
LIST OF FIGURES
Figure 1.1. Location of Alpine in red circle to the left. Alpine is located in the on Alaska’s western North Slope, west of the Kuparuk River Field (Kuparuk). ........................... 2
Figure 1.2. Alpine production site in Alaska. ............................................................................. 2
Figure 1.3. Location of Esso Slagen Refinery in the South-East of Norway situated on the west bank of the Oslo fjord.. ................................................................................... 3
Figure 1.4. Location of Alpine and Kuparuk in red circles to the left. Alpine and Kuparuk are located in the on Alaska’s Central North Slope………………………….……………..3
Figure 1.5. On Alaska's North Slope, ConocoPhillips Alaska, Inc. operates the Kuparuk River Unit (Kuparuk), North America’s second largest oil field………………………………4
Figure 1.6. Northstar production site in Alaska operated by Hilcorp Alaska, LLC. ..................... 4
Figure 1.7. Location of Statoil Mongstad Refinery at the west coast of Norway. ........................ 5
Figure 2.1. Oil samples of Alpine crude oil upon arrival at SINTEF laboratory, 19th of March 2015. ...................................................................................................................... 6
Figure 2.2. Oil samples of ADO upon arrival at SINTEF laboratory, 23rd October 2014. ............ 6
Figure 2.3. Oil samples of MGO upon arrival at SINTEF laboratory, 23rd of October, 2014. ...... 7
Figure 2.4. Oil samples of Kuparuk crude oil upon arrival at SINTEF laboratory, 19th of March 2015. ........................................................................................................... 7
Figure 2.5. Oil samples of Northstar upon arrival at SINTEF laboratory, 2nd June 2015. ............ 8
Figure 2.6. 1000 liters container of WRG (right). 25 liters aliquot of WRG ready for analysis (left) ........................................................................................................................ 8
Figure 3.1. GC/FID chromatograms of the fresh and its evaporated residues of Alpine crude oil...........................................................................................................................14
Figure 3.2. GC/FID chromatograms of the fresh and its evaporated residues of ADO ..............15
Figure 3.3. GC/FID chromatograms of the fresh and its evaporated residues of MGO .............16
Figure 3.5. GC/FID chromatograms of the fresh and its evaporated residues of Northstar crude oil .................................................................................................................18
Figure 3.6. GC/FID chromatogram of the fresh Wide Range Gasoil .........................................19
Figure 3.7. Distillation curves of Alpine, Kuparuk and Northstar crude oils in comparison with previously tested oils from Alaska North Slope (Leirvik et. al., 2002). .............22
Figure 3.8. Distillation curves of WRG (Year Two) in comparison of ADO and MGO (Year One), and other refined products of marine gas oil and wide range gas oil (Sørheim and Daling, 2015) ...................................................................................23
Figure 3.9. The rotating cylinders of water-in-oil emulsion of Alpine crude oil after 24 hours of rotation at 10 °C .................................................................................................24
Figure 3.10. The rotating cylinders of ADO (left) and MGO (right) after 24 hours of rotation at 10°C. No emulsification was observed for ADO and MGO ....................................25
Figure 3.11.The rotating cylinders of water-in-oil emulsion of Kuparuk crude oil after 24 hours of rotation at 10 °C, given as example for the 200 and 250°C+ residue .......26
vii
Figure 3.12.The rotating cylinders of water-in-oil emulsion of Northstar crude oil after 24 hours of rotation at 10 °C, given as example for the 150 and 200°C+ residues above, and for the 200 and 250°C+ residue, below ...............................................27
Figure 3.13. Unstable emulsion formation of WRG after 24 hours large droplet incorporated in the oil phase (left) and totally broken emulsion (left) after 48 hours without emulsion breaker ...................................................................................................28
Figure 4.1. Estimated mass balance for Alpine crude oil in the meso-scale flume basin at
10C, before dispersant application. ......................................................................36
Figure 4.2. Visual observation of Alpine crude oil before and after treatment of dispersant .....40
Figure 4.3. Estimated mass balance for ADO in the meso-scale flume basin at 10C, before dispersant application. ...........................................................................................42
Figure 4.4. The oil-samples P1 (0.5 hour) – P8 (48 hours) from left to right with observed changes in the color appearance over time ...........................................................43
Figure 4.5. Visual observation of ADO before and after treatment of dispersant agent ............48
Figure 4.6. Estimated Mass balance for MGO in the meso-scale flume basin at 10C. ...........49
Figure 4.7. Visual observation of MGO....................................................................................53
Figure 4.8. Estimated mass balance for Kuparuk crude oil in the meso-scale flume basin at
10C, before dispersant application. ......................................................................55
Figure 4.9. Visual observations of Kuparuk Crude Oil with and without dispersant application .............................................................................................................61
Figure 4.10. Estimated mass balance for Northstar crude oil in the meso-scale flume basin
at 10C, before dispersant application. ..................................................................63
Figure 4.11. Visual observations of Northstar Crude Oil with and without dispersant application .............................................................................................................67
Figure 4.12. Estimated mass balance for Wide Range Gasoil (WRG) in the meso-scale
flume basin at 10C, before dispersant application ................................................68
Figure 4.13. Visual observations of WRG with and without dispersant application ....................72
Figure A.1. Bench-scale laboratory weathering flow chart of oil ...............................................76
Figure A.2. Principle of the rotating cylinder after Mackay and Zagorski (1982) .......................78
Figure A.3. Schematic drawing of the meso-scale flume ..........................................................79
Figure C.1. Categorization of Alaska North Slope crude oils into four main groups; Naphtenic, Paraffinic, Waxy, and Asphaltenic oils. ................................................91
viii
LIST OF TABLES
Table 3.1 Pre-handling and analysis of water content and density of Alpine crude oil. ..........10
Table 3.2 Pre-handling and analysis of water content and density of ADO diesel oil .............10
Table 3.3 Pre-handling and analysis of water content and density of MGO diesel oil ............10
Table 3.4 Pre-handling and analysis of water content and density of Kuparuk crude oil ........11
Table 3.5 Pre-handling and analysis of water content and density of Northstar crude oil .......11
Table 3.6 Pre-handling and analysis of water content and density of WRG ...........................12
Table 3.7 Asphaltene (“hard”) and wax content of Alpine, ADO MGO (Year One), and Kuparuk, Northstar and WRG (Year Two) ..............................................................20
Table 3.8 Physical properties of Alpine crude oil and refined products of ADO and MGO (Year One) .............................................................................................................21
Table 3.9 Physical properties of Kuparuk and Northstar crude oils and refined products WRG (Year Two) ...................................................................................................21
Table 3.10 Water uptake of the evaporated residues of Alpine crude oil at 10 °C ....................24
Table 3.11 Water uptake of the evaporated residues of Kuparuk crude oil at 10 °C. ...............26
Table 3.12 Water uptake of the evaporated residues of Northstar crude oil at 10 °C. ..............28
Table 3.13 Water uptake of the fresh oil of WRG at 10 °C .......................................................29
Table 3.14 Stability of Alpine emulsions (no emulsion breaker) and efficiency of emulsion breaker at 10 °C ....................................................................................................30
Table 3.15 Stability of Kuparuk emulsions (no emulsion breaker) and efficiency of emulsion breaker at 10 °C ....................................................................................................30
Table 3.16 Stability of Northstar emulsions (no emulsion breaker) and efficiency of emulsion breaker at 10 °C .....................................................................................31
Table 3.17 Stability of WRG (no emulsion breaker) and efficiency of emulsion breaker at 10 °C ..........................................................................................................................31
Table 3.18 Viscosity of Alpine water-free residue and their emulsified residues at 10 °C ........32
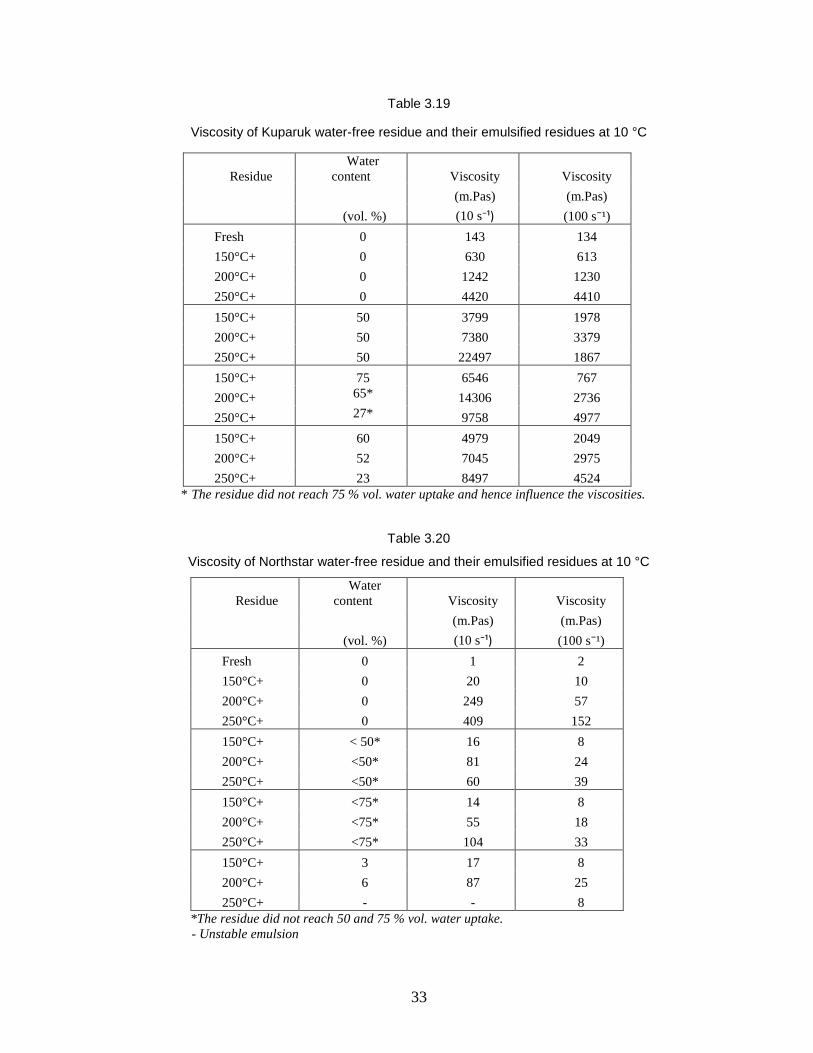
Table 3.19 Viscosity of Kuparuk water-free residue and their emulsified residues at 10 °C .....33
Table 3.20 Viscosity of Northstar water-free residue and their emulsified residues at 10 °C ....33
Table 4.1 Tabulated results from the meso-scale weathering experiment of Alpine crude oil at 10ºC ..............................................................................................................35
Table 4.2 Tabulated values of the estimated mass balance for Alpine crude oil. Example after 24 hours weathering in the meso-scale flume ................................................36
Table 4.3 Results from the meso-scale weathering experiment of ADO. ...............................41
Table 4.4 Tabulated values of the estimated mass balance for ADO. ....................................42
Table 4.5 Results from the meso-scale weathering experiment of MGO ...............................48
Table 4.6 Tabulated values of the estimated mass balance for MGO. ...................................49
Table 4.7 Results from the meso-scale weathering experiments of Kuparuk crude oil ...........54
Table 4.8 Tabulated values of the estimated mass balance for Kuparuk crude oil. ................55
ix
Table 4.9 Results from the meso-scale weathering experiment of Northstar .........................62
Table 4.10 Mass balance for Northstar during the meso-scale laboratory test at 10 °C ...........63
Table 4.11 Results from the meso-scale weathering experiment of WRG 10 °C .....................67
Table 4.12 Mass balance for WRG during the meso-scale laboratory test at 10 °C .................68
Table A.1 Analytical methods used to determine the physical properties ...............................77
Table A.2 Analytical methods used to determine the chemical properties. .............................77
Table A.3 Methods used to determine the physical properties of the surface oil/emulsion. ....80
Table B.1 Physical and chemical properties of the fresh oils for Alpine crude oil, ADO and MGO (Year One) ...................................................................................................81
Table B.2 Physical and chemical properties of the fresh oils for Kuparuk and Northstar crude oils and WRG (Year2) ..................................................................................82
Table B.3 True boiling point (TBP) curve for Alpine crude oil .................................................82
Table B.4 True boiling point (TBP) curve for ADO .................................................................83
Table B.5 True boiling point (TBP) curve for MGO .................................................................83
Table B.6 True boiling point (TBP) curve for Kuparuk crude oil ..............................................84
Table B.7 True boiling point (TBP) curve for Northstar crude oil ............................................84
Table B.8 True boiling point (TBP) curve for WRG.................................................................85
Table B.9 Summary lab weathering data of Alpine crude oil, 10 °C of fresh oil and its residues .................................................................................................................86
Table B.10 Summary lab weathering data of ADO, 10 °C of fresh oil and its residues .............86
Table B.11 Summary lab weathering data of MGO, 10 °C of fresh oils and its residues ..........87
Table B.12 Summary lab weathering data of Kuparuk crude oil, 10 °C of fresh oils and its residues .................................................................................................................87
Table B.13 Summary lab weathering data of Northstar crude oil, 10 °C of fresh oils and its residues .................................................................................................................88
Table B.14 Summary lab weathering data of WRG, 10 °C of fresh oil due to lack of lighter components with boiling point lower than 250 °C ...................................................89
x
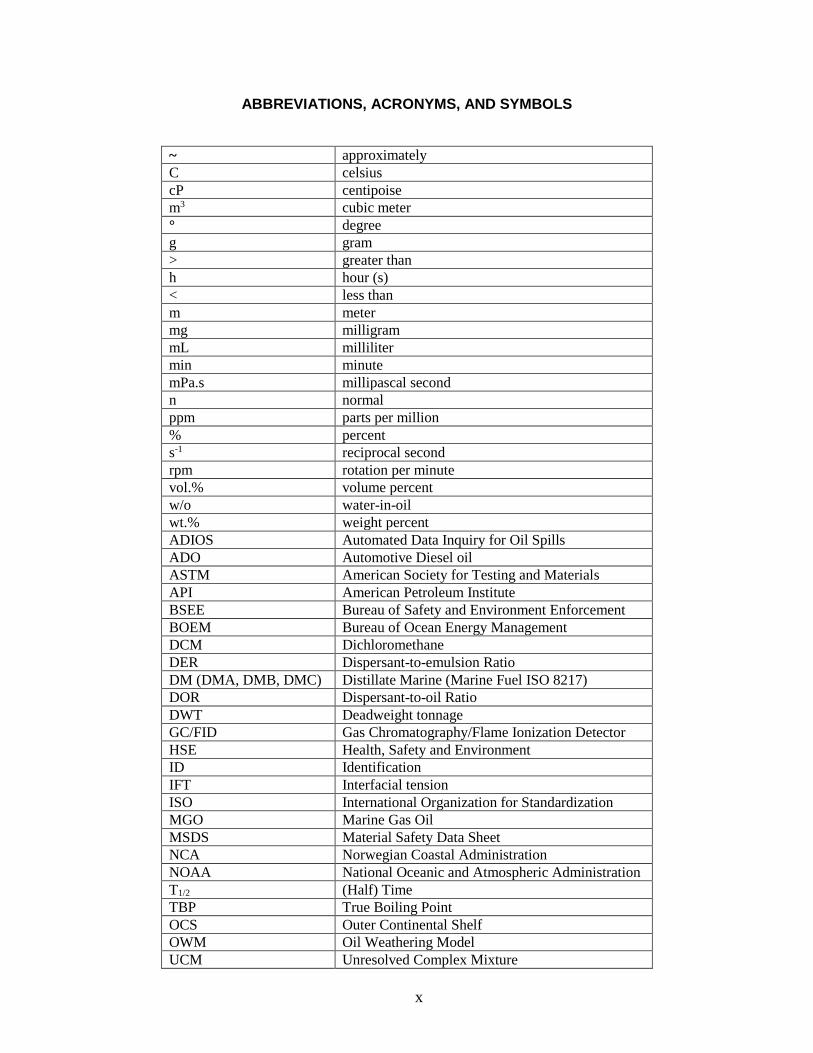
ABBREVIATIONS, ACRONYMS, AND SYMBOLS
~ approximately
C celsius
cP centipoise
m3 cubic meter
° degree
g gram
> greater than
h hour (s)
< less than
m meter
mg milligram
mL milliliter
min minute
mPa.s millipascal second
n normal
ppm parts per million
% percent
s-1 reciprocal second
rpm rotation per minute
vol.% volume percent
w/o water-in-oil
wt.% weight percent
ADIOS Automated Data Inquiry for Oil Spills
ADO Automotive Diesel oil
ASTM American Society for Testing and Materials
API American Petroleum Institute
BSEE Bureau of Safety and Environment Enforcement
BOEM Bureau of Ocean Energy Management
DCM Dichloromethane
DER Dispersant-to-emulsion Ratio
DM (DMA, DMB, DMC) Distillate Marine (Marine Fuel ISO 8217)
DOR Dispersant-to-oil Ratio
DWT Deadweight tonnage
GC/FID Gas Chromatography/Flame Ionization Detector
HSE Health, Safety and Environment
ID Identification
IFT Interfacial tension
ISO International Organization for Standardization
MGO Marine Gas Oil
MSDS Material Safety Data Sheet
NCA Norwegian Coastal Administration
NOAA National Oceanic and Atmospheric Administration
T1/2 (Half) Time
TBP True Boiling Point
OCS Outer Continental Shelf
OWM Oil Weathering Model
UCM Unresolved Complex Mixture

xi
ULSD Ultra-Low-Sulphur Diesel
UV Ultra Violet
WOR Water-to-oil Ratio
WRG Wide Range Gasoil
1
1. INTRODUCTION
SINTEF Materials and Chemistry, Department of Oil Spill Research (hereafter referred as
SINTEF) was asked by SEA Consulting Group (hereafter referred as Client) to conduct weathering
studies of six oils. A total of three oils were studied in Year One and three additional oils were
studied in Year Two. The six oils included:
Year One: One crude oil supplied from Alaska North Slope from ConocoPhillips Alaska,
Inc. (Alpine), and two light refined products of ADO (Automotive Diesel Oil, also called
Ultra-Low-Sulphur Diesel (ULSD) and MGO (Marine Diesel Oil). The refined products
(diesel oils) were supplied from the Esso Slagen refinery in Norway.
Year Two: The three oils in Year Two included two crude oils supplied from Alaska North
Slope from ConocoPhillips Alaska, Inc. (Kuparuk) and Hilcorp Alaska, LLC (Northstar),
and one refined product of WRG (Wide Range Gasoil) produced in Norway. The WRG
refined product was supplied from Statoil Mongstad refinery in conjunction with another
project that SINTEF is conducting (2014-2016) for the Norwegian Coastal Administration
(NCA). The NCA project is a weathering and dispersibility study, with screening of
dispersant agents for diesel products, including WRG. Findings from a pre-study of
weathering properties of another batch of WRG can be found in Sørheim and Daling, 2015
(open report in Norwegian language).
The bench-scale and meso-scale flume laboratory testing of the six oils were conducted at 10 °C,
reflecting relevant sea temperature in Alaskan waters, and was defined in agreement with the
Client. The experimental data were further customized in tables for use as input to numerical Oil
Weathering Models (OWMs), in order to obtain reliable and robust weathering predictions of spill
scenarios.
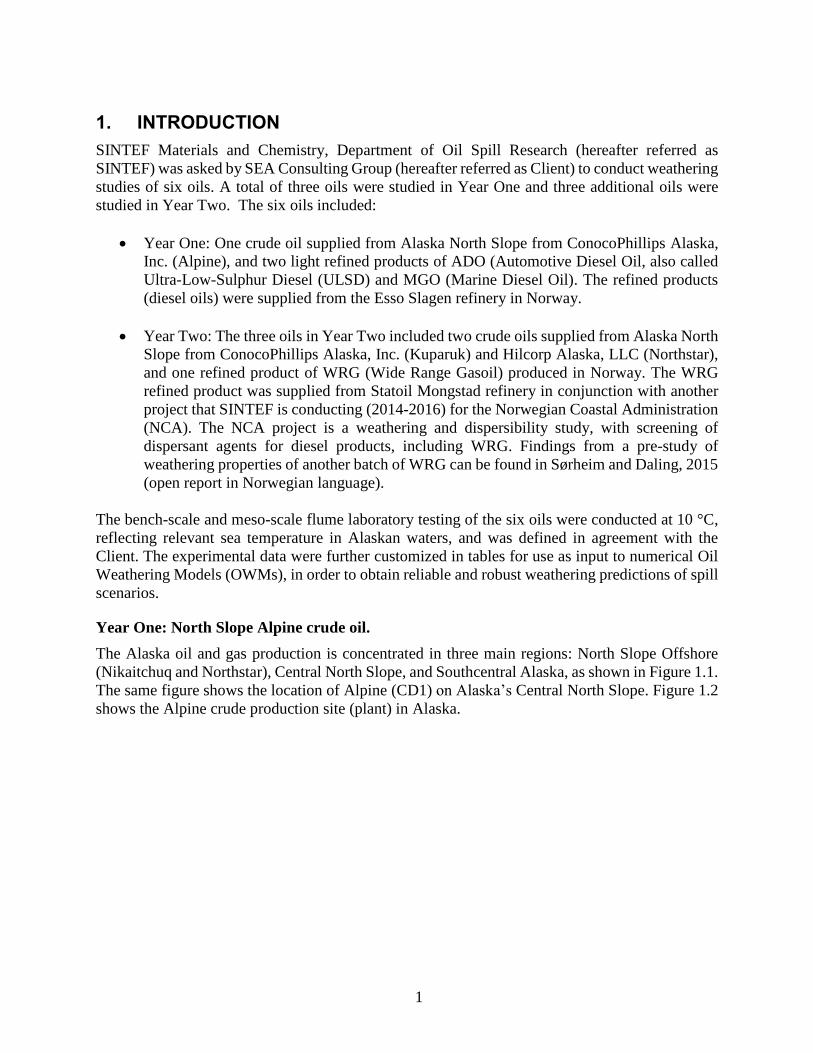
Year One: North Slope Alpine crude oil.
The Alaska oil and gas production is concentrated in three main regions: North Slope Offshore
(Nikaitchuq and Northstar), Central North Slope, and Southcentral Alaska, as shown in Figure 1.1.
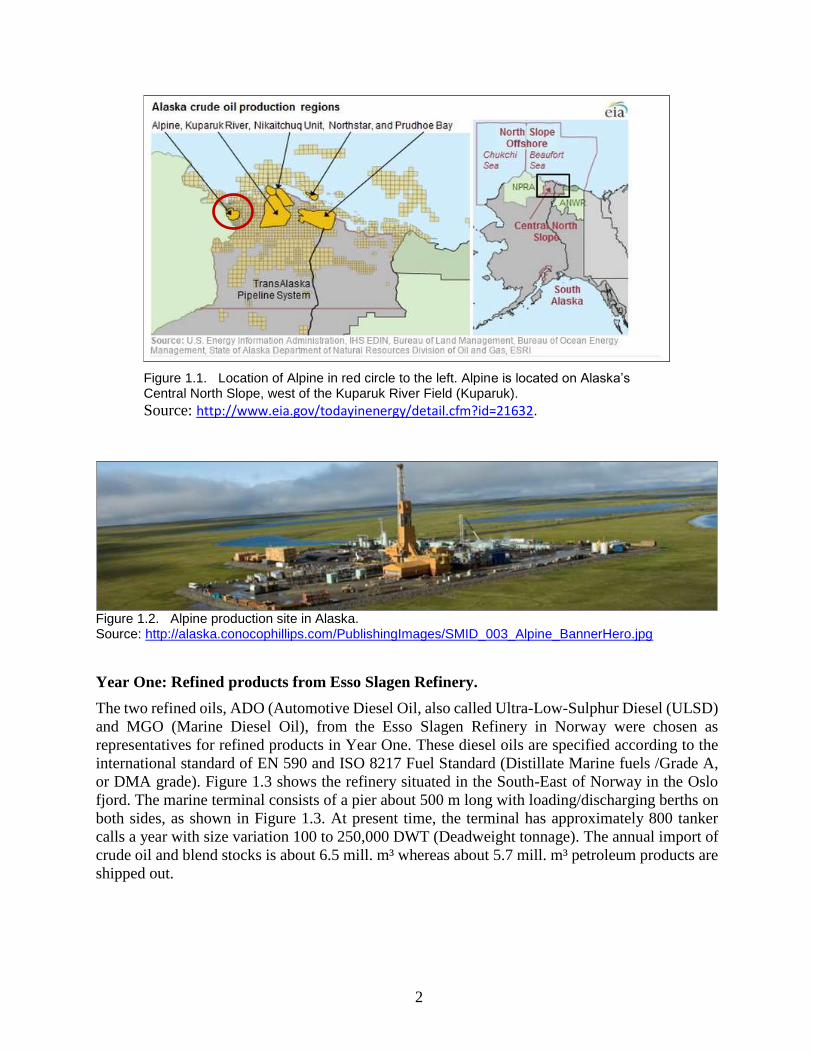
The same figure shows the location of Alpine (CD1) on Alaska’s Central North Slope. Figure 1.2
shows the Alpine crude production site (plant) in Alaska.
2
Figure 1.1. Location of Alpine in red circle to the left. Alpine is located on Alaska’s Central North Slope, west of the Kuparuk River Field (Kuparuk).
Source: http://www.eia.gov/todayinenergy/detail.cfm?id=21632.
Figure 1.2. Alpine production site in Alaska. Source: http://alaska.conocophillips.com/PublishingImages/SMID_003_Alpine_BannerHero.jpg
Year One: Refined products from Esso Slagen Refinery.
The two refined oils, ADO (Automotive Diesel Oil, also called Ultra-Low-Sulphur Diesel (ULSD)
and MGO (Marine Diesel Oil), from the Esso Slagen Refinery in Norway were chosen as
representatives for refined products in Year One. These diesel oils are specified according to the
international standard of EN 590 and ISO 8217 Fuel Standard (Distillate Marine fuels /Grade A,
or DMA grade). Figure 1.3 shows the refinery situated in the South-East of Norway in the Oslo
fjord. The marine terminal consists of a pier about 500 m long with loading/discharging berths on
both sides, as shown in Figure 1.3. At present time, the terminal has approximately 800 tanker
calls a year with size variation 100 to 250,000 DWT (Deadweight tonnage). The annual import of
crude oil and blend stocks is about 6.5 mill. m³ whereas about 5.7 mill. m³ petroleum products are
shipped out.
3
Figure 1.3. Location of Esso Slagen Refinery in the South-East of Norway situated on the west bank of the Oslo fjord. Source: http://www.businesswire.com/multimedia/home/20140903006720/en/
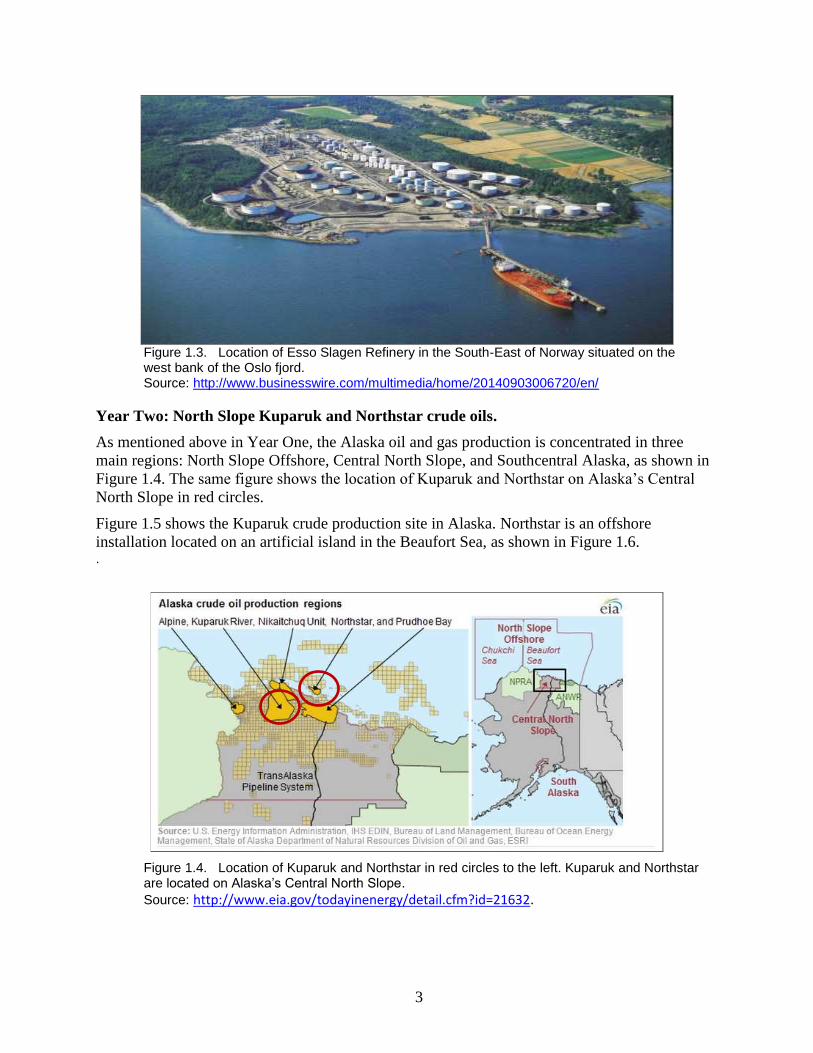
Year Two: North Slope Kuparuk and Northstar crude oils.
As mentioned above in Year One, the Alaska oil and gas production is concentrated in three
main regions: North Slope Offshore, Central North Slope, and Southcentral Alaska, as shown in
Figure 1.4. The same figure shows the location of Kuparuk and Northstar on Alaska’s Central
North Slope in red circles.
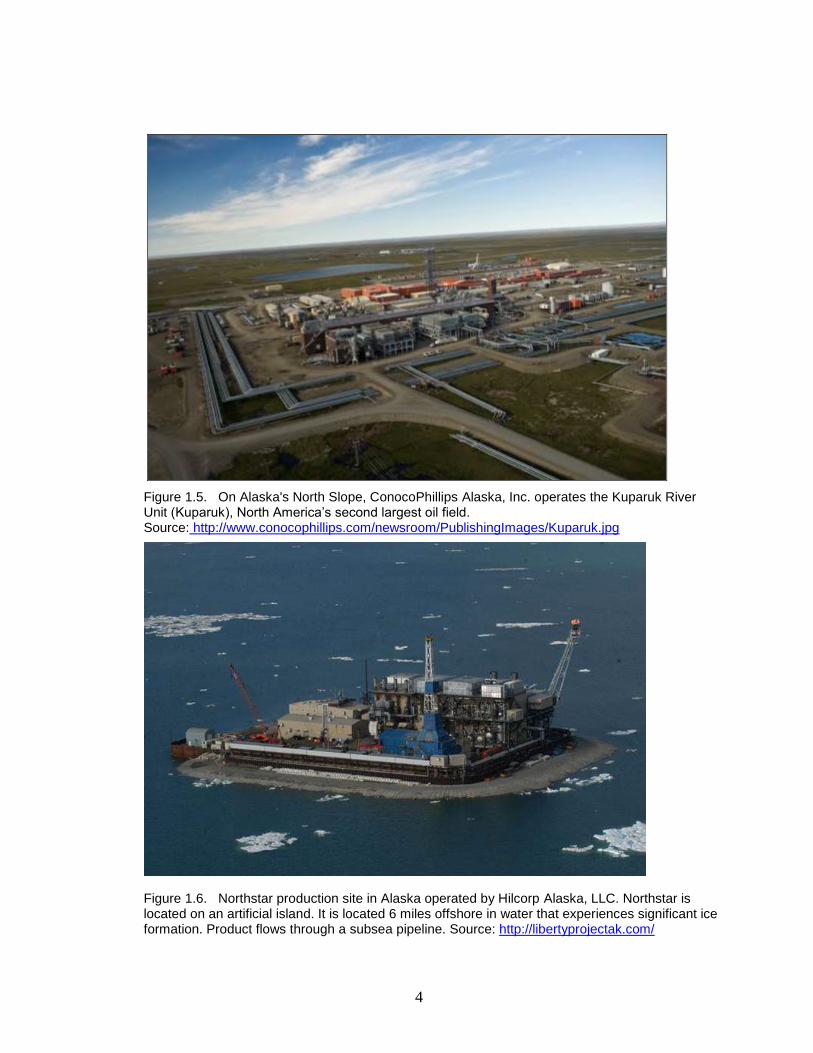
Figure 1.5 shows the Kuparuk crude production site in Alaska. Northstar is an offshore
installation located on an artificial island in the Beaufort Sea, as shown in Figure 1.6. .
Figure 1.4. Location of Kuparuk and Northstar in red circles to the left. Kuparuk and Northstar are located on Alaska’s Central North Slope.
Source: http://www.eia.gov/todayinenergy/detail.cfm?id=21632.
4
Figure 1.5. On Alaska's North Slope, ConocoPhillips Alaska, Inc. operates the Kuparuk River Unit (Kuparuk), North America’s second largest oil field. Source: http://www.conocophillips.com/newsroom/PublishingImages/Kuparuk.jpg
Figure 1.6. Northstar production site in Alaska operated by Hilcorp Alaska, LLC. Northstar is located on an artificial island. It is located 6 miles offshore in water that experiences significant ice formation. Product flows through a subsea pipeline. Source: http://libertyprojectak.com/
5
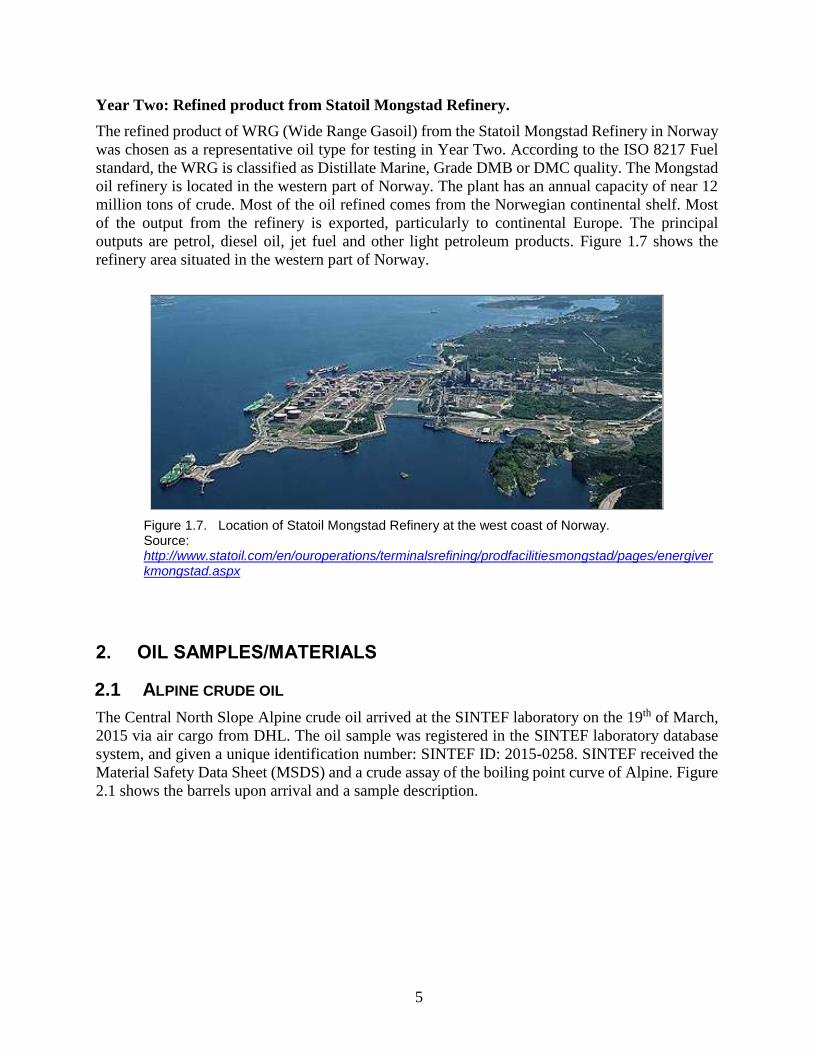
Year Two: Refined product from Statoil Mongstad Refinery.
The refined product of WRG (Wide Range Gasoil) from the Statoil Mongstad Refinery in Norway
was chosen as a representative oil type for testing in Year Two. According to the ISO 8217 Fuel
standard, the WRG is classified as Distillate Marine, Grade DMB or DMC quality. The Mongstad
oil refinery is located in the western part of Norway. The plant has an annual capacity of near 12
million tons of crude. Most of the oil refined comes from the Norwegian continental shelf. Most
of the output from the refinery is exported, particularly to continental Europe. The principal
outputs are petrol, diesel oil, jet fuel and other light petroleum products. Figure 1.7 shows the
refinery area situated in the western part of Norway.
Figure 1.7. Location of Statoil Mongstad Refinery at the west coast of Norway. Source: http://www.statoil.com/en/ouroperations/terminalsrefining/prodfacilitiesmongstad/pages/energiverkmongstad.aspx
2. OIL SAMPLES/MATERIALS
2.1 ALPINE CRUDE OIL
The Central North Slope Alpine crude oil arrived at the SINTEF laboratory on the 19th of March,
2015 via air cargo from DHL. The oil sample was registered in the SINTEF laboratory database
system, and given a unique identification number: SINTEF ID: 2015-0258. SINTEF received the
Material Safety Data Sheet (MSDS) and a crude assay of the boiling point curve of Alpine. Figure
2.1 shows the barrels upon arrival and a sample description.
6
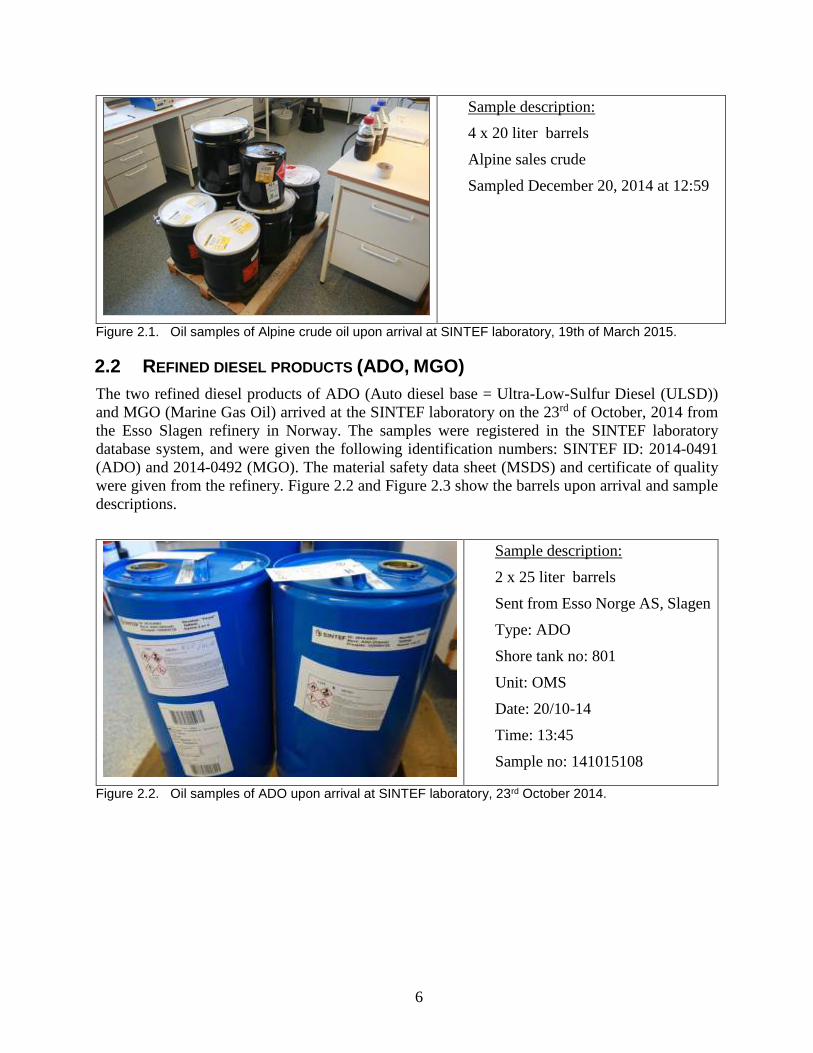
Sample description:
4 x 20 liter barrels
Alpine sales crude
Sampled December 20, 2014 at 12:59
Figure 2.1. Oil samples of Alpine crude oil upon arrival at SINTEF laboratory, 19th of March 2015.
2.2 REFINED DIESEL PRODUCTS (ADO, MGO)
The two refined diesel products of ADO (Auto diesel base = Ultra-Low-Sulfur Diesel (ULSD))
and MGO (Marine Gas Oil) arrived at the SINTEF laboratory on the 23rd of October, 2014 from
the Esso Slagen refinery in Norway. The samples were registered in the SINTEF laboratory
database system, and were given the following identification numbers: SINTEF ID: 2014-0491
(ADO) and 2014-0492 (MGO). The material safety data sheet (MSDS) and certificate of quality
were given from the refinery. Figure 2.2 and Figure 2.3 show the barrels upon arrival and sample
descriptions.
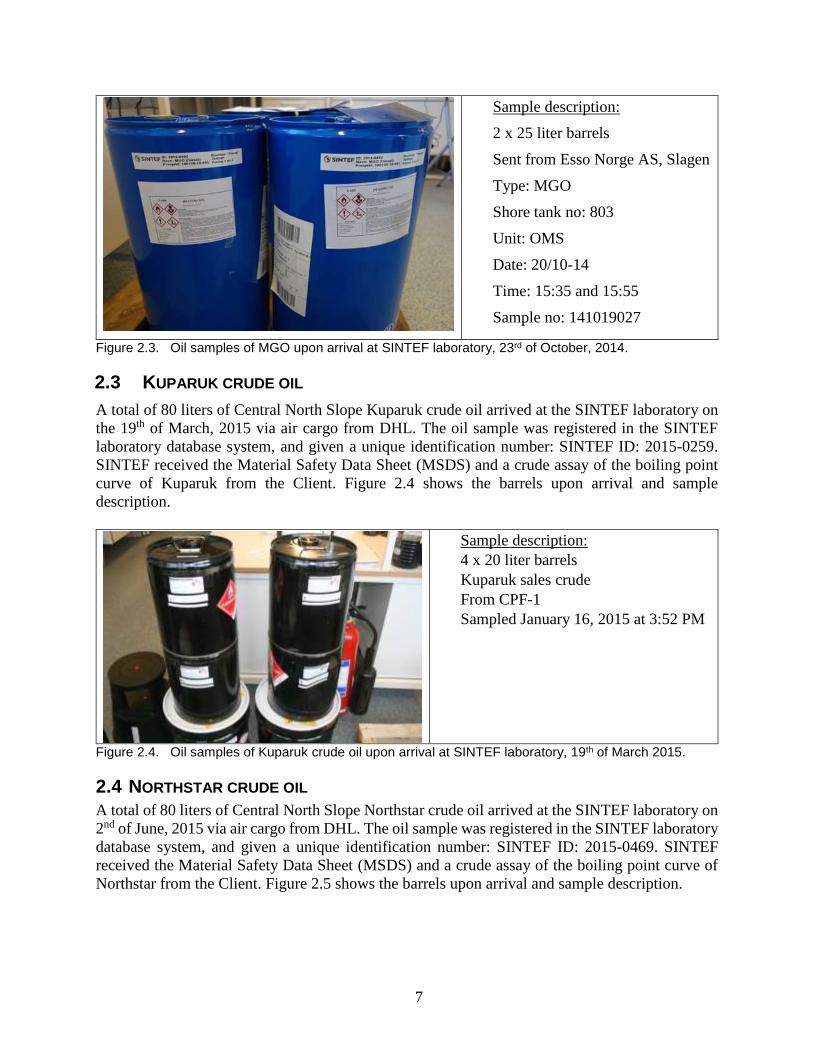
Sample description:
2 x 25 liter barrels
Sent from Esso Norge AS, Slagen
Type: ADO
Shore tank no: 801
Unit: OMS
Date: 20/10-14
Time: 13:45
Sample no: 141015108
Figure 2.2. Oil samples of ADO upon arrival at SINTEF laboratory, 23rd October 2014.
7
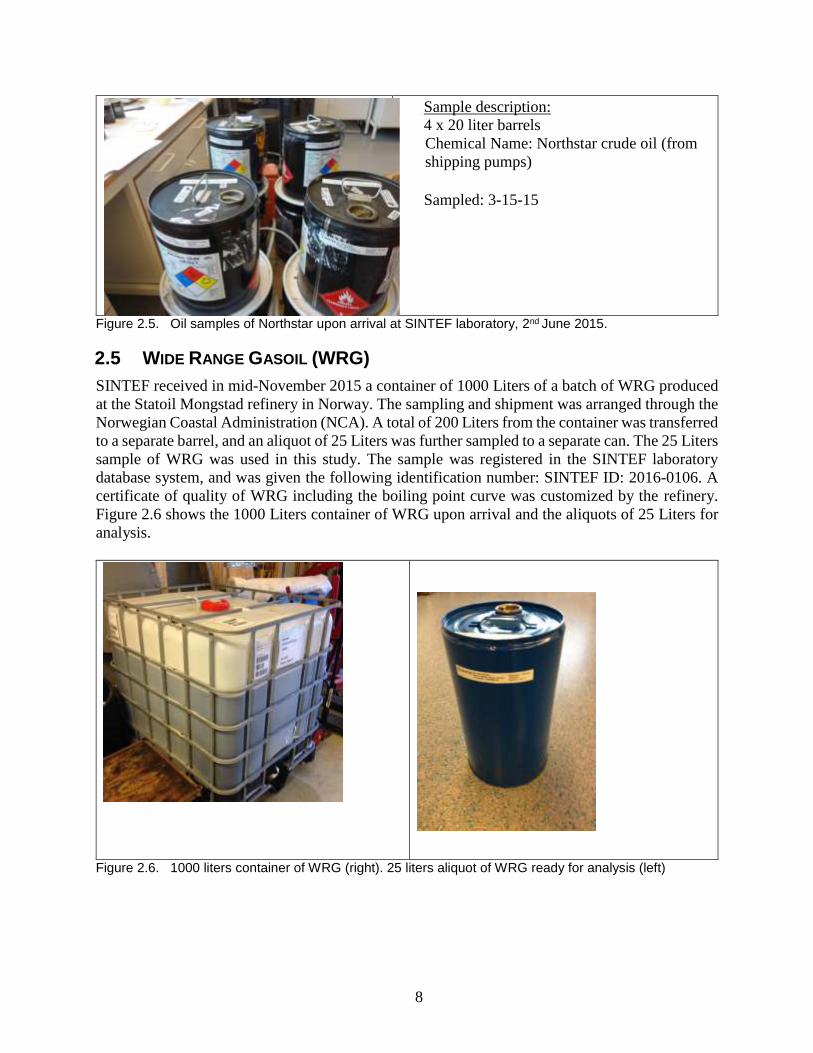
Sample description:
2 x 25 liter barrels
Sent from Esso Norge AS, Slagen
Type: MGO
Shore tank no: 803
Unit: OMS
Date: 20/10-14
Time: 15:35 and 15:55
Sample no: 141019027
Figure 2.3. Oil samples of MGO upon arrival at SINTEF laboratory, 23rd of October, 2014.
2.3 KUPARUK CRUDE OIL
A total of 80 liters of Central North Slope Kuparuk crude oil arrived at the SINTEF laboratory on
the 19th of March, 2015 via air cargo from DHL. The oil sample was registered in the SINTEF
laboratory database system, and given a unique identification number: SINTEF ID: 2015-0259.
SINTEF received the Material Safety Data Sheet (MSDS) and a crude assay of the boiling point
curve of Kuparuk from the Client. Figure 2.4 shows the barrels upon arrival and sample
description.
Sample description:
4 x 20 liter barrels
Kuparuk sales crude
From CPF-1
Sampled January 16, 2015 at 3:52 PM
Figure 2.4. Oil samples of Kuparuk crude oil upon arrival at SINTEF laboratory, 19th of March 2015.
2.4 NORTHSTAR CRUDE OIL
A total of 80 liters of Central North Slope Northstar crude oil arrived at the SINTEF laboratory on
2nd of June, 2015 via air cargo from DHL. The oil sample was registered in the SINTEF laboratory
database system, and given a unique identification number: SINTEF ID: 2015-0469. SINTEF
received the Material Safety Data Sheet (MSDS) and a crude assay of the boiling point curve of
Northstar from the Client. Figure 2.5 shows the barrels upon arrival and sample description.
8
Sample description:
4 x 20 liter barrels
Chemical Name: Northstar crude oil (from
shipping pumps)
Sampled: 3-15-15
Figure 2.5. Oil samples of Northstar upon arrival at SINTEF laboratory, 2nd June 2015.
2.5 WIDE RANGE GASOIL (WRG)
SINTEF received in mid-November 2015 a container of 1000 Liters of a batch of WRG produced
at the Statoil Mongstad refinery in Norway. The sampling and shipment was arranged through the
Norwegian Coastal Administration (NCA). A total of 200 Liters from the container was transferred
to a separate barrel, and an aliquot of 25 Liters was further sampled to a separate can. The 25 Liters
sample of WRG was used in this study. The sample was registered in the SINTEF laboratory
database system, and was given the following identification number: SINTEF ID: 2016-0106. A
certificate of quality of WRG including the boiling point curve was customized by the refinery.
Figure 2.6 shows the 1000 Liters container of WRG upon arrival and the aliquots of 25 Liters for
analysis.
Figure 2.6. 1000 liters container of WRG (right). 25 liters aliquot of WRG ready for analysis (left)
9
3. BENCH-SCALE LABORATORY TESTING RESULTS
The bench-scale methodology is thoroughly described in Appendix A. As some of the tested oils
exhibit similar properties and characteristics, this section is organized by the various composition
and property testing conducted and combines and summarizes results.
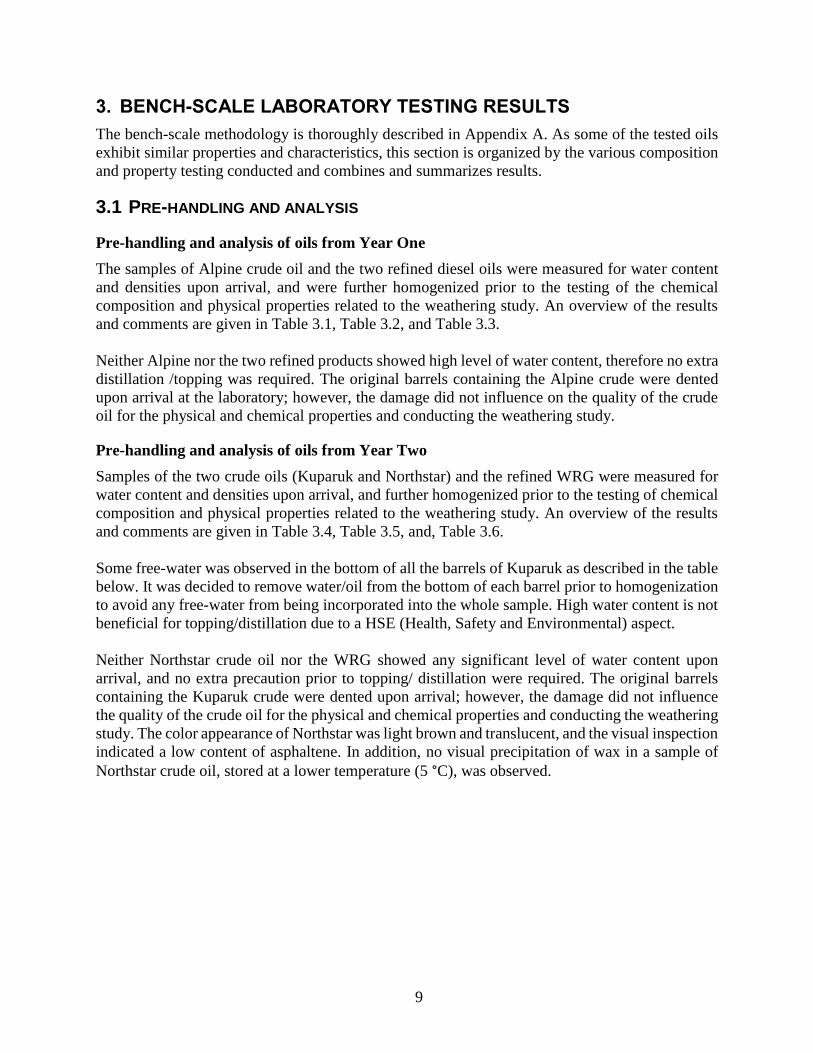
3.1 PRE-HANDLING AND ANALYSIS
Pre-handling and analysis of oils from Year One
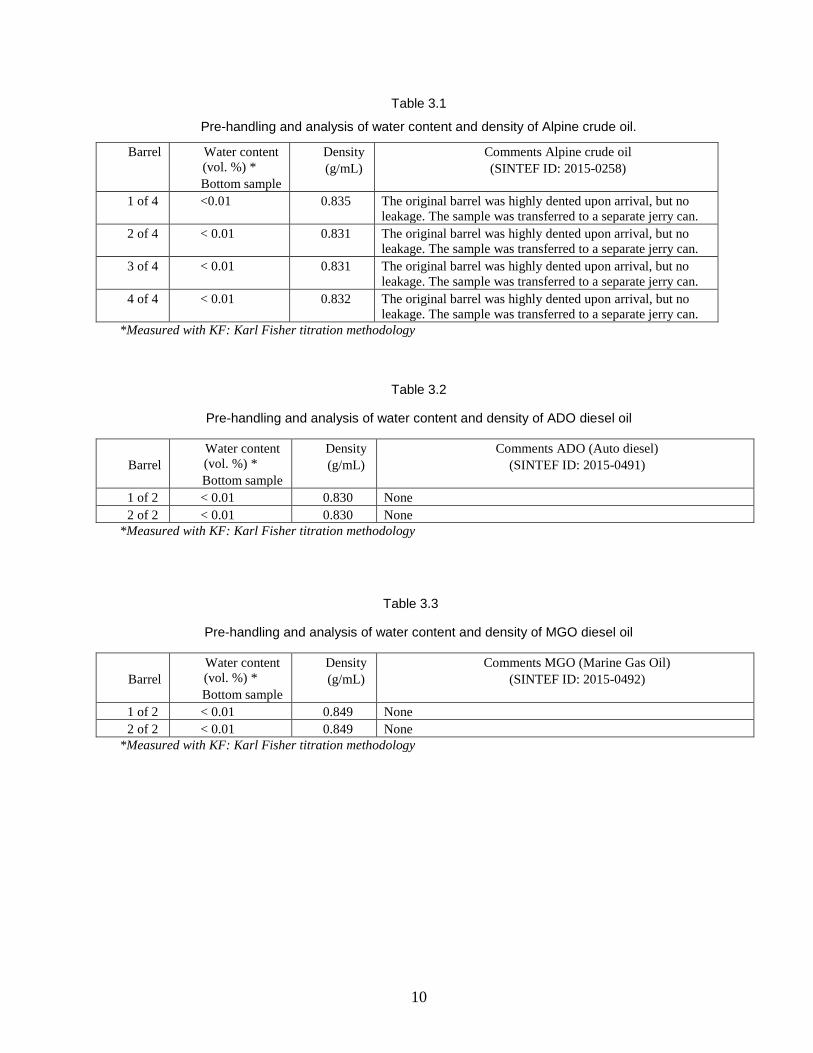
The samples of Alpine crude oil and the two refined diesel oils were measured for water content
and densities upon arrival, and were further homogenized prior to the testing of the chemical
composition and physical properties related to the weathering study. An overview of the results
and comments are given in Table 3.1, Table 3.2, and Table 3.3.
Neither Alpine nor the two refined products showed high level of water content, therefore no extra
distillation /topping was required. The original barrels containing the Alpine crude were dented
upon arrival at the laboratory; however, the damage did not influence on the quality of the crude
oil for the physical and chemical properties and conducting the weathering study.
Pre-handling and analysis of oils from Year Two
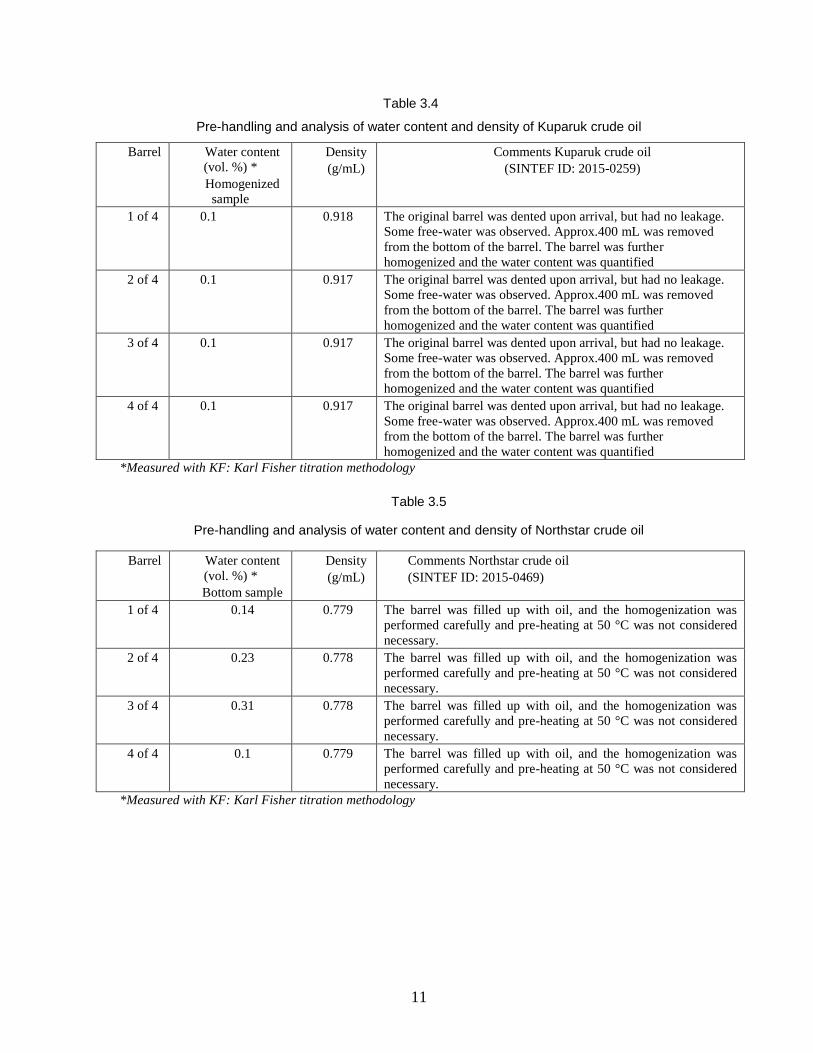
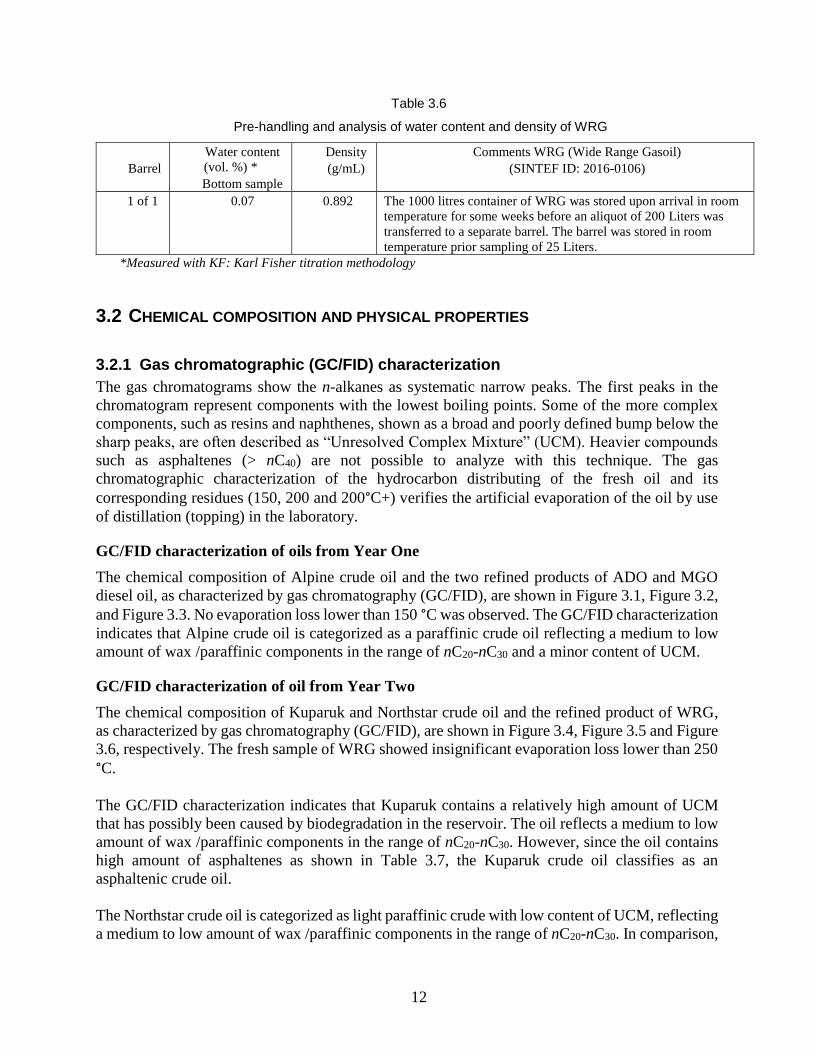
Samples of the two crude oils (Kuparuk and Northstar) and the refined WRG were measured for
water content and densities upon arrival, and further homogenized prior to the testing of chemical
composition and physical properties related to the weathering study. An overview of the results
and comments are given in Table 3.4, Table 3.5, and, Table 3.6.
Some free-water was observed in the bottom of all the barrels of Kuparuk as described in the table
below. It was decided to remove water/oil from the bottom of each barrel prior to homogenization
to avoid any free-water from being incorporated into the whole sample. High water content is not
beneficial for topping/distillation due to a HSE (Health, Safety and Environmental) aspect.
Neither Northstar crude oil nor the WRG showed any significant level of water content upon
arrival, and no extra precaution prior to topping/ distillation were required. The original barrels
containing the Kuparuk crude were dented upon arrival; however, the damage did not influence
the quality of the crude oil for the physical and chemical properties and conducting the weathering
study. The color appearance of Northstar was light brown and translucent, and the visual inspection
indicated a low content of asphaltene. In addition, no visual precipitation of wax in a sample of
Northstar crude oil, stored at a lower temperature (5 °C), was observed.
10
Table 3.1
Pre-handling and analysis of water content and density of Alpine crude oil.
Barrel Water content
(vol. %) *
Bottom sample
Density
(g/mL)
Comments Alpine crude oil
(SINTEF ID: 2015-0258)
1 of 4 <0.01 0.835 The original barrel was highly dented upon arrival, but no
leakage. The sample was transferred to a separate jerry can.
2 of 4 < 0.01 0.831 The original barrel was highly dented upon arrival, but no
leakage. The sample was transferred to a separate jerry can.
3 of 4 < 0.01 0.831 The original barrel was highly dented upon arrival, but no
leakage. The sample was transferred to a separate jerry can.
4 of 4 < 0.01 0.832 The original barrel was highly dented upon arrival, but no
leakage. The sample was transferred to a separate jerry can.
*Measured with KF: Karl Fisher titration methodology
Table 3.2
Pre-handling and analysis of water content and density of ADO diesel oil
Barrel
Water content
(vol. %) *
Bottom sample
Density
(g/mL)
Comments ADO (Auto diesel)
(SINTEF ID: 2015-0491)
1 of 2 < 0.01 0.830 None
2 of 2 < 0.01 0.830 None
*Measured with KF: Karl Fisher titration methodology
Table 3.3
Pre-handling and analysis of water content and density of MGO diesel oil
Barrel
Water content
(vol. %) *
Bottom sample
Density
(g/mL)
Comments MGO (Marine Gas Oil)
(SINTEF ID: 2015-0492)
1 of 2 < 0.01 0.849 None
2 of 2 < 0.01 0.849 None
*Measured with KF: Karl Fisher titration methodology
11
Table 3.4
Pre-handling and analysis of water content and density of Kuparuk crude oil
Barrel Water content
(vol. %) *
Homogenized
sample
Density
(g/mL)
Comments Kuparuk crude oil
(SINTEF ID: 2015-0259)
1 of 4 0.1 0.918 The original barrel was dented upon arrival, but had no leakage.
Some free-water was observed. Approx.400 mL was removed
from the bottom of the barrel. The barrel was further
homogenized and the water content was quantified
2 of 4 0.1 0.917 The original barrel was dented upon arrival, but had no leakage.
Some free-water was observed. Approx.400 mL was removed
from the bottom of the barrel. The barrel was further
homogenized and the water content was quantified
3 of 4 0.1 0.917 The original barrel was dented upon arrival, but had no leakage.
Some free-water was observed. Approx.400 mL was removed
from the bottom of the barrel. The barrel was further
homogenized and the water content was quantified
4 of 4 0.1 0.917 The original barrel was dented upon arrival, but had no leakage.
Some free-water was observed. Approx.400 mL was removed
from the bottom of the barrel. The barrel was further
homogenized and the water content was quantified
*Measured with KF: Karl Fisher titration methodology
Table 3.5
Pre-handling and analysis of water content and density of Northstar crude oil
Barrel Water content
(vol. %) *
Bottom sample
Density
(g/mL)
Comments Northstar crude oil
(SINTEF ID: 2015-0469)
1 of 4 0.14 0.779 The barrel was filled up with oil, and the homogenization was
performed carefully and pre-heating at 50 °C was not considered
necessary.
2 of 4 0.23 0.778 The barrel was filled up with oil, and the homogenization was
performed carefully and pre-heating at 50 °C was not considered
necessary.
3 of 4 0.31 0.778 The barrel was filled up with oil, and the homogenization was
performed carefully and pre-heating at 50 °C was not considered
necessary.
4 of 4 0.1 0.779 The barrel was filled up with oil, and the homogenization was
performed carefully and pre-heating at 50 °C was not considered
necessary.
*Measured with KF: Karl Fisher titration methodology
12
Table 3.6
Pre-handling and analysis of water content and density of WRG
Barrel
Water content
(vol. %) *
Bottom sample
Density
(g/mL)
Comments WRG (Wide Range Gasoil)
(SINTEF ID: 2016-0106)
1 of 1 0.07 0.892 The 1000 litres container of WRG was stored upon arrival in room
temperature for some weeks before an aliquot of 200 Liters was
transferred to a separate barrel. The barrel was stored in room
temperature prior sampling of 25 Liters.
*Measured with KF: Karl Fisher titration methodology
3.2 CHEMICAL COMPOSITION AND PHYSICAL PROPERTIES
3.2.1 Gas chromatographic (GC/FID) characterization
The gas chromatograms show the n-alkanes as systematic narrow peaks. The first peaks in the
chromatogram represent components with the lowest boiling points. Some of the more complex
components, such as resins and naphthenes, shown as a broad and poorly defined bump below the
sharp peaks, are often described as “Unresolved Complex Mixture” (UCM). Heavier compounds
such as asphaltenes (> nC40) are not possible to analyze with this technique. The gas
chromatographic characterization of the hydrocarbon distributing of the fresh oil and its
corresponding residues (150, 200 and 200°C+) verifies the artificial evaporation of the oil by use
of distillation (topping) in the laboratory.
GC/FID characterization of oils from Year One
The chemical composition of Alpine crude oil and the two refined products of ADO and MGO
diesel oil, as characterized by gas chromatography (GC/FID), are shown in Figure 3.1, Figure 3.2,
and Figure 3.3. No evaporation loss lower than 150 °C was observed. The GC/FID characterization
indicates that Alpine crude oil is categorized as a paraffinic crude oil reflecting a medium to low
amount of wax /paraffinic components in the range of nC20-nC30 and a minor content of UCM.
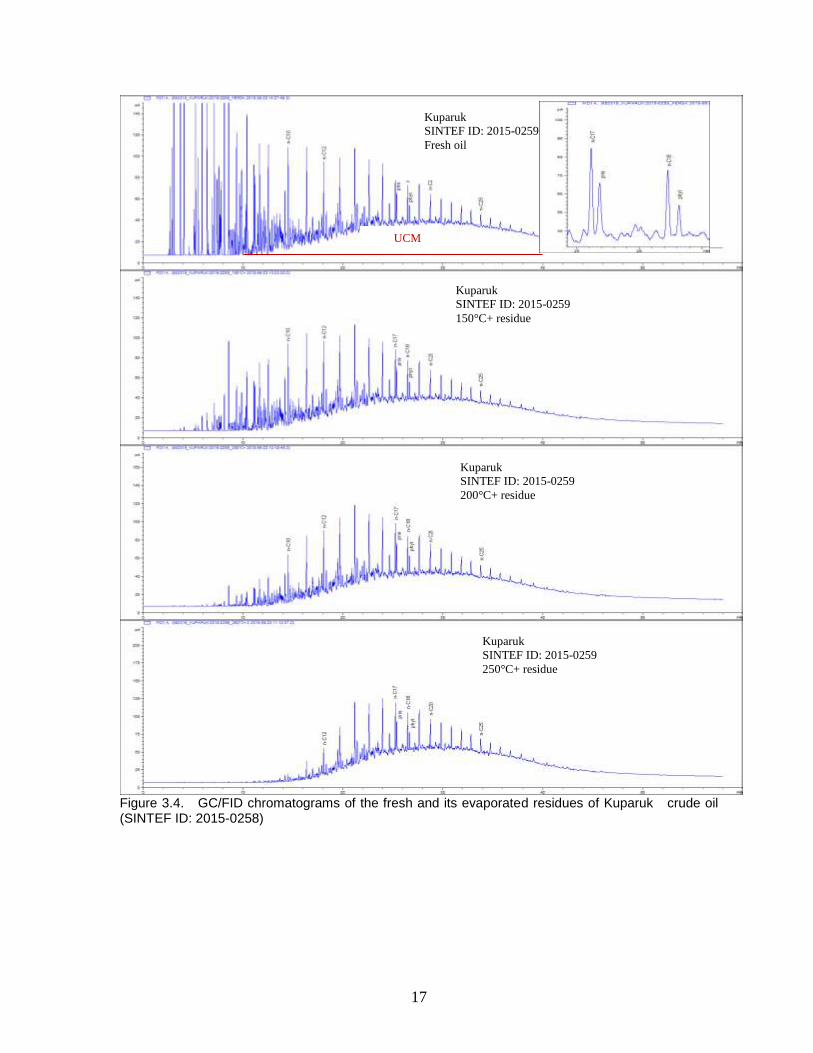
GC/FID characterization of oil from Year Two
The chemical composition of Kuparuk and Northstar crude oil and the refined product of WRG,
as characterized by gas chromatography (GC/FID), are shown in Figure 3.4, Figure 3.5 and Figure
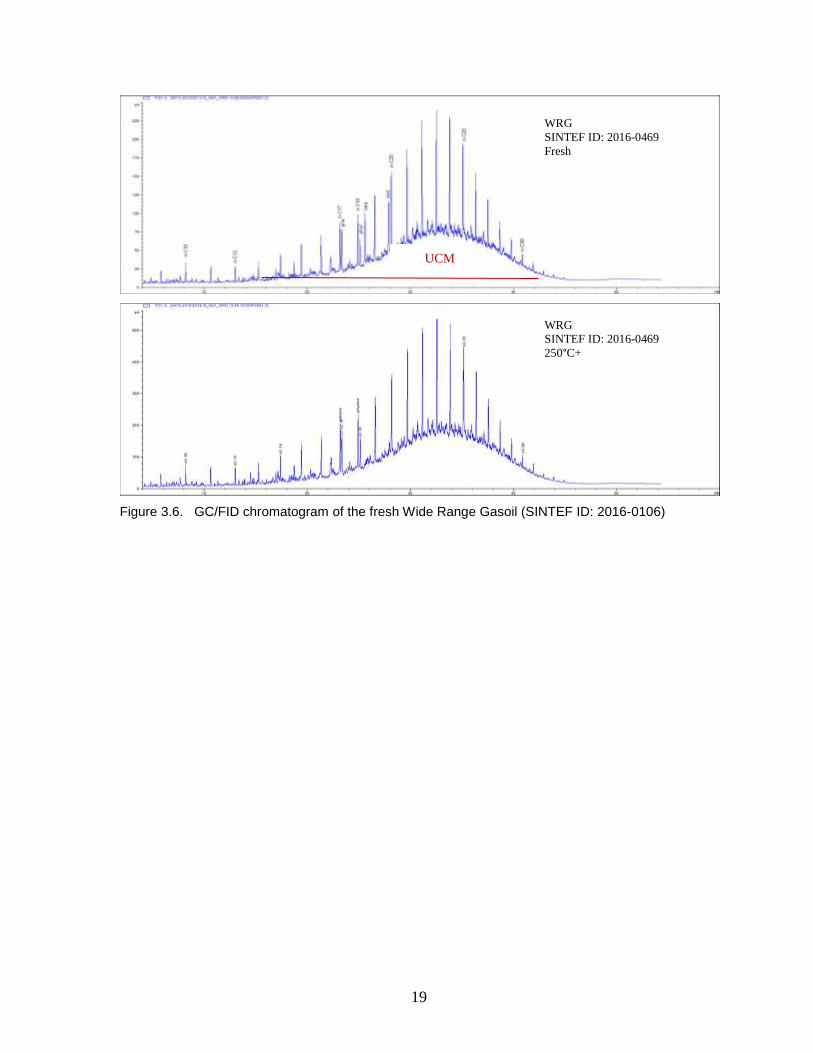
3.6, respectively. The fresh sample of WRG showed insignificant evaporation loss lower than 250
°C.
The GC/FID characterization indicates that Kuparuk contains a relatively high amount of UCM
that has possibly been caused by biodegradation in the reservoir. The oil reflects a medium to low
amount of wax /paraffinic components in the range of nC20-nC30. However, since the oil contains
high amount of asphaltenes as shown in Table 3.7, the Kuparuk crude oil classifies as an
asphaltenic crude oil.
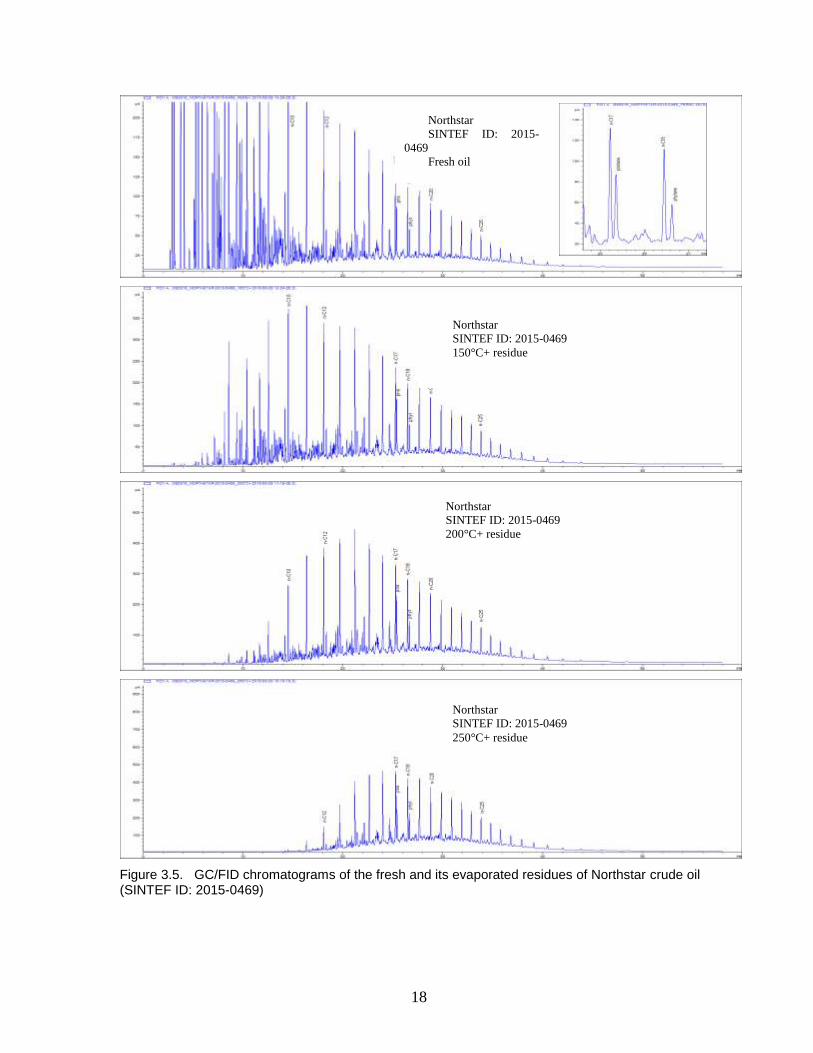
The Northstar crude oil is categorized as light paraffinic crude with low content of UCM, reflecting
a medium to low amount of wax /paraffinic components in the range of nC20-nC30. In comparison,
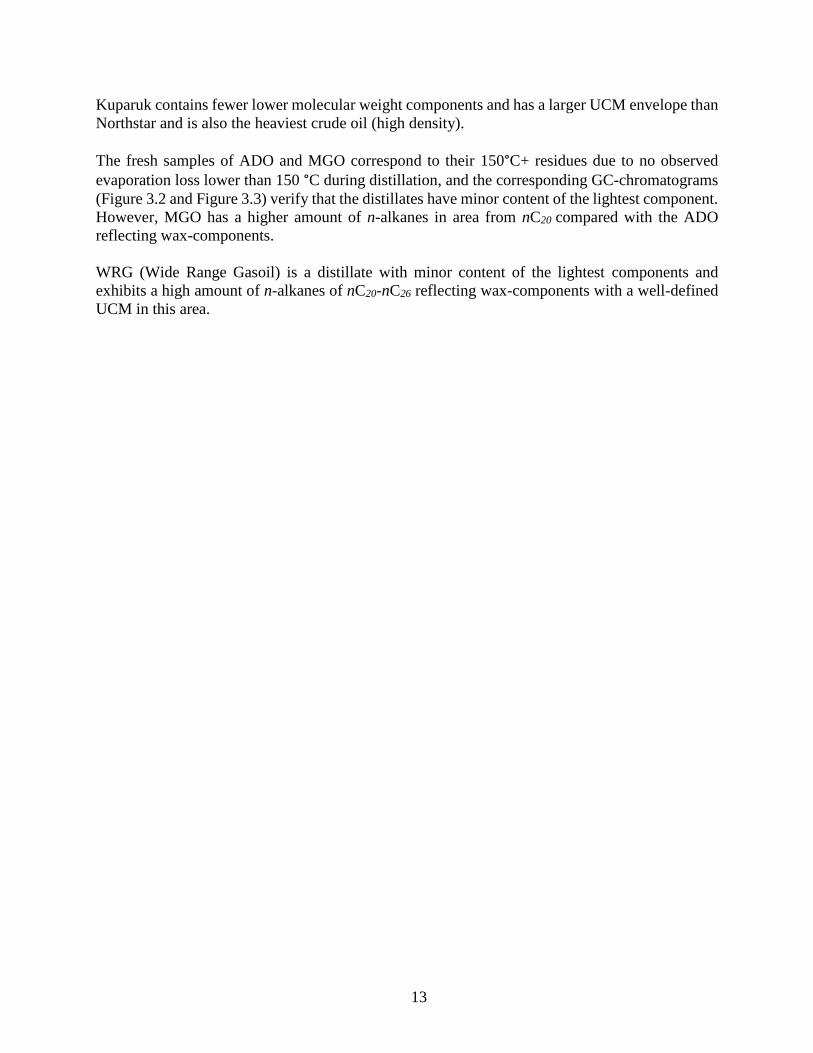
13
Kuparuk contains fewer lower molecular weight components and has a larger UCM envelope than
Northstar and is also the heaviest crude oil (high density).
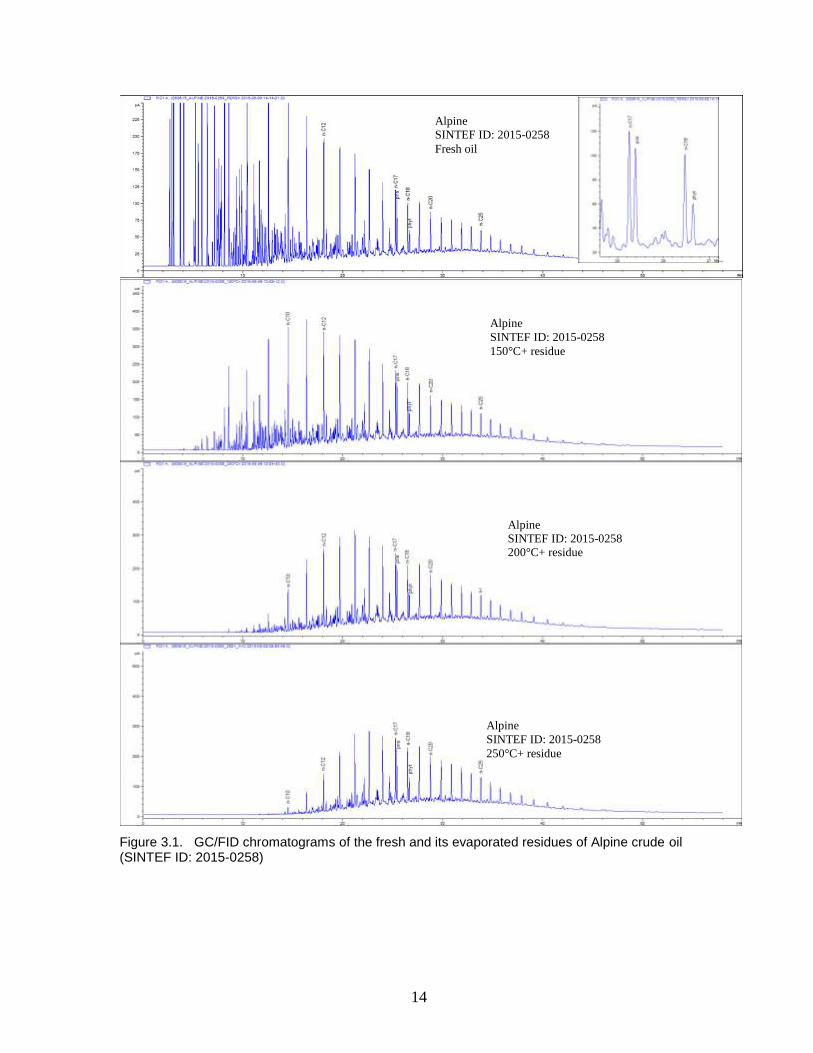
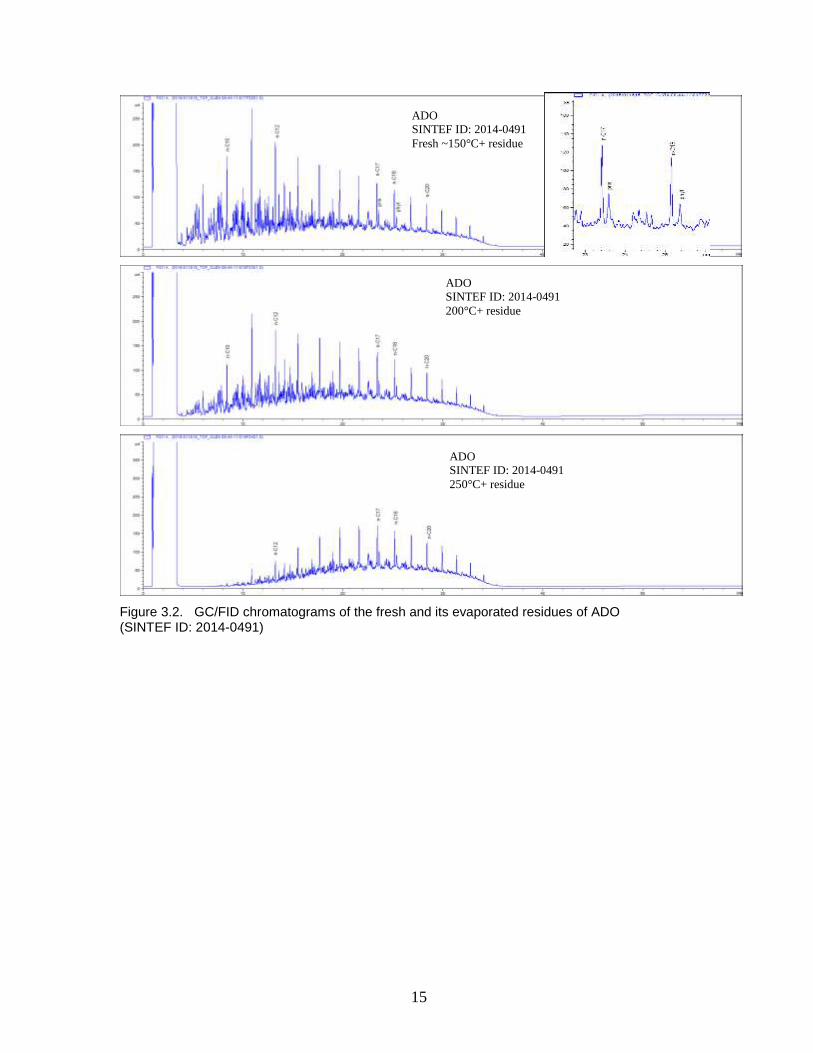
The fresh samples of ADO and MGO correspond to their 150°C+ residues due to no observed
evaporation loss lower than 150 °C during distillation, and the corresponding GC-chromatograms
(Figure 3.2 and Figure 3.3) verify that the distillates have minor content of the lightest component.
However, MGO has a higher amount of n-alkanes in area from nC20 compared with the ADO
reflecting wax-components.
WRG (Wide Range Gasoil) is a distillate with minor content of the lightest components and
exhibits a high amount of n-alkanes of nC20-nC26 reflecting wax-components with a well-defined
UCM in this area.
14
Figure 3.1. GC/FID chromatograms of the fresh and its evaporated residues of Alpine crude oil (SINTEF ID: 2015-0258)
Alpine
SINTEF ID: 2015-0258
Fresh oil
Alpine
SINTEF ID: 2015-0258
150°C+ residue
Alpine
SINTEF ID: 2015-0258
200°C+ residue
Alpine
SINTEF ID: 2015-0258
250°C+ residue
15
Figure 3.2. GC/FID chromatograms of the fresh and its evaporated residues of ADO (SINTEF ID: 2014-0491)
ADO
SINTEF ID: 2014-0491
Fresh ~150°C+ residue
ADO
SINTEF ID: 2014-0491
200°C+ residue
ADO
SINTEF ID: 2014-0491
250°C+ residue
16
Figure 3.3. GC/FID chromatograms of the fresh and its evaporated residues of MGO (SINTEF ID: 2014-0492).
MGO
SINTEF ID: 2014-0492
Fresh~150°C+ residue
MGO
SINTEF ID: 2014-0492
200°C+ residue
MGO
SINTEF ID: 2014-0492
250°C+ residue
17
Figure 3.4. GC/FID chromatograms of the fresh and its evaporated residues of Kuparuk crude oil (SINTEF ID: 2015-0258)
Kuparuk
SINTEF ID: 2015-0259
Fresh oil
Kuparuk
SINTEF ID: 2015-0259
150°C+ residue
Kuparuk
SINTEF ID: 2015-0259
200°C+ residue
Kuparuk
SINTEF ID: 2015-0259
250°C+ residue
UCM
18
Figure 3.5. GC/FID chromatograms of the fresh and its evaporated residues of Northstar crude oil (SINTEF ID: 2015-0469)
Northstar
SINTEF ID: 2015-
0469
Fresh oil
Northstar
SINTEF ID: 2015-0469
150°C+ residue
Northstar
SINTEF ID: 2015-0469
200°C+ residue
Northstar
SINTEF ID: 2015-0469
250°C+ residue
19
Figure 3.6. GC/FID chromatogram of the fresh Wide Range Gasoil (SINTEF ID: 2016-0106)
WRG
SINTEF ID: 2016-0469
Fresh
UCM
WRG
SINTEF ID: 2016-0469
250°C+
20
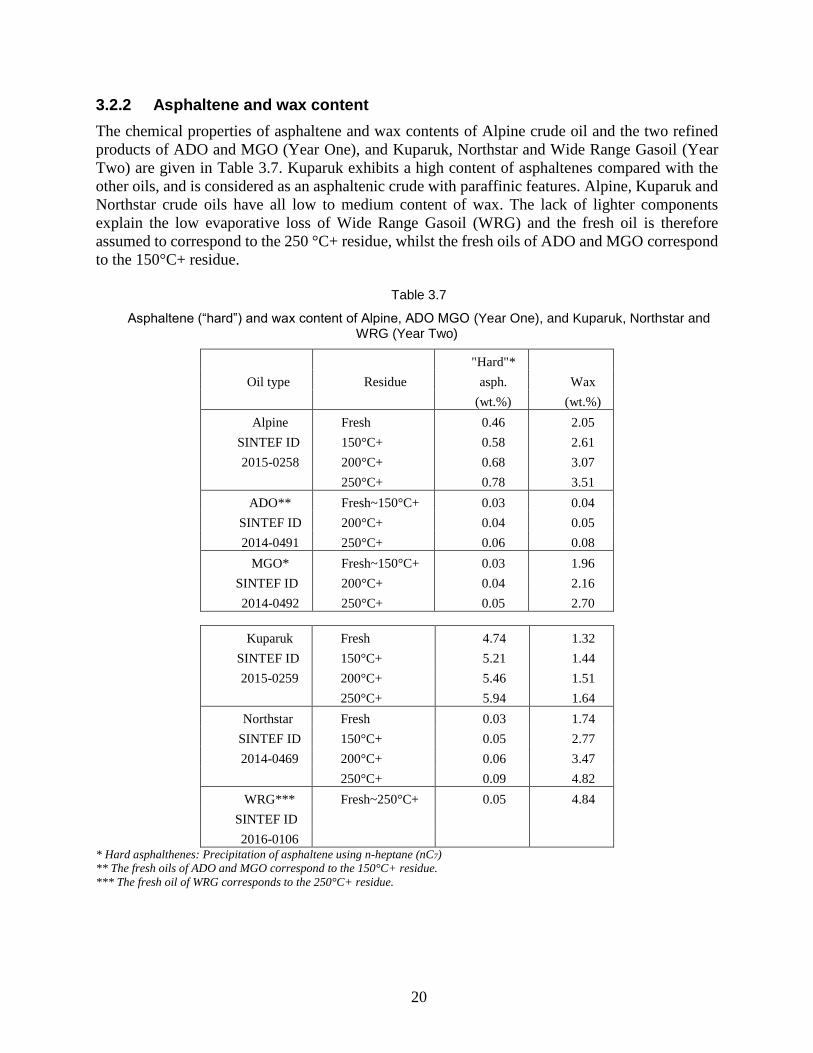
3.2.2 Asphaltene and wax content
The chemical properties of asphaltene and wax contents of Alpine crude oil and the two refined
products of ADO and MGO (Year One), and Kuparuk, Northstar and Wide Range Gasoil (Year
Two) are given in Table 3.7. Kuparuk exhibits a high content of asphaltenes compared with the
other oils, and is considered as an asphaltenic crude with paraffinic features. Alpine, Kuparuk and
Northstar crude oils have all low to medium content of wax. The lack of lighter components
explain the low evaporative loss of Wide Range Gasoil (WRG) and the fresh oil is therefore
assumed to correspond to the 250 °C+ residue, whilst the fresh oils of ADO and MGO correspond
to the 150°C+ residue.
Table 3.7
Asphaltene (“hard”) and wax content of Alpine, ADO MGO (Year One), and Kuparuk, Northstar and WRG (Year Two)
"Hard"*
Oil type Residue asph. Wax
(wt.%) (wt.%)
Alpine Fresh 0.46 2.05
SINTEF ID 150°C+ 0.58 2.61
2015-0258 200°C+ 0.68 3.07
250°C+ 0.78 3.51
ADO** Fresh~150°C+ 0.03 0.04
SINTEF ID 200°C+ 0.04 0.05
2014-0491 250°C+ 0.06 0.08
MGO* Fresh~150°C+ 0.03 1.96
SINTEF ID 200°C+ 0.04 2.16
2014-0492 250°C+ 0.05 2.70
Kuparuk Fresh 4.74 1.32
SINTEF ID 150°C+ 5.21 1.44
2015-0259 200°C+ 5.46 1.51
250°C+ 5.94 1.64
Northstar Fresh 0.03 1.74
SINTEF ID 150°C+ 0.05 2.77
2014-0469 200°C+ 0.06 3.47
250°C+ 0.09 4.82
WRG*** Fresh~250°C+ 0.05 4.84
SINTEF ID
2016-0106 * Hard asphalthenes: Precipitation of asphaltene using n-heptane (nC7)
** The fresh oils of ADO and MGO correspond to the 150°C+ residue.
*** The fresh oil of WRG corresponds to the 250°C+ residue.
21
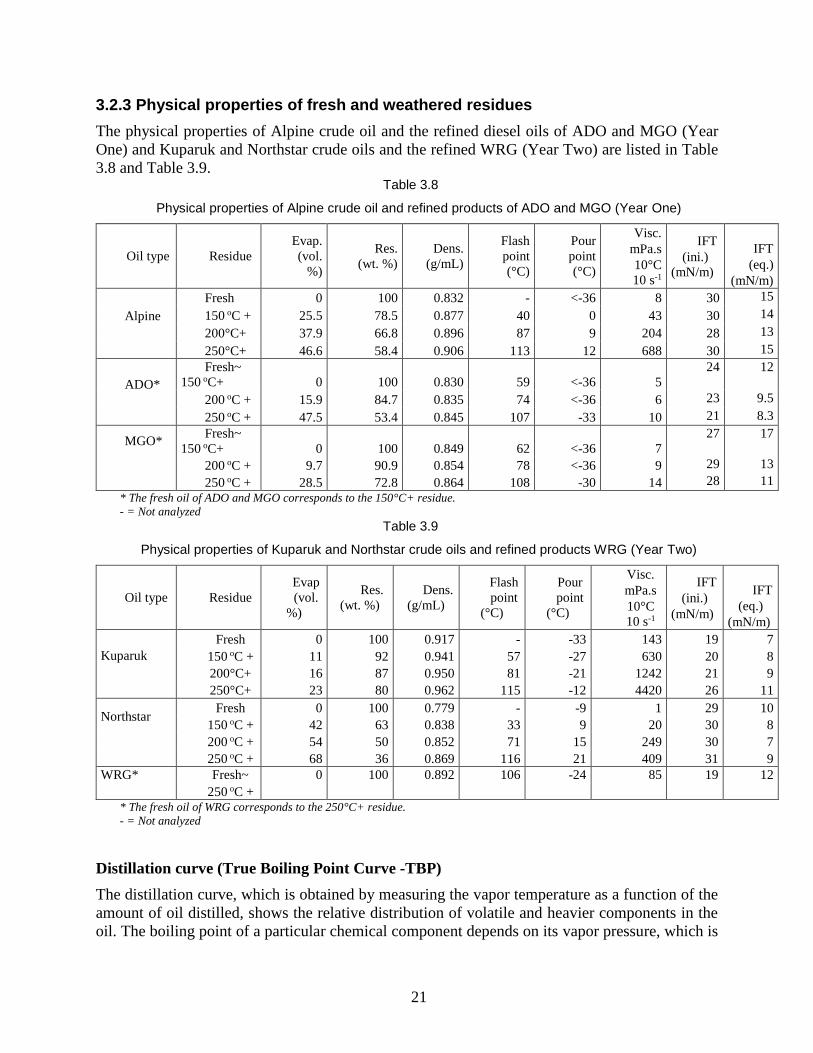
3.2.3 Physical properties of fresh and weathered residues
The physical properties of Alpine crude oil and the refined diesel oils of ADO and MGO (Year
One) and Kuparuk and Northstar crude oils and the refined WRG (Year Two) are listed in Table
3.8 and Table 3.9. Table 3.8
Physical properties of Alpine crude oil and refined products of ADO and MGO (Year One)
Oil type Residue
Evap.
(vol.
%)
Res.
(wt. %)
Dens.
(g/mL)
Flash
point
(°C)
Pour
point
(°C)
Visc.
mPa.s
10°C
10 s-1
IFT
(ini.)
(mN/m)
IFT
(eq.)
(mN/m)
Alpine
Fresh 0 100 0.832 - <-36 8 30 15
150 oC + 25.5 78.5 0.877 40 0 43 30 14
200°C+ 37.9 66.8 0.896 87 9 204 28 13
250°C+ 46.6 58.4 0.906 113 12 688 30 15
ADO*
Fresh~
150 oC+ 0 100 0.830 59 <-36 5
24 12
200 oC + 15.9 84.7 0.835 74 <-36 6 23 9.5
250 oC + 47.5 53.4 0.845 107 -33 10 21 8.3
MGO* Fresh~
150 oC+ 0 100 0.849 62 <-36 7
27 17
200 oC + 9.7 90.9 0.854 78 <-36 9 29 13
250 oC + 28.5 72.8 0.864 108 -30 14 28 11
* The fresh oil of ADO and MGO corresponds to the 150°C+ residue.
- = Not analyzed
Table 3.9
Physical properties of Kuparuk and Northstar crude oils and refined products WRG (Year Two)
Oil type Residue
Evap
(vol.
%)
Res.
(wt. %)
Dens.
(g/mL)
Flash
point
(°C)
Pour
point
(°C)
Visc.
mPa.s
10°C
10 s-1
IFT
(ini.)
(mN/m)
IFT
(eq.)
(mN/m)
Fresh 0 100 0.917 - -33 143 19 7
Kuparuk 150 oC + 11 92 0.941 57 -27 630 20 8
200°C+ 16 87 0.950 81 -21 1242 21 9
250°C+ 23 80 0.962 115 -12 4420 26 11
Northstar
Fresh 0 100 0.779 - -9 1 29 10
150 oC + 42 63 0.838 33 9 20 30 8
200 oC + 54 50 0.852 71 15 249 30 7
250 oC + 68 36 0.869 116 21 409 31 9
WRG* Fresh~ 0 100 0.892 106 -24 85 19 12
250 oC +
* The fresh oil of WRG corresponds to the 250°C+ residue.
- = Not analyzed
Distillation curve (True Boiling Point Curve -TBP)
The distillation curve, which is obtained by measuring the vapor temperature as a function of the
amount of oil distilled, shows the relative distribution of volatile and heavier components in the
oil. The boiling point of a particular chemical component depends on its vapor pressure, which is
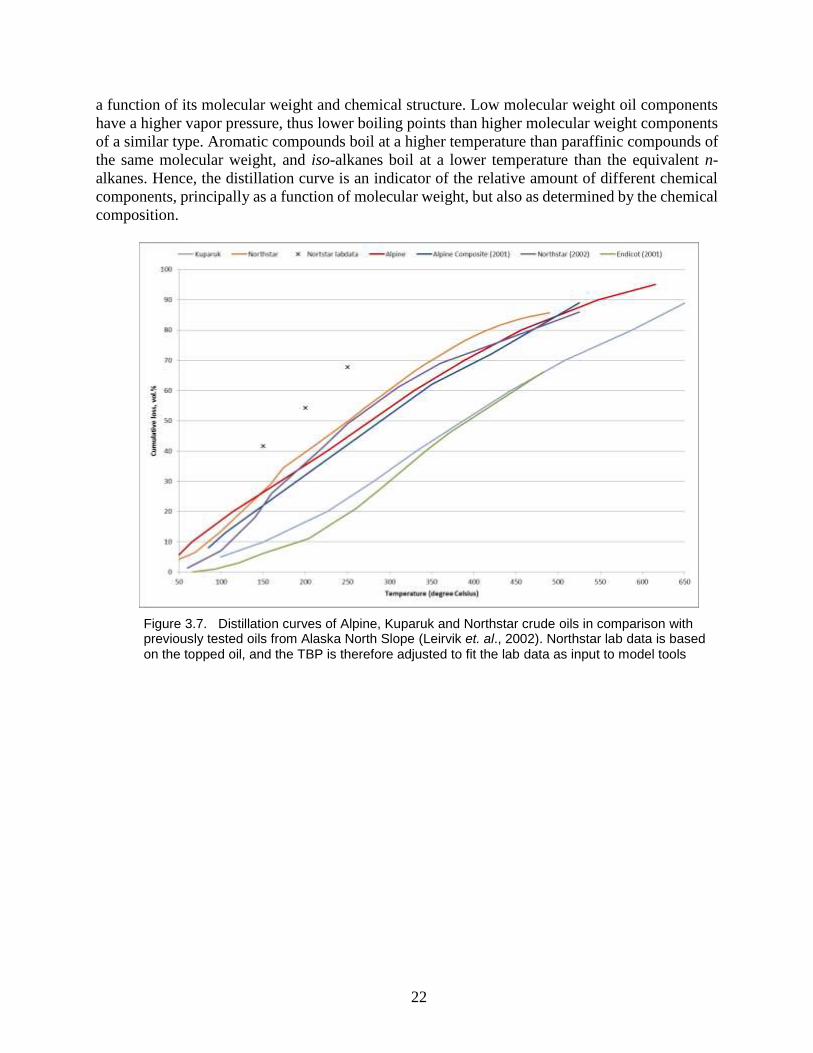
22
a function of its molecular weight and chemical structure. Low molecular weight oil components
have a higher vapor pressure, thus lower boiling points than higher molecular weight components
of a similar type. Aromatic compounds boil at a higher temperature than paraffinic compounds of
the same molecular weight, and iso-alkanes boil at a lower temperature than the equivalent n-
alkanes. Hence, the distillation curve is an indicator of the relative amount of different chemical
components, principally as a function of molecular weight, but also as determined by the chemical
composition.
Figure 3.7. Distillation curves of Alpine, Kuparuk and Northstar crude oils in comparison with previously tested oils from Alaska North Slope (Leirvik et. al., 2002). Northstar lab data is based on the topped oil, and the TBP is therefore adjusted to fit the lab data as input to model tools
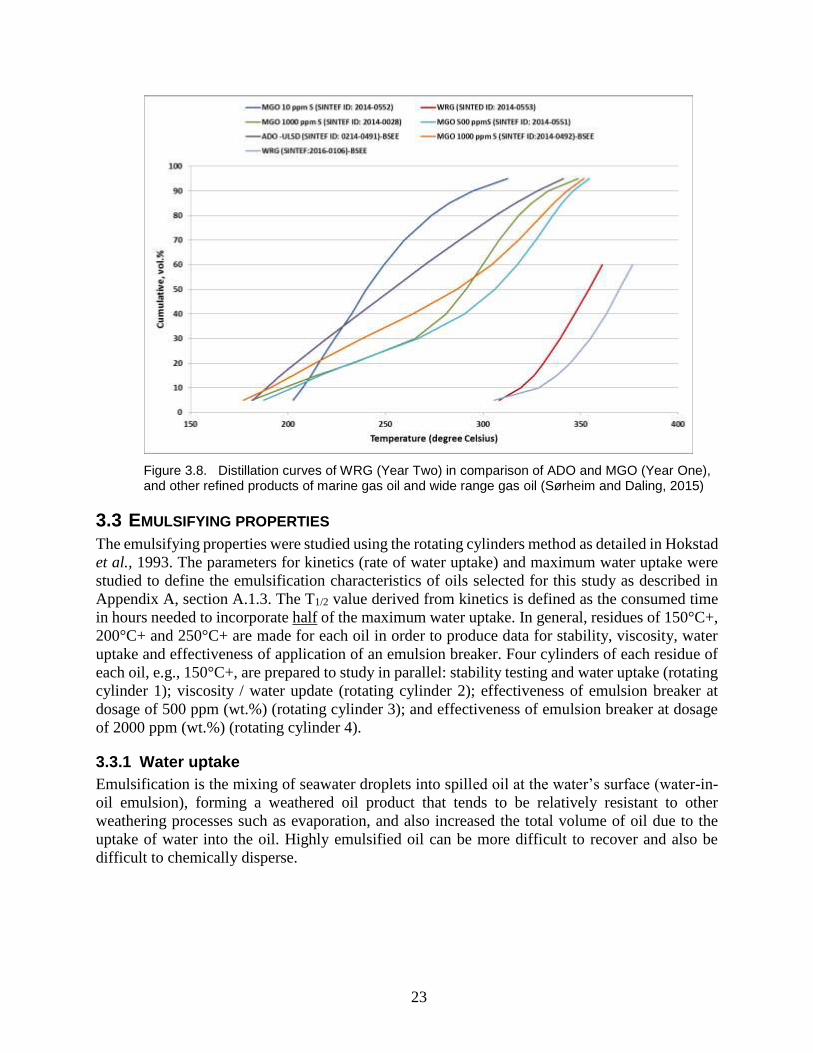
23
Figure 3.8. Distillation curves of WRG (Year Two) in comparison of ADO and MGO (Year One), and other refined products of marine gas oil and wide range gas oil (Sørheim and Daling, 2015)
3.3 EMULSIFYING PROPERTIES
The emulsifying properties were studied using the rotating cylinders method as detailed in Hokstad
et al., 1993. The parameters for kinetics (rate of water uptake) and maximum water uptake were
studied to define the emulsification characteristics of oils selected for this study as described in
Appendix A, section A.1.3. The T1/2 value derived from kinetics is defined as the consumed time
in hours needed to incorporate half of the maximum water uptake. In general, residues of 150°C+,
200°C+ and 250°C+ are made for each oil in order to produce data for stability, viscosity, water
uptake and effectiveness of application of an emulsion breaker. Four cylinders of each residue of
each oil, e.g., 150°C+, are prepared to study in parallel: stability testing and water uptake (rotating
cylinder 1); viscosity / water update (rotating cylinder 2); effectiveness of emulsion breaker at
dosage of 500 ppm (wt.%) (rotating cylinder 3); and effectiveness of emulsion breaker at dosage
of 2000 ppm (wt.%) (rotating cylinder 4).
3.3.1 Water uptake
Emulsification is the mixing of seawater droplets into spilled oil at the water’s surface (water-in-
oil emulsion), forming a weathered oil product that tends to be relatively resistant to other
weathering processes such as evaporation, and also increased the total volume of oil due to the
uptake of water into the oil. Highly emulsified oil can be more difficult to recover and also be
difficult to chemically disperse.
24
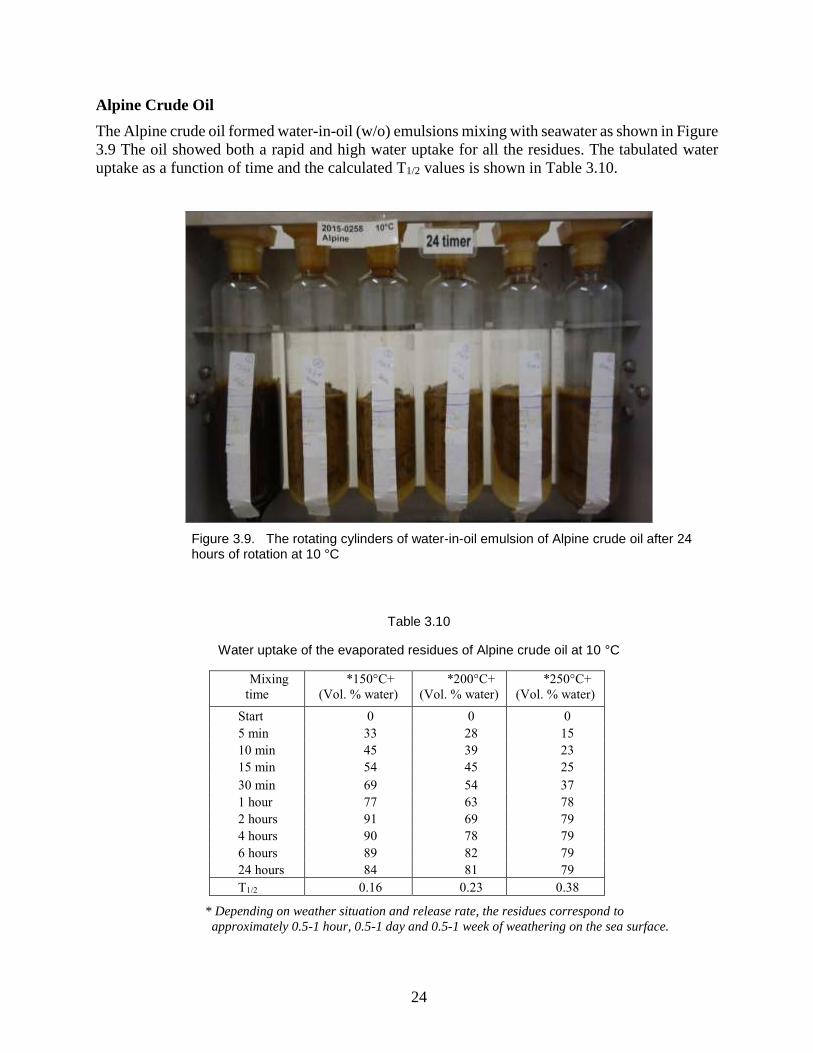
Alpine Crude Oil
The Alpine crude oil formed water-in-oil (w/o) emulsions mixing with seawater as shown in Figure
3.9 The oil showed both a rapid and high water uptake for all the residues. The tabulated water
uptake as a function of time and the calculated T1/2 values is shown in Table 3.10.
Figure 3.9. The rotating cylinders of water-in-oil emulsion of Alpine crude oil after 24 hours of rotation at 10 °C
Table 3.10
Water uptake of the evaporated residues of Alpine crude oil at 10 °C
Mixing
time
*150°C+
(Vol. % water)
*200°C+
(Vol. % water)
*250°C+
(Vol. % water)
Start 0 0 0
5 min 33 28 15
10 min 45 39 23
15 min 54 45 25
30 min 69 54 37
1 hour 77 63 78
2 hours 91 69 79
4 hours 90 78 79
6 hours 89 82 79
24 hours 84 81 79
T1/2 0.16 0.23 0.38
* Depending on weather situation and release rate, the residues correspond to
approximately 0.5-1 hour, 0.5-1 day and 0.5-1 week of weathering on the sea surface.
25
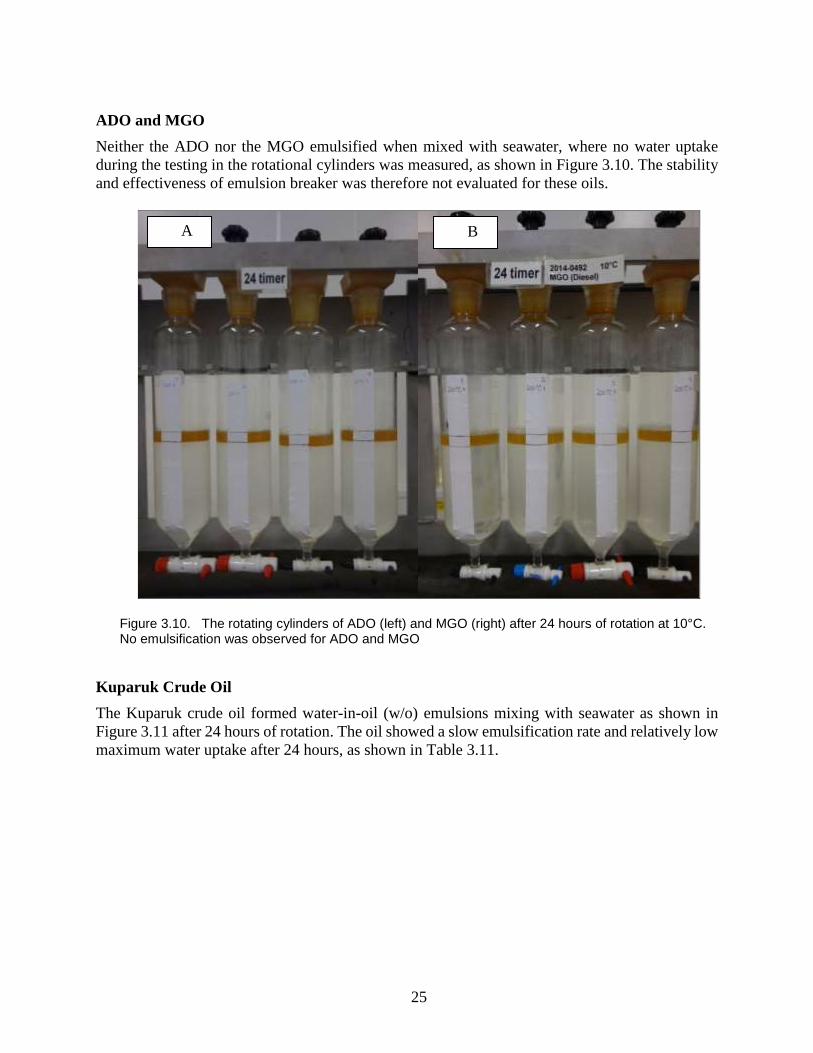
ADO and MGO
Neither the ADO nor the MGO emulsified when mixed with seawater, where no water uptake
during the testing in the rotational cylinders was measured, as shown in Figure 3.10. The stability
and effectiveness of emulsion breaker was therefore not evaluated for these oils.
Figure 3.10. The rotating cylinders of ADO (left) and MGO (right) after 24 hours of rotation at 10°C. No emulsification was observed for ADO and MGO
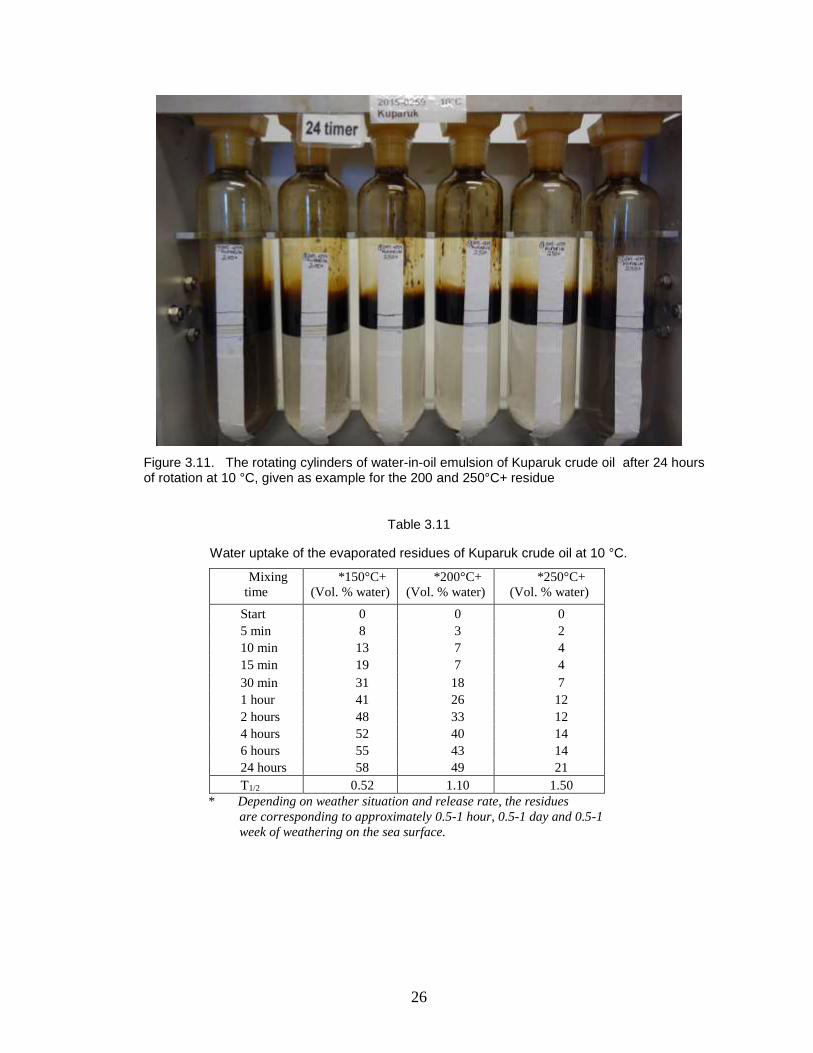
Kuparuk Crude Oil
The Kuparuk crude oil formed water-in-oil (w/o) emulsions mixing with seawater as shown in
Figure 3.11 after 24 hours of rotation. The oil showed a slow emulsification rate and relatively low
maximum water uptake after 24 hours, as shown in Table 3.11.
A
DO B
GO
26
Figure 3.11. The rotating cylinders of water-in-oil emulsion of Kuparuk crude oil after 24 hours of rotation at 10 °C, given as example for the 200 and 250°C+ residue
Table 3.11
Water uptake of the evaporated residues of Kuparuk crude oil at 10 °C.
Mixing
time
*150°C+
(Vol. % water)
*200°C+
(Vol. % water)
*250°C+
(Vol. % water)
Start 0 0 0
5 min 8 3 2
10 min 13 7 4
15 min 19 7 4
30 min 31 18 7
1 hour 41 26 12
2 hours 48 33 12
4 hours 52 40 14
6 hours 55 43 14
24 hours 58 49 21
T1/2 0.52 1.10 1.50
* Depending on weather situation and release rate, the residues
are corresponding to approximately 0.5-1 hour, 0.5-1 day and 0.5-1
week of weathering on the sea surface.
27
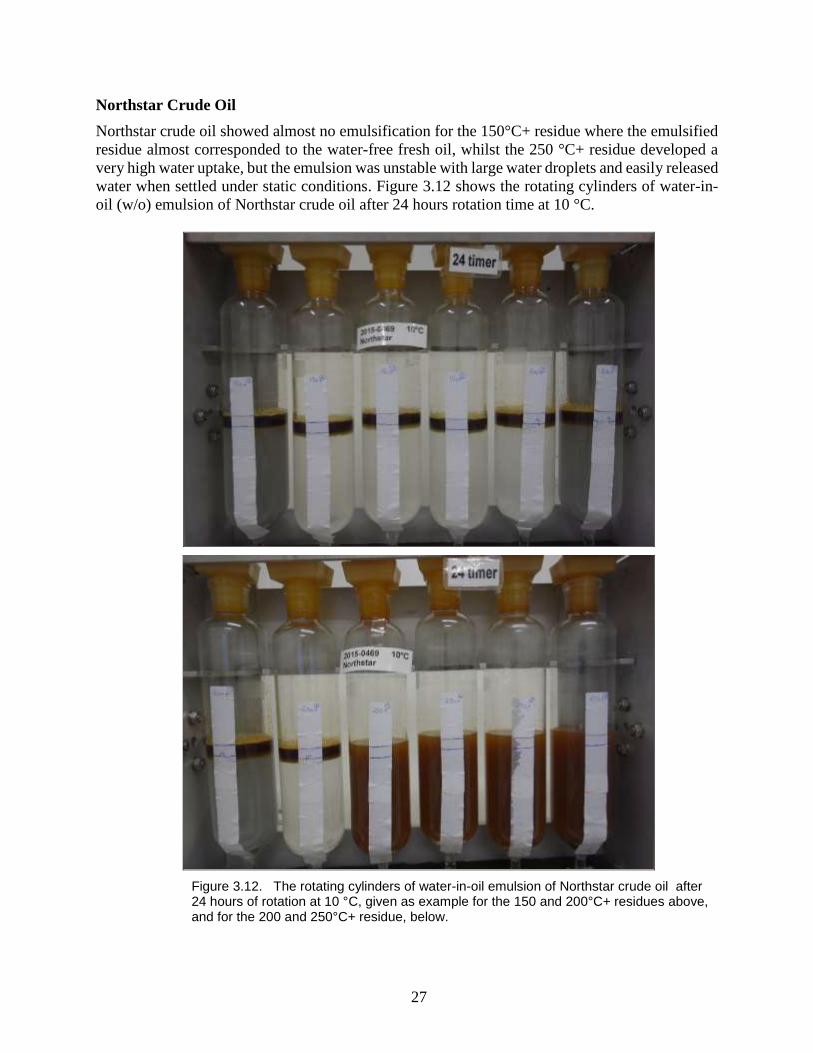
Northstar Crude Oil
Northstar crude oil showed almost no emulsification for the 150°C+ residue where the emulsified
residue almost corresponded to the water-free fresh oil, whilst the 250 °C+ residue developed a
very high water uptake, but the emulsion was unstable with large water droplets and easily released
water when settled under static conditions. Figure 3.12 shows the rotating cylinders of water-in-
oil (w/o) emulsion of Northstar crude oil after 24 hours rotation time at 10 °C.
Figure 3.12. The rotating cylinders of water-in-oil emulsion of Northstar crude oil after 24 hours of rotation at 10 °C, given as example for the 150 and 200°C+ residues above, and for the 200 and 250°C+ residue, below.
28
Table 3.12
Water uptake of the evaporated residues of Northstar crude oil at 10 °C.
Mixing
time
*150°C+
(Vol. % water)
*200°C+
(Vol. % water)
*250°C+
(Vol. % water)
Start 0 0 0
5 min 3 47 81
10 min 3 44 88
15 min 3 44 89
30 min 3 39 90
1 hour 3 33 90
2 hours 3 33 90
4 hours 3 31 90
6 hours 3 26 90
24 hours 3 26 90**
T1/2 0.01 0.01 0.03
* Depending on weather situation and release rate, the residues are corresponding
to approximately 0.5-1 hour, 0.5-1 day and 0.5-1 week of weathering on the sea surface. **~ 90 vol. % due to supersaturation in rotating cylinders and the very high water uptake is unlikely to happen
in a spill situation at sea.
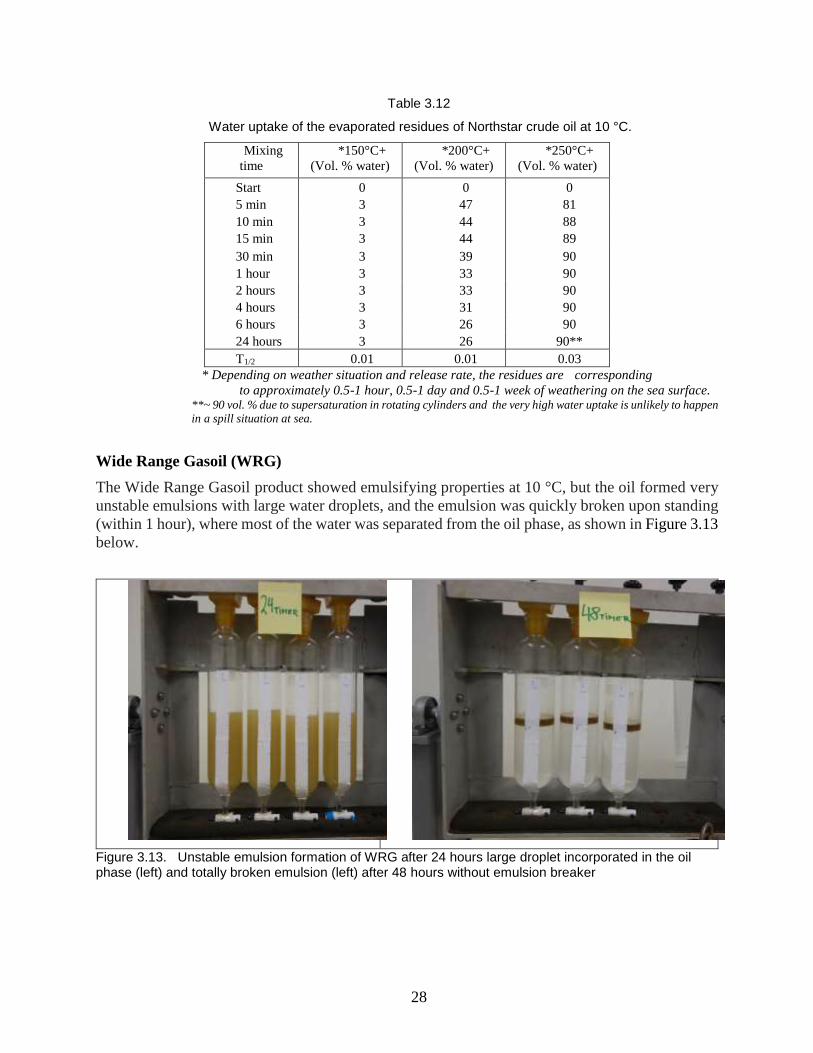
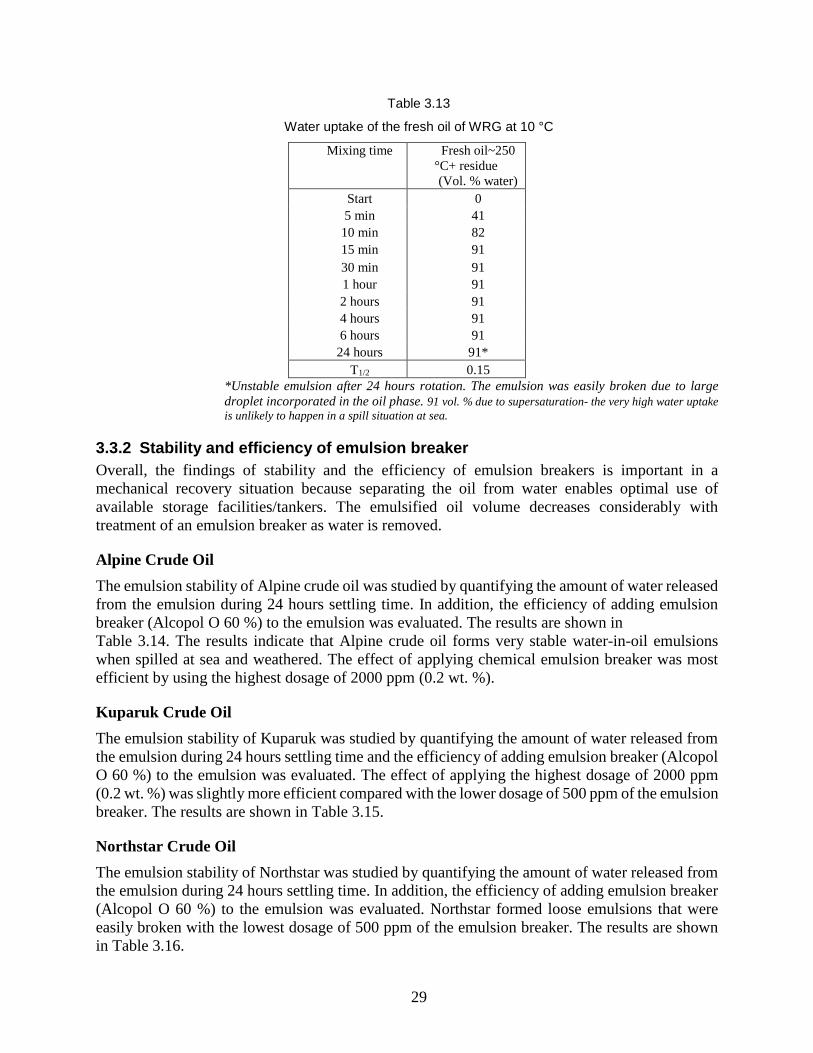
Wide Range Gasoil (WRG)
The Wide Range Gasoil product showed emulsifying properties at 10 °C, but the oil formed very
unstable emulsions with large water droplets, and the emulsion was quickly broken upon standing
(within 1 hour), where most of the water was separated from the oil phase, as shown in Figure 3.13
below.
Figure 3.13. Unstable emulsion formation of WRG after 24 hours large droplet incorporated in the oil phase (left) and totally broken emulsion (left) after 48 hours without emulsion breaker
29
Table 3.13
Water uptake of the fresh oil of WRG at 10 °C
Mixing time Fresh oil~250
°C+ residue
(Vol. % water)
Start 0
5 min 41
10 min 82
15 min 91
30 min 91
1 hour 91
2 hours 91
4 hours 91
6 hours 91
24 hours 91*
T1/2 0.15
*Unstable emulsion after 24 hours rotation. The emulsion was easily broken due to large
droplet incorporated in the oil phase. 91 vol. % due to supersaturation- the very high water uptake
is unlikely to happen in a spill situation at sea.
3.3.2 Stability and efficiency of emulsion breaker
Overall, the findings of stability and the efficiency of emulsion breakers is important in a
mechanical recovery situation because separating the oil from water enables optimal use of
available storage facilities/tankers. The emulsified oil volume decreases considerably with
treatment of an emulsion breaker as water is removed.
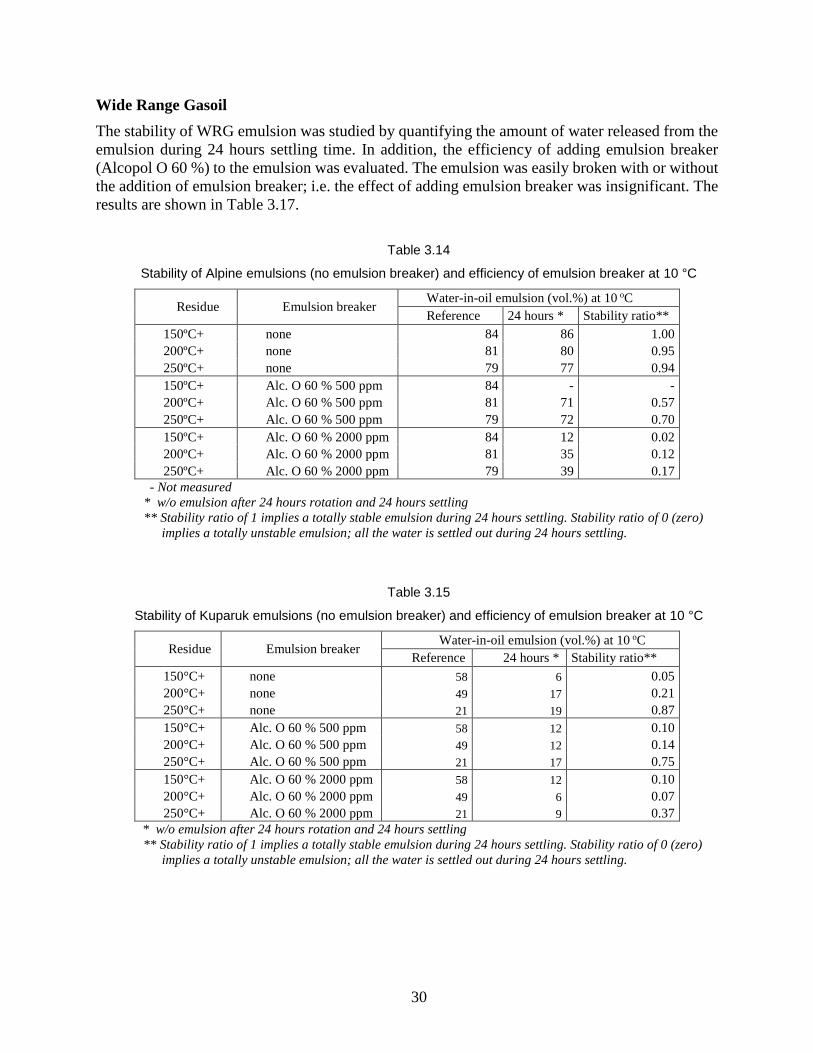
Alpine Crude Oil
The emulsion stability of Alpine crude oil was studied by quantifying the amount of water released
from the emulsion during 24 hours settling time. In addition, the efficiency of adding emulsion
breaker (Alcopol O 60 %) to the emulsion was evaluated. The results are shown in
Table 3.14. The results indicate that Alpine crude oil forms very stable water-in-oil emulsions
when spilled at sea and weathered. The effect of applying chemical emulsion breaker was most
efficient by using the highest dosage of 2000 ppm (0.2 wt. %).
Kuparuk Crude Oil
The emulsion stability of Kuparuk was studied by quantifying the amount of water released from
the emulsion during 24 hours settling time and the efficiency of adding emulsion breaker (Alcopol
O 60 %) to the emulsion was evaluated. The effect of applying the highest dosage of 2000 ppm
(0.2 wt. %) was slightly more efficient compared with the lower dosage of 500 ppm of the emulsion
breaker. The results are shown in Table 3.15.
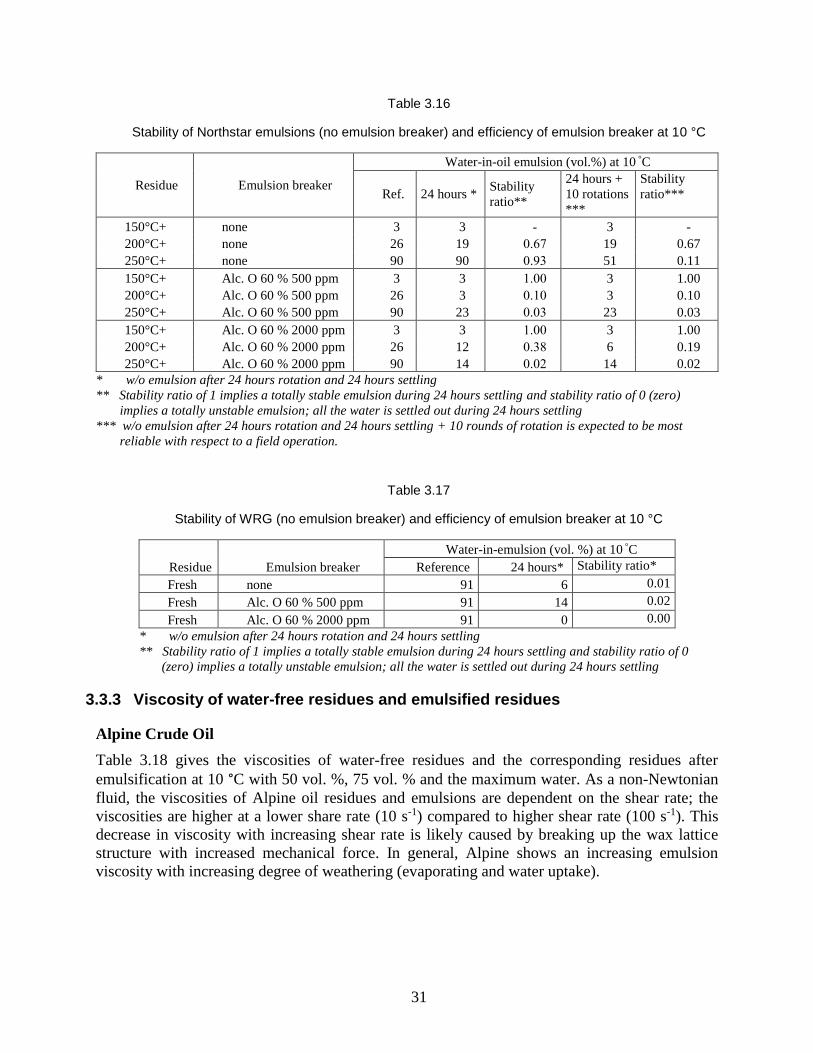
Northstar Crude Oil
The emulsion stability of Northstar was studied by quantifying the amount of water released from
the emulsion during 24 hours settling time. In addition, the efficiency of adding emulsion breaker
(Alcopol O 60 %) to the emulsion was evaluated. Northstar formed loose emulsions that were
easily broken with the lowest dosage of 500 ppm of the emulsion breaker. The results are shown
in Table 3.16.
30
Wide Range Gasoil
The stability of WRG emulsion was studied by quantifying the amount of water released from the
emulsion during 24 hours settling time. In addition, the efficiency of adding emulsion breaker
(Alcopol O 60 %) to the emulsion was evaluated. The emulsion was easily broken with or without
the addition of emulsion breaker; i.e. the effect of adding emulsion breaker was insignificant. The
results are shown in Table 3.17.
Table 3.14
Stability of Alpine emulsions (no emulsion breaker) and efficiency of emulsion breaker at 10 °C
Residue Emulsion breaker Water-in-oil emulsion (vol.%) at 10 oC
Reference 24 hours * Stability ratio**
150ºC+ none 84 86 1.00
200ºC+ none 81 80 0.95
250ºC+ none 79 77 0.94
150ºC+ Alc. O 60 % 500 ppm 84 - -
200ºC+ Alc. O 60 % 500 ppm 81 71 0.57
250ºC+ Alc. O 60 % 500 ppm 79 72 0.70
150ºC+ Alc. O 60 % 2000 ppm 84 12 0.02
200ºC+ Alc. O 60 % 2000 ppm 81 35 0.12
250ºC+ Alc. O 60 % 2000 ppm 79 39 0.17
- Not measured
* w/o emulsion after 24 hours rotation and 24 hours settling
** Stability ratio of 1 implies a totally stable emulsion during 24 hours settling. Stability ratio of 0 (zero)
implies a totally unstable emulsion; all the water is settled out during 24 hours settling.
Table 3.15
Stability of Kuparuk emulsions (no emulsion breaker) and efficiency of emulsion breaker at 10 °C
Residue Emulsion breaker Water-in-oil emulsion (vol.%) at 10 oC
Reference 24 hours * Stability ratio**
150°C+ none 58 6 0.05
200°C+ none 49 17 0.21
250°C+ none 21 19 0.87
150°C+ Alc. O 60 % 500 ppm 58 12 0.10
200°C+ Alc. O 60 % 500 ppm 49 12 0.14
250°C+ Alc. O 60 % 500 ppm 21 17 0.75
150°C+ Alc. O 60 % 2000 ppm 58 12 0.10
200°C+ Alc. O 60 % 2000 ppm 49 6 0.07
250°C+ Alc. O 60 % 2000 ppm 21 9 0.37
* w/o emulsion after 24 hours rotation and 24 hours settling
** Stability ratio of 1 implies a totally stable emulsion during 24 hours settling. Stability ratio of 0 (zero)
implies a totally unstable emulsion; all the water is settled out during 24 hours settling.
31
Table 3.16
Stability of Northstar emulsions (no emulsion breaker) and efficiency of emulsion breaker at 10 °C
Residue Emulsion breaker
Water-in-oil emulsion (vol.%) at 10 °C
Ref. 24 hours * Stability
ratio**
24 hours +
10 rotations
***
Stability
ratio***
150°C+ none 3 3 - 3 -
200°C+ none 26 19 0.67 19 0.67
250°C+ none 90 90 0.93 51 0.11
150°C+ Alc. O 60 % 500 ppm 3 3 1.00 3 1.00
200°C+ Alc. O 60 % 500 ppm 26 3 0.10 3 0.10
250°C+ Alc. O 60 % 500 ppm 90 23 0.03 23 0.03
150°C+ Alc. O 60 % 2000 ppm 3 3 1.00 3 1.00
200°C+ Alc. O 60 % 2000 ppm 26 12 0.38 6 0.19
250°C+ Alc. O 60 % 2000 ppm 90 14 0.02 14 0.02
* w/o emulsion after 24 hours rotation and 24 hours settling
** Stability ratio of 1 implies a totally stable emulsion during 24 hours settling and stability ratio of 0 (zero)
implies a totally unstable emulsion; all the water is settled out during 24 hours settling
*** w/o emulsion after 24 hours rotation and 24 hours settling + 10 rounds of rotation is expected to be most
reliable with respect to a field operation.
Table 3.17
Stability of WRG (no emulsion breaker) and efficiency of emulsion breaker at 10 °C
Residue Emulsion breaker
Water-in-emulsion (vol. %) at 10 °C
Reference 24 hours* Stability ratio*
Fresh none 91 6 0.01
Fresh Alc. O 60 % 500 ppm 91 14 0.02
Fresh Alc. O 60 % 2000 ppm 91 0 0.00
* w/o emulsion after 24 hours rotation and 24 hours settling
** Stability ratio of 1 implies a totally stable emulsion during 24 hours settling and stability ratio of 0
(zero) implies a totally unstable emulsion; all the water is settled out during 24 hours settling
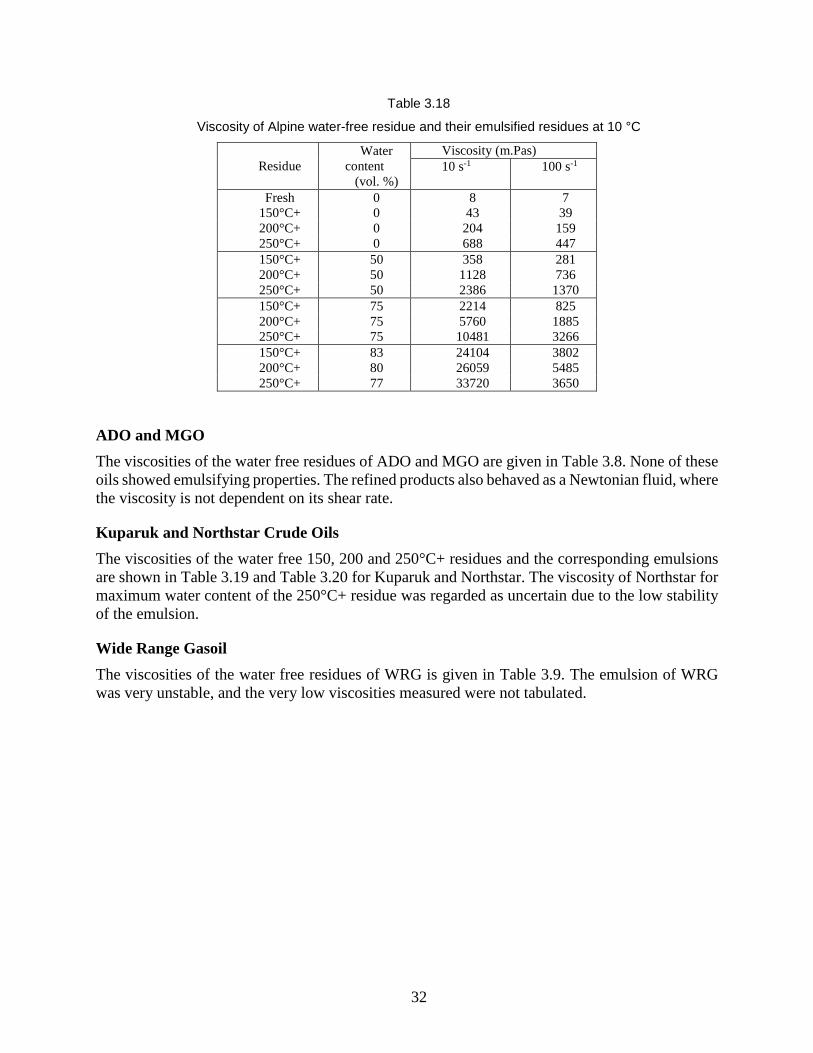
3.3.3 Viscosity of water-free residues and emulsified residues
Alpine Crude Oil
Table 3.18 gives the viscosities of water-free residues and the corresponding residues after
emulsification at 10 °C with 50 vol. %, 75 vol. % and the maximum water. As a non-Newtonian
fluid, the viscosities of Alpine oil residues and emulsions are dependent on the shear rate; the
viscosities are higher at a lower share rate (10 s-1) compared to higher shear rate (100 s-1). This
decrease in viscosity with increasing shear rate is likely caused by breaking up the wax lattice
structure with increased mechanical force. In general, Alpine shows an increasing emulsion
viscosity with increasing degree of weathering (evaporating and water uptake).
32
Table 3.18
Viscosity of Alpine water-free residue and their emulsified residues at 10 °C
Residue
Water
content
(vol. %)
Viscosity (m.Pas)
10 s-1
100 s-1
Fresh 0 8 7
150°C+ 0 43 39
200°C+ 0 204 159
250°C+ 0 688 447
150°C+ 50 358 281
200°C+ 50 1128 736
250°C+ 50 2386 1370
150°C+ 75 2214 825
200°C+ 75 5760 1885
250°C+ 75 10481 3266
150°C+ 83 24104 3802
200°C+ 80 26059 5485
250°C+ 77 33720 3650
ADO and MGO
The viscosities of the water free residues of ADO and MGO are given in Table 3.8. None of these
oils showed emulsifying properties. The refined products also behaved as a Newtonian fluid, where
the viscosity is not dependent on its shear rate.
Kuparuk and Northstar Crude Oils
The viscosities of the water free 150, 200 and 250°C+ residues and the corresponding emulsions
are shown in Table 3.19 and Table 3.20 for Kuparuk and Northstar. The viscosity of Northstar for
maximum water content of the 250°C+ residue was regarded as uncertain due to the low stability
of the emulsion.
Wide Range Gasoil
The viscosities of the water free residues of WRG is given in Table 3.9. The emulsion of WRG
was very unstable, and the very low viscosities measured were not tabulated.
33
Table 3.19
Viscosity of Kuparuk water-free residue and their emulsified residues at 10 °C
Residue
Water
content Viscosity Viscosity
(m.Pas) (m.Pas)
(vol. %) (10 s⁻¹) (100 s⁻¹)
Fresh 0 143 134
150°C+ 0 630 613
200°C+ 0 1242 1230
250°C+ 0 4420 4410
150°C+ 50 3799 1978
200°C+ 50 7380 3379
250°C+ 50 22497 1867
150°C+ 75 6546 767
200°C+ 65* 14306 2736
250°C+ 27* 9758 4977
150°C+ 60 4979 2049
200°C+ 52 7045 2975
250°C+ 23 8497 4524
* The residue did not reach 75 % vol. water uptake and hence influence the viscosities.
Table 3.20
Viscosity of Northstar water-free residue and their emulsified residues at 10 °C
Residue
Water
content Viscosity Viscosity
(m.Pas) (m.Pas)
(vol. %) (10 s⁻¹) (100 s⁻¹)
Fresh 0 1 2
150°C+ 0 20 10
200°C+ 0 249 57
250°C+ 0 409 152
150°C+ < 50* 16 8
200°C+ <50* 81 24
250°C+ <50* 60 39
150°C+ <75* 14 8
200°C+ <75* 55 18
250°C+ <75* 104 33
150°C+ 3 17 8
200°C+ 6 87 25
250°C+ - - 8
*The residue did not reach 50 and 75 % vol. water uptake.
- Unstable emulsion
34
4. MESO-SCALE FLUME LABORATORY TESTING RESULTS
The description of the meso-scale flume is given in Appendix A.2. This section is organized by oil
type and provides an overview of the tabulated results of the meso-flume testing, visual
observations, and estimated mass balance of each of the six oils that were tested.
The estimated mass balance of each oil is presented for each oil in Figures 4.1, 4.3, 4.6, 4.8, 4.10,
4.12.
The main processes of the mass balance for oil spilled at sea are:
Evaporative loss
Surface oil
Dispersed oil into the water column
In addition, the mass balances from the flume basin also includes the estimated parameters:
Amount of oil sampled
Amount of oil sticking to the flume wall
The meso-scale testing provides valuable operational information about the oil's behavior. The
flume testing is therefore considered a supplement to the bench-scale laboratory testing. The
experimental results obtained for Alpine crude oil, ADO and MGO (refined products) from Year
One and Kuparuk and Northstar crude oils, and WRG (refined product) from Year Two conducted
at 10 °C are presented below.
4.1 ALPINE CRUDE OIL
An overview of the tabulated results from the meso-scale flume testing is given in Table 4.1 for
Alpine crude oil.
35
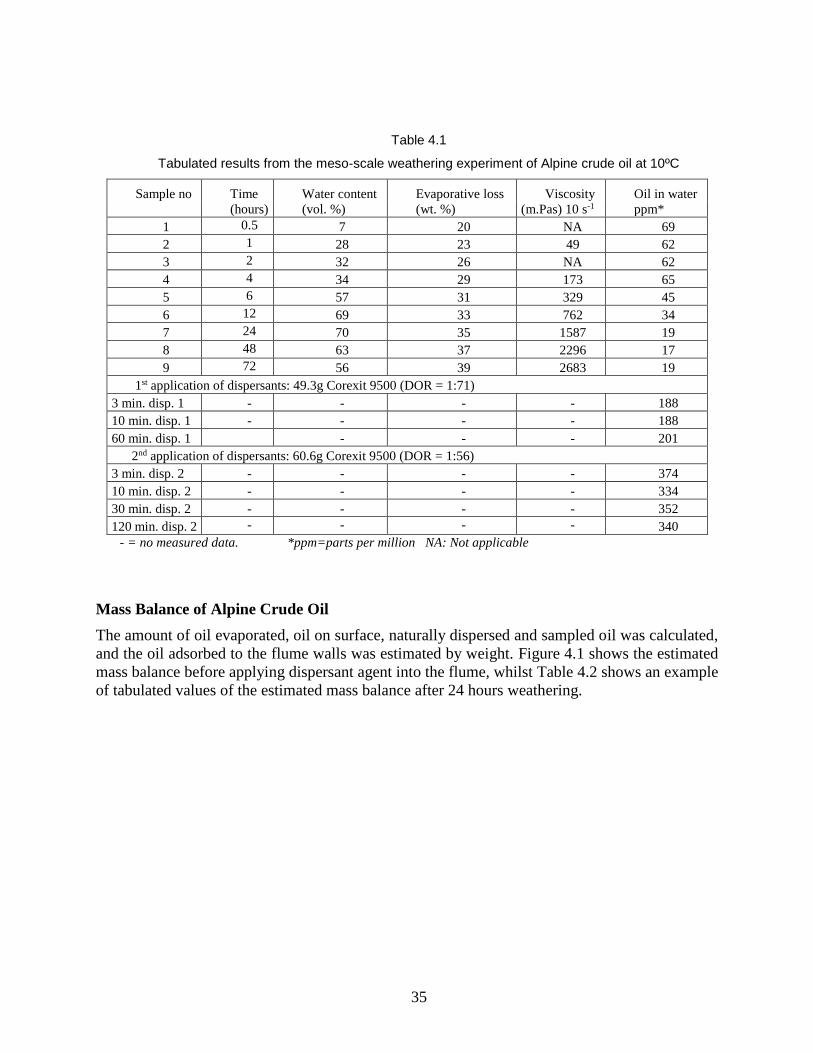
Table 4.1
Tabulated results from the meso-scale weathering experiment of Alpine crude oil at 10ºC
Sample no Time Water content Evaporative loss Viscosity Oil in water
(hours) (vol. %) (wt. %) (m.Pas) 10 s-1 ppm*
1 0.5 7 20 NA 69
2 1 28 23 49 62
3 2 32 26 NA 62
4 4 34 29 173 65
5 6 57 31 329 45
6 12 69 33 762 34
7 24 70 35 1587 19
8 48 63 37 2296 17
9 72 56 39 2683 19
1st application of dispersants: 49.3g Corexit 9500 (DOR = 1:71)
3 min. disp. 1 - - - - 188
10 min. disp. 1 - - - - 188
60 min. disp. 1 - - - 201
2nd application of dispersants: 60.6g Corexit 9500 (DOR = 1:56)
3 min. disp. 2 - - - - 374
10 min. disp. 2 - - - - 334
30 min. disp. 2 - - - - 352
120 min. disp. 2 - - - - 340
- = no measured data. *ppm=parts per million NA: Not applicable
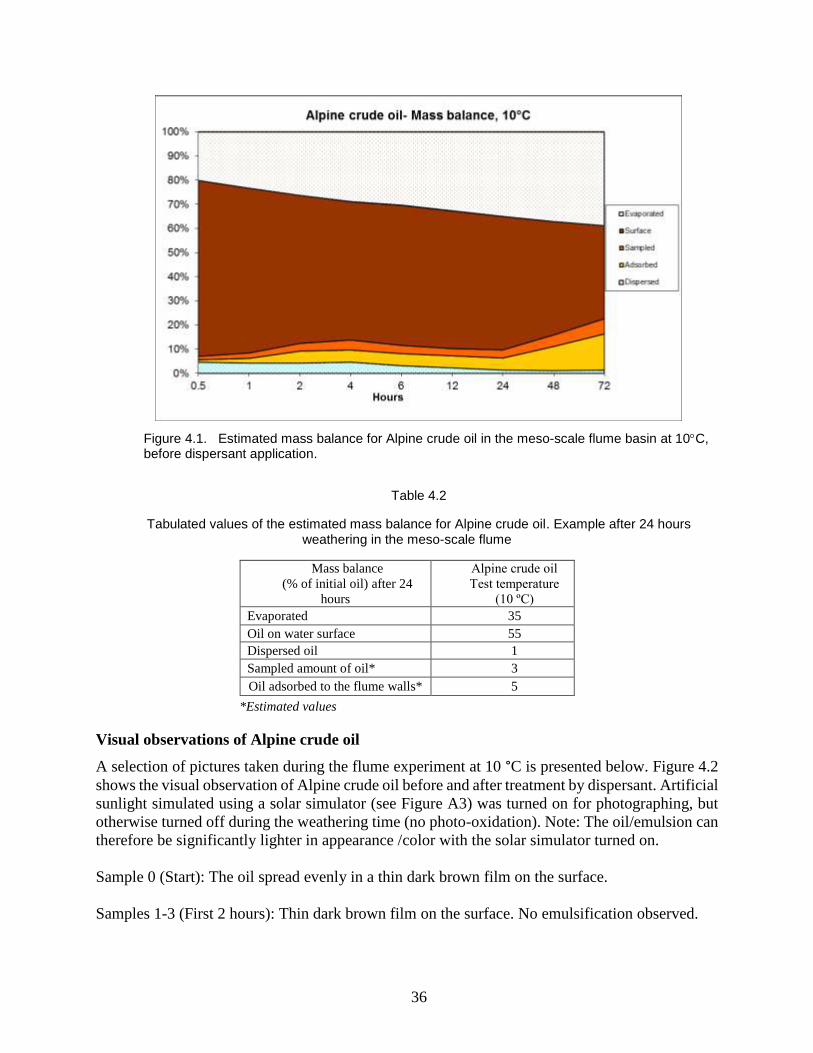
Mass Balance of Alpine Crude Oil
The amount of oil evaporated, oil on surface, naturally dispersed and sampled oil was calculated,
and the oil adsorbed to the flume walls was estimated by weight. Figure 4.1 shows the estimated
mass balance before applying dispersant agent into the flume, whilst Table 4.2 shows an example
of tabulated values of the estimated mass balance after 24 hours weathering.
36
Figure 4.1. Estimated mass balance for Alpine crude oil in the meso-scale flume basin at 10C, before dispersant application.
Table 4.2
Tabulated values of the estimated mass balance for Alpine crude oil. Example after 24 hours weathering in the meso-scale flume
Mass balance
(% of initial oil) after 24
hours
Alpine crude oil
Test temperature
(10 ºC)
Evaporated 35
Oil on water surface 55
Dispersed oil 1
Sampled amount of oil* 3
Oil adsorbed to the flume walls* 5
*Estimated values
Visual observations of Alpine crude oil
A selection of pictures taken during the flume experiment at 10 °C is presented below. Figure 4.2
shows the visual observation of Alpine crude oil before and after treatment by dispersant. Artificial
sunlight simulated using a solar simulator (see Figure A3) was turned on for photographing, but
otherwise turned off during the weathering time (no photo-oxidation). Note: The oil/emulsion can
therefore be significantly lighter in appearance /color with the solar simulator turned on.
Sample 0 (Start): The oil spread evenly in a thin dark brown film on the surface.
Samples 1-3 (First 2 hours): Thin dark brown film on the surface. No emulsification observed.
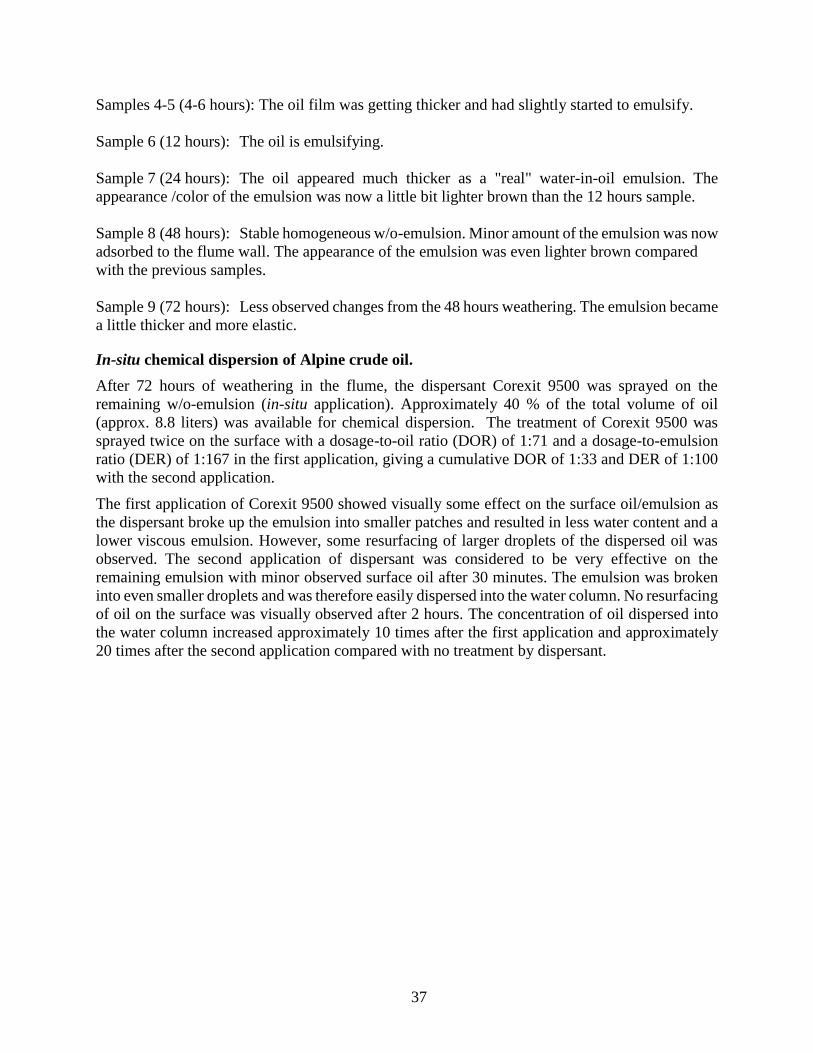
37
Samples 4-5 (4-6 hours): The oil film was getting thicker and had slightly started to emulsify.
Sample 6 (12 hours): The oil is emulsifying.
Sample 7 (24 hours): The oil appeared much thicker as a "real" water-in-oil emulsion. The
appearance /color of the emulsion was now a little bit lighter brown than the 12 hours sample.
Sample 8 (48 hours): Stable homogeneous w/o-emulsion. Minor amount of the emulsion was now
adsorbed to the flume wall. The appearance of the emulsion was even lighter brown compared
with the previous samples.
Sample 9 (72 hours): Less observed changes from the 48 hours weathering. The emulsion became
a little thicker and more elastic.
In-situ chemical dispersion of Alpine crude oil.
After 72 hours of weathering in the flume, the dispersant Corexit 9500 was sprayed on the
remaining w/o-emulsion (in-situ application). Approximately 40 % of the total volume of oil
(approx. 8.8 liters) was available for chemical dispersion. The treatment of Corexit 9500 was
sprayed twice on the surface with a dosage-to-oil ratio (DOR) of 1:71 and a dosage-to-emulsion
ratio (DER) of 1:167 in the first application, giving a cumulative DOR of 1:33 and DER of 1:100
with the second application.
The first application of Corexit 9500 showed visually some effect on the surface oil/emulsion as
the dispersant broke up the emulsion into smaller patches and resulted in less water content and a
lower viscous emulsion. However, some resurfacing of larger droplets of the dispersed oil was
observed. The second application of dispersant was considered to be very effective on the
remaining emulsion with minor observed surface oil after 30 minutes. The emulsion was broken
into even smaller droplets and was therefore easily dispersed into the water column. No resurfacing
of oil on the surface was visually observed after 2 hours. The concentration of oil dispersed into
the water column increased approximately 10 times after the first application and approximately
20 times after the second application compared with no treatment by dispersant.
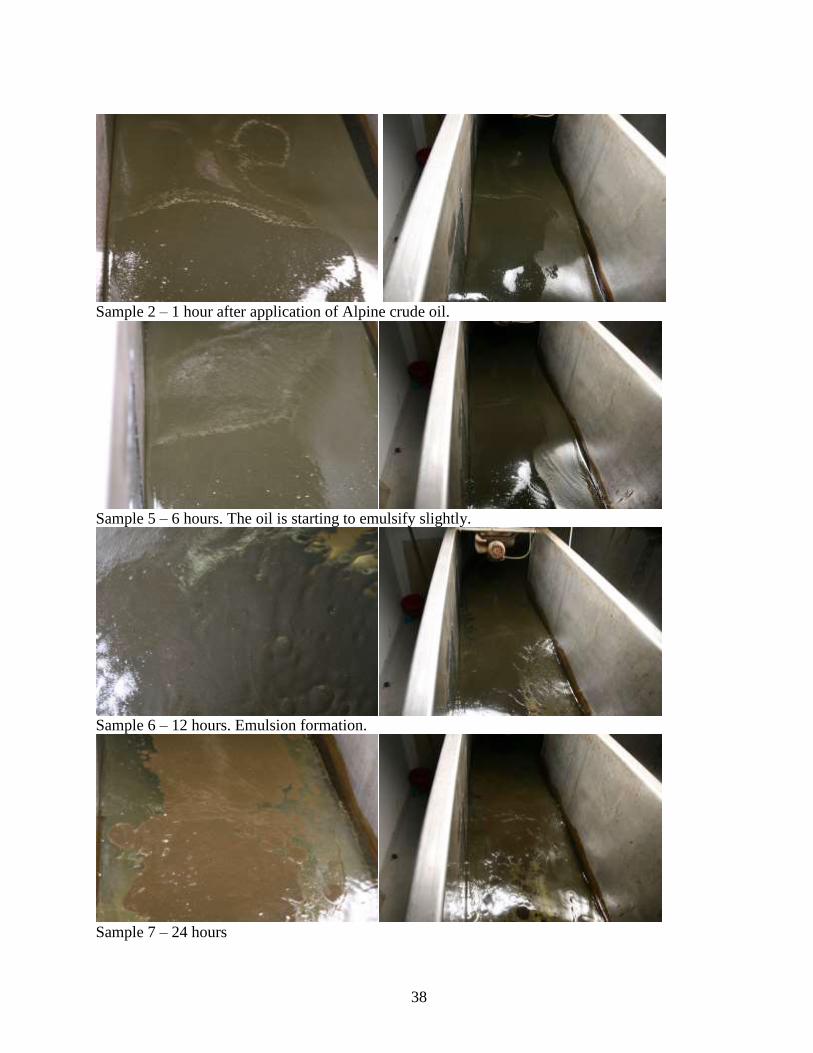
38
Sample 2 – 1 hour after application of Alpine crude oil.
Sample 5 – 6 hours. The oil is starting to emulsify slightly.
Sample 6 – 12 hours. Emulsion formation.
Sample 7 – 24 hours
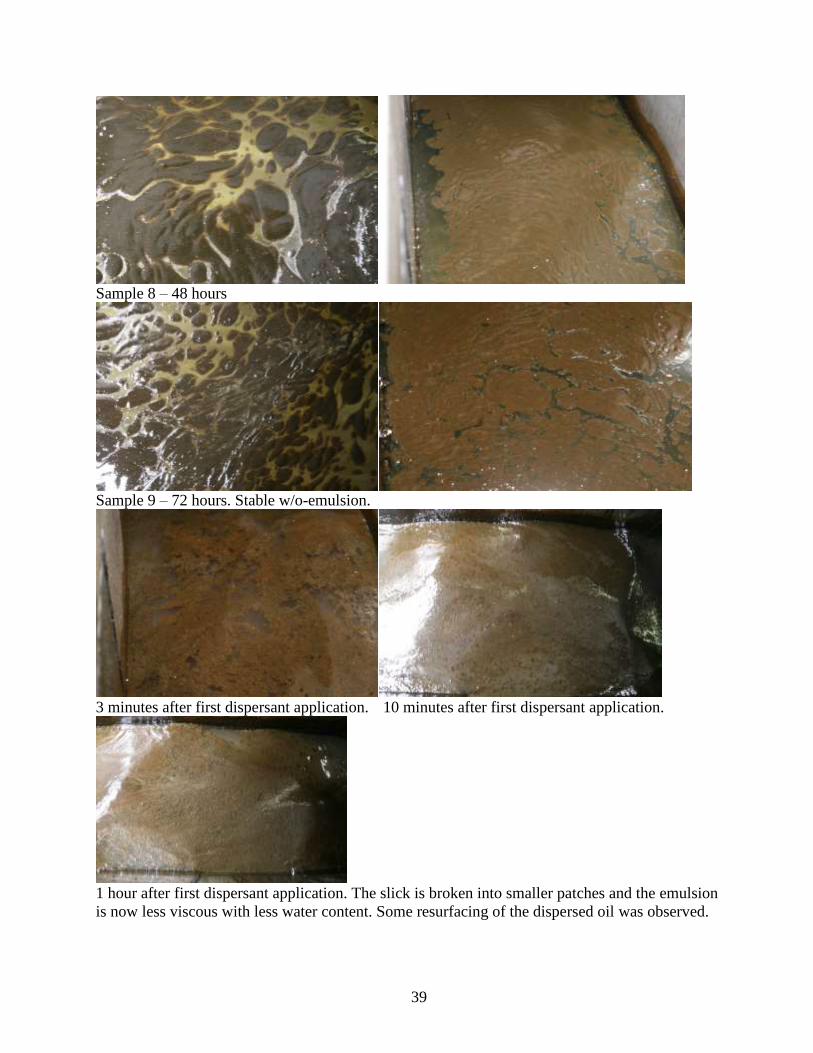
39
Sample 8 – 48 hours
Sample 9 – 72 hours. Stable w/o-emulsion.
3 minutes after first dispersant application. 10 minutes after first dispersant application.
1 hour after first dispersant application. The slick is broken into smaller patches and the emulsion
is now less viscous with less water content. Some resurfacing of the dispersed oil was observed.
40
3 minutes after second dispersant application. The dispersion process is ongoing.
10 minutes after second dispersant application. The major surface of oil/emulsion is dispersed into
the water column.
30 minutes after second dispers ion
30 minutes after second dispersant application. Only small patches left on the surface.
2 hours after second dispersant application. Hardly any observed oil/emulsion left on the surface.
Figure 4.2. Visual observation of Alpine crude oil before and after treatment by dispersant
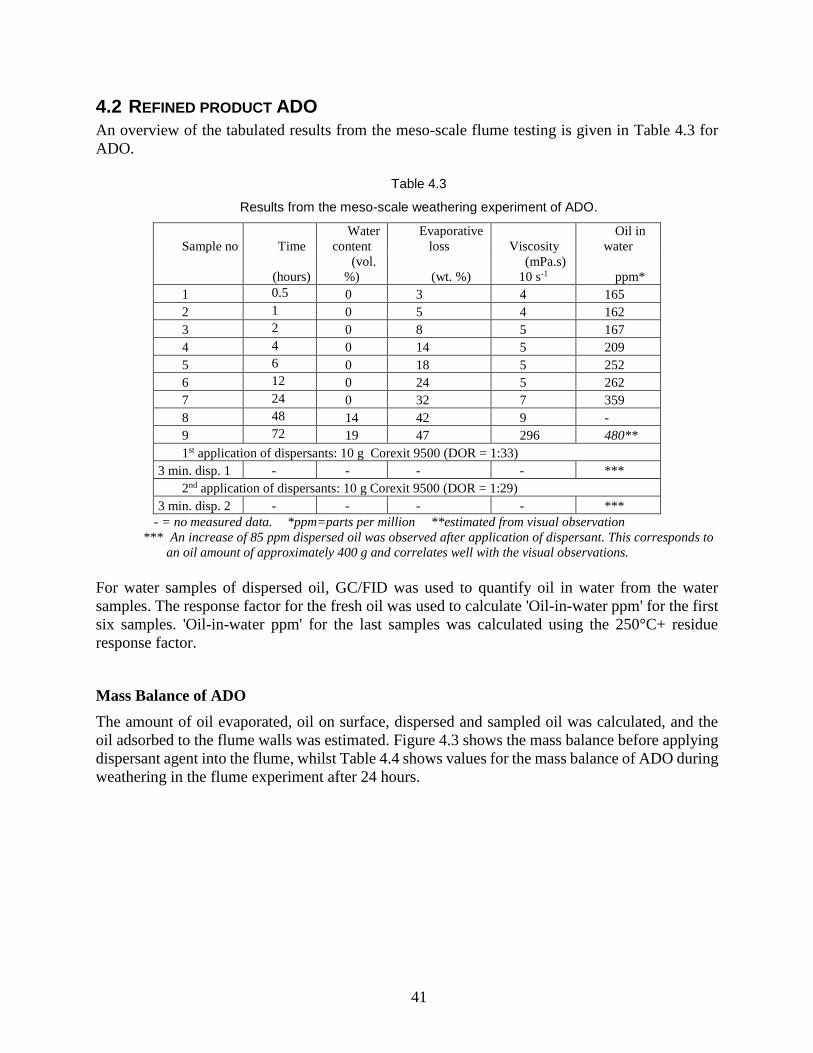
41
4.2 REFINED PRODUCT ADO
An overview of the tabulated results from the meso-scale flume testing is given in Table 4.3 for
ADO.
Table 4.3
Results from the meso-scale weathering experiment of ADO.
Sample no Time
Water
content
Evaporative
loss Viscosity
Oil in
water
(hours)
(vol.
%) (wt. %)
(mPa.s)
10 s-1 ppm*
1 0.5 0 3 4 165
2 1 0 5 4 162
3 2 0 8 5 167
4 4 0 14 5 209
5 6 0 18 5 252
6 12 0 24 5 262
7 24 0 32 7 359
8 48 14 42 9 -
9 72 19 47 296 480**
1st application of dispersants: 10 g Corexit 9500 (DOR = 1:33)
3 min. disp. 1 - - - - ***
2nd application of dispersants: 10 g Corexit 9500 (DOR = 1:29)
3 min. disp. 2 - - - - ***
- = no measured data. *ppm=parts per million **estimated from visual observation
*** An increase of 85 ppm dispersed oil was observed after application of dispersant. This corresponds to
an oil amount of approximately 400 g and correlates well with the visual observations.
For water samples of dispersed oil, GC/FID was used to quantify oil in water from the water
samples. The response factor for the fresh oil was used to calculate 'Oil-in-water ppm' for the first
six samples. 'Oil-in-water ppm' for the last samples was calculated using the 250°C+ residue
response factor.
Mass Balance of ADO
The amount of oil evaporated, oil on surface, dispersed and sampled oil was calculated, and the
oil adsorbed to the flume walls was estimated. Figure 4.3 shows the mass balance before applying
dispersant agent into the flume, whilst Table 4.4 shows values for the mass balance of ADO during
weathering in the flume experiment after 24 hours.
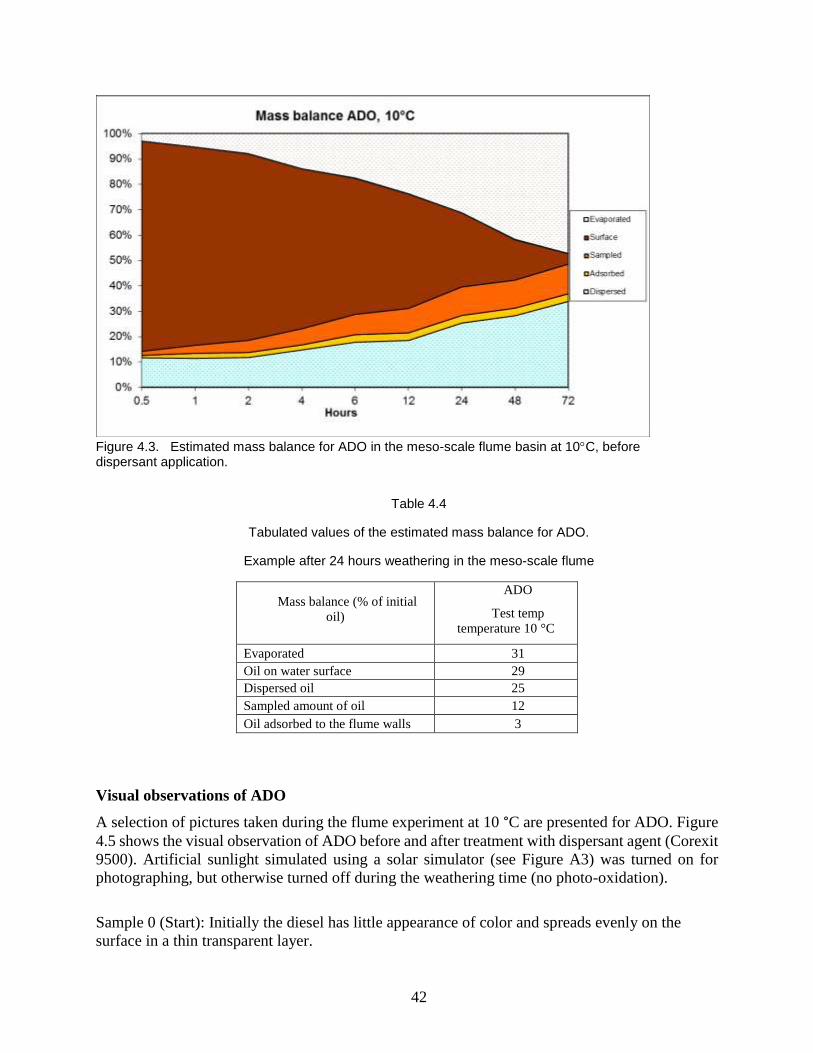
42
Figure 4.3. Estimated mass balance for ADO in the meso-scale flume basin at 10C, before dispersant application.
Table 4.4
Tabulated values of the estimated mass balance for ADO.
Example after 24 hours weathering in the meso-scale flume
Mass balance (% of initial
oil)
ADO
Test temp
temperature 10 °C
Evaporated 31
Oil on water surface 29
Dispersed oil 25
Sampled amount of oil 12
Oil adsorbed to the flume walls 3
Visual observations of ADO
A selection of pictures taken during the flume experiment at 10 °C are presented for ADO. Figure
4.5 shows the visual observation of ADO before and after treatment with dispersant agent (Corexit
9500). Artificial sunlight simulated using a solar simulator (see Figure A3) was turned on for
photographing, but otherwise turned off during the weathering time (no photo-oxidation).
Sample 0 (Start): Initially the diesel has little appearance of color and spreads evenly on the
surface in a thin transparent layer.
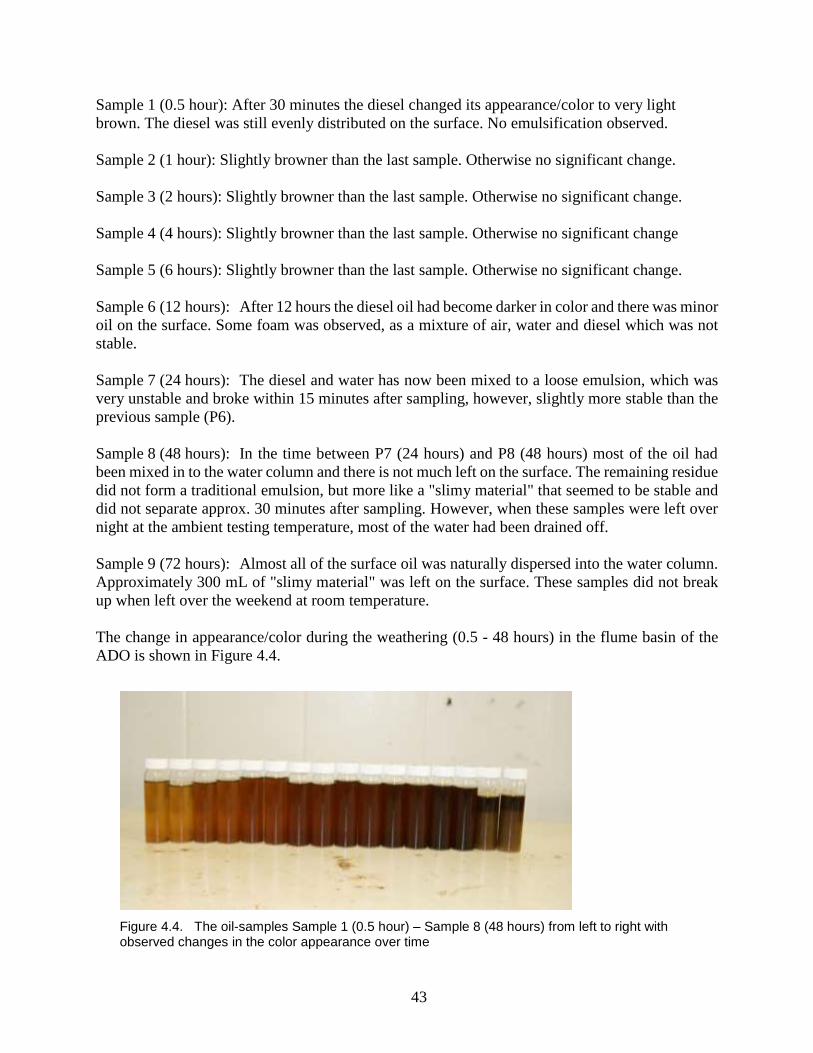
43
Sample 1 (0.5 hour): After 30 minutes the diesel changed its appearance/color to very light
brown. The diesel was still evenly distributed on the surface. No emulsification observed.
Sample 2 (1 hour): Slightly browner than the last sample. Otherwise no significant change.
Sample 3 (2 hours): Slightly browner than the last sample. Otherwise no significant change.
Sample 4 (4 hours): Slightly browner than the last sample. Otherwise no significant change
Sample 5 (6 hours): Slightly browner than the last sample. Otherwise no significant change.
Sample 6 (12 hours): After 12 hours the diesel oil had become darker in color and there was minor
oil on the surface. Some foam was observed, as a mixture of air, water and diesel which was not
stable.
Sample 7 (24 hours): The diesel and water has now been mixed to a loose emulsion, which was
very unstable and broke within 15 minutes after sampling, however, slightly more stable than the
previous sample (P6).
Sample 8 (48 hours): In the time between P7 (24 hours) and P8 (48 hours) most of the oil had
been mixed in to the water column and there is not much left on the surface. The remaining residue
did not form a traditional emulsion, but more like a "slimy material" that seemed to be stable and
did not separate approx. 30 minutes after sampling. However, when these samples were left over
night at the ambient testing temperature, most of the water had been drained off.
Sample 9 (72 hours): Almost all of the surface oil was naturally dispersed into the water column.
Approximately 300 mL of "slimy material" was left on the surface. These samples did not break
up when left over the weekend at room temperature.
The change in appearance/color during the weathering (0.5 - 48 hours) in the flume basin of the
ADO is shown in Figure 4.4.
Figure 4.4. The oil-samples Sample 1 (0.5 hour) – Sample 8 (48 hours) from left to right with observed changes in the color appearance over time
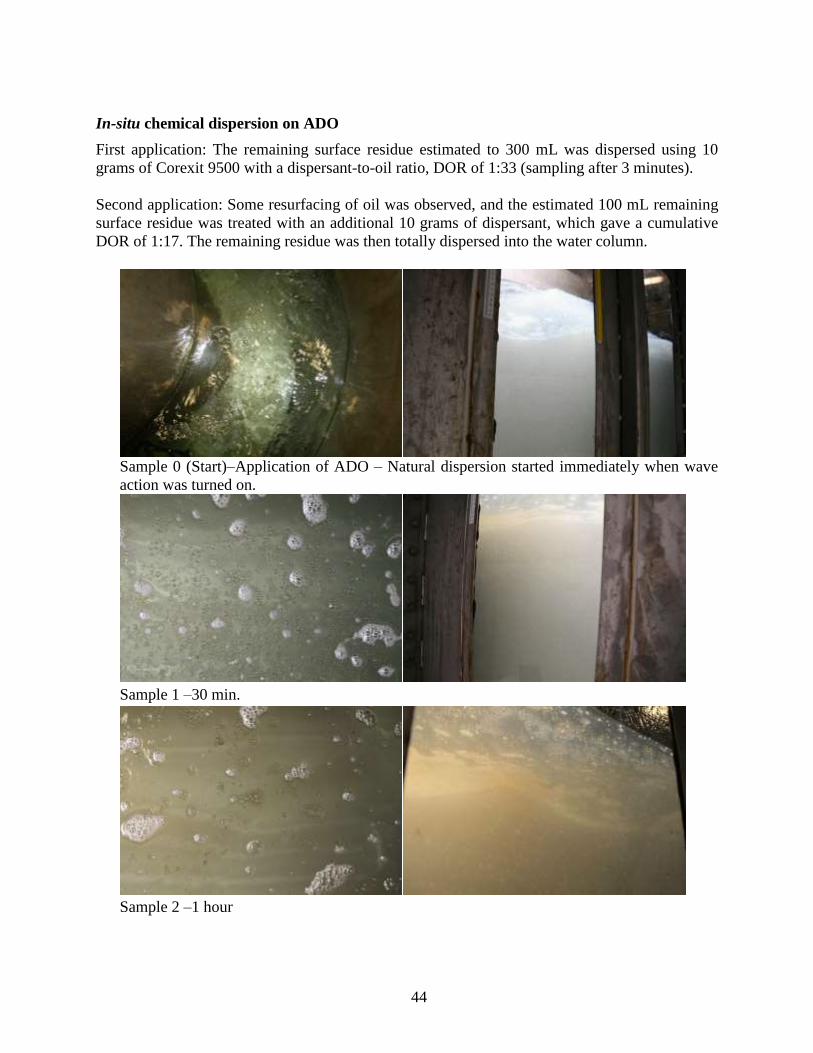
44
In-situ chemical dispersion on ADO
First application: The remaining surface residue estimated to 300 mL was dispersed using 10
grams of Corexit 9500 with a dispersant-to-oil ratio, DOR of 1:33 (sampling after 3 minutes).
Second application: Some resurfacing of oil was observed, and the estimated 100 mL remaining
surface residue was treated with an additional 10 grams of dispersant, which gave a cumulative
DOR of 1:17. The remaining residue was then totally dispersed into the water column.
Sample 0 (Start)–Application of ADO – Natural dispersion started immediately when wave
action was turned on.
Sample 1 –30 min.
Sample 2 –1 hour
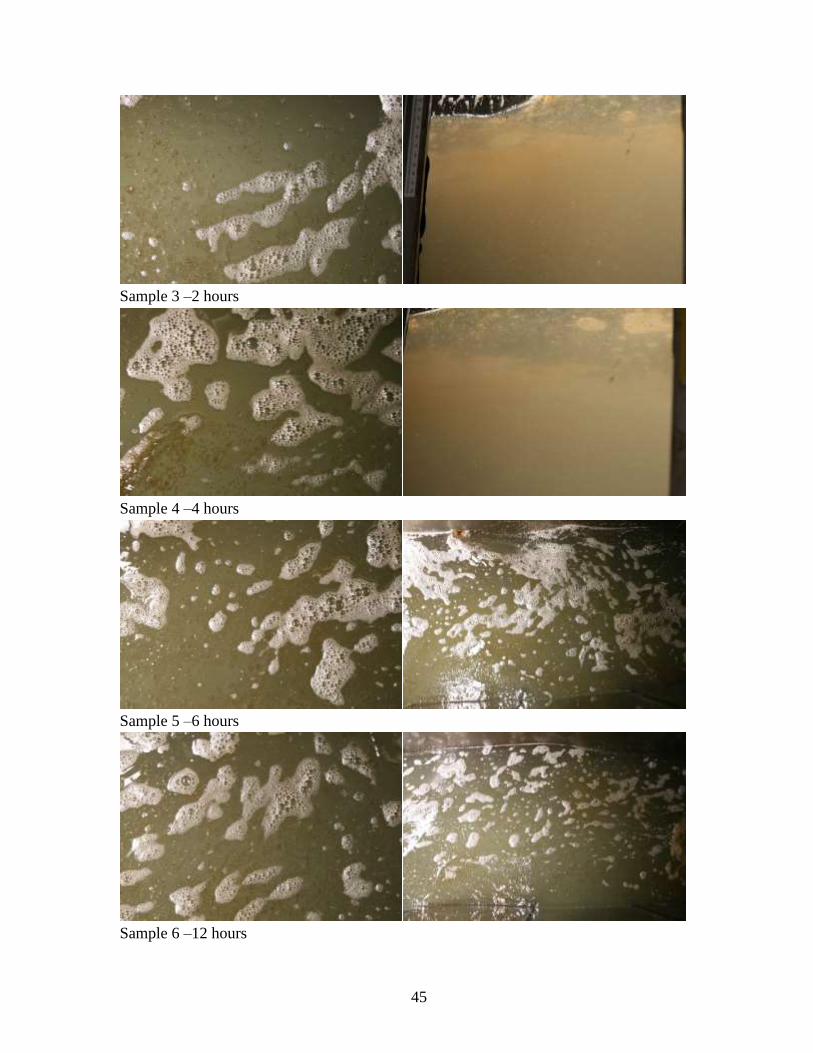
45
Sample 3 –2 hours
Sample 4 –4 hours
Sample 5 –6 hours
Sample 6 –12 hours
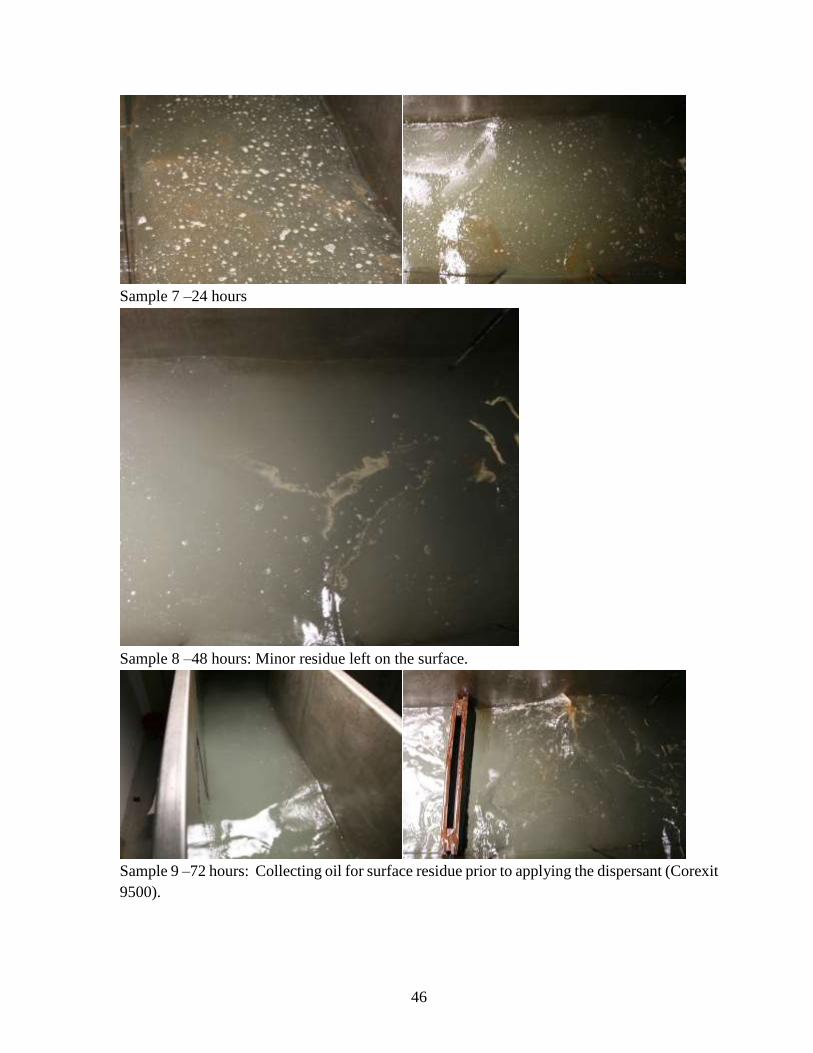
46
Sample 7 –24 hours
Sample 8 –48 hours: Minor residue left on the surface.
Sample 9 –72 hours: Collecting oil for surface residue prior to applying the dispersant (Corexit
9500).
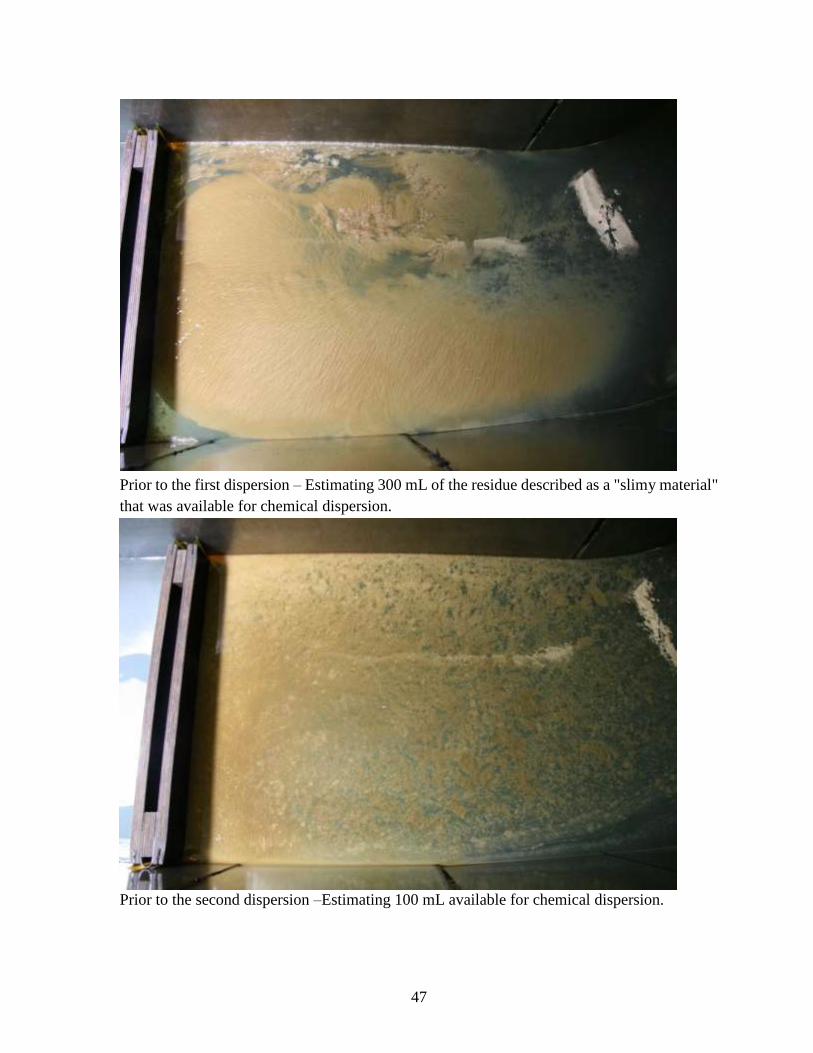
47
Prior to the first dispersion – Estimating 300 mL of the residue described as a "slimy material"
that was available for chemical dispersion.
Prior to the second dispersion –Estimating 100 mL available for chemical dispersion.
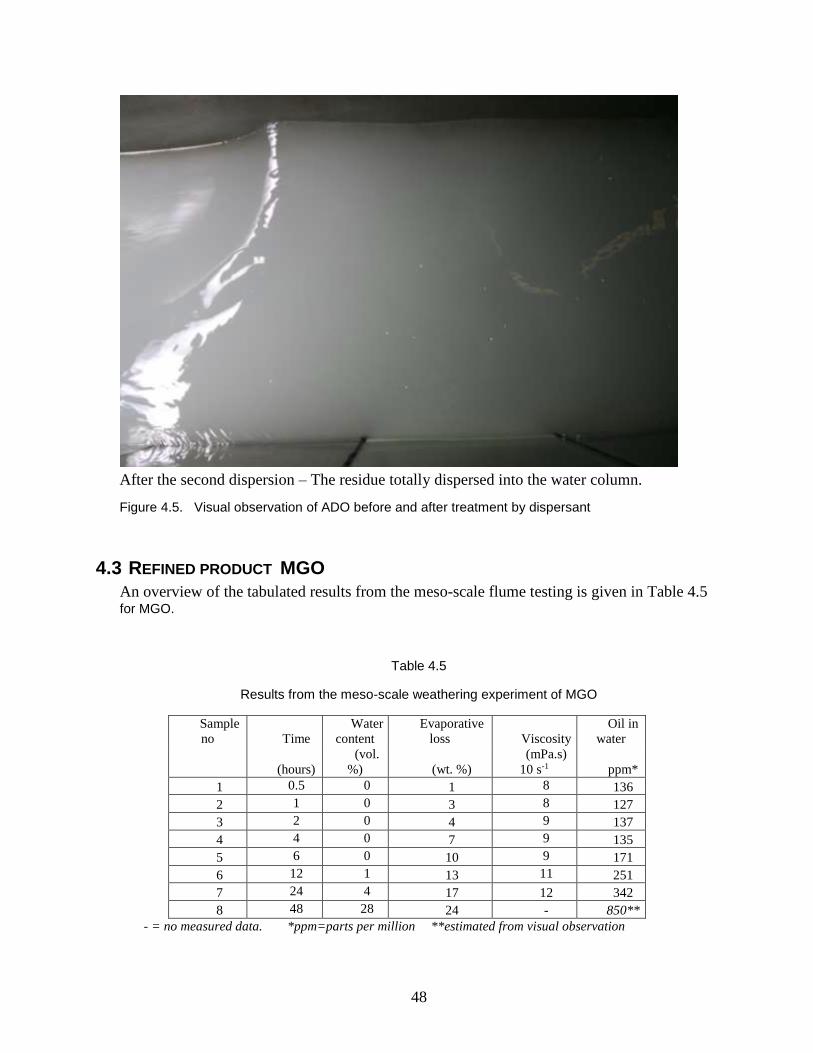
48
After the second dispersion – The residue totally dispersed into the water column.
Figure 4.5. Visual observation of ADO before and after treatment by dispersant
4.3 REFINED PRODUCT MGO
An overview of the tabulated results from the meso-scale flume testing is given in Table 4.5
for MGO.
Table 4.5
Results from the meso-scale weathering experiment of MGO
Sample
no Time
Water
content
Evaporative
loss Viscosity
Oil in
water
(hours)
(vol.
%) (wt. %)
(mPa.s)
10 s-1 ppm*
1 0.5 0 1 8 136
2 1 0 3 8 127
3 2 0 4 9 137
4 4 0 7 9 135
5 6 0 10 9 171
6 12 1 13 11 251
7 24 4 17 12 342
8 48 28 24 - 850**
- = no measured data. *ppm=parts per million **estimated from visual observation
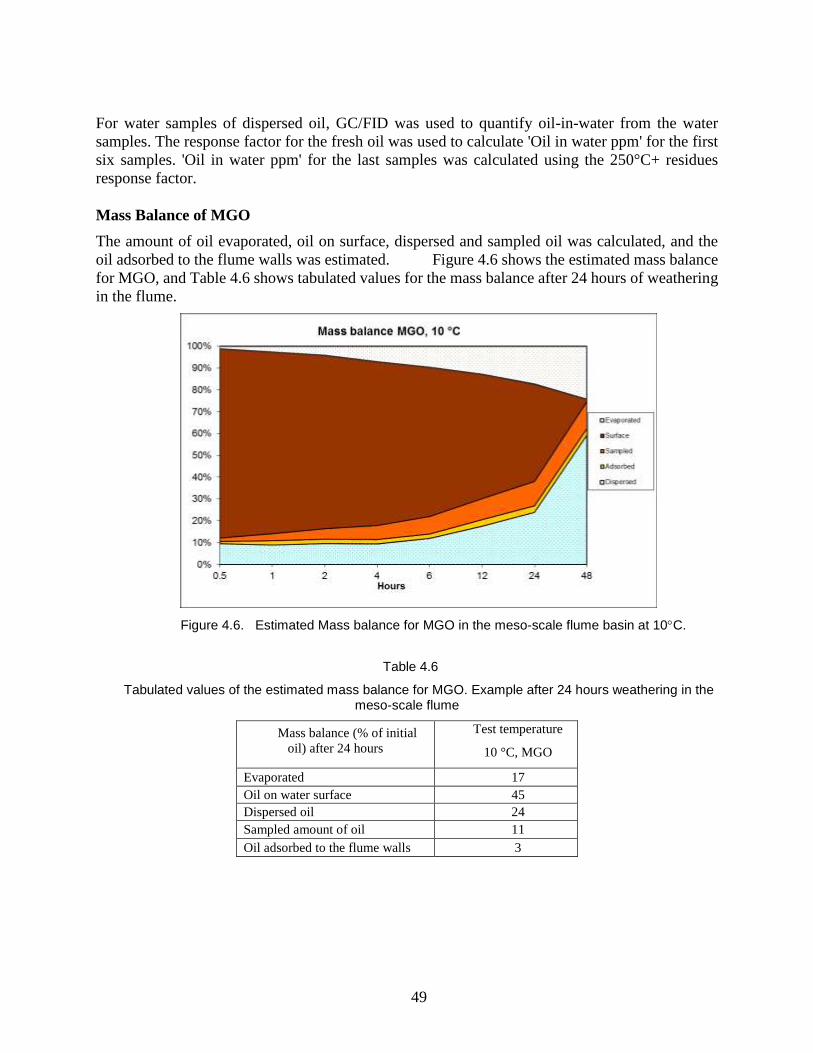
49
For water samples of dispersed oil, GC/FID was used to quantify oil-in-water from the water
samples. The response factor for the fresh oil was used to calculate 'Oil in water ppm' for the first
six samples. 'Oil in water ppm' for the last samples was calculated using the 250°C+ residues
response factor.
Mass Balance of MGO
The amount of oil evaporated, oil on surface, dispersed and sampled oil was calculated, and the
oil adsorbed to the flume walls was estimated. Figure 4.6 shows the estimated mass balance
for MGO, and Table 4.6 shows tabulated values for the mass balance after 24 hours of weathering
in the flume.
Figure 4.6. Estimated Mass balance for MGO in the meso-scale flume basin at 10C.
Table 4.6
Tabulated values of the estimated mass balance for MGO. Example after 24 hours weathering in the meso-scale flume
Mass balance (% of initial
oil) after 24 hours
Test temperature
10 °C, MGO
Evaporated 17
Oil on water surface 45
Dispersed oil 24
Sampled amount of oil 11
Oil adsorbed to the flume walls 3
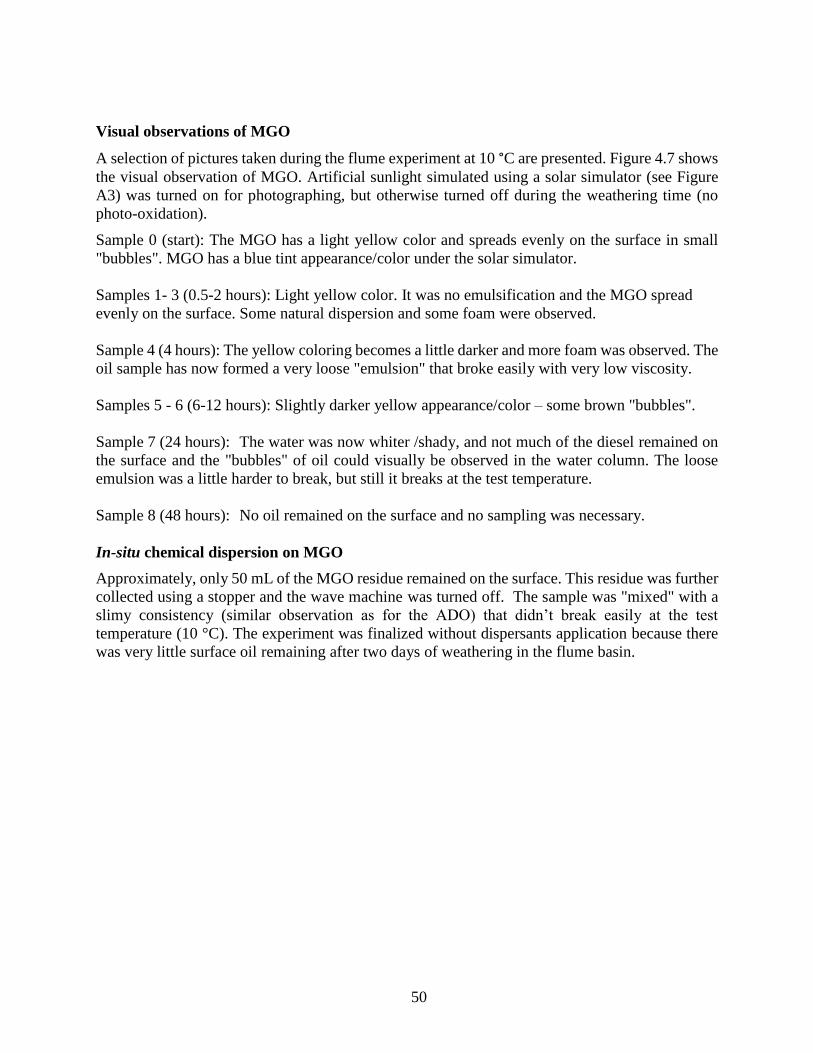
50
Visual observations of MGO
A selection of pictures taken during the flume experiment at 10 °C are presented. Figure 4.7 shows
the visual observation of MGO. Artificial sunlight simulated using a solar simulator (see Figure
A3) was turned on for photographing, but otherwise turned off during the weathering time (no
photo-oxidation).
Sample 0 (start): The MGO has a light yellow color and spreads evenly on the surface in small
"bubbles". MGO has a blue tint appearance/color under the solar simulator.
Samples 1- 3 (0.5-2 hours): Light yellow color. It was no emulsification and the MGO spread
evenly on the surface. Some natural dispersion and some foam were observed.
Sample 4 (4 hours): The yellow coloring becomes a little darker and more foam was observed. The
oil sample has now formed a very loose "emulsion" that broke easily with very low viscosity.
Samples 5 - 6 (6-12 hours): Slightly darker yellow appearance/color – some brown "bubbles".
Sample 7 (24 hours): The water was now whiter /shady, and not much of the diesel remained on
the surface and the "bubbles" of oil could visually be observed in the water column. The loose
emulsion was a little harder to break, but still it breaks at the test temperature.
Sample 8 (48 hours): No oil remained on the surface and no sampling was necessary.
In-situ chemical dispersion on MGO
Approximately, only 50 mL of the MGO residue remained on the surface. This residue was further
collected using a stopper and the wave machine was turned off. The sample was "mixed" with a
slimy consistency (similar observation as for the ADO) that didn’t break easily at the test
temperature (10 °C). The experiment was finalized without dispersants application because there
was very little surface oil remaining after two days of weathering in the flume basin.
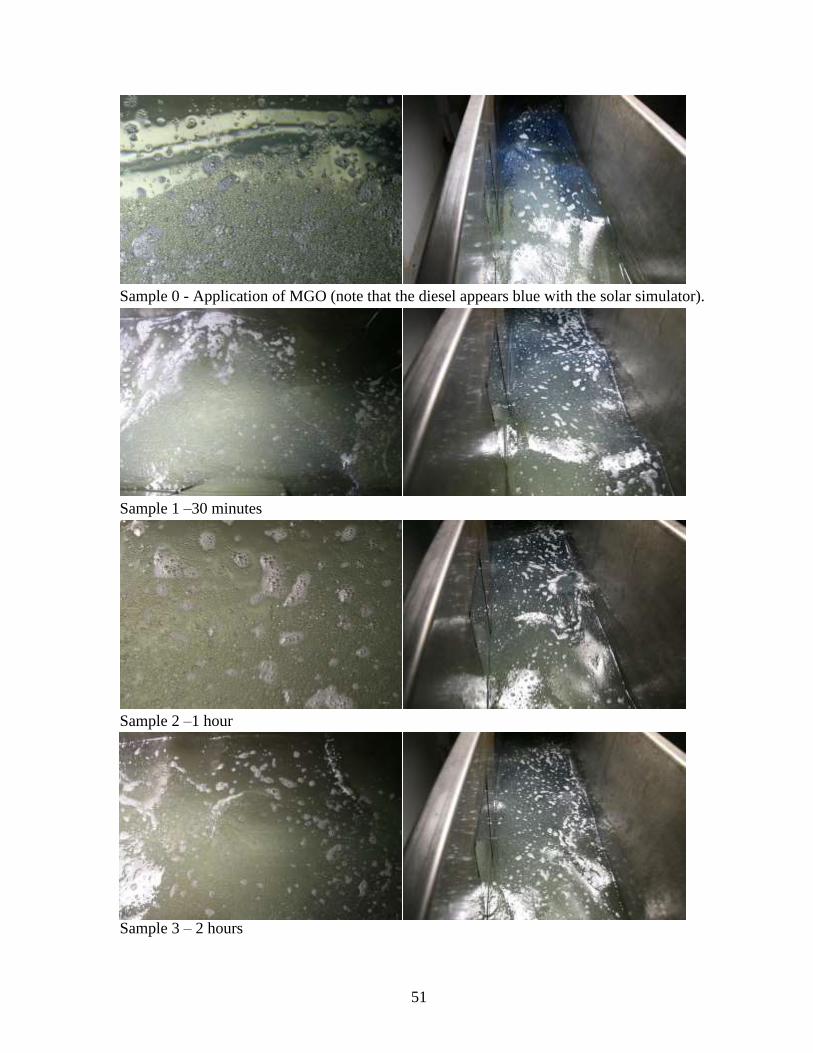
51
Sample 0 - Application of MGO (note that the diesel appears blue with the solar simulator).
Sample 1 –30 minutes
Sample 2 –1 hour
Sample 3 – 2 hours
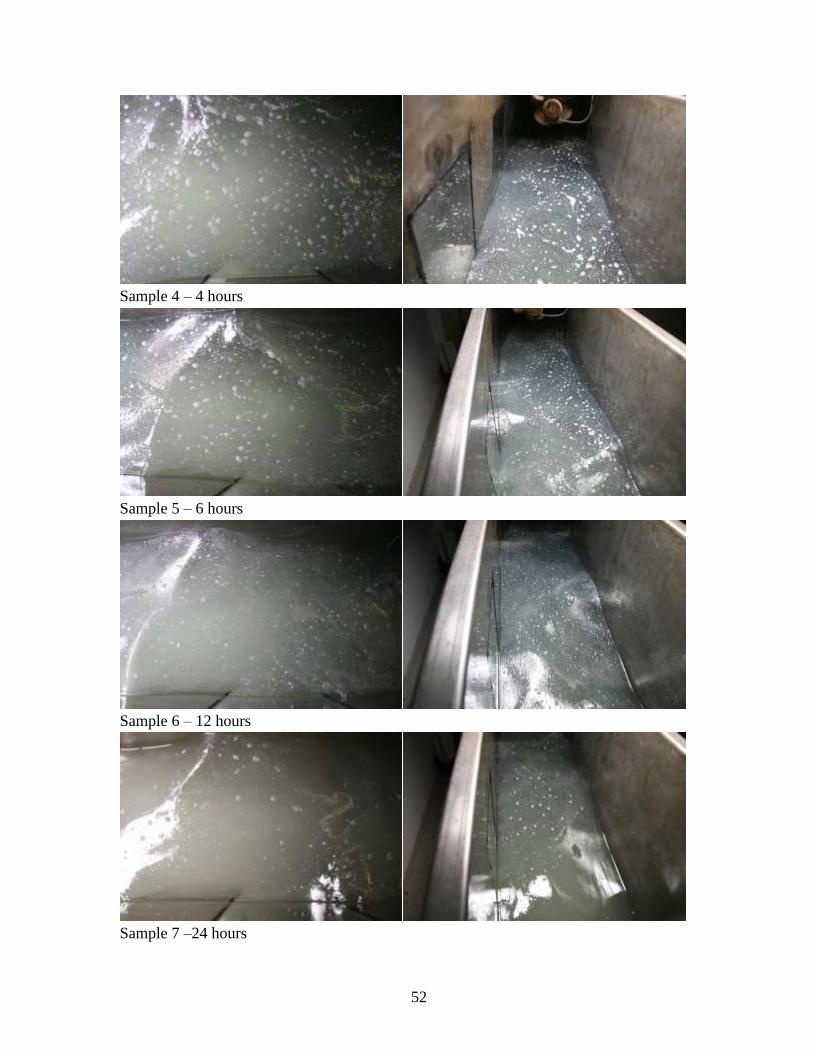
52
Sample 4 – 4 hours
Sample 5 – 6 hours
Sample 6 – 12 hours
Sample 7 –24 hours
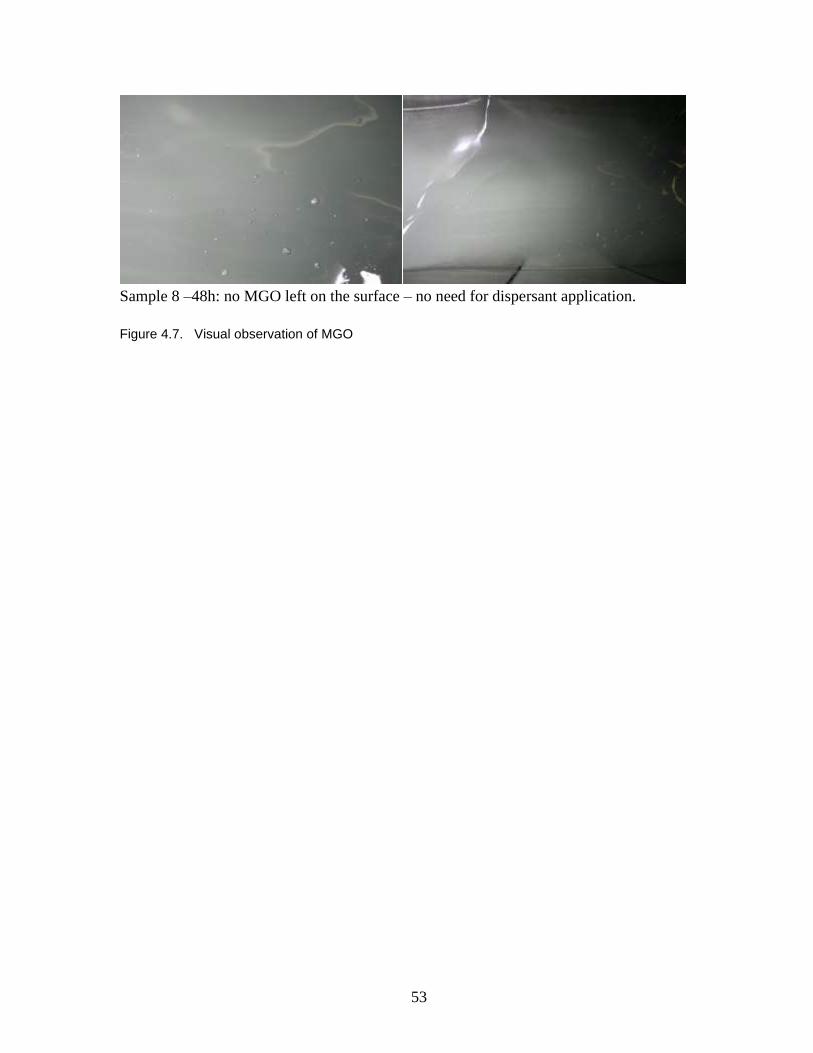
53
Sample 8 –48h: no MGO left on the surface – no need for dispersant application.
Figure 4.7. Visual observation of MGO
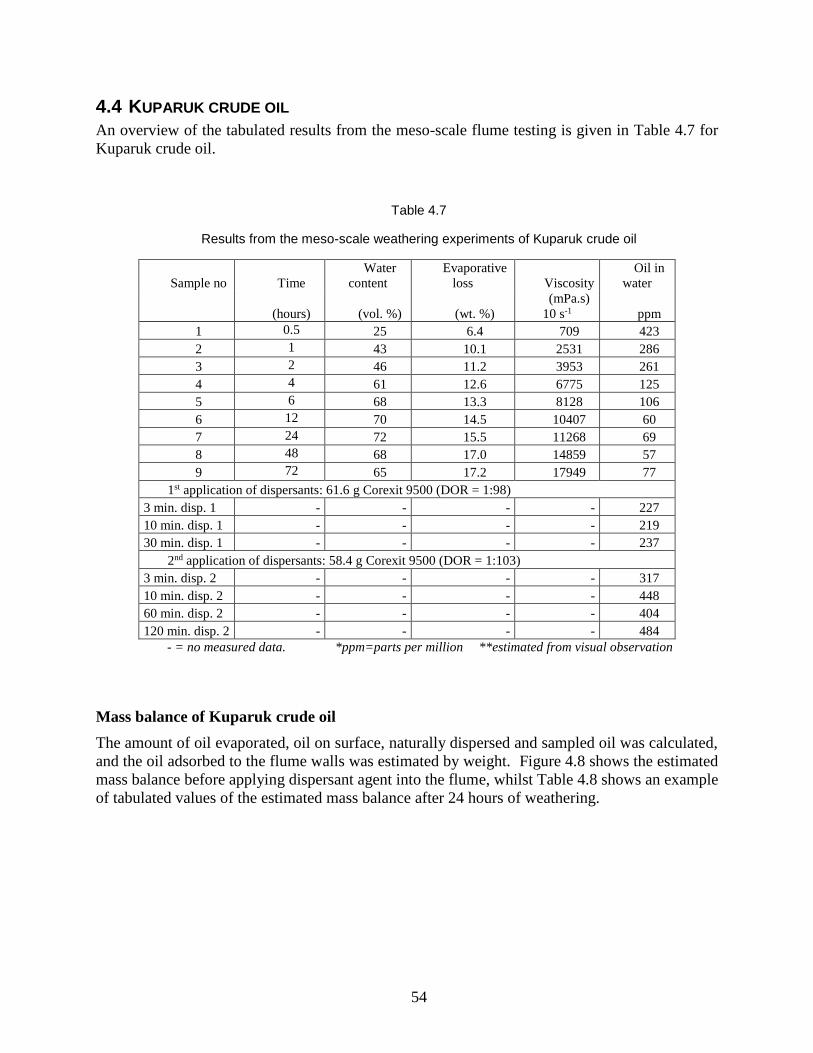
54
4.4 KUPARUK CRUDE OIL
An overview of the tabulated results from the meso-scale flume testing is given in Table 4.7 for
Kuparuk crude oil.
Table 4.7
Results from the meso-scale weathering experiments of Kuparuk crude oil
Sample no Time
Water
content
Evaporative
loss Viscosity
Oil in
water
(hours) (vol. %) (wt. %)
(mPa.s)
10 s-1 ppm
1 0.5 25 6.4 709 423
2 1 43 10.1 2531 286
3 2 46 11.2 3953 261
4 4 61 12.6 6775 125
5 6 68 13.3 8128 106
6 12 70 14.5 10407 60
7 24 72 15.5 11268 69
8 48 68 17.0 14859 57
9 72 65 17.2 17949 77
1st application of dispersants: 61.6 g Corexit 9500 (DOR = 1:98)
3 min. disp. 1 - - - - 227
10 min. disp. 1 - - - - 219
30 min. disp. 1 - - - - 237
2nd application of dispersants: 58.4 g Corexit 9500 (DOR = 1:103)
3 min. disp. 2 - - - - 317
10 min. disp. 2 - - - - 448
60 min. disp. 2 - - - - 404
120 min. disp. 2 - - - - 484
- = no measured data. *ppm=parts per million **estimated from visual observation
Mass balance of Kuparuk crude oil
The amount of oil evaporated, oil on surface, naturally dispersed and sampled oil was calculated,
and the oil adsorbed to the flume walls was estimated by weight. Figure 4.8 shows the estimated
mass balance before applying dispersant agent into the flume, whilst Table 4.8 shows an example
of tabulated values of the estimated mass balance after 24 hours of weathering.
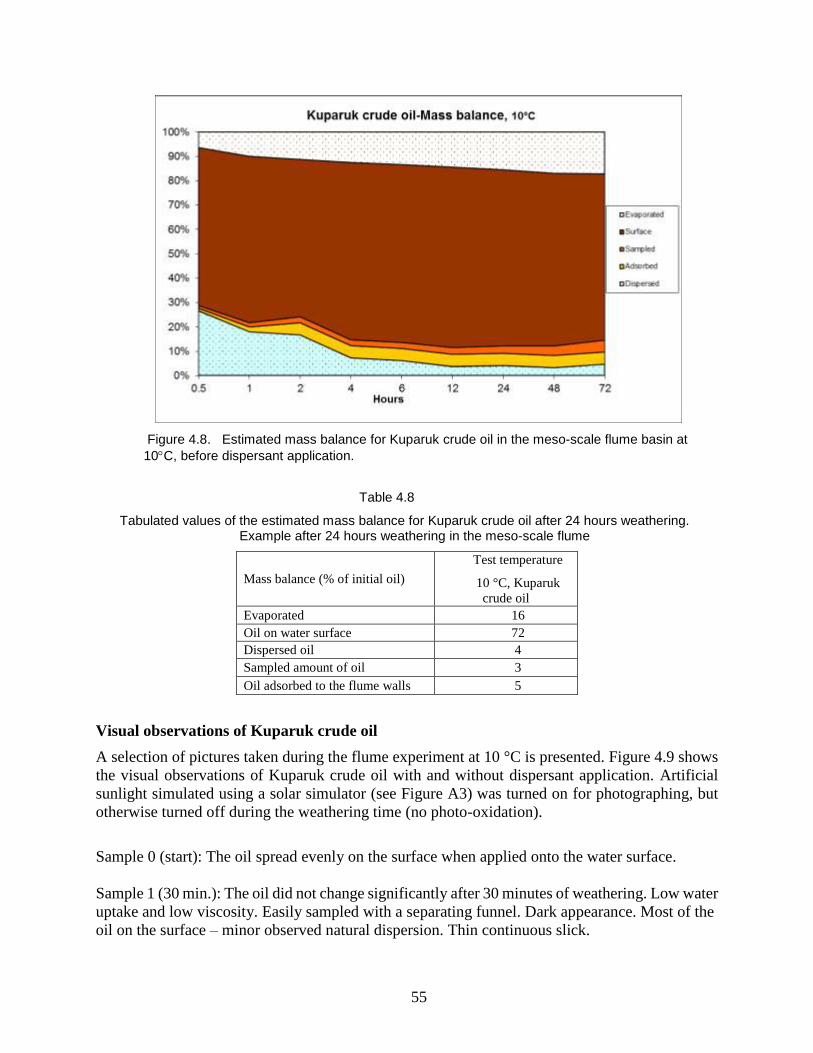
55
Figure 4.8. Estimated mass balance for Kuparuk crude oil in the meso-scale flume basin at
10C, before dispersant application.
Table 4.8
Tabulated values of the estimated mass balance for Kuparuk crude oil after 24 hours weathering. Example after 24 hours weathering in the meso-scale flume
Mass balance (% of initial oil)
Test temperature
10 °C, Kuparuk
crude oil
Evaporated 16
Oil on water surface 72
Dispersed oil 4
Sampled amount of oil 3
Oil adsorbed to the flume walls 5
Visual observations of Kuparuk crude oil
A selection of pictures taken during the flume experiment at 10 °C is presented. Figure 4.9 shows
the visual observations of Kuparuk crude oil with and without dispersant application. Artificial
sunlight simulated using a solar simulator (see Figure A3) was turned on for photographing, but
otherwise turned off during the weathering time (no photo-oxidation).
Sample 0 (start): The oil spread evenly on the surface when applied onto the water surface.
Sample 1 (30 min.): The oil did not change significantly after 30 minutes of weathering. Low water
uptake and low viscosity. Easily sampled with a separating funnel. Dark appearance. Most of the
oil on the surface – minor observed natural dispersion. Thin continuous slick.
56
Sample 2 (1 hour): The oil seemed a bit "thicker" – higher water uptake and increased viscosity.
Samples 3 - 6 (2 -12 hours): The emulsion steadily got thicker with increased water uptake giving
a higher viscosity. After 6 hours weathering, it was no longer possible to sample surface oil using
separating funnel. Dark emulsion. Most of the oil is on the surface – minor observed natural
dispersion.
Sample 7 (24 hours): The oil/emulsion seemed slightly thicker. Oil moves around the flume as
balls/lumps of emulsion (diameter ≈ 5 cm) – not a continuous slick. Some emulsion stuck to the
flume wall, but not more than expected for this kind of crude oil.
Sample 8 (48 hours): Little or no change visually from sample 7. Thick dark emulsion. Most of
the emulsion stuck to the wall was now released onto the water surface.
Sample 9 (72 hours): Visually minor changes from Sample 7. Thick dark emulsion. Almost no
emulsion observed on the flume wall.
In-situ chemical dispersion on Kuparuk crude oil
After 72 hours of weathering, the dispersant Corexit 9500 was sprayed on the remaining w/o-
emulsion (in-situ application). Approximately 68 % of the total volume of oil (approx. 8.8 liters)
was available for chemical dispersion as shown in Figure 4.8. Corexit 9500 was applied twice on
the surface with a dosage-to-oil ratio (DOR) of 1:98 and a dosage-to-emulsion ratio (DER) of
1:250 in the first application, giving a cumulative DOR of 1:50 and DER of 1:100 in the second
application.
First application: The dispersant (Corexit 9500) broke up the lumps of emulsion in to smaller more
irregular bits. Some dispersion effect observed, but not much – most of the emulsion was still on
the surface. After 1 hour, the emulsion started to re-form into balls/lumps again (diameter 3-5cm).
Second application: The dispersant broke the emulsion in to smaller patches (as observed in the
first application), but still a high amount of emulsion was observed on the water surface. Some
large droplets were observed in the water column, but those quickly resurfaced. After 30 minutes,
the emulsion again formed lumps (diameter 2-4 cm). Visually the dispersion was not effective (the
dispersant gives the emulsion a beautiful blue-green color under the solar simulator). 1 hour after
the 2nd dispersant application the large lumps generated in the flume broke into smaller
fractions/patches. The results indicated that Kuparuk is dispersible with Corexit 9500, but requires
a higher dosage of dispersant (DOR > 1:50; DER > 1:100). Use of artificial turbulence applied on
the slick after dispersant application in an oil spill situation may also increase the efficiency of
dispersant use on this oil.
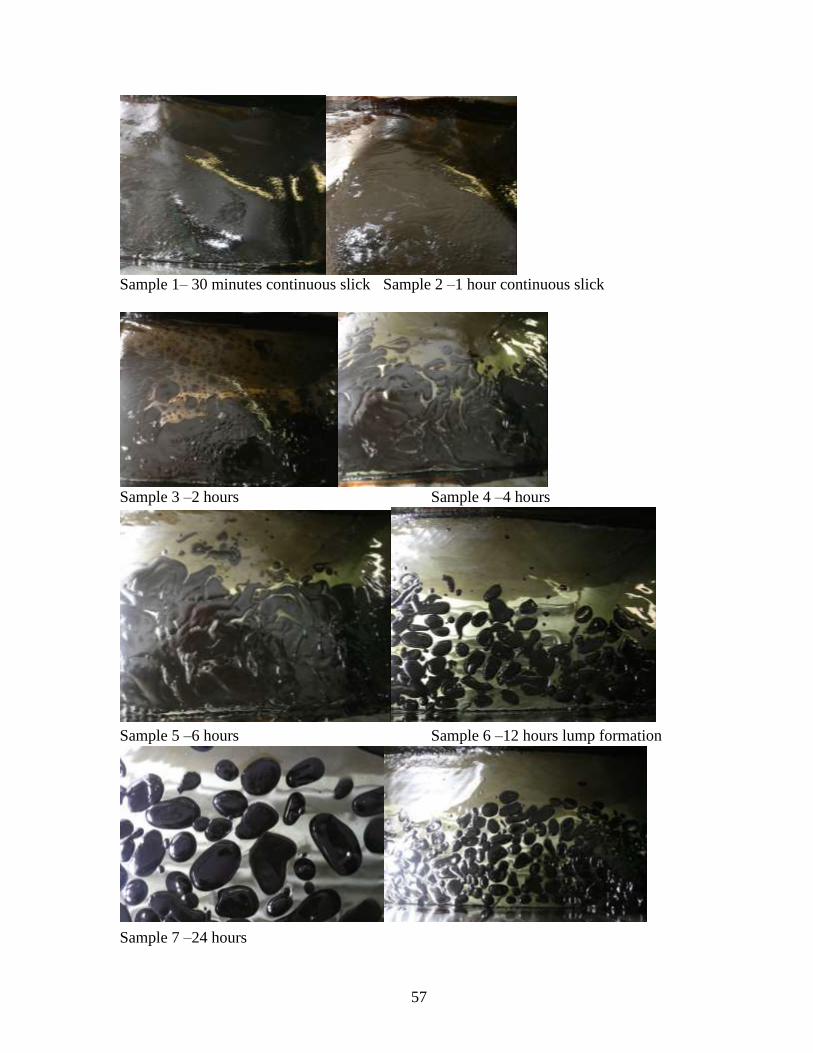
57
Sample 1– 30 minutes continuous slick Sample 2 –1 hour continuous slick
Sample 3 –2 hours Sample 4 –4 hours
Sample 5 –6 hours Sample 6 –12 hours lump formation
Sample 7 –24 hours
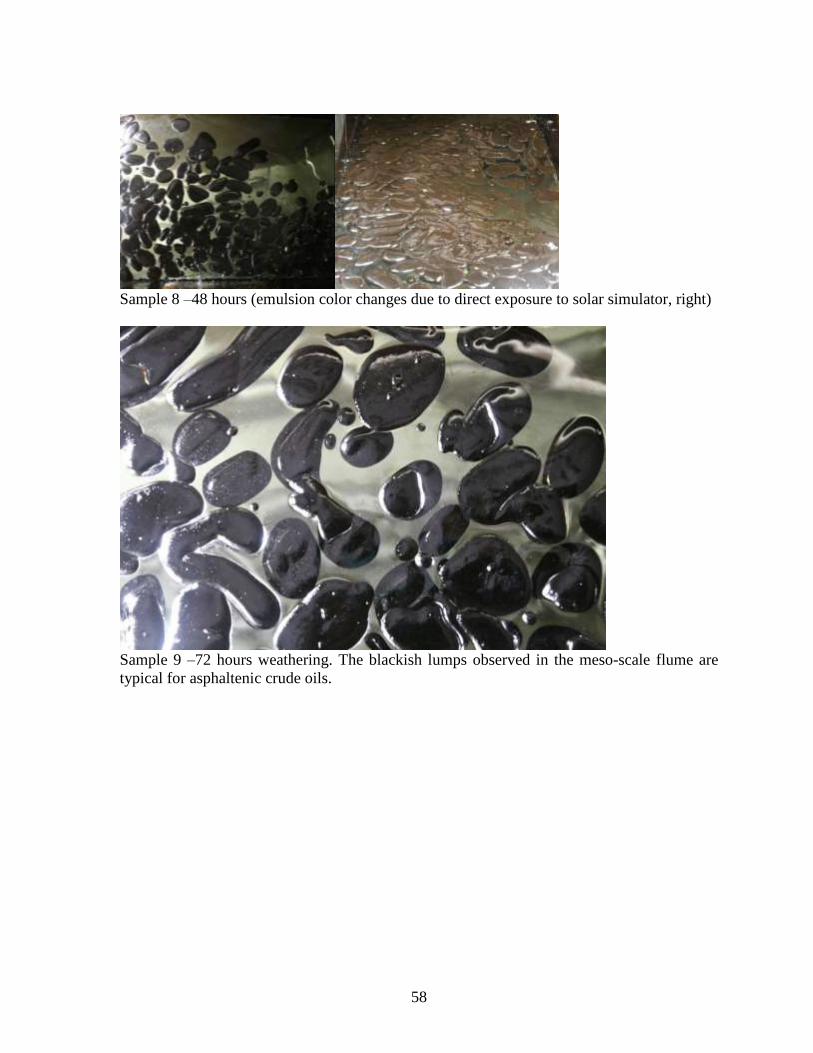
58
Sample 8 –48 hours (emulsion color changes due to direct exposure to solar simulator, right)
Sample 9 –72 hours weathering. The blackish lumps observed in the meso-scale flume are
typical for asphaltenic crude oils.
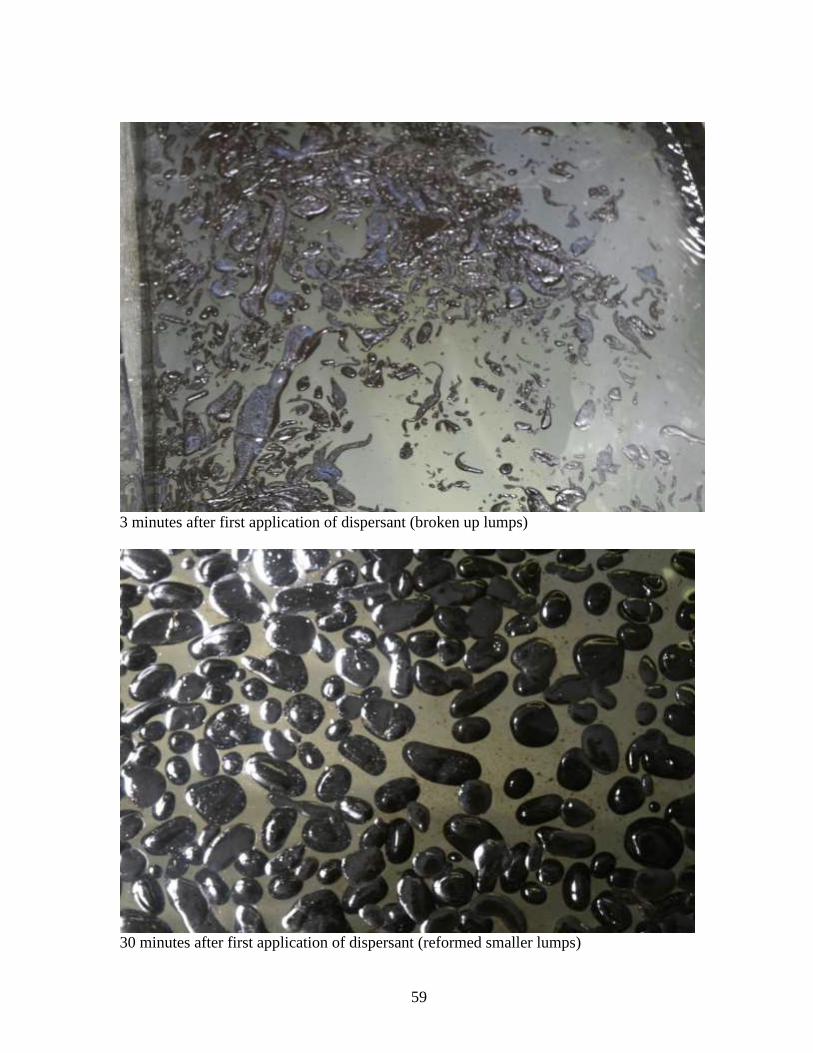
59
3 minutes after first application of dispersant (broken up lumps)
30 minutes after first application of dispersant (reformed smaller lumps)
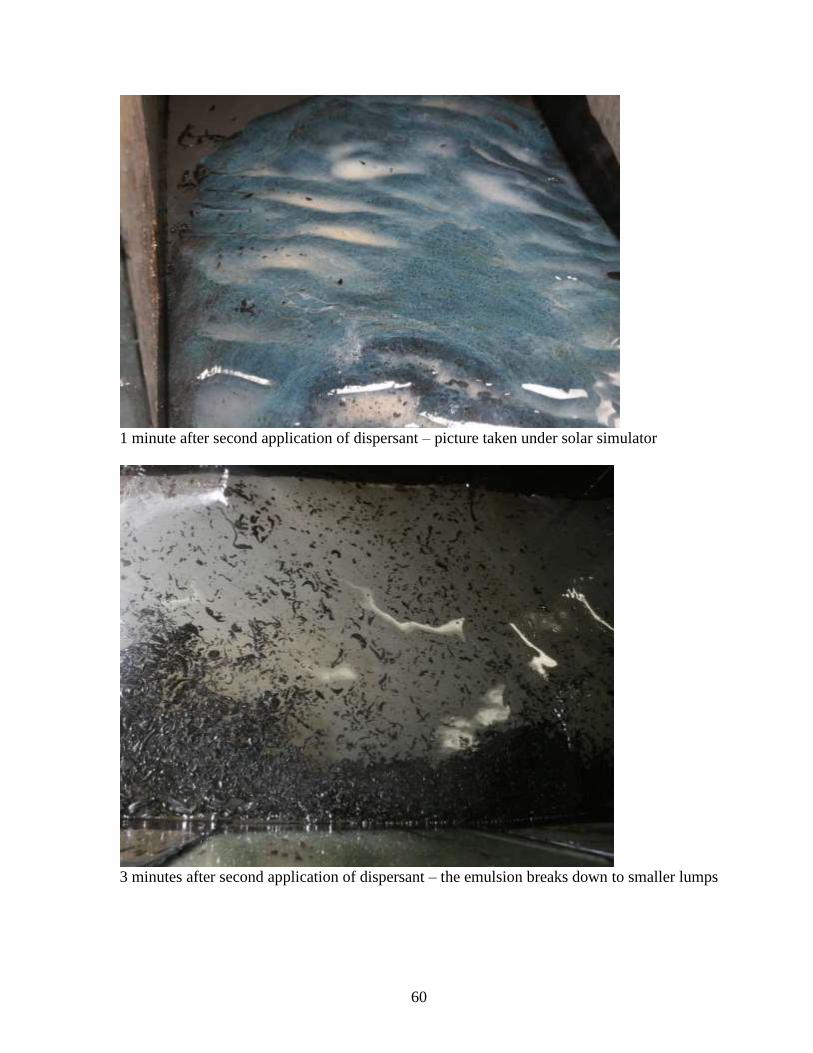
60
1 minute after second application of dispersant – picture taken under solar simulator
3 minutes after second application of dispersant – the emulsion breaks down to smaller lumps
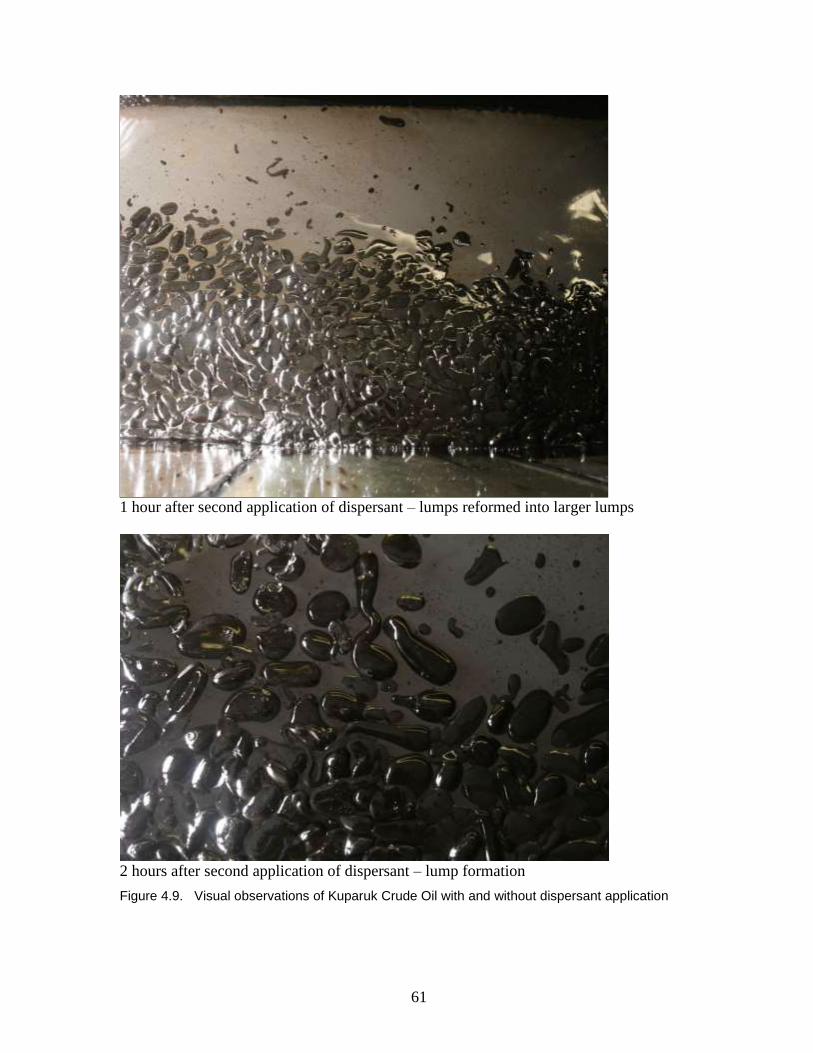
61
1 hour after second application of dispersant – lumps reformed into larger lumps
2 hours after second application of dispersant – lump formation
Figure 4.9. Visual observations of Kuparuk Crude Oil with and without dispersant application
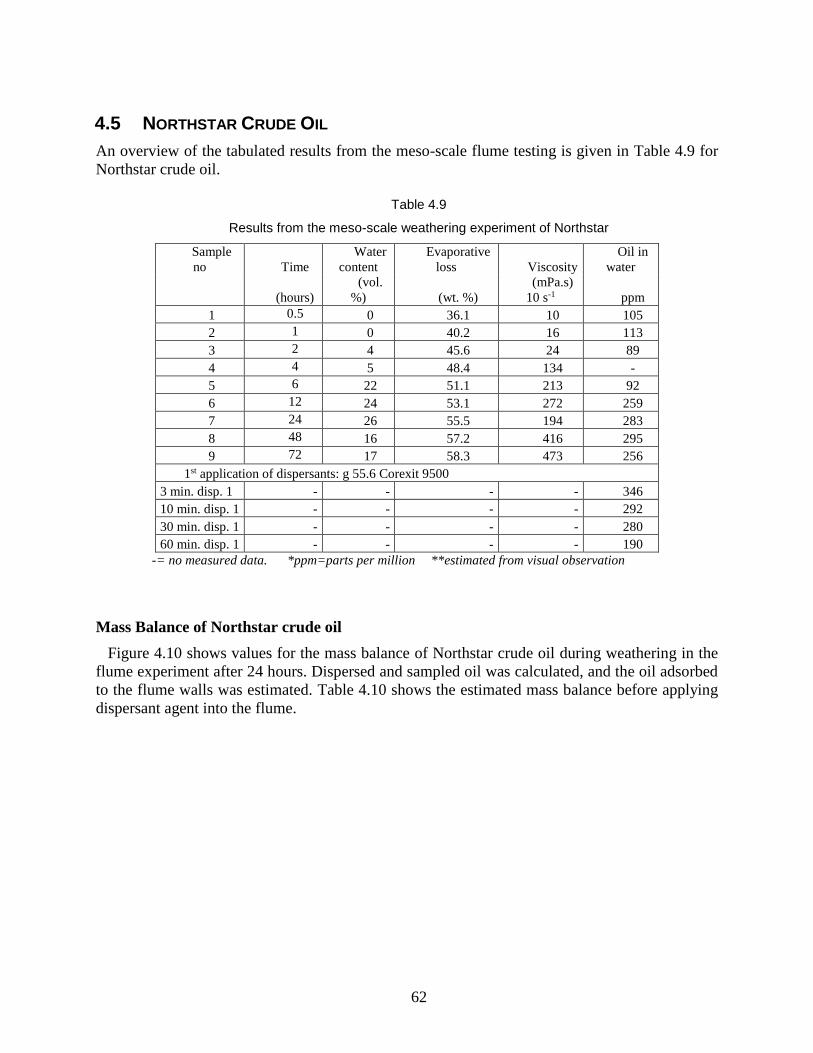
62
4.5 NORTHSTAR CRUDE OIL
An overview of the tabulated results from the meso-scale flume testing is given in Table 4.9 for
Northstar crude oil.
Table 4.9
Results from the meso-scale weathering experiment of Northstar
Sample
no Time
Water
content
Evaporative
loss Viscosity
Oil in
water
(hours)
(vol.
%) (wt. %)
(mPa.s)
10 s-1 ppm
1 0.5 0 36.1 10 105
2 1 0 40.2 16 113
3 2 4 45.6 24 89
4 4 5 48.4 134 -
5 6 22 51.1 213 92
6 12 24 53.1 272 259
7 24 26 55.5 194 283
8 48 16 57.2 416 295
9 72 17 58.3 473 256
1st application of dispersants: g 55.6 Corexit 9500
3 min. disp. 1 - - - - 346
10 min. disp. 1 - - - - 292
30 min. disp. 1 - - - - 280
60 min. disp. 1 - - - - 190
-= no measured data. *ppm=parts per million **estimated from visual observation
Mass Balance of Northstar crude oil
Figure 4.10 shows values for the mass balance of Northstar crude oil during weathering in the
flume experiment after 24 hours. Dispersed and sampled oil was calculated, and the oil adsorbed
to the flume walls was estimated. Table 4.10 shows the estimated mass balance before applying
dispersant agent into the flume.
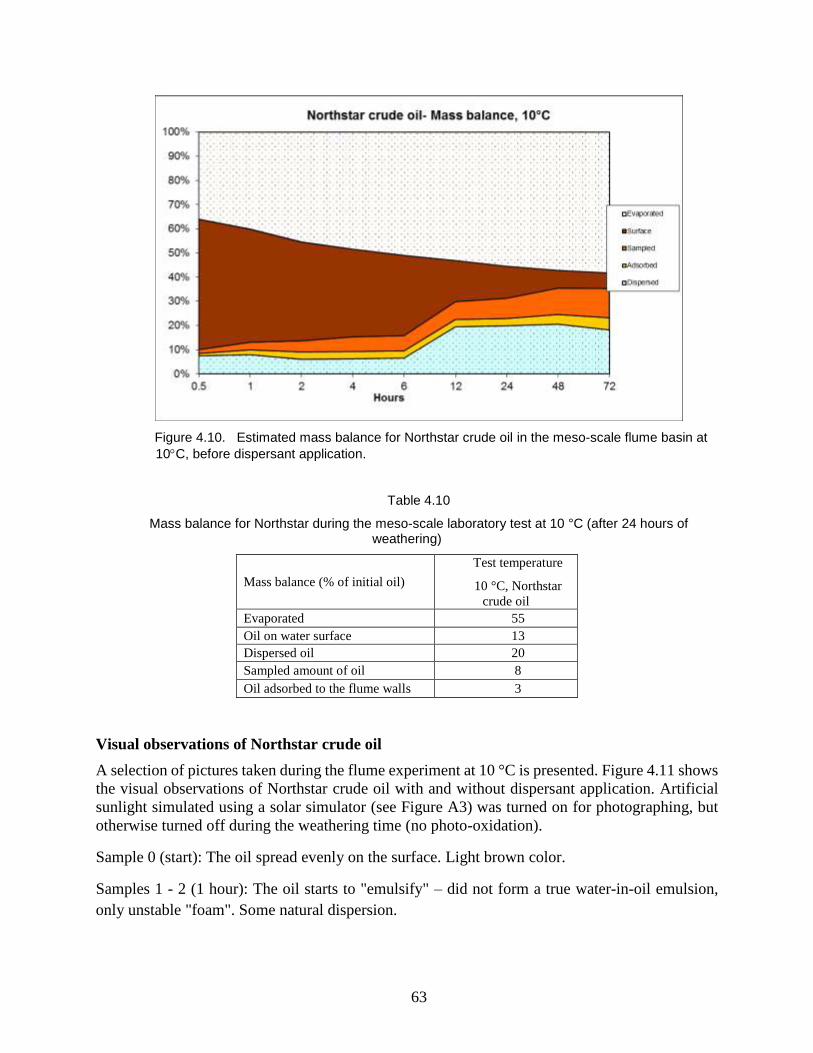
63
Figure 4.10. Estimated mass balance for Northstar crude oil in the meso-scale flume basin at
10C, before dispersant application.
Table 4.10
Mass balance for Northstar during the meso-scale laboratory test at 10 °C (after 24 hours of weathering)
Mass balance (% of initial oil)
Test temperature
10 °C, Northstar
crude oil
Evaporated 55
Oil on water surface 13
Dispersed oil 20
Sampled amount of oil 8
Oil adsorbed to the flume walls 3
Visual observations of Northstar crude oil
A selection of pictures taken during the flume experiment at 10 °C is presented. Figure 4.11 shows
the visual observations of Northstar crude oil with and without dispersant application. Artificial
sunlight simulated using a solar simulator (see Figure A3) was turned on for photographing, but
otherwise turned off during the weathering time (no photo-oxidation).
Sample 0 (start): The oil spread evenly on the surface. Light brown color.
Samples 1 - 2 (1 hour): The oil starts to "emulsify" – did not form a true water-in-oil emulsion,
only unstable "foam". Some natural dispersion.
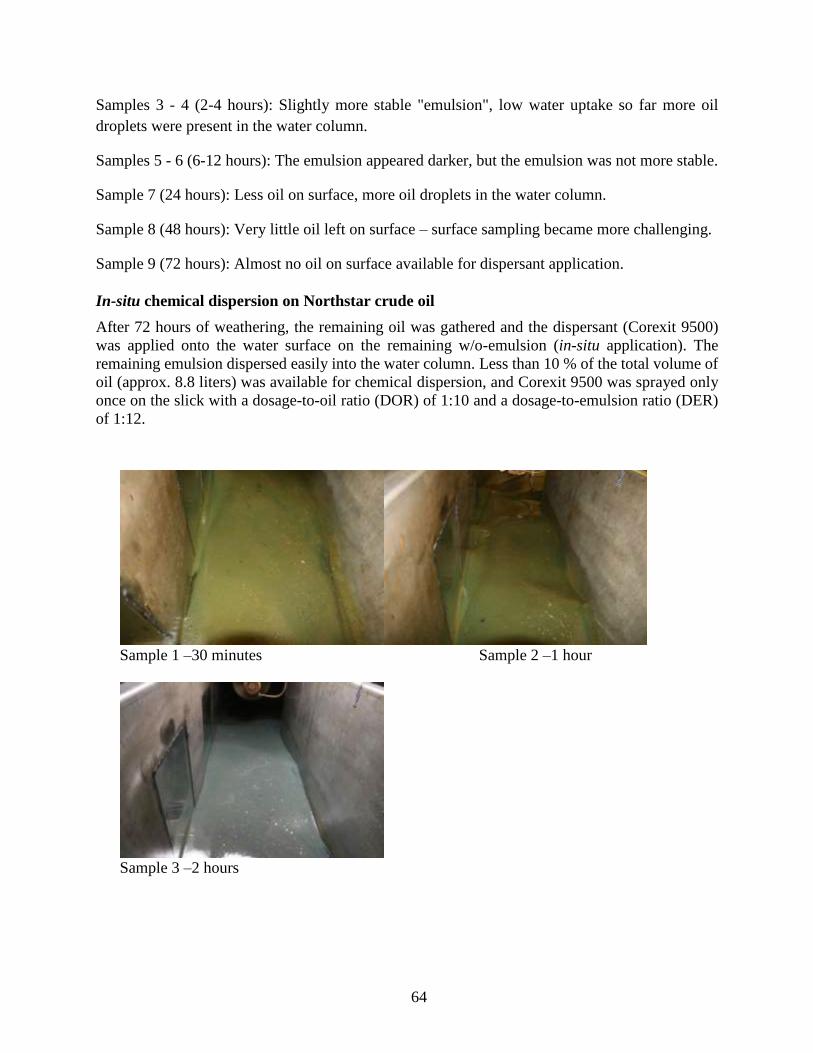
64
Samples 3 - 4 (2-4 hours): Slightly more stable "emulsion", low water uptake so far more oil
droplets were present in the water column.
Samples 5 - 6 (6-12 hours): The emulsion appeared darker, but the emulsion was not more stable.
Sample 7 (24 hours): Less oil on surface, more oil droplets in the water column.
Sample 8 (48 hours): Very little oil left on surface – surface sampling became more challenging.
Sample 9 (72 hours): Almost no oil on surface available for dispersant application.
In-situ chemical dispersion on Northstar crude oil
After 72 hours of weathering, the remaining oil was gathered and the dispersant (Corexit 9500)
was applied onto the water surface on the remaining w/o-emulsion (in-situ application). The
remaining emulsion dispersed easily into the water column. Less than 10 % of the total volume of
oil (approx. 8.8 liters) was available for chemical dispersion, and Corexit 9500 was sprayed only
once on the slick with a dosage-to-oil ratio (DOR) of 1:10 and a dosage-to-emulsion ratio (DER)
of 1:12.
Sample 1 –30 minutes Sample 2 –1 hour
Sample 3 –2 hours
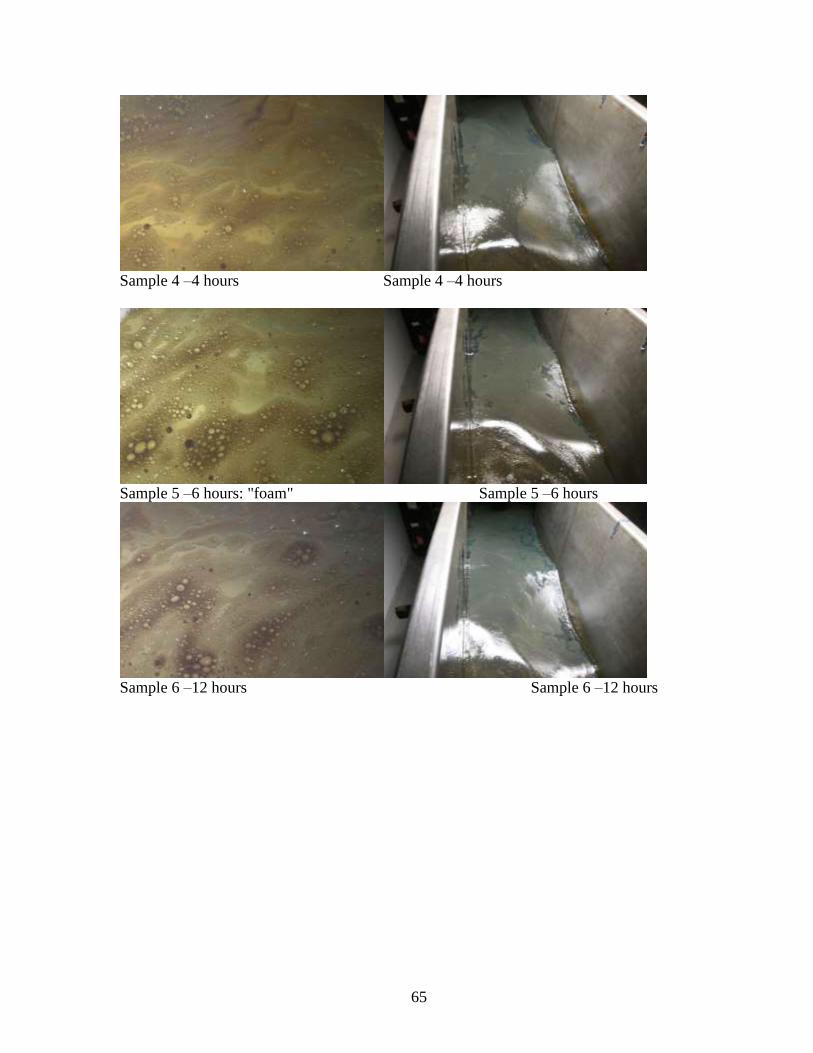
65
Sample 4 –4 hours Sample 4 –4 hours
Sample 5 –6 hours: "foam" Sample 5 –6 hours
Sample 6 –12 hours Sample 6 –12 hours
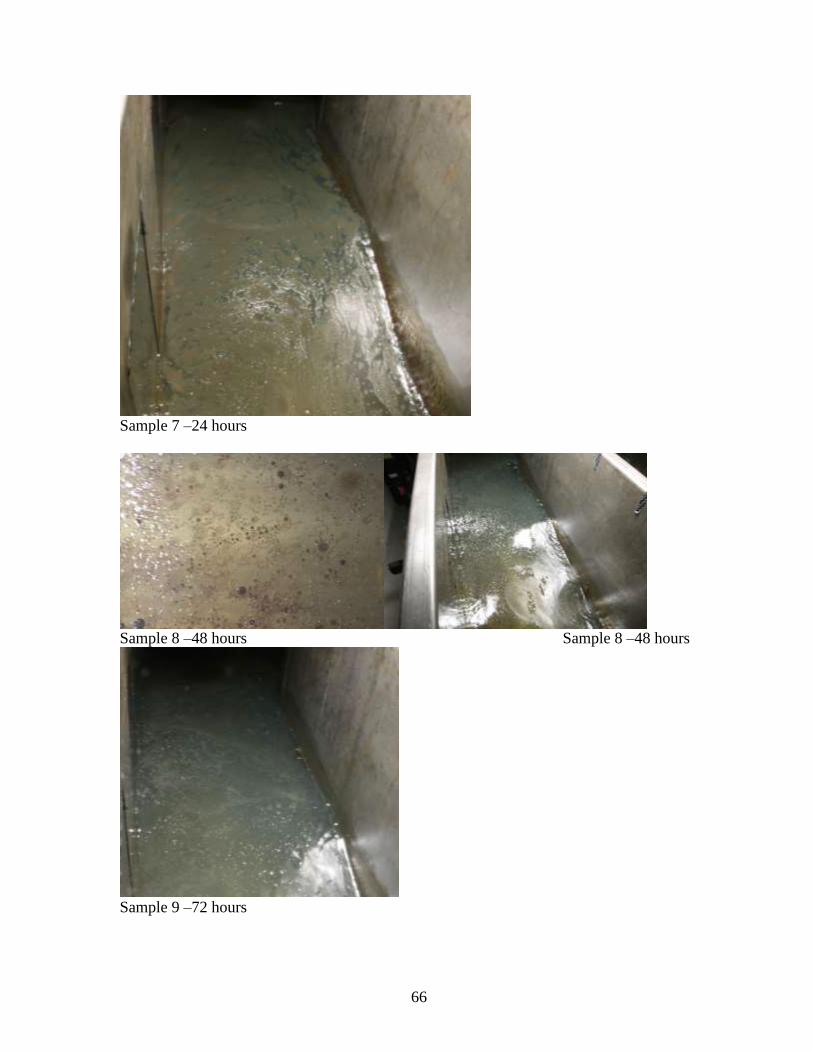
66
Sample 7 –24 hours
Sample 8 –48 hours Sample 8 –48 hours
Sample 9 –72 hours
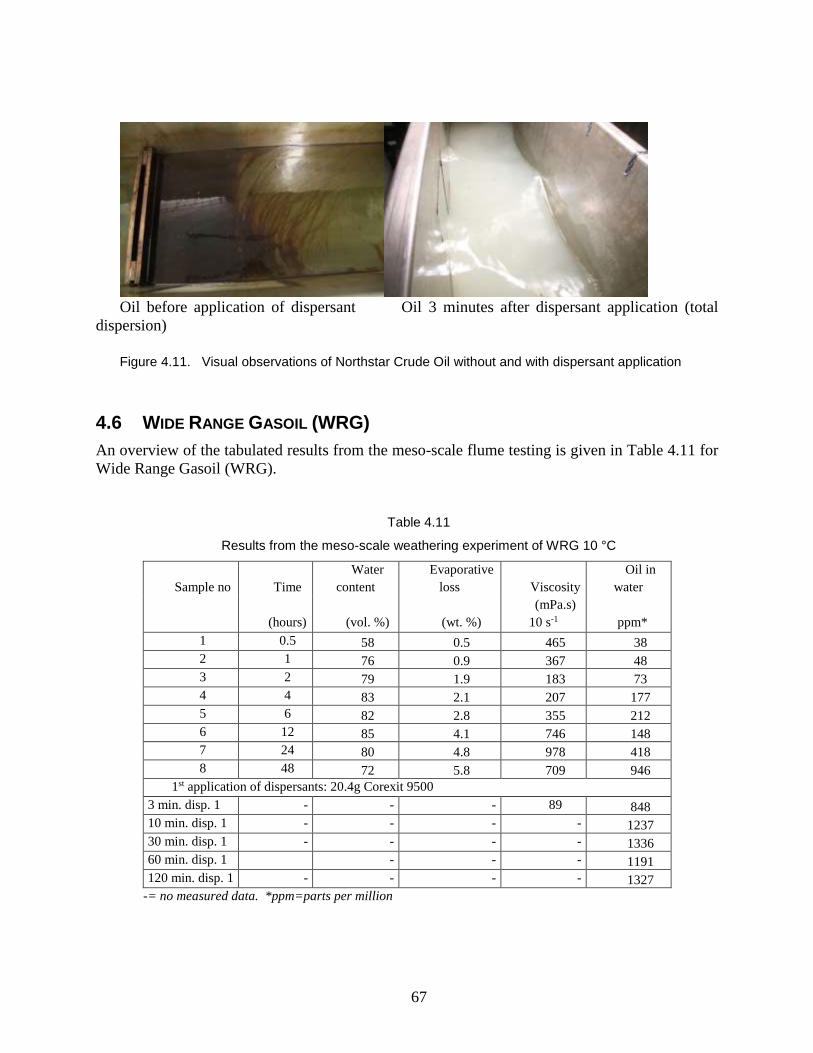
67
Oil before application of dispersant Oil 3 minutes after dispersant application (total
dispersion)
Figure 4.11. Visual observations of Northstar Crude Oil without and with dispersant application
4.6 WIDE RANGE GASOIL (WRG)
An overview of the tabulated results from the meso-scale flume testing is given in Table 4.11 for
Wide Range Gasoil (WRG).
Table 4.11
Results from the meso-scale weathering experiment of WRG 10 °C
Sample no Time
Water
content
Evaporative
loss Viscosity
Oil in
water
(hours) (vol. %) (wt. %)
(mPa.s)
10 s-1 ppm*
1 0.5 58 0.5 465 38
2 1 76 0.9 367 48
3 2 79 1.9 183 73
4 4 83 2.1 207 177
5 6 82 2.8 355 212
6 12 85 4.1 746 148
7 24 80 4.8 978 418
8 48 72 5.8 709 946
1st application of dispersants: 20.4g Corexit 9500
3 min. disp. 1 - - - 89 848
10 min. disp. 1 - - - - 1237
30 min. disp. 1 - - - - 1336
60 min. disp. 1 - - - 1191
120 min. disp. 1 - - - - 1327
-= no measured data. *ppm=parts per million
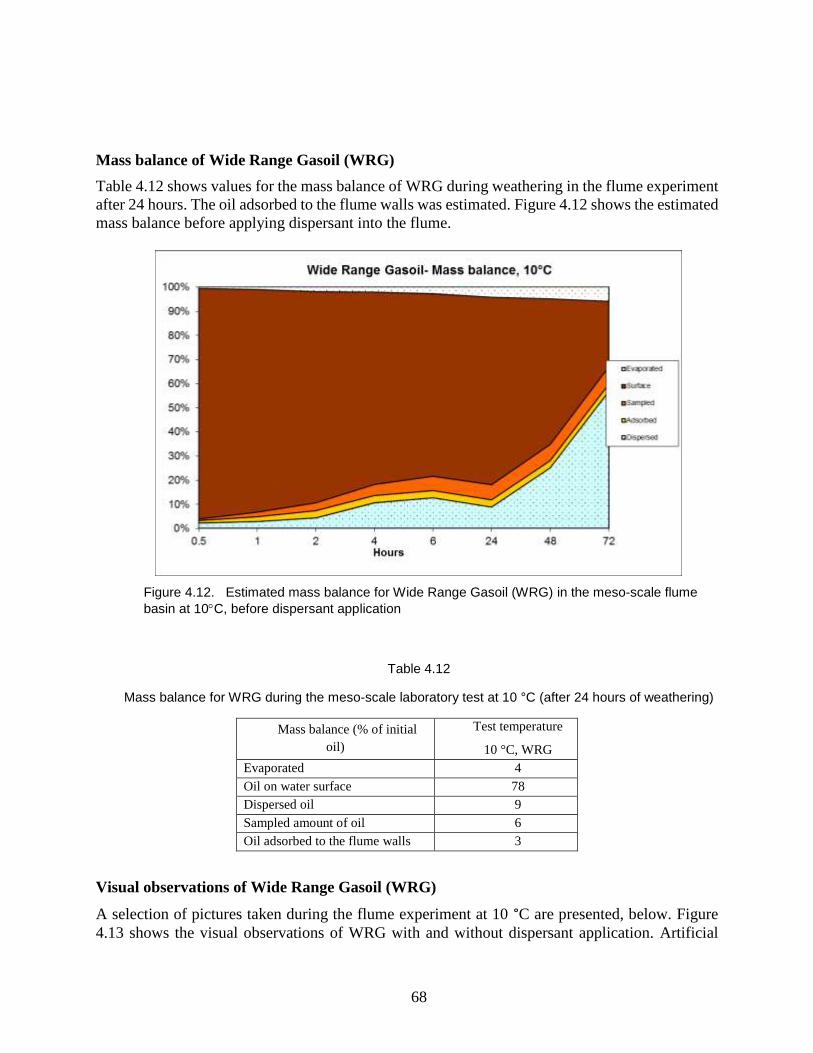
68
Mass balance of Wide Range Gasoil (WRG)
Table 4.12 shows values for the mass balance of WRG during weathering in the flume experiment
after 24 hours. The oil adsorbed to the flume walls was estimated. Figure 4.12 shows the estimated
mass balance before applying dispersant into the flume.
Figure 4.12. Estimated mass balance for Wide Range Gasoil (WRG) in the meso-scale flume
basin at 10C, before dispersant application
Table 4.12
Mass balance for WRG during the meso-scale laboratory test at 10 °C (after 24 hours of weathering)
Mass balance (% of initial
oil)
Test temperature
10 °C, WRG
Evaporated 4
Oil on water surface 78
Dispersed oil 9
Sampled amount of oil 6
Oil adsorbed to the flume walls 3
Visual observations of Wide Range Gasoil (WRG)
A selection of pictures taken during the flume experiment at 10 °C are presented, below. Figure
4.13 shows the visual observations of WRG with and without dispersant application. Artificial
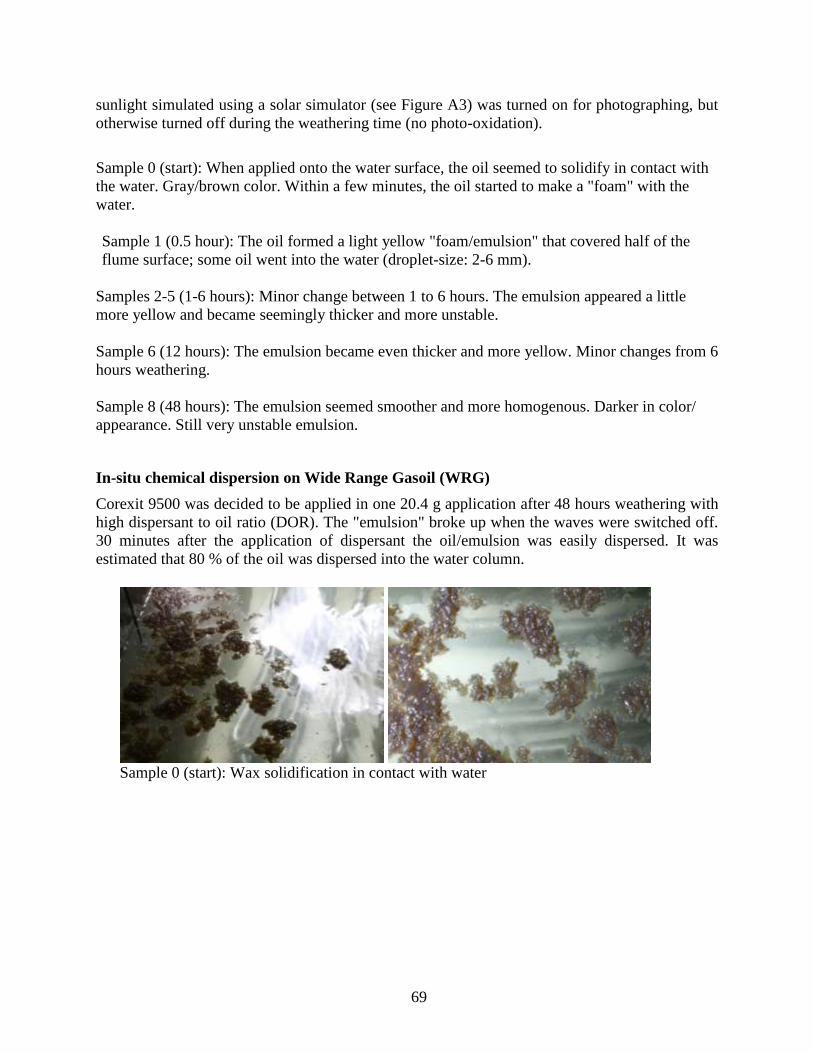
69
sunlight simulated using a solar simulator (see Figure A3) was turned on for photographing, but
otherwise turned off during the weathering time (no photo-oxidation).
Sample 0 (start): When applied onto the water surface, the oil seemed to solidify in contact with
the water. Gray/brown color. Within a few minutes, the oil started to make a "foam" with the
water.
Sample 1 (0.5 hour): The oil formed a light yellow "foam/emulsion" that covered half of the
flume surface; some oil went into the water (droplet-size: 2-6 mm).
Samples 2-5 (1-6 hours): Minor change between 1 to 6 hours. The emulsion appeared a little
more yellow and became seemingly thicker and more unstable.
Sample 6 (12 hours): The emulsion became even thicker and more yellow. Minor changes from 6
hours weathering.
Sample 8 (48 hours): The emulsion seemed smoother and more homogenous. Darker in color/
appearance. Still very unstable emulsion.
In-situ chemical dispersion on Wide Range Gasoil (WRG)
Corexit 9500 was decided to be applied in one 20.4 g application after 48 hours weathering with
high dispersant to oil ratio (DOR). The "emulsion" broke up when the waves were switched off.
30 minutes after the application of dispersant the oil/emulsion was easily dispersed. It was
estimated that 80 % of the oil was dispersed into the water column.
Sample 0 (start): Wax solidification in contact with water
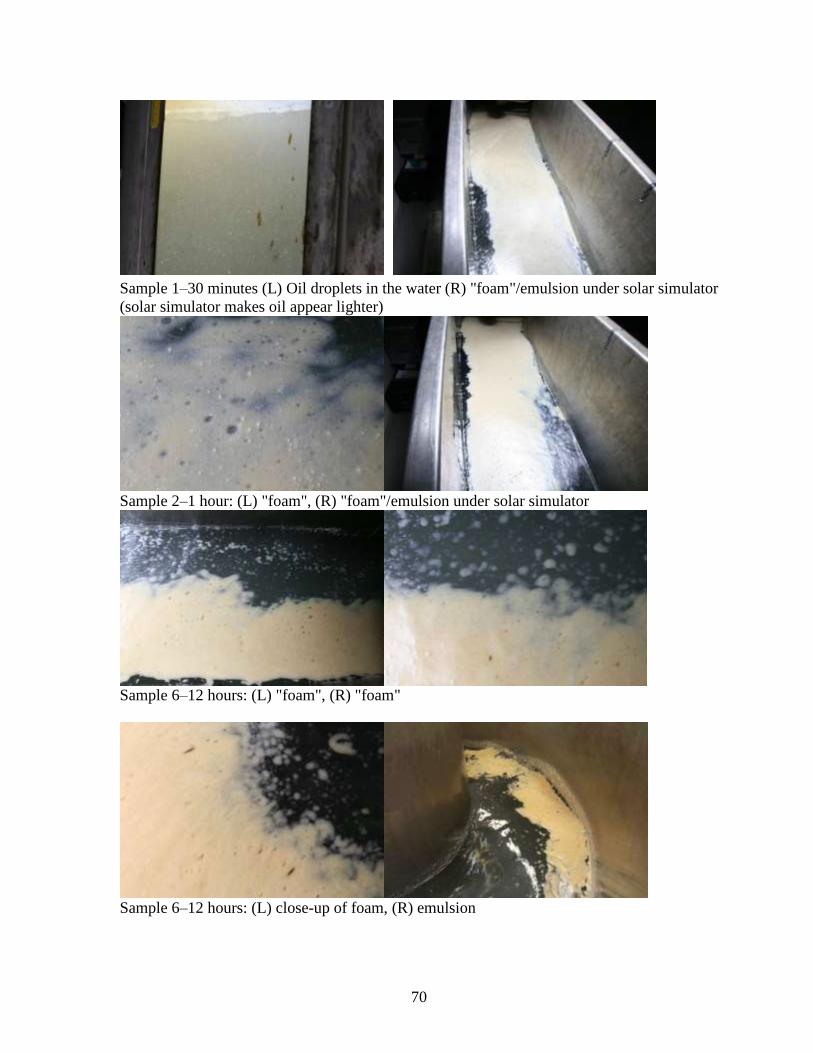
70
Sample 1–30 minutes (L) Oil droplets in the water (R) "foam"/emulsion under solar simulator
(solar simulator makes oil appear lighter)
Sample 2–1 hour: (L) "foam", (R) "foam"/emulsion under solar simulator
Sample 6–12 hours: (L) "foam", (R) "foam"
Sample 6–12 hours: (L) close-up of foam, (R) emulsion
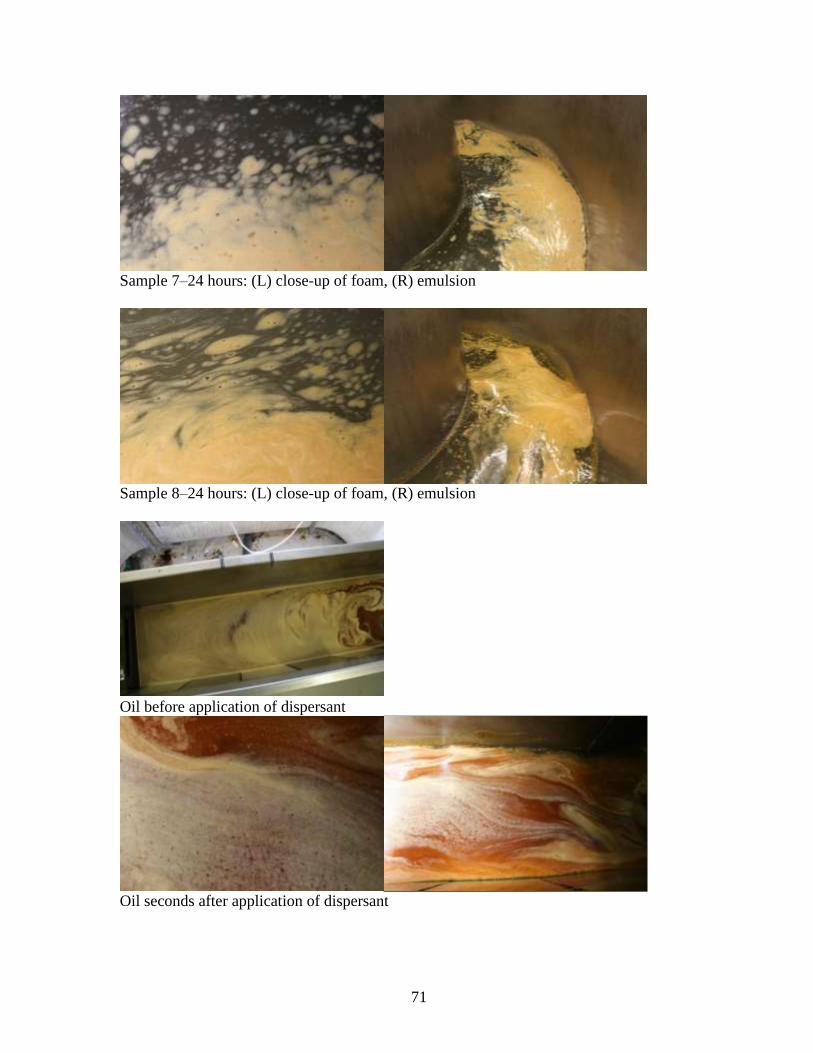
71
Sample 7–24 hours: (L) close-up of foam, (R) emulsion
Sample 8–24 hours: (L) close-up of foam, (R) emulsion
Oil before application of dispersant
Oil seconds after application of dispersant
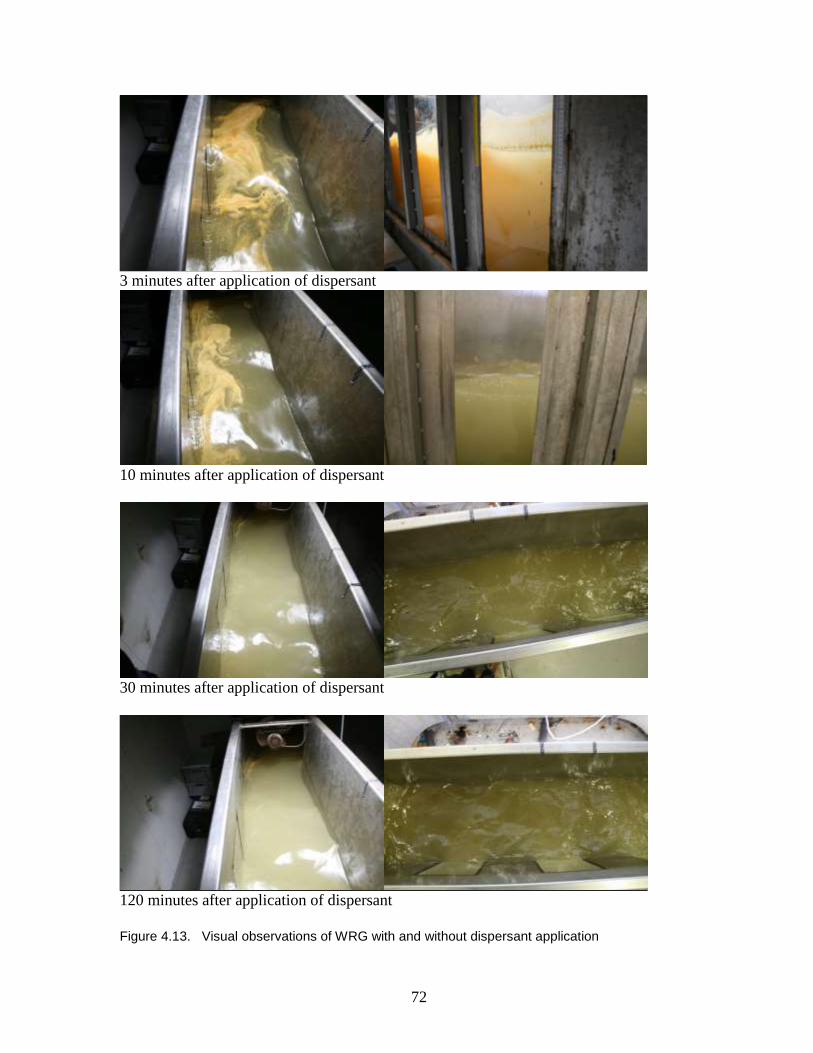
72
3 minutes after application of dispersant
10 minutes after application of dispersant
30 minutes after application of dispersant
120 minutes after application of dispersant
Figure 4.13. Visual observations of WRG with and without dispersant application
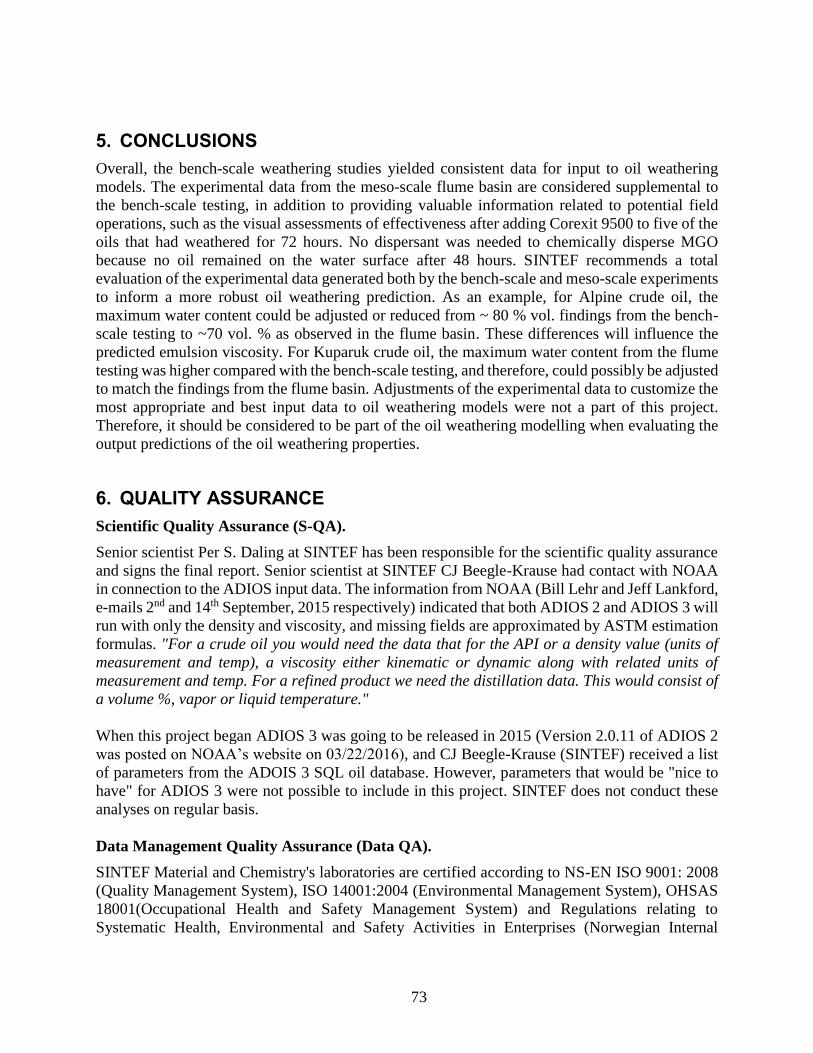
73
5. CONCLUSIONS
Overall, the bench-scale weathering studies yielded consistent data for input to oil weathering
models. The experimental data from the meso-scale flume basin are considered supplemental to
the bench-scale testing, in addition to providing valuable information related to potential field
operations, such as the visual assessments of effectiveness after adding Corexit 9500 to five of the
oils that had weathered for 72 hours. No dispersant was needed to chemically disperse MGO
because no oil remained on the water surface after 48 hours. SINTEF recommends a total
evaluation of the experimental data generated both by the bench-scale and meso-scale experiments
to inform a more robust oil weathering prediction. As an example, for Alpine crude oil, the
maximum water content could be adjusted or reduced from ~ 80 % vol. findings from the bench-
scale testing to ~70 vol. % as observed in the flume basin. These differences will influence the
predicted emulsion viscosity. For Kuparuk crude oil, the maximum water content from the flume
testing was higher compared with the bench-scale testing, and therefore, could possibly be adjusted
to match the findings from the flume basin. Adjustments of the experimental data to customize the
most appropriate and best input data to oil weathering models were not a part of this project.
Therefore, it should be considered to be part of the oil weathering modelling when evaluating the
output predictions of the oil weathering properties.
6. QUALITY ASSURANCE
Scientific Quality Assurance (S-QA).
Senior scientist Per S. Daling at SINTEF has been responsible for the scientific quality assurance
and signs the final report. Senior scientist at SINTEF CJ Beegle-Krause had contact with NOAA
in connection to the ADIOS input data. The information from NOAA (Bill Lehr and Jeff Lankford,
e-mails 2nd and 14th September, 2015 respectively) indicated that both ADIOS 2 and ADIOS 3 will
run with only the density and viscosity, and missing fields are approximated by ASTM estimation
formulas. "For a crude oil you would need the data that for the API or a density value (units of
measurement and temp), a viscosity either kinematic or dynamic along with related units of
measurement and temp. For a refined product we need the distillation data. This would consist of
a volume %, vapor or liquid temperature."
When this project began ADIOS 3 was going to be released in 2015 (Version 2.0.11 of ADIOS 2
was posted on NOAA’s website on 03/22/2016), and CJ Beegle-Krause (SINTEF) received a list
of parameters from the ADOIS 3 SQL oil database. However, parameters that would be "nice to
have" for ADIOS 3 were not possible to include in this project. SINTEF does not conduct these
analyses on regular basis.
Data Management Quality Assurance (Data QA).
SINTEF Material and Chemistry's laboratories are certified according to NS-EN ISO 9001: 2008
(Quality Management System), ISO 14001:2004 (Environmental Management System), OHSAS
18001(Occupational Health and Safety Management System) and Regulations relating to
Systematic Health, Environmental and Safety Activities in Enterprises (Norwegian Internal
74
Control Regulations), all which are international accepted standards for management of quality,
environment and occupational health and safety.
The laboratory personnel have followed SINTEF laboratory SOP (Standard Operational
Procedures). Samples and the obtained experimental data were also identified with unique
identification numbers found in the laboratory database system and/or in the laboratory journals.
Jon Olav Bjørgum (QA manager at SINTEF Materials and Chemistry) was responsible for
SINTEF data management in this project, according to procedures in SINTEF ISO certificate
management system to ensure chain of custody in laboratory reporting. Regular backups of all
central servers in SINTEF are performed on a daily basis by SINTEF’s CT service contractor,
EVRY (www.evry.no).
7. REFERENCES
Bridié A.L., T.H. Wanders and W.V. Zegweld, H.B. den Heijde. 1980. Formation, Prevention
and Breaking of Seawater in Crude Oil Emulsions, Chocolate Mousse. Marine Poll. Bull., vol
11, pp. 343-348.
Daling, P. S., Brandvik, P. J., Mackay, D., Johansen, Ø. 1990: Characterization of crude oils for
environmental purposes. Oil & Chemical Pollution 7, 1990, pp.199-224.
Daling, P.S. and Brandvik, P.J., 1991: Characterization and prediction of the weathering
properties of oils at sea – A manual for the oils investigated in the DIWO project. IKU
Report No: 02.0786.00/16/91.
Hokstad, J. N., Daling, P. S., Lewis, A., Strøm-Kristiansen, T. 1993: Methodology for testing
water-in-oil emulsions and demulsifiers Description of laboratory procedures. In:
Proceedings Workshop on Formation and Breaking of W/O Emulsions. MSRC, Alberta June
14-15 24p.
Johansen, Ø. 1991. Numerical modelling of physical properties of weathered North Sea crude
oils. DIWO-report no. 15. IKU-report 02.0786.00/15/91. Open.
Leirvik F, Schrader T and M. Moldestad. 2002: Weathering properties of Endicott, Milne Point
unit, High Island Composite, the Alpine composite, the Neptune Field Composite and North
Star oil samples. SINTEF report STF66 A02114, Unrestricted. :
http://www.boem.gov/BOEM-Newsroom/Library/Publications/2005/2005_020_appB.aspx
Mackay, D. and Zagorski, W. 1982. Studies of W/o Emulsions". Report EE-34: Environment
Canada, Ottawa.
McDonagh, M, J.N. Hokstad and A.B. Nordvik. 1995. Standard procedure for viscosity
measurement of water-in-oil emulsions”. Marine Spill Response Corp., Washington, D.C.
MRSC Technical Report Series 95-030, 36 p.
75
Singsaas, I., Daling, P.S., Jensen, H., 1993: Meso-scale laboratory weathering of oils. IKU
report 22.2042.00/04/93. 81 p.
Stiver, W. and D. Mackay. 1984. Evaporation rate of spills of hydrocarbons and petroleum
mixtures. Environ, Sci. Technol., vol. 18 (11), pp. 834-840.
Sørheim, K.R. and P. Daling. 2015. Fysikalsk-kjemiske analyser og emuleringsegenskaper av
ulike dieselkvaliteter. In English: Physico-chemial analyis and emulsion properties of diesel
oils. SINTEF report A27122 (Unresricted), ISBN no. 978-82-14-05844-4.
76
Appendix A
Experimental setup
The testing of the weathering properties was performed at 10 °C in accordance with the Client.
A.1 Bench-scale laboratory methodology
To isolate and map the various weathering processes at sea, the oil was exposed to a systematic,
stepwise procedure developed at SINTEF (Daling et al., 1990). The weathering process is
illustrated in Figure A.1.
WOR: Water to Oil Ratio
WOR=1: 50 vol.% water
WOR=3: 75 vol.% water
WOR=max: the maximum
water content
Figure A.1. Bench-scale laboratory weathering flow chart of oil
A.1.1 Evaporation
The evaporation procedure used is described in Stiver and Mackay (1984). Evaporation of the
lighter compounds from the fresh condensate was carried out as a simple one-step distillation to
vapor temperatures of 150C, 200C and 250C, which resulted in condensate residues with an
evaporation loss corresponding to approximately 0.5-1 hour, 0.5-1 day and 0.5-1 week of
weathering on the sea surface. These residues are referred to as 150C+, 200C+ and 250C+,
respectively.
A.1.2 Physical and chemical analysis
The viscosity, density, pour point and flash point of the fresh and water-free residues was analyzed.
In addition wax content and "hard" asphaltenes was measured for the 250C+ residue. Viscosity
for all the w/o- emulsions was determined. The analytical methods used are given in Table A.1
and Table A.2.
.
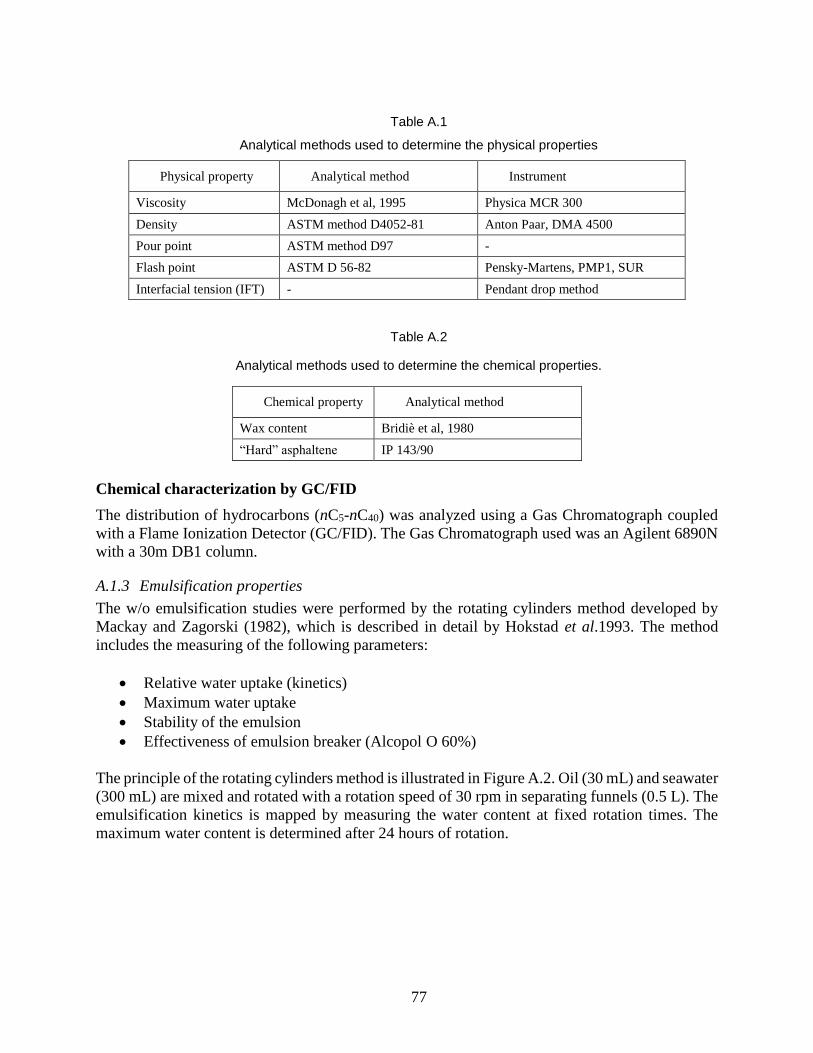
77
Table A.1
Analytical methods used to determine the physical properties
Physical property Analytical method Instrument
Viscosity McDonagh et al, 1995 Physica MCR 300
Density ASTM method D4052-81 Anton Paar, DMA 4500
Pour point ASTM method D97 -
Flash point ASTM D 56-82 Pensky-Martens, PMP1, SUR
Interfacial tension (IFT) - Pendant drop method
Table A.2
Analytical methods used to determine the chemical properties.
Chemical property Analytical method
Wax content Bridiè et al, 1980
“Hard” asphaltene IP 143/90
Chemical characterization by GC/FID
The distribution of hydrocarbons (nC5-nC40) was analyzed using a Gas Chromatograph coupled
with a Flame Ionization Detector (GC/FID). The Gas Chromatograph used was an Agilent 6890N
with a 30m DB1 column.
A.1.3 Emulsification properties
The w/o emulsification studies were performed by the rotating cylinders method developed by
Mackay and Zagorski (1982), which is described in detail by Hokstad et al.1993. The method
includes the measuring of the following parameters:
Relative water uptake (kinetics)
Maximum water uptake
Stability of the emulsion
Effectiveness of emulsion breaker (Alcopol O 60%)
The principle of the rotating cylinders method is illustrated in Figure A.2. Oil (30 mL) and seawater
(300 mL) are mixed and rotated with a rotation speed of 30 rpm in separating funnels (0.5 L). The
emulsification kinetics is mapped by measuring the water content at fixed rotation times. The
maximum water content is determined after 24 hours of rotation.
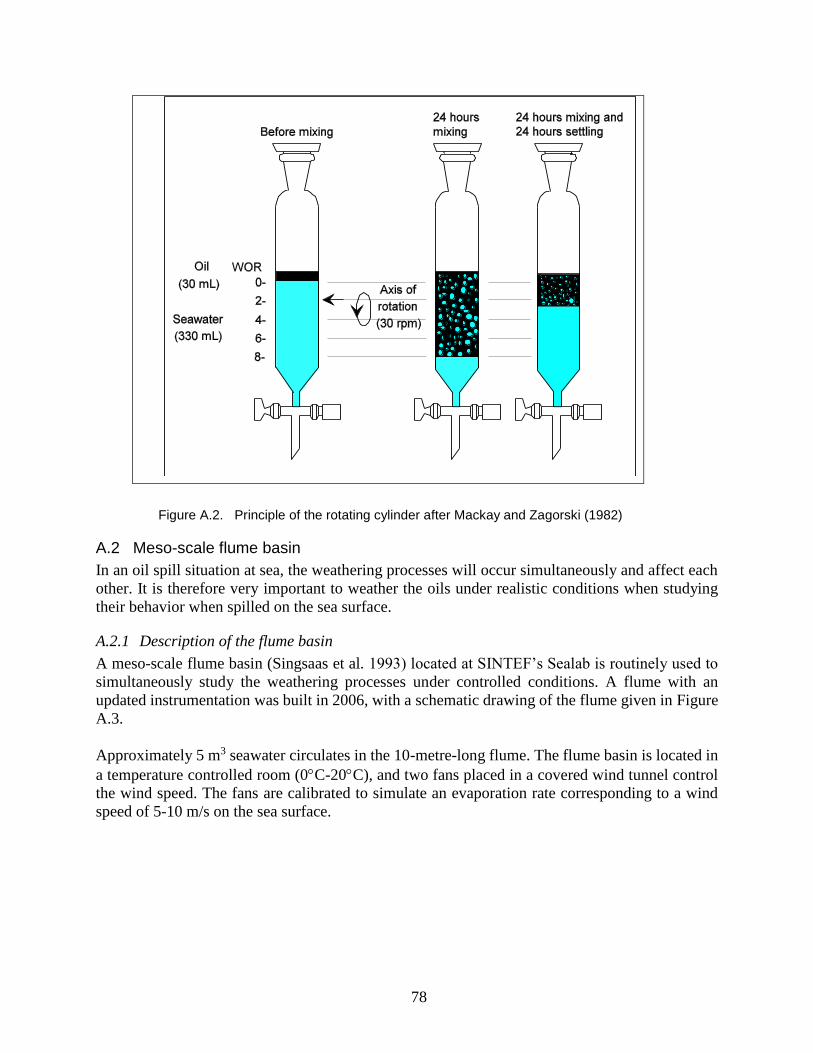
78
Figure A.2. Principle of the rotating cylinder after Mackay and Zagorski (1982)
A.2 Meso-scale flume basin
In an oil spill situation at sea, the weathering processes will occur simultaneously and affect each
other. It is therefore very important to weather the oils under realistic conditions when studying
their behavior when spilled on the sea surface.
A.2.1 Description of the flume basin
A meso-scale flume basin (Singsaas et al. 1993) located at SINTEF’s Sealab is routinely used to
simultaneously study the weathering processes under controlled conditions. A flume with an
updated instrumentation was built in 2006, with a schematic drawing of the flume given in Figure
A.3.
Approximately 5 m3 seawater circulates in the 10-metre-long flume. The flume basin is located in
a temperature controlled room (0C-20C), and two fans placed in a covered wind tunnel control
the wind speed. The fans are calibrated to simulate an evaporation rate corresponding to a wind
speed of 5-10 m/s on the sea surface.
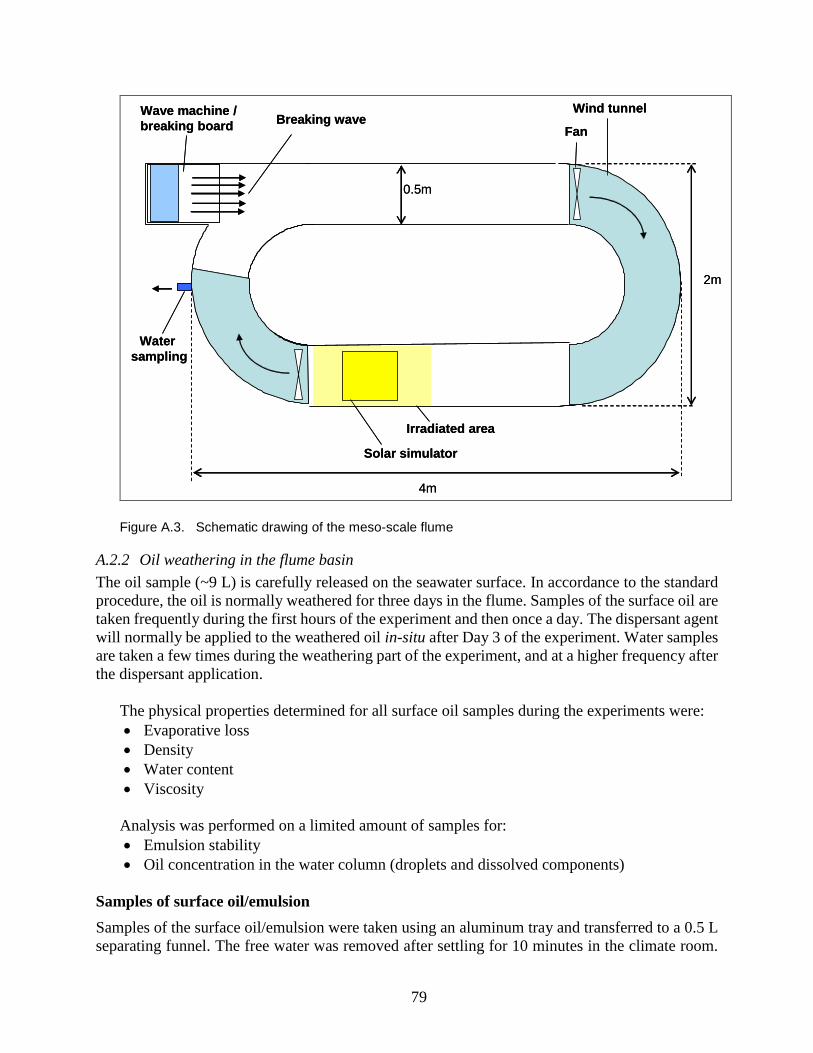
79
Figure A.3. Schematic drawing of the meso-scale flume
A.2.2 Oil weathering in the flume basin
The oil sample (~9 L) is carefully released on the seawater surface. In accordance to the standard
procedure, the oil is normally weathered for three days in the flume. Samples of the surface oil are
taken frequently during the first hours of the experiment and then once a day. The dispersant agent
will normally be applied to the weathered oil in-situ after Day 3 of the experiment. Water samples
are taken a few times during the weathering part of the experiment, and at a higher frequency after
the dispersant application.
The physical properties determined for all surface oil samples during the experiments were:
Evaporative loss
Density
Water content
Viscosity
Analysis was performed on a limited amount of samples for:
Emulsion stability
Oil concentration in the water column (droplets and dissolved components)
Samples of surface oil/emulsion
Samples of the surface oil/emulsion were taken using an aluminum tray and transferred to a 0.5 L
separating funnel. The free water was removed after settling for 10 minutes in the climate room.
Solar simulator
Irradiated area
Fan
Wind tunnel
Water
sampling
Wave machine /
breaking boardBreaking wave
0.5m
2m
4m
Solar simulator
Irradiated area
Fan
Wind tunnel
Water
sampling
Wave machine /
breaking boardBreaking wave
0.5m
2m
4m
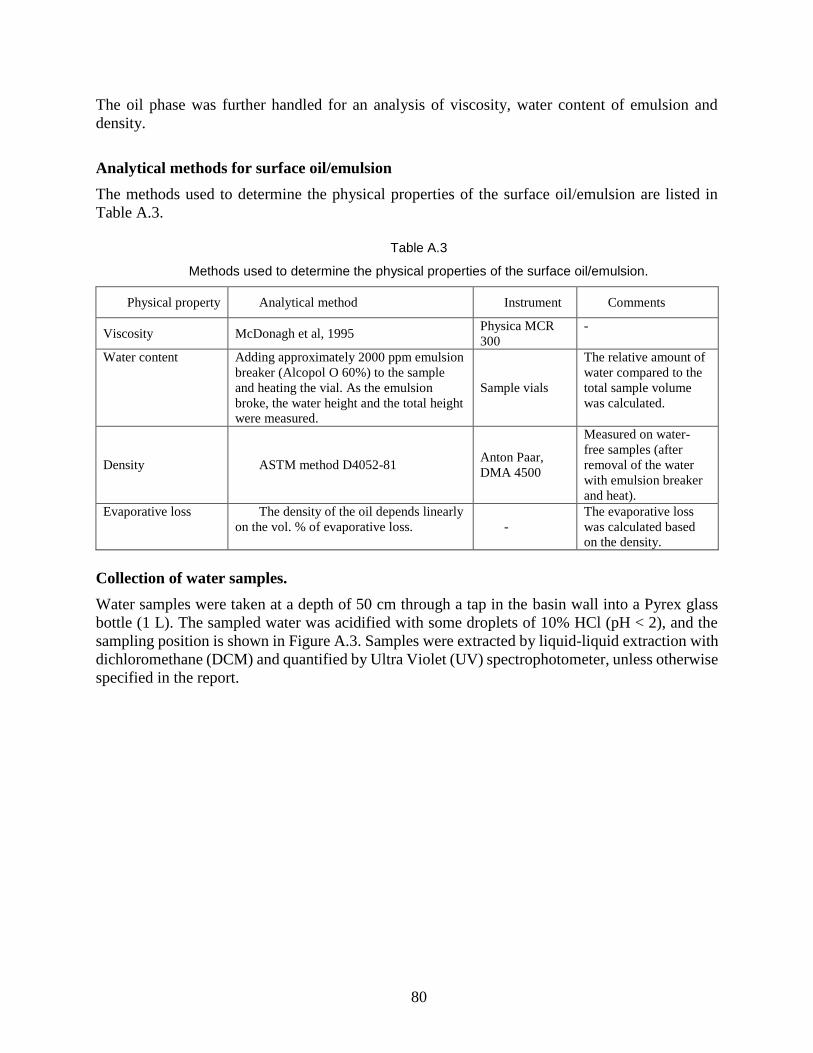
80
The oil phase was further handled for an analysis of viscosity, water content of emulsion and
density.
Analytical methods for surface oil/emulsion
The methods used to determine the physical properties of the surface oil/emulsion are listed in
Table A.3.
Table A.3
Methods used to determine the physical properties of the surface oil/emulsion.
Physical property Analytical method Instrument Comments
Viscosity McDonagh et al, 1995 Physica MCR
300
-
Water content
Adding approximately 2000 ppm emulsion
breaker (Alcopol O 60%) to the sample
and heating the vial. As the emulsion
broke, the water height and the total height
were measured.
Sample vials
The relative amount of
water compared to the
total sample volume
was calculated.
Density ASTM method D4052-81 Anton Paar,
DMA 4500
Measured on water-
free samples (after
removal of the water
with emulsion breaker
and heat).
Evaporative loss
The density of the oil depends linearly
on the vol. % of evaporative loss. -
The evaporative loss
was calculated based
on the density.
Collection of water samples.
Water samples were taken at a depth of 50 cm through a tap in the basin wall into a Pyrex glass
bottle (1 L). The sampled water was acidified with some droplets of 10% HCl (pH < 2), and the
sampling position is shown in Figure A.3. Samples were extracted by liquid-liquid extraction with
dichloromethane (DCM) and quantified by Ultra Violet (UV) spectrophotometer, unless otherwise
specified in the report.
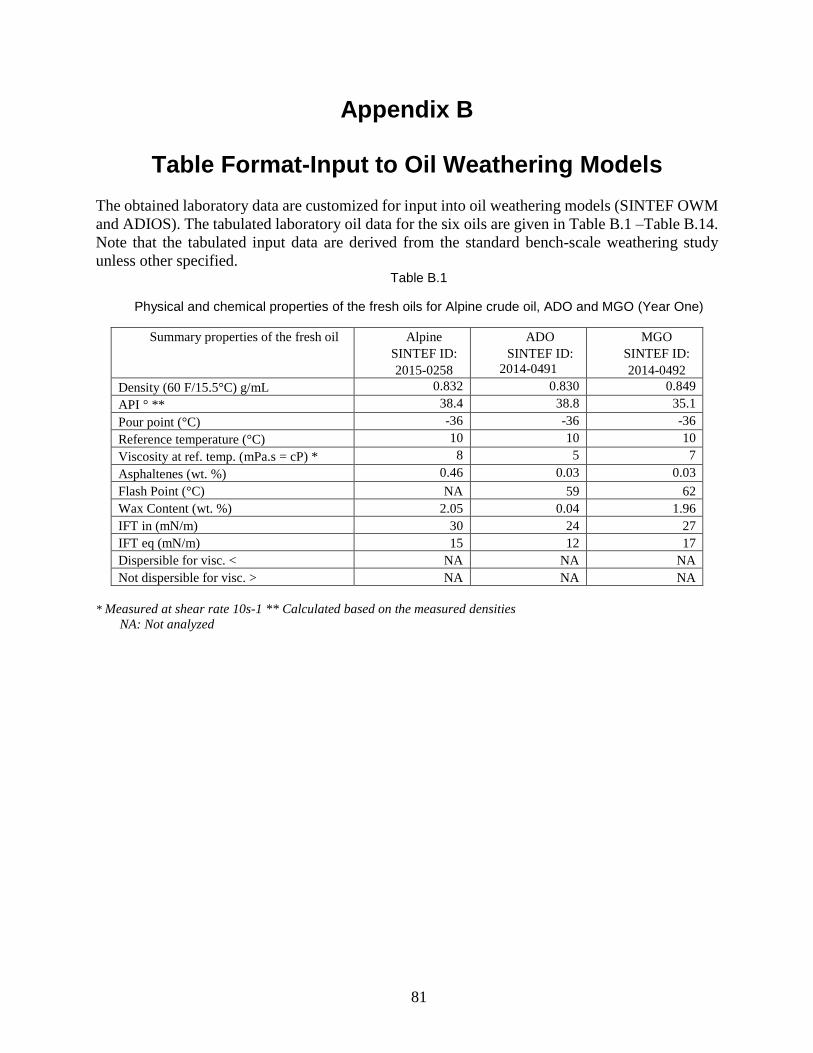
81
Appendix B
Table Format-Input to Oil Weathering Models
The obtained laboratory data are customized for input into oil weathering models (SINTEF OWM
and ADIOS). The tabulated laboratory oil data for the six oils are given in Table B.1 –Table B.14.
Note that the tabulated input data are derived from the standard bench-scale weathering study
unless other specified. Table B.1
Physical and chemical properties of the fresh oils for Alpine crude oil, ADO and MGO (Year One)
* Measured at shear rate 10s-1 ** Calculated based on the measured densities
NA: Not analyzed
Summary properties of the fresh oil Alpine
SINTEF ID:
2015-0258
ADO
SINTEF ID:
2014-0491
MGO
SINTEF ID:
2014-0492
Density (60 F/15.5°C) g/mL 0.832 0.830 0.849
API ° ** 38.4 38.8 35.1
Pour point (°C) -36 -36 -36
Reference temperature (°C) 10 10 10
Viscosity at ref. temp. (mPa.s = cP) * 8 5 7
Asphaltenes (wt. %) 0.46 0.03 0.03
Flash Point (°C) NA 59 62
Wax Content (wt. %) 2.05 0.04 1.96
IFT in (mN/m) 30 24 27
IFT eq (mN/m) 15 12 17
Dispersible for visc. < NA NA NA
Not dispersible for visc. > NA NA NA
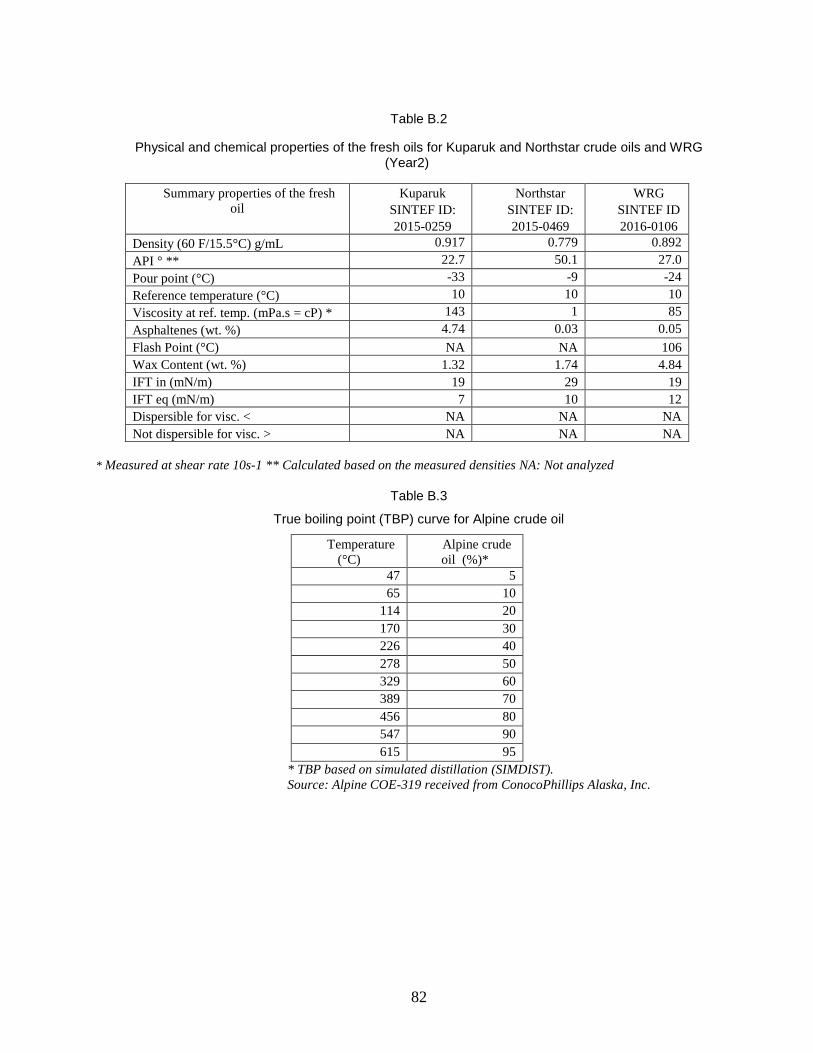
82
Table B.2
Physical and chemical properties of the fresh oils for Kuparuk and Northstar crude oils and WRG (Year2)
* Measured at shear rate 10s-1 ** Calculated based on the measured densities NA: Not analyzed
Table B.3
True boiling point (TBP) curve for Alpine crude oil
Temperature
(°C)
Alpine crude
oil (%)*
47 5
65 10
114 20
170 30
226 40
278 50
329 60
389 70
456 80
547 90
615 95
* TBP based on simulated distillation (SIMDIST).
Source: Alpine COE-319 received from ConocoPhillips Alaska, Inc.
Summary properties of the fresh
oil
Kuparuk
SINTEF ID:
2015-0259
Northstar
SINTEF ID:
2015-0469
WRG
SINTEF ID
2016-0106
Density (60 F/15.5°C) g/mL 0.917 0.779 0.892
API ° ** 22.7 50.1 27.0
Pour point (°C) -33 -9 -24
Reference temperature (°C) 10 10 10
Viscosity at ref. temp. (mPa.s = cP) * 143 1 85
Asphaltenes (wt. %) 4.74 0.03 0.05
Flash Point (°C) NA NA 106
Wax Content (wt. %) 1.32 1.74 4.84
IFT in (mN/m) 19 29 19
IFT eq (mN/m) 7 10 12
Dispersible for visc. < NA NA NA
Not dispersible for visc. > NA NA NA
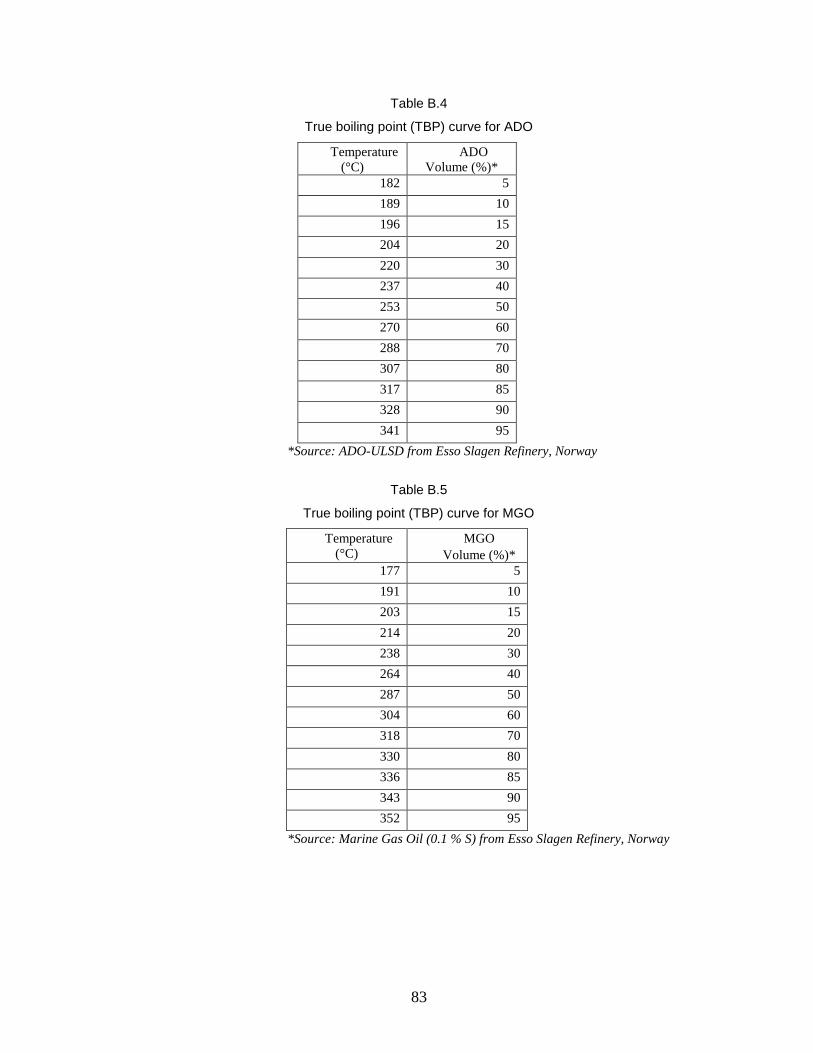
83
Table B.4
True boiling point (TBP) curve for ADO
Temperature
(°C)
ADO
Volume (%)*
182 5
189 10
196 15
204 20
220 30
237 40
253 50
270 60
288 70
307 80
317 85
328 90
341 95
*Source: ADO-ULSD from Esso Slagen Refinery, Norway
Table B.5
True boiling point (TBP) curve for MGO
Temperature
(°C)
MGO
Volume (%)*
177 5
191 10
203 15
214 20
238 30
264 40
287 50
304 60
318 70
330 80
336 85
343 90
352 95
*Source: Marine Gas Oil (0.1 % S) from Esso Slagen Refinery, Norway
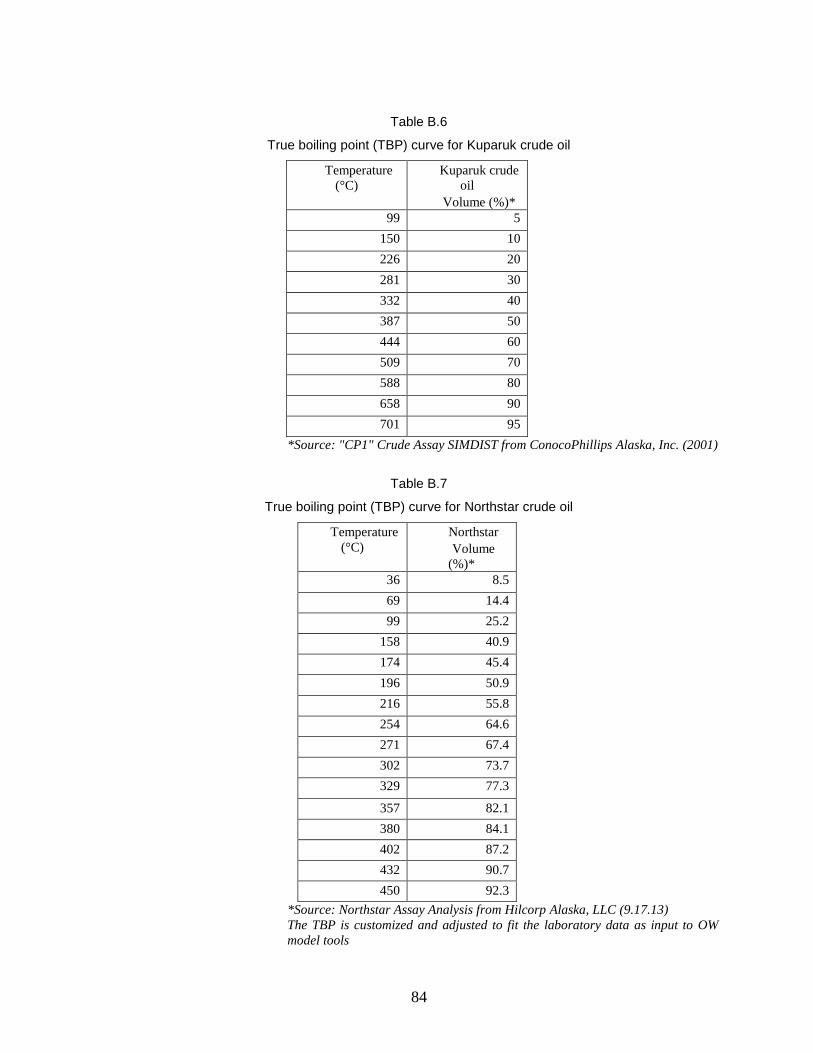
84
Table B.6
True boiling point (TBP) curve for Kuparuk crude oil
Temperature
(°C)
Kuparuk crude
oil
Volume (%)*
99 5
150 10
226 20
281 30
332 40
387 50
444 60
509 70
588 80
658 90
701 95
*Source: "CP1" Crude Assay SIMDIST from ConocoPhillips Alaska, Inc. (2001)
Table B.7
True boiling point (TBP) curve for Northstar crude oil
Temperature
(°C)
Northstar
Volume
(%)*
36 8.5
69 14.4
99 25.2
158 40.9
174 45.4
196 50.9
216 55.8
254 64.6
271 67.4
302 73.7
329 77.3
357 82.1
380 84.1
402 87.2
432 90.7
450 92.3
*Source: Northstar Assay Analysis from Hilcorp Alaska, LLC (9.17.13)
The TBP is customized and adjusted to fit the laboratory data as input to OW
model tools
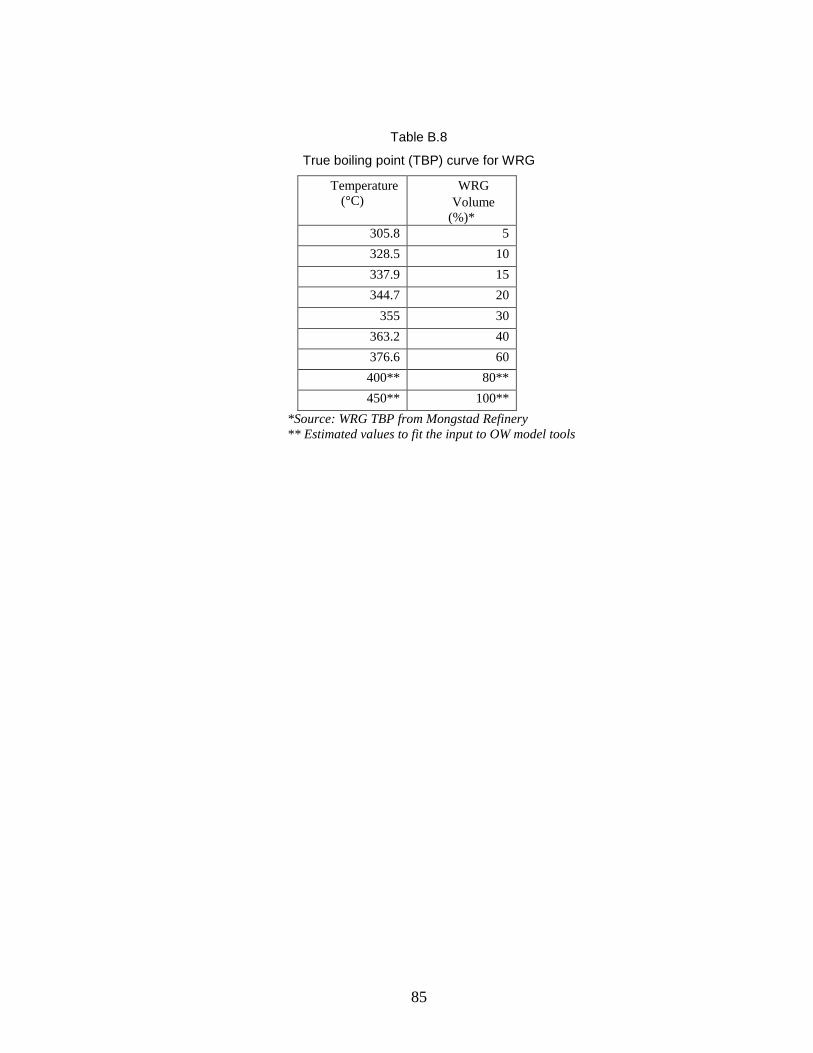
85
Table B.8
True boiling point (TBP) curve for WRG
Temperature
(°C)
WRG
Volume
(%)*
305.8 5
328.5 10
337.9 15
344.7 20
355 30
363.2 40
376.6 60
400** 80**
450** 100**
*Source: WRG TBP from Mongstad Refinery
** Estimated values to fit the input to OW model tools
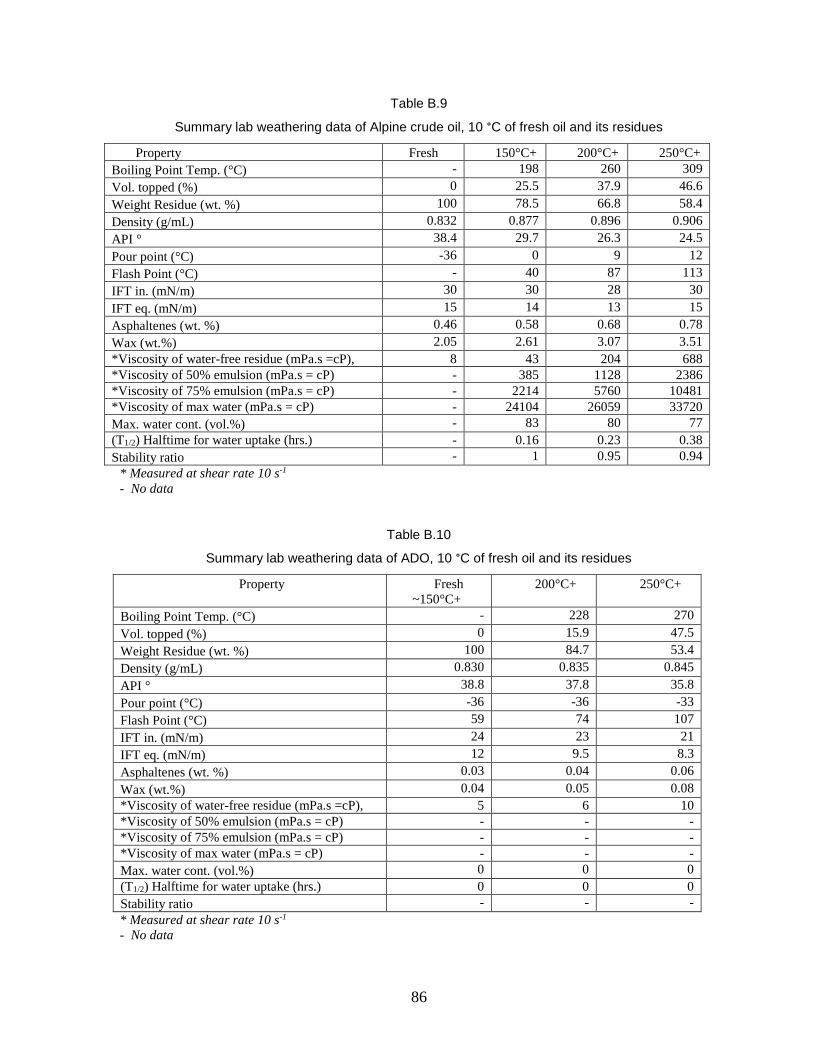
86
Table B.9
Summary lab weathering data of Alpine crude oil, 10 °C of fresh oil and its residues
Property Fresh 150°C+ 200°C+ 250°C+
Boiling Point Temp. (°C) - 198 260 309
Vol. topped (%) 0 25.5 37.9 46.6
Weight Residue (wt. %) 100 78.5 66.8 58.4
Density (g/mL) 0.832 0.877 0.896 0.906
API ° 38.4 29.7 26.3 24.5
Pour point (°C) -36 0 9 12
Flash Point (°C) - 40 87 113
IFT in. (mN/m) 30 30 28 30
IFT eq. (mN/m) 15 14 13 15
Asphaltenes (wt. %) 0.46 0.58 0.68 0.78
Wax (wt.%) 2.05 2.61 3.07 3.51
*Viscosity of water-free residue (mPa.s =cP), 8 43 204 688
*Viscosity of 50% emulsion (mPa.s = cP) - 385 1128 2386
*Viscosity of 75% emulsion (mPa.s = cP) - 2214 5760 10481
*Viscosity of max water (mPa.s = cP) - 24104 26059 33720
Max. water cont. (vol.%) - 83 80 77
(T1/2) Halftime for water uptake (hrs.) - 0.16 0.23 0.38
Stability ratio - 1 0.95 0.94
* Measured at shear rate 10 s-1
- No data
Table B.10
Summary lab weathering data of ADO, 10 °C of fresh oil and its residues
Property Fresh
~150°C+
200°C+ 250°C+
Boiling Point Temp. (°C) - 228 270
Vol. topped (%) 0 15.9 47.5
Weight Residue (wt. %) 100 84.7 53.4
Density (g/mL) 0.830 0.835 0.845
API ° 38.8 37.8 35.8
Pour point (°C) -36 -36 -33
Flash Point (°C) 59 74 107
IFT in. (mN/m) 24 23 21
IFT eq. (mN/m) 12 9.5 8.3
Asphaltenes (wt. %) 0.03 0.04 0.06
Wax (wt.%) 0.04 0.05 0.08
*Viscosity of water-free residue (mPa.s =cP), 5 6 10
*Viscosity of 50% emulsion (mPa.s = cP) - - -
*Viscosity of 75% emulsion (mPa.s = cP) - - -
*Viscosity of max water (mPa.s = cP) - - -
Max. water cont. (vol.%) 0 0 0
(T1/2) Halftime for water uptake (hrs.) 0 0 0
Stability ratio - - -
* Measured at shear rate 10 s-1
- No data
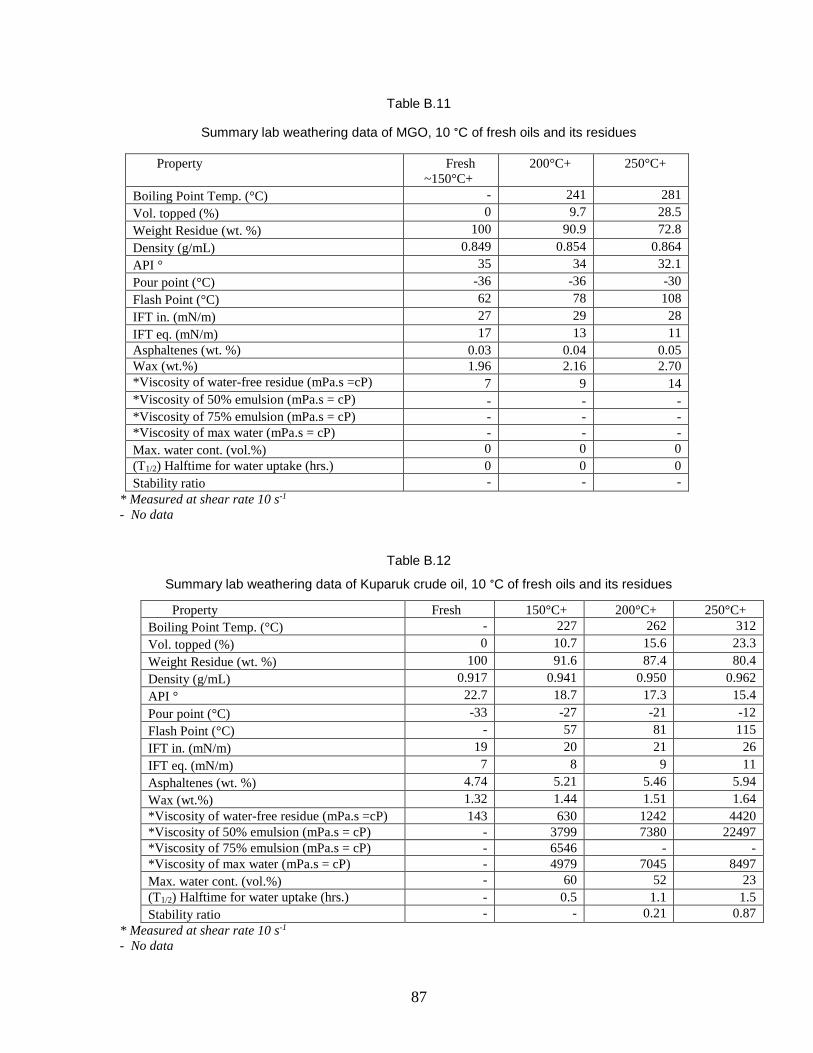
87
Table B.11
Summary lab weathering data of MGO, 10 °C of fresh oils and its residues
Property Fresh
~150°C+
200°C+ 250°C+
Boiling Point Temp. (°C) - 241 281
Vol. topped (%) 0 9.7 28.5
Weight Residue (wt. %) 100 90.9 72.8
Density (g/mL) 0.849 0.854 0.864
API ° 35 34 32.1
Pour point (°C) -36 -36 -30
Flash Point (°C) 62 78 108
IFT in. (mN/m) 27 29 28
IFT eq. (mN/m) 17 13 11
Asphaltenes (wt. %) 0.03 0.04 0.05
Wax (wt.%) 1.96 2.16 2.70
*Viscosity of water-free residue (mPa.s =cP) 7 9 14 *Viscosity of 50% emulsion (mPa.s = cP) - - - *Viscosity of 75% emulsion (mPa.s = cP) - - -
*Viscosity of max water (mPa.s = cP) - - -
Max. water cont. (vol.%) 0 0 0
(T1/2) Halftime for water uptake (hrs.) 0 0 0
Stability ratio - - -
* Measured at shear rate 10 s-1
- No data
Table B.12
Summary lab weathering data of Kuparuk crude oil, 10 °C of fresh oils and its residues
Property Fresh 150°C+ 200°C+ 250°C+
Boiling Point Temp. (°C) - 227 262 312
Vol. topped (%) 0 10.7 15.6 23.3
Weight Residue (wt. %) 100 91.6 87.4 80.4
Density (g/mL) 0.917 0.941 0.950 0.962
API ° 22.7 18.7 17.3 15.4
Pour point (°C) -33 -27 -21 -12
Flash Point (°C) - 57 81 115
IFT in. (mN/m) 19 20 21 26
IFT eq. (mN/m) 7 8 9 11
Asphaltenes (wt. %) 4.74 5.21 5.46 5.94
Wax (wt.%) 1.32 1.44 1.51 1.64
*Viscosity of water-free residue (mPa.s =cP) 143 630 1242 4420
*Viscosity of 50% emulsion (mPa.s = cP) - 3799 7380 22497
*Viscosity of 75% emulsion (mPa.s = cP) - 6546 - -
*Viscosity of max water (mPa.s = cP) - 4979 7045 8497
Max. water cont. (vol.%) - 60 52 23
(T1/2) Halftime for water uptake (hrs.) - 0.5 1.1 1.5
Stability ratio - - 0.21 0.87
* Measured at shear rate 10 s-1
- No data
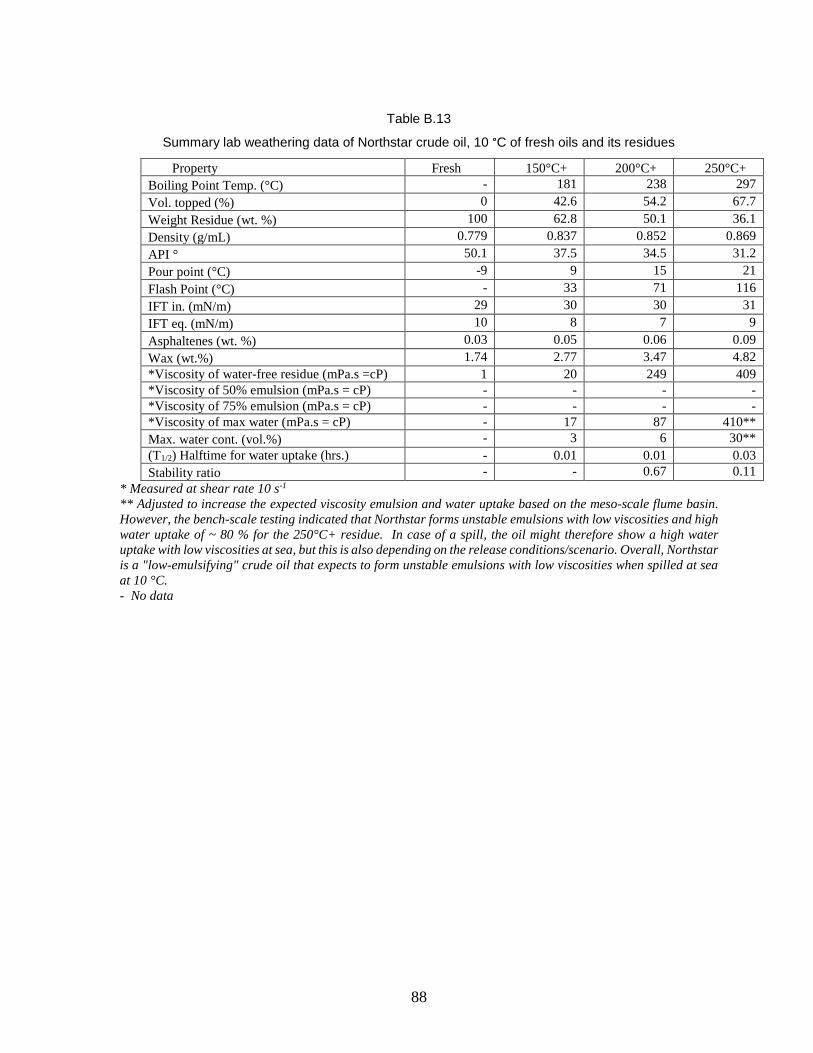
88
Table B.13
Summary lab weathering data of Northstar crude oil, 10 °C of fresh oils and its residues
Property Fresh 150°C+ 200°C+ 250°C+
Boiling Point Temp. (°C) - 181 238 297
Vol. topped (%) 0 42.6 54.2 67.7
Weight Residue (wt. %) 100 62.8 50.1 36.1
Density (g/mL) 0.779 0.837 0.852 0.869
API ° 50.1 37.5 34.5 31.2
Pour point (°C) -9 9 15 21
Flash Point (°C) - 33 71 116
IFT in. (mN/m) 29 30 30 31
IFT eq. (mN/m) 10 8 7 9
Asphaltenes (wt. %) 0.03 0.05 0.06 0.09
Wax (wt.%) 1.74 2.77 3.47 4.82
*Viscosity of water-free residue (mPa.s =cP) 1 20 249 409
*Viscosity of 50% emulsion (mPa.s = cP) - - - -
*Viscosity of 75% emulsion (mPa.s = cP) - - - -
*Viscosity of max water (mPa.s = cP) - 17 87 410**
Max. water cont. (vol.%) - 3 6 30**
(T1/2) Halftime for water uptake (hrs.) - 0.01 0.01 0.03
Stability ratio - - 0.67 0.11
* Measured at shear rate 10 s-1
** Adjusted to increase the expected viscosity emulsion and water uptake based on the meso-scale flume basin.
However, the bench-scale testing indicated that Northstar forms unstable emulsions with low viscosities and high
water uptake of ~ 80 % for the 250°C+ residue. In case of a spill, the oil might therefore show a high water
uptake with low viscosities at sea, but this is also depending on the release conditions/scenario. Overall, Northstar
is a "low-emulsifying" crude oil that expects to form unstable emulsions with low viscosities when spilled at sea
at 10 °C.
- No data
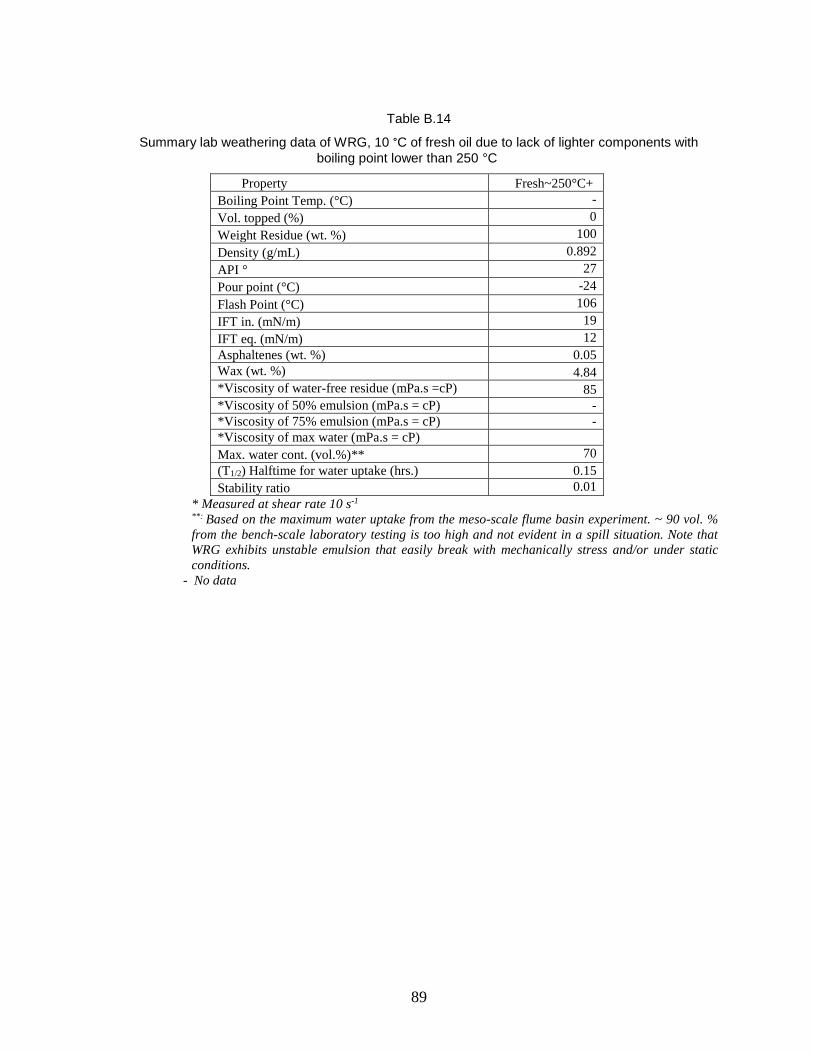
89
Table B.14
Summary lab weathering data of WRG, 10 °C of fresh oil due to lack of lighter components with
boiling point lower than 250 °C
Property Fresh~250°C+
Boiling Point Temp. (°C) -
Vol. topped (%) 0
Weight Residue (wt. %) 100
Density (g/mL) 0.892
API ° 27
Pour point (°C) -24
Flash Point (°C) 106
IFT in. (mN/m) 19
IFT eq. (mN/m) 12
Asphaltenes (wt. %) 0.05
Wax (wt. %) 4.84
*Viscosity of water-free residue (mPa.s =cP) 85
*Viscosity of 50% emulsion (mPa.s = cP) -
*Viscosity of 75% emulsion (mPa.s = cP) -
*Viscosity of max water (mPa.s = cP)
Max. water cont. (vol.%)** 70
(T1/2) Halftime for water uptake (hrs.) 0.15
Stability ratio 0.01
* Measured at shear rate 10 s-1
**: Based on the maximum water uptake from the meso-scale flume basin experiment. ~ 90 vol. %
from the bench-scale laboratory testing is too high and not evident in a spill situation. Note that
WRG exhibits unstable emulsion that easily break with mechanically stress and/or under static
conditions.
- No data
90
Appendix C
Categorization Map of Alaska North Slope Crude Oils
A semi-quantitative categorization map of crude oils is developed into four main groups of oil;
paraffinic, waxy, naphthenic, and asphaltenic oils, based on their typically physio-chemical
properties, as described below. The categorization of crude oils from Alaska North Slope for Year
One and Two (2016) and previous studies of crude oils from this region are illustrated in Figure C
1. The previous studies were part of the OCS Study MMS 98-0031 for MMS (Leirvik et al., 2002),
and an older SINTEF study funded by MSRC in 1993. The categorization map (Figure C 1)
illustrates the span in physio-chemical properties within the Alaska North Slope crude oils (blue
and yellow circles) that can be quite wide, and may change as a function of production time.
Paraffinic crude oils
Paraffinic crude oils are often characterized by low to medium density, which reflects high content
of light and saturated components, such as paraffins (alkanes). Paraffinic crudes differ mainly from
the waxy crudes with a lower wax content (typically < 6 wt. %), hence the pour point of the fresh
crude is often lower compared with waxy crude oils. Paraffinic crudes are characterized with
medium to high evaporation loss, with rapid and high water uptake and normally form stable w/o-
emulsions. Rapid initial evaporative loss will result in a relative increase of physiochemical
properties like pour point, asphaltene and the wax content. Hence, the asphaltenes (polar surface-
active components) may contribute, together with the wax, to the high stability usually observed
of the w/o-emulsions formed.
Waxy crude oils
Waxy crude oils often exhibit high pour points due to large content of wax components (typically
> 6 wt.%). These oils have a tendency to solidify producing elastic properties on the sea surface,
particularly observed at low seawater temperatures. Solidification is pronounced if the seawater
temperature typically is 10-15 ºC below the pour point. Waxy crude oils typically exhibit a light
to medium evaporative loss. The water uptake can vary extensively, whereas the w/o- emulsions
can be very stable or even highly unstable depending on the content of stabilizing and polar
surface-active components like the asphaltenes and resins.
Naphtenic crude oils
Typically, naphtenic oils exhibit disrupted n-alkane (paraffins) patterns due to high degree of
biodegradation of the oil in the reservoir. The content of paraffins are therefore normally low in
for these oils, and have low pour points with corresponding low wax content. Such biodegraded
crude oils may have high densities and a high degree of UCM (Unresolved Complex Mixture)
consisting of a wide range of complex components, such as resins and naphthenes. Other naphtenic
crude oils can be only slightly biodegraded and exhibit e.g. paraffinic features. Hence, the
evaporative loss among this naphtenic crude can vary extensively, depending on its physical
properties. Naphthenic crudes may form unstable w/o-emulsions with very low viscosities, but can
also exhibit properties towards asphaltenic features and form stable w/o-emulsions. The water
uptake may vary among the naphtenic crudes, but generally, they form emulsions with both low
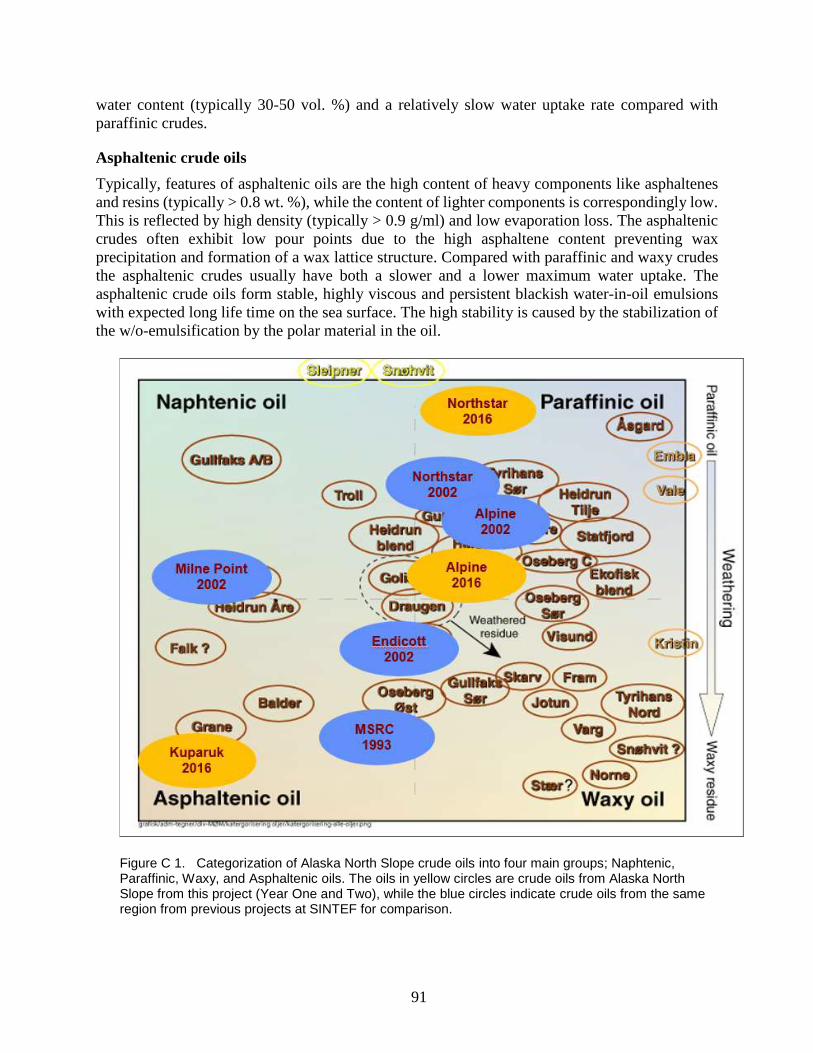
91
water content (typically 30-50 vol. %) and a relatively slow water uptake rate compared with
paraffinic crudes.
Asphaltenic crude oils
Typically, features of asphaltenic oils are the high content of heavy components like asphaltenes
and resins (typically > 0.8 wt. %), while the content of lighter components is correspondingly low.
This is reflected by high density (typically > 0.9 g/ml) and low evaporation loss. The asphaltenic
crudes often exhibit low pour points due to the high asphaltene content preventing wax
precipitation and formation of a wax lattice structure. Compared with paraffinic and waxy crudes
the asphaltenic crudes usually have both a slower and a lower maximum water uptake. The
asphaltenic crude oils form stable, highly viscous and persistent blackish water-in-oil emulsions
with expected long life time on the sea surface. The high stability is caused by the stabilization of
the w/o-emulsification by the polar material in the oil.
Figure C 1. Categorization of Alaska North Slope crude oils into four main groups; Naphtenic, Paraffinic, Waxy, and Asphaltenic oils. The oils in yellow circles are crude oils from Alaska North Slope from this project (Year One and Two), while the blue circles indicate crude oils from the same region from previous projects at SINTEF for comparison.
The Department of the Interior Mission
As the Nation's principal conservation agency, the Department of the
Interior has responsibility for most of our nationally owned public lands
and natural resources. This includes fostering sound use of our land and
water resources; protecting our fish, wildlife, and biological diversity;
preserving the environmental and cultural values of our national parks and
historical places; and providing for the enjoyment of life through outdoor
recreation. The Department assesses our energy and mineral resources and
works to ensure that their development is in the best interests of all our
people by encouraging stewardship and citizen participation in their care.
The Department also has a major responsibility for American Indian
reservation communities and for people who live in island territories under
US administration.
The Bureau of Ocean Energy Management
As a bureau of the Department of the Interior, the Bureau of Ocean
Energy (BOEM) primary responsibilities are to manage the mineral
resources located on the Nation's Outer Continental Shelf (OCS) in an
environmentally sound and safe manner.
The BOEM Environmental Studies Program
The mission of the Environmental Studies Program (ESP) is to
provide the information needed to predict, assess, and manage impacts
from offshore energy and marine mineral exploration, development, and
production activities on human, marine, and coastal environments.