Embed Size (px)
Citation preview
Single-Item Physical Activity Measures
1
Physical activity assessment for public health: efficacious use of the single-item measure
Zwolinsky S, McKenna J, PhD; Pringle A, PhD; Widdop P, PhD; Griffiths C, PhD;
Centre for Active Lifestyles, Carnegie Faculty, Research Institute of Sport, Physical Activity
and Leisure, Leeds Beckett University, Leeds, UK. LS6 3QS
Corresponding Author:
Zwolinsky S, Centre for Active Lifestyles, Institute of Sport, Physical Activity and Leisure,
Carnegie Faculty, Leeds Beckett University.
E-Mail – [email protected]
Telephone – (+44) 013 812 9107
Single-Item Physical Activity Measures
2
Objectives: The accurate mass assessment of physical activity is essential for effective Public
Health policy and practice. Combined with a desire to minimise participant burden, the self-
reported single-item physical activity screening measure has become increasingly attractive
and widespread. To help reduce any potential misclassification, refining this instrumentation
in line with any changes in prescribed activity levels is essential to optimise accuracy. Study
design: This study compares the levels of agreement, sensitivity and specificity for the single-
item measure versus IPAQ using current physical activity recommendations. Methods:
Agreement was assessed in a non-probability sample of 7650 adults. The statistic, sensitivity
and specificity were used to assess agreement between the tools for classifying participants as
sufficiently active for health (≥150 minutes of physical activity per week) or not, and being
classified as inactive (<30 of minutes of physical activity per week) or not. Results: The single-
item measure showed weak agreement with the IPAQ for identifying participants who met the
current physical activity guidelines (= 0.13, 95% CI 0.12 to 0.14), sensitivity was 18.7% and
specificity was 97.2%. For the classification of inactive participants it showed a moderate
agreement with IPAQ (= 0.45, 95% CI 0.43 to 0.47), sensitivity was 74.2% and specificity
was 79.7%. Conclusions: The single-item measure has a low diagnostic capacity compared to
IPAQ. Further research is needed if it is to be used in large scale surveys and interventions
where screening for sufficiently active or inactive individuals is the goal.
Keywords: physical activity, sensitivity and specificity, questionnaire,
Single-Item Physical Activity Measures
3
Introduction –
Refining our understanding of physical activity measurement is central to the development of
effective public health policy and programming. Moreover, accurate assessment is fundamental
to intervention design, the assessment of outcomes and persuasive policy.1 Accuracy becomes
progressively augmented when data is used to propose links to health, and/or establish the scale
of behaviour change within an intervention.2 This is especially true for areas of known
deprivation hampered by the effects of the social gradient.3 Further, it is imperative to update
and improve this instrumentation in line with any changes in prescribed activity levels to reduce
potential misclassification.
A number of underlying issues guide the selection process for an appropriate physical activity
measure. Contrary to widely held beliefs, it is not simply about choosing the most accurate
tool.4 For instance, evaluators/researchers must consider the dimensions and domains of
physical activity they wish to measure, the number of participants they plan to engage with,
the potential costs, personnel requirements and the speed at which results are needed.5 Tools
should also be feasible, practical, and where necessary, sufficiently sensitive to detect change.
While objective measurement is generally accepted as being the most accurate approach for
physical activity assessment, self-reported measures – including questionnaires – remain
popular due to their feasibility, practicality and low cost.4, 6
For instance, a substantial amount of physical activity data that links participation to health
outcomes has relied on self-report as the primary data collection method.4, 7 Despite the fact
that self-report is not considered the gold standard, many tools are valid and reliable. Validated
Single-Item Physical Activity Measures
4
self-report tools can range from lengthy, in depth, quantitative history measures like the
‘Modifiable Activity Questionnaire’,8 to short recall measures such as International Physical
Activity Questionnaire (IPAQ)9 and ‘GPAQ’,10 to global activity questionnaires including
‘Exercise Vital Sign’11 and single-item measures.12, 13
Public Health agencies are becoming increasingly interested in the widespread screening of
activity levels among potential participants prior to intervention.14 Further, determining the
number of people who meet physical activity guidelines is an on-going Public Health priority.15
At the same time, screening tools that help to identify inactive individuals are equally sought-
after.16 At present, the single-item measure is one of the most widely used activity screening
tools with the potential to address these issues.12-14 The single-item measure was initially
developed to assess attainment of the 2004 physical activity recommendations,17 i.e. adults
achieving ≥30 minutes of moderate to vigorous intensity physical activity (MVPA) on five or
more days of the week. For assessing whether or not an individual achieved this guideline, the
single-item measure demonstrated strong repeatability (r= 0.72) and moderate validity against
other self-report,14 and objective measures.12, 13, 18
However, the physical activity recommendations have since been updated, it is now suggested
that adults undertake ≥150 minutes of moderate intensity physical activity each week.15
Notably, this new criterion is not framed according to a ‘number of days’. Nevertheless, while
this change in prescribed activity appears modest, the prevalence of physically active
individuals at a population level can vary markedly when classified using the 2004 or the 2011
recommendations. For example, the ‘Health Survey for England 2008’19 reported that 39% of
adult men and 29% of adult women were achieving the 2004 recommendations,17 yet when this
Single-Item Physical Activity Measures
5
data was re-assessed against the 2011 guidelines, the figure rose to 65-66% for men and 53-
56% for women.20
There is amplified potential for classification error when physical activity measures have been
validated against recommendations that are now outdated. Closing the gaps in our
understanding of this issue is important, there are serious Public Health consequences
associated with the large scale misclassification of physically inactive adults.4 Therefore, it is
important that the sensitivity and specificity of screening tools - like the single-item measure -
are as close to 100% as possible.21 However, at present, the single-item measure is yet to be
compared to any validated physical activity measure using the latest physical activity
guidelines.
This study builds on previous work, and aims to assess the single-item measures levels of
agreement, sensitivity and specificity against the IPAQ for assessing individuals who meet the
current physical activity guidelines - classed as sufficiently active, and individuals who
undertake less than 30 minutes of physical activity each week - classified as inactive.
Methods –
Study Design, Description of Participants –
The ‘Leeds Let’s Get Active’ (LLGA) programme was developed by Leeds City Council as
part of Sport England’s ‘Get Healthy, Get into Sport’ scheme. LLGA aims to increase activity
levels across the city and encourage inactive individuals to undertake at least 30 minutes
Single-Item Physical Activity Measures
6
MVPA each week. The scheme supports inactive people from areas of deprivation to become
active through the provision of free access to leisure centres, community sports and activities.
Each week, around 150 hour long sessions are offered to participants at 17 different venues, at
a variety of times.
Recruitment was open to all adults in Leeds aged ≥16 years. Prior to engaging LLGA,
participants provided demographic information, and completed the single-item measure plus
the IPAQ. Measures were completed either on-line or using paper based methods. At the point
of analysis, a non-probability sample had recruited a data corpus of N=9589 participants.
Participants were excluded from the analysis if they lived outside the desired catchment area
(n=951), were aged <16 years old (n=910) or their contributions failed to correspond to the
data cleaning guidelines of the IPAQ scoring protocol (n=78).22 The final data set on which the
analysis was undertaken contained n=7650 participants.
Ethical approval was provided by Leeds Beckett University research ethics committee, all
participants provided informed consent. Data collection took place between September 2013
and January 2014.
Measurements –
Indices of Multiple Deprivation (IMD) were used as covariates to investigate the levels of
agreement, sensitivity and specificity of the single-item measure compared to IPAQ. IMD
scores provide a relative continuous measure of deprivation at lower super output area (LSOA)
level. Areas are ranked on seven different dimensions of deprivation and an overall composite
Single-Item Physical Activity Measures
7
measure of multiple deprivation. There is no fixed number on the scale which catalogues an
area as deprived or not. However, participants presenting the lowest ̴ 20% IMD scores are
deemed to be living in the ‘most deprived’ LSOA’s compared to the remaining ̴ 80% living in
the ‘least deprived’ LSOA’s.23
Physical activity data was captured using two self-report instruments; (i) the short version
IPAQ and (ii) a single-item activity question.
IPAQ is a short recall questionnaire providing a quick assessment of the total volume of
physical activity classified by dimension of intensity or domain (type or mode).5 Originally
developed to measure health enhancing physical activity for population surveillance, IPAQ can
be used as an evaluation tool in interventions to assess individual energy expenditure and
activity status.22 IPAQ has been validated for use in community settings with adults, older
adults and ethnic minority groups.9, 24 MET-minute/week expenditure was calculated by
summing the relevant activity dimension’s and domains for each participant. The number of
days featuring these activities was multiplied by the estimated time per day spent doing each
one. The relative energy expenditure of each activity was taken into account by multiplying
weekly minutes by a MET value (multiples of the resting metabolic rate) recommended by the
IPAQ scoring protocol (walking was scored as 3.3 METs, moderate intensity activity was 4
METs and vigorous intensity activity and 8 METs).9
The single-item measure has been validated for use against accelerometers12 and GPAQ
demonstrating strong reproducibility (r =0.72) and modest concurrent validity (r= 0.53).14 An
Single-Item Physical Activity Measures
8
open response scale to the question was used, with valid responses ranging from 0 to 7 days.
The wording of the single-item question was.14
“In the past week, on how many days have you done a total of 30 minutes or more of physical
activity, which was enough to raise your breathing rate. This may include sport, exercise, and
brisk walking or cycling for recreation or to get to and from places, but should not include
housework or physical activity that may be part of your job”
Statistical Analysis –
Descriptive statistics show the socio-demographic profiles and activity characteristics of
participants. The Shapiro-Wilk test of normality determined distribution. As data were not
normally distributed, Mann-Whitney tests calculated differences in days of physical activity
per week and total MET-minutes/week by gender and IMD (‘most deprived’ vs. ‘least
deprived’). Kruskal-Wallis tests measured differences, and the Jonckheere-Terpstra test
identified trends in days of physical activity per week and total MET-minutes/week by age
category.
Participants were grouped into either inactive or sufficiently active categories according to
activity scores from the single-item measure and IPAQ.25 A participant was classified as
inactive if they reported a zero on the single-item measure, or no days of MVPA totalling less
than 120 MET-minutes/week on the IPAQ. The cut point for being classified as sufficiently
active was achieved if participants reported 5 days or more on the single-item measure, or
reported 5 or more days of any combination of walking/MVPA achieving a minimum of at
least 600 MET-minutes/week on the IPAQ.
Single-Item Physical Activity Measures
9
Cohen’s kappa ( determined the magnitude of agreement; sensitivity and specificity were
calculated to assess diagnostic performance. Analysis looked at two outcomes. First was the
agreement between the single-item measure and IPAQ for detecting whether or not participants
were sufficiently active - achieving the current physical activity recommendations of ≥150
minutes of MVPA per week.15 The second outcome was the agreement between the single-
item measure and the IPAQ for classifying participants as inactive (achieving <30 minutes of
MVPA per week). Percent agreement was also reported.
Across the analyses, scores of <0.2 were regarded as weak, 0.21-0.4 fair, 0.41-0.6 moderate,
0.61-0.8 strong, and 0.81-1.0 very strong.26 For all inferential tests, a p value of ≤.05 or less
was taken to be statistically significant. All analyses were conducted using SPSS for windows
version 21.0.
Results –
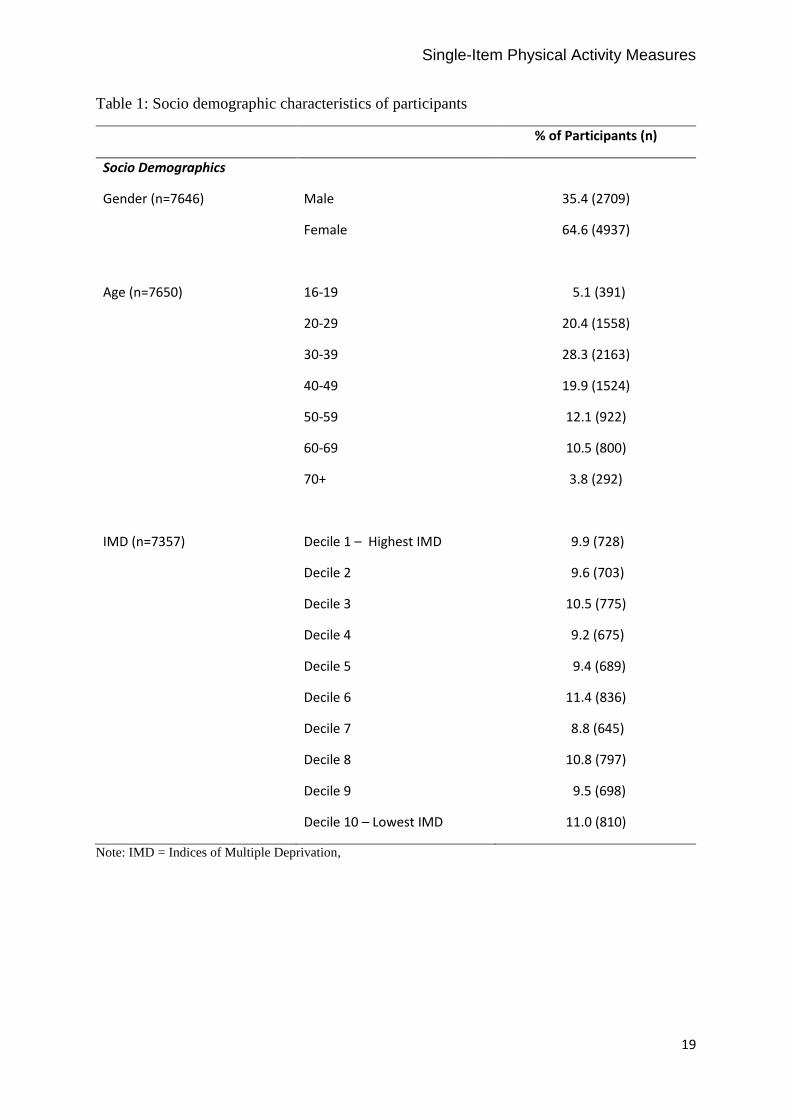
Analysis was undertaken with n=7650 participants. Table 1 shows their socio demographic
characteristics. Female participants dominated the sample (64.6%). The majority of
participants (53.8%) were aged <40 years, however, over one quarter of participants were aged
≥50 years - classified as older adults. Valid postcodes were provided by 96.2% (n=7357) of
participants; these were used to determine IMD. In total, n=1431 participants were categorised
as living in the ‘most deprived’ areas and n=5926 participants were categorised as living in the
‘least deprived’ areas.
Single-Item Physical Activity Measures
10
Single-Item Outcomes –
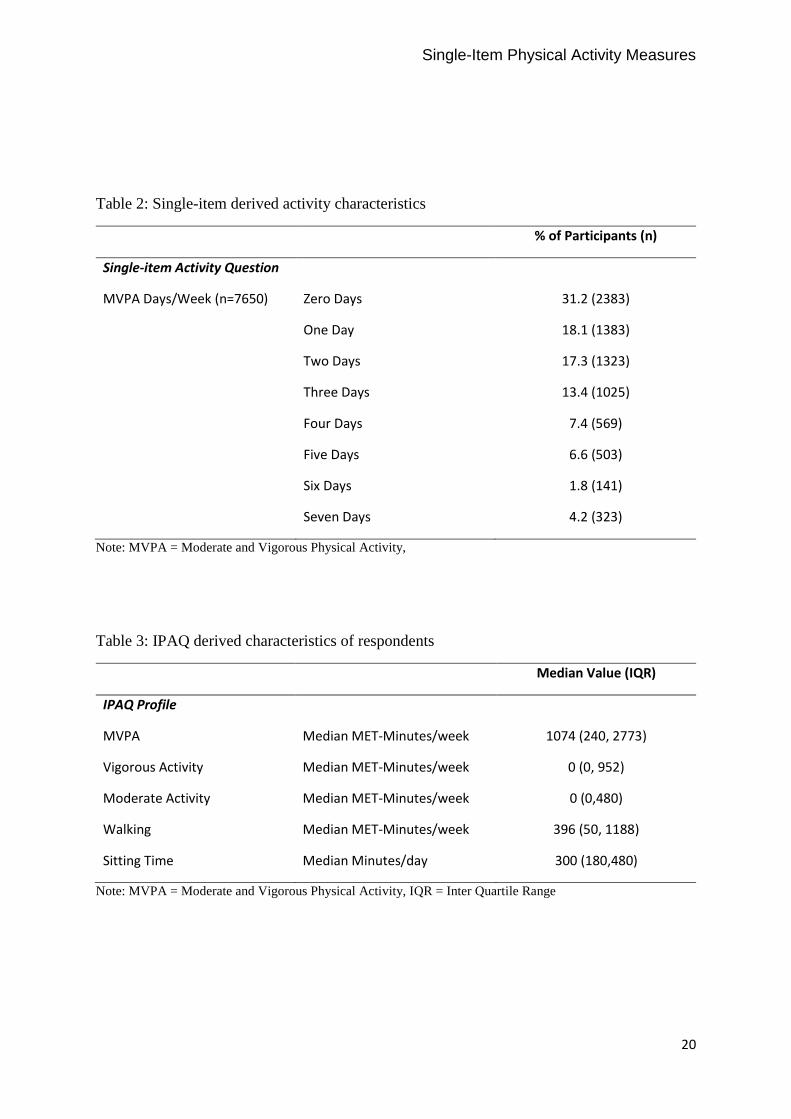
Based on the single-item measure (Table 2), 31.2% of participants were classified as inactive
- undertaking zero days of physical activity each week. The single-item measure categorised
12.6% of participants as achieving the current physical activity guidelines – undertaking 5 or
more days each week. Days of physical activity reported by males were significantly higher
compared to females (U = 6317679, z = -4.094, p <.001, r = -.05), and days of physical activity
reported by the ‘most deprived’ participants were significantly higher compared to the ‘least
deprived’ participants (U = 3804821, z = -6.174, p <.001, r = -.07). Days of physical activity
were significantly affected by age (H [6] = 80.951, p < .001). Jonckheere’s test revealed
significant trends in the data; as age increased so too did median days of physical activity (J =
12156854, z = 2.956, r = 0.03).
IPAQ Outcomes –
IPAQ classified 20.3% of participants as inactive and 62.0% as sufficiently active. Table 3
shows the median values and the interquartile range for each dimension (intensity and type) of
the IPAQ. Participants reported a median value of 1074 MET-minutes/week of MVPA
signifying a sufficiently active cohort. Median values for vigorous and moderate MET-
minutes/week suggest that the majority of participants undertook no vigorous or moderate
physical activity each week. Further, MET-minutes/week values indicate that walking made
up a sizable proportion of total weekly energy expenditure.
Males reported significantly more MET-minutes/week of MVPA (Mdn = 13986) compared to
females (Mdn = 986), U = 6148676, z = -5.849, p <.001, r = -.07. Participants classified as
Single-Item Physical Activity Measures
11
‘most deprived’ reported significantly more MET-minutes/week of MVPA (Mdn = 1272)
compared to the ‘least deprived’ (Mdn = 1020), U = 3945335, z = -4.098, p <.001, r = -.05.
MET-minutes/week were significantly affected by age (H [6] = 61.760, p <.001), Jonckheere’s
test revealed no significant trends in the data. Further, daily sitting time reported by participants
suggests high levels of sedentary behaviour.
Levels of Agreement –
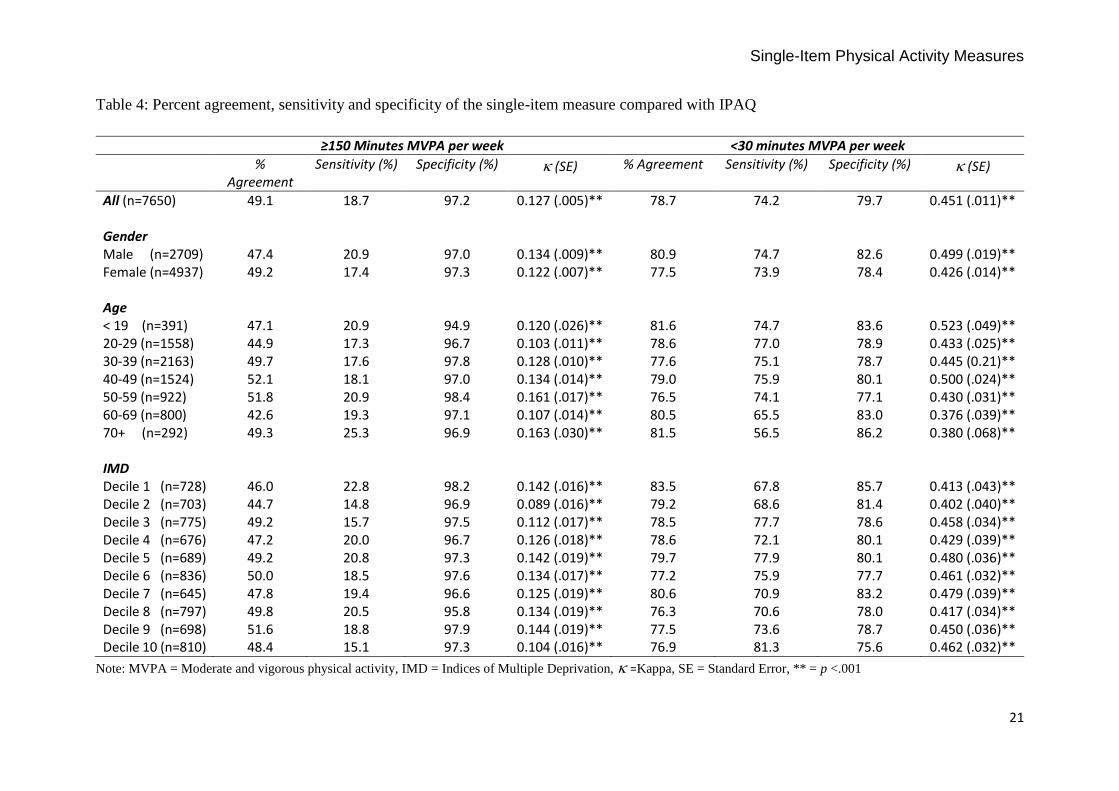
Table 4 shows the precent agreement, levels of agreement, sensitivity and specificity for the
two measures. Overall agreement between the single-item measure and IPAQ for detecting
sufficiently active participants - i.e. those achieving the current physical activity
recommendations - was 49.1% with a statistic of 0.13 (95% Confidence Interval [CI] 0.12 to
0.14). The single-item measure correctly identified 18.7% of participants that met the current
physical activity guidelines (sensitivity) and 97.2% who did not meet the current physical
activity guidelines (specificity). The statistic and sensitivity was generally higher for males,
older adults and those classified as ‘least deprived’ by IMD. Further, overall agreement
between the single-item measure and IPAQ for identifying inactive participants was 78.7%
with a statistic of 0.45 (95% CI 0.43 to 0.47). The single-item measure demonstrated 74.2%
for sensitivity and 79.7% for specificity. The statistic and sensitivity levels were higher for
males compared to females, younger age groups compared to older ones, and participants
classified as living in the ‘least deprived’ areas by IMD.
Single-Item Physical Activity Measures
12
Discussion –
This study investigated the levels of agreement, sensitivity and specificity of the single-item
measure compared to IPAQ, using contemporary physical activity recommendations. The main
findings indicated that the single-item measure had a low diagnostic capacity and was not
sufficiently sensitive to detect physically active participants. However, the single-item measure
fared substantially better at diagnosing inactive participants. Findings from this study may be
of interest to Public Health systems, policy makers, program evaluators and researchers.
Results highlight that the single-item measure - a widely used physical activity screening tool
– has limited capacity to achieve its original aims.
The sample was predominantly female, <50 years old and presented IMD scores across the
spectrum. Using both measures, results reflect findings from other national evidence that males
report being more active than females.15 However, contrary to evidence concerning physical
activity and age,15 in this cohort, older adults reported more activity than younger adults. It is
possible that these results were influenced by LLGA attracting active older adults who were
displacing other pre-existing activity, whereas younger less-active adults may have used LLGA
to displace sedentary behaviour.27, 28 Further, higher levels of deprivation, assessed using IMD
have previously been associated with lower levels of activity.29 Nonetheless, in this study,
participants living in the ‘most deprived’ areas were more active compared to participants from
the ‘least deprived’ areas. The disparity between these findings and our results may in part be
due to the comparatively high levels of deprivation found within this sample. This issue may
be important in studies addressing impacts of the built environment on physical activity
behaviour.
Single-Item Physical Activity Measures
13
Based on the single-item measure, <15% of participants achieved the current physical activity
guidelines compared to >60% identified by IPAQ. Across the two measures, for determining
sufficiently active participants, the precent agreement was 49.1%. Previous studies, using
earlier activity recommendations17 showed agreement for the single-item measure ranging
from 58% against accelerometers,12 to 28% for short recall measures.14 As percent agreement
is limited and inflated by chance agreements, use of kappa ( is also recommended to
determine the level of agreement. In the current sample, was 0.13, signifying that the single-
item measure was a weak predictor of sufficiently active participants versus the IPAQ, this is
considerably lower than in previous research.12 The single-item measure correctly diagnosed
less than one in five participants as sufficiently active - using current physical activity
recommendations. This questions its ability to achieve its original aims and suitability for
future use.
This reduced diagnostic capacity may be partially mediated by changes in the physical activity
recommendations from ≥30 minutes MVPA on five or more days a week 17 to a cumulative
≥150 minutes MVPA each week.15 Whilst the changes appear negligible, the single-item
measures open scale response can establish the number of days an individual achieves ≥30
minutes MVPA each week, however, it is unable to provide an accurate estimate of total weekly
activity.12 The potential for misclassification and under reporting of physically active
individuals can be seen using the example of an individual, screened by the single-item
measure, who achieves 151 minutes of MVPA split equally over two days each week. Against
the 2004 recommendations the single-item measure was validated against, the individual would
select 2 days and be correctly screened insufficiently active. However, against the 2011
recommendations, they achieve the ≥150 minute MVPA benchmark and are sufficiently active.
Single-Item Physical Activity Measures
14
Yet they would be classified as insufficiently active by the single-item measure reporting just
two days MVPA a week.
Regarding the diagnosis of inactive individuals, the benchmark for being classified as inactive
is set at <30 minutes of MVPA per week. The open scale response of the single-item measure
means that participants reporting 0 days are classified as inactive. However, it is possible that
an individual could be achieving 25 minutes MVPA every day, effectively making them
sufficiently active (175 minutes MVPA each week) against the 2011 recommendations.15 Yet,
if they correctly report 0 days on the single item measure, they would be classified as inactive.
To our knowledge, percent agreement, levels of agreement and sensitivity and specificity
between the single-item measure and IPAQ on the classification of inactive individuals have
not been reported elsewhere. The single-item measure categorised ̴ 30% of participants as
inactive compared to ̴ 20% using IPAQ. For this diagnosis, percent agreement between the
single-item measure and IPAQ was 72.4% with a statistic of 0.46 (95% CI 0.44 to 0.48).
These findings suggest that it is a moderate predictor of inactivity, with moderate consistency
of agreement between the two measures. The single-item measure demonstrated 72% for
sensitivity, highlighting that it correctly diagnosed nearly three quarters of participants as
inactive. Furthermore, the levels of agreement, sensitivity and specificity for this categorisation
remained when adjusting for IMD. Although these results are promising, given the potential
for misclassification due to the cumulative nature of the current physical activity
recommendations, further validation is needed.
Single-Item Physical Activity Measures
15
This study has a number of limitations. The use of a non-probability sample may limit the
external validity of the findings.30 For instance, males were underrepresented accounting for
35% of the sample. Additionally, there were relatively few demographic markers which may
in turn lower the generalizability and external validity. Further, both measures of physical
activity rely on self-report, meaning that response bias may have caused some level of
misclassification.31 For example, even though IPAQ was used to compare diagnostic capability
with the single-item measure, it is not considered the gold standard indicator and may also
misclassify participants. However, these limitations should be measured against the strengths
which include the sample size. Indeed our sample of 7650 can be compared to samples of 133,12
318,13 and 48014 in other studies. This is also the first study to compare the single-item measure
to any validated activity measure against contemporary guidelines. Future studies should assess
the diagnostic capacity of the single-item measure against more sensitive, objective measures
and its responsiveness over an intervention period.
Conclusions –
The assessment of physical activity for Public Health can be a moveable feast, fluctuating as
recommendations and classification boundaries are amended and new methods of assessment
are developed. Therefore, the process of physical activity measurement requires continuous
refinement. Given the voracious appetite of evaluators and researchers for speedily assessing
physical activity status, this work develops and informs our understanding of the single-item
physical activity measure. Findings from this study suggest that in its current form, the single-
item measure is no longer an appropriate screening tool. Further validation is needed to confirm
the suitability of the single-item measure for large scale surveys and interventions where
screening for sufficiently active or inactive individuals is the goal.
Single-Item Physical Activity Measures
16
Acknowledgements: The authors gratefully acknowledge the contribution of all those
individuals and agencies who partnered this work especially Leeds city council and Sport
England.
Funding: This work was supported by ‘Sport England’ and ‘Leeds City Council’ as part of the
get healthy, get in to sport scheme.
Competing Interests: None declared.
Ethical Approval: Ethical approval was obtained from the Local Research Ethics Committee
at Leeds Beckett University.
References -
1. Hallal PC, Andersen LB, Bull FC, Guthold R, Haskell W, Ekelund U. Global physical activity levels: surveillance progress, pitfalls, and prospects. Lancet. 2012;380(9838):247-57. Epub 2012/07/24. 2. Hagstromer M, Ainsworth BE, Kwak L, Bowles HR. A checklist for evaluating the methodological quality of validation studies on self-report instruments for physical activity and sedentary behavior. J Phys Act Health. 2012;9 Suppl 1:S29-36. Epub 2012/02/01. 3. Marmot M. Universal health coverage and social determinants of health. Lancet. 2013;382(9900):1227-8. Epub 2013/10/15. 4. Haskell WL. Physical activity by self-report: a brief history and future issues. J Phys Act Health. 2012;9 Suppl 1:S5-10. Epub 2012/02/01. 5. Strath SJ, Kaminsky LA, Ainsworth BE, Ekelund U, Freedson PS, Gary RA, et al. Guide to the assessment of physical activity: Clinical and research applications: a scientific statement from the American Heart Association. Circulation. 2013;128(20):2259-79. Epub 2013/10/16. 6. Masse LC, de Niet JE. Sources of validity evidence needed with self-report measures of physical activity. J Phys Act Health. 2012;9 Suppl 1:S44-55. Epub 2012/02/01.
Single-Item Physical Activity Measures
17
7. Bowles HR. Measurement of active and sedentary behaviors: closing the gaps in self-report methods. J Phys Act Health. 2012;9 Suppl 1:S1-4. Epub 2012/02/01. 8. Pettee Gabriel K, McClain JJ, Schmid KK, Storti KL, Ainsworth BE. Reliability and convergent validity of the past-week Modifiable Activity Questionnaire. Public Health Nutr. 2011;14(3):435-42. Epub 2010/09/17. 9. Craig CL, Marshall AL, Sjostrom M, Bauman AE, Booth ML, Ainsworth BE, et al. International physical activity questionnaire: 12-country reliability and validity. Med Sci Sports Exerc. 2003;35(8):1381-95. Epub 2003/08/06. 10. World Health Organisation. Global Physical Activity Questionnaire (GPAQ). Geneva: World Health Organisation; 2006. 11. Coleman KJ, Ngor E, Reynolds K, Quinn VP, Koebnick C, Young DR, et al. Initial validation of an exercise "vital sign" in electronic medical records. Med Sci Sports Exerc. 2012;44(11):2071-6. Epub 2012/06/13. 12. Milton K, Clemes S, Bull F. Can a single question provide an accurate measure of physical activity? Br J Sports Med. 2013;47(1):44-8. Epub 2012/04/24. 13. Wanner M, Probst-Hensch N, Kriemler S, Meier F, Bauman A, Martin BW. What physical activity surveillance needs: validity of a single-item questionnaire. Br J Sports Med. 2013. Epub 2013/06/19. 14. Milton K, Bull FC, Bauman A. Reliability and validity testing of a single-item physical activity measure. Br J Sports Med. 2011;45(3):203-8. Epub 2010/05/21. 15. Department of Health. Start Active, Stay Active: A report on physical activity for health from the four home countries‟ Chief Medical Officers. London: Department of Health; 2011. 16. National Institute for Health and Care Excellence. Exercise referral schemes to promote physical activity. London: National Institute for Health and Care Excellence
2014. 17. Department of Health. At least 5 a week: Evidence on the impact of physical activity and its relationship to health. London: Department of Health; 2004. 18. Marshall AL, Smith BJ, Bauman AE, Kaur S. Reliability and validity of a brief physical activity assessment for use by family doctors. Br J Sports Med. 2005;39(5):294-7; discussion -7. Epub 2005/04/26. 19. Craig R, Mindell J, Hirani V, eds. Health Survey for England 2008: Volume 1 Physical Activty and Fitnes. London: The NHS Information Centre; 2009. 20. Eastwood P. Statistics on obesity, physical activity and diet in England 2013 Version 2. In: The Information Centre for Health and Social Care, editor. London2013. 21. Sedgwick P, Joekes K. Evaluating the performance of a screening test for depression in primary care. Bmj. 2015;350:h1801. Epub 2015/04/11. 22. IPAQ Research Committee. Guidelines for Data Processing and Analysis of the International Physical Activity Questionnaire (IPAQ) – Short and Long Forms. In: International Physical Activity Questionnaire, editor. 2005. 23. Department for Communities and Local Government. The English indices of deprivation 2010. Statistical release; 2011; Available from: https://www.gov.uk/government/uploads/system/uploads/attachment_data/file/6871/1871208.pdf. 24. Grimm EK, Swartz AM, Hart T, Miller NE, Strath SJ. Comparison of the IPAQ-Short Form and accelerometry predictions of physical activity in older adults. J Aging Phys Act. 2012;20(1):64-79. Epub 2011/12/23. 25. Sjostrom M, Oja P, Hagstromer M, Smith B, Bauman A. Health-enhancing physical activity across European Union countries: the Eurobarometer study. Journal of Public Health. 2006;14(5):291-300. 26. Landis JR, Koch GG. The measurement of observer agreement for categorical data. Biometrics. 1977;33(1):159-74. Epub 1977/03/01.
Single-Item Physical Activity Measures
18
27. Biddle SJ, Marshall SJ, Gorely T, Cameron N. Temporal and environmental patterns of sedentary and active behaviors during adolescents' leisure time. Int J Behav Med. 2009;16(3):278-86. Epub 2009/02/25. 28. Owen N, Bauman A, Brown W. Too much sitting: a novel and important predictor of chronic disease risk? Br J Sports Med. 2009;43(2):81-3. Epub 2008/12/04. 29. Fox KR, Hillsdon M, Sharp D, Cooper AR, Coulson JC, Davis M, et al. Neighbourhood deprivation and physical activity in UK older adults. Health Place. 2011;17(2):633-40. Epub 2011/02/05. 30. Sedgwick P. Convenience sampling. BMJ. 2013;347(f6304):f6304. 31. Sedgwick P. Questionnaire surveys: sources of bias. BMJ. 2013;347:f5265.
Single-Item Physical Activity Measures
19
Table 1: Socio demographic characteristics of participants
% of Participants (n)
Socio Demographics
Gender (n=7646) Male 35.4 (2709)
Female 64.6 (4937)
Age (n=7650) 16-19 5.1 (391)
20-29 20.4 (1558)
30-39 28.3 (2163)
40-49 19.9 (1524)
50-59 12.1 (922)
60-69 10.5 (800)
70+ 3.8 (292)
IMD (n=7357) Decile 1 – Highest IMD 9.9 (728)
Decile 2 9.6 (703)
Decile 3 10.5 (775)
Decile 4 9.2 (675)
Decile 5 9.4 (689)
Decile 6 11.4 (836)
Decile 7 8.8 (645)
Decile 8 10.8 (797)
Decile 9 9.5 (698)
Decile 10 – Lowest IMD 11.0 (810)
Note: IMD = Indices of Multiple Deprivation,
Single-Item Physical Activity Measures
20
Table 2: Single-item derived activity characteristics
% of Participants (n)
Single-item Activity Question
MVPA Days/Week (n=7650) Zero Days 31.2 (2383)
One Day 18.1 (1383)
Two Days 17.3 (1323)
Three Days 13.4 (1025)
Four Days 7.4 (569)
Five Days 6.6 (503)
Six Days 1.8 (141)
Seven Days 4.2 (323)
Note: MVPA = Moderate and Vigorous Physical Activity,
Table 3: IPAQ derived characteristics of respondents
Median Value (IQR)
IPAQ Profile
MVPA Median MET-Minutes/week 1074 (240, 2773)
Vigorous Activity Median MET-Minutes/week 0 (0, 952)
Moderate Activity Median MET-Minutes/week 0 (0,480)
Walking Median MET-Minutes/week 396 (50, 1188)
Sitting Time Median Minutes/day 300 (180,480)
Note: MVPA = Moderate and Vigorous Physical Activity, IQR = Inter Quartile Range
Single-Item Physical Activity Measures
21
Table 4: Percent agreement, sensitivity and specificity of the single-item measure compared with IPAQ
≥150 Minutes MVPA per week <30 minutes MVPA per week
% Agreement
Sensitivity (%) Specificity (%) (SE) % Agreement Sensitivity (%) Specificity (%) (SE)
All (n=7650) 49.1 18.7 97.2 0.127 (.005)** 78.7 74.2 79.7 0.451 (.011)** Gender Male (n=2709) 47.4 20.9 97.0 0.134 (.009)** 80.9 74.7 82.6 0.499 (.019)** Female (n=4937) 49.2 17.4 97.3 0.122 (.007)** 77.5 73.9 78.4 0.426 (.014)** Age < 19 (n=391) 47.1 20.9 94.9 0.120 (.026)** 81.6 74.7 83.6 0.523 (.049)** 20-29 (n=1558) 44.9 17.3 96.7 0.103 (.011)** 78.6 77.0 78.9 0.433 (.025)** 30-39 (n=2163) 49.7 17.6 97.8 0.128 (.010)** 77.6 75.1 78.7 0.445 (0.21)** 40-49 (n=1524) 52.1 18.1 97.0 0.134 (.014)** 79.0 75.9 80.1 0.500 (.024)** 50-59 (n=922) 51.8 20.9 98.4 0.161 (.017)** 76.5 74.1 77.1 0.430 (.031)** 60-69 (n=800) 42.6 19.3 97.1 0.107 (.014)** 80.5 65.5 83.0 0.376 (.039)** 70+ (n=292) 49.3 25.3 96.9 0.163 (.030)** 81.5 56.5 86.2 0.380 (.068)** IMD Decile 1 (n=728) 46.0 22.8 98.2 0.142 (.016)** 83.5 67.8 85.7 0.413 (.043)** Decile 2 (n=703) 44.7 14.8 96.9 0.089 (.016)** 79.2 68.6 81.4 0.402 (.040)** Decile 3 (n=775) 49.2 15.7 97.5 0.112 (.017)** 78.5 77.7 78.6 0.458 (.034)** Decile 4 (n=676) 47.2 20.0 96.7 0.126 (.018)** 78.6 72.1 80.1 0.429 (.039)** Decile 5 (n=689) 49.2 20.8 97.3 0.142 (.019)** 79.7 77.9 80.1 0.480 (.036)** Decile 6 (n=836) 50.0 18.5 97.6 0.134 (.017)** 77.2 75.9 77.7 0.461 (.032)** Decile 7 (n=645) 47.8 19.4 96.6 0.125 (.019)** 80.6 70.9 83.2 0.479 (.039)** Decile 8 (n=797) 49.8 20.5 95.8 0.134 (.019)** 76.3 70.6 78.0 0.417 (.034)** Decile 9 (n=698) 51.6 18.8 97.9 0.144 (.019)** 77.5 73.6 78.7 0.450 (.036)** Decile 10 (n=810) 48.4 15.1 97.3 0.104 (.016)** 76.9 81.3 75.6 0.462 (.032)**
Note: MVPA = Moderate and vigorous physical activity, IMD = Indices of Multiple Deprivation, =Kappa, SE = Standard Error, ** = p <.001
Single-Item Physical Activity Measures
22