Embed Size (px)
Citation preview

Netherlands " TN ) Phys;cs and Electror;;ct
organizationi for Laboiatoryapplied scientificresearch Co 320d 1
AD-A228 227
TIUDCGK RAPPCRTENCENTRALEF eilkkazerne, Geb. 140.m ie '-ch 1 -3an 31
*-f:.21 f ' 07') -3 1 66 122
DTICELECTE
OCT 3 11990
"OrJIro'.,! ccl:t'.. 0)O E
ETR~httI.e"
ipprovid frr pubnl tel

Aplc cettcF E L 'Brresexrcli
titlereport no. copy no.FEL-90-B262 First pulsed near-field measurement results.
aulhor(s):
ir. 1-.1. Visser
date Ae!C,: !9
jL'I)GF RAPPORTENCENTRALE
classificaion
title unclassified
abstract unclassified
reporttext unclassified
appendix A unclassified
no. of copies 26
no. of pages :30 (Inc. appendixexci. RDP & distributioritist)
appendices I
All information whichi Is classified according to Dutchregulations shalt be treated by the recipient In the saeinway as classifiled Information of corresponJing value Inhis own cnlintry. No pz~ -'z - ,,to will Dediscloqed to any party.

TNO report
Page2
report no. FEL-90-B262
title First pulsed near-field measurement results.
author(s) Ir. H. Visser
institute TNO Physics and Electronics Laboratory
date August 1990
NDRO no.
no. in pow'90 710.2
Research supervised by .Ir. J.G. van Hezewijk
Research carried out by Ir. H.J. Visser
ABSTRACT (UNCLASSIFIED)
First near-field tests in using low-PRF pulsed signals with a standard (CW) HP 8510B Vector Netvork
Analyzei are pertormed. Although the measurement system did have a loss of 50 dB, it was possible to
obtain radiation patterns down to 40 dB below the maximum. The tests have proven that it is possible to
obtain accurate antenna characteristics under pulsed conditions for low PRFs spending only a few
milliseconds per near-field grid point in the FEL-TNO planar .za,-ficd anzaaurczient ,...-y.
A i I -'I j T'y COalst<
. . .

TNO report
Page3
rapport no. FEL-90-B262
thel Eerste resultaten van gepuiste nabije-veld metingen
auteur(s) In. HTJ Visser
instituut Fysisch en Elektronisch Laboratorium TNO
datum augustus 1990
hdo-oodr.no.
no. in iwp'90 710.2
Onderzoek uitgevoerd o I v rIn JG. van Hezewijk
Onderzoek uitgevoerd door Ir. HTJ Visser
SAMENIVA1TIN~G (ONGERUBRICEERD)
De eerste nabije-veld testen in het gebruik van lage PRF gepuiste signalen met een standaard
(CW) HP 85 1GB Vector Network Analyzer zijn uitgevoerd. Hoewel het meetsysteem een verlies
had van 50 dB, was bet mogelijk antennepatronen te, verkrijgen tot 40 dB onder het maximum. De
testen hebben aangetoond dat het mogelijk is nauwkeurige antenne karakteristieken te verkrijgen
onder gepuiste condities, waarbij slechts, een paar miliseconden per nabije-veld grid punt worden
gespendeerd, in de FEL-TNO planaire nabije-veld meetfaciliteit.
TNO report
Page4
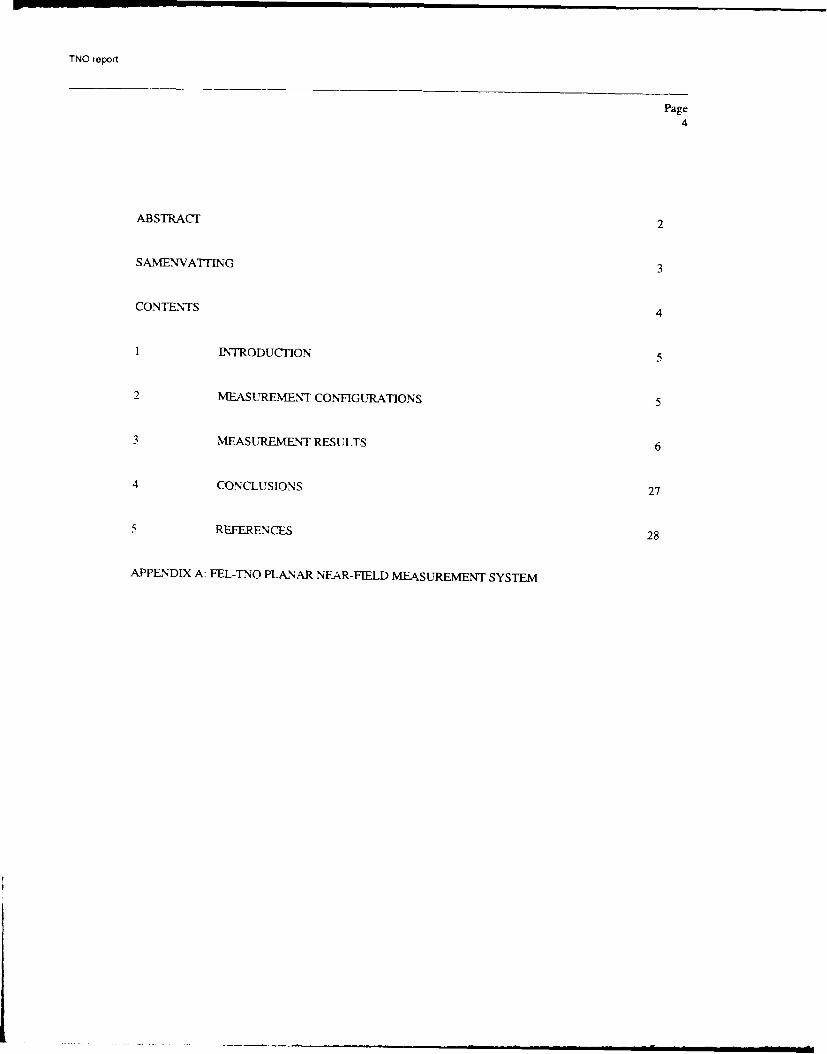
ABSTRACT 2
SAMENVAT1TNG 3
CONTENTS 4
1 LNTRODUCTION 5
2 MEASUREMENT CONFIGURATIONS 5
3 MEASUREMENT RESII.TS 6
4 CONCLUSIONS 27
5 REFERENCES 28
APPENDIX A: FEL-TNO PLANAR NFAR-FIELD MEASUREMENT SYSTEM

TN,. repot
Page5
1 TRODUCI1ON
Now, that the fundamentals of measuring low-PRF pulsed signals with a standard (CW) HP
8510B NWA within milliseconds have been shown [1], the time has arrived that pulsed
measurement tests in the FEL-TNO planar near-field measurement facility have to be performed.
CW measurements as well as pulsed measurements with the HP 8510B are performed on a
transmitting Antenna Under Test (AUT). The AUT is a 1 m diameter C-band parabolic antenna
with a Geyerhom as feedhorn. F/D = 0.4. Pulsed measurement results will be compared with CW
measurement results.
2 MEASUREMENT CONTIGURATIONS
The near-field low-PRF pulsed measurement configuration [1, p.30] is shown in figure 1.
A. I _t -
3mx3mrn.4
F &:^F NFA IH C710 MXISMt T IUR
AntennaSUnder Test
Scanning
PULID-OW....01
Fig. 1: Low-PRF pulsed measurement configuration
The AUT is operated with a carrier frequency of 5.3 GHz and a Pulse Repetition Frequency of 3.5
kHz with a pulsewidth of 12.8 ps.
In the CW measurement configuration, the external trigger connection with the NWA is removed;
use will be made of internal triggering. Both pulsegenerators are turned off, but the
pulsemodulator will remain, thuugh inactive, in order to maintain the same RF-path as used with
pulsed measurements.

TNO rtupot
Page6
3 MEASUREMENT RESULTS
Before the near-field measurement results are discussed, some remarks about the near-field measurement
systpm loss have to be made.
Measurements of amplitude and phase are carried out both CW and pulsed, with the probe positioned in
front of the AUT and with the probe positioned in the upper left comer of the scan frame (see figure 1). The
measurement results are stated in table 1.
Table 1: Amplitude and phase vs probe position
Probe position Amplitude CW Ir Phase CW Amplitude Phase
(dB) (o) Pulsed (dB) Pulsed (0)
In front of -27.91 -164.60 -27.80 -165.25
AUT t 0.15 + 0.90 ± 0.20 ± 1.10
In upper left -63.77 -25. 16 -64.61 -23.57
corner of frame - 6.0 _80 - 8.0 ±90
CW source power = 9 dBm
Pulsed: source power = 20 dlm
The fluctuations in the measured values, especially those measured at the edge of the scan frame, indicate -
considering the measurement results as stated in [1] - a considerable loss in the near-field measurement
system.
Vhen alout is directly connected to bl (see figure 1), a CW amplitude measurement gives: 23.0 ± 0.010 dB.
So, with table 1, it appears that the near-field measurement system loss is about 50 dB (at the centre of the
scan plane).
With this cause of large fluctuations away from the centre of the scan plane in mind, we can now look at
differences in near-field data and in calculated far-field data.
Figure 2 shows the near-field amplitude, measured in the CW measurement configuration 1). Figure 3
shows the amplitude, measured in the pulsed-RF measurement configuration. The colours indicate lines of
equal amplitude. Above and at the right of the figures, the amplitude patterns through the centres of the
scan plane are indicated.
I) Near-field measurement software developed at FEL-TNO.

TNO report
Page7
Figure 4 shows the difference of the data of figure 2 and 3. This difference is negligible at the
centre of the scan plane and increases going toward the edges of the scan plane, the reason of
which is already mentioned before. Above and at the right of figure 4, the amplitude difference
patterns through the centres of the scan plane are shown.
Figure 5, 6 and 7 respectively show near-field phase measured in the CW measurement
configuration, phase measured in the pulsed-RF measurement configuration and the phase
difference. Atvove and at the right of these figures phase patterns, respectively phase difference
patterns through the centres of the scan plane are shown.
The remarks made for the amplitude patterns also apply for the phase patterns.
. .. . . . _, ,,,..,, ,, ,.- -. m m nnnnmnm -n _W

INC dpOft
T).
age
;4 .~-.jQS~
~ h: *.?.t3 y I)
* ~-'~1W* ~
I -?
'yl ~' ~'
-~ I
-I 4,;
H
* A ,~- A
'-V'4'
-) Near-tickl ampliwdi ~ W IlRdsURlRfll

7-N() pr
Page
r Ar
NO fi$ Mlit"de -~c F-- F

NO i port
Page
I I .+ \ ~.irtI id amplitudc dit lt; trI (. k 'Aca~str~lent usdW aduen
iI Ur~fl~s inxupb Ujj u ph.: xe ai aiculated hlx lakiiq the absolukc valUC6 athUk data oft twko
k1itjtf Ic'. Efnomahzingi the data to tzlw nax irnN aluc of the *-irst datafile subtracting the data and
takirte P) tines. the logarithm to cewt the ditferen.ce in (I1B

Pagc
WY Q
e h ll',C

TNt) report
Page12
4:;
'r- r& 2 k4K,
I~? y r

1NO repurt
Page13
I~e7 New- ield phase diftte.rence ("A Winea surernent h-ilsed-R!" nicsurerneli
In order to sho" that dhe difference,, hetween (i'W and Pulsed measuements are mainly%, due to the
noticed fluctuations, one column of the scan plane is measured three times (in the CW
measurement configuration). Subtracted amplitude and phase show values corresponding with the
fluctuations as stated in tab'le 1. Figure 8 shows the subtracted amplitudes of two column-
measurements. figure 9 shows the subtracted phase of two column -measurements

TN() report
Page14
irIg ~8~ Nvr tmccoi .IIIIIZ LIIW hierr_ 'l I t' .-I hlmin W nlt stIlefllm l! c,.MlrwiigiliraII i)n

TNO ,eport
P~ge
15
Fig 9 Near-field phase diltfrenle, one coIltni ('W measurement configuration
With the near tield data as shown in the foregoing, far-fields are calculated. Figure 10 gives a 3-
dimensional impression of the far-field amplitude, calculated from the near-field data measured in
the CW measurement configuration Figure I I gives the contour plot of the far-field amplitude
obtained from the CW near-field measurement: figure 12 gives the contour plot of the far-field
phase
Figure 13 gives the contour plot ot the far-field amplitude obtained from the pulsed-RF near-field
measurement: figure 14 gives the contour plot of the far-field phase.

rNO report
Page16
Hig I 0. Far-field amnpliude: calculaled trom CWA nicaure int

TNU rep)
Page
17
f"jI far*teld drnplitilje, calculaled ttriCW measurxement

TNC) report
Page
0 -si
2t
1-ig~y %~ 12- Far fil h c ~cltd rmC esrmn

TNO repor t
Page19
I 13, Fatr-tield a;ipliiudc; calculated frcm pulsed*RF- measurement

rNo repot
Page20
44
Fi, 4 f-rfil pac lclte ro o- RI Meaure en
TNO ieport
Page21
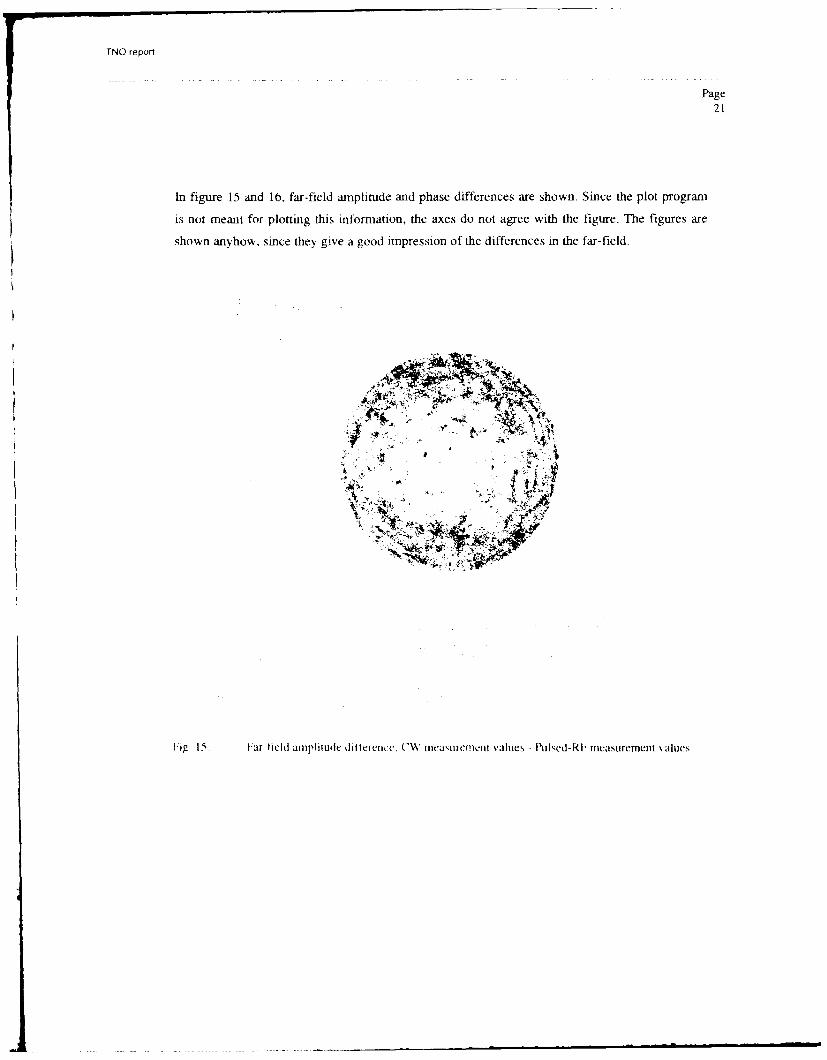
In figure 15 and 16, far-field amplitude and phase differences are shown. Since the plot program
is not meant for plotting this iriformation, the axes do not agree with the figure. The figures are
shown anyhow, since they give a good impression of the differences in the far-field.
A
hpg 15: Far field aiplitudc dittererict. ("AM'a~lec~ vAes PilI ed-Ri- mieasurement vaues

I N
Page
~2
Iv
Hv1 airftzdd plIwe difteren (% (A WIiieasuirecrif values - Puked-RF measurement values
An even better impressioni ol the amiplitude differences can be obtained by showing the iadiation
patterns in the principal planes Trhis is done in figure 17 and 18. The blue pattern is obtained
from the ("A measurement configuration: the green one from the pulsed-RF measurement
configuration The horizontal axes dto not agree with the figure.

INC, Ix
Page23
L! Pfi 'rI&PA pauc radiii, 11,11CM
Fh, fio igutre I,, (rie verm cal cr o ,.cc oIi ofi,,urc: M Th figurv on tic 10 'Ilo,%ing pc
It ure 18 )1 i the iionita I cross, sectIloll 4 t fl Cure 0,

F1,NC report
Page24
T-11, radiaIN01 patterl, it\ fcre \('f', Ik cliIt appear" that thle rwvar- fiell meiasurvinctit Puuetuatirtns
,mi,-el out \&hent -alculating, (te fmu field. due ito the integration of the iiear-field data 121.
A,, I .1 CA.k the tar hield obtained \xith [lie pu led - P - measuremnt I oilfguration is compared
%%ith the tar- tic d ohtained v ith a totalI lviiterent ( N~r measurement system as is in usC for a
a'.ple of years in the FF1. VN( planar near- field measurement facility. This measurement
"N steirn is build up around at Scientific Atlanta receiver series 1780 (:;Ie appendix A for the
measurenment c~onfiguration). Figure 19 mnd 20 give the principle plane radiation patterns. The
radiation pattern obtained with the SA receivet is given in hlue, the one obtained with the HP
pulsed-RF measurement svsteni i, given in green

Page25
h1C .b' III'I 1, 11he VMrImal t o w ccpon o t -,i 10 T11C tiOiC iOl the follo i L page
flLeire' 20) fib.' 110f,'011til j~ section o1 ftiic 10

Page26
I P i~rrm, ipl(- pliw raixu io patucrn,
n [he AIMC !i £ II ICS ','.L SOC A %(11 i2,olod aurccni between the radiation patterns, what proves
';the po Led R - measuremnit method as described in III is suitable for near-tield

TNC XY
Page27
4 CONCLUSIONS
First pulsed-RF near-field measurements carried out with a standard (CW) HP 8510B vector network
analyzer have shown that it is possible to obtain accurately antenna characteristics under pulsed conditions
for low PRFs and within milliseconds.
Measurements were carried out for a carrier frequency of 5.3 GHz and a Pulse Repetition Frequency of 3.5
kHz with a pulsewidth of 12.8 gis.
Although the measurement system did have a loss of 50 dB, accurate antenna patterns down to 40 dB below
the maximum were obtained- When the loss is minimized or when the transmitting AUT source power is
increased, the accuracy is expected to increase.

TNO report
Page28
5 REFERENCES
[I] Visser, H.J.: "Measuring low-PRF pulsed signals with a standard HP 8510B vector network analyzer
within milliseconds",
Physics & Electronics Laboratory TNO, Report FEL-90-B238, July 1990.
[2] Visser, H.J.: 'Theory of planar near-field measurement",
Physics & Electronics Laboratory TNO, Report FEL-89-B273, December 1998.

TNO report
Page29
Ir. G.A. van der Spek Ir. H.J. Visser
(Group leader) (Author)

TNO report
Appendix A PageA. 1
APPENDIX A: FEL-TNO PLANAR NEAR-FIELD MEASUREMENT SYSTEM
A, '-scanner
ReferenceServo channel
ScanningprobeDaaausto
c~e.Pompu.lter ~at

UNCLASSiFIED
REPORT DOCUMENTATION PAGE (MOD-NL)
1. DEFENSE REPORT NUMBER (MOD-NL) 2. RECIPIENTS ACCESSION NUMBER 3. PERFORMING ORGANIZATION REPORT
NUMBER
TD90-3208 FEL-90-B262
4. PROJECTiTASKNWORK UNIT NO. 5. CONTRACT NUMBER 6. REPORT DATE
21877.6 AUGUST 1990
7. NUMBER OF PAGES 8. NUMBER OF REFERENCES 9. TYPE OF REPORT AND DATES COVERED31 (INCL. RDP & 1 APPENDIX 2 FINAL REPORT
EXCL. DiSTRIBUTIONLIST)
10. TITLE AND SUBTITLEFIRST LSED. NEAR-EL . E ASUrl MENT RESULTS
11. AUTHOR(S)IR. H.J. VISSER
12. PERFORMING ORGANIZATION NAME(S) AND ADDRESS(ES)
PHYSICS AND ELECTRONICS LABORATORY TNO, P.O. BOX 96864, 2509 JG THE HAGUEOUDE WAALSDORPERWEG 63, THE HAGUE, THE NETHERLANDS
13. SPONSORING/MONITORING AGENCY NAME(S)
TNO DIVISION OF NATIONAL DEFENSE RESEARCH, THE NETHERLANDS
14. SUPPLEMENTARY NOTES
THE PHYSICS AND ELECTRONICS LABORATORY IS PART OF THE NETHERLANDS ORGANIZATION FORAPPLIED SCIENTIFIC RESEARCH
15. ABSTRACT (MAXIMUM 200 WORDS, 1044 POSITIONS)
FIRST NEAR-FIELD TESTS IN USING LOW-PRF PULSED SIGNALS WITH A STANDARD (CW) HP 85 1OB VECTORNETWORK ANALYZER ARE PERFORMED. ALTHOUGH THE MEASUREMFNT SYSTEiv DID HAVE A LOSS OF 50DB, IT WAS POSSIBLE TO OBTAIN RADIATION PATTERNS DOWNTO 40 DB BELOW THE MAXIMUM. THE TESTSHAVE PROVEN THAT IT IS POSSIBLE TO OBTAIN ACCURATE ANTENNA CHARACTERISTICS UNDER PULSEDCONDITIONS FOiR LOW PRF'S SPENDING ONLY A FEW MILLISECONDS PER NEAR-FIELD GRID POINT IN THEFEL-TNO PLANAR NEAR-FIELD MEASUREMENT FACILITY.
16. DESCRIPTORS IDENTIFIERS
PULSE CIRCUITS NETWORK ANALYZERSHORT DURATION PULSES NEAR FIELD MEASUREMENTANTENNA RADIATION PATTERNS
17a, SECURITY CLASSIFICATION 17b. SECURITY CLASSIFICATION 17c. SECURITY CLASSIFICATION
(OF REPORT) (OF PAGE) (OF ABSTRACT)UNCLASSIFIED UNCLASSIFIED UNCLASSIFIED
16. DISTRIBUTIOJAVAtLABILITY STATEMENT 17d. SECURITY CLASSIFICATION
(OF TITLES)UNLIMITED AVAILABLE UNCLASSIFIED
UNCLASSIFIED
Al m m - m ~ ml ll m . . - m m