Embed Size (px)
Citation preview
PhysChem Measurements-more than just a number
Emily Freeman Physical and Analytical Sciences UCB
PhysChem Forum June 2007
Overview
PhysChem Report
Overview of the Assays run at UCB
More to learn from AKAS and HTLogD
Summary
Questions?

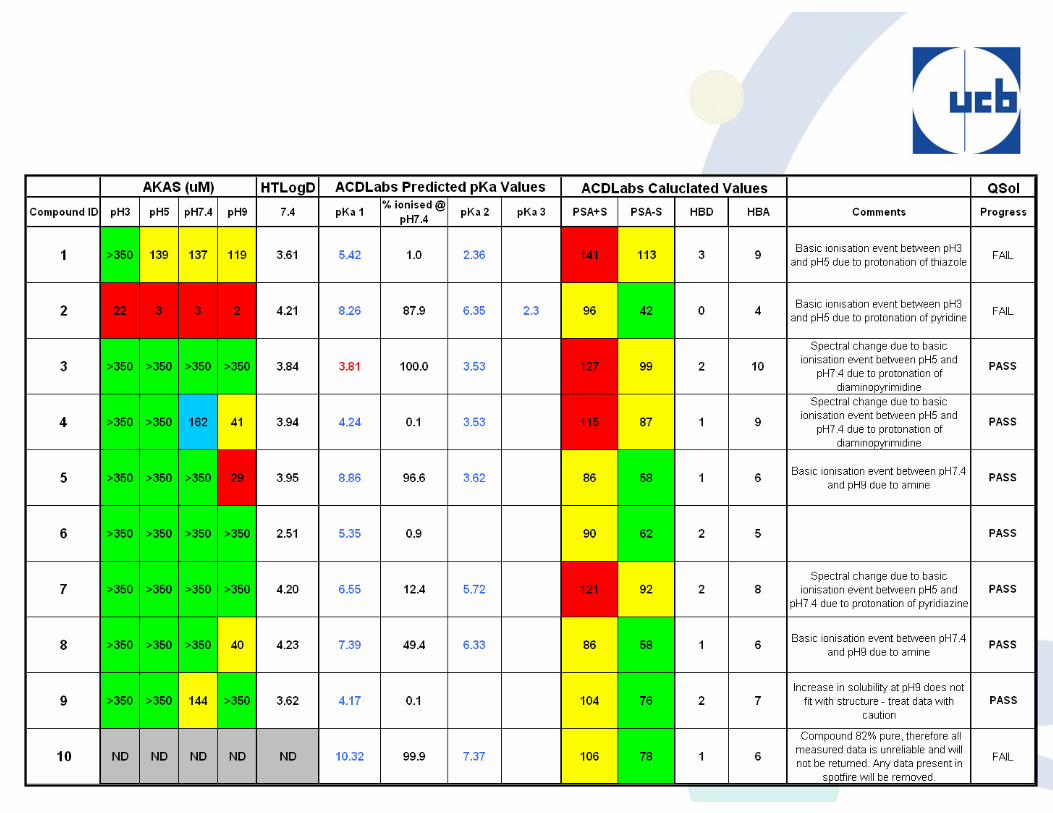
PhysChem Report
ND Poor Modest GoodAKAS ND <30mM 30-150mM 150-350mM >350mMPSA >113 83-113 <83
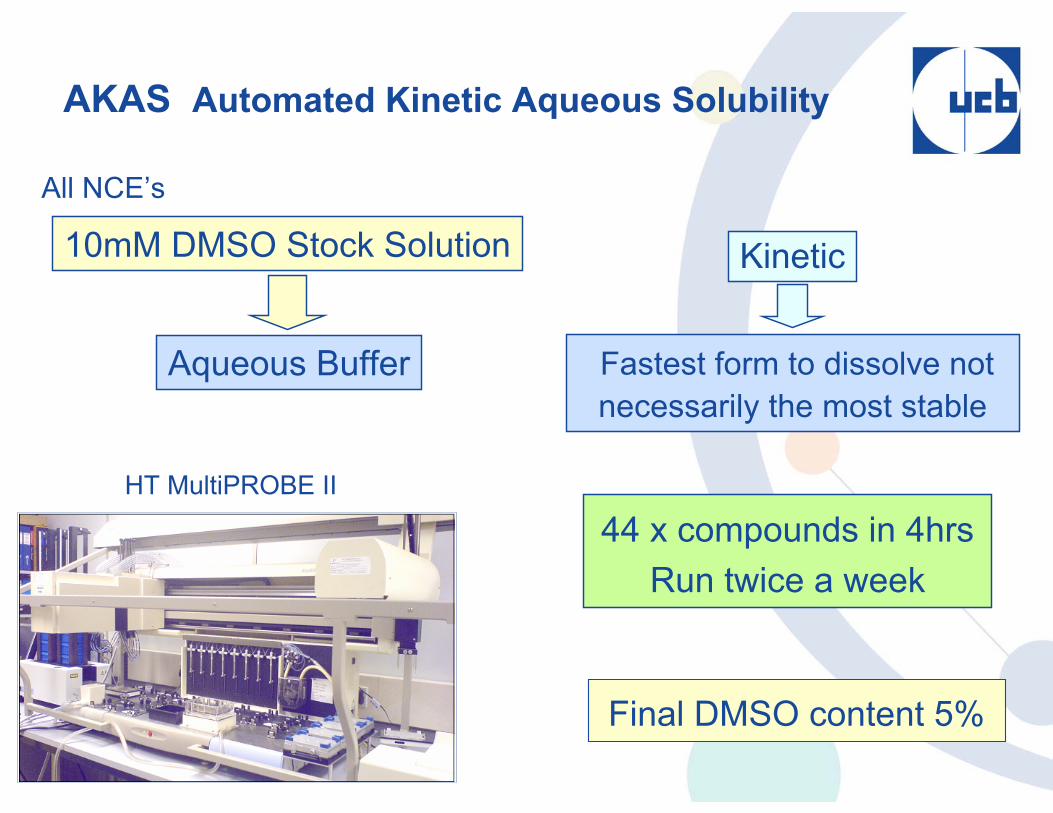
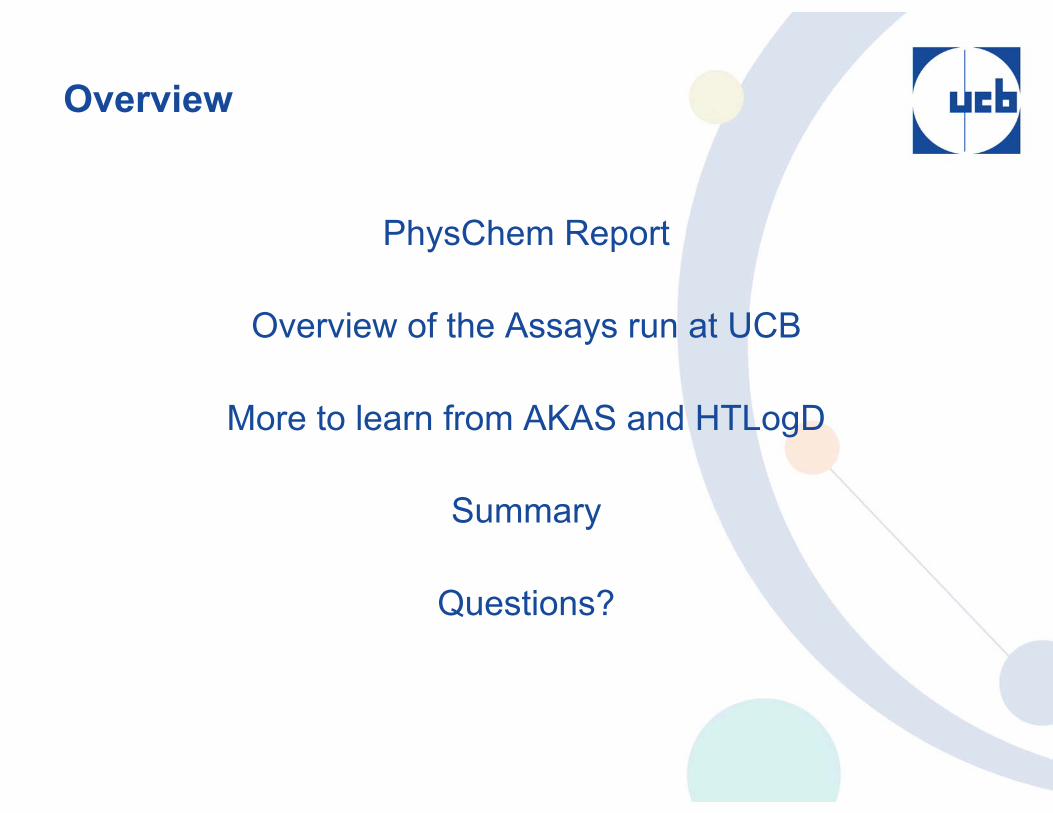
AKAS Automated Kinetic Aqueous Solubility
Final DMSO content 5%
HT MultiPROBE II
Aqueous Buffer
44 x compounds in 4hrs Run twice a week
10mM DMSO Stock Solution
Fastest form to dissolve not necessarily the most stable
Kinetic
All NCE’s
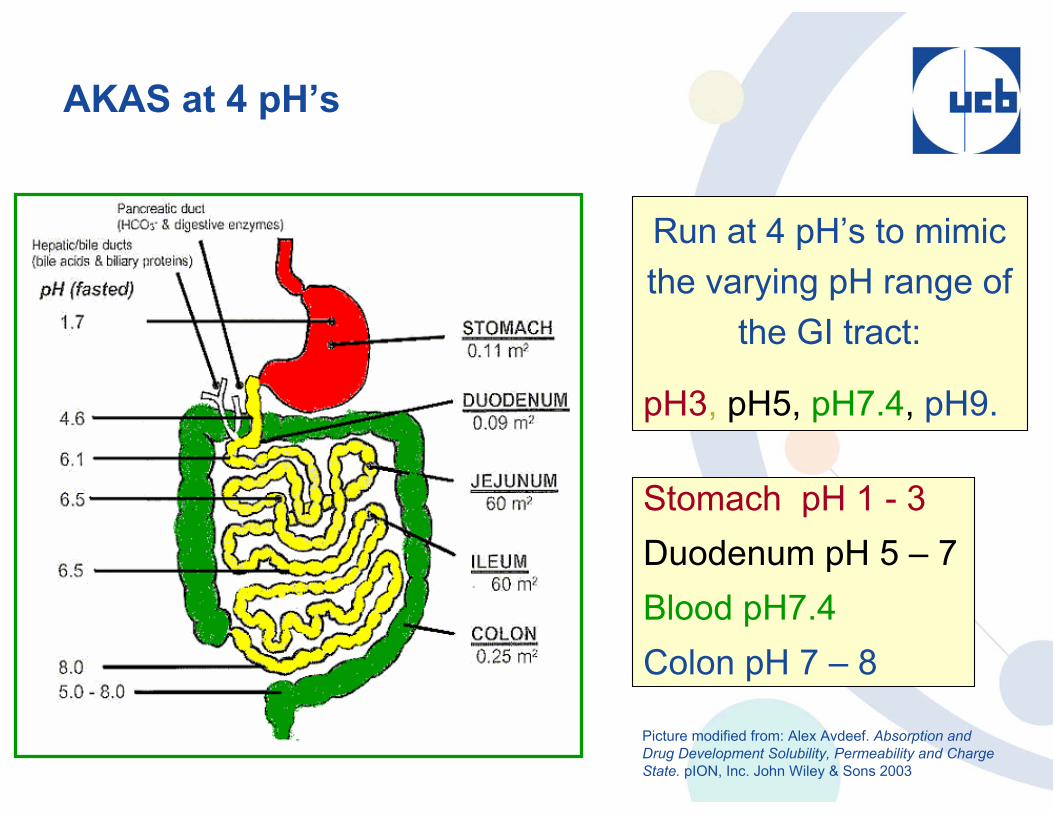
AKAS at 4 pH’s
Stomach pH 1 - 3 Duodenum pH 5 – 7Blood pH7.4Colon pH 7 – 8
Run at 4 pH’s to mimic the varying pH range of
the GI tract:
pH3, pH5, pH7.4, pH9.
Picture modified from: Alex Avdeef. Absorption and Drug Development Solubility, Permeability and Charge State. pION, Inc. John Wiley & Sons 2003
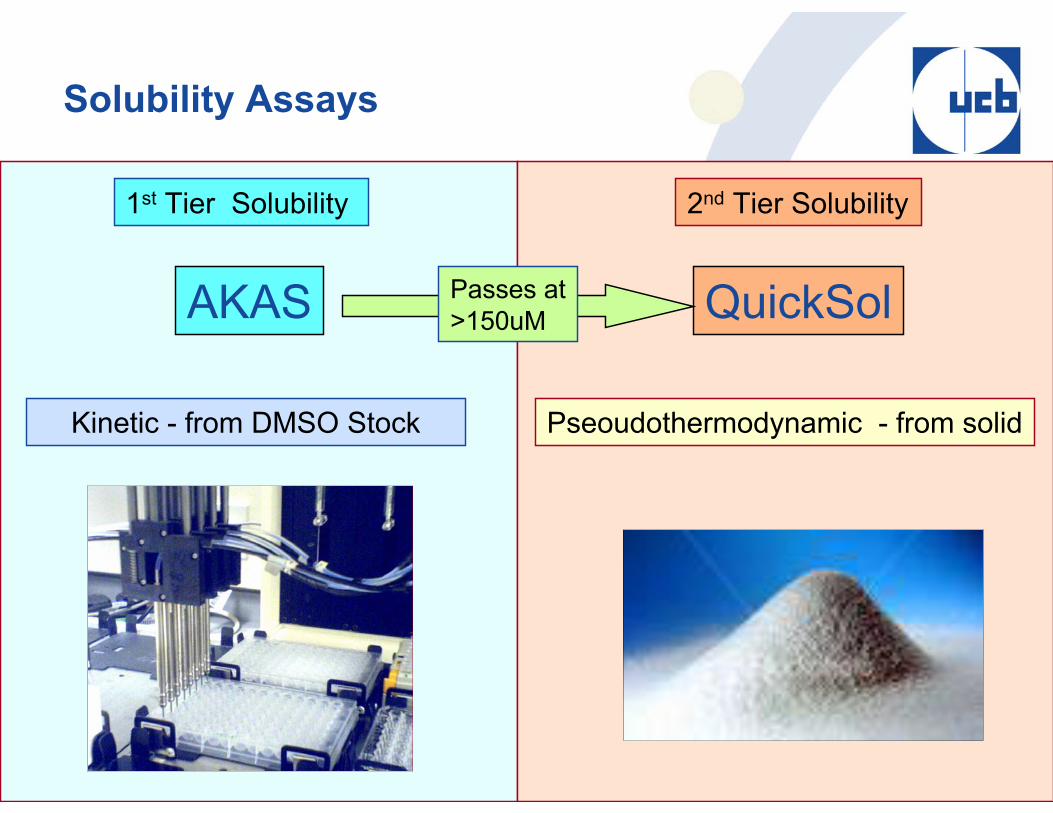
Solubility Assays
2nd Tier Solubility
Kinetic - from DMSO Stock
1st Tier Solubility
Pseoudothermodynamic - from solid
QuickSolAKAS Passes at>150uM
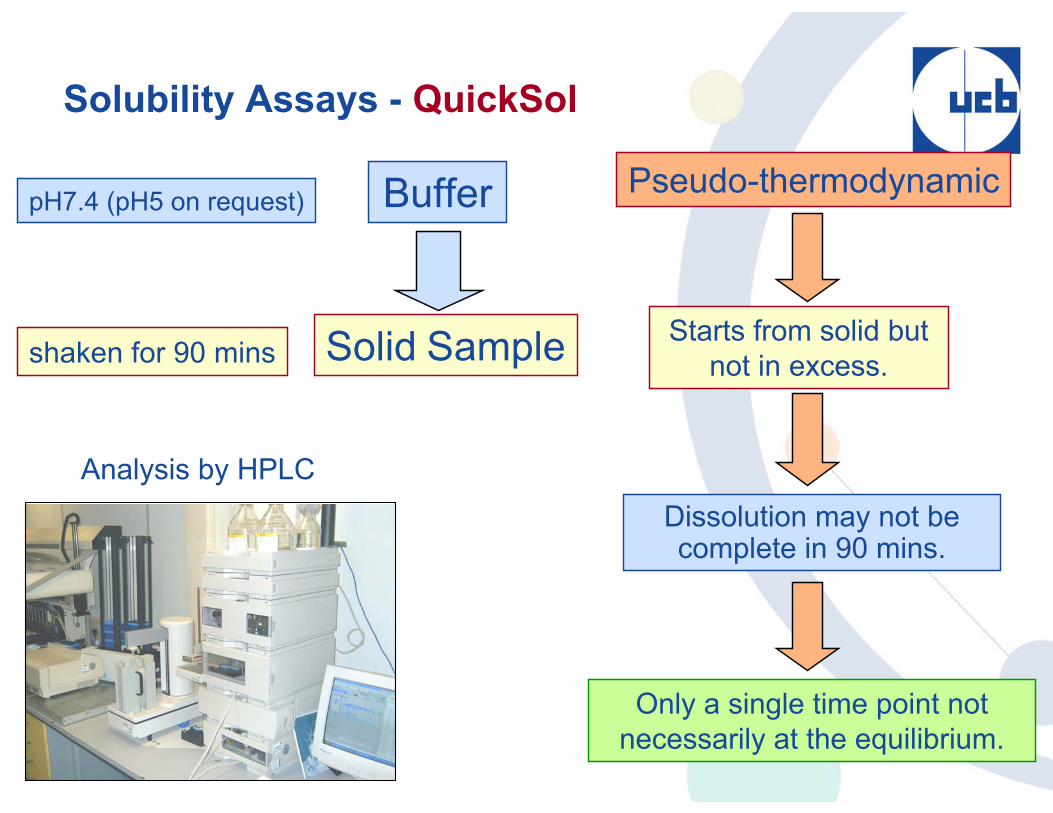
Solubility Assays - QuickSol
Analysis by HPLC
Solid Sample
Buffer
shaken for 90 mins
Pseudo-thermodynamic
Starts from solid but not in excess.
Only a single time point not necessarily at the equilibrium.
pH7.4 (pH5 on request)
Dissolution may not be complete in 90 mins.
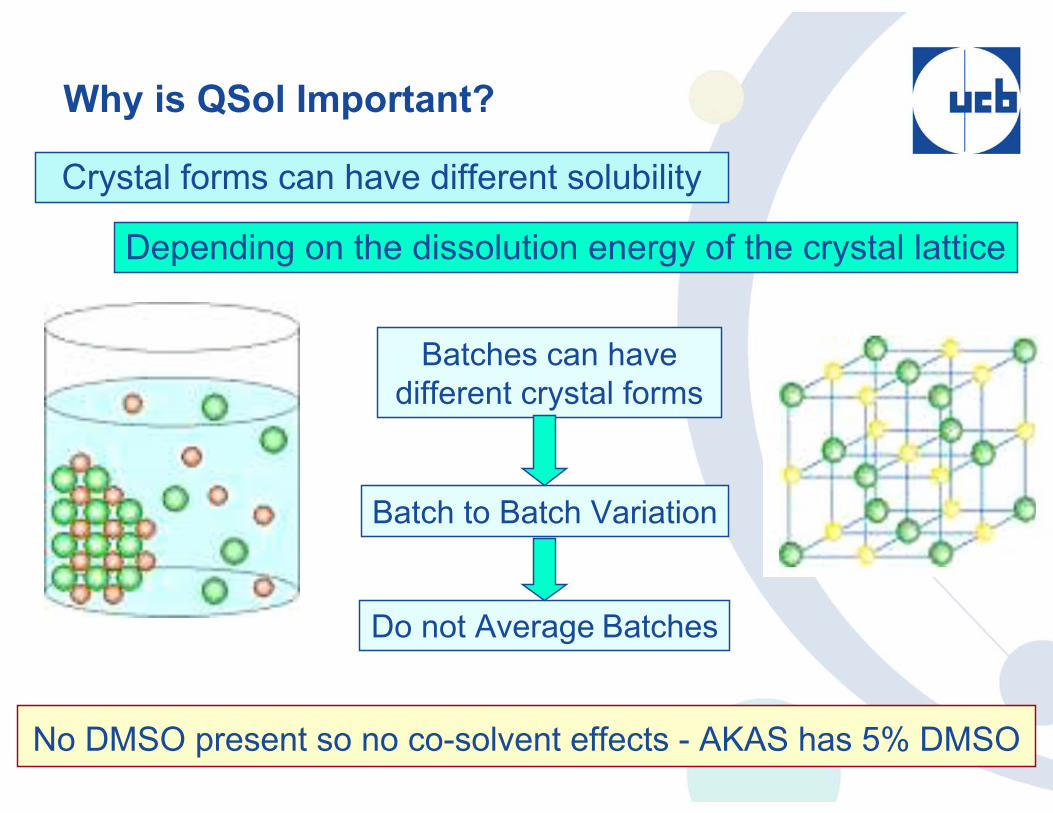
Why is QSol Important?
Crystal forms can have different solubility
Batches can have different crystal forms
Batch to Batch Variation
Depending on the dissolution energy of the crystal lattice
Do not Average Batches
No DMSO present so no co-solvent effects - AKAS has 5% DMSO
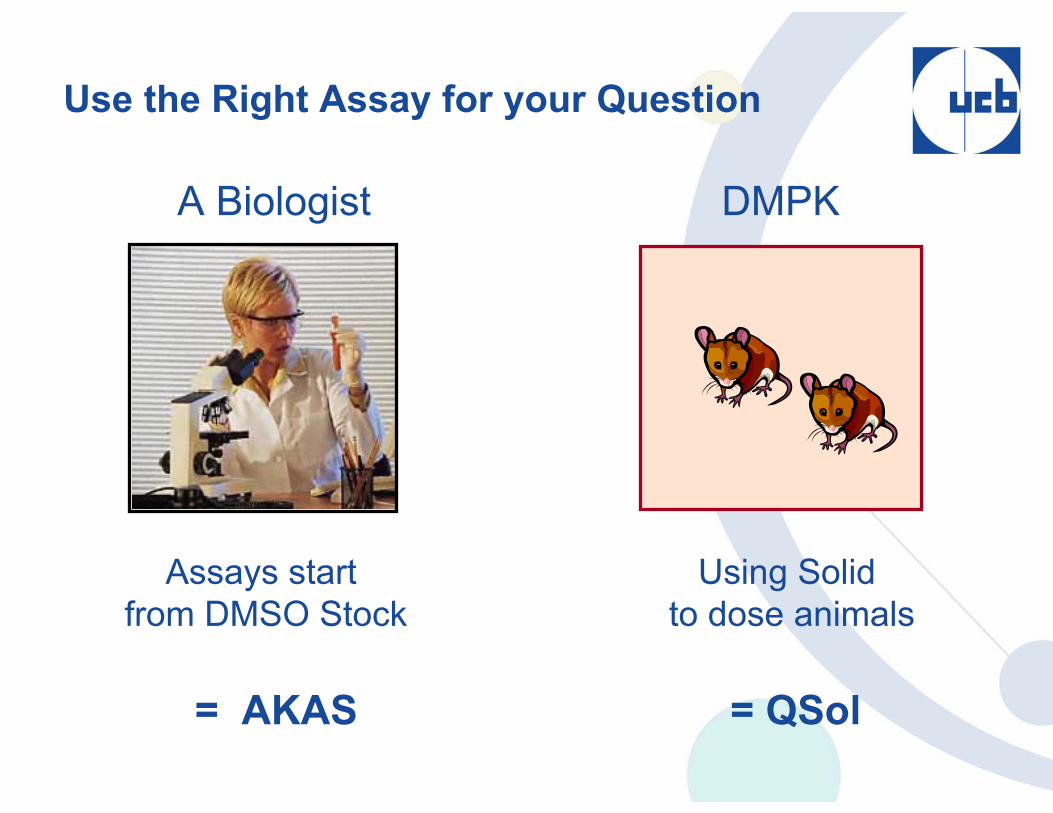
Use the Right Assay for your Question
Assays start from DMSO Stock
Using Solid to dose animals
A Biologist DMPK
= QSol= AKAS

Lipophilicity
aqaq
octoct
[neutral][ionised][neutral][ionised]D(o/w)
++
=Octanol
WaterPartition
Layers are separated and analysed by HPLC
Distribution Around The Body BloodAqueous
TissuesLipophilic
Sample added to octanol and water and shaken for 90 minutes
HTLogD7.4 assay
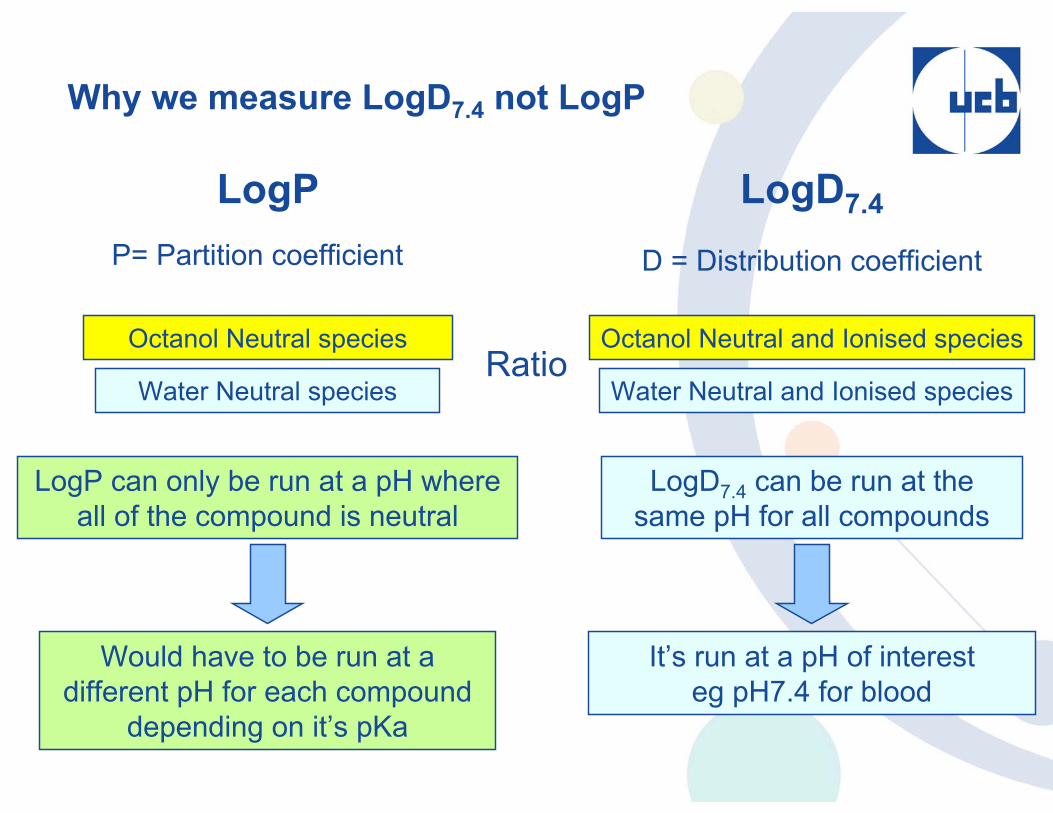
Why we measure LogD7.4 not LogP
Ratio
D = Distribution coefficient
Octanol Neutral and Ionised species
Water Neutral and Ionised species
LogD7.4 can be run at the same pH for all compounds
It’s run at a pH of interest eg pH7.4 for blood
LogD7.4
P= Partition coefficient
Octanol Neutral species
Water Neutral species
LogP can only be run at a pH where all of the compound is neutral
Would have to be run at a different pH for each compound
depending on it’s pKa
LogP
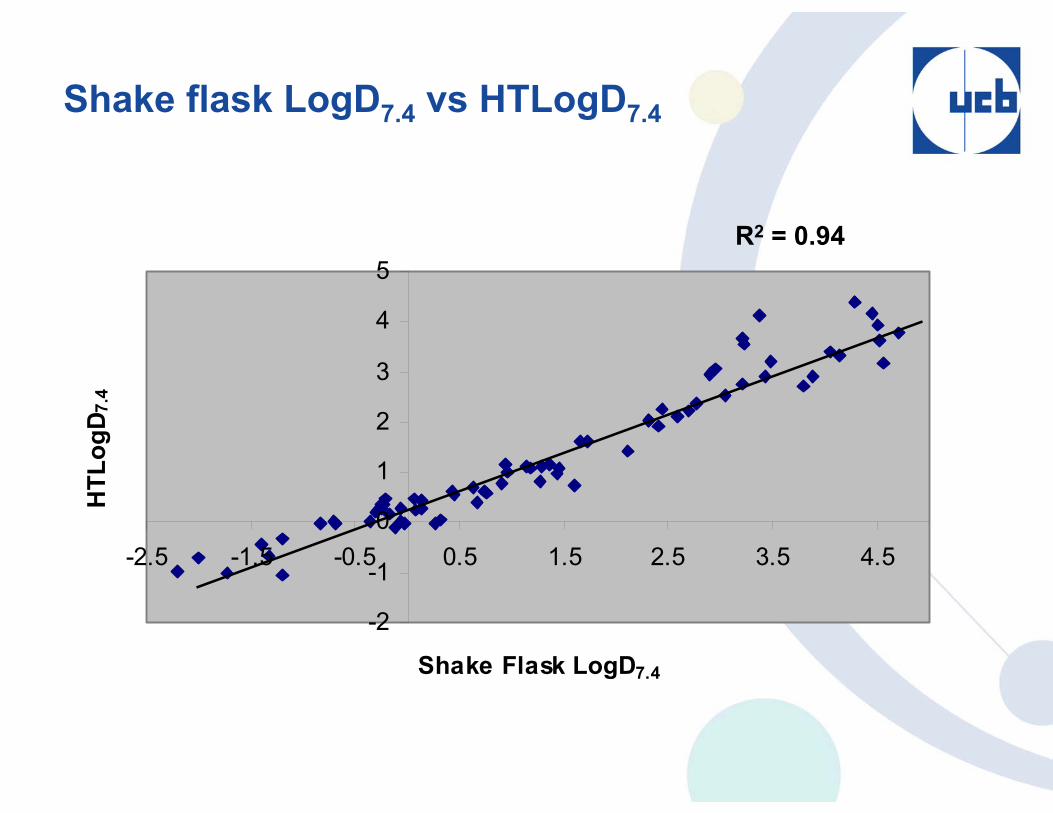
Shake flask LogD7.4 vs HTLogD7.4
-2
-1
0
1
2
3
4
5
-2.5 -1.5 -0.5 0.5 1.5 2.5 3.5 4.5
Shake Flask LogD7.4
HTL
ogD 7
.4
R2 = 0.94
There’s more to learn from AKAS than just solubility
Stability
pKa Approximation
If a compound is ionisable
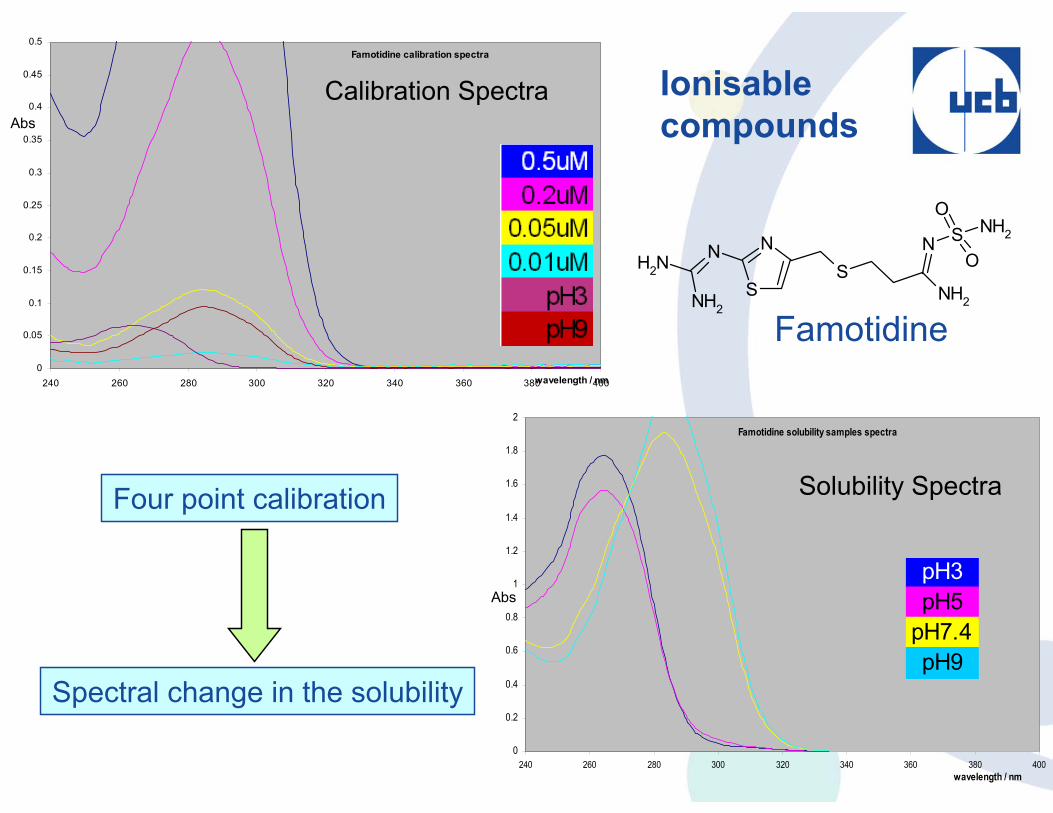
Spectral ChangeFamotidine calibration spectra
0
0.05
0.1
0.15
0.2
0.25
0.3
0.35
0.4
0.45
0.5
240 260 280 300 320 340 360 380 400wavelength / nm
0.5mM
0.2mM
0.05mM
0.01mM
pH3
pH9
Famotidine solubility samples spectra
0
0.2
0.4
0.6
0.8
1
1.2
1.4
1.6
1.8
2
240 260 280 300 320 340 360 380 400wavelength / nm
pH3
pH5
pH7.4
pH9
S
NNNH2
NH2
SNH2
N SO
O
NH2
Famotidine
Calibration Spectra
Solubility Spectra
Ionisable compoundsAbs
AbspH3pH5
pH7.4pH9
Four point calibration
Spectral change in the solubility
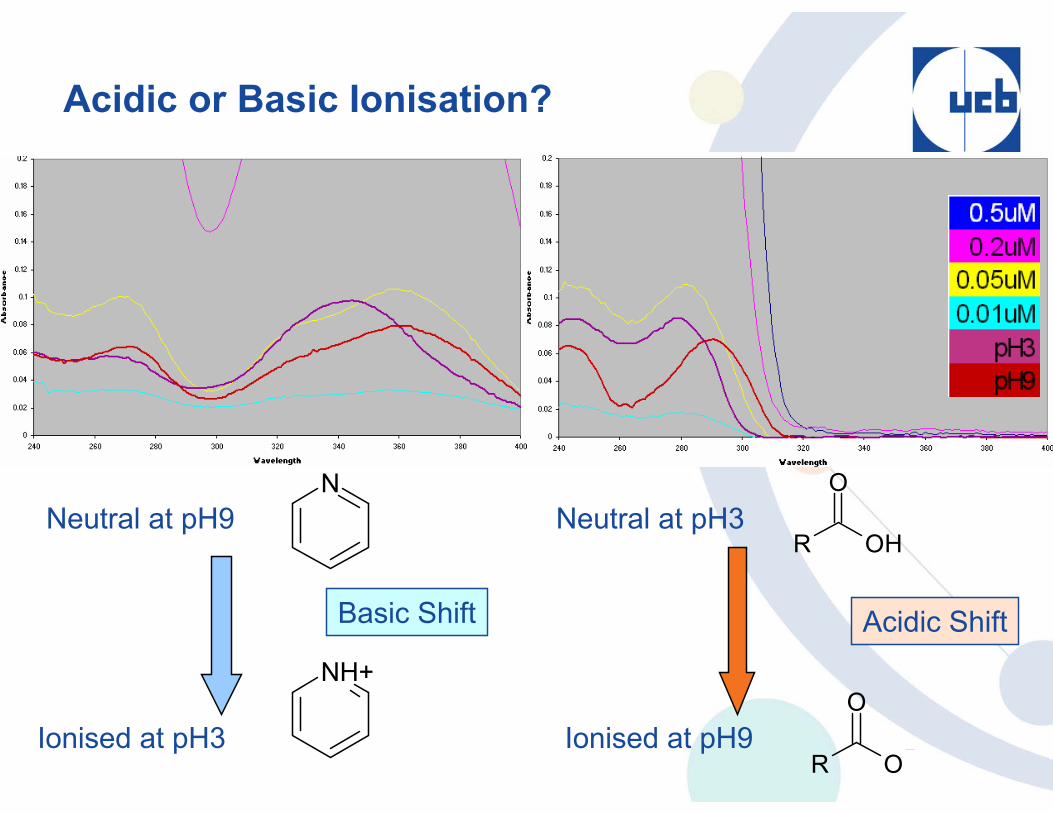
Acidic or Basic Ionisation?
N
NH+
O
R OH
O
R O
Neutral at pH9
Ionised at pH3
Neutral at pH3
Ionised at pH9
Basic Shift Acidic Shift
Spectral ChangeFamotidine calibration spectra
0
0.05
0.1
0.15
0.2
0.25
0.3
0.35
0.4
0.45
0.5
240 260 280 300 320 340 360 380 400wavelength / nm
0.5mM
0.2mM
0.05mM
0.01mM
pH3
pH9
Famotidine solubility samples spectra
0
0.2
0.4
0.6
0.8
1
1.2
1.4
1.6
1.8
2
240 260 280 300 320 340 360 380 400wavelength / nm
pH3
pH5
pH7.4
pH9
S
NNNH2
NH2
SNH2
N SO
O
NH2
Famotidine
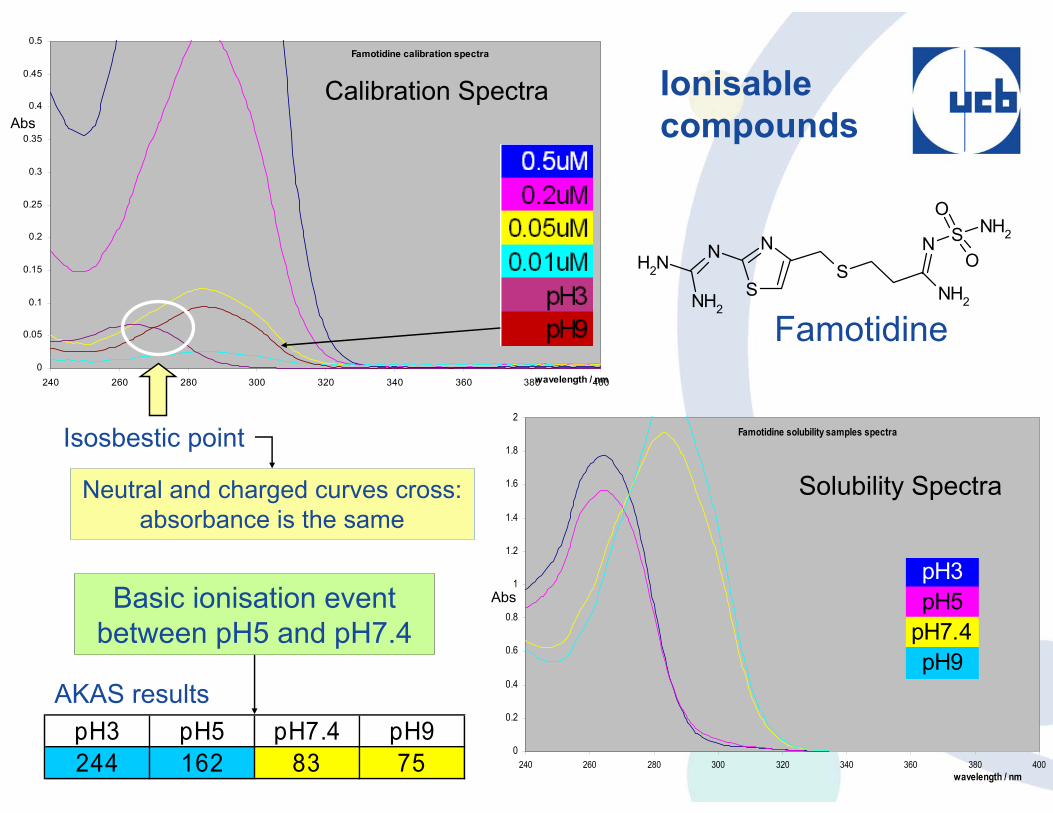
Isosbestic point
Neutral and charged curves cross: absorbance is the same
Calibration Spectra
Solubility Spectra
Ionisable compoundsAbs
AbspH3pH5
pH7.4pH9
Basic ionisation event between pH5 and pH7.4
pH3 pH5 pH7.4 pH9244 162 83 75
AKAS results
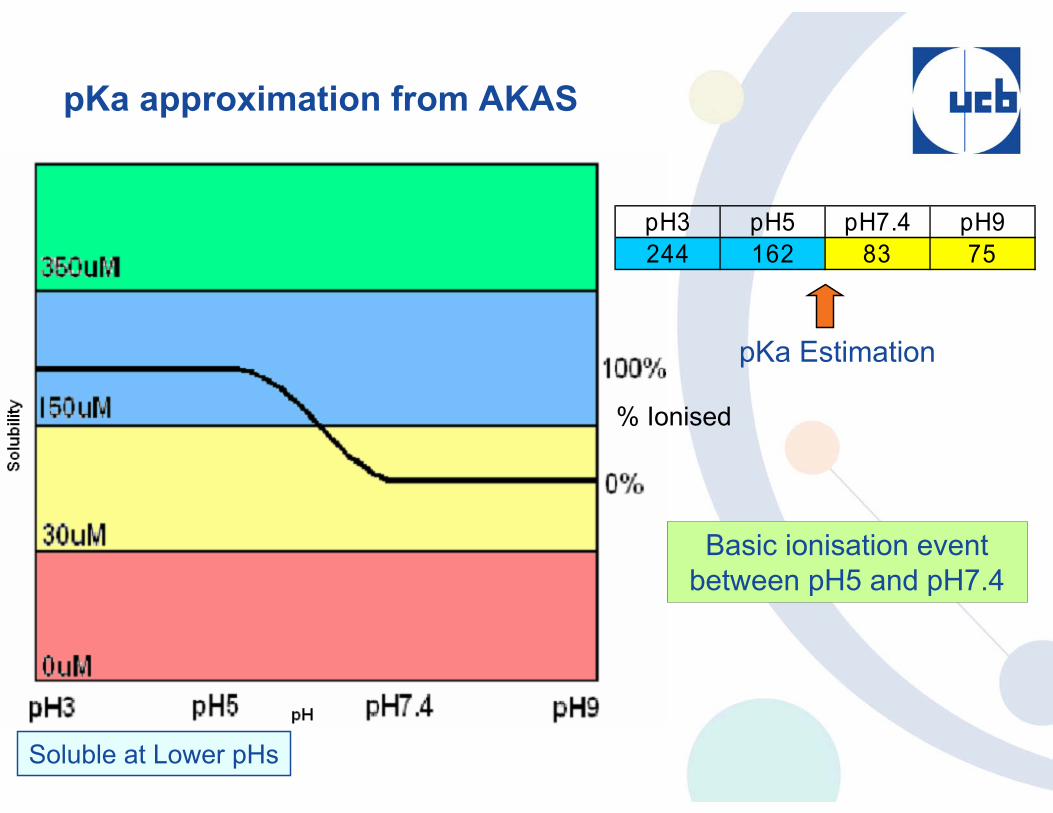
pKa approximation from AKAS
pKa Estimation
Soluble at Lower pHs
Basic ionisation event between pH5 and pH7.4
pH3 pH5 pH7.4 pH9244 162 83 75
% Ionised
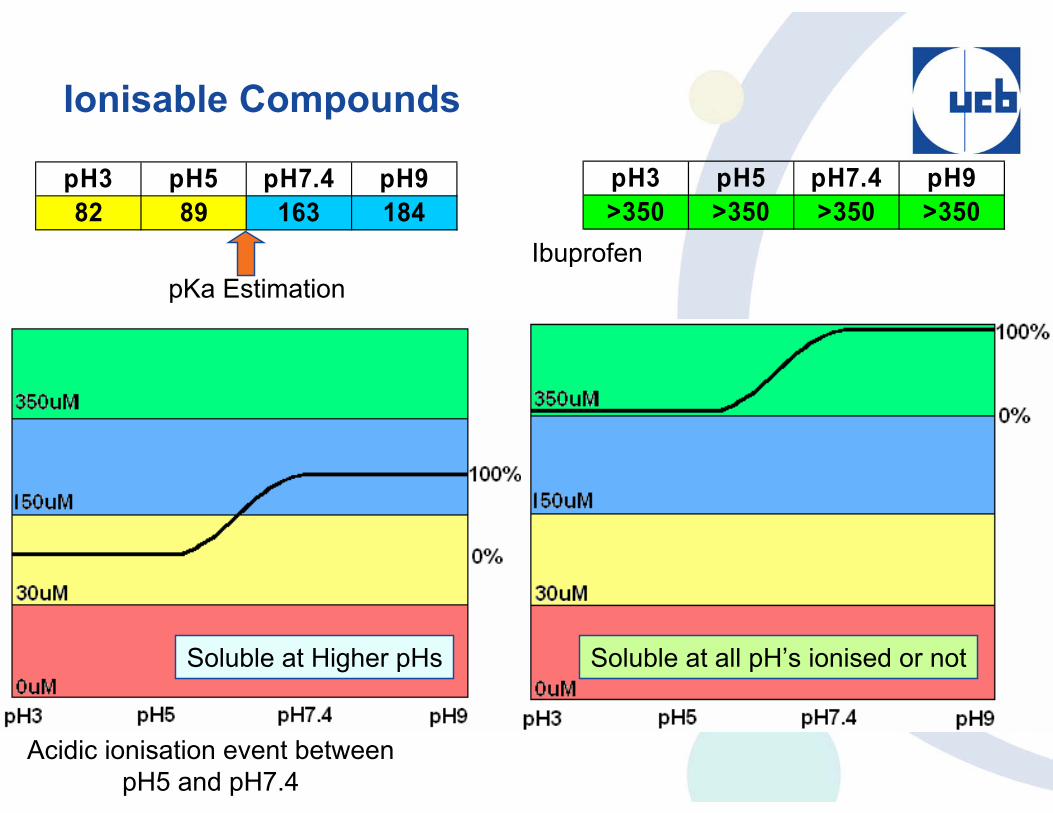
Ionisable Compounds
pH3 pH5 pH7.4 pH982 89 163 184
pKa Estimation
Soluble at Higher pHs Soluble at all pH’s ionised or not
pH3 pH5 pH7.4 pH9>350 >350 >350 >350
Ibuprofen
Acidic ionisation event between pH5 and pH7.4
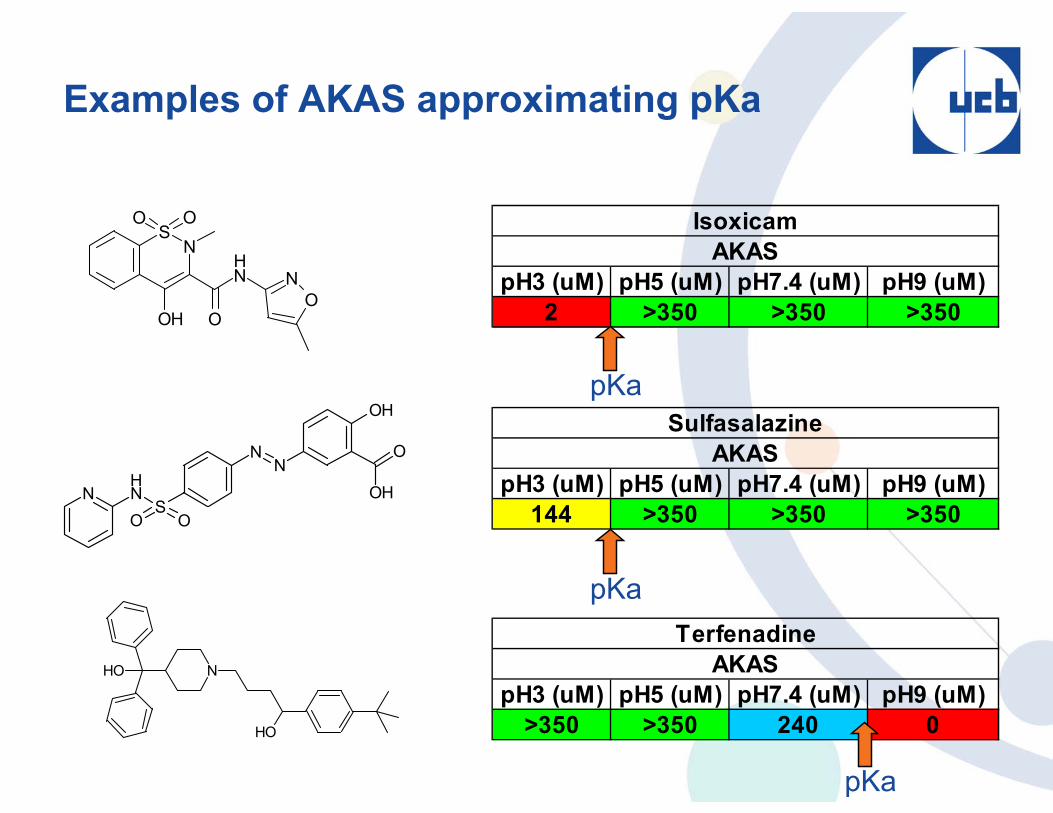
Examples of AKAS approximating pKa
pH3 (uM) pH5 (uM) pH7.4 (uM) pH9 (uM)2 >350 >350 >350
AKASIsoxicam
pH3 (uM) pH5 (uM) pH7.4 (uM) pH9 (uM)144 >350 >350 >350
AKASSulfasalazine
pH3 (uM) pH5 (uM) pH7.4 (uM) pH9 (uM)>350 >350 240 0
AKASTerfenadine
NS
O
NH
OH
OO
ON
N NH
SO O
NN
OH
O
OH
NOH
OH
pKa
pKa
pKa
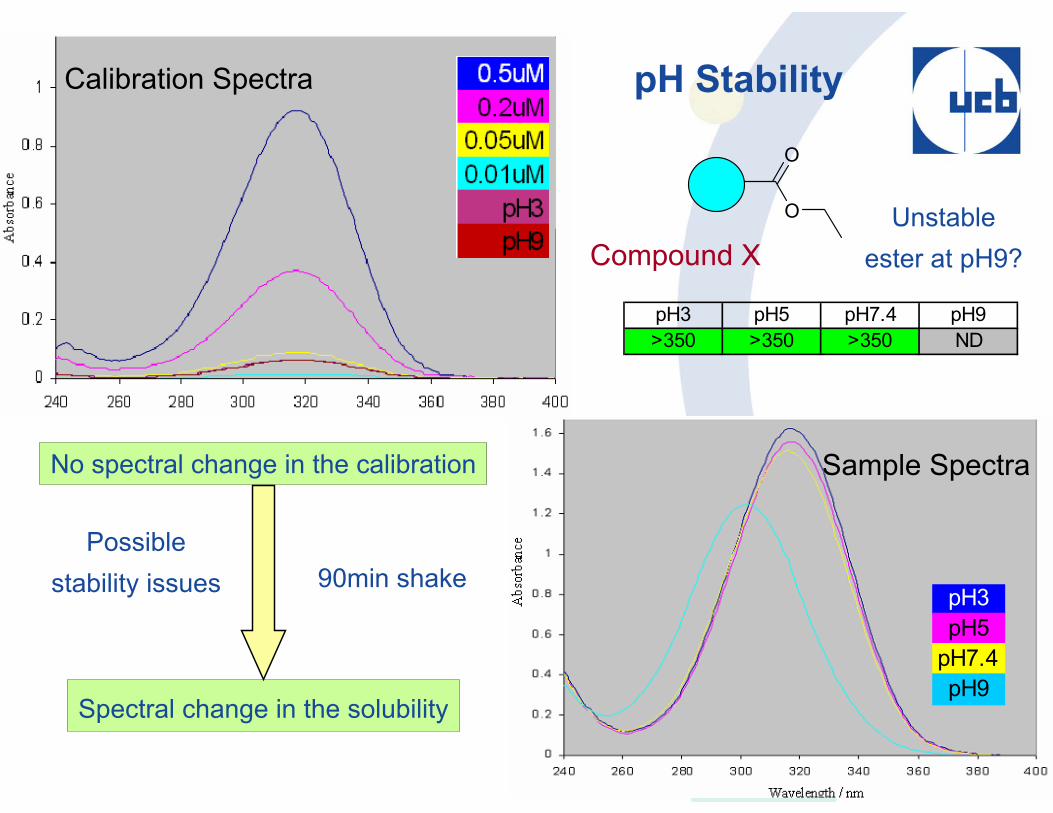
pH Stability
pH3 pH5 pH7.4 pH9>350 >350 >350 ND
O
O
Compound X
No spectral change in the calibration
Spectral change in the solubility
Unstable ester at pH9?
90min shakePossible
stability issues
Calibration Spectra
Sample Spectra
pH3pH5
pH7.4pH9
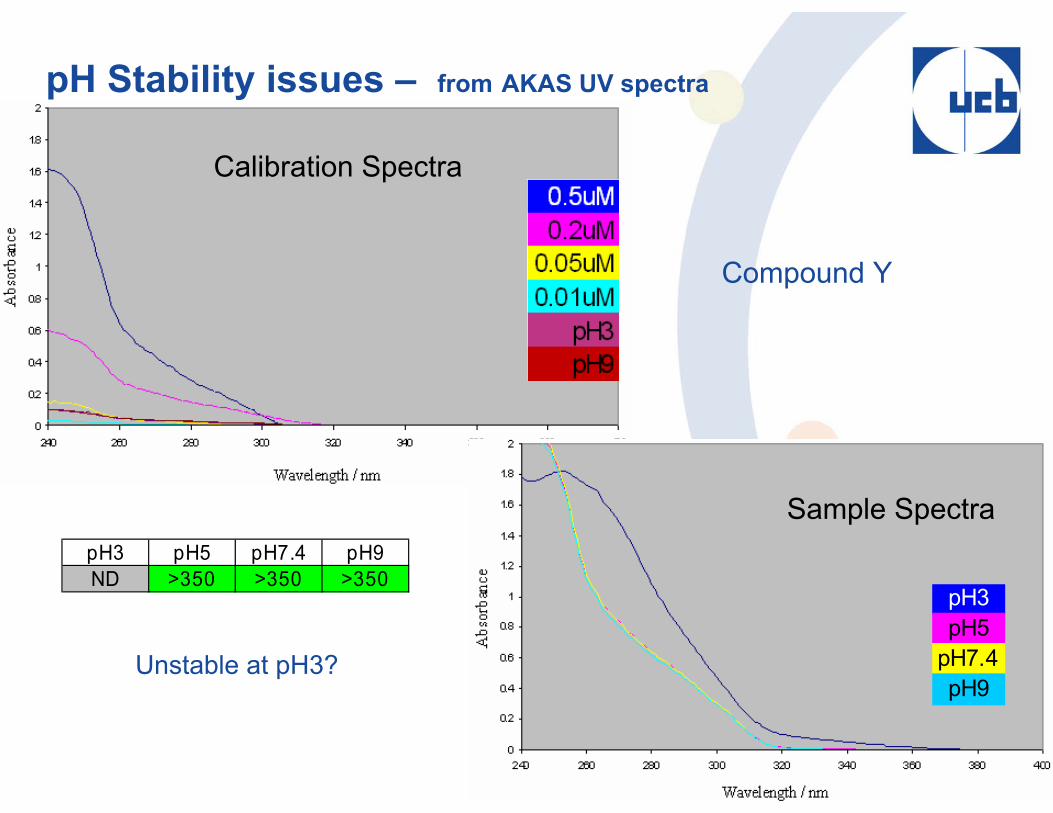
pH Stability issues – from AKAS UV spectra
Compound Y
pH3pH5
pH7.4pH9
Calibration Spectra
Sample SpectrapH3 pH5 pH7.4 pH9ND >350 >350 >350
Unstable at pH3?
There’s more to learn from AKAS than just solubility
Stability
pKa Approximation
If a compound is ionisable
So in 6hrs we have discovered:
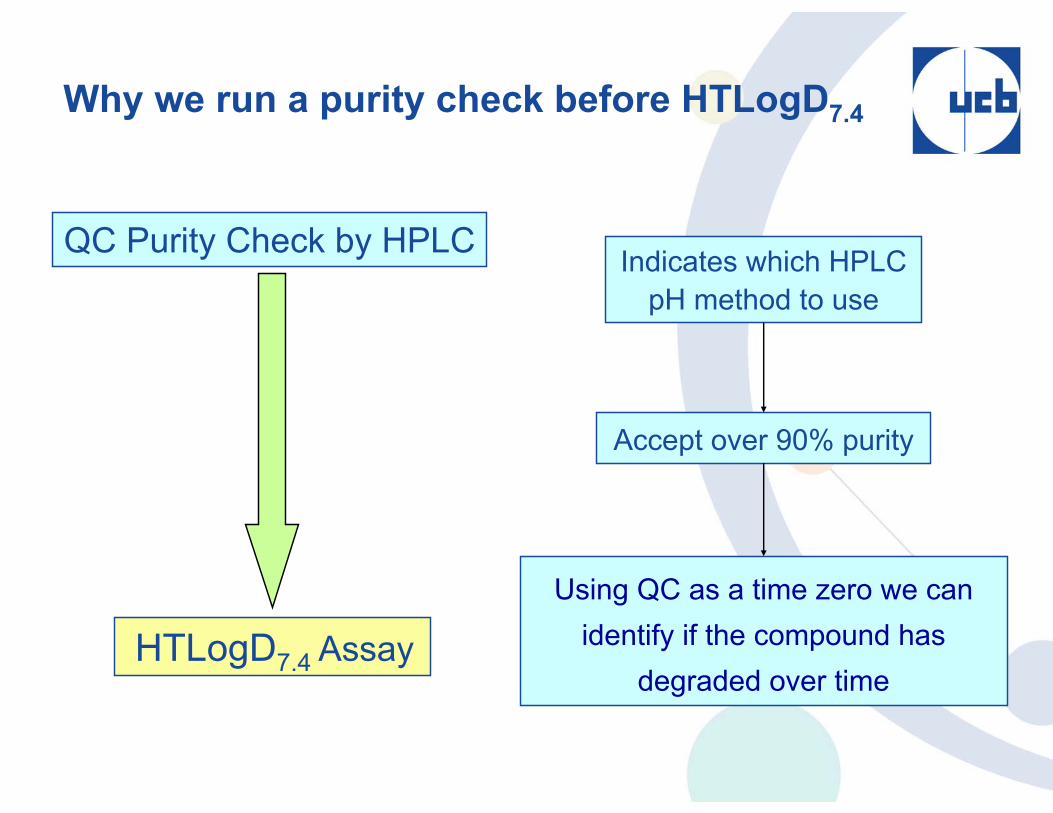
Why we run a purity check before HTLogD7.4
Accept over 90% purity
Indicates which HPLC pH method to use
Using QC as a time zero we can identify if the compound has
degraded over time
QC Purity Check by HPLC
HTLogD7.4 Assay
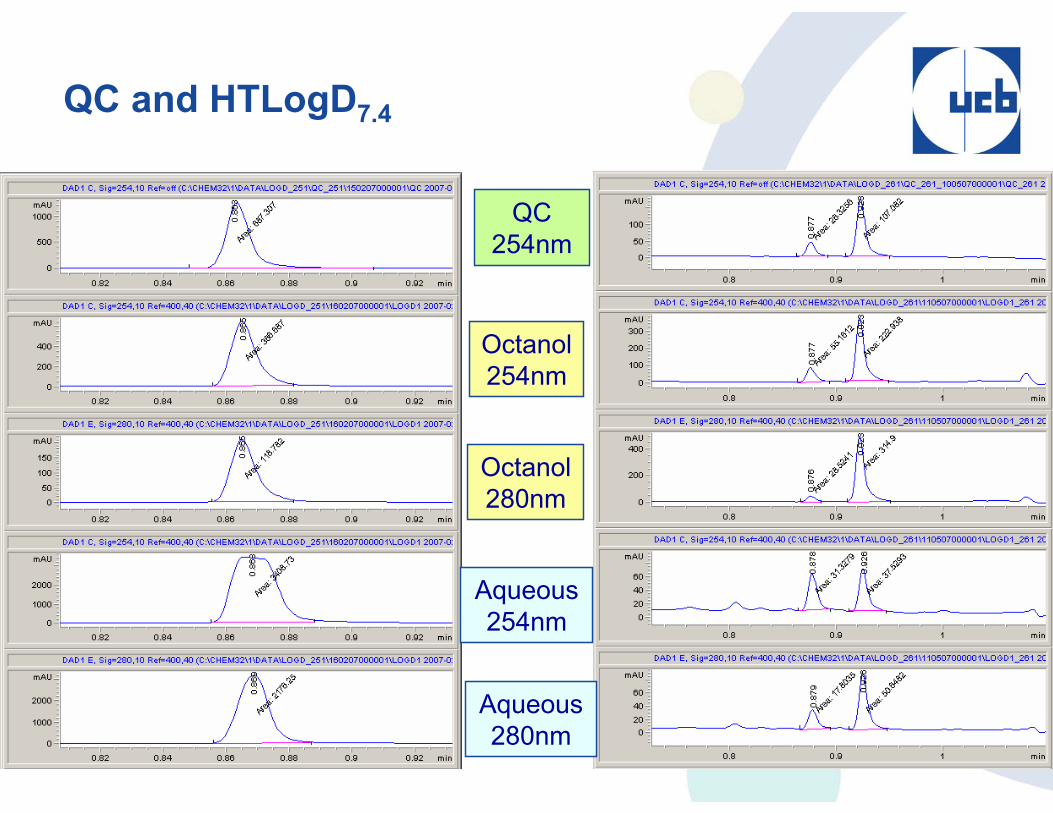
QC and HTLogD7.4
Octanol 254nm
Octanol 280nm
Aqueous 254nm
Aqueous 280nm
QC 254nm

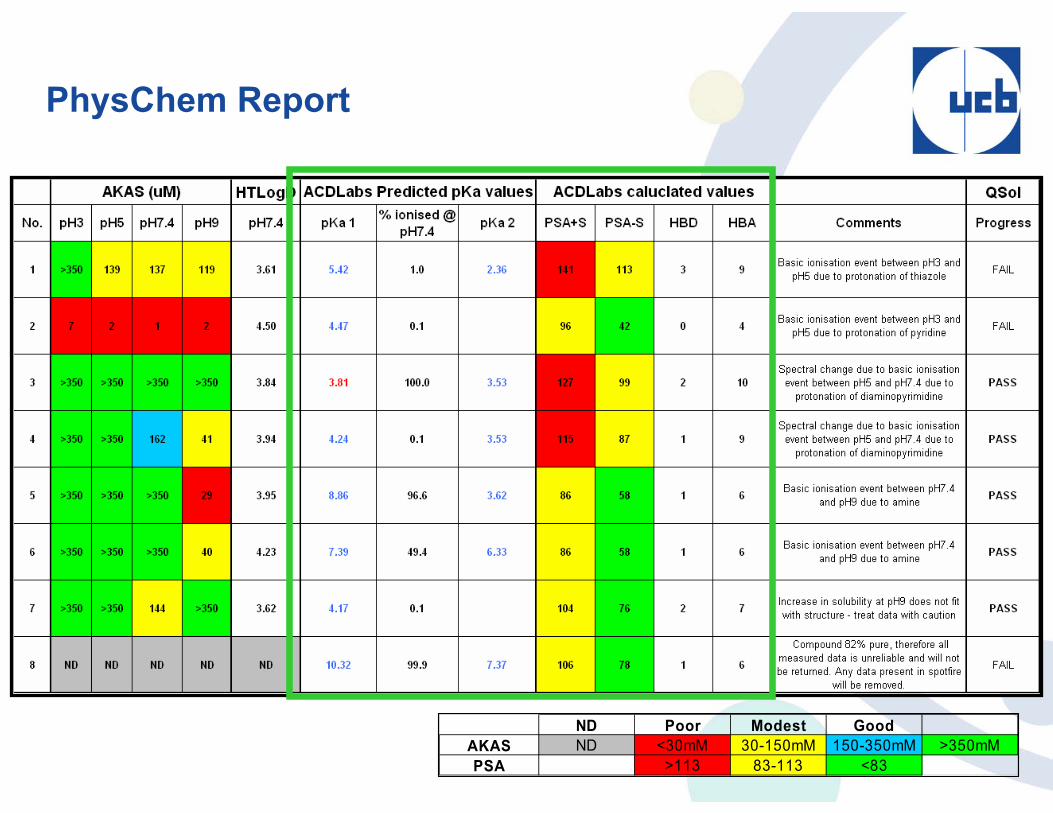
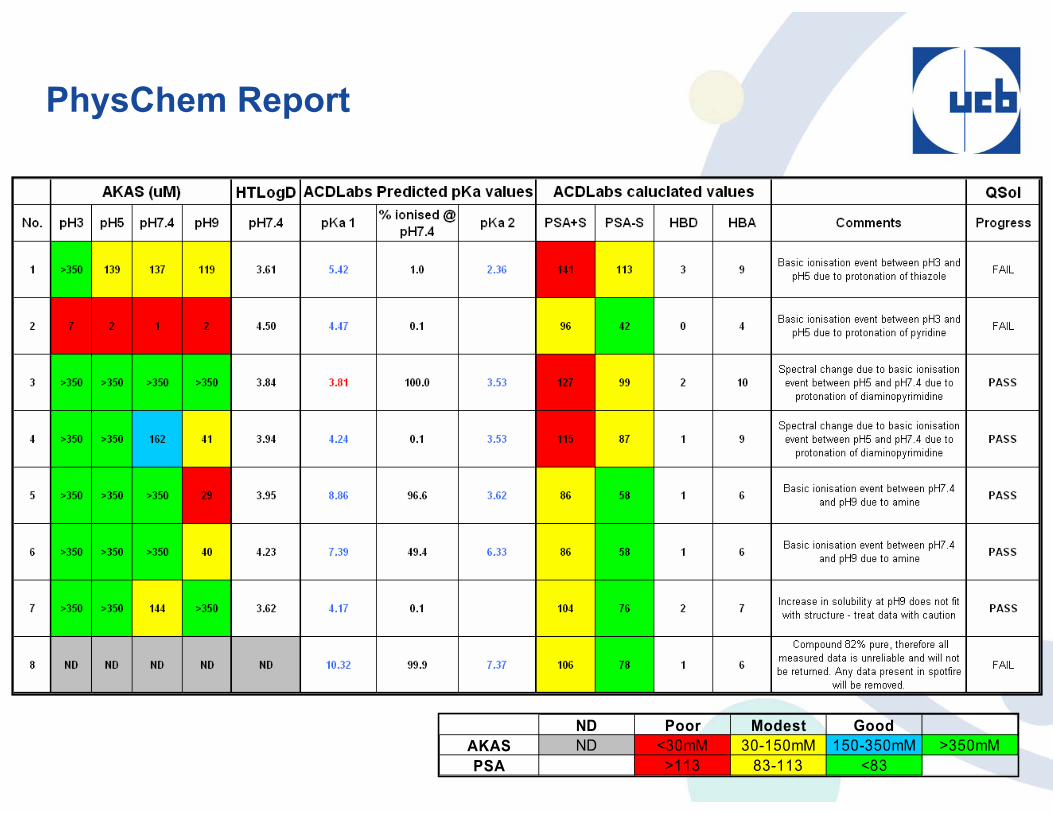
PhysChem Report
ND Poor Modest GoodAKAS ND <30mM 30-150mM 150-350mM >350mMPSA >113 83-113 <83
PhysChem Report
ND Poor Modest GoodAKAS ND <30mM 30-150mM 150-350mM >350mMPSA >113 83-113 <83
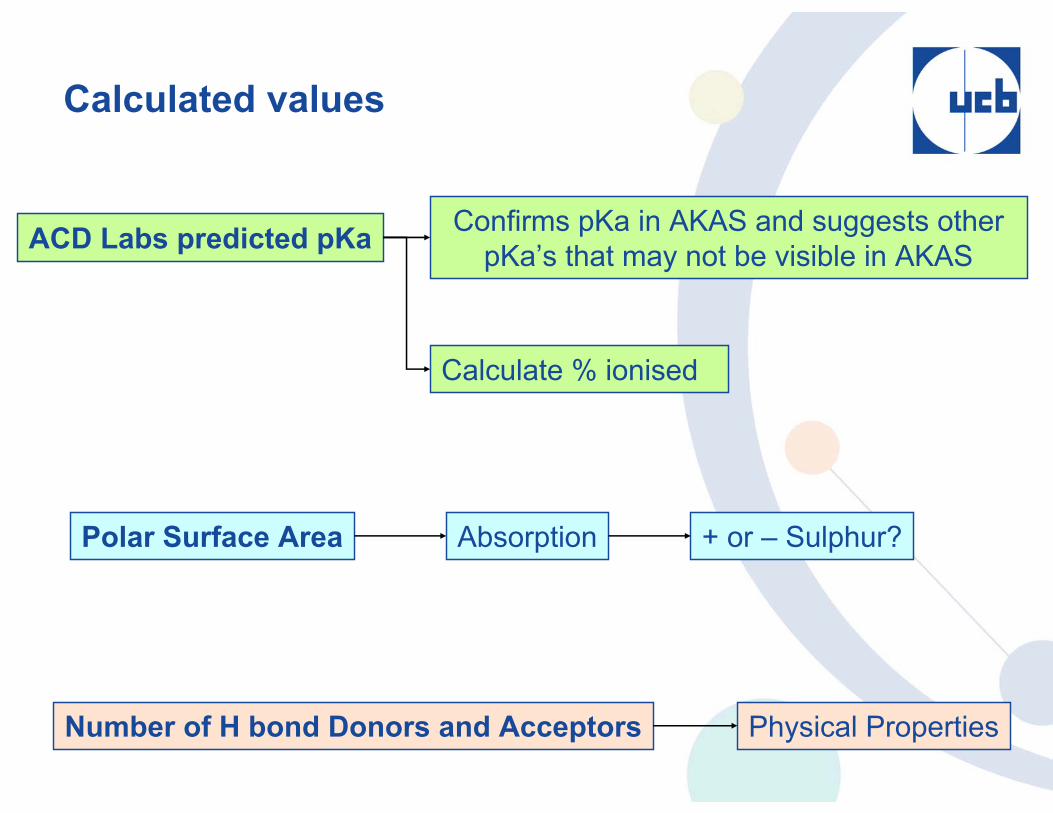
Calculated values
ACD Labs predicted pKa
Polar Surface Area Absorption
Calculate % ionised
Number of H bond Donors and Acceptors Physical Properties
Confirms pKa in AKAS and suggests other pKa’s that may not be visible in AKAS
+ or – Sulphur?
Benefit of Our Report Over Databases
Averaged and concatenated data
Comments not looked at – stability issues highlighted
Difficult to see PhysChem data as a package
ACD labs pKa
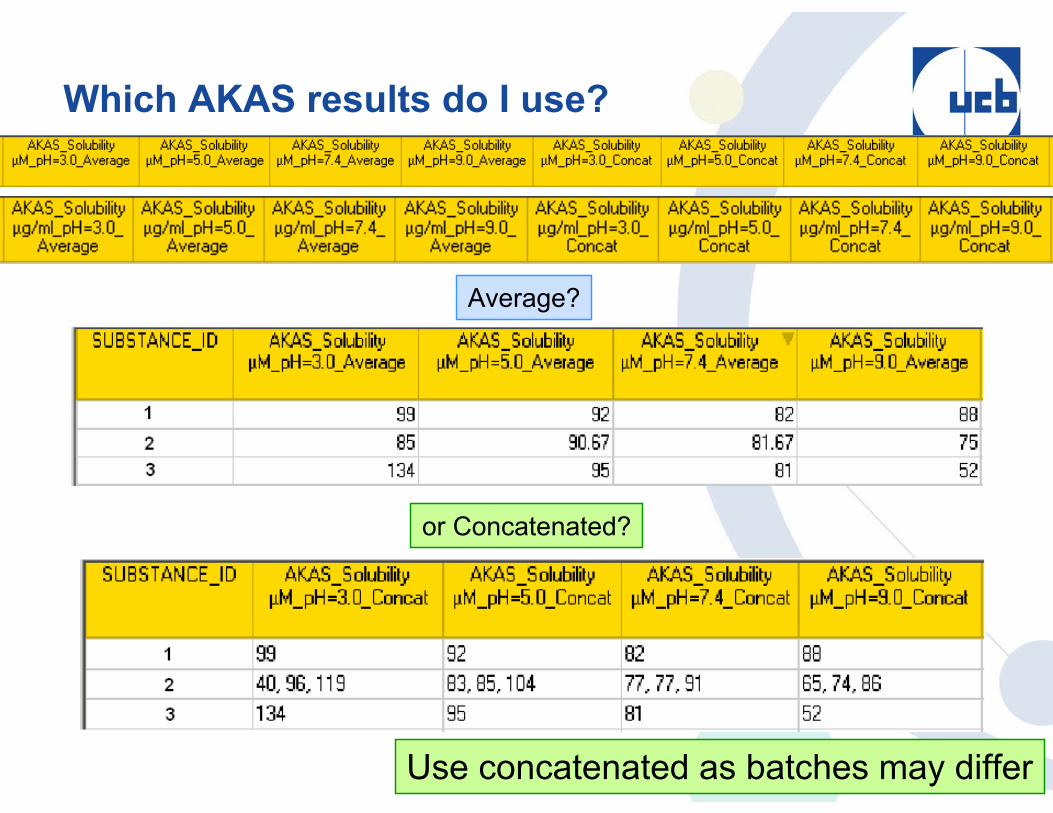
Which AKAS results do I use?
Use concatenated as batches may differ
Average?
or Concatenated?
PhysChem Report
ND Poor Modest GoodAKAS ND <30mM 30-150mM 150-350mM >350mMPSA >113 83-113 <83
Summary
The PhysChem Report
Measured Values, AKAS, QSol, HTLogD.
Can approximate pKa from AKAS
Possible to highlight stability issues from AKAS and HTLogD
Calculated Values, pKa, PSA, H-bond Donors/Acceptors
Limitations with Spotfire

Acknowledgements
•PhysChem, Cambridge, UK• John Cooper• Benedicte Fau• Dave Sherwood
•PhysChem, Slough, UK• Richard Taylor• Barbara Mason• Christine Prosser• Justin Staniforth• Femi Kumuyi
•PhysChem, Braine, Belgium• Luc Quere• Liliane Ellens• Benoit Matthew• Geraldine Longfils
•Informatics, Slough• Mike Sanderson• Sarah Archibald• Dave Lee• Phil Ashworth• Steve Guise• Matt Page

Questions
Questions?
References
Li Di and E H Kerns. Profiling drug-like properties in discovery research. Current opinion in Chemical Biology 2003, 7:402-408
Li Di and E H Kerns. Physicochemical profiling: overview of the screens.DDT. Vol.1, No.4 2004
Li Di and E H Kerns. Pharmaceutical profiling in drug discovery. Therapeutic focus. DDT Vol.8 No.7 April 2003
T Hartman, J Schmitt. Lipophilicity-beyond octanol/water: a short comparison of modern technologies. DDT Vol.1 No.4 2004
Alex Avdeef. Absorption and Drug Development Solubility, Permeability and Charge State. pION, Inc. John Wiley & Sons 2003
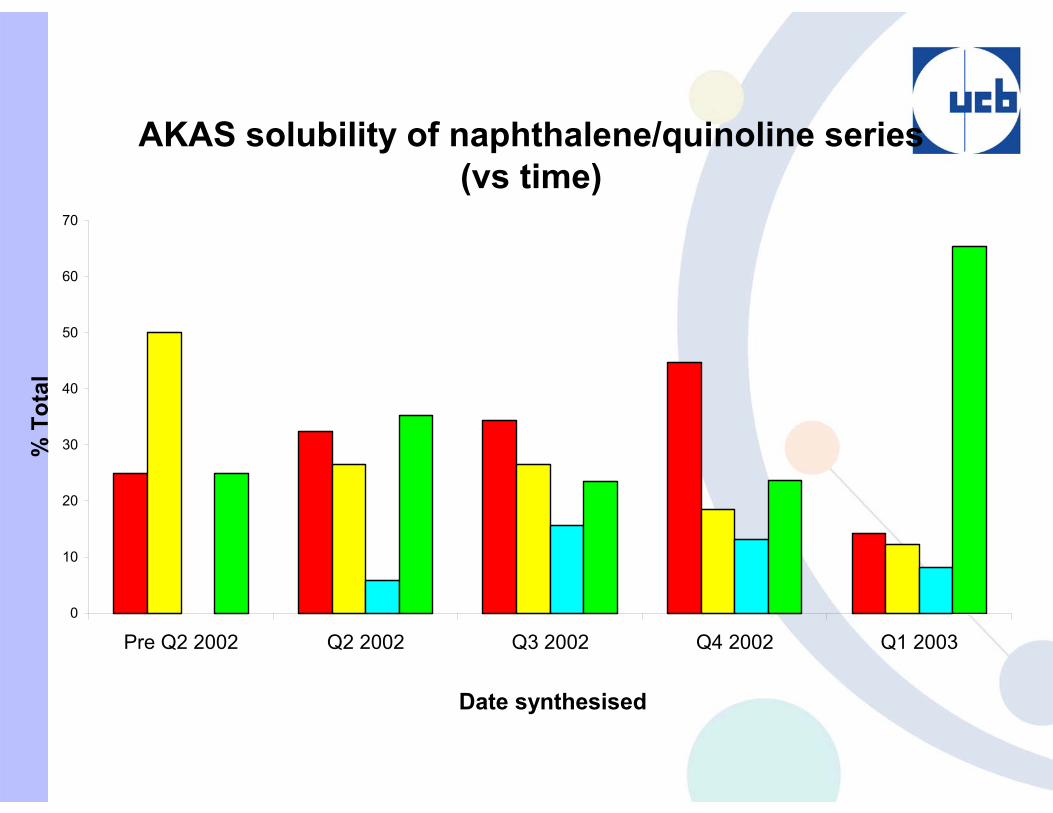
AKAS solubility of naphthalene/quinoline series(vs time)
0
10
20
30
40
50
60
70
Pre Q2 2002 Q2 2002 Q3 2002 Q4 2002 Q1 2003
Date synthesised
% T
otal
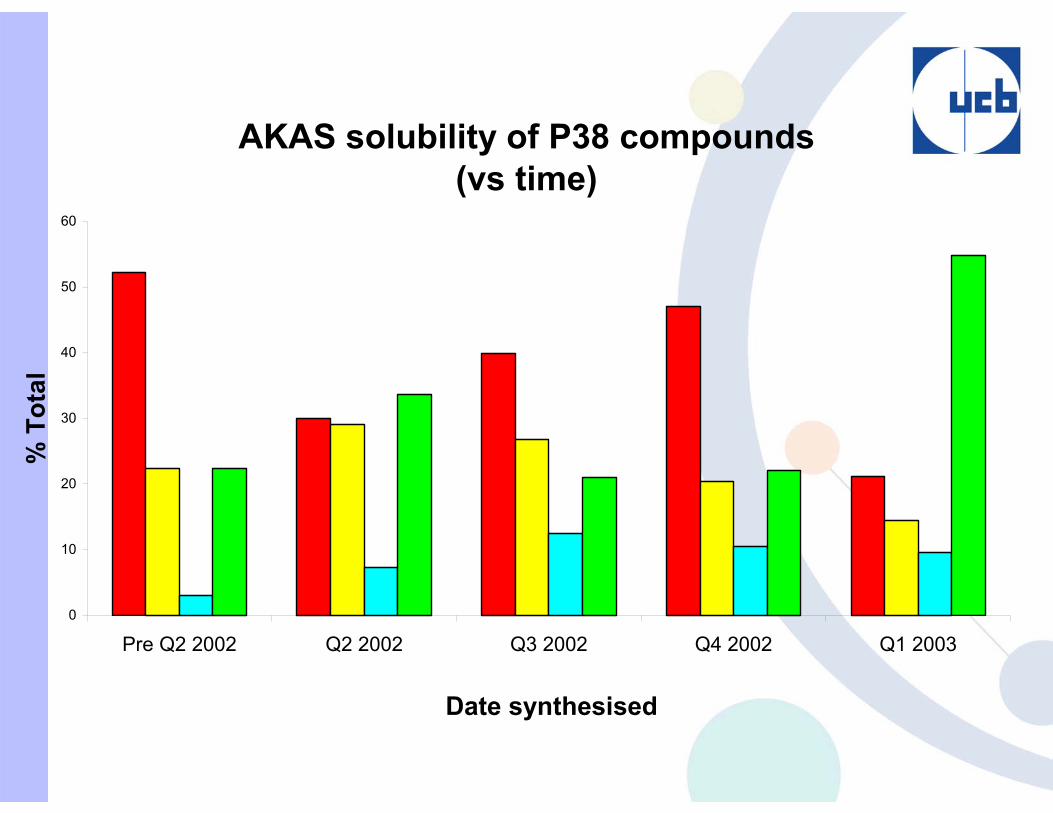
AKAS solubility of P38 compounds(vs time)
0
10
20
30
40
50
60
Pre Q2 2002 Q2 2002 Q3 2002 Q4 2002 Q1 2003
Date synthesised
% T
otal
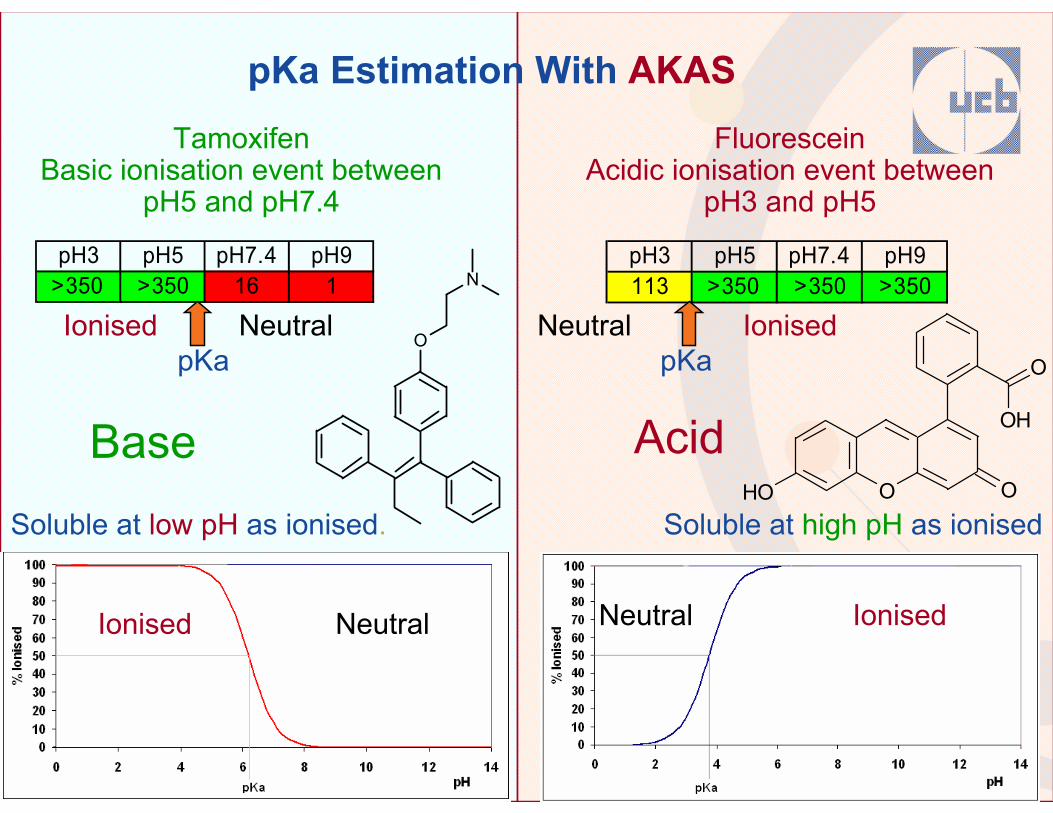
pKa Estimation With AKASTamoxifen
Basic ionisation event between pH5 and pH7.4
O
O
O
OH
OH
Fluorescein Acidic ionisation event between
pH3 and pH5
pH3 pH5 pH7.4 pH9>350 >350 16 1
pH3 pH5 pH7.4 pH9113 >350 >350 >350
Ionised NeutralpKa
IonisedNeutralpKa
Base Acid
O
N
Soluble at low pH as ionised. Soluble at high pH as ionised
Ionised Neutral Neutral Ionised
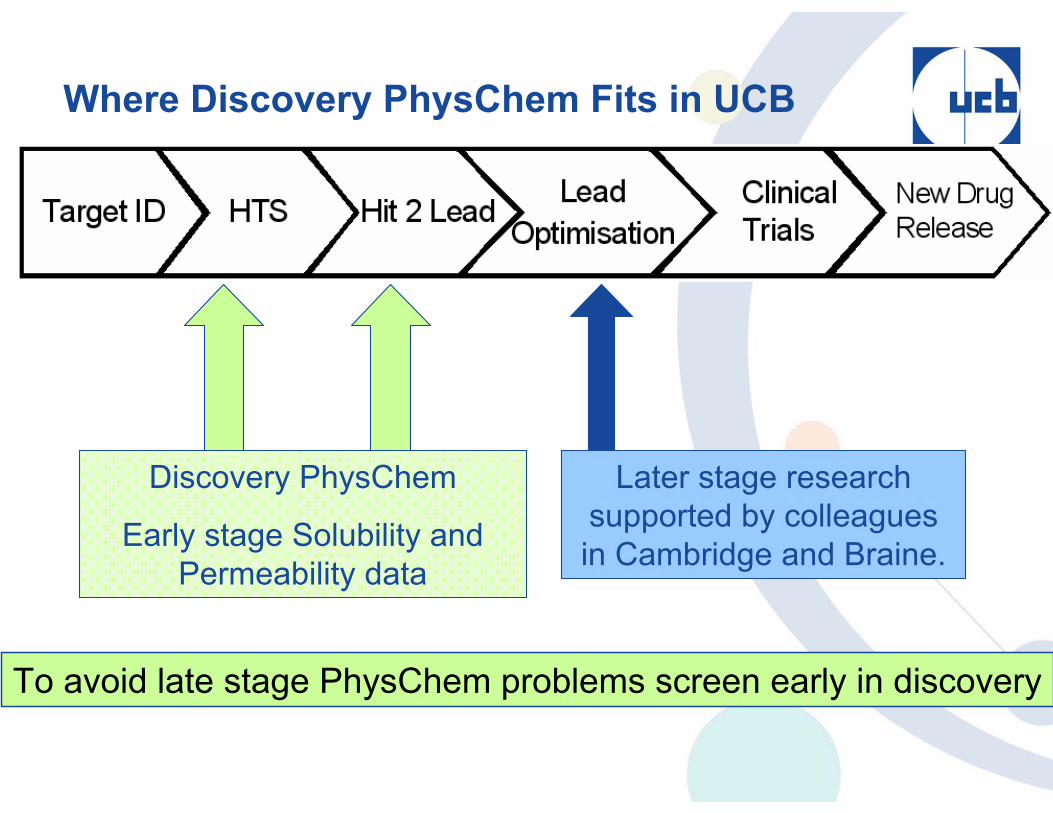
Where Discovery PhysChem Fits in UCB
To avoid late stage PhysChem problems screen early in discovery
Discovery PhysChem
Early stage Solubility and Permeability data
Later stage research supported by colleagues in Cambridge and Braine.
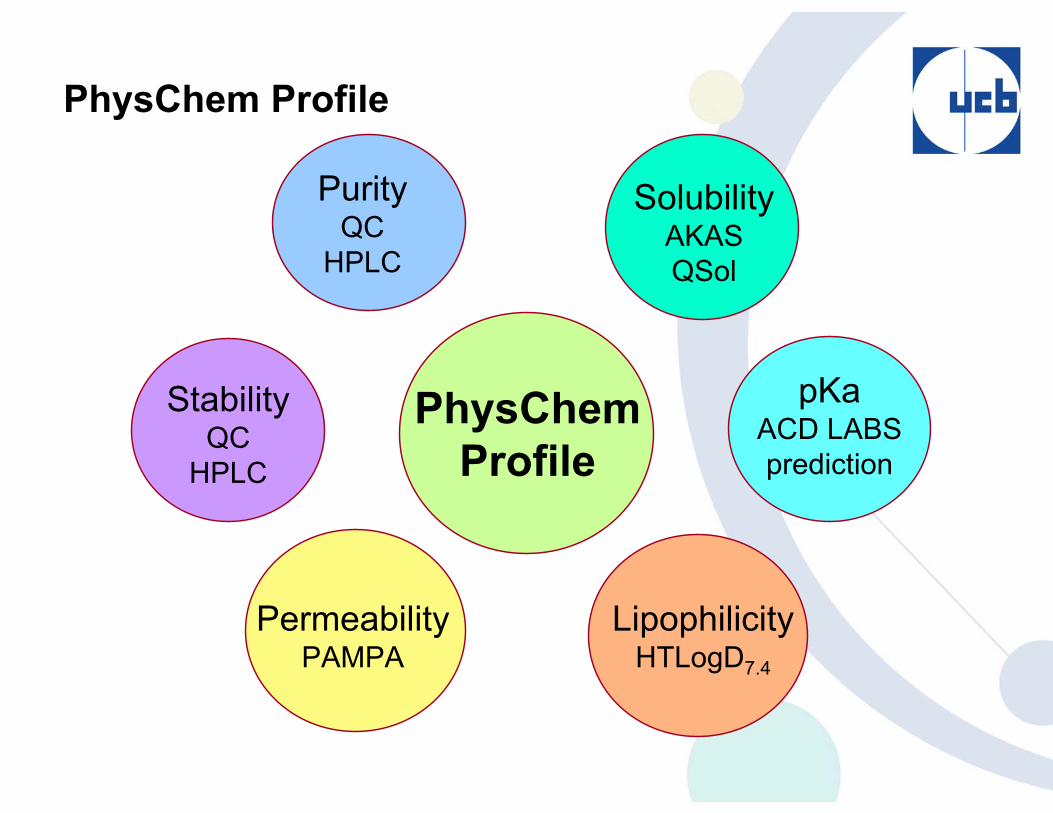
PhysChem Profile
Lipophilicity HTLogD7.4
pKaACD LABS prediction
PurityQC
HPLC
StabilityQC
HPLC
PermeabilityPAMPA
PhysChem Profile
SolubilityAKASQSol
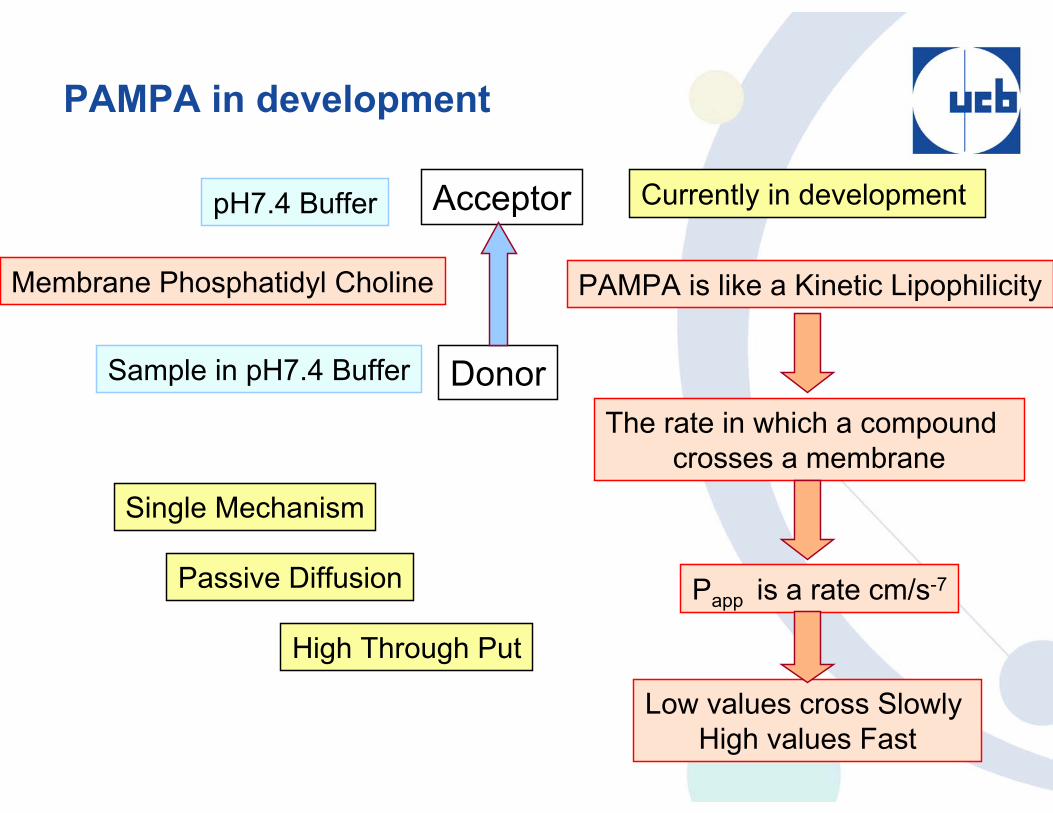
PAMPA in development
Currently in development
Donor
AcceptorpH7.4 Buffer
Sample in pH7.4 Buffer
Membrane Phosphatidyl Choline
Single Mechanism
Passive Diffusion
High Through Put
Papp is a rate cm/s-7
PAMPA is like a Kinetic Lipophilicity
The rate in which a compound crosses a membrane
Low values cross Slowly High values Fast
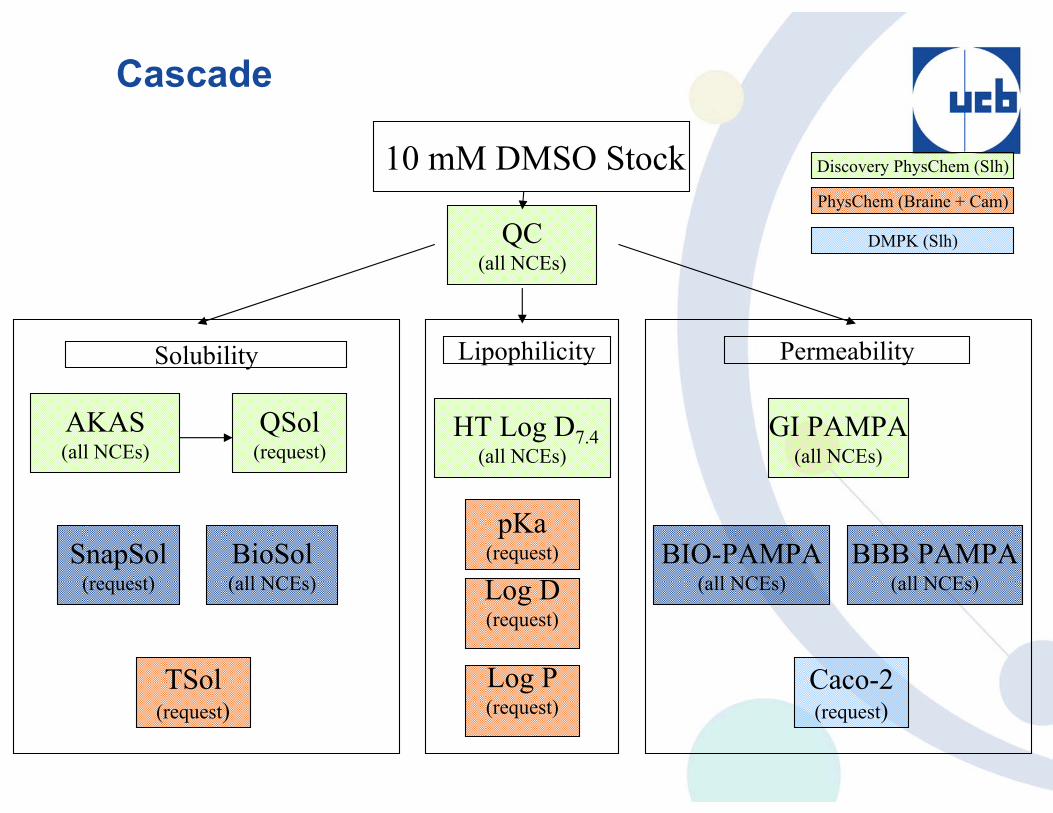
GI PAMPA(all NCEs)
BBB PAMPA(all NCEs)
Caco-2(request)
Permeability
SnapSol(request)
BioSol(all NCEs)
AKAS(all NCEs)
QSol(request)
TSol(request)
Solubility
HT Log D7.4(all NCEs)
BIO-PAMPA(all NCEs)
Lipophilicity
10 mM DMSO Stock
Log P(request)
pKa(request)
Discovery PhysChem (Slh)
PhysChem (Braine + Cam)
DMPK (Slh)QC(all NCEs)
Log D(request)
Cascade
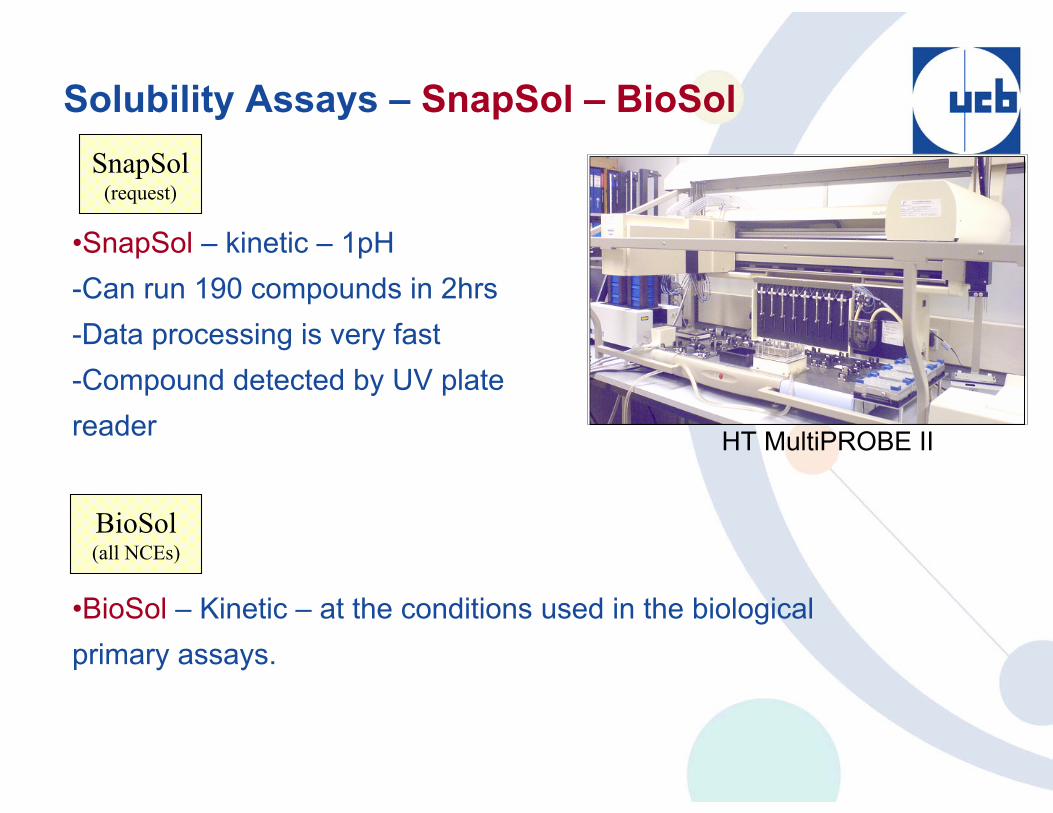
Solubility Assays – SnapSol – BioSol
•SnapSol – kinetic – 1pH-Can run 190 compounds in 2hrs-Data processing is very fast-Compound detected by UV plate reader
•BioSol – Kinetic – at the conditions used in the biological primary assays.
HT MultiPROBE II
SnapSol(request)
BioSol(all NCEs)