Embed Size (px)
Citation preview

Phylogeographic Structure in Benthic MarineInvertebrates of the Southeast Pacific Coast of Chile withDiffering Dispersal PotentialPilar A. Haye1,2*, Nicolas I. Segovia1,3, Natalia C. Munoz-Herrera1,2, Francisca E. Galvez1,
Andrea Martınez3, Andres Meynard4, Marıa C. Pardo-Gandarillas3,4, Elie Poulin3, Sylvain Faugeron4
1 Laboratorio de Diversidad Molecular, Departamento de Biologıa Marina, Facultad de Ciencias del Mar, Universidad Catolica del Norte & Centro de Estudios Avanzados en
Zonas Aridas (CEAZA), Coquimbo, Chile, 2 Interdisciplinary Center for Aquaculture Research (INCAR), Universidad de Concepcion, Concepcion, Chile, 3 Instituto de
Ecologıa y Biodiversidad, Departamento de Ciencias Ecologicas, Universidad de Chile, Santiago, Chile, 4 Centro de Conservacion Marina, Facultad de Ciencias Biologicas,
Pontificia Universidad Catolica de Chile, Santiago, Chile
Abstract
The role of dispersal potential on phylogeographic structure, evidenced by the degree of genetic structure and thepresence of coincident genetic and biogeographic breaks, was evaluated in a macrogeographic comparative approachalong the north-central coast of Chile, across the biogeographic transition zone at 30uS. Using 2,217 partial sequences of themitochondrial Cytochrome Oxidase I gene of eight benthic invertebrate species along ca. 2,600 km of coast, we contrasteddispersal potential with genetic structure and determined the concordance between genetic divergence betweenbiogeographic regions and the biogeographic transition zone at 30uS. Genetic diversity and differentiation highly differedbetween species with high and low dispersal potential. Dispersal potential, sometimes together with biogeographic region,was the factor that best explained the genetic structure of the eight species. The three low dispersal species, and onespecies assigned to the high dispersal category, had a phylogeographic discontinuity coincident with the biogeographictransition zone at 30uS. Furthermore, coalescent analyses based on the isolation-with-migration model validate that the splitbetween biogeographic regions north and south of 30uS has a historic origin. The signatures of the historic break in highdispersers is parsimoniously explained by the homogenizing effects of gene flow that have erased the genetic signatures, ifever existed, in high dispersers. Of the four species with structure across the break, only two had significant albeit very lowlevels of asymmetric migration across the transition zone. Historic processes have led to the current biogeographic andphylogeographic structure of marine species with limited dispersal along the north-central coast of Chile, with a stronglasting impact in their genetic structure.
Citation: Haye PA, Segovia NI, Munoz-Herrera NC, Galvez FE, Martınez A, et al. (2014) Phylogeographic Structure in Benthic Marine Invertebrates of the SoutheastPacific Coast of Chile with Differing Dispersal Potential. PLoS ONE 9(2): e88613. doi:10.1371/journal.pone.0088613
Editor: Brian R. MacKenzie, Technical University of Denmark, Denmark
Received February 6, 2012; Accepted January 15, 2014; Published February 19, 2014
Copyright: � 2014 Haye et al. This is an open-access article distributed under the terms of the Creative Commons Attribution License, which permitsunrestricted use, distribution, and reproduction in any medium, provided the original author and source are credited.
Funding: This research was mainly funded by the Chilean National Fund of Science and Technology FONDECYT (grant Fondecyt 1090670 to PH and SF). Partialfunding was provided by Iniciativa Cientıfica Mileno (ICM P05-002 and PFB-23 to A. Martınez and EP; ICM P10-033F to A. Meynard and SF) and INCAR (grantFONDAP 15110027 to PH). The funders had no role in study design, data collection and analysis, decision to publish, or preparation of the manuscript.
Competing Interests: The authors have declared that no competing interests exist.
* E-mail: [email protected]
Introduction
It has long been established that the geographical structure of
the genetic diversity of benthic species is strongly shaped by life
history traits. Among the main life history attributes, mode of
larval development, duration and characteristics of larval life, have
been highlighted as features that influence the maximum distance
of dispersal in many benthic marine species [1–3]. Similarly it has
been recognized that dispersal potential in terms of the pelagic
larval duration (PLD) is an important determinant of the genetic
structure of benthic marine species. Many of these taxa have
planktonic larvae that can spend up to several months and even
over a year in the water column; others spend only hours or few
days in the water column, theoretically preventing long distance
dispersal and eventually reducing population connectivity [4].
In the recent years however, the correlation between pelagic
larval duration (PLD) and the spatial scale of genetic differenti-
ation has been repeatedly questioned by meta-analyses and
comparative studies of benthic and coastal marine species [5–
10]. These studies have consistently shown a low to null
correlation, suggesting that PLD is a poor predictor of connectivity
between marine populations. This conclusion, however, has to be
considered with caution, as it seems to be largely influenced by the
kind of markers, sampling scheme and genetic parameters used to
determine the genetic structure [11]. Alternative determinants of
spatial genetic structure have been proposed, such as vicariant
effects of historic patterns of oceanic circulation (e.g. Plio–
Pleistocene), physical barriers and contemporary restrictions to
dispersal, including modern patterns of oceanographic circulation
and the distribution of suitable habitat ([12] and references
therein). There are also mechanisms that enhance connectivity
such as anthropogenic transport (e.g. [13–14]) or rafting on
floating objects [15–16], allowing connectivity between distant
geographic areas.
PLOS ONE | www.plosone.org 1 February 2014 | Volume 9 | Issue 2 | e88613

Among the different alternatives, biogeographic transitions have
been considered as ideal situations to study the historical and
contemporary processes that affect the distribution and abundance
of species. Indeed, depending on the species ability to disperse and
survive in different environmental conditions, biogeographic
breaks often reflect species range limits [17]. In fact, three main
patterns are observed: a) species that end their geographic range
within this limited geographic area, b) species that cross the
transitional zone, but their population density and structure
changes dramatically, leading to major changes in dominance
within local communities, and c) species that cross the boundary
and do not seem to ‘‘perceive’’ any discontinuity as reflected in
their homogeneous abundance. An increasing number of reports
are evidencing strong phylogeographic structure associated to
biogeographic breaks in these latter species, allowing the inference
of the origin and the persistence of the biogeographic structure
(e.g. [18–20]). For example, the southeast Australian coast bears a
major biogeographic transition between two different oceano-
graphic conditions and coincides with the Pleistocene land-bridge
formation between Australia and Tasmania. This transition is
therefore the result of both a historical and a contemporary barrier
to dispersal, and coincides with deep phylogeographic differenti-
ation and/or restricted gene flow [21–24]. The different studies
conducted so far suggest that both the historical barrier and the
contemporary oceanic circulation have caused genetic lineages to
diverge and remain geographically separated [25]. In this region,
potential dispersal inferred from larval type is less correlated with
the presence of a phylogeographic break than habitat specificity
[12]. However, other studies are consistent with the hypothesis
that dispersal potential is determinant to the presence or location
of phylogeographic breaks [18,26]. Pelc et al. [26] analyzed
datasets of marine fauna of the southwest and southeast coast of
the USA to compare concordance among phylogeographic and
biogeographic breaks. Dispersal potential appeared to be a strong
determinant of the magnitude and position of phylogeographic
discontinuities, associated to biogeographic breaks. These results
strongly emphasize that phylogeographic breaks of species with
low dispersal potential reflect primarily historical processes
whereas those of species with high dispersal potential reflect more
recent or current gene flow restrictions [26–29]. The rational
behind these patterns is that phylogeographic structure can persist
many generations for species with restricted gene flow, whereas
high gene flow species can bear a phylogeographic break only if a
local barrier is currently restricting dispersal, whatever the history
of the barrier [30].
This study further tests these predictions by undertaking a
comparative phylogeographic analysis across a biogeographic
boundary along the coast of Chile. The lineal coast of Chile, north
of 42uS, encompasses approximately 2,600 km with a natural
temperature gradient associated to latitude, but with neither
apparent geographic barriers to dispersal nor any sharp environ-
mental discontinuity. The cold and rich nutrient Humboldt
Current influences the coastal area between 18 and 42uS, with
upwelling as the dominant feature influencing coastal communities
[31]. In spite of this, a marine biogeographic break has been
reported at 30uS based on the distribution ranges of most benthic
species (for review see [31–32]). The origins of this marine
discontinuity as well as the environmental factors that ensure its
persistence are largely unknown. One question that is still open is if
there is a present-day disruption in the ecological characteristics of
the coastal ecosystems, or if the biogeographic break results from
some historic vicariant or disruptive event that no longer persist.
Three phylogeographic studies conducted so far have evidenced a
strong phylogeographic break coinciding with the 30u–33uS
region: the kelp Lessonia nigrescens [33], the red alga Mazzaella
laminarioides [34], and the brooding muricid gastropod Acanthina
monodon [35], suggesting the existence of an old divergence
between lineages north and south of 30uS. Three other species,
the muricid gastropod Concholepas concholepas, and the squat lobster
Pleuroncondes monodon and the cephalopod Dosidicus gigas, did not
show genetic structure at a macrogeographic scale across 30uS[36–38]. Taxa with low dispersal that lack the break correspond to
species that are likely to disperse by alternative means, the algal-
dwelling genus Limnoria by rafting on macroalgae [39] and the
biofouling tunicate Pyura chilensis on boat and ship hulls [40]. Even
though these studies have important differences in the sampling
effort, the dispersal potential of these species seems tightly related
to the magnitude of phylogeographic breaks and their concor-
dance with the biogeographic transition at ca. 30uS. Lessonia
nigrescens and A. monodon have planktonic dispersive stages that last
a few hours to a few days, whereas C. concholepas, J. cirratus, P.
monodon and D. gigas can spend weeks to several months in the
water column. Thus, these studies strongly suggest that the
biogeographic break is the result of a past discontinuity that is
currently not perceivable in the macrogeographic genetic structure
of species with high dispersal potential.
The current study aims at contributing to the knowledge of
phylogeographic patterns of marine benthic organisms along the
Chilean coast under the influence of the Humboldt Current
focusing on eight species with high and low dispersal potential.
More broadly, the role of dispersal potential on the population
genetic diversity and differentiation is addressed. We predict that
species with low dispersal potential will have greater genetic
structure, lower genetic diversity than high dispersers and the
presence of a historic phylogeographic break around 30uS,
coincident with the biogeographic transition zone.
The species chosen for this study are all very abundant in the
intertidal of the Chilean coast in the two biogeographic regions at
the vicinity of 30uS, and none of them has commercial value. For
categorization purposes, the average number of days that larvae
spend in the water column was used as a proxy of PLD (see
Materials and Methods) with reflects an upper bound of dispersal
rather than a mean dispersal time [10]. Species that do not have
free-living larvae or with PLD in the water column of less than two
weeks were considered as low dispersers while those whose larvae
spend 15 or more days in the water column were considered as
high dispersers. Based on this, five of the model species fell in the
long dispersal potential category. These include two species of the
Order Decapoda (Infraorder Anomura), Emerita analoga (Stimpson)
(Hippidae) and Petrolisthes violaceus Stimpson (Porcellanidae); two
starfishes of the class Asteroidea (order Forcipulatida), Heliaster
helianthus (Lamarck) (Heliasteridae) and Stichaster striatus Muller and
Troschel (Asteriidae); and the sea urchin Tetrapygus niger (Molina)
(Echinoidea, Arbaciidae). The remaining three species were
considered as having low dispersal potential: the peracarid
Orchestoidea tuberculata Nicolet (Amphipoda, Talitroidea) that broods
its embryos, and the gastropods Scurria scurra (Lesson) (Patellogas-
tropoda, Lottidae) and Tegula atra (Lesson) (Vestigastropoda,
Trochoidea, Turbinidae, Tegulinae) (see Materials & Methods
section; Table 1).
Results
COI gene sequences were obtained from 2,217 individuals of
eight species (Table 2), covering at least 16 and up to 23 degrees of
latitude along the coast of Chile (Fig. 1). Sequences were deposited
in the GenBank database with the following accession numbers:
Emerita analoga JX130229 - JX130344; Heliaster helianthus JX130054
Dispersal Potential and Genetic Structure
PLOS ONE | www.plosone.org 2 February 2014 | Volume 9 | Issue 2 | e88613
- JX130098; Orchestoidea tuberculata JX129929 - JX129953;
Petrolisthes violaceus KC543356 - KC543409; Scurria scurra
JX130193 - JX130212; Stichaster striatus JX129954 - JX130053;
Tegula atra JX130156 - JX130192; Tetrapygus niger JX130099 -
JX130155.
All truncated alignments lacked indels and their final length
varied from 546 nucleotides in T. niger to 672 in S. scurra. Variable
sites varied between 2.7% in S. scurra to 23.2% in O. tuberculata,
with an average of 10.5% (Table 2). Most substitutions
corresponded to transitions; only O. tuberculata exhibited average
transversions greater than zero, with 37.5% of substitutions
corresponding to transversions. Percentage of variable sites, as
well as haplotype and nucleotide diversities, were in general high
in high PLD species while low dispersers showed lower values
(Table 2). Generalized Linear Mixed Models (GLMMs) consis-
tently revealed that dispersal potential was the variable that best
explained genetic diversity patterns (Fig. 2; Table 3). In the case of
nucleotide diversity, biogeographic region (north or south of 30uS)
was also a significant explanatory variable, as well as its interaction
with dispersal potential (Table 3).
Snn, average pairwise WST, and Mantel’s correlation coefficient
for isolation by distance were significant in all low dispersers and
for the starfish S. striatus; the other species showed non-significant
values (Table 2). The low dispersers O. tuberculata and S. scurra had
the highest Snn values, 0.93 and 0.33, respectively, indicating that
most individuals that were genetically similar occurred in the same
locality. Likewise, the highest WST values were found in S. scurra
and O. tuberculata (Table 2), and overall, low dispersers showed
greater genetic differentiation than high dispersers (Fig. 3).
Mantel’s correlation coefficients were highest for the three low
dispersers, which also showed significant isolation by distance in
each biogeographic region. Isolation by distance was also
significant in S. striatus, however analyses per biogeographic region
indicated a significant Mantel’s correlation coefficient only in the
southern biogeographic region. Similarly S. striatus had significant
WST only in the southern region, while for the three low dispersers
WST values were significant in both biogeographic regions (data
not shown). The genetic structure detected for S. striatus was
weaker than on the three low dispersers.
Overall, GLMMs indicated that pairwise WST values were
significantly associated with the interaction of dispersal potential
and biogeographic differentiation (i.e., genetic differentiation
among or within biogeographic regions; Table 3). When excluding
separately the brooder O. tuberculata and the starfish S. striatus,
GLMMs of genetic diversity and differentiation yielded overall
similar results, giving support to the robustness of the detected
patterns. The exclusion of O. tuberculata was aimed at testing the
effects of non-pelagic dispersal (see [5]) on the results. If its removal
from analyses resulted in a non-significant relationship between
dispersal potential and genetic differentiation, then dispersal
potential would poorly correlate with genetic differentiation of
species with free larval development, i.e. broadcasters. On the
opposite, since S. striatus had more genetic structure than expected
given the dispersal potential that was assigned based on a
congener, we evaluated the effects of this species on the GLMM
results. However, none of the exclusions led to a change in the
association between dispersal potential and measures of genetic
diversity and differentiation (data not shown), suggesting that
differences detected between low and high dispersers were not
biased by the inclusion of O. tuberculata and S. striatus.
AMOVA performed grouping populations by biogeographic
region indicated that low dispersers had the highest percentages of
variation between biogeographic regions, while high dispersers
had the highest percentages of variation within populations
(Table 4). Tegula atra and S. striatus showed a very similar pattern;
although there was greater structure in T. atra both species had a
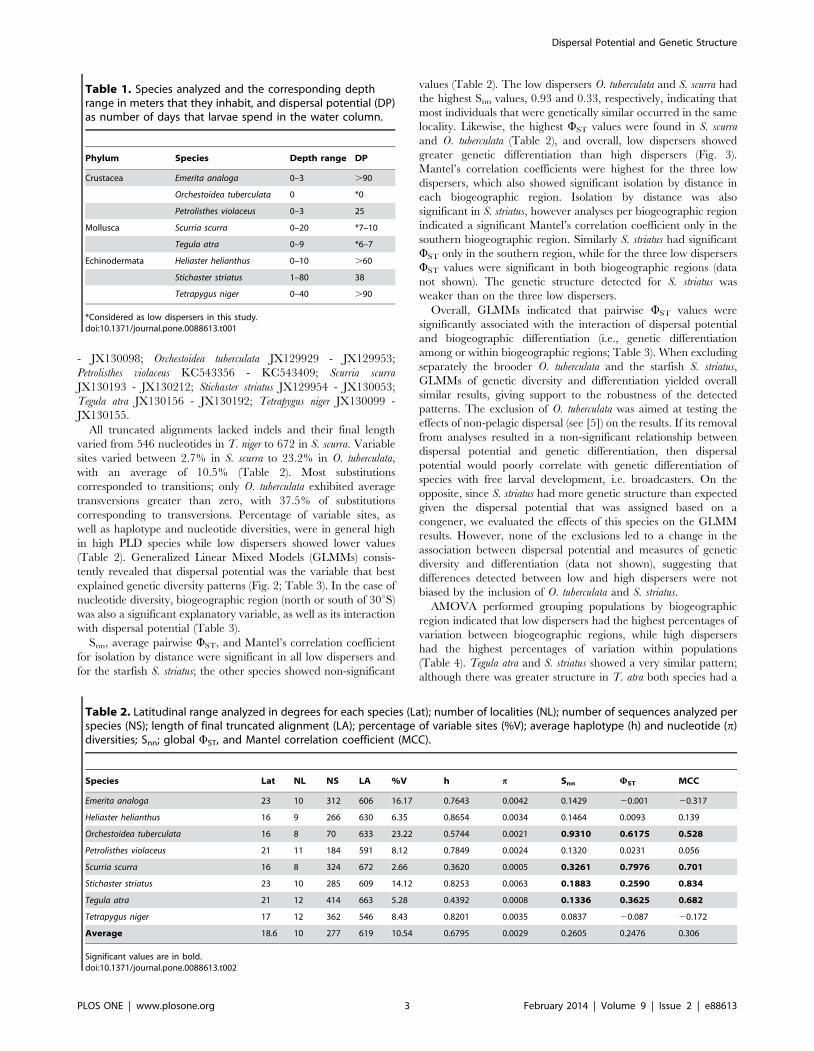
Table 1. Species analyzed and the corresponding depthrange in meters that they inhabit, and dispersal potential (DP)as number of days that larvae spend in the water column.
Phylum Species Depth range DP
Crustacea Emerita analoga 0–3 .90
Orchestoidea tuberculata 0 *0
Petrolisthes violaceus 0–3 25
Mollusca Scurria scurra 0–20 *7–10
Tegula atra 0–9 *6–7
Echinodermata Heliaster helianthus 0–10 .60
Stichaster striatus 1–80 38
Tetrapygus niger 0–40 .90
*Considered as low dispersers in this study.doi:10.1371/journal.pone.0088613.t001
Table 2. Latitudinal range analyzed in degrees for each species (Lat); number of localities (NL); number of sequences analyzed perspecies (NS); length of final truncated alignment (LA); percentage of variable sites (%V); average haplotype (h) and nucleotide (p)diversities; Snn; global WST, and Mantel correlation coefficient (MCC).
Species Lat NL NS LA %V h p Snn WST MCC
Emerita analoga 23 10 312 606 16.17 0.7643 0.0042 0.1429 20.001 20.317
Heliaster helianthus 16 9 266 630 6.35 0.8654 0.0034 0.1464 0.0093 0.139
Orchestoidea tuberculata 16 8 70 633 23.22 0.5744 0.0021 0.9310 0.6175 0.528
Petrolisthes violaceus 21 11 184 591 8.12 0.7849 0.0024 0.1320 0.0231 0.056
Scurria scurra 16 8 324 672 2.66 0.3620 0.0005 0.3261 0.7976 0.701
Stichaster striatus 23 10 285 609 14.12 0.8253 0.0063 0.1883 0.2590 0.834
Tegula atra 21 12 414 663 5.28 0.4392 0.0008 0.1336 0.3625 0.682
Tetrapygus niger 17 12 362 546 8.43 0.8201 0.0035 0.0837 20.087 20.172
Average 18.6 10 277 619 10.54 0.6795 0.0029 0.2605 0.2476 0.306
Significant values are in bold.doi:10.1371/journal.pone.0088613.t002
Dispersal Potential and Genetic Structure
PLOS ONE | www.plosone.org 3 February 2014 | Volume 9 | Issue 2 | e88613

significant and high portion of the total variance within
populations (63.7% and 74.1%, respectively), and a considerable
amount explained by biogeographic region (29.6 and 23.8%,
respectively, although non-significant for S. striatus). Overall,
GLMMs revealed significant differences between high and low
dispersers for each of the AMOVA’s W-statistics (Table 5).
Mitochondrial DNA diversity was high (Fig. 4). Most species
had a most frequent haplotype shared between biogeographic
regions. The exception was the amphipod O. tuberculata that
showed divergent haplogroups separated by up to 18 mutational
steps and lacked shared haplotypes. For the other seven species,
the percentage of shared haplotypes between biogeographic
regions ranged from 13.5% in T. atra to 37.8% in H. helianthus;
the maximum number of mutational steps was 5 in S. striatus and
most haplotypes were separated by one mutational step (Fig. 4). In
general low dispersers have less shared haplotypes and more
private haplotypes in each biogeographic region. Even though the
most frequent shared haplotypes were rarely unique of individuals
Figure 1. Map of the study area along the coast of Chile indicating the sampling sites and the sample size per site for each of theanalyzed species.doi:10.1371/journal.pone.0088613.g001
Dispersal Potential and Genetic Structure
PLOS ONE | www.plosone.org 4 February 2014 | Volume 9 | Issue 2 | e88613

of one biogeographic region, low dispersal species had greater
differences on the haplotype frequencies between regions. For
example, the most common haplotype of T. atra was most often
encountered on individuals north of 30uS, and the second most
common haplotype was largely composed of individuals from the
south of 30uS.
SAMOVA analyses were undertaken on species that displayed
significant genetic structure (Table 2) (Fig. 4), i.e. all low dispersers
and S. striatus, to better characterize the spatial genetic structure.
The optimal k, that defines the most probable number of
geographic subdivisions, ranged between 2 for S. striatus and T.
atra, indicating a low substructure, to 17 for the brooder O.
tuberculata (Table 6), revealing a strong subdivision of the genetic
diversity. For O. tuberculata small sample size could lead to
overestimation of divergence, but haplotype networks also validate
that SAMOVA results reflect degree of divergence between
localities. The limpet S. scurra had k = 4 (Table 6). For both O.
tuberculata and S. scurra, when k is set to 2, individuals were grouped
to the north and south of 30uS (the locality at 31.8uS belonged to
the southern group; Table 6). On the other hand, the two groups
formed for S. striatus and of T. atra were located north and south of
31.8uS. Tegula atra showed a slightly peculiar pattern: the locality at
34.4uS was included in the northern group while the northern
locality at 31.8uS was part of the southern group. In Table 6 this is
expressed as a range of latitudes where the discontinuity occurs.
The coalescent approach of isolation-with-migration imple-
mented in IMa2 revealed overall low levels of gene flow across the
30uS transition zone in all taxa that displayed significant genetic
differentiation between biogeographic regions (north and south of
30uS) (Fig. 5A). In general, the model predicted a most likely
pattern of asymmetric migration with greater migration from
south to north (Table 7). Similarly, effective population sizes,
inferred from H-estimates, were generally smaller in the south
than in the north of 30uS, except for S. striatus (Table 7; Fig. 5B).
Estimated divergence times varied among taxa. The analyses
recovered a most likely divergence time for each of the four taxa
analyzed, yet 95% HPD confidence intervals were broad, except
for T. atra. This is also the species for which estimated divergence
time was the most recent (Fig. 5C), confirming that the 30uSphylogeographic break is a historic signature. A common pattern
was observed in two of the four species, which had the lowest
genetic differentiation of the species analyzed with IMa2, S. striatus
and T. atra. For both species the model predicted asymmetric
migration from south to north (and for T. atra low but significant
Figure 2. Box-plots of global (a and b) and per population (c and d) haplotype (a and c) and nucleotide (b and d) diversities for highand low dispersers.doi:10.1371/journal.pone.0088613.g002
Dispersal Potential and Genetic Structure
PLOS ONE | www.plosone.org 5 February 2014 | Volume 9 | Issue 2 | e88613

migration from north to south) and divergence times were .0,
indicating that not all shared haplotypes are a consequence of gene
flow but there is also ancestral polymorphism (Fig. 5D; Table 7).
As opposed to the other species, the 95% highest posterior density
(HPD) of H from the north and south do not overlap in S. striatus
and T. atra (Table 7). Altogether the results for these two species do
not allow pinpointing a unique cause for the genetic differentiation
and the shared alleles among biogeographic regions. The two most
differentiated species, O. tuberculata and S. scurra, showed different
results. For O. tuberculata migration rates were not significantly
differentiated from zero and the degree of differentiation seems
best explained by the old splitting (Fig. 5D). Scurria scurra does not
have significant migration and estimated divergence time is an
order of magnitude more recent than for O. tuberculata (Table 7).
Given that there was no significant inferred migration, the shared
haplotypes between biogeographic regions for S. scurra are likely
due to shared ancestral polymorphism. Scurra scurra had the lowest
inferred Ne, with H-values of 2.08 and 0.81 for the north and
south respectively.
Discussion
Reinforcing the Marine Connectivity ParadigmOur results suggest that the phylogeographic patterns of marine
benthic organisms of the Chilean intertidal have been strongly
influenced by their dispersal potential. Compared to other regions
of the world, such as the northeast Pacific [8], southeast Australian
coast [12], southeast Africa [41], Hawaii [42], for the southeast
Pacific coast under the influence of the Humboldt Current,
dispersal potential was significantly associated to genetic diversity,
genetic differentiation, and the concordance between phylogeo-
graphic and biogeographic breaks, adjusting to the predictions of
the marine connectivity paradigm. Four of the five species
categorized with high dispersal potential had low genetic
differentiation, high genetic diversity at a macrogeographic scale
and lacked phylogeographic discontinuities. In contrast, brooders
and species with short-lived planktonic larvae had a strong
phylogeographic discontinuity at 30uS coincident with the
biogeographic break for marine benthic species [31–32].
Several studies have explored the determinants of the
geographic structure of the genetic diversity of marine species.
Among them, Weersing & Toonen [6] tested the general
connectivity paradigm, but contrary to the results obtained herein,
when including and excluding the brooder from their analyses,
they found no support for the general predictions of the marine
connectivity paradigm. They found that when excluding brooders,
dispersal potential was not correlated with genetic differentiation
and concluded that among taxa with free-living larvae, dispersal
potential does not predict genetic structure. When we eliminated
the one brooder for analyses, differences between contrasting
dispersal potentials continued to be significant, albeit lower
statistical power when eliminating one of the few low dispersers.
In the study of Weersing & Toonen [6], variance between genetic
markers explained most of the genetic variability detected, rather
Table 3. GLMMs performed to compare genetic structure in species with high and low dispersal potential and biogeographicregions (north and south of 30uS), with respect to haplotype diversity, nucleotide diversity, number of substitutions, and geneticdifferentiation (global WST).
GLMM Estimate Standard error t-value P
Haplotype Diversity: AIC = 235.33; df = 7
Intercept 0.804 0.029 29.259 0.001
DP 20.395 0.054 27.590 0.001
BR 0.016 0.046 0.361 0.712
DP x BR 20.016 0.075 20.227 0.816
Nucleotide Diversity: AIC = 2750.4; df = 7
Intercept 0.004 0.001 5.370 0.001
DP 20.002 0.001 23.144 0.008
BR 0.001 0.000 2.714 0.007
DP x BR 20.001 0.001 22.339 0.019
Number of Substitutions: AIC = 2505.3; df = 7
Intercept 15.219 3.034 5.306 0.001
DP 210.469 3.416 23.221 0.008
BR 1.935 1.581 1.284 0.190
DP x BR 23.155 2.588 21.261 0.199
Genetic differentiation (pairwise WST): AIC = 2518.5; df = 7
Intercept 0.057 0.027 2.216 0.043
DP 0.661 0.235 2.827 0.028
BD 20.036 0.014 22.925 0.004
DP x BD 20.319 0.024 214.163 0.001
Species were nested to dispersal in the models. For each model the AIC value is shown and the variance estimate of fixed effects (Estimate), standard error, degrees offreedom (df), t-value ratio and P values of the intercept and of the contributions of dispersal potential (DP), biogeographic region (BR) (for genetic diversities andnumber of substitutions) or biogeographic differentiation (BD) (for genetic differentiation), and the interaction of DP x BR and DP x BD for diversities and differentiation,respectively.Significant values are in bold (P,0.05).doi:10.1371/journal.pone.0088613.t003
Dispersal Potential and Genetic Structure
PLOS ONE | www.plosone.org 6 February 2014 | Volume 9 | Issue 2 | e88613

than dispersal potential. This is an expected result when markers
analyzed between species differ both in quantity and quality of
information. In our study, the same portion of the mitochondrial
COI gene was used for analyzing all species, reducing the effect of
marker choice from the interpretation of results. Similarly, Kelly &
Palumbi [8] found that when considering only species with pelagic
larvae for analyses, dispersal potential was not a predictor of
population genetic differentiation in the northeast Pacific, and
that, in some cases, there was a correlation between habitat (high
to low intertidal) and genetic differentiation. Likewise, Ayre et al.
[12] determined that habitat explained the presence of a
biogeographic break for the southwest Australian coast better
than dispersal potential. To avoid this bias, we analyzed species
inhabiting a similar bathymetric stretch and substrata. The
exceptions are E. analoga and O. tuberculata that inhabit sandy
beaches. All the rest are all found in the mid-intertidal rocky shore.
The species with the most divergent habitat is O. tuberculata that
inhabits the supralittoral (Table 1), however, eliminating it from
the analyses did not change the contrasting phylogeographic
patterns between high and low dispersers. Moreover, the studied
region is relatively homogeneous in terms of environmental
conditions, with the major influence of the Humboldt Current
system that maintains upwelling conditions between 42uS and 6uS[31], therefore reducing the potential environmental bias likely
occurring in studies covering long stretches of coast (more than
2,600 km). Recently Dawson [43] showed a strong correlation
between dispersal potential and genetic differentiation at a
regional scale when analyzing co-distributed species. Therefore,
when sources of errors are avoided (i.e., same marker and
sampling scheme of co-distributed species to enable comparative
analyzes), PLD seems to reflect scales of dispersal on the basis of its
good fit with genetic differentiation (FST) [10]. The phylogeo-
graphic patterns detected herein are robust in spite of having used
a single mitochondrial marker. There was a consistent association
between dispersal potential and genetic structure, suggesting that
dispersal potential is a strong determinant of genetic diversity,
genetic differentiation, and presence of a genetic discontinuity
coincident with a biogeographic transition zone of coastal benthic
species along the HCS. Additionally for genetic differentiation the
significant interaction of dispersal with the differentiation between
biogeographic regions suggests that dispersal alone cannot explain
the detected pattern of genetic differentiation, and that the break
at 30uS has an important effect.
One species, S. striatus, was assumed to have high dispersal
potential based on the estimated PLD of its congener S. australis
[44]. This species did not show a consistent pattern with the other
Figure 3. Box-plots of global (a) and average population-pairwise (b) WST for high and low dispersers.doi:10.1371/journal.pone.0088613.g003
Table 4. AMOVA for all species.
Species Among Groups (N and S of 306S) Among populations within groups Within populations
Emerita analoga 20.29 0.09 100.2
Heliaster helianthus 20.62 1.54 99.07
Orchestoidea tuberculata 36.09 48.28 15.64
Petrolisthes violaceus 0.42 1.89 97.69
Scurria scurra 69.15 10.60 20.24
Stichaster striatus 23.78 2.11 74.1
Tegula atra 29.58 6.67 63.75
Tetrapygus niger 20.03 20.84 100.87
Percentage of variation explained among groups north and south of 30uS, among populations within groups, and within populations are shown.Values in bold indicate association to significant AMOVA’s W-statistics.doi:10.1371/journal.pone.0088613.t004
Dispersal Potential and Genetic Structure
PLOS ONE | www.plosone.org 7 February 2014 | Volume 9 | Issue 2 | e88613

four high dispersers analyzed, yet it is not as structured as the three
species considered as low dispersers. Analyzes excluding S. striatus
did not change the implications of results, i.e. dispersal potential
was still a strong predictor of genetic diversity, genetic differen-
tiation, and of the presence of a phylogeographic break at 30uS. Of
the four species with structure across 30uS, S. striatus had the least
structure. For example, WCT (among groups) was non-significant
for S. striatus while it was for all low dispersers. When analyzing
genetic differentiation and isolation by distance of S. striatus at each
side of the break, only the northern biogeographic region had
significant differentiation and isolation by distance. The southern
region showed non-significant differentiation and lack of an
isolation by distance pattern. Contrastingly, all low dispersers had
significant genetic differentiation and isolation by distance in both
biogeographic regions. There was a tremendous difference
between the genetic diversity (2 Ne) of the northern and southern
biogeographic regions for S. striatus. Presumably the genus Stichaster
has cold-water affinities [45] and has colonized the Chilean coast
from south to north in the presence of a biogeographic barrier that
has nonetheless allowed significant migration. Until its larval
duration is properly studied, there are at least two plausible
explanations to the detected patterns in S. striatus: (1) S. striatus is a
true high disperser and its spatial genetic structure is the result of
the effects of strong local genetic drift, or (2) it is a medium to low
disperser, in which case observed results would be consistent with
the marine connectivity paradigm. The effective size inferred from
isolation-with-migration model is comparable to the two most
structured species (O. tuberculata and S. scurra) and much smaller
than the other low dispersal species, T. atra, suggesting that genetic
drift may indeed have been strong in S. striatus. On the other hand,
PLD is highly variable within the order Forcipulatidae, with a
minimum of zero days (e.g. [46–48]), an intermediate value of 80
days [49] and a maximum of 150 days [50]. Larval development
of forcipulatids may be abbreviated in response to feeding, habitat
[51–52], and temperature [49,53–54]. Settlement can be selective,
in which case metamorphosis is avoided until the adequate
substrate or settling signal is encountered [44,53,55–56]. On the
other hand, the highly productive Humboldt Current System that
includes several upwelling regions [57] could favor the fast
settlement and metamorphosis of larvae by providing the adequate
environmental cues [58–59]. Given the high variability of PLD
within Forcipulatidae, and the results obtained herein, it is likely
that S. striatus has a shorter PLD than assigned based on the
congener’s planktonic larval duration. For S. scurra and T. atra,
PLD was also assumed based on related species, however, PLD’s
are conserved for these gastropod groups. For confamilials of the
genus Scurra the minimum PLD is 3 days [60] and the maximum 7
days [61], while among the genus Tegula, the minimum PLD is 4
days and the maximum 7 days [62–63].
There is an interesting contrast between our results and those of
Kelly & Palumbi [8] for the genus Tegula, probably due to the
contrasting sampling scale. We found significant genetic structure
in T. atra along 21 degrees of latitude while the congener T.
funebralis from California did not show structure in 8 degrees
analyzed [8]. We performed exploratory analyses of the COI data
of T. atra, considering distances of ca. 8 latitudinal degrees, to
better match the spatial scale considered for T. funebralis. If sub-
samples were drawn from the area north of 30uS, without crossing
the 30uS biogeographic break, genetic differentiation was zero and
non-significant, mimicking the lack of structure detected for T.
funebralis in California. As was emphasized by Pelc et al. [26] in a
meta-analysis, it is very important to consider the spatial scale at
which processes such as phylogeographic discontinuities and
genetic differentiation may occur with respect to dispersal
potential.
Indirect Consequences of Reduced Dispersal on GeneticDiversity and Divergence
Species with low dispersal potential had consistently and
significantly lower genetic diversity (i.e., the lowest values for
haplotype and nucleotide diversity). The main way in which
populations and species loose genetic diversity at neutral markers
is by genetic drift. However, the actual influence of genetic drift
depends on its interaction with other evolutionary forces, such as
gene flow: reduced dispersal may allow local populations to
demographically fluctuate and increase extinction-recolonization
rates [64]. Therefore, at a same population density, high gene flow
species will retain more alleles than low gene flow species.
Consequently, dispersal potential is a major determinant of genetic
diversity when comparing species with similar population densi-
ties. In addition, population dynamics may also have a strong
influence on the effective population size, and therefore on the
accumulation of new alleles. For instance, demographic dynamics
differ between brooders and broadcasters leading to disparate
Table 5. GLMMs performed to compare species with high and low dispersal potential (DP) in AMOVA’s F statistics among groups(WCT), among populations within groups (WSC), and within populations (WST).
GLMM Estimate Standard error t-value P
Among Groups (WCT): AIC = 7.388; df = 3
Intercept 0.050 0.171 0.295 0.497
DP 0.435 0.251 1.739 0.017
Among populations within groups (WSC): AIC = 8.009; df = 3
Intercept 0.012 0.180 0.064 0.874
DP 0.386 0.264 1.463 0.025
Within Populations (WST): AIC = 7.259; df = 3
Intercept 0.045 0.169 0.264 0.540
DP 0.588 0.248 2.372 0.008
Species were nested to dispersal in the model. For each model the AIC value, and the variance estimate of fixed effects (Estimate), standard error, degrees of freedom(df), t-value ratio and P values of the intercept are shown.Significant values are in bold (P,0.05).doi:10.1371/journal.pone.0088613.t005
Dispersal Potential and Genetic Structure
PLOS ONE | www.plosone.org 8 February 2014 | Volume 9 | Issue 2 | e88613

Figure 4. Median joining haplotype networks of eight species analyzed of the Chilean coast. Insert with map details the biogeographicregions north and south of 30uS in the analyzed coast section and shades associated with each of them that were used to mark the geographiclocation of haplotypes. All haplotype networks are standardized in such way that small circles represent haplotypes present in one individual.Mutational steps (lines between circles) were kept the same length excepting for the network of Emerita analoga where mutational steps arising fromthe most common haplotype were kept to the minimum length to allow accommodating all derived haplotypes.doi:10.1371/journal.pone.0088613.g004
Dispersal Potential and Genetic Structure
PLOS ONE | www.plosone.org 9 February 2014 | Volume 9 | Issue 2 | e88613

changes in nucleotide substitution rates [65–67]. The accelerated
molecular evolution of low dispersers, as a consequence of greater
population turnover at various temporal scales can thus also partly
explain the contrasting evolutionary patterns between high and
low dispersers.
Finally, because low dispersers have subdivided populations
they are prone to metapopulation dynamics, i.e. extinction and
recolonization [64]. Extinction rates, as well as speciation rates are
high in the geologic record of low dispersers [68–72]. These
processes are likely reinforcing the role of drift and contribute to
explaining why low dispersers are more susceptible to accumulate
genetic divergence between local lineages, and overall retain less
genetic diversity through time than high dispersers.
The 30uS Biogeographic Break in the Coast of Chile is aHistoric Discontinuity
Bayesian analyses based on the isolation-with-migration model
take full advantage of the data by using a coalescent approach to
jointly estimate migration, time of divergence and effective
population size. Ideally, when using coalescent approaches such
as those implemented in IMa2, several polymorphic and unlinked
loci should be used for a robust estimation of parameters and to
deal with phylogenetic uncertainty [73–77]. Herein, albeit using a
single locus, isolation-with-migration analyses shed important light
into the historic nature of the phylogeographic break. Of the four
species with a phylogeographic break at ca. 30uS, three species (S.
scurra, T. atra and S. striatus) showed similar and relatively recent
divergence times, suggesting that the genetic discontinuity
originated either during the last glacial period (based on t 2%)
or just after (when based in t 10%). However, O. tuberculata had a
divergence time between biogeographic regions of an order of
magnitude higher and overlaps those estimated for other reported
genetic discontinuities in the same region, such as the kelp Lessonia
nigrescens with estimated divergence at 3095 ky 61200 ky [78].
These results strongly suggest that the 30uS biogeographic break
has an ancient origin. The biogeographic break likely disrupted
connectivity between biogeographic regions in the past, rather
than in present days, with low dispersers retaining genetic
signatures that are geographically concordant with the biogeo-
graphic break, while those signatures have been erased in high
dispersers by gene flow across the 30u region.
Migration estimations suggested low yet significant northward
migration across the 30uS break in two of the four species that had
genetic structure among biogeographic regions, S. striatus and T.
atra. Both species showed a greater contribution from the southern
to the northern region. Likely these two species have been able to
achieve a low yet significant connectivity between biogeographic
regions (probably enhanced by the Humboldt Current), slightly
eroding the historic signature, which is anyhow strong in both
species. Concordantly, shared haplotypes of S. striatus and T. atra
between biogeographic regions are best explained by a combina-
tion of migration, shared ancestral polymorphism and drift. For
the northeast Pacific coast, Wares et al. [28] described a similar
scenario of migration in the direction of the main currents and
across the Point Conception biogeographic break, for four benthic
species with planktonic development. Similarly, along the northern
Chilean coast (25u–28uS), asymmetric dispersal linked to the
direction of the Humboldt Current has been detected for one non-
neutral microsatellite locus of the mussel Perumytilus purpuratus [79],
and with RAPD data for the intertidal algae Mazzaella laminarioides
[80].
Consistently dispersal potential was the variable that always best
explained the contrasting genetic structure of low and high
dispersers. Genetic structuring measures that are more associated
with genetic divergence (i.e., nucleotide diversity and genetic
differentiation), not only were determined by dispersal potential
but also significantly by its interaction with biogeographic region.
Based on isolation-with-migration analyses, the biogeographic
regions have been completely or partially isolated in recent times.
Isolation has led to differentiation, which in some cases is likely to
have been enhanced by low effective population size. Genetic
diversity was estimated to be unequal between biogeographic
regions and species, such that some species (such as O. tuberculata
and S. scurra) and biogeographic regions (the north for S. striatus
and the south for T. atra) may have stronger effects of genetic drift.
Concomitantly, biogeographic regions carry within their structure
the signatures of historic effective population size, low migration
and historic isolation, which probably leads to the significant
interaction of dispersal potential and biogeographic region in
models associated to nucleotide diversity and genetic differentia-
tion between low and high dispersers.
The current study contributes significantly to the knowledge of
COI phylogeography of benthic marine species along the 30uSbiogeographic transition zone on the coast of Chile. Previous
studies had shown that there was a strong association between the
spatial structure of the genetic diversity around 30uS and dispersal
potential. Tellier et al. [33] and Montecinos et al. [34], found sharp
genetic discontinuities at 30uS the algae Lessonia spp. and Mazzaella
laminarioides, respectively, evidencing cryptic species at each side of
the break. In the former, there is also evidence of reproductive
isolation in natural populations [81]. Likewise, studies on animal
species also show the consistency of the pattern. The low
dispersing gastropods Acanthina monodon and Crepipatella dilatata
have a phylogeographic discontinuity at 30uS [35,82]. Moreover,
there is evidence of gene flow restrictions in the barnacle
Notochthamalus scabrosus around 30uS, in particular of the two
haplogroups present, one has very low abundance north of 30uS[83]. These examples added to the three low dispersers reported
herein that have a coincident phylogeographic discontinuity, and
the lack of such phylogeographic break in most high dispersal
species [36–38,83], give strong support to consistency of the
pattern and the validity of the marine connectivity paradigm for
the biogeographic break at 30uS on the coast of Chile.
Concluding RemarksWhen designing comparative phylogeographic analyses it
should not be assumed, as much of the literature has suggested
recently, that compared to other factors, dispersal potential is a
Table 6. SAMOVA of species with spatial genetic structure.
Species Best k FCT P k (2) FCT k (2) P Lat k(2)
Orchestoideatuberculata
17 0.92960 0.00000 0.56871 0.00000 30uS
Scurriascurra
4 0.72027 0.03812 0.69155 0.13392 30uS
Stichasterstriatus
2 0.24874 0.00489 – – 31.8uS
Tegula atra 2 0.35528 0.00196 – – 31.8–34.4uS
Best k corresponds to the detected optimal number of populations, the FCT
value of optimal k and associated probability (P) are shown. For the two taxathat have optimal k .2, the corresponding FCT is also shown (k (2) FCT), as wellas the associated p-value (k (2) P), and the latitude that limits the two groups(Lat k (2)).Significant values are in bold.doi:10.1371/journal.pone.0088613.t006
Dispersal Potential and Genetic Structure
PLOS ONE | www.plosone.org 10 February 2014 | Volume 9 | Issue 2 | e88613

weak explanatory variable for spatial genetic structure at
macrogeographic scales. Herein we showed that along the coast
of Chile under the influence of the Humboldt Current, there is
concordance between phylogeographic and biogeographic discon-
tinuities on low dispersing taxa and that these taxa have
significantly lower genetic diversity and greater genetic differen-
tiation than species with long planktonic larval duration. Thus,
dispersal potential is a robust predictor of the genetic structure of
benthic species for the coastline analyzed. This result calls for
caution with generalizations as to which are the main factors
structuring genetic diversity, and to not extrapolate from studies
performed in other regions. This comparative study of species
along ca. 2,600 km and other studies of benthic species along the
central-northern coast of Chile, support the conclusion that on the
coast of Chile, the general marine connectivity paradigm, based on
dispersal potential, is met and that phylogeographic patterns could
be used as a proxy of dispersal capacity and vice versa.
Figure 5. Isolation-with-migration analysis of four species with significant structure across the 30uS biogeographic break. (a)Marginal posterior probability distribution of migration rate estimates in each direction for each species. (b) Estimated H (2 Ne) values for eachbiogeographic region (north and south) as well as the ancestral H against genetic differentiation (global WST). Asterisks denote estimated H 95% HPDthat do not overlap with either ancestral H or the estimated H in the other biogeographic region. (c) Marginal posterior probability distributions ofdivergence time (t) estimates expressed in thousands of years (Kyr). Divergence time estimates were scaled using 2% and 10% per million yearsubstitution rates. (d) Highest probability value of estimated migration rates (m) in each direction, and divergence times (t) expressed in thousands ofyears (Kyr) scaled using 2% per million year substitution rate, versus genetic differentiation (global WST). Asterisks indicate significant values based onthe likelihood ratio test.doi:10.1371/journal.pone.0088613.g005
Dispersal Potential and Genetic Structure
PLOS ONE | www.plosone.org 11 February 2014 | Volume 9 | Issue 2 | e88613

Materials and Methods
Estimation of the Dispersal Potential of Model SpeciesAmphipods, as all peracarids, brood their embryos up to a
crawl-away stage. Thus, O. tuberculata has zero days of PLD. Both
gastropods analyzed, S. scurra and T. atra, theoretically have
relatively short-lived larvae. Since there are no direct estimations
of larval duration of these species, the larval durations considered
herein are based on reported larval durations of taxa phylogenet-
ically close to them. For S. scurra the estimated PLD considered (7
to 10 days) is based on reports that show that PLD is short and
very conserved in the Patellogastropoda [84,60–61]. Similarly,
species of the genus Tegula have conserved PLD’s of 6 to 7 days
[63,85], which was herein considered as the dispersal potential for
T. atra.
Of the analyzed species, the ones with longest planktonic larval
duration of over 90 days are E. analoga [86] and T. niger [87].
Unpublished data (S. Navarrete, personal communication) indi-
cates that under laboratory conditions, larvae of H. helianthus can
persist for at least 2 months without reaching metamorphosis. The
New Zealand starfish Stichaster australis, the only congener of S.
striatus from the southeast Pacific coast, has larvae that spend 38
days in the water column [52,55]. This larval duration was used as
for S. striatus; albeit it is possible this extrapolation is wrong given
that PLD is highly variable in asteroids (e.g. [48–50]). Larval
development of Petrolisthes violaceus lasts 25 days under laboratory
conditions at 19uC [88], akin to what has been observed for other
members of the genus at similar temperatures [89].
Data CollectionIndividuals of each species were collected from the intertidal
zone from Arica (18uS) to Chiloe (42uS) along the coast of Chile.
The intertidal areas are not privately owned in Chile, however,
there are areas of restricted access (management or protected
areas) where we did not sample. All sampling was performed in
free access areas for which no permit was required. Also no
permits were required for the sampling as species studied did not
involve commercially important species or species endangered or
protected.
Organisms were processed a few hours after being extracted
from nature, obtaining from them a piece of tissue. In most cases
tissues corresponded to skeletal muscle. From starfishes (H.
helianthus and S. striatus) and the urchin (T. niger), ambulacral feet
and gonad tissue were sampled, respectively. Tissues were placed
in absolute ethanol and stored at 220uC. Total DNA was
extracted using standard phenol/chloroform protocol [90].
A partial sequence of COI was obtained using the universal
HCO and LCO primers [91] for O. tuberculata, S. scurra, and T. atra.
For other taxa specific primers were used to amplify COI gene: for
starfishes primers COIceR and COIceF [92]; for E. analoga
primers ECL1-ECH1 [93]; for Petrolisthes violaceus primers COif
[94] and COIa1 [95]; and for the urchin the de novo designed
primers ArbaF (59 TTTCTACAAACCATAAGGATATTGG93)
and ArbaR (59TATACTTCAGGGTGTCCAAAGAATCA93).
These latter primers were designed for this study in GENEIOUS
5.5.4 [96] using COI sequences from other echinoids obtained
from GenBank as references. PCR’s were performed in a total
volume of 10 ml, which included 1 ml of total genomic DNA,
1.5 mM MgCl2, 0.4 mM of each primer, 0.22 mM of each dNTP,
1.5 mg ml21 of bovine serum albumin, and 1.5 U of Taq
polymerase. Cycling conditions consisted of an initial denaturation
at 94uC for 10 min followed by 35 cycles of 1 min denaturing,
1 min annealing at 50uC, and a 2 min extension at 72uC.
Data AnalysesFor each species, sequences were aligned and then truncated on
both extremes using GENEIOUS. DnaSP 5.0 [97] was used for
the estimation of per population and global haplotype and
nucleotide diversities, as well as the Snn statistic [98] and its
significance that was evaluated with 1000 permutations. Snn or the
nearest neighbor statistic [98] is a genetic distance measure based
on how frequently the nearest haplotypes are in the same sampling
locality. It is particularly suitable when data shows high diversity
and small or unequal sample size between sites or regions; it
outperforms other measures when sample size is small.
Pairwise and global population genetic differentiation values
based on sequence data (WST) were calculated in ARLEQUIN 3.5
[99]. ARLEQUIN was also used for testing for Isolation by
Distance using a Mantel test with 1000 permutations, to determine
the correlation between the Slatkin’s linearized population
pairwise genetic differentiation [100] and the lineal geographic
distance (Km) between populations. Pairwise linear distance
matrixes were calculated using the package FOSSIL in R 2.14.0
[101]. Tests for Isolation by Distance were also performed
separately north and south of 30uS for species that displayed
significant Snn and WST.
Table 7. Estimates of migration rates (m) in each direction across 30uS, time of divergence (t) between biogeographic regions, andgenetic diversities (H) (north =HN; south =HS; ancestral =HA), based on the isolation-with-migration model implemented in IMa2.
Species m NRS m SRN t 2% (Kyr) t 10% (Kyr) HN HS HA
Orchestoidea tuberculata HP 0.00 0.00 548.90 109.80 14.66 4.96 29.21
95% HPD 0.00–0.17 0.00–0.33 335.70–1,665 67.10–333 6.64–29.84 0.00–196.50 15.50–56.60
Scurria scurra HP 0.419 0.01 50.70 10.20 2.08 0.81 5.79
95% HPD 0–6.32 0.00–5.76 14.90–699.40 3.00–139.90 0.55–7.60 0.18–44.07 2.15–15.62
Stichaster striatus HP 0.08 0.73* 83.30 16.70 21 1,703 47.00
95% HPD 0.00–0.76 0.19–1.77* 53.40–233.20 10.70–46.60 3–53 771–1,999 23.00–85.00
Tegula atra HP 0.25** 0.73*** 15.50 3.10 169.50 52.40 151.50
HPD 95% 0.05–0.71** 0.33–1.34*** 7.50–33.20 1.50–6.60 106.50–310.50 42–68.40 94.50–280.50
For each parameter per species, the high point (HP) and 95% highest posterior density (95% HPD) of the marginal posterior probabilities are shown. Significant m valuesof the LRT are denoted with asterisks; *P,0.05, **P,0.01, ***P,0.001. t was scaled using substitution rates of 2% and 10% per million years, t 2% and t 10% respectivelyas is expressed in thousands of years (Kyr).Significant values are in bold.doi:10.1371/journal.pone.0088613.t007
Dispersal Potential and Genetic Structure
PLOS ONE | www.plosone.org 12 February 2014 | Volume 9 | Issue 2 | e88613

To test the influence of dispersal capacity and the 30uStransition zone on the genetic diversity and differentiation
Generalized Lineal Mixed Models (GLMMs) were performed
using the package lme4 in R. These models are appropriate for
data influenced both fixed and random effects. In the models
population-specific data of genetic diversity were grouped into
biogeographic regions (north and south of 30uS). For models of
genetic differentiation data was grouped according to biogeo-
graphic differentiation (WST among and within regions). All models
were constructed nesting the species as a random factor. The
syntax of the diversity models was: Genetic Diversity = Dispersal X
Biogeographic Region+Species (Dispersal). For the differentiation
model the syntax was: Genetic Differentiation = Dispersal X
Biogeographic Differentiation+Species (Dispersal).
Haplotype networks for each species were constructed using
NETWORK 4.6 (Fluxus Technology 2010). To evaluate the
presence of a genetic discontinuity coincident with the biogeo-
graphic break at 30uS, ARLEQUIN software was used to perform
AMOVA by grouping individuals a priori north and south of 30uS.
The difference between the percentages of the genetic variation
explained by groups, populations within groups or within
populations, between high and low dispersers were evaluated with
GLMMs.
Two further analyses were conducted for species that displayed
genetic structure with AMOVA, i.e., those that had less than 95%
of the variation within populations. The clustering method
implemented by SAMOVA 1.0 [102] was executed to define the
most likely number of groups of populations, based on the
proportion of the total molecular variance explained by differences
between groups (FCT). The number of groups was denoted as k. In
each species, statistical variance was evaluated with 1000 random
permutations running repeatedly SAMOVA from 2 to 1-n
populations, where n was the total number of sampled localities.
The k value that maximized FCT was interpreted as the most likely
geographic subdivision. A genetic break coincident with the
biogeographic transition was inferred if when k = 2 the clustering
FCT was significant and the groups of individuals were located
north and south of 30uS.
The second analytical approach applied only on species with
structure across 30uS, consisted in the evaluation of asymmetric
migration and time of divergence across 30uS using the isolation-
with-migration demographic model [103] in a Bayesian context
implemented in the software IMa2 [73]. This model does not
assume equilibrium conditions for the populations and allows to
estimates demographic parameters in recently separated popula-
tions that share haplotypes as consequence of gen flow or
incomplete lineage sorting [74]. The estimated demographic
parameters are t (splitting time), effective population sizes
(H= 2 Ne), and migration rates in each direction across the
biogeographic break. For each analyzed species, we generated a
random balanced subsample of individuals per biogeographic
region with a double goal of having equal number of individuals
per biogeographic region and reducing the number of sequences
analyzed, which is recommended when using the model of
isolation-with-migration with information from a single locus [73].
To estimate the best set of priors that ensure mixing and
convergence of parameters we carried out several preliminary runs
in the M mode (MCMC mode) of IMa2. All runs were carried out
using the HKY model of substitution. Chain length ranged from
50,000,000 to 150,000,000 generations until convergence was
achieved. Chains were sampled every 100 generations with the
first 10 to 30% discarded as burn-in. When convergence could not
be reached, long runs with Metropolis Couples MCMC (MC3)
algorithm [104] were carried out setting 20 chains with geometric
heating (a = 0.96, b = 0.9). After achieving convergence in the M-
mode, we used the same simulated genealogies in the L-Mode
(Load Tree mode) of full isolation-with-migration model, to
calculate the log maximum-likelihood and credibility intervals
based on the 95% highest posterior density (95% HPD) for each
parameter. The significance of migration patterns was estimated
using a likelihood ratio test (LTR) [105]. Splitting time parameter
was re-scaled into years (t/m) using two substitution rates, 2 and
10% per My. Even though 2% per My is a high substitution rate
for invertebrates, according to the time dependency of molecular
evolution [106], rates of substitution at the population level are
several times higher than the ones inferred from interspecies
analyses [106–107], thus we used two rates and obtained a
temporal range for the divergence across 30uS.
Acknowledgments
Marcelo Rivadeneira, Bernardo Broitman and John Wares gave us
inspiring conversations and suggestions. We greatly thank Raul Vera for
general assistance in the project. Paula Ayerdi (RIP), Florence Tellier, and
Jhon Gajardo, kindly helped with sampling.
Author Contributions
Conceived and designed the experiments: PH EP SF. Performed the
experiments: NIS NCM FEG A Martınez A Meynard MCP-G. Analyzed
the data: NIS NCM FEG A Martınez A Meynard MCP-G. Contributed
reagents/materials/analysis tools: PH EP SF. Wrote the paper: PH SF
NIS.
References
1. Siegel DA, Kinlan BP, Gaylord B, Gaines SD (2003) Langrangian descriptions
of marine larval dispersion. Mar Ecol Prog Ser 260: 83–96.
2. Kinlan BP, Gaines SD (2003) Propagule dispersal in marine and terrestrial
environments: a community perspective. Ecology 84: 2007–2020.
3. Shanks AL (2009) Pelagic larval duration and dispersal distance revisited. Biol
Bull 216: 373–385.
4. Shanks AL, Grantham BA, Carr MH (2003) Propagule dispersal distance and
the size and spacing of marine reserves. Acol Appl 13: S159–S169.
5. Bradbury IR, Laurel B, Snelgrove PVR, Bentzen P, Campana SE (2008)
Global patterns in 431 marine dispersal estimates: the influence of geography,
taxonomic category and life history. P Roy Soc B 275: 1803–1809.
6. Weersing K, Toonen RJ (2009) Population genetics, larval dispersal, and
connectivity in marine systems. Mar Ecol Prog Ser 393: 1–12.
7. Ross PM, Hogg ID, Pilditch CA, Lundquist CJ (2009) Phylogeography of New
Zealand’s coastal benthos. N Z J Mar Freshwarer Res 43: 1009–1027.
8. Kelly RP, Palumbi SR (2010) Genetic structure among 50 species of the
Northeastern Pacific rocky intertidal community. PLoS ONE 5: e8594.
doi:10.1371/journal.pone.0008594.
9. Riginos C, Douglas KE, Jin Y, Shanahan DF, Treml EA (2011) Effects of
geography and life history traits on genetic differentiation in benthic marine
fishes. Ecography 34: 566–575.
10. Selkoe KA, Toonen RJ (2011) Marine connectivity: a new look at pelagic larval
duration and genetic metrics of dispersal. Mar Ecol Prog Ser 436: 291–305.
11. Bohonak AJ (1999) Dispersal, gene flow, and population structure. Q Rev Biol
74: 21–45.
12. Ayre DJ, Minchinton TE, Perrin C (2009) Does life history predict past and
current connectivity for rocky intertidal invertebrates across a marine
biogeographic barrier? Mol Ecol 18: 1887–1903.
13. Carlton JT, Geller JB (1993) Ecological roulette: the global transport of
nonindigenous marine organisms. Science 261: 78–82.
14. Carlton JT, Hodder J (1995) Biogeography and dispersal of coastal marine
organisms: experimental studies on a replica of a 16th century sailing vessel.
Mar Biol 121: 721–730.
15. Janson K (1987) Allozyme and shell variation in two marine snails (Littorina,
Prosobranchia) with different dispersal abilities. Biol J Linn Soc 30: 245–256.
16. Watts PC, Thorpe JP, Taylor PD (1998) Natural and anthropogenic dispersal
mechanisms in the marine environment: a study using cheilostome Bryozoa.
Phil Trans R Soc B 353: 453–464.
Dispersal Potential and Genetic Structure
PLOS ONE | www.plosone.org 13 February 2014 | Volume 9 | Issue 2 | e88613

17. Lomolino MV, Riddle BR, Whittaker RJ, Brown JH (2010) Biogeography.
Fourth edition. Sunderland, U S A: Sinauer.
18. Dawson MN (2001) Phylogeography in coastal marine animals: a solution from
California? J Biogeo 28: 723–736.
19. Kuo CH, Avise J (2005) Phylogeographic breaks in low-dispersal species: the
emergence of concordance across gene trees. Genetica 124: 179–186.
20. Goldstein SJ, Schiel DR, Gemmell NJ (2006) Comparative phylogeography of
coastal limpets across a marine disjunction in New Zealand. Mol Ecol 15:
3259–3268.
21. Dawson MN (2005) Incipient speciation of Catostylus mosaicus (Scyphozoa,
Rhizostomeae, Catostylidae), comparative phylogeography and biogeography
in south-east Australia. J Biogeo 32: 515–533.
22. Waters JM, Roy MS (2004) Phylogeography of a high-dispersal New Zealand
sea-star: does upwelling block gene-flow? Mol Ecol 13: 2797–2806.
23. Waters JM, King TM, O’Loughlin PM, Spencer HG (2005) Phylogeographical
disjunction in abundant high-dispersal littoral gastropods. Mol Ecol 14: 2789–
2802.
24. Waters JM, McCulloch GA, Eason JA (2007) Marine biogeographical structure
in two highly dispersive gastropods: implications for trans-Tasman dispersal.
J Biogeo 34: 678–687.
25. Waters JM (2008) Marine biogeographical disjunction in temperate Australia:
historical landbridge, contemporary currents, or both? Div Distr 14: 692–700.
26. Pelc RA, Warner RR, Gaines SD (2009) Geographical patterns of genetic
structure in marine species with contrasting life histories. J Biogeo 36: 1881–
1890.
27. Hellberg ME, Burton RS, Neigel JE, Palumbi SR (2002) Genetic assessment of
connectivity among marine populations. Bull Mar Sci 70, 273–290.
28. Wares JP, Gaines SD, Cunningham CW (2001) A comparative study of
asymmetric migration events across a marine biogeographic boundary.
Evolution 55: 295–306.
29. Galindo HM, Olson DB, Palumbi SR (2006) Seascape genetics: a coupled
oceanographic-genetic model predicts population structure of Caribbean
corals. Curr Biol 16: 1622–1626.
30. Irwin DE (2002) Phylogeographic breaks without geographic barriers to gene
flow. Evolution 56: 2383–2394.
31. Thiel M, Macaya EC, Acuna E, Arntz W, Bastias H, et al. (2007) The
Humboldt Current System of Northern and Central Chile: oceanographic
processes, ecological interactions and socioeconomic feedback. Annu Rev
Oceanogr Mar Biol 45: 195–344.
32. Camus PA (2001) Biogeografıa marina de Chile continental. Rev Ch Hist Nat
74: 587–617.
33. Tellier F, Meynard AP, Correa JA, Faugeron S, Valero M (2009)
Phylogeographic analyses of the 30uS south-east Pacific biogeographic
transition zone establish the occurrence of a sharp genetic discontinuity in
the kelp Lessonia nigrescens: vicariance or parapatry? Mol Phylogenet Evol 53:
679–693.
34. Montecinos A, Broitman B, Faugeron S, Haye PA, Tellier F, et al. (2012)
Species replacement along a lineal coastal habitat: phylogeography and
speciation in the red alga Mazzaella laminarioides along the south east Pacific.
BMC Evol Biol 12: 97.
35. Sanchez R, Sepulveda RD, Brante A, Cardenas L (2011) Spatial pattern of
genetic and morphological diversity in the direct developer Acanthina monodon
(Gastropoda: Mollusca). Mar Ecol Prog Ser 434: 121–131.
36. Cardenas L, Castilla JC, Viard F (2009) A phylogeographical analysis across
three biogeographical provinces of the south-eastern Pacific: the case of the
marine gastropod Concholepas concholepas. J Biogeo 36: 969–981.
37. Haye PA, Salinas P, Acuna E, Poulin E (2010) Heterochronic phenotypic
plasticity with lack of genetic differentiation in the southeastern Pacific squat
lobster Pleuroncodes monodon. Evol Dev 12: 627–633.
38. Ibanez CM, Cubillos LA, Tafur R, Arguelles J, Yamashiro C, et al. (2011)
Genetic diversity and demographic history of Dosidicus gigas (Cephalopoda:
Ommastrephidae) in the Humboldt Current System. Mar Ecol Prog Ser 431:
163–171.
39. Haye PA, Varela AI, Thiel M (2012) Genetic signatures of rafting dispersal in
algal-dwelling brooders Limnoria spp. (Isopoda) along the SE Pacific (Chile).
Mar Ecol Prog Ser 455: 111–122.
40. Haye PA, Munoz-Herrera NC (2013) Isolation with differentiation followed by
expansion with admixture in the tunicate Pyura chilensis. BMC Evol Biol 13:
252.
41. Teske PR, Papadopoulos I, Mmonwas L, Matumba TG, McQuaid CD, et al.
(2011) Climate-driven genetic divergence of limpets with different life histories
across a southeastern African marine biogeographic disjunction. Mol Ecol 20:
5025–5041.
42. Bird CE, Holland BS, Bowen BW, Toonen RJ (2007) Contrasting
phylogeography in three endemic Hawaiian limpets (Cellana spp.) with similar
life histories. Mol Ecol 16: 3173–3186.
43. Dawson MN (2013) Natural experiments and meta-analyses in comparative
phylogeography. J Biogeogr doi:10.1111/jbi.12190.
44. Barker ME (1977) Observations on the settlement of the brachiolaria larvae of
Stichaster australis (Verrill) and Coscinasterias calamaria (Gray) (Echinodermata:
Asteroidea) in the laboratory and on the shore. J Exp Mar Biol Ecol 30: 95–
108.
45. Mah CL, Foltz DW (2011) Molecular phylogeny of the Forcipulatacea
(Asteroidea: Echinodermata): Systematics & biogeography. Zool J Linn Soc
162: 646–660.
46. Chia FS (1966) Brooding behavior of a six rayed starfish, Leptasterias hexactis.
Biol Bull 130: 304–315.
47. Komatsu M, O’Loughlin PM, Bruce B, Yoshizawa H, Tanaka K, et al. (2006)
A gastric brooding asteroid, Smilasterias multipara. Zool Sci 23: 699–705.
48. Pearse JS, Mooi R, Lockhart SJ, Brandt A (2009) Brooding and species
diversity in the Southern Ocean: selection for brooders or speciation withinbrooding clades? In: Krupnik I, Lang MA, Miller SE, editors. Smithsonian at
the poles: contributions to international polar year science. Washington:
Smithsonian Institution. 181–196.
49. Barker MF, Nichols D (1983) Reproduction, recruitment and juvenile ecology
of the starfish, Asterias rubens and Marthasterias glacialis. J Mar Biol Ass UK 63:
745–765.
50. Kitazawa C, Komatsu M (2001) Larval development and asexual development
of the sea star, Distolasterias nipon (Doderlein). In: Barker M, editor. Echinoderms
2000. Lisse, The Netherlands: Swets and Zeitlinger. 177.
51. McEdward LR (1992) Morphology and development of a unique type of
pelagic larva in the starfish Pteraster tesselatus (Echinodermata: Asteroidea). Biol
Bull 182: 177–187.
52. Byrne M (1995) Changes in larval morphology in the evolution of benthic
development by Patiriella exigua (Asteroidea: Asterinidae), a comparison with the
larvae of Patiriella species with planktonic development. Biol Bull 188: 293–305.
53. Vickery MS, McClinton JB (2000) Effects of food concentration and availability
on the incidence of cloning in planktotrophic larvae of the sea star Pisaster
ochraceus. Biol Bull 199: 298–304.
54. Paik SG, Park HS, Yi SK, Yun SG (2005) Developmental duration and
morphology of the sea star Asterias amurensis, in Tongyeong, Korea. Ocean Sci J
40: 65–70.
55. Barker MF (1978) Descriptions of the larvae of Stichaster australis (Verril) andCoscinasterias calamaria (Gray) (Echinodermata: Asteroidea) from New Zealand,
obtained from Laboratory Culture. Biol Bull 154: 32–46.
56. Johnson CR, Sutton DC (1994) Bacteria on the surface of crustose coralline
algae induce metamorphosis of the crown of-thorns starfish Acanthaster planci.
Mar Biol 120: 305–310.
57. Daneri G, Dellarossa V, Quinones R, Jacob B, Montero P, et al. (2000)
Primary production and community respiration in the Humboldt Current
System of Chile and associated oceanic areas. Mar Ecol Prog Ser 197: 41–49.
58. Birkeland C, Chia FS, Strathmann RR (1971) Development, substratum
selection, delay of metamorphosis and growth in the seastar Mediaster aequalis
Stimpson. Biol Bull 141: 99–108.
59. Young CM, Sewell MA, Tyler PA, Metaxas A (1997). Biogeographic and
bathymetric ranges of Atlantic deep-sea echinoderms and ascidians: the role of
larval dispersal. Biodivers Conserv 6: 1507–1522.
60. Kolbin KG, Kulikova VA (2011) Reproduction and larval development of the
limpet Lottia persona (Rathke, 1833) (Gastropoda: Lottiidae). Russ J Mar Biol 37:
239–242.
61. Page LR (2002) Apical sensory organ in larvae of the patellogastropod Tectura
scutum. Biol Bull 202: 6–22.
62. Sasaki R (1985) Larval identification and occurrence of Ezo abalone, Haliotis
discus hannai, in the adjacent waters of Kensennuma Bay, Miyagi Prefecture.
Aquiculture 32: 199–206.
63. Kulikova VA, Omel’yanenko VA (2000) Reproduction and larval development
of the gastropod mollusk Tegula rustica in Peter the Great Bay, Sea of Japan.
Russ J Mar Biol 26: 128–130.65.
64. Kritzer JP, Sale PF (2006) Marine metapopulations, Elsevier, The Netherlands.
65. Foltz DW (2003) Invertebrate species with nonpelagic larvae have elevated
levels of nonsynonymous substitutions and reduced nucleotide diversity. J Mol
Evol 57: 607–612.
66. Foltz DW, Hrincevich AW, Rocha-Olivares A (2004) Apparent selection
intensity for the cytochrome oxidase I gene varies with mode of reproduction in
echinoderms. Genetica 122: 115–125.
67. Foltz DE, Mah CL (2010) Difference in larval type explains patterns of
nonsynonymous substitutions in two ancient paralogs of the histone H3 gene in
sea stars. Evol Dev 12: 222–230.
68. Hansen TA (1978) Larval dispersal and species longevity in Lower Tertiary
gastropods. Science, 199, 885–887.
69. Hansen TA (1983) Modes of larval development and rates of speciation in early
Terciary neogastropods. Science, 220, 501–502.
70. Jablonski D, Lurtz RA (1983) Larval ecology of marine benthic invertebrates:
paleobiological implications. Biological Review of the Cambridge Philosophical
Society, 58, 21–89.
71. Jablonski D (1986) Larval ecology and macroevolution in marine invertebrates.
Bull Mar Sci 39: 565–587.
72. Grantham TA (1995) Hierarchical approaches to macroevolution: recent work
on species selection and the ‘effect hypothesis’. Ann Rev Ecol Syst 26: 301–321.
73. Hey J (2010) Isolation with migration models for more than two populations.
Mol Biol Evol 27: 905–920.
74. McGovern TM, Keever CC, Saski CA, Hart MW, Marko PB (2010)
Divergence genetics analysis reveals historical population genetic processes
leading to contrasting phylogeographic patterns in co-distributed species. Mol
Ecol 19: 5043–5060.
Dispersal Potential and Genetic Structure
PLOS ONE | www.plosone.org 14 February 2014 | Volume 9 | Issue 2 | e88613

75. Plouviez S, Le Guen D, Lecompte O, Lallier FH, Jollivet D (2010) Determining
gene flow and the influence of selection across the equatorial barrier of the East
Pacific Rise in the tube-dwelling polychaete Alvinella popejana. BMC Evol Biol
10: 220.
76. Marko PB, Hart MW (2011) The complex analytical landscape of gene flow
inference. Trends Ecol Evol 26: 448–456.
77. Marko PB, Hart MW (2012) Retrospective coalescent methods and the
reconstruction of metapopulation histories in the sea. Evol Ecol 26: 291–315.
78. Martin P, Zuccarello GC (2012) Molecular phylogeny and timing of radiation
in Lessonia (Phaeophyceae, Laminariales). Phycol Res 60: 276–287.
79. Briones C, Presa P, Perez M, Pita A, Guinez R (2013) Genetic connectivity of
the ecosystem engineer Perumytilus purpuratus north to the 32uS southeast Pacific
ecological discontinuity. Mar Biol DOI 10.1007/s00227-013-2301-x.
80. Faugeron S, Valero M, Destombe C, Martınez EA, Correa JA (2001)
Hierarchical spatial structure and discriminant analysis of genetic diversity in
the red alga Mazzaella laminarioides (Gigartinales, Rhodophyta). J Phycol 37:
705–716.
81. Tellier F, Tapia J, Destombe C, Valero M, Faugeron S (2011) The Lessonia
nigrescens species complex (Laminariales. Phaeophyceae) shows strict parapatry
and complete reproductive isolation in a secondary contact zone. J Phycol 47:
894–903.
82. Brante A, Fernandez M, Viard F (2012) Phylogeography and biogeography
concordance in the marine gastropod Crepipatella dilatata (Calyptraeidae) along
the Southeastern Pacific coast. J Hered 103: 630–637.
83. Zakas C, Binford J, Navarrete SA, Wares JP (2009) Restricted gene flow in
Chilean barnacles reflects an oceanographic and biogeographic transition zone.
Mar Ecol Prog Ser 394: 165–177.
84. Strathmann MF (1897) Reproduction and development of marine invertebrates
of the northern Pacific coast. Washington, U S A: University of Washington
Press.
85. Grantham BA, Eckert GL, Shanks AL (2003) Dispersal potential of marine
invertebrates in diverse habitats. Ecol Appl 13: S108–S116.
86. Johnson MW (1939) The correlation of water movements and dispersal of
pelagic larval stages of certain littoral animals, especially the Sand crab, Emerita.
J Mar Res 2: 236–245.
87. Fuentes I, Barros C (2000) Larval development and metamorphosis of cultured
Tetrapygus niger (Echinodermata: Echinoidea). An uncommon form of
echinoplutei. Inv Rep Dev 37: 201–209.
88. Wehrtmann IS, Albornoz L, Pardo LM, Veliz D (1997) The larval
development of Petrolisthes violaceus (Guerin, 1831) (Decapoda, Anomura,
Porcellanidae) from Chilean waters, cultivated under laboratory conditions.
Crustaceana 70: 562–583.
89. Gore RH (1971) Petrolisthes tridentatus: the development of larvae from a Pacific
specimen in laboratory culture with a discussion of larval characters in the
genus (Crustacea: Decapoda: Porcellanidae). Biol Bull 141: 485–501.
90. Sambrook J, Fristch E, Maniatis T (1989) Molecular Cloning: A Laboratory
Manual. Cold Spring Harbor Laboratory Press, Cold Spring Harbor, NewYork.
91. Folmer O, Black M, Hoeh W, Lutz R, Vrikenhoek R (1994) DNA primers for
amplification of mitochondrial cytochrome c oxidase subunit I from diversemetazoan invertebrates. Mol Mar Biol Biotech 3: 294–299.
92. Hoareau TB, Boissin E (2010) Design of phylum-specific hybrid primers forDNA barcoding: addressing the need for efficient COI amplification in the
Echinodermata. Mol Ecol Res 10: 960–967.
93. Dawson MN, Barber PH, Gonzalez-Guzman LI, Toonen RJ, Dugan JE, et al.(2011) Phylogeography of Emerita analoga (Crustacea, Decapoda, Hippidae), an
eastern Pacific Ocean sand crab with long-lived pelagic larvae. J Biogeo 38:1600–1612.
94. Palumbi SR, Benzie J (1991) Large mitochondrial DNA differences betweenmorphologically similar Penaeid shrimp. Mol Mar Biol Biotech 1: 27–34.
95. Werding B, Hiller A, Misof B (2001) Evidence of paraphyly in the neotropical
Porcellanid genus Neopisosoma (Crustacea: Anomura: Porcellanidae) based onmolecular characters. Dev Hydrobiol 154: 105–110.
96. Drummond AJ, Ashton B, Buxton S (2011) Geneious. Biomatters Ltd.97. Librado P, Rozas J (2009) DnaSP v5: A software for comprehensive analysis of
DNA polymorphism data. Bioinf 25: 1451–1452.
98. Hudson RR (2000) A new statistic for detecting genetic differentiation. Genetics155: 2011–2014.
99. Excoffier L, Lischer HEL (2010) Arlequin ver 3.5: A new series of programs toperform population genetics analyses under Linux and Windows. Mol Ecol Res
10: 564–567.100. Slatkin M (1995) A measure of population subdivision based on microsatellite
allele frequencies. Genetics 139: 457–462.
101. R Development Core Team (2011) R: A language and environment forstatistical computing. R Foundation for Statistical Computing, Vienna, Austria.
ISBN 3-900051-07-0, Available: http://www.R-project.org/.102. Dupanloup I, Schneider S, Excoffier L (2002) A simulated annealing approach
to define the genetic structure of populations. Mol Ecol 11: 2571–2581.
103. Hey J, Nielsen R (2007) Integration within the Felsenstein equation forimproved Markov chain Monte Carlo methods in population genetics. Proc
Natl Acad Sci 104: 2785–2790.104. Geyer CJ (1991) Markov chain Monte Carlo likelihood. In: Keramidas, EM,
editor. Computing Science and Statistics: Proceedings of the 23rd Symposiumon the Interface. Fairfax Station: Interface Foundation. 156–163.
105. Nielsen R, Wakeley J (2001) Distinguishing migration from isolation. A Markov
chain Monte Carlo approach. Genetics 158: 885–96.106. Ho STW, Phillips MJ, Cooper A, Drummond A (2005) Time dependency of
molecular rate estimates and systematic overestimation of recent divergencetimes. Mol Biol Evol 22: 1561–1568.
107. Ho SYW, Lanfear R, Bromham L, Phillips MJ, Soubrier J, et al. (2011) Time-
dependent rates of molecular evolution. Mol Ecol 20: 3087–3101.
Dispersal Potential and Genetic Structure
PLOS ONE | www.plosone.org 15 February 2014 | Volume 9 | Issue 2 | e88613