Embed Size (px)
Citation preview

Phylogeographic insights into an irruptive pest outbreakCatherine I. Cullingham, Amanda D. Roe, Felix A. H. Sperling & David W. Coltman
Department of Biological Sciences, CW405 Biological Sciences Building, University of Alberta, Edmonton, Alberta, T6G 2E9, Canada
KeywordsDendroctonus ponderosae, forestry, irruptivepopulations, mountain pine beetle,phylogeography.
CorrespondenceCatherine I. Cullingham, Department ofBiological Sciences, CW 405 BiologicalSciences Building, University of Alberta,Edmonton, Alberta, T6G 2E9, Canada.Tel: 1-780-492-8368; Fax: 1-780-492-9234;E-mail: [email protected]
Funded by Genome Canada, the Governmentof Alberta through Genome Alberta, andGenome British Columbia in support of theTria I and Tria II projects.
Received: 6 December 2011; Accepted: 7December 2011
Ecology and Evolution 2012; 2(5): 908–919
doi: 10.1002/ece3.102
Abstract
Irruptive forest insect pests cause considerable ecological and economic damage,and their outbreaks have been increasing in frequency and severity. We use a phy-logeographic approach to understand the location and progression of an outbreakby the MPB (Dendroctonus ponderosae Hopkins), an irruptive bark beetle that hascaused unprecedented damage to lodgepole pine forests in western North Americaand is poised to expand its range across the boreal forest. We sampled MPB pop-ulations across British Columbia and Alberta and used phylogeographic methodsto describe lineage diversification, characterize population structure, investigate ex-pansion dynamics, and identify source populations of the outbreak. Using 1181 bpof mitochondrial DNA sequence from 267 individuals, we found high haplotypediversity, low nucleotide diversity, and limited lineage diversification. The overallpattern was consistent with isolation by distance at a continental scale, and withreduced diversity and population structure in the northerly, outbreak regions. Post-Pleistocene expansion was detected, however more recent expansion signals werenot detected, potentially due to the size and rapid rate of range expansion. Basedon the limited genetic structure, there were likely multiple source populations insouthern British Columbia, although the magnitude of the demographic expansionand rate of spread have obscured the signature of these source populations. Our datahighlight the need for caution in interpreting phylogeographic results for specieswith similar demographics.
IntroductionThe past few decades have seen an increase in the frequencyand severity of insect pest outbreaks (Fleming and Candau1998; Bale et al. 2002; Jepsen et al. 2008), often impactinghost species of economic importance. Understanding the dy-namics of an outbreak pest species is important from a man-agement perspective. Knowing the source and spread of anoutbreak can help delineate potential boundaries for controland provide the basis for developing strategies to preventfuture outbreaks (Mun et al. 2003; Kim et al. 2006; Porrettaet al. 2007). The use of population genetic methods to addressmanagement-associated questions for insect pest species isincreasing. For example, Davies et al. (1999) determined thatthe source of a Californian outbreak of medfly (Ceratitis cap-itata) was Latin America. As well, Kobayashi et al. (2010)effectively used population genetic methods to determinethat multiple source populations contributed to an outbreakof mirid bug (Stenotus rubrovittatus) in Japan, necessitating
monitoring of nonoutbreak areas to prevent additional cropdamage. Here, we use a phylogeographic approach to illumi-nate the outbreak dynamics of mountain pine beetle (MPB;Scolytidae: Dendroctonus ponderosae Hopkins, Fig. 1).
The MPB is a bark beetle that attacks many Pinus speciesin western North America including: Pinus contorta Dougl.,P. lambertiana Dougl., P. monticola Dougl. Ed. E. Don, P.ponderosae P. Laws. Ex C. Laws, P. albicaulis Engelm., andP. flexilis James (Furniss and Schenk 1969; Safranyik andCarroll 2006; Safranyik et al. 2010). Recently, MPB popula-tions have also been recorded in native stands of P. banksianaLamb (Cullingham et al. 2011), an important boreal speciesin Canada and the eastern United States. While MPB are usu-ally considered secondary pests that feed on suppressed ordiseased trees, certain conditions can lead to irruptive pop-ulation outbreaks. In these situations, MPB can successfullyattack mature healthy trees, leading to significant stand mor-tality (Rudinsky 1962; Safranyik and Carroll 2006). Theseirruptive situations generally occur every 20–30 years and
908 c© 2012 The Authors. Ecology and Evolution published by Blackwell Publishing Ltd.This is an open access article under the terms of the Creative Commons Attribution-NonCommercial License, which permitsuse, distribution and reproduction in any medium, provided the original work is properly cited and is not used for commercialpurposes.
C. I. Cullingham et al. Irruptive Pest Phylogeography
Figure 1. Scanned election microscopy image of mountain pine beetle(Dendroctonus ponderosae). Photo credit: Jack Scott.
usually last for —five to seven years (Cole and Cahill 1976;Safranyik 2004; Taylor et al. 2006).
Outbreaks of MPB are important for the maintenance ofhealthy forest stands (Roe and Amman 1970; Logan and Pow-ell 2001; Taylor and Carroll 2004), but anthropogenic factorshave altered the dynamics of this system. Increasing globaltemperatures have prompted synchrony of beetle emergencein the summer and reduced winter mortality, thereby result-ing in population increases (Hicke et al. 2006; Regniere andBentz 2007; Powell and Bentz 2009). Population growth ofMPB has also been fueled by an abundant food supply ofcontinuous tracts of even-aged forest stands resulting fromforest management practices (Taylor et al. 2006). All of thesefactors have contributed to the most severe MPB outbreak onrecord, and an unprecedented eastern expansion into north-ern Alberta outside of the historical range (Taylor and Carroll2004; Raffa et al. 2008; Robertson et al. 2009; Bentz et al. 2010;Safranyik et al. 2010; Cullingham et al. 2011).
As MPB populations expand into novel habitats, we havebeen presented with an opportunity to explore their phy-logeographic patterns in real time. Understanding how andwhere spatial expansion has occurred can assist with MPBmanagement and help to predict risk of future spread. Phy-logenetic analysis has been previously employed to analyzeMPB populations in western Canada to understand historicdemographics (Mock et al. 2007), although sampling wasdiffuse across the entire range, limiting the inferences thatcould be drawn about MPB phylogeography. Increased sam-pling within the outbreak populations would provide a morecomprehensive understanding of the outbreak history. Weare provided with a unique opportunity to apply expan-sion statistics to an outbreaking natural system. The rangeof MPB was affected by the Pleistocene glaciation due torange contraction and expansion of its host species caused by
glaciation (Fazekas and Yeh 2006). In addition to this historicexpansion, their range has grown considerably over the past50 years into northern BC and west-central Alberta, repre-senting a recent expansion. Here, we analyze MPB popu-lations in British Columbia and Alberta, focusing on theseareas of range expansion. We have included mitochondrial(mtDNA) data from Mock et al. (2007) to assess range-widelineage diversification. The objectives of our study were to (1)assess lineage diversification and patterns of diversity in re-lation to geography across the MPB range, (2) to determineif signals of expansion can be detected in a natural systemwith complex population dynamics comprising historic andrecent expansions, and (3) determine whether these data canbe used to identify locations of source populations that mayhave contributed to the current outbreak.
Methods
Sample collection
Live beetles were collected from 26 locations in BritishColumbia, Alberta, and South Dakota (Table 1 and Fig. 2)from 2005 to 2009 prior to summer dispersal each year. Bee-tle larvae and adults were collected from different galleries bydirect sampling from infested lodgepole pine and lodgepolepine × jack pine hybrid trees. For each tree, the Global Posi-tioning System location was taken and collected beetles weretransported to the laboratory on ice or in 95% ethanol andstored at –80◦C upon arrival. We have also included in ouranalyses MPB samples analyzed by Mock et al. (2007) at eightlocalities: Arizona (F-AZ), British Columbia (FSJ-BC), Cali-fornia (R-CA, SB-CA), Idaho (BF-ID, S-ID), Oregon (L-OR),and Utah (K-UT) (GenBank: DQ865977.1–DQ866021.1; Ta-ble 1 and Fig. 2).
DNA extraction and sequencing
Genomic DNA was isolated from whole beetle samples usingone of two methods. The first method employed a standardphenol/chloroform procedure (Sambrook and Russell 2001)and following precipitation, DNA was suspended in Tris-EDTA (pH 8.0). Alternatively, a DNeasy Blood & Tissue Kit(Qiagen, Mississauga, Ontario) was used following manufac-turer’s instructions.
Partial mtDNA sequence was generated from portions ofcytochrome c oxidase I (COI) and cytochrome c oxidase II(COII) genes as well as the complete tRNA-LEU using twosets of primers (C1-J-1718 (F): GGA GGA TTT GGA AATTGA TTA GTT CC, C1-N-2611 (R): GCA AAA ACT GCACCT ATT GA and C1-J-2193 (F): CCA GGG TTT GGT ATAATT TCT T, C2-N-3174 (R): TTA GAG GGG AAG ACC TATCTT GT; Simon et al. 1994; Cognato and Sperling 2000; Mocket al. 2007). PCR amplification was carried out in 25-ul re-actions containing 25 ng DNA, 1× Thermopol buffer (NEB,
c© 2012 The Authors. Ecology and Evolution published by Blackwell Publishing Ltd. 909

Irruptive Pest Phylogeography C. I. Cullingham et al.
Table 1. Sample areas for Dendroctonus ponderosae mitochondrial DNA analysis with sample size (N), haplotype diversity (H), nucleotide diversity (π )(and associated standard deviation “SD”), their population assignment based population histories, and associated diversity measures. Sample areas inbold are taken from Mock et al. (2007).
Pop Abbrev. Year N H SD π SD
North 173 0.9035 0.0109 0.0065 0.0034Bowron Lake BL 2006 13 0.8590 0.0886 0.0087 0.0048Fox Creek FC 2008 12 0.9242 0.0575 0.0057 0.0033Francois Lake FL 2006 11 0.8909 0.0740 0.0029 0.0018Fairview FV 2008 7 0.9048 0.1033 0.0082 0.0049Grande Prairie GP 2008 10 0.8444 0.0796 0.0044 0.0027Houston HO 2006 12 0.8636 0.0639 0.0014 0.0010McBride MB 2005 10 0.9778 0.0540 0.0083 0.0047Mackenzie MK 2005 9 0.8889 0.0910 0.0089 0.0051Mount Robson MR 2005 10 0.9556 0.0594 0.0085 0.0048Prince George PG 2005 9 0.9444 0.0702 0.0068 0.0040Pine Pass PP 2006 7 0.8095 0.1298 0.0047 0.0029Quesnel QN 2006 7 0.9048 0.1033 0.0101 0.0060Telkwa TK 2006 9 0.8889 0.0910 0.0058 0.0034Tumbler Ridge TR 2007 17 0.8309 0.0648 0.0035 0.0020Valemount V 2007 10 0.8444 0.1029 0.0089 0.0050Willmore-Kakwa WK 2008 11 0.9818 0.4630 0.0091 0.0051Ft St James FSJ-BC 2003 9 0.2222 0.1662 0.0022 0.0015Central 78 0.9624 0.0106 0.0089 0.0045Cypress Hills CH 2007 12 0.9545 0.0569 0.0115 0.0063Canmore CA 07/08 16 0.9250 0.0389 0.0104 0.0056Crowsnest Pass CN 2008 12 0.9545 0.0569 0.0052 0.0030Golden G 2008 7 0.9524 0.0955 0.0109 0.0067Kotonay-Yoho KY 07/08 6 1.0000 0.0962 0.0094 0.0058Sparwood SW 2008 8 0.9643 0.0772 0.0082 0.0048Whistler WH 2006 8 1.0000 0.0625 0.0070 0.0042Bonner’s Ferry BF-ID <2006 9 1.0000 0.0524 0.0694 0.0375South 87 0.9588 0.0096 0.0087 0.0045Black Hills BH 2009 11 0.8545 0.0852 0.0085 0.0047Custer Peak CU 2009 10 0.7556 0.1295 0.0054 0.0032Tigervill TV 2009 13 0.8462 0.0854 0.0054 0.0031Flagstaff F-AZ <2006 10 0.5333 0.0947 0.0108 0.0060Kamas K-UT <2006 10 0.7778 0.1374 0.0849 0.0452La Grande L-OR <2006 8 1.0000 0.0625 0.1082 0.0594Klamath R-CA <2006 10 0.9556 0.0594 0.0834 0.0444San Bernadino SB-CA <2006 8 0.7500 0.1391 0.0897 0.0492Stanley S-ID <2006 7 0.7619 0.1148 0.0846 0.0476
Pickering, Ontario), 0.1 ng/μl bovine serum albumin frac-tion V (BSA), 4 mM MgCl2, 0.2 mM each dNTP, 0.25 μMeach primer, and 1U Taq DNA polymerase (NEB). Thermo-cycling conditions consisted of an initial denaturation at 98◦Cfor 30 sec, followed by 35 cycles of 95◦C for 10 sec, 45◦C for30 sec, and 72◦C for 60 sec, and a final extension at 72.0◦C for5 min. For primer pair C1-J-2193 and C2-N-3174, 15 ng DNAwas used and the annealing temperature was 62◦C. Primersand unincorporated dNTPs were removed using ExoSAP-IT(USB Corporation, Cleveland, OH) following manufacturer’sinstructions prior to sequencing. Purified PCR products weresequenced bidirectionally with Applied Biosystems Big DyeTerminator v 3.1 cycle sequencing kit (Applied Biosystems,
Foster City, CA) using an Applied Biosystems 3730 DNAAnalyzer. Sequence data were analyzed and assembled withSeqman (DNASTAR Lasergene, Madison, WI). Final assem-bled sequences were checked manually.
Phylogenetic analyses
The most appropriate model of sequence evolution wasselected using jModelTest 0.1.1 (Posada 2008) based onAkaike’s information criterion. Using the parameter esti-mates, we calculated both a Maximum-Likelihood (ML)tree and a Median-Joining (MJ) network for the alignedmtDNA dataset. The ML tree was estimated using the on-line
910 c© 2012 The Authors. Ecology and Evolution published by Blackwell Publishing Ltd.

C. I. Cullingham et al. Irruptive Pest Phylogeography
Figure 2. Sample sites, including data from Mock et al. (2007) divided into south (blue), central (green), and northern (red) groups. Beetle attack datafor British Columbia and Alberta up to 1970 are included as shading as an indicator of the historic range postglaciation in Canada. The haplotypeMedian-Joining network for D. ponderosae is included, where the presence of a haplotype is indicated for each group. Circles are proportioned basedon sample size. Sample sites in Arizona and California from Mock et al. (2007) are not shown. Beetle attack data are from Thandi and Taylor (unpubl.ms.).
version of PhyML 3.0 (http://www.atgc-montpellier.fr/phyml/; Guindon and Gascuel 2003) using a general timereversible (GTR) model of nucleotide substitution, with thetransition:transversion ratio, invariable sites, and gamma-shape parameter estimated from jModelTest, subtree prun-ing and regrafting for tree improvement with 10 startingtrees, Shimodaira-Hasegawa like branch support, and 100bootstrap replicates. We included D. jeffreyi Hopkins, sisterspecies to D. ponderosae (Kelley and Farrell 1998) as an out-group. The MJ network was calculated using Network 4.516(fluxus-engineering.com). We implemented the maximum
parsimony option to identify unnecessary median vectorsand links (Polzin and Daneschmand 2003) and calculatedthe MJ network (Bandelt et al. 1999) using the output fromthis and the parameters from jModelTest.
Using a traditional phylogeographic approach (Avise2004), we looked at lineage diversification in relation togeography across the range of the beetle. We divided ourstudy area into three separate regions based on their bio-geographic history (Fig. 2): (1) south—populations thatwere south of the Cordilleran ice sheet (Clark et al. 2009),(2) central—populations that are considered to have been
c© 2012 The Authors. Ecology and Evolution published by Blackwell Publishing Ltd. 911

Irruptive Pest Phylogeography C. I. Cullingham et al.
Figure 3. Spatially interpolated surface of mt nucleotide diversity for MPB populations across western North America, generated using inverse-distanceweighting in the spatial analyst extension of ArcMap9.2. Inset shows the central and northern populations at a finer scale.
endemic since post-Pleistocene expansions (Safranyik et al.2010), (3) north—populations that have resulted from a re-cent range expansion of MPB (Fig. 2).
Population structure
Given the evidence of post-Pleistocene colonization (Mocket al. 2007) and a more recent expansion, we calculated hap-lotype (H) and nucleotide (π) diversity for each subpopu-lation, and regressed these on latitude and longitude, wherewe expected diversity to decrease toward the north and tothe east as MPB has recently expanded into central Alberta.All above calculations were performed in Arlequin 3.5.1.2(Excoffier et al. 2005) and significance was estimated using10,000 bootstrap replicates where appropriate. To test for sig-nals of expansion, we estimated Fu’s Fs (Fu 1997), and R2from Ramos-Onsins and Rozas (2002) given the statistical
power of these statistics over other measures of expansion(Ramos-Onsins and Rozas 2002). Both measures were calcu-lated in DnaSP v 5 (Librado and Rozas 2009) and significancewas tested using the coalescent simulation to estimate thedistribution. Using continuous surface maps, we visualizedgeographic patterns of diversity and signatures of expansion.The maps were generated in ArcMap 9.2 (ESRI) using theinverse-distance weighting (Fig. 3; Shepard 1968) calculationin the spatial analyst extension, using the six nearest neigh-bors for the estimation.
To examine the spatial genetic structure of MPB pop-ulations, we tested for isolation by distance including theMock et al. (2007) data, and for just the outbreaking re-gion in British Columbia and Alberta. We calculated pair-wise genetic differentiation using FST in Arlequin, which ac-counts only for haplotype frequency differences (Excoffieret al. 1992). Geographic distances were calculated among
912 c© 2012 The Authors. Ecology and Evolution published by Blackwell Publishing Ltd.

C. I. Cullingham et al. Irruptive Pest Phylogeography
sample area centroids using Hawth’s Tools (Beyer 2004) inArcMap 9.2 (ESRI Inc, Redlands, CA). The correlation be-tween the matrices was tested using a Mantel test imple-mented in zt (Bonnet and Van de Peer 2002) and significancewas assessed using 10,000 iterations.
Results
Phylogenetic analyses
We obtained 1181 bp of mtDNA sequence from 267 individu-als yielding 62 haplotypes (GenBank: JQ308436-JQ308479).We aligned our sequences with those from Mock et al. (2007)trimmed to our fragment size. This reduced the number ofhaplotypes described in Mock et al. (2007) to 35, which wereanalyzed with the 62 haplotypes from the newly sampledMPB populations. Most of the haplotypes were found in oneof the three regions (south [31], central [23], and north [26]),11 were shared between two of the regions (south–central[6], south–north [3], and central–north [2]), and six wereshared among all regions. One hundred six variable sites werefound, 97 transitions, seven transversions, and two transi-tion/transversions. The ML tree was very shallow, character-ized by short internal branches with little bootstrap supportover 80% (Fig. S1). The low level of divergence among hap-lotypes was also reflected in the MJ network where therewere some reticulations and a number of “star-burst” pat-terns (Fig. 2). Some phylogenetic resolution in both the MJnetwork and ML tree was found among haplotypes that oc-curred in the southern portion of the MBP range, althoughfor the majority, lineage diversification did not correspondto geography (Fig. 2).
Population structure
Among sampling areas, we found high haplotype diversity(0.756–1.000) and low nucleotide diversity (0.001–0.011)(Table 1). Nucleotide diversity declined significantly with in-creasing latitude (R2 = 0.39, t32 = –3.41 × 10⁻³, P = 7.47 ×10⁻⁵), but haplotype diversity was unrelated to either latitudeor longitude (R2
latitude = 0.05, t32 = 5.94 × 10³, P = 0.19;R2
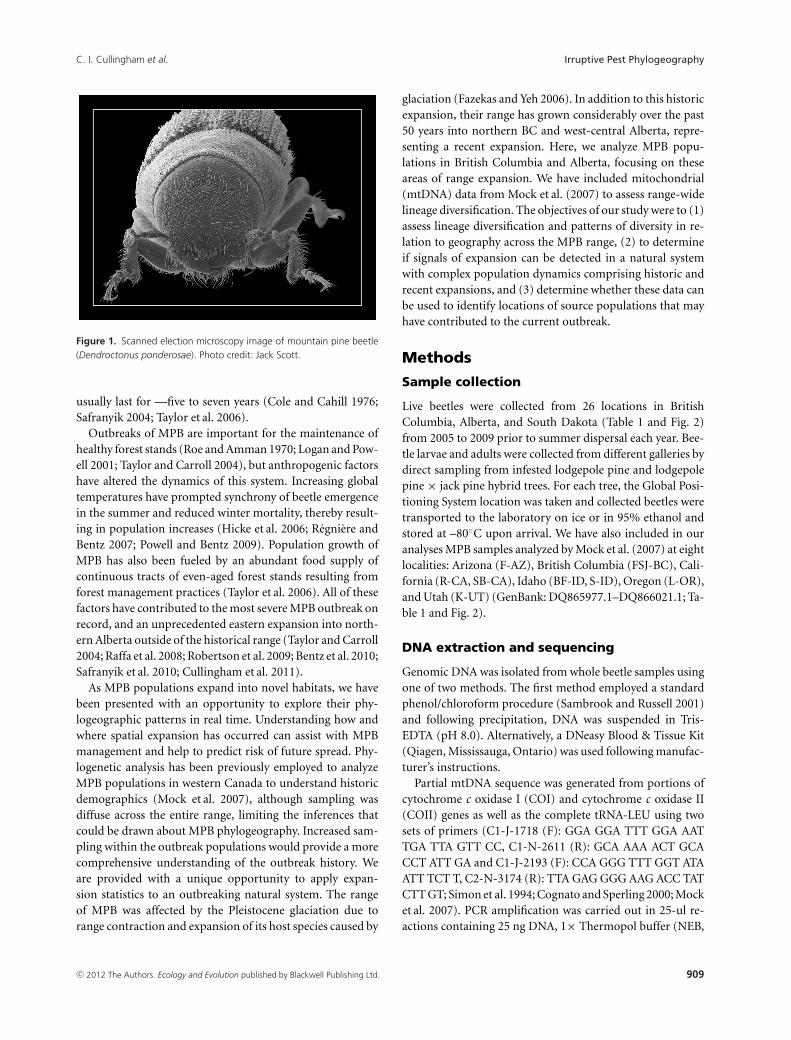
longitude = 1.38 × 10⁻³, t32 = –9.42 × 10⁻⁵, P = 0.83).There was a greater than 10-fold difference in nucleotide di-versity between the southern and northern beetle populations(Fig. 2). There were minor differences between the two ex-pansion statistics we calculated; therefore, we chose to map Fsto illustrate patterns of demographic expansion (Fig. 4). Onlytwo populations (BF-ID and WH) had significant signals ofexpansion, located in the central regions, we plotted the ac-tual values of Fs because they were highly correlated with theP-values (r = 0.93). The signal of expansion decreased to thenorth with no evidence of expansion in the south. However,when we analyzed the population groups based on their his-tories, we found a significant signal of expansion only for the
central (Fs = –13.40, P = 0.003) and no significant signalfor the southern (Fs = –7.79, P = 0.050) or northern groups(Fs = –5.76, P = 0.107). Genetic differentiation was highlycorrelated with geographic distance for the combined data(r = 0.64, P = 0.0001, Fig. 5A), however this relationshipwas weaker when only the current outbreak samples wereincluded (r = 0.30, P = 0.0033, Fig. 5B). There were no sig-nificant Fst comparisons among our 22 sampled populationsin the outbreak region following Bonferroni correction.
Discussion
Our assessment of mitochondrial diversity in MPB acrossBritish Columbia and Alberta indicates poorly resolvedphylogenetic structure with limited genetic differentiation.Across the sampled range, we observed high haplotype diver-sity, but found over a 10-fold difference in nucleotide diversitybetween the southern and central/northern populations, re-sulting in a significant correlation with latitude. When com-bined with the data from Mock et al. (2007), we found asignificant signal of isolation by distance, which agrees withtheir prior analysis. Based on the limited genetic structure, wehypothesize there were multiple outbreak sources in south-ern British Columbia in the current epidemic. Analysis withmicrosatellite markers also found southern British Columbiarepresented a single genetic population (N. G. Samarasekaraet al. unpubl. ms.) with weak substructure due to the sizeand rapid spread of this outbreak. Although little phyloge-netic structure was apparent, there were interesting patternsof diversity and expansion that can be used to make somedemographic inferences. As well, these data bring to light po-tential limitations of phylogeographic inference for specieswith similar demographics.
Limited phylogenetic structure of MPB is not surprisinggiven their population demographics. MPB development iscompleted most often in one year and under certain condi-tions in two years (Amman 1977; Safranyik et al. 2010) andfollowing development within the host tree, adult beetlesemerge and disperse (Safranyik and Carroll 2006). Disper-sal is either short (among host trees, 30 m; Safranyik et al.1992) or medium distance (between forest stands, 20 km;Furniss and Furniss 1972), although beetles have been shownto achieve long-range dispersal of >100 km in a single day(Safranyik et al. 2010). Given the dispersive nature of theMPB life cycle and the distances they travel, the potential forisolated populations and genetic signatures to develop shouldbe limited.
Along with being dispersive, MPB also routinely experi-ence large fluctuations in population size. Since documen-tation of MPB attacks began in British Columbia approxi-mately 125 years ago, there have been four to five major out-breaks, often in different geographic areas (Taylor and Carroll2004; Aukema et al. 2006). The level of haplotype diversity
c© 2012 The Authors. Ecology and Evolution published by Blackwell Publishing Ltd. 913
Irruptive Pest Phylogeography C. I. Cullingham et al.
Figure 4. Spatially interpolated surface of range expansion (measured as Fu’s [1997] Fs) for MPB populations across western North America, generatedusing inverse-distance weighting in the spatial analyst extension of ArcMap9.2.
is affected by the effective population size, where a loss ofdiversity will result when the effective population is reduced.For outbreaking populations, there is an expectation of re-duced diversity since the long-term effective population willreflect the size of the endemic phase (Motro and Thomson1982). Estimates of population size for MPB in the endemicphase are <40 attacking females per hectare (Carroll et al.2006), a considerably smaller population than the epidemicphase where attack densities are on average 70 beetles/m2
bark (Raffa and Berryman 1983). Despite this expectation,we observed very high haplotype diversity in all of our studiedpopulations (Table 1), consistent with other species of irrup-tive bark beetles (Cognato et al. 1999; Anducho–Reyes et al.
2008; Ruiz et al. 2009). Based on other studies of outbreakingpopulations, there are two factors that likely act to maintainhigh diversity. First, the dispersive behavior of MPB will re-sult in constant immigration, which can act to maintain highlevels of heterozygosity (Ehrich and Jorde 2005). Second, theeffective population size at the endemic phase for MPB maybe high enough to maintain diversity, and/or the length ofthe endemic phase is not long enough for a considerable de-crease in diversity, this was observed for outbreaking locustpopulations in Europe (Chapuis et al. 2009).
Using a phylogeographic approach, other studies have beenable to assess the geographic source of outbreaking insects(Davies et al. 1999; Kobayashi et al. 2010). When multiple
914 c© 2012 The Authors. Ecology and Evolution published by Blackwell Publishing Ltd.

C. I. Cullingham et al. Irruptive Pest Phylogeography
Figure 5. Isolation by distance plot for D. ponderosae across (A) western North America; and (B) our sample areas in British Columbia and Alberta.Geographic distance is significantly correlated to genetic differentiation (FST) across the entire region (r = 0.64, P = 0.0001), though more weaklyamong the outbreak populations alone (r = 0.30, P = 0.0033). Comparisons with FSJ-BC are indicated by gray squares.
sources contribute to an outbreak, it will generally result ingenetic population clusters (Mun et al. 2003; Kobayashi et al.2010). Spatiotemporal analysis of outbreak data in BC in-dicates the current epidemic resulted from a simultaneousincrease in populations in southern BC (Aukema et al. 2006),suggesting multiple sources. Yet, we did not observe evidenceof population structure, rather we observed nonsignificantpair-wise FST comparisons and very diffuse isolation by dis-tance among outbreak populations (Fig. 5B). In both Munet al. (2003) and Kobayashi et al. (2010), the outbreaks weregeographically separate whereas the MPB outbreak in south-ern BC involved multiple areas that are geographically prox-imate. Proximity and the dispersal capability of MPB have
likely contributed to the mixing of mitochondrial lineagesduring the outbreak, which would be consistent with thefindings of Aukema et al. (2006).
The limited degree of phylogenetic structure across a largegeographic region for MPB raises an important considera-tion: how applicable is a phylogeographic approach to re-solving the history of a highly dispersive, irruptive species?There have been a number of studies that have considered thephylogeographic structure of outbreaking insect populations(Cognato et al. 2005; Maroja et al. 2007; Mock et al. 2007;Anducho–Reyes et al. 2008; Ruiz et al. 2009) and these foundlimited phylogenetic structure, high haplotype diversity, lownucleotide diversity, and evidence of range expansion. For
c© 2012 The Authors. Ecology and Evolution published by Blackwell Publishing Ltd. 915

Irruptive Pest Phylogeography C. I. Cullingham et al.
both our analysis of MPB and that of Mock et al. (2007), thesignal of range expansion that we observe is most likely tobe from post-Pleistocene historical processes and the morerecent expansion is not detectable using traditional expan-sion statistics. Since record taking began in the early 1900s,MPB has been documented primarily in southern and cen-tral British Columbia (Carroll et al. 2003; Taylor and Carroll2004), and in the past 50 years the range has increased sub-stantially toward the north. While we were unable to detectexpansion using statistical measures, we do see the relation-ship between haplotype diversity and latitude that is sugges-tive of a historical range expansion.
The magnitude of the recent outbreak, in terms of both therapid population size increase and the geographic spread, hasthe potential to swamp phylogeographic signal. For example,Mock et al. (2007) sampled one site in British Columbia atFort St. James (FSJ) in 2003 (S. Lindgren, pers. comm.). FSJis proximate to our sample sites in Francois Lake (FL) andMackenzie (MK), which were obtained in 2005/2006. The FSJsample is characterized by extremely low haplotype diversity(H = 0.2222) relative to all of our datapoints including itsnearest neighbors (HFL = 0.8909, HMK = 0.8889). This lowdiversity is a signature of a very recently founded population(Mayr 1942), and in 2003 this area was at the front of theMPB outbreak. Yet, within three years (equal to three genera-tions), this signature is no longer evident in our samples. Thissuggests that recent population demographic change has thepotential to obscure population genetic signatures. In fact,Lee et al. (2007) studied the genetic diversity of Grosmaniaclavigera, a fungal associate of MPB, and found two distinctlineages in the northern Rocky Mountains. However, morerecent studies did not find any lineage diversification in acomprehensive treatment of the region (Alamouti et al. 2011;Roe et al. 2011), suggesting that rapid expansion of MPBreplaced the endemic populations of fungi in the northernRocky Mountains.
This study provides information on MPB dynamics, butwe have also highlighted potential drawbacks in using phy-logeographic analyses for highly dispersive species with largefluctuations in population size. This is clearly an avenue thatdeserves more detailed attention through model-based phy-logeographic inference (Excoffier and Heckel 2006; Kuhner2008; Beaumont et al. 2010) as the use of phylogeography inthese types of applications increases (Mun et al. 2003; Cog-nato et al. 2005; Kim et al. 2006; Maroja et al. 2007; Mock et al.2007; Porretta et al. 2007; Anducho–Reyes et al. 2008; Cha-puis et al. 2009; Ruiz et al. 2009). The use of a single markermay affect our ability to detect accurate patterns, a commoncriticism of single marker studies (e.g., Zink and Barrow-clough 2008; Flanders et al. 2009); however, multiple nuclearmarkers are not likely to contradict these results, particularlyin outbreak areas that are phylogeographically unstructured.A recent population genetic analysis using microsatellites did
not reveal conflicting or additional information about MPBpopulation history (N. G. Samarasakara et al. unpubl. ms.),rather the higher resolution of microsatellite data was able toresolve subtle population structure resulting from the recentexpansion (N. G. Samarasakera et al. unpubl. ms.). Also, mi-crosatellite data may not be appropriate for phylogeographicanalysis given the differences in temporal sensitivity of mi-crosatellite and mitochondrial data (Wang 2010).
Acknowledgments
The authors would like to thank K. Mock, S. Lindgren, andB. Bentz for access and clarification of data; S. Boychuk andS. Dang for laboratory and data-handling assistance;B. Murray (University Northern British Columbia), K. Bleiker(Pacific Forestry Centre), R. Moore (Saskatchewan Ministryof the Environment), and B. Jones, D. Edwards, E. Hunt, andS. Bourassa (University of Alberta) for sample collection.We acknowledge funding for this research from GenomeCanada, the Government of Alberta through GenomeAlberta, and Genome British Columbia in support of theTria I and Tria II projects (http://www.thetriaproject.ca) ofwhich FAHS and DWC are principle investigators.
References
Alamouti, S. M., V. Wang, S. DiGuistini, D. L. Six, J. Bohlmann,
R. C. Hamelin, N. Feau, and C. Breuil. 2011. Gene genealogies
reveal cryptic species and host preferences for the pine fungal
pathogen Grosmania clavigera. Mol. Ecol. 20:2581–2602.
Amman, G. D. 1977. The role of mountain pine beetle in
lodgepole pine ecosystems: impact on succession. Pp. 3–18 in
W. J. Mattson, ed. The role of arthropods in forest ecosystems,
proceedings of the 15th international congress of entomology,
Washington, DC, 19–27 August 1976. Springer-Verlag, New
York.
Anducho-Reyes, M. A., A. I. Cognato, J. L. Hayes, and G. Zuniga.
2008. Phylogeography of the bark beetle Dendroctonus
mexicanus Hopkins (Coleoptera: Curculionidae: Scolytinae).
Mol. Phylogenet. Evol. 49:930–940.
Aukema, B. H., A. L. Carroll, J. Zu, K. F. Raffa, T. A. Sickley, and
S. W. Taylor. 2006. Landscape level analysis of mountain pine
beetle in British Columbia, Canada: spatiotemporal
development and spatial synchrony within the present
outbreak. Ecography 29:427–441.
Avise, J. C. 2004. Molecular markers, natural history, and
evolution, 2nd ed. Sinauer Associates, Sunderland, MA.
Bale, J. S., G. J. Masters, I. D. Hodkinson, C. Awmack, T. M.
Bezemer, V. K. Brown, J. Butterfield, A. Buse, J.C. Coulson, J.
Farrar, et al. 2002. Herbivory in global climate change research:
direct effects of rising temperature on insect herbivores. Glob.
Change Biol. 8:1–16.
Bandelt, H.-J., P. Forster, and A. Rohl. 1999. Median-joining
networks for inferring intraspecific phylogenies. Mol. Biol.
Evol. 16:37–48.
916 c© 2012 The Authors. Ecology and Evolution published by Blackwell Publishing Ltd.

C. I. Cullingham et al. Irruptive Pest Phylogeography
Beaumont, M. A., R. Nielsen, C. Robert, J. Hey, O. Gaggiotti, L.
Knowles, A. Estoup, M. Panchal, J. Corander, M. Hickerson,
et al. 2010. In defense of model-based inference in
phylogeography. Mol. Ecol. 19:436–446.
Bentz, B. J., J. Regniere, C. J. Fettig, E. M. Hansen, J. L. Hayes, J.
A. Hicke, R. G. Kelsey, J. F. Negron, and S. J. Seybold. 2010.
Climate change and bark beetles of the western United States
and Canada: direct and indirect effects. BioScience 60:602–
613.
Beyer, H. L. 2004. Hawth’s analysis tools for ArcGIS. Available at
http://www.spatialecology.com/htools. Accessed November 22,
2010.
Bonnet, E., and Y. Van de Peer. 2002. zt: a software tool for simple
and partial Mantel tests. J. Stat. Softw. 10:1–12.
Carroll, A. L., S. W. Taylor, J. Regniere, and L. Safranyik. 2003.
Effect of climate change on range expansion by the mountain
pine beetle in British Columbia. Pp. 223–232 in T. L. Shore, J.
E. Brooks, and J. E. Stone, eds. Mountain pine beetle
symposium: challenges and solutions, Report BC-X-399,
Canadian Forest Service, Pacific Forestry Centre, Victoria,
British Columbia.
Carroll, A. L., B. H. Aukema, K. F. Raffa, D. A. Linton, G. D.
Smith, and B. S. Lindgren. 2006. Mountain pine beetle
outbreak development: the endemic–incipient epidemic
transition. Mountain Pine Beetle Initiative Project #1.03,
pp. 22, Canadian Forest Service, Pacific Forestry Centre,
Victoria, British Columbia.
Chapuis, M.-P., A. Loiseau, M. Michalakis, M. Lecoq, A. Franc,
and A. Estoup. 2009. Outbreaks, gene flow and effective
population size in the migratory locust, Locusta migratoria: a
regional-scale comparative survey. Mol. Ecol. 18:792–
800.
Clark, P. U., A. S. Dyke, J. D. Shakun, A. E. Carlson, J. Clark, B.
Wohlfarth, J. X. Mitrovica, S. W. Hostetler, and A. M. McCabe.
2009. The last glacial maximum. Science 325:710–714.
Cognato, A. I., and F. A. H. Sperling. 2000. Phylogeny of Ips
DeGeer species (Coleoptera: Scolytidae) inferred from
mitochondrial cytochrome oxidase I DNA sequence. Mol.
Phylogenet. Evol. 14:445–460.
Cognato, A. I., S. J. Seybold, and F. A. H. Sperling. 1999.
Incomplete barriers to mitochondrial gene flow between
pheromone races of the North American pine engraver, Ips
pini (Say. (Coleoptera: Scolytidae). Proc. Roy. Soc. Lond. Ser. B
Biol. 266:1843–1850.
Cognato, A. I., N. E. Gillette, R. C. Bolanos, and F. A. H. Sperling.
2005. Mitochondrial phylogeny of pine cone beetles
(Scolytinae, Conophthorus) and their affiliation with
geographic area and host. Mol. Phylogenet. Evol. 36:494–508.
Cole, W. E., and D. B. Cahill. 1976. Cutting strategies can reduce
probabilities of mountain pine beetle epidemics in lodgepole
pine. J For. 74:294–297.
Cullingham, C. I., J. E. K. Cooke, S. Dang, C. S. Davis, B. J. Cooke,
and D. W. Coltman. 2011. Mountain pine beetle host-range
expansion threatens the boreal forest. Mol. Ecol. 20:2157–2171.
Davies, N., F. X. Villablanca, and G. K. Roderick. 1999.
Bioinvasions of the Medfly Ceratitis capitata: source estimation
using DNA sequences at multiple intron loci. Genetics
153:351–360.
Ehrich, D., and P. E. Jorde. 2005. High genetic variability despite
high-amplitude population cycles in lemmings. J. Mammal.
86:380–385.
Excoffier, L., and G. Heckel. 2006. Computer programs for
population genetics data analysis: a survival guide. Nat. Rev.
Genet. 7:745–758.
Excoffier, L., P. Smouse, and J. Quattro. 1992. Analysis of
molecular variance inferred from metric distances among
DNA haplotypes—application to human mitochondrial-DNA
restriction data. Genetics 131:479–491.
Excoffier, L., G. Laval, and S. Schneider. 2005. Arlequin (version
3.0): an integrated software package for population genetics
data analysis. Evol. Bioinform. 1:47–50.
Fazekas, A. J., and F. C. Yeh. 2006. Postglacial colonization and
population genetic relationships in the Pinus contorta
complex. Can. J. Bot. 84:223–234.
Flanders, J., G. Jones, P. Benda, C. Dietz, G. L. Zhang, M. Sharifi,
and S. J. Rossiter. 2009. Phylogeography of the greater
horseshoe bat, Rhinolophus ferrumequinum: contrasting results
from mitochondrial and microsatellite data. Mol. Ecol.
18:306–318.
Fleming, R. A., and J.-N. Candau. 1998. Influences of climatic
change on some ecological processes of an insect outbreak
system in Canada’s boreal forests and the implications for
biodiversity. Environ. Monit. Assess. 49:235–249.
Fu, Y. X. 1997. Statistical tests of neutrality of mutations against
population growth, hitch-hiking, and background selection.
Genetics 147:915–925.
Furniss, M. M., and R. L. Furniss. 1972. Scolytids (Coleoptera)
on snowfields above timberline in Oregon and Washington.
Can. Entomol. 104:1471–1478.
Furniss, M. M., and J. A. Schenk. 1969. Sustained natural
infestations by the mountain pine beetle in seven new Pinus
and Picea hosts. J. Econ. Entomol. 62:518–519.
Guindon, S., and O. Gascuel. 2003. A simple, fast, and accurate
algorithm to estimate large phylogenies by maximum
likelihood. Syst. Biol. 52:696–704.
Hicke, J. A., J. A. Logan, J. Powell, and D. S. Ojima. 2006.
Changing temperatures influence suitability for modeled
mountain pine beetle (Dendroctonus ponderosae)
outbreaks in the western United States. J. Geophys. Res. 111:
G02019.
Jepsen, J. U., S. B. Hagen, R. A. Ims, and N. G. Yoccoz. 2008.
Climate change and outbreaks of the geometrids Operophtera
brumata and Epirrita autumnata in subarctic birch forest:
evidence of a recent outbreak range expansion. J. Anim. Ecol.
77:257–264.
Kelley, S. T., and B. D. Farrell. 1998. Is specialization a dead end?
The phylogeny of host use in Dendrotonus bark beetles
(Scolytidae). Evolution 52:1731–1743.
c© 2012 The Authors. Ecology and Evolution published by Blackwell Publishing Ltd. 917

Irruptive Pest Phylogeography C. I. Cullingham et al.
Kim, K. S., P. Cano-Rıos, and T. W. Sappington. 2006. Using
genetic markers and population assignment techniques to
infer origin of boll weevils (Coleoptera: Curculionidae)
unexpectedly captured near an eradication zone in Mexico.
Environ. Entomol. 35:813–826.
Kobayashi, T., T. Saurai, M. Sakakibara, and T. Watanabe. 2010.
Multiple origins of outbreak populations of a native insect pest
in an agro-ecosystem. Bull. Entomol. Res. 101:313–
324.
Kuhner, M. K. 2008. Coalescent genealogy samplers: windows
into population history. Trends Ecol. Evol. 24:86–93.
Lee, S., R. C. Hamelin, D. L. Six, and C. Breuil. 2007. Genetic
diversity and the presence of two distainct groups in
Ophiostoma clavigerum associated with Dendroctonus
ponderosae in British Columbia and the northern Rocky
Mountains. Phytopathology 97:1177–1185.
Librado, P., and J. Rozas. 2009. DnaSP v5: a software for
comprehensive analysis of DNA polymorphism data.
Bioinformatics 25:1451–1452.
Logan, J. A., and J. A. Powell. 2001. Ghost forests, global
warming, and the mountain pine beetle (Coleoptera:
Scolytidae). Am. Entomol. 47:160–172.
Maroja, L. S., S. M. Bogdanowicz, K. F. Wallin, K. F. Raffa, and R.
G. Harrison. 2007. Phlogeography of spruce beetles
(Dendrotonus rufinpennis Kirby) (Curculionidae: Scolytinae)
in North America. Mol. Ecol. 16:2560–2573.
Mayr, E. 1942. Systematics and the origin of species. Columbia
Univ. Press, New York.
Mock, K. E., B. J. Bentz, E. M. O’Neill, J. P. Chong, J. Orwin, and
M. E. Pfrender. 2007. Landscape-scale genetic variation in a
forest outbreak species, the mountain pine beetle
(Dendroctonus ponderosae). Mol. Ecol. 16:553–568.
Motro, U., and G. Thomson. 1982. On heterozygosity and the
effective size of populations subject to size changes. Evolution
36:1059–1066.
Mun, J., A. J. Bohonak, and G. K. Roderick. 2003. Population
structure of the pumpkin fruit fly Bactrocera depressa
(Tephritidae) in Korea and Japan: Pliocene allopatry or recent
invasion? Mol. Ecol. 12:2941–2951.
Polzin, T., and S. V. Daneschmand. 2003. On Steiner trees and
minimum spanning trees in hybergraphs. Oper. Res. Lett.
31:12–20.
Porretta, D., D. Canestrelli, R. Bellini, G. Celli, and S. Urbanelli.
2007. Improving insect pest management through population
genetic data: a case study of the mosquito Ochlerotatus caspius
(Pallas). J. Appl. Ecol. 44:682–691.
Posada, D. 2008. jModelTest: phylogenetic model averaging. Mol.
Biol. Evol. 25:1253–1256.
Powell, J. A., and B. J. Bentz. 2009. Connecting phenological
predictions with population growth rates for mountain pine
beetle, an outbreak insect. Landscape Ecol. 24:657–672.
Raffa, K. F., and A. A. Berryman. 1983. The role of host plant
resistance in the colonization behavior and ecology of bark
beetles (Coleoptera: Scolytidae). Ecol. Monogr. 53:27–49.
Raffa, K. F., B. H. Aukema, J. Berntz, A. L. Carroll, J. A. Hicke, M.
G. Turner, and W. H. Romme. 2008. Cross-scale divers of
natural disturbances prone to anthropogenic amplification:
the dynamics of bark beetle eruptions. BioScience 58:501–
517.
Ramos-Onsins, S. E., and J. Rozas. 2002. Statistical properties of
new neutrality tests against population growth. Mol. Biol.
Evol. 19:2092–2100.
Regniere, J., and B. Bentz. 2007. Modeling cold tolerance in the
mountain pine beetle, Dendroctonus ponderosae. J. Insect
Physiol. 53:559–572.
Robertson, C., T. A. Nelson, D. E. Jelinski, M. A. Wulder, and B.
Boots. 2009. Spatial-temporal analysis of species range
expansion: the case of the mountain pine beetle, Dendroctonus
ponderosae. J. Biogeogr. 36:1446–1458.
Roe, A. D., A. V. Rice, D. W. Coltman, J. E. K. Cooke, and F. A. H.
Sperling. 2011. Comparative phylogeography, genetic
differentiation and contrasting reproductive modes in three
fungal symbionts of a multipartite bark beetle symbiosis. Mol.
Ecol. 20:584–600.
Roe, A. L., and G. D. Amman. 1970. Mountain pine beetle in
lodgepole pine forests. Research paper INT-71, USDA Forest
Service, Intermountain Research Station, Missoula, MT.
Rudinsky, J. A. 1962. Ecology of Scolytidae. Ann. Rev. Entomol.
7:327–348.
Ruiz, E. A., J. E. Rinehart, J. L. Hayes, and G. Zuniga. 2009. Effect
of geographic isolation on genetic differentiation in
Dendroctonus pseudotsugae (Coleoptera: Curculionidae).
Heriditas 146:79–92.
Safranyik, L., Brooks, and J. E. Stone. 2004. Mountain pine beetle
epidemiology in lodgepole pine. Pp. 33–40 in T. L. Shore, J. E.
Stone, eds. Proceedings of the Mountain Pine Beetle
Symposium. Natural Resources Canada, Canadian Forest
Service, Pacific Forestry Centre, BC-X-399, NRC Research
Press, Ottawa, Ontario.
Safranyik, L., and A. Carroll. 2006. The biology and epidemiology
of the mountain pine beetle in lodgepole pine forests. Pp. 3–66.
in L. Safranyik, and W. Wilson, eds. The mountain pine beetle:
a synthesis of biology, management and impacts on lodgepole
pine. Natural Resources Canada, Canadian Forest Service,
Pacific Forestry Centre, Victoria, British Columbia.
Safranyik, L., D. A. Linton, R. Silversides, and L. H. McMullen.
1992. Dispersal of released mountain pine beetles under the
canopy of a mature lodgepole pine stand. J. Appl. Entomol.
113:441–450.
Safranyik, L., A. L. Carroll, J. Regniere, D. W. Langor, W. G. Riel,
T. L. Shore, et al. 2010. Potential for range expansion of
mountain pine beetle into the boreal forest of North America.
Can. Entomol. 142:415–4442.
Sambrook, J., and D. W. Russell. 2001. Molecular cloning: a
laboratory manual. 3rd ed. Cold Spring Harbour Laboratory
Press, New York.
Shepard, D. 1968. A two-dimensional interpolation function for
irregularly-spaced data. Pp. 517–524 in 23rd National
918 c© 2012 The Authors. Ecology and Evolution published by Blackwell Publishing Ltd.

C. I. Cullingham et al. Irruptive Pest Phylogeography
Conference of American Computing machinery, Princeton,
NJ.
Simon, C. F., F. Frati, A. T. Beckenbach, B. Crespi, H. Liu, and P.
Flook. 1994. Evolution, weighting, and phylogenetic utility of
mitochondrial gene sequences and a compilation of conserved
polymerase chain reaction primers. Ann. Entomol. Soc. Am.
87:651–701.
Taylor, S. W., and A. L. Carroll. 2004. Disturbance, forest age,
and mountain pine beetle outbreak dynamics in BC: a
historical perspective. Canadian Forest Service, Pacific
Forestry Centre, Information Report BC-X-399, Victoria,
British Columbia.
Taylor, S. W., A. L. Carroll, R. I. Alfaro, and L. Safranyik. 2006.
Forest climate and mountain pine beetle outbreak dynamics in
western Canada. Pp. 67–94 in T. L. Shore, J. E. Brooks, J. E.
Stone, eds. Mountain pine beetle symposium: challenges and
solutions. Report BC-X-399, Canadian Forest Service, Pacific
Forestry Centre, Victoria, British Columbia.
Wang, I. J. 2010. Recognizing the temporal distinctions between
landscape genetics and phylogeography. Mol. Ecol.
19:2605–2608.
Zink, R. M., and G. F. Barrowclough. 2008. Mitochondrial DNA
under siege in avian phylogeography. Mol. Ecol. 17:2107–2121.
Supporting Information
Additional Supporting Information may be found online onWiley Online Library.
Figure S1. Maximum-likelihood tree generated using PhyML3.0 (Guindon and Gascuel 2003) for Dendroctonus ponderosaeacross western North America with D. jeffreyi as the outgroup.
Please note: Wiley-Blackwell is not responsible for the contentor functionality of any supporting materials supplied by theauthors. Any queries (other than missing material) should bedirected to the corresponding author for the article.
c© 2012 The Authors. Ecology and Evolution published by Blackwell Publishing Ltd. 919