Embed Size (px)
Citation preview

Copyright © 2015 IJAIR, All right reserved 1768
International Journal of Agriculture Innovations and Research
Volume 3, Issue 6, ISSN (Online) 2319-1473
Phylogenetic Relationship among the Wild Rice [Oryza
rufipogon Griff.] of NBU Campus and Cultivated Rice as
Revealed by Chloroplast matK Gene
Subhas Chandra Roy Plant Genetics & Molecular Breeding Laboratory
DRS Department of Botany, University of North Bengal, PO- NBU, Siliguri-734013, West Bengal, India. Email: [email protected]
Abstract – Genetic variation and phylogenetic relationship
was carried out in Asian common wild rice and cultivated
rice using chloroplast matK gene sequence information. The
matK gene was PCR amplified from Asian common wild rice
(Oryza rufipogon Griff.) of NBU campus using specific
primer and sequenced based on Sanger method. The matK
gene sequence of 1420 bp was deposited in the NCBI
GenBank with Accession No-KM516199. Fifteen others
matK sequences were retrieved from NCBI Genbank and
analysed for phylogenetic relationship using bioinformatics
algorithm. All the matK sequences are aligned in ClustalX2
and aligned sequence fragments were 1201 with 7.09%
variable and 4.79% phylogenetically informative sites and
the estimated transition/transversion bias (R) was 1.65.
Substitution pattern and rates were estimated under the
Kimura (1980) 2-parameter model in MEGA6. Sites with
alignment gaps or missing data was 20, invariable
(monomorphic) sites 1034, variable (polymorphic) sites 147,
total number of mutations was 154, singleton variable sites
112, and parsimony informative sites 35 analyzed in DNAsp
v.5 program. Number of haplotypes h- 14, haplotype (gene)
diversity, Hd: 0.983, variance of haplotype diversity: 0.00077,
standard Deviation of Haplotype diversity: 0.028, Nucleotide
diversity, Pi: 0.02352. Haplotypes of cultivated rice and crop
wild relatives (AA genome) were more similar than those of
distantly related species (BB, CC/DD, EE and GG genomes).
It observed that the EE genome species is most closely related
to the CC genome and CCDD genomes but BBCC genome
species had different origins. Their maternal parents had
either the BB or CC genome. The CpG rich matK sequences
were rich in AA genome followed in BB, BBCC and EE, FF
genotypes, whereas CpA rich sequences belonged to AA
genome and in out group E. longifolia (unknown genome).
The nucleotide frequencies are 30.12% (A), 35.72% (T/U),
17.60% (C), and 16.57% (G). The transition/transversion
rate ratios are k1 = 3.379 (purines) and k2 = 3.465
(pyrimidines). The overall transition/transversion bias is R =
1.65, where R = [A*G*k1 + T*C*k2]/[(A+G)*(T+C)].
Maximum likelihood estimate of transition/transversion bias
was estimated in MEGA6. The estimated Transition/
Transversion bias (R) is 1.65. Substitution pattern and rates
were estimated under the Kimura (1980) 2-parameter model
(Kimura 1980). For estimating ML values, a tree topology
was automatically computed. The maximum Log likelihood
for this computation was -3109.393 (MEGA6).
Keywords – Rice, Oryza Species, Oryza rufipogon, matK
Gene, Phylogeny, Variation.
I. INTRODUCTION
The genus Oryza (Poaceae) includes 2 cultivated species, (Oryza glaberrima Steud. and O. sativa L.) and 22
wild species. O. glaberrima is restricted only Western Africa, but O. sativa is cultivated globally [1] due to its wide adaptability to different habitats and growing conditions. The species sativa can be grouped into two subspecies, Oryza sativa ssp. japonica and Oryza sativa
ssp. indica, based on a number of physiological and morphological traits [2]. Oryza sativa L., represents the world’s most important staple food crop, feeding more than half of the human population (supplying 20% of the world’s total caloric intake). Despite this essential role in world agriculture, the history of cultivated rice’s domestication from its progenitors (ancestors) and evolutionary pathways remains unclear. The diversity and phylogeny of rice species have been investigated using the nuclear, chloroplast and mitochondrial genomes using several techniques [3, 4, 5, 6], but the origin of many cultivars still remains unsolved. Phylogeographic studies indicate that India and Indochina may represent the center of diversity of one of the 22 wild rice species O. rufipogon
Griff. This wild rice species, O. rufipogon, grows across this entire range. O. sativa L. and O. rufipogon Griff. shares the similar vegetative growth and other eco-geographical parameters including the same AA genome and is widely recognized as a progenitor of cultivated rice (O. sativa L) [7-8]. O. rufipogon is a perennial species and cultivated rice is an annual species, it has been proposed that the annually occurring form of O. rufipogon, Oryza
nivara [9], may represent the most recent ancestor of O.
sativa. These wild species are the reservoirs of many useful genes/QTLs particularly for resistance to major biotic and abiotic stresses [1, 10]. The rice genus, Oryza, consists of approximately 24 species distributed in Asia, Africa, Australia and the Americas. All species have been classified into six diploid genome types (AA, BB, CC, EE, FF and GG) and four tetraploid genome types (BBCC, CCDD, HHJJ and HHKK) based on chromosome pairing in F1 hybrids between different taxa [11]. The most common AA genome group includes the cultivated rice species of Asian (O. sativa), African (O. glaberrima), Australian (O. meridionalis) origins, while the other types belong to wild species. It needs immediate attention with high priority so that we could not loss this agriculturally important Oryza genepool. A 'barcode' gene that can be used to distinguish between the majorities of plant species on Earth has been identified. DNA barcoding involves sequencing a standard region of DNA as a tool for species identification. However, there has been no agreement on which region(s) should be used for barcoding land plants. The chloroplast maturase K gene (matK) is one of the
Manuscript Processing Details (dd/mm/yyyy) :Received : 20/06/2015 | Accepted on : 25/06/2015 | Published : 29/06/2015
Copyright © 2015 IJAIR, All right reserved 1769
International Journal of Agriculture Innovations and Research
Volume 3, Issue 6, ISSN (Online) 2319-1473
most variable coding genes of angiosperms and has been suggested to be a “barcode” for land plants. DNA barcoding, a concept that has recently become popular, is characterized by using one or a few DNA fragments to identify different species [12]. The mitochondrial cytochrome c oxidase subunit 1 (CO1) gene was selected to be a DNA barcode for animal species [13]. Among the candidate barcode genes, matK is one of the most promising candidates for a plant barcode. The matK gene is approximately 1570 bp in length and codes for a maturase protein. The rate of substitution in matK is three times higher at the nucleotide level and is six times higher at the amino acid level than that of rbcL, denoting it as a fast or rapidly evolving gene. The accelerated rate of amino acid substitution in matK is due to almost even distribution of substitution rates among the three codon positions compared with most protein-coding genes where the rates are skewed toward the third codon position. The coding region of matK is generally located within an intron of the chloroplast trnK gene. In plant systematics, matK has recently emerged as an invaluable gene because of its high phylogenetic signal compared with other genes used in this field [14].
The chloroplast genome is a useful subject for evolutionary and phylogenetic study as it is mostly conserved, has without recombination, haploid, maternally inherited, and present in multiple copies per cell [15]. The matK gene has been used effectively for phylogenetic studies at different taxonomic levels in different plant groups [16-17] including Oryza [18]. In this present study, the phylogenetic relationship between wild rice of NBU campus and other Oryza species (those were retrieved from NCBI Genbank) were analysed based on matK gene sequences.
II. MATERIALS AND METHODS
Plant material Asian common wild rice [Oryza rufipogon Griff.] was
naturally growing in the campus of the University of North Bengal (NBU), which is located at Latitude of 26º 84 North and Longitude of 88º 44 East, near Siliguri, Dist- Darjeeling, WB, India.
Genomic DNA extraction and purification Tender soft leaf tissue (1gm) of wild rice (Oryza
rufipogon) was placed in pre-cooled mortar and pestle and crushed with liquid Nitrogen (LN2) to make dusty powder. Taken whole powdery dust in a 15 ml centrifuge tube, added 3.5 ml of extraction buffer (15% sucrose, 50 mM Tris-HCl-pH 8.0, 10% SDS, 50 mM EDTA-pH8.0, and 250mM NaCl), homogenized using a pestle and incubated in water bath at 37˚C for 30 min. After incubation, 2 ml of CTAB buffer (20 mM Tris-HCl -pH 8.0, 10 mM EDTA-pH 8.0, 8 % CTAB, 4% PVP) and 50 μl of Proteinase k (10 mg/ml) were added, incubated at 65˚C for 1 h and centrifuged at 12,000 xg for 10 minutes. The supernatant was transferred into a fresh tube and treated with equal volume Phenol: Chloroform: Isoamyl (PCI), mixed gently by inverting the tube for 2 to 3 minutes, centrifuged at 10,000 x g for 10 minutes, and the supernatant transferred
into a fresh tube. PCI treatment was repeated, 20 mg/ml (25 μl) of RNase was added, and the tube incubated at 37˚C for 30 min. PCI treatment was done for a third time, the tube centrifuged at 10,000Xg for 10 min and the supernatant transferred into a fresh tube. Added 1/10 volume of 3 M Sodium Acetate (pH 5.2) and then double volume of ice cold isopropanol and stored at -20˚C over-night for DNA precipitation followed by Centrifugation at 10,000 rpm for 10 min. The DNA pellet was spooled out with the forceps and washed with 70% ethanol twice and was air dried properly. The pellet was dissolved with 200 μl of TE buffer (10 mM Tris-pH 8.0, 1 mM EDTA-pH 8.0) for future use. Quality of purified DNA was checked by running in 1% agarose gel electrophoresis and UV-vis spectrophotometric reading at 260 nm and 280 nm. The ratio >1.8 at 280/260 reading was considered good for PCR amplification.
Amplification of matK gene in PCR Specific primers for matK was employed for gene
amplification - matK Xf 5’- TAATTTACGATCAATTCATTC-3’ and matK-MALP 5’-ACAAGAAAGTCGAAGTAT-3’.
The 25 μl of PCR reaction mixture consisted of 1X Taq buffer, 250 μmM dNTPs, and 4.5 pmol each primer, 1U Taq DNA polymerase (Promega), and 50-100 ng template DNA. Thermal cycling conditions were as follows: 98◦C for 45 s, followed by 35 cycles of 98◦C for 30 s, 54◦C for 30 s, 72◦C for 40 s, and a final extension at 72◦C for 10 min. The PCR products were verified by electrophoresis in 1% agarose gel stained with ethidium bromide. One specific band was recorded at 1420 bp on the gel. Amplification was carried out on MJ Mini Gradient Thermal Cycler (BioRad, USA). The PCR products were sent to the SciGenom Pvt. Ltd, Cochin, Kerala, India for sequencing based on Sanger method after simple purification.
Fifteen matK sequence retrieved from NCBI and
aligned using ClustalX2 DNA sequences of amplified matK gene was compared
with NCBI database through BLAST algorithm and matched with maturase (matK) gene of chloroplast of wild rice Oryza rufipogon Griff. Partial matK gene sequence (1420 bp) was annotated and submitted into the GenBank of NCBI and allotted GenBank accession no. KM516199. Other fifteen matK gene sequences of Oryza species were retrieved from GenBank (Table 1) belonging to different genome (AA, BB, CCDD, EE, FF, HHJJ). Multiple sequence alignment of all these sequences including matK gene sequence of NBU wild rice were first aligned using ClustalX 2.0.11 [19]. The variability of the aligned sequences was evaluated using the sliding window method in DNAsp ver. 5.10 [20]. The window length was set to greater than 1000 bp for present analysis. Only a number of polymorphic sites were considered for present analysis. The regions were identified according to the original annotations, then extracted and compared among the genera after precise alignments. Nucleotide and Amino acid divergence and genetic distances [21] were calculated by MEGA-6. The variable substitution rate over site was calculated by the formula: The variability at site ‘i’ is
Copyright © 2015 IJAIR, All right reserved 1770
International Journal of Agriculture Innovations and Research
Volume 3, Issue 6, ISSN (Online) 2319-1473
measured by the entropy (or information), where ‘j’ = 1, 2, 3, 4 corresponding to nucleotide A, C, G and T, and ‘pj’ is the proportion of nucleotide ‘j’ at site ‘i’. If all nucleotides at site ‘i’ are identical, then ‘Hi’ = 0. Substitutions will lead to polymorphic sites at which the ‘H’ value will be larger than 0. It is ‘Hi’ that is plotted over sites [22] (DAMBE 5.327). The transition and transversion ratio was calculated by MEGA-6 [23] and the number of transitions and transversions versus divergence and display of substitution saturation and CpG, TpG, CpA value was respectively plotted and calculated by DAMBE 5.327 [22].
Phylogenetic analysis Maximum-parsimony analysis of the coding data set of
sixteen Oryza species with Ehrharta longifolia as out-group was conducted in MEGA6 [23] phylogenetic software. Each character was equally weighted, and heuristic search with 50 repetitions and TBR, stepwise addition was used in the search for most parsimonious trees. The sequence data were also analyzed with a neighbor-joining (NJ) method using the Juke-Cantor and Kimura two parameter distance estimates [21, 24].
III. RESULTS AND DISCUSSION
Sequence characteristics All the matK sequences of 16 Oryza species were
aligned in ClustalX2 software and analysed with DNAsp and DAMBE program for data analyses. Figure 1 shows that substitutions of all the three codons can be easily fitted to a two different straight lines, indicating that they are unsaturated. To understand the necessity and usefulness of the weighting, it is estimated the relative frequencies of transitions and transversions using ML composite Tamura-Nei parameter distance method (ML-CompositeTN93). It was observed that the number of observed transitions relative to that of transversions gradually decreased with increasing divergence while run in DAMBE software [22]. Variable and conservative sequence segment are estimated using DAMBE program and represented in figure 2 and 3.
Fig.1. Transition and transversion versus divergence of
sixteen matK gene sequence of Oryza species. Here ‘xS’ represent Transition rate and ‘∆ V’ represent Transversion rate. The number of observed transitions relative to that of
transversion gradually decreases with increasing divergence. A plot of the number of transtitions and
transversions versus divergence are displayed in this figure (DAMBE 5.327).
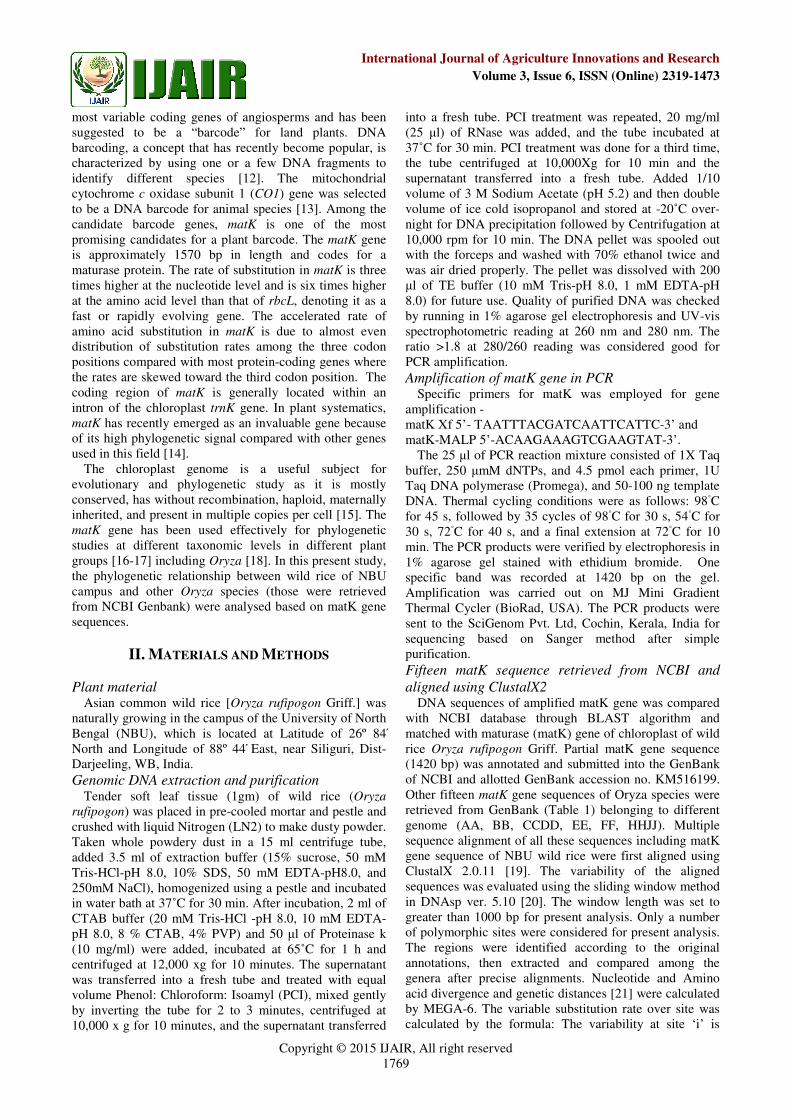
Fig.2. Variable substitution rate over sites, the plot shows visually which sequence segments are conservative and
which are variable; the sharp pick represents variable sites (DAMBE 5.327).
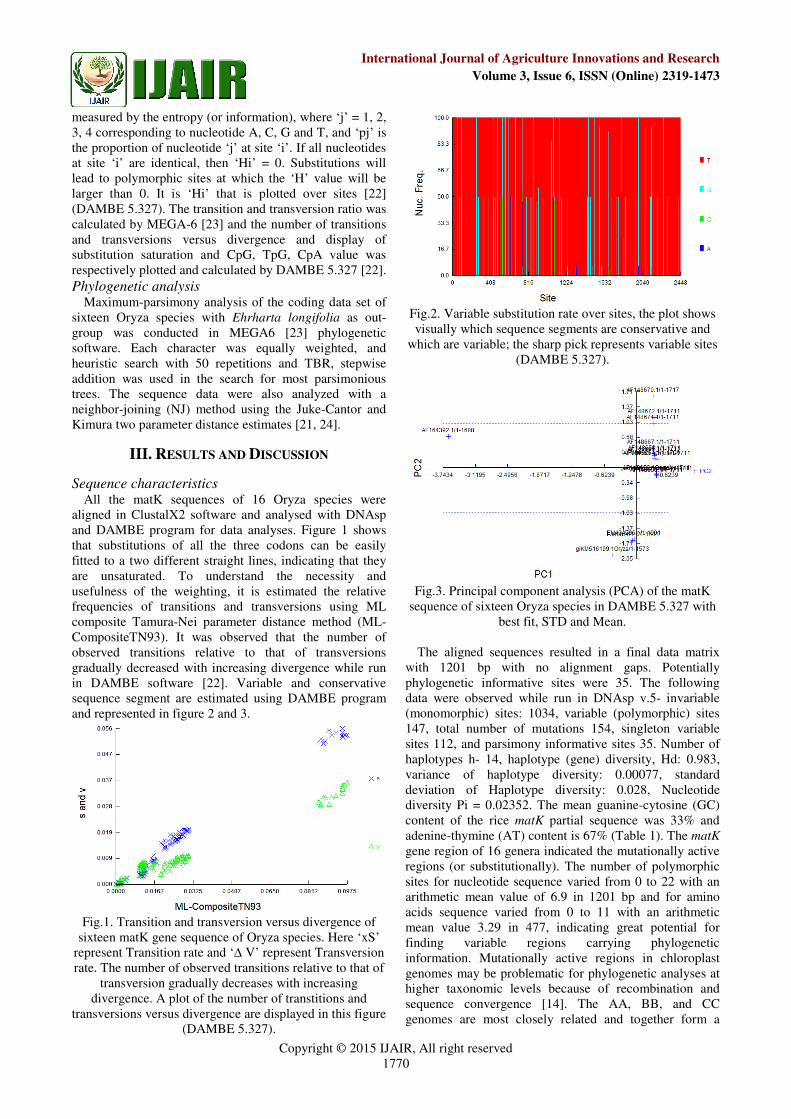
Fig.3. Principal component analysis (PCA) of the matK
sequence of sixteen Oryza species in DAMBE 5.327 with best fit, STD and Mean.
The aligned sequences resulted in a final data matrix
with 1201 bp with no alignment gaps. Potentially phylogenetic informative sites were 35. The following data were observed while run in DNAsp v.5- invariable (monomorphic) sites: 1034, variable (polymorphic) sites 147, total number of mutations 154, singleton variable sites 112, and parsimony informative sites 35. Number of haplotypes h- 14, haplotype (gene) diversity, Hd: 0.983, variance of haplotype diversity: 0.00077, standard deviation of Haplotype diversity: 0.028, Nucleotide diversity Pi = 0.02352. The mean guanine-cytosine (GC) content of the rice matK partial sequence was 33% and adenine-thymine (AT) content is 67% (Table 1). The matK
gene region of 16 genera indicated the mutationally active regions (or substitutionally). The number of polymorphic sites for nucleotide sequence varied from 0 to 22 with an arithmetic mean value of 6.9 in 1201 bp and for amino acids sequence varied from 0 to 11 with an arithmetic mean value 3.29 in 477, indicating great potential for finding variable regions carrying phylogenetic information. Mutationally active regions in chloroplast genomes may be problematic for phylogenetic analyses at higher taxonomic levels because of recombination and sequence convergence [14]. The AA, BB, and CC genomes are most closely related and together form a
Copyright © 2015 IJAIR, All right reserved 1771
International Journal of Agriculture Innovations and Research
Volume 3, Issue 6, ISSN (Online) 2319-1473
sister group with the DD genome. This monophyletic group, containing the AA through EE genomes, corresponds to section Oryza. The GG genome, which occupies the most basal position of the genus, constitutes O. granulata and O. meyeriana. The HHJJ genome types that are included in O. ridleyi, however, form a monophyletic group in the phylogenetic hypothesis (Figure 4) [25]. The AA genome, which contains cultivated rice, is one of the most recently diverged lineages within the rice genus (Figure 4). The AA genome contains the maximum number of diploid species and is geographically the most cultivated rice genome. The relationships within the AA genome show that the widely cultivated species O. sativa is most closely related to two wild species distributed in Asia, O. nivara and O.
rufipogon, supporting the previous hypothesis of an Asian origin of O. sativa ([26],[7]. Asian wild rice O. rufipogon /
O. nivara clustered in the same group with almost all Asian cultivated O. sativa with high bootstrap. The African cultivated species, O. glaberrima, is most closely related to the African wild species, O. longistaminata and Asian O. nivara, as well as O. glumaepatula and O.
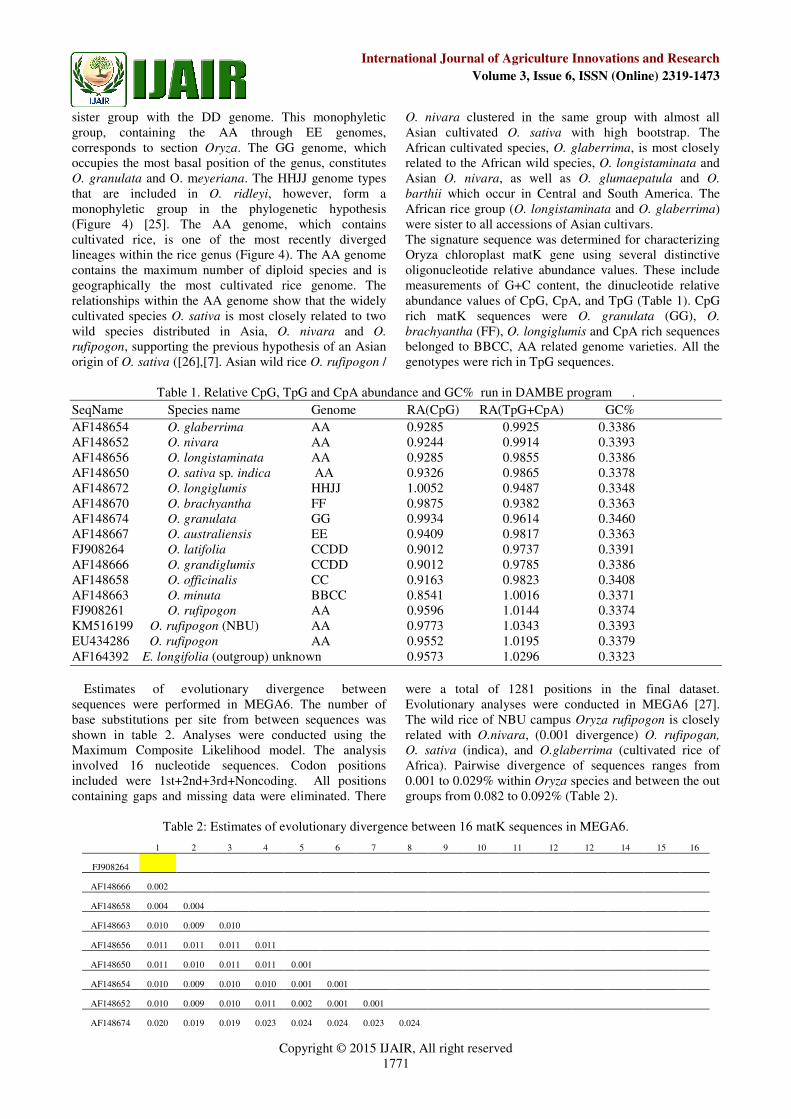
barthii which occur in Central and South America. The African rice group (O. longistaminata and O. glaberrima) were sister to all accessions of Asian cultivars. The signature sequence was determined for characterizing Oryza chloroplast matK gene using several distinctive oligonucleotide relative abundance values. These include measurements of G+C content, the dinucleotide relative abundance values of CpG, CpA, and TpG (Table 1). CpG rich matK sequences were O. granulata (GG), O.
brachyantha (FF), O. longiglumis and CpA rich sequences belonged to BBCC, AA related genome varieties. All the genotypes were rich in TpG sequences.
Table 1. Relative CpG, TpG and CpA abundance and GC% run in DAMBE program .
SeqName Species name Genome RA(CpG) RA(TpG+CpA) GC%
AF148654 O. glaberrima AA 0.9285 0.9925 0.3386 AF148652 O. nivara AA 0.9244 0.9914 0.3393 AF148656 O. longistaminata AA 0.9285 0.9855 0.3386 AF148650 O. sativa sp. indica AA 0.9326 0.9865 0.3378 AF148672 O. longiglumis HHJJ 1.0052 0.9487 0.3348 AF148670 O. brachyantha FF 0.9875 0.9382 0.3363 AF148674 O. granulata GG 0.9934 0.9614 0.3460 AF148667 O. australiensis EE 0.9409 0.9817 0.3363 FJ908264 O. latifolia CCDD 0.9012 0.9737 0.3391 AF148666 O. grandiglumis CCDD 0.9012 0.9785 0.3386 AF148658 O. officinalis CC 0.9163 0.9823 0.3408 AF148663 O. minuta BBCC 0.8541 1.0016 0.3371 FJ908261 O. rufipogon AA 0.9596 1.0144 0.3374 KM516199 O. rufipogon (NBU) AA 0.9773 1.0343 0.3393 EU434286 O. rufipogon AA 0.9552 1.0195 0.3379
AF164392 E. longifolia (outgroup) unknown 0.9573 1.0296 0.3323
Estimates of evolutionary divergence between
sequences were performed in MEGA6. The number of base substitutions per site from between sequences was shown in table 2. Analyses were conducted using the Maximum Composite Likelihood model. The analysis involved 16 nucleotide sequences. Codon positions included were 1st+2nd+3rd+Noncoding. All positions containing gaps and missing data were eliminated. There
were a total of 1281 positions in the final dataset. Evolutionary analyses were conducted in MEGA6 [27]. The wild rice of NBU campus Oryza rufipogon is closely related with O.nivara, (0.001 divergence) O. rufipogan,
O. sativa (indica), and O.glaberrima (cultivated rice of Africa). Pairwise divergence of sequences ranges from 0.001 to 0.029% within Oryza species and between the out groups from 0.082 to 0.092% (Table 2).
Table 2: Estimates of evolutionary divergence between 16 matK sequences in MEGA6.
1 2 3 4 5 6 7 8 9 10 11 12 12 14 15 16
FJ908264
AF148666 0.002
AF148658 0.004 0.004
AF148663 0.010 0.009 0.010
AF148656 0.011 0.011 0.011 0.011
AF148650 0.011 0.010 0.011 0.011 0.001
AF148654 0.010 0.009 0.010 0.010 0.001 0.001
AF148652 0.010 0.009 0.010 0.011 0.002 0.001 0.001
AF148674 0.020 0.019 0.019 0.023 0.024 0.024 0.023 0.024

Copyright © 2015 IJAIR, All right reserved 1772
International Journal of Agriculture Innovations and Research
Volume 3, Issue 6, ISSN (Online) 2319-1473
AF148667 0.010 0.009 0.010 0.014 0.016 0.015 0.014 0.014 0.021
AF148672 0.024 0.024 0.023 0.027 0.029 0.028 0.027 0.028 0.021 0.026
AF148670 0.022 0.021 0.021 0.025 0.028 0.027 0.027 0.027 0.017 0.022 0.021
FJ908261 0.011 0.010 0.110 0.011 0.001 0.001 0.001 0.001 0.024 0.015 0.028 0.027
KM516199 0.010 0.009 0.010 0.010 0.001 0.001 0.001 0.001 0.023 0.014 0.027 0.027 0.001
EU434286 0.011 0.011 0.011 0.011 0.001 0.001 0.001 0.002 0.023 0.016 0.027 0.028 0.001 0.001
AF164392 0.085 0.082 0.083 0.091 0.093 0.092 0.091 0.091 0.087 0.084 0.089 0.087 0.092 0.091 0.091
Table 3: Maximum composite likelihood estimate of the
pattern of nucleotide substitution.
A T C G
A - 6.58 3.24 10.32
T 5.55 - 11.24 3.05
C 5.55 22.81 - 3.05
G 18.76 6.58 3.24 -
For simplicity, the sum of r values is made equal to 100.
Rates of different transitional substitutions are shown in bold and those of transversionsal substitutions are shown in italics (Table 3). The nucleotide frequencies are 30.12% (A), 35.72% (T/U), 17.60% (C), and 16.57% (G). The transition/transversion rate ratios are k1 = 3.379 (purines) and k2 = 3.465 (pyrimidines). The overall transition/ transversion bias is R = 1.65, where R = [A*G*k1 + T*C*k2]/[(A+G)*(T+C)]. The analysis involved 16 nucleotide sequences. Codon positions included were 1st+2nd+3rd+Noncoding. All positions containing gaps and missing data were eliminated. There were a total of 1419 positions in the final dataset. Evolutionary analyses were conducted in MEGA6. Maximum likelihood estimate of transition/transversion bias was estimated in MEGA6. The estimated Transition/Transversion bias (R) is 1.65. Substitution pattern and rates were estimated
under the Kimura (1980) 2-parameter model [28]. For estimating ML values, a tree topology was automatically computed. The maximum Log likelihood for this computation was -3109.393. The analysis involved 16 nucleotide sequences. All positions containing gaps and missing data were eliminated. There were a total of 1419 positions in the final dataset. Evolutionary analyses were conducted in MEGA6. Tajima’s neutrality test was performed and showed the following estimation (Table 4) [29].
Table 4: Results from Tajima's Neutrality Test [Tajima, 1989][30]
m S ps Θ π D
16 170 0.119803 0.036104 0.022252 -1.668270
NOTE:- The analysis involved 16 nucleotide sequences. Codon positions included were 1st+2nd+3rd+Noncoding. All positions containing gaps and missing data were eliminated. There were a total of 1419 positions in the final dataset. Evolutionary analyses were conducted in MEGA6.
Abbreviations: m = number of sequences, n = total number of sites, S = Number of segregating sites, ps = S/n, Θ = ps/a1, π = nucleotide diversity, and D is the Tajima test statistic [29]).
AF148656.1/44-1961
EU434286.1/9-2151
AF148650.1/44-1961
FJ908261.1/7-1893
AF148652.1Oryza/44-1961
giAF148654.1Oryza/44-1961
giKM516199.1Oryza/1-1823
AF148663.1Oryza/44-1961
AF148658.1/44-1961
FJ908264.1/42-1959
AF148666.1/44-1961
AF148667.1/44-1961
AF148672.1/44-1961
AF148674.1/44-1961
AF148670.1/44-1967
AF164392.1/1-1938
10 Fig.4. The evolutionary history was inferred using the maximum parsimony method of sixteen matK gene sequences of
Oryza species.
Copyright © 2015 IJAIR, All right reserved 1773
International Journal of Agriculture Innovations and Research
Volume 3, Issue 6, ISSN (Online) 2319-1473
Phylogenetic analysis The evolutionary history was inferred using the
maximum parsimony method. The consensus tree inferred from 9 most parsimonious trees is shown (Figure 4). Branches corresponding to partitions reproduced in less than 50% trees are collapsed. The consistency index is 0.913265 (0.721311), the retention index is 0.854701 (0.854701), and the composite index is 0.780569 (0.616506) for all sites and parsimony-informative sites (in parentheses). The MP tree was obtained using the Subtree-Pruning-Regrafting (SPR) algorithm with search level 0 in which the initial trees were obtained by the random addition of sequences (10 replicates). The tree is drawn to scale; with branch lengths calculated using the average pathway method and are in the units of the number of changes over the whole sequence. The analysis involved 16 nucleotide sequences. Codon positions included were 1st+2nd+3rd+Noncoding. All positions containing gaps and missing data were eliminated. There were a total of 1419 positions in the final dataset. Evolutionary analyses were conducted in MEGA6. The topology of the ingroup (all Oryza species) was exactly same when Ehrharta longifolia was specified as out-groups. The analysis using genetic distances, maximum likelihood and maximum parsimony all resulted in very similar trees. Same result was estimated by Doris et al [31]. The most parsimonious tree of Oryza species based on matK sequence is shown in Figure 4. All Oryza species groups were clearly distinguished. The species belonging to the Oryza AA genome group clustered together and were separated from those belonging to the other genome groups (BB, BBCC, CC/CCDD, EE, GG, HHJJ and FF). All rice species within CCDD genome formed a monophyletic group. The BB and BBCC genome are closely related to the AA genome [5]. According to the cross-ability between O. sativa and other rice species from other genome types, the wild species have been categorized as the primary, secondary, and tertiary gene pools for the cultivars [7].
IV. CONCLUSION
Asian common wild rice of NBU campus [Oryza
rufipogon Griff.] is unique of its genotypes and can be identified based on matK gene sequence of 1420 bp. The wild rice of NBU campus Oryza rufipogon is closely related with O.nivara, (0.001 divergence) O. rufipogan,
O. sativa (indica), and O.glaberrima (cultivated rice of Africa). Pairwise divergence of sequences ranges from 0.001 to 0.029% within Oryza species and between the out groups from 0.082 to 0.092%. The estimated Transition/Transversion bias (R) is 1.65. Substitution pattern and rates were estimated under the Kimura (1980) 2-parameter model. The AA genome, which contains cultivated rice, is one of the most recently diverged lineages within the rice genus. The AA genome contains the maximum number of diploid species and is geographically the most cultivated rice genome. The relationships within the AA genome show that the widely cultivated species O. sativa is most closely related to two
wild species distributed in Asia, O. nivara and O.
rufipogon, supporting the previous hypothesis of an Asian origin of O. sativa. Asian wild rice O. rufipogon of NBU campus along with O. nivara clustered in the same group with almost all Asian cultivated O. sativa with high bootstrap in the present study.
REFERENCES [1] L. P. Sanchez, Rod A Wing and D.S. Brar (2013). The wild
relatives of rice: genomes and genomics. In, Zhang Q and RA Wing (eds), Genetics and genomics of rice, Plant genetics and genomics: Crops and model 5, Springer, NY, pp 9-25.
[2] H. I. Oka (1998). Origin of cultivated rice. Developments in Crop Science 14, Tokyo, Japan Scientific Societies Press, Japan.
[3] S. R. Prashanth, M. Parani, B.P. Mohanty, V. Talame, R. Tuberosa and A. Parida (2001). Genetic diversity in cultivars and landraces of sativa subsp.revealed by AFLP markers. Genome, 44(3): 476-494.
[4] G. C. Buso, P.N. Rangel and M.E. Ferreira (2001). Analysis of random and specific sequences of nuclear and cytoplasmic DNA in diploid and tetraploid American wild rice species (Oryza
spp.). Genome, 44: 476-494. [5] T. Nishikawa, A. Duncan, A.Vaughan and K. Kadowaki (2005).
Phylogenetic analysis of Oryza species, based on simple sequence repeats and their flank-ing nucleotide sequences from the mitochondrial and chloroplast genomes. Theor Appl Genet, 110: 696-705.
[6] K. Shirasawa, L. Monna, S. Kishitani and T. Nishio (2004). Single nucleotide polymorphisms in randomly selected genes among japonica Rice (Oryza sativa L.) varieties identified by PCR-RF-SSCP. DNA Research, 11: 275-283.
[7] G.S. Khush (1997). Origin, dispersal, Cultivation & variation of rice. Plant molecular biology, 35: 25-34.
[8] J. P. Londo et al (2006). Phylogeography of Asian wild rice, Oryza rufipogon, reveals multiple independent domestications of cultivated rice, Oryza sativa. Pros Nat Acad Sci USA, 103: 9578–9583.
[9] Sharma and Shastry (1965). Taxonomic studies in the genus Oryza L. III. O. rufipogon Griff. sensu stricto and O. nivara
Sharma et Shastry nom. Nov. Indian J Genet Plant Breed, 25: 157–167.
[10] J. Xiao, S. Grandillo, S. N. Ahn et al (1996). Genes from wild rice improve yield. Nature, 384: 223–224.
[11] D.A. Vaughan, H. Morishima and K. Kadowaki (2003). Diversity in the Oryza genus. Current Opinion in Plant Biology, 6: 1-8.
[12] W. J. Kress, K. J. Wurdack, E. A. Zimmer, L. A. Weigt, D. H. Janzen (2005). Use of DNA barcodes to identify flowering plants. Proceedings of the National Academy of Sciences USA, 102: 8369–8374.
[13] P. D. N. Hebert, A. Cywinska, S. L. Ball, J. R. De Waard (2003). Biological identifications through DNA barcodes. Proceedings of the Royal Society B: Biological Sciences, 270: 313–321.
[14] K. Muller (2006). Incorporating information from length-mutational events into phylogenetic analysis. Molecular Phylogenetics and Evolution, 38: 667-676.
[15] N. Fujii, N. Tomaru, K. Okuyama, T. Koike, T. Mikami and K. Ueda (2001). Chloroplast DNA phy-logeography of Fagus crenata (Fagaceae) in Japan. Plant Syst. Evolution, 232: 21-33.
[16] K.W. Hilu and H. Liang (1997). The matK gene: sequence variation and application in plant systematics. American Journal of Botany, 84: 830-839.
[17] R.G. Olmstead, and J.D. Palmer (1994). Chloroplast DNA systematics: a review of methods and data analysis. American Journal of Botany, 81: 1205-1224.
[18] K.W. Hilu, L. A. Alice and H. Liang (1999). Phylogeny of Poaceae inferred from matK sequences. Annals of Missouri Botanical Garden, 86:835-851.
[19] M.A. Larkin, G. Blackshields, N. P. Brown, R. Chenna and P.A. McGettigan (2007). Clustal W and clustal X version 2.0. Bioinformatics, 23: 2947-2948.
Copyright © 2015 IJAIR, All right reserved 1774
International Journal of Agriculture Innovations and Research
Volume 3, Issue 6, ISSN (Online) 2319-1473
[20] J. Rozas, J. C. Sanchez-DelBarrio, X. Messeguer and R. Rozas (2003). DnaSP, DNA polymorphism analyses by the coalescent and other methods. Bioinformatics, 19: 2496-2497.
[22] X. Xia and Z. Xie (2001). DAMBE: Software Package for Data Analysis in Molecular Biology and Evolution. The American Genetic Association, 371-373.
[23] K. Tamura, G. Stecher, D. Peterson, A. Filipski, and S. Kumar (2013). MEGA6: Molecular Evolutionary Genetics Analysis version 6.0. Molecular Biology and Evolution, 30: 2725-2729.
[24] M. Saitoun, and Nei M (1987). The neighbor-joining method: a new method for reconstruction phylogenetic trees. Molecular Biology and Evolution, 4: 406- 425.
[25] T. Sang, D. J. Crawford and T. F. Stuessy (1997). Chloroplast DNA phylogeny, reticulate evolution and biogeography of Paeonia (Paeoniaceae). American Journal of Botany, 84: 1120-1136.
[26] D. A. Vaughan (1994). The wild relatives of rice: a genetic resources Handbook. IRRI, Manila, p 137.
[27] K. Tamura, M. Nei and S. Kumar (2004). Prospects for inferring very large phylogenies by using the neighbor-joining method. Proceedings of the National Academy of Sciences (USA), 101:11030-11035.
[28] M. Kimura (1980). A simple method for estimating evolutionary rate of base substitutions through comparative studies of nucleotide sequences. Journal of Molecular Evolution, 16:111-120.
[29] M. Nei and S. Kumar (2000). Molecular Evolution and Phylogenetics. Oxford University Press, New York.
[30] F. Tajima (1989). Statistical methods to test for nucleotide mutation hypothesis by DNA polymorphism. Genetics, 123: 585-595.
[31] Zodinpuii Doris, Souvik Ghatak, Subhajit Mukherjee and Nachimuthu Senthil Kumar (2013). Genetic relatedness of genus Oryza from Eastern Himalayan region as revealed by chloroplast matK gene. Asian Journal of Conservation Biology, 2: 144–151.
AUTHOR'S PROFILE
Dr. Subhas Chandra Roy M.Sc (Bot); M.Tech (Biotechnology), PhD, Associate Professor, Plant Genetics & Molecular
Breeding Laboratory, Department of Botany, University of North Bengal, PO-NBU, Siliguri-734013, WB, India. I have worked as Sr. Research Assistant, CSR&TI, Central Silk Board, Govt. of
India, Berhampur, WB. Then joined in West Bengal Education Service (WBES) as Lecturer in Botany, PG Department of Botany, Darjeeling Govt. College, WB. Now I am working with the University of North Bengal since 2006. My present research interest is in molecular breeding and genome analysis of rice for the crop improvement. I have visited International Rice Research Institute (IRRI), Manila, Philippines w.e.f 19-09-11 to 30-09-2011and participated in the training course of Molecular Breeding in Rice. Recently I attended 4th International Rice Congress, in Bangkok, Thailand (October 24-November 1, 2014, at BITECH). Email: [email protected].