Embed Size (px)
Citation preview

ARTICLE IN PRESS
0022-5193/$ - se
doi:10.1016/j.jtb
�CorrespondMaryland, Coll
fax: +1301 314
E-mail addr
shipman@math
Journal of Theoretical Biology 251 (2008) 421–439
www.elsevier.com/locate/yjtbi
Phyllotaxis: Cooperation and competition betweenmechanical and biochemical processes
Alan C. Newella, Patrick D. Shipmanb,c,�, Zhiying Suna
aDepartment of Mathematics, University of Arizona, Tucson, AZ 85721, USAbDepartment of Mathematics, University of Maryland, College Park, MD 20742, USA
cMax Planck Institute for Mathematics in the Sciences, Inselstrasse 22, 04103 Leipzig, Germany
Received 16 May 2007; received in revised form 18 September 2007; accepted 29 November 2007
Available online 8 December 2007
Abstract
Current theories and models of the formation of phyllotactic patterns at plant apical meristems center on either transport of the
growth hormone auxin or the mechanical buckling of the plant tunica. By deriving a continuum approximation of an existing discrete
biochemical model and comparing it with a mechanical model, we show that the model partial differential equations are similar in form.
The implications of this universality in the form of the equations on interpreting the results of simulations are discussed. We develop a
combined model that incorporates the coupling of biochemistry and mechanics. The combined model is accessible to analysis by
reduction to a set of ordinary differential equations for the amplitudes of shapes associated with both the auxin concentration field and
plant surface deformation. Analysis of these amplitude equations reveals the parameter choices under which the two mechanisms may
cooperate in determining the pattern, or under which one or the other mechanism may dominate.
r 2007 Elsevier Ltd. All rights reserved.
Keywords: Phyllotaxis; Auxin; Growth
1. Introduction
Phyllotaxis, namely the arrangement of phylla (leaves,bracts, stickers, florets) on a plant’s surface, has intriguednatural scientists for over 400 years. Pictured in Fig. 1 areexamples of phylla arranged along ridges (Fig. 1(a)) orspirals (Figs. 1(c,d)). Equally impressive are the relatedplanforms of ridges (Fig. 1(a)), hexagons (Fig. 1(b)), ordiamonds (Figs. 1(c,d)) that tile the plant surface.
The challenge is to provide a rational explanation for theformation of such patterns, a mechanism or combinationof mechanisms which capture
�
the phyllotactic configurations and the reasons for theubiquitous presence of Fibonacci sequences in spiralphyllotaxis,e front matter r 2007 Elsevier Ltd. All rights reserved.
i.2007.11.036
ing author at: Department of Mathematics, University of
ege Park, MD 20742, USA. Tel.: +1301 405 5066;
0827.
esses: [email protected] (A.C. Newell),
.umd.edu (P.D. Shipman).
�
the reasons for the various surface tiling shapes, � the connection between the phyllotactic configurationsand the tiling planforms, and � the reasons for, and the nature of, transitions whichoccur in the phyllotactic lattice and planform as a plantgrows in size.Noting that new primordia (when they first form at theshoot apex, phylla are small, undifferentiated bumps onthe surface of the plant called primordia) tend to form inthe most open space available, Hofmeister (1868) formu-lated in 1868 a set of rules governing the formation ofphyllotactic patterns. These rules, modified over a centurylater by Snow and Snow (1952), made no reference to theunderlying mechanism behind the formation of theprimordial bumps, but rather suggested that phyllotaxiscan be understood through simple geometric and kinematiclaws. The work of Levitov (1991a, b) on the positioningof vortices in superconducting lattices and a series ofingeneous and insightful works by Douady and Couder(1996a) (DC), albeit paradigms, pointed to the idea that

ARTICLE IN PRESS
Fig. 1. Examples of various phyllotactic lattice and tiling patterns. Ridges (a), undulating ridges (b), hexagons (c), diamonds (parallelograms) (d) and
offset diamonds (e) are observed on these succulents. In (d) and (e), the phylla are arranged on families of spirals—families of eight clockwise and 13
counterclockwise spirals in (d) and 13 clockwise and 21 counterclockwise spirals in (e).
A.C. Newell et al. / Journal of Theoretical Biology 251 (2008) 421–439422
phyllotactic configurations minimized some appropriatefree energy functional, which in the case of DC wasdesigned to encode the Hofmeister and Snow and Snowrules. As the energy landscape changed with the growingplant, old minima disappeared and new neighboringminima became the new configuration. Many aspects ofphyllotactic behavior were captured by these considera-tions. But not all. The paradigms do not capture ridge-dominated plants (as in Figs. 1(a,b)) or explain thephyllotactic tiling planforms. No physical mechanism forthe formation of primordia is suggested by the DCparadigm.
Biophysical mechanisms involving mechanical pressureas the means by which primordia are produced weresuggested by Schwendener (1909). Similar ideas are presentin the contact pressure models of Airy (1873), Adler (1974),and van Iterson (1907). Within the last 20 years thebiomechanical hypothesis has been developed by Green(1999), Green et al. (1998), Dumais and Steele (2000), andShipman and Newell (2005). Green and colleagues arguedthat plant growth, and in particular differential growthbetween the plant corpus and its tunica (outer skin, a layerabout 1 or 2 cell layers thick), generates compressivestresses in the tunica and leads to buckling of the plantsurface. Experimental backing for this hypothesis includesexperimental evidence in sunflowers that compressivestresses are present in the generative region whereprimordia form (Dumais and Steele, 2000) (althoughearlier experiments in Snow and Snow, 1951 indicated thatthe plant surface is under tension, and an extensive study ofthe stress state of the tunica has not been performed).Additionally, applied mechanical constraints can lead tonew leaves (Green, 1999) or altered planforms (Hernandezand Green, 1993). The mathematical analysis of Green,Steele and Rennich was primarily a linear one, suggestinghow a buckled surface might begin. But, the particularchoice, amongst the set of all possible buckling shapes,manifested by the plant is determined by nonlinearinteractions, and Green’s group was not, apparently,familiar with the seminal work of Koiter (1963) in thatregard. Two novel features of that work, emphasized byShipman and Newell (2004, 2005), are the central rolesplayed both by the quadratic coupling in the nonlinearshell equations and by bias. Quadratic interactions lead
naturally to the addition of the arguments of sinusoidalshapes and in particular this leads to the addition of theinteger circumferential wavenumbers, a necessary albeitnot sufficient, condition for the appearance of Fibonacci,Lucas and double Fibonacci sequences in phyllotacticconfigurations. Bias, called geometric imperfection byKoiter and continuous bifurcation in the mathematicalliterature, is important since primordia are formed in anannular region of the plant’s shoot apical meristem. Onceformed, a primordium moves radially outward into apassive region. It may continue to mature, but it retains itsgeometrical position relative to the set of all otherprimordia. As primordia leave the generative region, newprimordia are formed in their wake. The lattice of newprimordia may be different because the plant has grownand, as we shall see, the plant size is a key parameter indetermining phyllotactic configurations. Nevertheless, theold lattice, located on the outer edge of the active,generative region, still has a role to play. It can influencethe choice of the configuration which follows by preferen-tially amplifying certain members of the new set ofadmissible shapes. This is what we mean by bias. Weintroduced its effect directly into our quantitative formula-tion (Newell and Shipman, 2005) and showed how it playsa crucial role in favoring the Fibonacci sequence overalternatives. The role of the plant’s phyllotactic history inchoosing sequential configurations is also crucial in the DCparadigm.The role of growth in the mechanical models was, for the
most part, passive. To be sure, it was the main reason forthe compressive stress in the tunica which can give rise tothe buckling pattern. The amplitude of this bucklingpattern, however, is of the order of the thickness tunica.Therefore, whereas buckling leads to a template forprimordia, it is growth that leads to the visible primordialbumps and phylla. This growth is postulated to be abiochemical response, perhaps through chemical agentssuch as auxin, to the local stress or curvature inhomogene-ities of the buckled surface (Green, 1999).But chemical models as the initiation mechanism for
phyllotaxis also have a long history. The existence of achemical inhibitor controlling phyllotaxis was proposed bySchoute (1913). Schwabe and Clewer (1984) developed amodel for phyllotaxis based on auxin inhibitors. Veen and

ARTICLE IN PRESSA.C. Newell et al. / Journal of Theoretical Biology 251 (2008) 421–439 423
Lindenmayer (1977) and Meinhardt (1984) included bothactivator and inhibitor molecules in reaction–diffusionmodels. Recent work by the group of Kuhlemeier (Fleminget al., 1997; Reinhardt et al., 2000, 2003; Smith et al., 2006)has made a strong case that the growth hormone auxin andits interaction with the PIN1 transport protein is instru-mental in initiating primordia formation. Their evidenceincludes the following:
1.
Auxin transport proteins are essential for primordiaformation. When Reinhardt et al. (2000) cultivatedshoot apices in the presence of auxin-transport inhibi-tors, the primordia failed to form. Application of auxinto these meristems resulted in the induction ofprimordia at the sites of application.2.
Auxin may regulate the expression of the PIN1transport protein. Vieten et al. (2005) demonstrate that,in the root, PIN proteins are regulated by auxin. Smithet al. (2006) provide evidence for this regulation in theshoot apical meristem.3.
PIN1 is polarized towards incipient primordia. Re-inhardt et al. (2003) show that the PIN1 protein ispolarized towards incipient primordia. As the primor-dia are the locations of higher auxin concentration,Smith et al. hypothesize that the polarization is a resultof the auxin gradient.More discussion of the evidence can be found in Smithet al. (2006). This picture has also been supported bymathematical models (Jonsson et al., 2006; Smith et al.,2006; Barbier de Reuille et al., 2006). A key idea in thechemically driven models is the recognition that a uniformauxin concentration can be unstable. What drives theinstability? The suggestion is that polarized PIN1 mole-cules in the cell walls orient themselves according to localauxin concentration. Moreover, they orient themselves soas to facilitate the transport of auxin with its concentrationgradient, in effect acting like negative diffusion. Thistransport can overcome regular auxin diffusion and leadto an instability which enhances the auxin concentrationat some locations and depletes it in their immediateneighborhoods.
Such a picture suggests that the surface deformations arepassive partners to auxin concentration and are maximalwhere the phylla are located, slaved to the pattern set bythe PIN1-driven uniform auxin concentration instability.Let us emphasize this. The surface deformation of theplant’s tunica which we may consider to be an over-damped, curved elastic sheet, is determined by the stressesit experiences. Part of the stress is supplied by the spatiallyuniform in-surface growth. Another part will be thespatially nonuniform stress distribution triggered by theauxin concentration instability. If the former is not close tothe buckling value, the surface deformation will simply beslaved to the latter, resulting in a surface deformation withits maxima at the auxin fluctuation maxima. But we arguethat there is ample evidence, including analysis of the
relationship between phyllotactic lattice and tiling pattern,to suggest that both mechanisms, auxin/growth localiza-tion and nonuniform stress distribution, may play key rolesin governing phyllotaxis. It may be that in some plants onemechanism dominates. In others, both mechanisms may beimportant. It is certainly well known that they are notindependent. In biological tissues, growth plays a key rolein determining stress distributions (Goriely and Ben Amar,2005a, b) and it is also known (although the relationship isnot well formulated) that stress is key to growth andremodelling (Braam, 2005; Brouzes and Farge, 2004;Shraiman, 2005).It is very important to note that the shapes of primordia
can change as the primorida mature and exit the generativeregion. For example, the primordia of the cactus inFig. 1(b) are hexagonally shaped at initiation. Thesehexagonal shapes evolve into undulating ridges due tosecondary growth. Our model only concerns the initiationof primordia in the generative region. The shapescomputed by our model must therefore be compared withmicroscopic images of primordia in the generative region,and caution must be taken in comparing our model resultsof images of mature phylla as in Fig. 1. However, wesuggest that, even upon initiation in the generative region,primordial patterns may show different tiling shapes even ifthey share the same phyllotactic lattice; see Figs. 6 and 8.Our goal in this paper is to formulate the interactions
and potential competition or cooperation of the twomechanisms. We develop a combined model of stress–strain and growth fields. Through the stress–strain relation-ship, growth gives rise to compressive stress because ofconstraints on strain. This is principally seen in an annularregion near the shoot apical meristem, the generativeregion where primordia are formed. Basically, the tunica inthe generative region cannot expand in the circumferentialdirection. A compressive stress, which may be sufficient toinitiate a buckling of the plant surface, is the result.Further, any growth inhomogeneities initiated by a non-uniform distribution of auxin also leads to correspondinglocal stress changes. On the other hand, stress influencesgrowth and we adopt a very simple model for how it does.What we find is that the two mechanisms largely reinforceeach other. Moreover, we show that when both the PIN1transport coefficient and the circumferential growth-induced stress in the plant’s generative region are nearcritical, the cooperation is very strong. What is exciting isthat it can lead to phyllotactic patterns and surfacedeformation patterns which do not match and looksubstantively different.The outline of this paper is as follows. In Section 2, we
derive a continuum description of the biochemical reac-tion-transport model of Jonsson et al. (2006). We showthat the governing partial differential equation is almostidentical in form to that of the buckling model, and indeedto that governing the behavior of a universal class ofpattern-forming systems. We introduce a useful coordini-zation of the fluctuating fields which is more in tune with

ARTICLE IN PRESSA.C. Newell et al. / Journal of Theoretical Biology 251 (2008) 421–439424
what physicists and chemists use to discuss systems intransition. These coordinates are the amplitudes (the orderparameters) and wavevectors (the active set) of the shapesof competing configurations. They can be expressed interms of phyllotactic coordinates. The order parameters forthe surface deformation and the growth fields, althoughcoupled, are different. The growth field is assumed to belinearly related to the fluctuation of auxin concentrationabout its spatially uniform value. Sometimes the couplingleads to the passive enslavement of one set of orderparameters to the other but in certain circumstances, whichwe outline in Section 3, they can be quite independent.
In Section 3, we introduce the combined model. Weshow how the model is accessible to analysis and leads tothe determination of key parameters that dictate the choiceof both the phyllotactic lattice and the correspondingplanform. In this paper, we focus more on situations inwhich the biochemical instability sets the phyllotacticpattern in order to illuminate the differing circumstancesunder which surface deformations mirror and are indepen-dent of the growth field configuration. In particular, wefind that
(i)
The coupling of biochemistry and mechanics can bepassive when only one of the mechanisms leads to aninstability. In this case, the unstable mechanismdictates the choice of pattern.(ii)
When both mechanisms are close to their instabilitythresholds, the coupling can be active via a linearresonance. This can lead to ridge-like surface deforma-tions with an underlying whorl lattice (see Fig. 6).(iii)
The coupling can be active via nonlinear resonance.This allows for the formation of various-shapedpolygons with an underlying Fibonacci-spiral phyllo-tactic lattice.We identify key parameters which should be measuredand discuss the sense in which the idea of free energylandscape is still relevant even though in general biochem-ical systems are not gradient flows.
2. The biochemical model in the continuum limit
A series of pioneering papers by Jonsson et al. (2006),Smith et al. (2006), and Barbier de Reuille et al. (2006) havepresented discrete ODE models for the auxin-transporthypothesis of primordium formation. We begin byreexamining these models from a slightly different pointof view. Our goal is to take advantage of the fact that theauxin concentration fluctuations found in Jonsson et al.(2006) occur over many cell diameters. We recast the modelof Jonsson et al. (2006) using a continuum approximation.This reformulation allows us to examine the combinedeffects of growth and stress more conveniently.
The idea of a continuum approximation is as follows.Imagine we have a one-dimensional lattice of cells, each oflength h0, and the auxin concentration in the ith cell is AðiÞ,
1pipN. We introduce a new field AðxÞ depending on thecontinuous variable x, where we identify Aðx ¼ ih0Þ withAðiÞ. Then, the difference of auxin levels Aði þ 1Þ � AðiÞ intwo neighboring cells can be written exactly as Aðði þ 1Þh0Þ�
Aðih0Þ ¼ ðexpðh0ddxÞ � 1ÞAðxÞ. We now expand the expo-
nential in powers of h0ddx
to get the familiar Taylor series. IfAðiÞ changes significantly over many cell lengths, thenpowers of h0
ddx
can be estimated ash0l , where l is a typical
wavelength of the pattern. From simulations (Jonsson etal., 2006), this number is small, at least 1
10. We keep only
terms up to ðh0ddxÞ4. Why? It turns out that the competition
between the reverse diffusion of PIN1 transport andordinary auxin diffusion is reflected in the second orderterm, so its coefficient is small near the threshold value forPIN1 transport at which a uniformly distributed auxinconcentration becomes unstable. Our series involves adecay term �dA, a second order term (in two dimensions)H0h
20r
2A, where H0 is small, and a fourth order termh40r
4A. The decay rate d (in suitable units) is also small, sothat we can have a balance between these three terms suchthat the neglected sixth and higher derivations are an orderof magnitude smaller.The models used in Jonsson et al. (2006) and Smith et al.
(2006) are nonlinear. But, near the value of PIN1 transportat which the pattern first appears, the fluctuations aboutsome mean auxin level (in the cells of the outer surfacelayer, the tunica) are small. We take advantage of this byexpanding the field AðxÞ around its mean value A0, A ¼
A0ð1þ f 0gÞ, and keeping fluctuation terms up to at mostcubic order in f 0g. Here, g is the corresponding fluctuationin the amount of strain experienced by the tissue due to afluctuation
A�A0A0
in the fractional auxin concentration level.The coefficient f 0 can be interpreted as a coefficient ofcubic expansion. The result of all this is a partialdifferential equation for the auxin fluctuation fieldgðx; y; tÞ which reads
gt þDgr4gþHr2gþ dgþ k1rðgrgÞ þ k2rðrgr2gÞ ¼ 0,
ð2:1Þ
for
Dg ¼PTA2
0h40
4ðkþ A0Þ2; H ¼ �h20Dg þ
h20PTA2
0
ðkþ A0Þ2; k1 ¼
2PTh20kA0
ðkþ A0Þ3
f 0,
k2 ¼PTh40A
20
2ðkþ A0Þ3
f 0.
The definitions of the parameters will be given inSection 2.1.The convenience of (2.1) is that it has exactly the form
that describes pattern formation in many systems. More-over, it closely mimics the equation for the normal surfacedeformation of an overdamped curved elastic shell (forexample, in mechanical models of phyllotaxis, the gen-erative region in the neighborhood of the shoot apicalmeristem) under compressive stresses. This makes it easy toanalyze the behavior of the combined model which takesboth biochemical and mechanical forces into account.

ARTICLE IN PRESS
Fig. 2. Schematic diagram of the shoot apical meristem (SAM). The SAM
consists of a thin skin (the tunica, Regions 1, 2, 3 in the diagram) attached
to a foundation of less well-organized cells (the corpus, Region 4). Cells in
Region 1 show little growth activity and Region 2 is the generative region
in which some active cell division is occurring and new primordia are first
seen to form. As the plant tip grows, cells move from Regions 2 to 3,
radially outward in the reference frame of the diagram’s north pole. In
Region 3, primordia further develop into mature phylla such as leaves.
We define radial r and angular a coordinates on the generative region
(Region 2) by projecting the surface to polar coordinates on the plane.
Fig. 3. Schematic diagram of the cell lattice. The lattice of cells is taken to
be square lattice. A cell i has auxin concentration AðiÞ and PIN1
concentration Pi in its interior, and PIN1 concentration Pij on the wall
shared with cell j.
A.C. Newell et al. / Journal of Theoretical Biology 251 (2008) 421–439 425
The outline of the remainder of this section is as follows.In Section 2.1, we give more details of the derivation of(2.1). The reader may accept this on a first reading andmove directly to Section 2.2. In Section 2.2, we discuss howit is that one analyzes the behavior of solutions of (2.1)near onset, that is near the PIN1 transport threshold atwhich a pattern with some preferred wavelength begins toappear.
In the context of interest, the x; y plane is the annulargenerative region in the neighborhood of the plant’s shootapical meristem, an average distance R from the apex (seeFig. 2). Thus, for y read r and for x read Ra, where r and aare, respectively, radial and angular coordinates. (For agenerative region near the north pole of a sphere, we definer by projecting the surface in the generative region to theplane; this corresponds more closely to the arc length fromthe pole for less curved surfaces.) It turns out that thedimensionless ratio G ¼ R
L, where 2pL is the distancebetween primordia, is relatively large and therefore wecan approximate the Laplacian as q2
qr2þ 1
R2q2
qa2.
2.1. Derivation of the continuum, small fluctuation
approximation
In the model of Jonsson et al. (2006), a planar generativeregion (modelling Region 2 of Fig. 2) in the tunica is takento be made up of a network, or square lattice, of cells,which we picture in Fig. 3. The auxin concentration AðiÞ inthe ith cell of the lattice is governed by the following set ofdiscrete equations:
dAðiÞ
dt¼ Dg
Xk
ðAðkÞ � AðiÞÞ þ TX
k
ðAðkÞPðk; iÞ
� AðiÞPði; kÞÞ þ c� dAðiÞ, ð2:2Þ
where the above summations are taken over all neighborsof cell i. In Eq. (2.2), c� dAðiÞ describes the transportation
of auxin between the meristem top surface and the bulkbelow. The supply of auxin from the bulk below ischaracterized by the constant c. When there is excessiveauxin in the top surface, it will be transported back down.This is the only part that describes the exchange of auxinbetween the top surface and the body of the plant. Theother two parts both govern the auxin flow inside thegenerative region. The second part Dg
Pk ðAðkÞ � AðiÞÞ
represents normal diffusion. Dg is the diffusion coefficient.The third part T
Pk ðAðkÞPðk; iÞ � AðiÞPði; kÞÞ is the so-
called PIN1 up-regularization term, because the enzymePIN1 on the cell wall can polarize so that auxin istransported from low concentration to high concentration,a reverse diffusion. T is a constant measuring the strengthof dependency of auxin transportation on the PIN1distribution. For any k and i, Pðk; iÞ (also denoted as Pki)is the PIN1 concentration on the cell wall of cell k that isadjacent to cell i. The sum T
Pk AðkÞPðk; iÞ is the amount
of auxin flowing into cell i, and TP
k ð�AðiÞPði; kÞÞ is theamount flowing out of cell i.In order to close Eq. (2.2), a relation between the PIN1
concentration and the auxin concentration is required.Indeed, the PIN1 distribution in a cell is determined by theauxin concentration in the neighboring cells, and thisprocess is called PIN1 cycling. Consider two neighboringcells i and j, with each cell divided into five parts; aninternal part, and a four-sided wall. The PIN1 concentra-tion in the internal part is denoted by Pi ¼ PðiÞ, and thePIN1 concentration in cell i on the wall neighboring cell j isdenoted by Pði; jÞ ¼ Pij . The time responses of Pij and Pi
are taken to be
dPij
dt¼ f ðAðjÞÞPi � k2Pij , (2.3)
dPi
dt¼X
k
ðk2Pik � f ðAðkÞÞPiÞ. (2.4)
From Eq. (2.3), we see that the PIN1 concentration on thecell wall ði; jÞ will increase if a high auxin concentration incell j calls for more PIN1 to be transported from internalcell i to the cell wall. This effect is represented by the termf ðAðjÞÞPi. At the same time, there is also an internalizationprocess �k2Pij , acting like diffusion, taking PIN1 back to

ARTICLE IN PRESSA.C. Newell et al. / Journal of Theoretical Biology 251 (2008) 421–439426
the internal part of cell i with a constant rate k2. Similarly,Eq. (2.4) describes the change of PIN1 concentration of theinternal part of cell i. The right-hand side of this equationhas exactly the opposite sign of Eq. (2.3) because wheneverthe cell wall loses a PIN1 molecule, the internal cell gains it,and vice versa. Since each cell is surrounded by four sides, asummation is taken over all sides. It is known that f ðAjÞ isan increasing function of Aj , but the exact formula isunknown. For simplicity, Jonsson et al. assume a linearmodel, namely that
f ðAðjÞÞ ¼ k1AðjÞ. (2.5)
Eqs. (2.3)–(2.5) form a closed system. However, a furtherand most useful simplification can be made by assuming,consistent with the data given in Table S2 of Jonsson et al.(2006), that the PIN1 relaxation time k�12 is much less thanthe auxin concentration relaxation time d�1 and that thePIN1 concentration Pij responds adiabatically to changesin AðiÞ. This assumption allow Jonsson et al. to express Pki
algebraically in terms of AðiÞ as
Pki ¼ Pðk; iÞ ¼ PAðiÞ
kþPðkÞ
j AðjÞ. (2.6)
HerePðkÞ
j AðjÞ is taken over all neighbors of cell k, P ¼
Pi þP
Pik is the total amount of PIN1 in a single cell andis assumed constant throughout all cells, and k ¼ k2
k1. Only
those PIN1 molecules in the cell walls are of interestbecause PIN1 molecules in the internal part will not beactive in auxin transportation.
From Eq. (2.6), we can see that approximately (exactly ifk5
PAðiÞ) the fraction of PIN1 attached to a specific part
of cell wall ði; jÞ is determined by the fraction of auxinconcentration in the cell j over the total amount of auxinin neighborhoods of cell i. Substituting Eq. (2.6) intoEq. (2.2), the following closed form of the system ofequations for auxin distribution results:
dAðiÞ
dt¼ Dg
Xk
ðAðkÞ � AðiÞÞ
þ TX
k
AðkÞPAðiÞ
kþPðkÞ
j AðjÞ� AðiÞP
AðkÞ
kþPðiÞ
j AðjÞ
!
þ c� dAðiÞ
¼ Dg
Xk
ðAðkÞ � AðiÞÞ
þ TPX
k
AðkÞAðiÞ
kþPðkÞ
j AðjÞ�
AðkÞAðiÞ
kþPðiÞ
j AðjÞ
!
þ c� dAðiÞ. ð2:7Þ
These are the equations analyzed by Jonsson et al. (2006).
Their results show that for a sufficiently large value of PTDg,
the ratio of reverse to normal diffusion, the spatiallyuniform solution A0 ¼
cdis unstable, and a pattern emerges.
The wavelength of this pattern is many cell diameters.Therefore, much simplification can be achieved by recog-nizing that the solutions AðiÞ of interest of (2.7) are ones for
which Aði1 þ h0; i2 þ h0Þ � Aði1; i2Þ is small. (ði1; i2Þ are theeast–west and north–south labels of the ith cell in thesquare lattice with side length h0.) Therefore, we canintroduce a continuum approximation by replacing the setof concentrations Aði1; i2; tÞ, 1pi1; i2p
ffiffiffiffiffiNp
(N is the totalnumber of cells) by a field Aðx; y; tÞ, where Aðx ¼ i1h0;y ¼ i2h0; tÞ ¼ Aði1; i2; tÞ. For example, the difference termDg
Pk ðAðkÞ � AðiÞÞ is written as
DgðAðði1 � 1Þh0; i2h0Þ þ Aðði1 þ 1Þh0; i2h0Þ
þ Aði1h0; ði2 � 1Þh0Þ þ Aði1h0; ði2 þ 1Þh0Þ � 4Aði1; i2ÞÞ,
which, when expressed as a Taylor series is, up to fourth
order, h20Dgr
2AþDgh4012
A4, where r2 ¼ q2
qx2þ q2
qy2and
A4 ¼q4Aqx4þ q4A
qy4. The reasons for keeping terms only up to
fourth order are discussed above, and the ratio of the firstneglected term (the sixth derivative) and the fourthderivative term is estimated below. To expand the PIN1terms in (2.6), it is convenient to introduce the fractionalPIN1 concentration field Gðx; y; tÞ, where
Gði1h0; i2h0; tÞ
¼Aði1; i2Þ
kþ Aði1 þ 1; i2Þ þ Aði1 � 1; i2Þ þ Aði1; i2 þ 1Þ þ Aði1; i1 � 1Þ.
Then, summing over the four cells adjacent to the ith celllabelled ði1; i2Þ,
TX
k
ðAðkÞPðk; iÞ � AðiÞPði; kÞÞ
¼ PTAði1; i2ÞðGði1 þ 1; i2Þ þ Gði1 � 1; i2Þ
þ Gði1; i2 � 1Þ þ Gði1; i2 þ 1ÞÞ
� PTGði1; i2ÞðAði1 þ 1; i2Þ þ Aði1 � 1; i2Þ
þ Aði1; i2 � 1Þ þ Aði1; i2 þ 1ÞÞ, ð2:8Þ
which, when expanded to fourth order, gives
PTh20r A2r
G
A
� �� �þ PT
h40
12ðAG4 � GA4Þ. (2.9)
Next, we expand about the spatially uniform constant stateA0 ¼
cdby writing
Aðx; y; tÞ ¼ A0ð1þ f 0gðx; y; tÞÞ, (2.10)
where f 0 is a coefficient of expansion and the field g is ameasure of the auxin fluctuation. (g will be interpreted inSection 3 as the strain induced by a fluctuation ðAðx; y; tÞ �A0Þ=A0 in auxin level.) We emphasize that, in this analysis,we are dealing with fluctuations in the auxin concentrationwhich are small with respect to the overall auxin concen-tration level. The local auxin concentration field Aðx; y; tÞ iscertainly never negative. The field gðx; y; tÞ is a measure ofauxin concentration fluctuation. Negative values of g at agiven point are possible and just mean that there is anauxin depletion at that point. Substituting (2.8) and (2.9)

ARTICLE IN PRESSA.C. Newell et al. / Journal of Theoretical Biology 251 (2008) 421–439 427
into (2.7) and expanding in powers of f 0g gives
gt ¼ � dgþ h20Dgr
2gþDgh4
0
12g4
þ PTh20 �
A20
ðkþ A0Þ2r2g�
A20h20
4ðkþ A0Þ2r4g
� �
þPTh4
0
12
A0kg4
ðkþ A0Þ2�
A0
ðkþ A0Þg4
� �
þ PTh20r �
2kA0f 0
ðkþ A0Þ3
grg�h20A2
0f 0
2ðkþ A0Þ3rgr2g
� �. ð2:11Þ
Observe that the effective diffusion, the coefficient of theLaplacian r2, is
�H ¼ �H0h20 ¼ h2
0 Dg �PTA2
0
ðkþ A0Þ2
� �.
For DgoPTA20
ðkþA0Þ2, reverse diffusion driven by PIN1
transport overcomes diffusion. If only the Laplacian termwere present (if one ignored higher derivatives), aninstability of the uniform auxin concentration state g ¼ 0would be possible for H40 since one could always choosea perturbation with small enough wavelength 2p
k(that is,
large enough wavenumber k) so that the reverse diffusionterm �Hr2g would overcome linear damping �dg. But,for larger k, the higher order derivatives become increas-ingly important and may arrest the linear instability. Theirpresence leads to a finite choice of the most unstablewavenumber. The fact that the observed pattern is not sobig (the pattern wavelength is between 10 and 20 celldiameters) means that, whereas H is positive, it is small. Inthat case, we note that the g4 coefficient in (2.11), which is
h4
12ðDg � PT
A20
ðA0þkÞ2Þ, is also small, so that only the
rotationally invariant r4 is left in the fourth derivativeterm.
We can therefore approximate the linear part of thecontinuum approximation to Eqs. (2.3)–(2.5) by includingterms up to the fourth derivative. Because the coefficientH0 of the Laplacian is small and because (in suitable units)the linear damping is small, the three terms �dg; H0h
20r
2g
and Dgr4g can balance and each of them is larger than the
sixth and higher derivative terms which are ignored. Anestimate of the ratio of the sixth to fourth derivative terms
on a field cos ~k � ~x, k ¼ j~kj, is 4!6! ðh0kÞ2 ’ 4p2
30ðhl Þ
2, where l is
the pattern wavelength. For hl ’
110, this ratio is indeed
small. As already indicated, we also expand (2.6) aroundthe mean auxin concentration A0 ¼
cdas (2.10) and retain
all terms to cubic order in the product f 0g. The resultingequation is (2.1).
2.2. Simplification via the use of order parameters
What follows is the standard treatment for pattern-forming systems near onset. A linear analysis of the stabilityof the uniform solutions A ¼ A0, g ¼ 0 can be carried outby setting g proportional to expðilrþ imaÞ expðstÞ (recall
that r2 ’ q2
qr2þ 1
R2q2
qa2to a good approximation), whereupon
sðl;mÞ ¼ s k2¼ l2 þ
m2
R2
� �¼ �Dgk4
þHk2� d. (2.12)
As H increases, the growth rate s first becomes positive for
a value of the wavenumber k ¼ kc ¼ffiffiffiffiffid
Dg
4q
, or h0kc ¼ffiffiffiffiffiffiffiffiffiffiffiffiffiffiffiffiffi4ðkþA0Þ
2d
PTA20
4
rat the value H ¼ Hc ¼ 2
ffiffiffiffiffiffiffiffidDg
p. Both observa-
tions (and the values of the parameters given in Jonssonet al., 2006) suggest an intraprimordial distance 2p
kcof
between 10 and 15 cell diameters. For H close to Hc, wetake gðr; a; tÞ to be a linear combination of sinusoidalfunctions with wavevectors ~k ¼ ðl;mÞ in the set Ag ofwavevectors for which sð~kÞ is small (positive or negative).The set Ag is the set of wavevectors for the so-called
active modes. Thus, we write
gðr; a; tÞ ¼X~kj2Ag
BjðtÞeiðlj rþmjaÞ þ ð�Þ, (2.13)
where ð�Þ denotes the complex conjugate of the first term.When convenient, each of the wavevectors ~k in the set canbe written in terms of phyllotactic coordinates
l ¼2pl0ðq�md0Þ; m ¼ m, (2.14)
where l0 is the plastochrone ratio and 2pd0 is thedivergence angle; see Shipman and Newell (2005) forexplanation of the phyllotactic coordinates and thederivation of (2.14). If the lattice is not perfect, but variesin space, we can accommodate this feature in thedescription by allowing the complex amplitudes BjðtÞ,called the order parameters, to be slowly varying functionsof the spatial variables (see Section 3.6, Remark 11). In(2.14), m is an integer, as is q. The former is thecircumferential wavenumber, and the latter measures thenumber of times the generating lattice corresponding to(2.14) is wrapped around the cylinder 0oro1; 0oao2p.The coefficients of all modes with wavevectors ~k for
which sð~kÞ is significantly negative (which we call passive
modes) are algebraically slaved to the amplitudes of theactive modes; that is, the passive modes are algebraicfunctions of the active modes. The most importantnonlinear term is, for small fluctuations, the quadraticnonlinearity. Quadratic interactions between two activemodes expð�iðlprþmpaÞÞ and expð�iðlqrþmqaÞÞ will givean exponential whose exponent contains all sums anddifferences of the arguments, expð�iðlp� lqÞrþ ðmp�
mqÞaÞ. Most of these nonlinearly generated modes willhave wavevectors lp � lq, mp �mq well outside the activeset for which sðlp � lq;mp �mqÞ is small. They will not playa role in determining the pattern. On the other hand, anonlinearly generated phase �ðlp þ lqÞr� ðmp þmqÞa forwhich ~kpþq ¼ ðlp þ lq;mp þmqÞ belongs to the active set Ag
will lead to a strong interaction between the modes with
wavevectors ~kp~kq, ~kpþq. Standard analysis then yields a set

ARTICLE IN PRESSA.C. Newell et al. / Journal of Theoretical Biology 251 (2008) 421–439428
of amplitude equations
dBj
dt¼ sðk2
j ÞBj þXp;q
kðj; p; qÞB�pB�q (2.15)
for each of the order parameters Bj in the set Ag. (We givea detailed derivation of these equations for the mechanicalmodel in Shipman and Newell, 2005.) The coefficientkðj; p; qÞ (whose nondimensional value is given in Section 3)is only nonzero for triads ~kj ¼ �
~kp �~kq, each of whose
wavevectors lie in Ag.Amplitude equations such as (2.15) are universal in the
sense that they result from the near-threshold analysis ofmany pattern-forming systems, such as overdamped shellsunder compressive stress, convection patterns in buoyancyor surface tension-driven unstable fluid layers, Faradaywaves in vibrating dishes. The information about themicroscopic details is all contained in the coefficients sðk2
j Þ
and kðj; p; qÞ. The common feature of all the microscopicsystems giving rise, near threshold, to the form of (2.15) issimply that they share common symmetries, such asrotational symmetry in the x; y-plane. Therefore, one hasto be careful about reaching definite conclusions concern-ing which mechanism or mechanisms are responsible forthe observed pattern. Many different mechanisms whichare described by equations such as (2.1) with similarsymmetries to (2.1) (here, rotational symmetry and abreaking of the g!�g symmetry) will give rise to patternswhich look similar. To distinguish one mechanism fromanother, one must see how the pattern behaves as thecoefficients s and k, which contain information about theparticular microscopic model, are changed. The remarkapplies even before any simplifying reductions of theoriginal equations (2.3)–(2.5) are performed. That Jonnsonet al. and Smith et al. note that numerical simulations ofEqs. (2.3)–(2.5) give patterns which are similar to observedphyllotactic patterns cannot be taken as proof that themechanism giving rise to their model is the correct one.One has to work much harder by showing that theobserved changes in pattern which occur as certain externalinfluences are changed are also captured by the model. Thesame, of course, applies for any mechanical model.
We have already noted that the equations for anoverdamped, curved elastic shell under an in-surfacecompressive stress (possibly induced by the combinationof growth and the presence of boundaries which limitexpansion) has almost exactly the same form as (2.1).Moreover, near the threshold at which this compressivestress would produce buckling, the surface deformationwðr; a; tÞ can also be expanded in a set Am of active modes:
wðr; a; tÞ ¼X~kj2Am
AjðtÞeiðlj rþmjaÞ þ ð�Þ, (2.16)
and the equations for the order parameters AjðtÞ of thesurface deformation are the same as (2.15) except for the
linear and quadratic coefficients
dAj
dt¼ smðk
2j ÞAj þ
Xp;q
tðj; p; qÞA�pA�q. (2.17)
We give the expressions for smðk2j Þ and tðj; p; qÞ (derived in
Shipman and Newell, 2005) in the next section.It is very natural to ask, therefore, how the patterns for
both the auxin concentration fluctuation (gðr; a; tÞ) andsurface deformation (wðr; a; tÞ) fields will interact if weinclude some coupling between the biochemical andmechanical fields. It is possible that one mechanismdominates in some plants and the other in other plants.For example, while the values for the PIN1 transport maybe close to or above threshold, the compressive stress maybe well below its threshold value. In that case, the patternwill be set predominantly by the biochemical considera-tions (the amplitude equations (2.15)) and the coupling willsimply slave the surface deformation pattern to the auxinconcentration pattern. It is also possible, however, that forother plants the two sets Ag (of active modes for thebiochemical system) and Am overlap and phyllotaxis willbe a cooperation between the two mechanisms. The goal ofSection 3 is to examine both of these possibilities.Before we do that, however, we end this section with a
brief discussion of how the solutions AjðtÞ and BjðtÞ ofEqs. (2.15) and (2.17) can reach finite values. Whereas thequadratic terms redistribute energy amongst the modes,they do not saturate growth. Just as a spherical elastic shellunder external pressure will collapse (after first making, forexample, a hexagonal pattern), so too will the amplitudesAjðtÞ and BjðtÞ grow without bound. In the case of thesurface deformation, the source of the saturation is fairlyclear. The tunica (the curved elastic sheet) is attached to acorpus which acts mechanically as an elastic foundation.This gives rise to spring-like forces in the direction normalto the undeformed surface. In Shipman and Newell (2005),we have modelled this spring force F ðwÞ as a Taylor series�kw� g2w2 � g3w3, which leads, in the perturbation ana-lysis, to a slight change in the coefficient tðj; p; qÞ in (2.17)and the addition of cubic terms �gAjðjAjj
2 þ 2P
paj jApj2Þ
(g is a function of g2 and g3) on the right-hand side of(2.17). Now, strictly speaking, since the linear andquadratic terms balance (that is, they have roughly thesame magnitude since the growth sm is small), the cubicterm will generally be smaller (since it is the third power ofthe small amplitudes). However, we have argued that g, thenonlinear restoring coefficient, is likely to be large, andtherefore, in (2.17), all three terms will be of the same orderof magnitude. The reason for the saturation in (2.15)(which would give rise to cubic terms again having thesame form, but different coefficient values, as for (2.17)) isless clear. Certainly the total auxin concentration isbounded, but this fact does not necessarily bound itsfluctuations, except, of course, that the concentrationcannot be less than zero. Our analysis, however, is lookingat situations for which the fluctuation
A�A0A0
of auxin is

ARTICLE IN PRESSA.C. Newell et al. / Journal of Theoretical Biology 251 (2008) 421–439 429
small. One can formally calculate a cubic term, but in orderfor the cubic term to saturate BjðtÞ, the amplitudes becomelarge so that higher powers also come into play. Wesidestep this issue by simply postulating that the growthfluctuation amplitudes have a saturation �dBjðjBjj
2þ
2P
paj jBpj2Þ, where d is sufficiently large so that all three
terms on the right-hand side of (2.15) can balance. But, thecubic saturation term should now be considered phenom-enological with the parameter d determined by theobserved fluctuation size.
3. The combination of mechanics and biochemistry
The outline of this section is as follows. First, we willdiscuss the coupling between the biochemical and mechan-ical (normal surface deformation and Airy stress potential)fields. Second, we introduce the nondimensionalizedequations for these fields. We will state, but not rederive,results from Shipman and Newell (2005) on the Foppl–vonKarman–Donnell (FvKD) equations relevant for thispaper. Third, we introduce the order parameter representa-tions of the fields and write down the correspondingcoupled set of amplitude equations. Fourth, we analyze thelinear growth properties of these equations and identifycircumstances in which cooperative rather than dominantbehavior by one or the other mechanism can be expected.Fifth, we list 11 important properties of both the linear andnonlinear amplitude equations. We will discuss conditionsunder which the system is governed by an energy functional(Is there an energy landscape?). Sixth, we review somerelevant previous results from Shipman and Newell (2005)valid only when mechanical forces are involved. In thatcase, it was simply assumed that the local stress inhomo-geneities would provide for the growth of phylla to occur atsurface deformation maxima. Seventh, we examine threelimits of the amplitude equations. Case one corresponds tothe case where the auxin concentration field is dominantand the surface deformation observed is simply slaved tothe spatial auxin pattern. This case will be of most interestto colleagues who are of the belief that auxin fluctuationsare the principal source of phyllotactic patterning. Casetwo corresponds to the reverse case, where growth-inducedin-surface stress effects dominate. The third case is themost interesting because both mechanisms are important.The interesting new result, described in Section 3.7, is thatvia linear coupling, the surface deformation field and theauxin concentration field (which translates into a growthfield) can be very different. Finally, in Section 3.8, wedescribe how a nontrivial cooperation can take place vianonlinear resonance.
3.1. The coupling of mechanics and biochemistry
To build a simple model that includes mechanics and theeffects of auxin, we begin with the stress–strain relations inthe generative region of the plant’s tunica. Neglecting, forsimplicity, and for the moment only, Poisson’s ratio, and
denoting in-plane stresses (averaged through the width ofthe tunica) by Nij and (total) strains by �ij , the stress–strainrelations in the angular (a) and radial (r) directions are
Naa ¼ Ehð�aa � GaaÞ; Nrr ¼ Ehð�rr � GrrÞ,
where E is Young’s modulus of the tunica and h itsthickness. The functions Gij come from two effects, bothconsequences of growth. First, they encode plastic, orgrowth, strains. These strains do not result in stress. If�ij ¼ Gij , then Nij ¼ 0. Secondly, the Gij encode stressesEhGij that arise from restrained growth. Since the plant’sannular generative region cannot expand in the circumfer-ential direction (it does a little, as the ring moves outward,but this effect is small), �aa ¼ 0, and a positive Gaa gives riseto negative, or compressive, stress. In terms of the stressesNij and the normal deflection wðr; aÞ of the tunica shell, theFvKD stress-equilibrium equation (for simplicity, assum-ing for now that the original shell is flat) reads
Dr4w�Nrr
q2
qr2w�Naa
1
R2
q2
qa2w� 2Nra
1
R
q2
qrqaw ¼ 0,
(3.1)
where D ¼ Eh3n2, n2 ¼ 112ð1�m2Þ
for Poisson’s ratio m, is the
bending modulus. In Shipman and Newell (2005), weanalyzed the FvKD equation for the case in whichGaa ¼ P=ðEhÞ, Grr ¼ wP=ðEhÞ are constant. That is, thegrowth-induced stresses were assumed to be constant overthe generative region. But, the auxin models suggest thatgrowth may not be constant throughout the generativeregion. To allow for the growth-induced stress to varyspatially, we consider perturbations
Gaa ¼P
Ehþ gaa; Grr ¼
wP
Ehþ grr; Gra ¼ gra
by functions gaaðr; aÞ, grrðr; aÞ. Eq. (3.1) then becomes
Dr4wþ wPq2
qr2wþ P
1
R2
q2
qa2w�N 0rr
q2
qr2w
�N 0aa1
R2
q2
qa2wþ 2N 0ra
1
R
q2
qr qaw ¼ 0,
where N 0ij ¼ Ehð�ij � gijÞ: The next step is to formulate agoverning equation for the gij . Here we make the sim-plifying assumptions that the tensor gij ¼ gdij (grr ¼ gaa ¼
g; gra ¼ 0) is isotropic and gðr; a; tÞ satisfies (2.1) withadditional terms added to capture the effects of thefluctuation stress field over the tunica. Defining aperturbation Airy stress function f ðr; a; tÞ by
q2fqr2¼ N 0aa;
1
R2
q2fqa2¼ N 0rr;
1
R
q2fqr qa
¼ �N 0ra,
we take the additional term in (2.2) to be br2f , where r2f
is the trace of the stress tensor. Growth is thus enhancedwhere r2f is largest, namely where the total stress S ¼�P� wPþr2f is larger (S40 implies tension, and So0compression). The rationale is that tension (or lesscompression) allows for plastic stretching of the cell walls.We mention that our formulation of an auxin-induced

ARTICLE IN PRESSA.C. Newell et al. / Journal of Theoretical Biology 251 (2008) 421–439430
growth is similar to that used in the analysis of self-similarwrinkling in leaf edges by Sharon et al. (2007) and Audolyand Boudaoud (2003).
Our combined model then consists of the stressequilibrium equation (3.1) (with an extra term proportionalto the curvature of the spherical apex of which thegenerative region is a part), a compatibility equation thatrelates f, g, and w, and the biochemical equation (2.1).Written in nondimensional units, the equations are
zmwt þ r4wþ P
1
G2
q2
qa2wþ w
q2
qr2w
� �þ Cr2f � ½f ;w�
þ kwþ gw3 ¼ 0, ð3:2aÞ
r4f þ r2g� Cr2wþ 12½w;w� ¼ 0, (3.2b)
zggt þ r4gþHr2gþ gþ rðrgðk1gþ k2r2gÞÞ
� br2f þ dg3 ¼ 0. ð3:2cÞ
In (3.2), zm and zg are, respectively, relaxation time scalesof the overdamped elastic surface and the auxin field,G ¼ R
Lg, where 2pLg, for L4
g ¼Dg
d, is the natural instability
wavelength for the critical value of the auxin flux H
(namely Hc ¼ 2), and C is the nondimensional curvatureL2
g
Rcnh, where Rc is the radius of curvature of the spherical
apex and n; h are defined as above. k and g arenondimensional spring constants giving the interactionbetween the plant’s tunica and interior. k and g are related
to their dimensional forms k0 and g0 by k ¼L4
g
Dk0,
g ¼L4
gn2h2
Dg0. The natural mechanical buckling wavelength
is given by L4m ¼
DR2cn
2h2
Dþk0R2cn
2h2, and defining L ¼
L4g
L2m, the
constraint kþ C2 ¼ L is satisfied. We take r2 ¼
ð 1G2
q2
qa2þ q2
qr2Þ, and the bracket G2½u; v� ¼ q2u
qr2q2vqa2þ q2u
qa2q2vqr2�
2 q2uqr qa
q2vqr qa. ½w;w� is closely related to the Gaussian
curvature of the deformed elastic surface. The surfacedeformation field w has been scaled by nh and theperturbation Airy stress potential f with D. As explainedin Section 3.1, the in-surface growth is accounted for in theterm containing second derivatives in (3.2a). If w ¼ 1, thein-surface stress is equally important in the r and adirections. We shall take w ¼ 0, as there is experimentalevidence to support the idea that the in-plane stress onlyacts in the a direction (Dumais and Steele, 2000).
We now analyze the behavior of the two coupled fields g
and w when one or both of the applied forcing parametersP (compressive stress) or H (PIN1 transport) is close totheir critical values 2
ffiffiffiffiLp
and 2, respectively.
3.2. The order parameter equations
As we did in Section 2.2, we represent the fields w and g
as linear combinations of sinusoidal functions of the phases
yj ¼ ljrþmja, j ¼ 1; . . . ;N,
w; g ¼XN
j¼1
ðAjðtÞ;BjðtÞÞ eiyj þ ð�Þ.
The wavevectors ~kj ¼ ðlj ;mjÞ determine the shapes in-volved, but it is the relative sizes of the amplitudes—theorder parameters AjðtÞ;BjðtÞ—which determine the config-urations. For example, if N ¼ 1, ~k1 ¼ ð0;mÞ, the deforma-tion w is a set of m ribs emanating from the shoot apicalmeristem. If N ¼ 3, ~k1 ¼ ð0; 1Þm, ~k2 ¼ ð
ffiffi3p
2;� 1
2Þm; ~k3 ¼
ð�ffiffi3p
2;� 1
2Þm, and the amplitudes B1, B2, B3 are equal, the
auxin concentration field is a hexagonal structure withmaxima at the intersections of y1 ¼ 2n1p, y2 ¼ 2n2p, y3 ¼2n3p for integers nj, j ¼ 1; 2; 3. The common feature of allthe members ~kj belonging to the active set is that one or theother of the corresponding growth rates smðlj ;mjÞ, sgðlj ;mjÞ
defined below is small. The amplitudes of the orderparameters AjðtÞ;BjðtÞ may not all be of equal size fordifferent ~kj. The order parameter equations are
zm
dAj
dt¼ smðlj ;mjÞAj þ CBj � C
XtjpqA�pA�q
þXðt0qpjA
�pB�q þ t0pqjA
�qB�pÞ
� 3gAj jAjj2 þ 2
Xpaj
jApj2
!, ð3:3aÞ
zg
dBj
dt¼ sgðlj ;mjÞBj þ bCAj þ
XkjpqB�pB�q
þ bX
t0jpqA�pA�q � 3dBj jBjj2 þ 2
Xpaj
jBpj2
!,
ð3:3bÞ
where, for k2¼ l2 þ m2
G2,
zmsmðl;mÞ ¼ � k4þ P
m2
G2� k� C2
¼ � k2�
P
2
� �2
þP2
4� L, ð3:4Þ
zgsgðl;mÞ ¼ � k4þHk2
� 1� b
¼ � k2�
H
2
� �2
þH2
4� 1� b, ð3:5Þ
and the coefficients t0jpq; tjpq, kjpq are given by
t0jpq ¼j~kp �
~kqj2
k2j
¼ðlpmq � lqmpÞ
2
k2j G
2, (3.6)
tjpq ¼ j~kp �
~kqj2 1
k2j
þ1
k2p
þ1
k2q
!
¼ðlpmq � lqmpÞ
2
G2
1
k2j
þ1
k2p
þ1
k2q
!, ð3:7Þ

ARTICLE IN PRESS
Fig. 4. Graphs of sg ¼ �k4þHk2
� 1� b (for b ¼ 0) and
sm ¼ �k4þ Pk2
� L, k2¼ l2 þ m2
G2projected on the plane l ¼ 0, for (a)
H ¼ Hc, PoPc (b) H ¼ Hc, P ¼ Pc, where Hc ¼ 2 and Pc ¼ 2ffiffiffiffiLp
are the
critical values of H and P.
A.C. Newell et al. / Journal of Theoretical Biology 251 (2008) 421–439 431
kjpq ¼ k1k2j þ k2ð~kj �
~kpk2q þ
~kj �~kqk2
pÞ, (3.8)
for k2s ¼ j
~ksj2 and k1, k2 are defined in (2.1). We note that
tjpq ¼ tpqj ¼ tqjp is constant over a triad because ~kj þ~kp þ
~kq ¼ 0 and that t0jpq cycled over jpq is tjpq. If, in addition,
the wavelengths 2pj~kj
of all participating modes are equal,
then all the terms in t0jpq and kjpq are equal for all j; p; qpermutations. This is because the only wavevectorssatisfying ~kj þ
~kp þ~kq ¼ 0, j~kjj ¼ j
~kpj ¼ j~kqj, are 120
apart.The coefficients t0jpq, tjpq and kjpq are nonzero over
wavevector triads ~kj , ~kp, ~kq such that ~kj þ~kp þ
~kq ¼ 0. The
fixed point solutions (we shall see that the flow representedby (3.3) is, to a very good approximation, gradient so thatall attracting sets are points which are local minima ofsome free energy EðAj ;BjÞ) determine the configurations ofthe vertical deformation and auxin concentration fields. Asparameters, and in particular the size parameter G, change,so will the fixed points leading to transitions from onesurface deformation pattern and phyllotactic lattice toanother.
3.3. Linear analysis
We begin with a linear stability analysis of the solutionw ¼ g ¼ 0 corresponding to uniform auxin concentrationand the original tunica surface with no normal deforma-tion. Equivalently, we can look at the linear stability of thesolution Aj ¼ Bj ¼ 0 of (3.3). Neglecting nonlinear terms in(3.3) and setting ðAj ;BjÞ ¼ ðA; BÞest, we find
ðs� smÞA ¼C
zm
B; ðs� sgÞB ¼bzg
CA. (3.9)
Eliminating either A or B in (3.9) gives the growth rate
s� ¼sm þ sg
2�
ffiffiffiffiffiffiffiffiffiffiffiffiffiffiffiffiffiffiffiffiffiffiffiffiffiffiffiffiffiffiffiffiffiffiffiffiffiffiffism � sg
2
� �2þ
bC2
zmzg
s. (3.10)
We note that for positive b, sþ, the larger of the two roots,is always bigger than either sm or sg. Coupling helps theonset of primordium formation. The curvature of theoriginal surface is important. Fig. 4 shows two graphs ofsm and sg projected on the plane l ¼ 0. In Fig. 4(a), wehave drawn a situation in which the auxin growth sg isabout to make a transition from negative to positive whilethe stress P is small (we make even allow it to be zero ornegative), so that sm, the buckling growth, is alwaysnegative. In this instance, we would expect sþ to bedominated by sg (it might be useful to think of the couplinggrowth as being small so that sþ ’ maxðsg;smÞ and for theBj fields to dominate the Aj fields. Indeed, because sm isnegative and of order one, the Aj field will be simply slavedto the Bj field through the relation smAj ¼ �CBj. InSection 3.7, we examine this case in more detail. In thesame subsection, we will also investigate what happens as P
increases so that sm increases towards zero. We will find
the slaving tendency of Aj to Bj reduced and the surfacedeformation will take on a life and shape of its own.Fig. 4(b) shows a situation where both sg and sm are
close to zero, the former at mG ¼ 1, and the latter at m
G ¼ffiffiffiffiL4p
.If
ffiffiffiffiL4p
is close to 1, there is a strong linear resonancebetween the two fields. This is examined in Section 3.7. But,one can also have a nonlinear resonance, where
ffiffiffiffiL4p
is suchthat the cross-coupling terms in (3.2a) (arising from½r�2g;w� in (3.2b) are important). Such a possibility isinvestigated in Section 3.8.
3.4. Eleven important remarks
1. smðl;mÞ and sgðl;mÞ are the growth/decay rates offluctuations on the separate uniform compression anduniform auxin states in the absence of the other. sþðl;mÞ isthe modified growth rate in the presence of both. Even inthe absence of coupling (i.e., b ¼ 0), sþ is nontrivial. It canbe smðl;mÞ for some l;m values and sgðl;mÞ for others. Italways is the larger of the two.2. For b40, the case in which the fluctuation stress tracer2f produces a positive rate of growth in the field g, sþ isalways larger than either sm or sg. Thus, coupling stressand auxin fields enhances primordia formation.3. sg is maximum at on the ellipse l2 þ m2
G2¼ H
2 and, forb ¼ 0, becomes zero when H ¼ 2 (for b40, it becomes zeroat H ¼ 2
ffiffiffiffiffiffiffiffiffiffiffi1þ b
p, so that l2 þ m2
G2¼ 1. In physical space this
corresponds to a wavelength Lg, which was used as anondimensionalization scaling parameter. sm is maxi-mum on the ellipse wl2 þ m2
G2¼ P
2and becomes zero when

ARTICLE IN PRESSA.C. Newell et al. / Journal of Theoretical Biology 251 (2008) 421–439432
P ¼ 2ffiffiffiffiLp
. For w ¼ 0, this gives that mG ¼
ffiffiffiffiL4p
is thepreferred wavenumber.
4. We identify the active set of modes A in (3.3) by thecriterion that, for a mode ðl; m
GÞ, the growth rate sþðl;mÞ isgreater than some prescribed negative value �s�þ. �s
�þ is
not zero since nonlinear coupling can overcome lineardamping and lead to stable finite amplitude solutionsAj ;Bj . Our results should, however, not be sensitive to thechoice of s�þ (and they are not).
5. Having identified all possible active modes using lineartheory, we now allow them to compete by expanding w andg in an asymptotic expansion with respect to some smallparameter (the amount by which sþ is above or belowcritical). The amplitude equations (3.3) are the necessaryand sufficient condition that this asymptotic expansionremains well ordered in time.
6. The most important nonlinear terms are the quadraticones, whereby modes such as expð�iypÞ, expð�iyqÞ,y ¼ lrþma, give rise to expð�iðyp þ yqÞÞ. This couplingproduces a resonance with a mode expðiyjÞ already inthe active set when ~kp þ
~kq þ~kj ¼ 0 (~ks ¼ ðls;
msG Þ). For
example, let us suppose that
~kp ¼ l;�m
2G
� �; ~kq ¼ �l;�
m
2G
� �; ~kj ¼ 0;
m
G
� �,
which encodes a m2-whorl if the amplitudes Ap, Aq, Aj are
more or less equal. The choices l ¼ffiffi3p
2, G ¼ m ¼ 4, give the
decussate (2-whorl) pattern. The value of l is chosen byminimizing the elastic energy.
7. It is very important to understand that a ridge solution
Aj ¼
ffiffiffiffiffiffiffiffiffiffiffiffiffiffiffiffiffiffiffismðlj ;mjÞ
3g
s; Ap ¼ Aq ¼ 0
is unstable to a configuration with a nonzero Ap, Aq whenthe quadratic coefficient t is sufficiently large. Therefore,even though the linear buckling instability leads to radialridges, the ridges can rapidly destabilize to more hexagonalstructures. See Shipman and Newell (2005) for discussion.
8. The cubic terms in (3.3) are not complete. There aremany additional terms arising from the interaction of thequadratically generated nonresonant terms in ½w;w� withthe w field itself. However, we assume that the dominantsaturation for the surface deformation is the strongnonlinear elastic foundation term gw3 and that thesaturation of the auxin field is primarily due to a concen-tration of auxin which is represented in (3.3b) as dBjðjBjj
2þ
2P
paj jBpj2Þ. Again, our results are relatively insensitive to
these choices.9. We have stated that the fixed generative domain
R� r1oroRþ r1, 0oao2p, where we consider both R
and r1 large and ignore boundaries, is a simplification.First, the region is moving slowly outwards on those timescales, 1
zmsþand 1
zgsþ, associated with primordia formation.
Thus, in reality, we should think that the parameter G is aslowly varying function of time. We assume that it is aconstant for each calculation of the minimizing configura-
tion AjðGÞ, BjðGÞ and then imagine that the amplitudesfollow G adiabatically. But, the evolution of a givenplanform with G may or may not always be continuous. InShipman and Newell (2005), we showed that in continuoussecond-order phase transitions the plant patterns moves upthe Fibonacci sequence. Transitions from whorls to spiralsare, however, discontinuous.Second, the pattern moves with the surface material
faster than the plant grows. The old pattern passes out ofthe generative region leaving an unpatterned template onwhich the next pattern will develop. If G increases, the newpattern will have a slightly different structure from the oldpattern. Nevertheless, the old one will influence theemerging pattern via its presence on the outer boundaryRþ r1. This is incorporated into our picture by projectingthe shapes of w and g on their outer boundary onto thesolvability condition which gives rise to the amplitudeequations (3.3). Its effect is to add constants Aj, Bj to eachof (3.3a), (3.3b). These additional terms play a central rolein the evolving phyllotactic configuration. In Newell andShipman (2005), we showed how they are key elements inchoosing the Fibonacci sequence. The idea, explained inNewell and Shipman (2005), is the following. Suppose onehas a spiral pattern with circumferential wavenumbers (theparastichy numbers) m; n;mþ n, mon, where mþ n ’ G.Quadratic interactions can give rise to modes withcircumferential wavenumbers mþ n (already present),2mþ n (non-Fibonacci if m; n are members of theFibonacci sequence) or mþ 2n (Fibonacci). The wavenum-ber mþ 2n is preferred since, in forming the boundary, them mode plays less of a role since it is more stronglydamped. As G increases past mþ n to either 2mþ n ormþ 2n, the emerging spiral pattern is therefore n;mþ n;mþ 2n, not m;mþ n; 2mþ n. In fact, because of the firstpoint in this remark, there is a slow evolution fromm; n;mþ n to n;mþ n;mþ 2n. The amplitude Am de-creases as the amplitude Amþ2n increases. The in-betweenpattern displays a surface deformation with amplitudesAm ’ Amþ2n5An ’ Amþn, a diamond pattern. What ismore intriguing is that the size G can be scaled out of theequations altogether. The envelope of the amplitudes, thegraph connecting Am;An;Amþn;Amþ2n, is largely indepen-dent of the plant size G.10. An energy functional? It is not a surprise that the
amplitude equations for the amplitudes Aj of the vertical
deformations can be derived as the gradient � qEqA�
jof some
energy landscape function EðAj ;BjÞ. The equations werederived from the elastic energy of the generative region.But, the equations for the auxin concentration field, ineither their discrete or continuous forms, are not, ingeneral, gradient. There is not a natural functional whichoptimizes auxin distributions. But, the amplitude equationsfor Bj are, in special circumstances, gradient. The key iswhether the coupling coefficient kjpq is constant acrosstriads. Its counterpart tjpq, which is proportional to j~kp �
~kqj2ð 1
k2j
þ 1
k2pþ 1
k2qÞ is equal to tpqj and tqjp because ~kj þ
~kpþ

ARTICLE IN PRESSA.C. Newell et al. / Journal of Theoretical Biology 251 (2008) 421–439 433
~kq ¼ 0. But kjpq is proportional to k2j and k2
j ð~kp �
~kqÞ. This is
only constant across the triad if k2j ¼ k2
p ¼ k2q ¼ k2 because
this, along with the condition that ~kj þ~kp þ
~kq ¼ 0 means
that ~kp �~kq ¼
~kq �~kj ¼
~kj �~kp ¼ �
12
k2; namely, the wave-
vectors are 120 apart in angle. A very similar situationarises in other contexts. Convection in horizontal fluidlayers is not a gradient flow. However, as Busse (1967) hasshown, near onset it is because the participating wavevec-tors in triad interactions are equal in length and 120 apartin angle, creating perfect hexagonal lattices. If, in our case,kjpq ¼ kpqj ¼ kqjp ¼ k, then the energy functional is
EðAj ;BjÞ ¼ �X
smð~kjÞAjA
�j �
1
b
Xsgð~kjÞBjB
�j
� CXðB�j Aj þ BjA
�j Þ
þC
6
XtjpqðAjAqAp þ A�j A�qA�pÞ
�1
3
Xðt0jpqðB
�j A�qA�p þ BjAqApÞ
þ t0pqjðB�pA�qA�j þ BpAqAjÞ
þ t0qjpðB�qA�j A�p þ BqAjApÞÞ
þ3
2
XðgA2
j A�2j þdb
B2j B�2j Þ
þ 3X
gAjA�j ApA�p þ
db
BjB�j BpB�p
� �, ð3:11Þ
and Eqs. (3.3) are zmdAj
dt¼ � qE
qA�j, zg
dBj
dt¼ �b qE
qB�j. The
reasons for the factors of 16and 1
3multiplying the cubic
terms is that these sums are over all j0; p0; q0 such that~kj0 þ
~kp0 þ~kq0 ¼ 0, and a derivation with respect to a fixed j
must act on each j0; p0; q0. A similar remark holds for thefactor of 3 on the quartic term. The b! 0 limit shows thatthe growth field decouples. Note that in this limit equation(3.3b) has no terms depending on Aj. If there is an energyfunctional, we can view the evolution of the plant’s surfacedeformation and phyllotactic lattice as a landscape whichevolves as the plant size, measured by G, increases. Oldminima will disappear and be replaced by new ones. It iseasy to picture that sequential minima lie in the sameneighborhood of Aj ;Bj space. As G increases, system (3.3)is going to relax into the nearest minimum accessible to itfrom its previous positions. That may not, and in fact mostoften will not, be an absolute minimum of E. In Shipmanand Newell (2005), we showed that absolute minima tendto be associated with N-whorl structures. If there is noenergy functional, we do not necessarily know that theattractors of (3.3) are stable fixed points. When E exists, wechoose the radial wavenumbers lj by calculating Aj and Bj
for different values of the radial wavenumbers and thenchoosing that set which minimizes the value of E at its localminimum. The corresponding procedure when E does notexist is to choose the radial wavenumbers on the basis ofthe most stable solution.
11. Modulated patterns. No pattern is a perfect lattice.Moreover, as the plant size increases, there are transitionsfrom one lattice to another. There is a useful way forincorporating such modulations in our description. We willsimply state the main idea here; a later work will examinepossible outcomes. In order to include a band of wave-numbers in the radial direction, we simply allow the orderparameters Aj and Bj to depend slowly on the spatialvariable r as well as on time. This introduces diffusion terms
proportional toq2Aj
qr2and
q2Bj
qr2into (3.3) with coefficients that
depend on the curvatures of the functions of sm and sg,defined as functions of l, the radial wavenumber, near theirmaxima. Solutions of the partial differential equations forthe order parameters will admit solutions corresponding totransitions between two different perfect lattice states.Spatially modulated amplitudes will be very useful inallowing us to change slowly the radial wavenumber in thecase where we allow the plant size also to be slowly varying.
3.5. A brief review of relevant previous results
It is worthwhile reviewing briefly previous results whenonly mechanical forces were involved and it was assumedthat phylla would simply grow at the maxima of the surfacedeformation as long as the maxima were isolated. The keyresults were:
1.
The linearly most unstable mode is always purelycircumferential. However, for sufficiently strong quad-ratic coupling, the purely circumferential mode isunstable to a three mode structure. The ratios of theamplitudes of the other two modes and the amplitude ofthe circumferential of the stationary state increases withthe ratio of quadratic to linear coefficients.2.
The quadratic coefficient tjpq in (3.3) arising from thestrain elastic energy is maximum when one of its radialwavenumbers is zero. This means that this coefficient isa sensitive function of the divergence angle d0 andprefers values of d0 which are ratios of next toconsecutive members of the Fibonacci sequence. Also,the balance between the linear growth rate sm and tensures that the radial wavenumbers of the other twoparticipating modes in the triad are order one.3.
When G ¼ 2N, absolute minima are achieved for threemode structures with circumferential wavenumbers N;N; 2N. When G increases to 2N þ 1, the preferred struc-ture has circumferential wavenumbers, N ;N þ 1;2N þ 1.4.
Fibonacci sequences appear because if P is sufficientlysupercritical, more than one triad can compete. Forexample, if one begins with a 2, 3, 5 structure with G ¼ 5and then lets G increase, it is possible for thewavevectors ~k7 ¼~k2 þ~k5 and ~k8 ¼
~k3 þ~k5 to compete.
The coefficient of the quadratic terms A2A5 and A3A5
are maximized when d4 25and do 2
5, respectively. In
almost all circumstances and very much because of the

ARTICLE IN PRESSA.C. Newell et al. / Journal of Theoretical Biology 251 (2008) 421–439434
bias on the outer boundary of the radial region providedby the 3 and 5 modes (the 2 mode is more stronglydamped), the latter wins and the new stationary state isa combination of the four modes ~k2; ~k3; ~k5; ~k8, withcorresponding amplitudes A2 ’ A8oA3 ’ A5 whichleads to a diamond shape. As G continues to increase,the participating modes are ~k2; ~k3; ~k5; ~k8; ~k13 and theamplitudes A2 ’ A13oA3 ’ A5oA8. All these transi-tions are second order and d0 changes continuouslytowards the golden angle value.
5.
The shape of the graph of the amplitudes Aj is invariantas G increases (see Shipman and Newell, 2005, Fig. 28).A later paper will discuss the extension of these results tothe case where biochemistry is included. For the remainderof this paper, however, our goal is to illustrate with twoexamples how the two mechanisms can cooperate and inparticular to demonstrate the nontrivial connection be-tween the phyllotactic lattice, namely the lattices of auxinmaxima and the corresponding surface deformations andtilings.
3.6. Four cases
Now that we have laid the groundwork, we proceed tosome new results which accentuate the role that auxin canplay in forming the plant surface and phyllotacticarrangements. We are guided by the graphs of theindividual growth functions smðl;mÞ and sgðkÞ and theircomposite sþðl;mÞ, as shown in Fig. 4. We discuss fourdifferent cases.
Case 1: Auxin dominates. In Fig. 4(a), we show thesurfaces sgðl;mÞ, smðl;mÞ projected on the plane l ¼ 0. Thevalue of the PIN1 transport has reached the critical levelHc ¼ 2 and the auxin distribution is about to becomeunstable to the wavenumber ðl2 þ m2
G2Þ1=2¼ 1. The auxin
fluctuation amplitudes Bj will be determined from (3.3b).The corresponding surface deformation mode amplitudesAj will be slaved to the auxin fluctuation amplitudes Bj byzmsmðlj ;mjÞAj ¼ �CBj. The surface deformation will lookvery similar to the auxin deformation.
Case 2: The compressive stress dominates. This is theopposite of case 1. For l ¼ 0; m
G ¼ 1 ’ffiffiffiffiLp
, sm is about tocross-zero for the circumferential mode ~k1 ¼ ð0; 1Þ so thatm ¼ G. As we have shown in Shipman and Newell (2005),for t sufficiently large, the circumferential mode will beunstable to modes with nontrivial radial structures ~k2 ¼
ð�l; m2GÞ,
~k3 ¼ ðl; m2GÞ. The resulting m
2-whorl will drive the
slaved auxin concentrations zgsgð0;mÞB1 ¼ bCA1, zgsg
ð0; m2ÞBj ¼ bCAj, j ¼ 2; 3. Here, and in the following, we
write sgð0;mÞ for sð~k3 ¼ ð0; 2NG ÞÞ.
Case 3: Cooperation. Linear resonance. From this case,we can also understand the outcomes of cases 1 and 2. Bothgrowth functions smðl;mÞ and sgðl;mÞ have maxima incommon and the values of both PIN1 transport and thecircumferential compressive stress are close to their critical
values. Fig. 4(b) shows the projections of sm and sg on theplane l ¼ 0. We examine this in Section 3.7.
Case 4: Cooperation. Nonlinear resonance. The twofields are also coupled through the nonlinear terms in Eqs.(3.2a) and (3.2b). In Section 3.8, we examine how thisnonlinear coupling can lead to different lattice-planformcombinations.
3.7. Anatomy of an N-whorl. Cooperation, linear resonance
We now illustrate these ideas by examining the transitionbetween cases 1 and 3. We investigate the anatomy of anN-whorl phyllotactic pattern as the in-surface inducedcompressive stress P increases from a value for whichsm ¼ �0:5 to 0. The change in-surface geometry is dra-matic (Fig. 6).By an N-whorl we mean a phyllotactic lattice pattern in
which primordia form in groups of N elements equidistantfrom the center of the plant, equidistant to each other, andoffset by an angle 2pd0 ¼
2p2N
from the previously formedprimordia. N-whorls are produced by the wavevector
choices ~k2N ¼ ð0; 2NG Þ;
~kþ
N ¼ ðl;�NGÞ,
~k�
N ¼ ð�l;� NGÞ for l ¼ffiffi
3p
2(see Shipman and Newell, 2005). We imagine that auxin
is the main instigator of the phyllotactic system and choosem ¼ G ¼ 2N and sgðkÞ ¼ 0 so that the three modes are
~k2N ¼ ð0; 1Þ, ~kþ
N ¼ ðl;�12Þ, ~k
�
N ¼ ð�l;� 12Þ. We begin by
taking b ¼ 0 so that growth is unaffected by local stresschanges. In this case, there is an exact hexagonal solutionjB2N j ¼ jB
þN j ¼ jB
�N j ¼ b for (3.3b). We then calculate the
corresponding amplitudes A2N , AþN , A�N for the surfacedeformation. We take smðl;�NÞ ¼ smð�l;�NÞ ¼ �0:5
and examine the ratiosjAþ
Nj
jA2N jas smð0; 2NÞ is increased from
�0:5 to 0. The results are shown in Fig. 5(a), and the plantsurface and phyllotactic lattice for N ¼ 6 are drawn inFig. 6. We note the following very important conclusion.For smð0; 2NÞ ¼ �0:5, strongly negative, the ratios
jAþN j
jA2N j¼jA�N j
jA2N j¼ 1,
and the surface deformation has the same hexagonal shapeas that of the auxin concentration field. But, as smð0; 2NÞ
approaches zero, the mechanical buckling instability takeson a life of its own. The surface deformation amplitudesare no longer linearly slaved to the auxin concentrationfield, but involve their nonlinear terms in (3.3a). We notethat, as smð0; 2NÞ evolves from �0:5 to 0, the above ratioof amplitudes decreases from 1 to 0.25. The resultingsurface deformation is strongly ridge-like (see Fig. 6). Thispattern continues as we increase the coupling of stress andgrowth by increasing b from zero to finite values. Theresults are shown in Fig. 5(b,c). Again, as smð0; 2NÞ
approaches zero, the surface deformation is more ridge-likealthough the parameter b means that the local stress andgrowth are more strongly coupled at the linear level.

ARTICLE IN PRESS
Fig. 5. (a) As described in the text, the amplitudes AþN ;A�N ;A2N are found for the case b ¼ 0;C ¼ 0:4;k ¼ 0:25; g ¼ 1
15 ;L ¼ 1. Plotted is the
ratio jAþN j=jA2N j ¼ jA�N j=jA2N j as a function of smð0; 2NÞ. (b,c) The effect of the biochemical–mechanical coupling coefficient b on the amplitude ratios.
For b increasing from 0 to positive values, the amplitude ratios jAþN j=jA2N j and jBþN j=jB2N j are plotted as functions of smð0; 2NÞ. Other parameters are as
for part (a).
A.C. Newell et al. / Journal of Theoretical Biology 251 (2008) 421–439 435
Thus, it is not at all contradictory for plants to display aphyllotactic lattice configuration (the arrangement ofphylla on the surface) which is very different in appearancefrom the surface deformation. The auxin concentrationand surface deformation fields share the same geometry(the same ~kj’s), but their amplitude ratios are different.
In the simulations of Figs. 5 and 6, the curvatureparameter C is taken to be C ¼ 0:340. Positive (respec-tively negative) C correspond to a convex (respectivelyconcave) apical meristem and C ¼ 0 to a flat apical meris-tem. Without the coupling to an auxin field, we found inShipman and Newell (2005) that Co0 is required forpositive amplitudes Aj of the surface deformation; forC40 the mechanical energy-minimizing amplitudes Aj
were found to be negative, and the resulting surfacedeformation is one in which the centers of the phylla arethe minima, not the maxima of the surface. In thesimulations reported here, the positive amplitudes Bj allowfor stable solutions with Aj40 even with C40. This isimportant, since although C might indeed be negative inmany cactus meristems, most plant meristems are convex.
3.8. Cooperation. Nonlinear resonance
In Shipman and Newell (2004, 2005), we showed that, asthe plant grows, its phyllotactic pattern is governed byoverlapping triads ~km; ~kn; ~kmþn; ~kmþ2n; . . . whose circumfer-ential wavenumbers are sequential members of theFibonacci sequence (see Remark 9). We now reexaminethis scenario when both mechanical buckling and auxin
redistribution processes are in play. The new result againillustrates the importance of amplitudes in determiningwhat is observed. We choose the simple case b ¼ 0 soEqs. (3.3b) for the biochemical amplitudes Bj decouplefrom the mechanical amplitudes Aj. The energy EðAj ;BjÞ in(3.11) does not apply when b ¼ 0, but the Bj-amplitudeequations are the variations
dBj
dt¼ � q
qBjEB of the energy
EBðBjÞ ¼ �X
sgð~kjÞBjB
�j � k
XðB�j B�pB�q þ BjBpBqÞ
þ3
2dX
bBjB�j þ 6d
XðBjB
�j BpB�pÞ. ð3:12Þ
EBðBjÞ is the limit of bEðAj ;BjÞ as b tends to zero. Thisenergy only applies for the symmetric case k ¼ kjpq ¼
kpqj ¼ kqjp ¼ k. We will allow for wavevector choices forwhich this condition does not hold, and to solve theequations we approximate the coefficient kjpq by a constantk. Our strategy, then, is to find an EB-energy-minimizingchoice of wavevectors ~kj and corresponding amplitudes Bj.These values of ~kj and Bj are then used in the Aj-amplitudeequations (3.3a) to find the amplitudes Aj. Physically, thiscorresponds to an auxin-transport instability determining apatterned, nonuniform stress state which can then lead to abuckling instability with the same underlying phyllo-tactic lattice (encoded in the choice of ~kj), but possibly adifferent amplitude distribution and therefore differenttiling planform.In contrast to the previous discussion of whorls, we now
allow for multiple triads of wavevectors favored by thenonlinear interactions. We include the eight wavevectors

ARTICLE IN PRESS
Fig. 6. The surface deformation and auxin distribution corresponding to
the experiments of Fig. 5(a). In the top two rows, the deformation w ¼
Aþ6 cosðlrþ 6aÞ þ A�6 cosð�lrþ 6aÞ þA12 cosð12aÞ is plotted as a deforma-
tion of the sphere for A�6 =A12 ¼13(first column, corresponding to sm ¼ 0
in Fig. 5(a)), A�6 =A12 ¼23(second column, corresponding to sm ¼ �
13in
Fig. 5(a)) and A�6 =A12 ¼ 1 (third column, corresponding to sm ¼ �12in
Fig. 5(a)). The auxin distribution is plotted in the third row together with
the surface deformation and in the center of the fourth row by itself;
plotted is g ¼ Bþ6 cosðlrþ 6aÞ þ B�6 cosð�lrþ 6aÞ þ B12 cosð12aÞ with
Bþ6 ¼ B�6 ¼ B12. Pictured also in the fourth row are plants that show
similar surface deformations.
Fig. 7. The amplitudes Aj , Bj (vertical axis) vs. angular wavenumber. The
amplitude equations for eight modes with angular wavenumbers
3; 5; . . . ; 89 are solved as described in the text for the parameter values
G ¼ 19:2, H ¼ 2:4, k ¼ 3, d ¼ 0:01, C ¼ 1, g ¼ 0:01, w ¼ 0 and (i) L ¼ 1,
P ¼ 2:4, or (ii) L ¼ 5, P ¼ 6. Plotted are the amplitudes Bj (dotted line)
and the amplitudes Aj (solid lines).
Fig. 8. Simulations of surface deformations corresponding to the
experiment of Fig. 7. Graphed are the surface deformations wðs; aÞ for(a,c) L ¼ 1, (b,d) L ¼ 5; (a,b) for the plastochrone difference (s ¼ r); (c,d)
with the plastochrone ratio (s ¼ lnðrÞ). In (a,b), the phyllotactic lattice
corresponding to the maxima of the deformation is marked by white
crosses; both figures display the same lattice.
A.C. Newell et al. / Journal of Theoretical Biology 251 (2008) 421–439436
~k3; ~k5; ~k8 ¼~k3 þ
~k5; ~k13 ¼~k5 þ
~k8; ~k21 ¼~k8 þ
~k13; ~k34 ¼~k13 þ
~k21; ~k55 ¼~k21 þ
~k34; ~k89 ¼~k34 þ
~k55, where
~k3 ¼2pl0ð1� 3d0Þ;
3
G
� �; ~k5 ¼
2pl0ð2� 5d0Þ;
5
G
� �.
For a given choice of G and H slightly above critical, wefind the values of the divergence angle 2pd0 andplastochrone ratio l0 and the amplitudes B3;B5; . . . ;B89
that minimize the energy (3.12). For G ’ 19 andH ¼ 2:4 ¼ Hc þ 0:4, we find d0 ¼ 0:3816 (close to thegolden angle 2pd0 ¼ 2pð0:3819662:::Þ) and the amplitudesBj graphed in Fig. 7. These values and Eq. (3.3a) thendetermine the amplitudes Aj, and the surface deformationsare graphed in Fig. 8.
Of particular interest is the parameter L ¼L4
g
L4mmeasuring
the ratio of natural biochemical Lg and mechanical Lm
wavelengths. For L ¼ 1, the amplitudes Aj match the
amplitudes Bj; in both cases, the amplitude correspondingto angular wavenumber n ¼ 13 is the largest; see Fig. 7.This results in a configuration of diamond-shaped phylla asshown in Fig. 8(a,c). For L ¼ 5, the favored biochemical

ARTICLE IN PRESSA.C. Newell et al. / Journal of Theoretical Biology 251 (2008) 421–439 437
wavelength isffiffiffi54p’ 1:5 times the favored mechanical
wavelength, and the amplitudes Aj are maximized atangular wavenumber n ¼ 21. The resulting surface defor-mation is that of elongated (relative to the case L ¼ 1)diamond-shaped phylla. These results are robust and notsensitive to the choice of parameters d; g; k, and C.
4. Discussion
In this paper, we have shown that existing models for thetwo proposed mechanisms for phyllotactic pattern forma-tion—auxin transport and mechanical buckling—havegoverning equations that are very similar in form butdiffer in the interpretation of parameters. Both sets ofequations determine an instability to periodic deformationsof a given natural wavelength as a bifurcation parameter—either the auxin-transport parameter H or the compressivestress P—increases above a critical value. And, bothmodels are accessible to analysis by the reduction toamplitude equations that are universal in form but containinformation about the microscopic mechanism in theircoefficients. In particular, the coefficients sg and sm of thelinear terms in the amplitude equations determine the set ofactive modes that participate in the determination of thepattern, whereas the coefficients kjpq and tjpq of the quad-ratic terms bring into play triad interactions that areimportant for the formation of lattice structures.
The universal form of the amplitude equations highlightsthe fact that the results of any model must be interpretedwith care. As emphasized in the introduction, it is notenough to obtain results that mimic real plants; the resultsmust lead to testable predictions and determination of keyparameters or combinations of parameters. What predic-tions result from our combined auxin-mechanical model?Let us review the results. The coupling between mechanicsand biochemistry can be either passive or active andinvolve both linear and nonlinear terms in the equations.Therefore, different outcomes involving the relationshipbetween the chosen phyllotactic lattice and the correspond-ing planform are possible.
Cases 1/2: If either auxin transport or compressive stressdominates as the critical instability-driving mechanism,then that mechanism determines the phyllotactic lattice(the wavevectors ~kj) and also the corresponding ampli-tudes. The amplitudes for the other mechanism are slavedand match those of the dominant mechanism. The domi-nant mechanism therefore determines both the phyllotacticlattice and the tiling planform.
Case 3: If the compressive stress and auxin-transportparameters P and H are both near critical, cooperationbetween the two mechanisms can occur through the linearterms in the equations. In this case, a set of wavevectors ~kj
is chosen, but the corresponding amplitudes Bj of the auxindistribution may not match the amplitudes Aj of thebuckling configuration. In particular, we show in Fig. 6how N-whorls with BþN ¼ B�N ¼ B2N but ridge-like surfacedeformation amplitudes AþN ¼ A�N5A2N may arise.
Case 4: The cooperation between the two mechanismsmay occur through the nonlinear terms in the equations.This results in Fibonacci-like planforms which involvemultiple triads of wavevectors driven by the nonlinearterms. Key to understanding the relation between thephyllotactic lattice and the tiling planform is the parameter
L ¼L4
g
L4m, giving the ratio of biochemical to mechanical
natural wavelengths. We show in Fig. 8 how diamond-shaped phylla or elongated diamond phylla are preferreddepending on how close L is to 1. For L ¼ 1, we are closeto a linear resonance.
The relative sizes of the parameters P and H and theirproximity to their critical values thus distinguishes betweencases 1/2, in which one mechanism dominates, and thecooperative cases 3/4. Nonlinear cooperation (case 4) andthe related diamond-shaped planforms are favored by largequadratic coefficients tjpq and kjpq which bring in thenonlinear interactions. The mechanical coefficient tjpq isproportional to the curvature of the buckling surface; oneexpects therefore a larger nonlinear effect on a more curvedapical meristem. The biochemical quadratic coefficient kjpq
is, in general, not symmetric over permutations of j; p; qdue to the fact that the biochemical system is not thegradient of an energy. However, for certain wavevectorchoices, including those that are associated with N-whorlconfigurations, kjpq is symmetric and the system is thengradient. In our simulations, we approximated kjpq by aconstant and therefore studied a gradient system, but adeeper understanding of the role of a nongradient system indetermining the choice of pattern is desired. Still lacking isan understanding the relationship between gradient or non-gradient PDE models and the energy-landscape approachto phyllotaxis central to the work of Levitov (1991a, b),Douady and Couder (1996a, b), Atela et al. (2002), andHotton et al. (2006).
We should also comment on how the continuumapproximation developed here can complement the discretemodel of Jonnson et al. A discrete model has the advantageof directly capturing the fact that cells are discrete objects.One consequence of going to a continuum model is that weneed to introduce a cubic saturation term and parameter dinto the amplitude equations to achieve finite-amplitudesolutions. In the discrete model, it is enough to assume thatthere is fixed amount of total auxin to prevent an infiniteamount of auxin from accumulating in a cell. However,Jonnson et al. also note that their simulations tend not togive stable patterns. It is not clear from the discrete modelif this is due to how the cells are connected or if the modelis nongradient. Both effects may be important, but ourcontinuum approximation reveals that the model is non-gradient due to the asymmetry of the quadratic coefficientas a function of the wavevectors. There is no reason toexpect that a biochemical mechanism would be gradient,but the form of the quadratic terms in the discrete model(coming from the relation (2.6)) still needs experimentaljustification. We note that Heisler and Jonsson (2006)
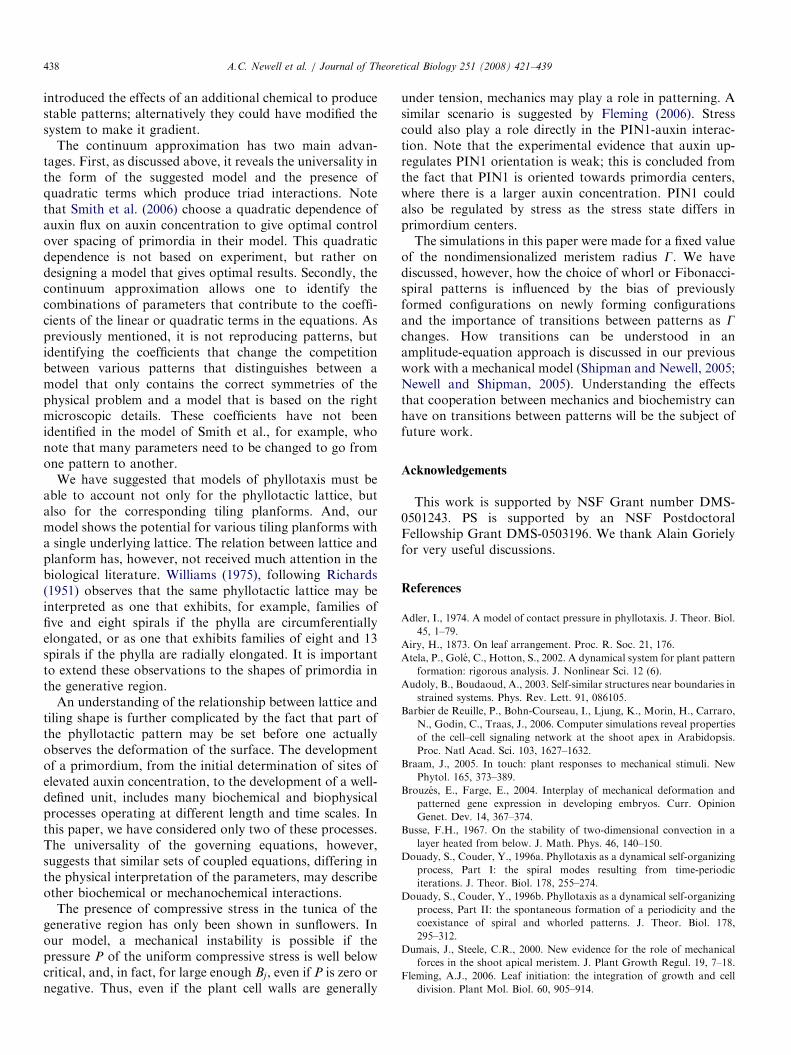
ARTICLE IN PRESSA.C. Newell et al. / Journal of Theoretical Biology 251 (2008) 421–439438
introduced the effects of an additional chemical to producestable patterns; alternatively they could have modified thesystem to make it gradient.
The continuum approximation has two main advan-tages. First, as discussed above, it reveals the universality inthe form of the suggested model and the presence ofquadratic terms which produce triad interactions. Notethat Smith et al. (2006) choose a quadratic dependence ofauxin flux on auxin concentration to give optimal controlover spacing of primordia in their model. This quadraticdependence is not based on experiment, but rather ondesigning a model that gives optimal results. Secondly, thecontinuum approximation allows one to identify thecombinations of parameters that contribute to the coeffi-cients of the linear or quadratic terms in the equations. Aspreviously mentioned, it is not reproducing patterns, butidentifying the coefficients that change the competitionbetween various patterns that distinguishes between amodel that only contains the correct symmetries of thephysical problem and a model that is based on the rightmicroscopic details. These coefficients have not beenidentified in the model of Smith et al., for example, whonote that many parameters need to be changed to go fromone pattern to another.
We have suggested that models of phyllotaxis must beable to account not only for the phyllotactic lattice, butalso for the corresponding tiling planforms. And, ourmodel shows the potential for various tiling planforms witha single underlying lattice. The relation between lattice andplanform has, however, not received much attention in thebiological literature. Williams (1975), following Richards(1951) observes that the same phyllotactic lattice may beinterpreted as one that exhibits, for example, families offive and eight spirals if the phylla are circumferentiallyelongated, or as one that exhibits families of eight and 13spirals if the phylla are radially elongated. It is importantto extend these observations to the shapes of primordia inthe generative region.
An understanding of the relationship between lattice andtiling shape is further complicated by the fact that part ofthe phyllotactic pattern may be set before one actuallyobserves the deformation of the surface. The developmentof a primordium, from the initial determination of sites ofelevated auxin concentration, to the development of a well-defined unit, includes many biochemical and biophysicalprocesses operating at different length and time scales. Inthis paper, we have considered only two of these processes.The universality of the governing equations, however,suggests that similar sets of coupled equations, differing inthe physical interpretation of the parameters, may describeother biochemical or mechanochemical interactions.
The presence of compressive stress in the tunica of thegenerative region has only been shown in sunflowers. Inour model, a mechanical instability is possible if thepressure P of the uniform compressive stress is well belowcritical, and, in fact, for large enough Bj, even if P is zero ornegative. Thus, even if the plant cell walls are generally
under tension, mechanics may play a role in patterning. Asimilar scenario is suggested by Fleming (2006). Stresscould also play a role directly in the PIN1-auxin interac-tion. Note that the experimental evidence that auxin up-regulates PIN1 orientation is weak; this is concluded fromthe fact that PIN1 is oriented towards primordia centers,where there is a larger auxin concentration. PIN1 couldalso be regulated by stress as the stress state differs inprimordium centers.The simulations in this paper were made for a fixed value
of the nondimensionalized meristem radius G. We havediscussed, however, how the choice of whorl or Fibonacci-spiral patterns is influenced by the bias of previouslyformed configurations on newly forming configurationsand the importance of transitions between patterns as Gchanges. How transitions can be understood in anamplitude-equation approach is discussed in our previouswork with a mechanical model (Shipman and Newell, 2005;Newell and Shipman, 2005). Understanding the effectsthat cooperation between mechanics and biochemistry canhave on transitions between patterns will be the subject offuture work.
Acknowledgements
This work is supported by NSF Grant number DMS-0501243. PS is supported by an NSF PostdoctoralFellowship Grant DMS-0503196. We thank Alain Gorielyfor very useful discussions.
References
Adler, I., 1974. A model of contact pressure in phyllotaxis. J. Theor. Biol.
45, 1–79.
Airy, H., 1873. On leaf arrangement. Proc. R. Soc. 21, 176.
Atela, P., Gole, C., Hotton, S., 2002. A dynamical system for plant pattern
formation: rigorous analysis. J. Nonlinear Sci. 12 (6).
Audoly, B., Boudaoud, A., 2003. Self-similar structures near boundaries in
strained systems. Phys. Rev. Lett. 91, 086105.
Barbier de Reuille, P., Bohn-Courseau, I., Ljung, K., Morin, H., Carraro,
N., Godin, C., Traas, J., 2006. Computer simulations reveal properties
of the cell–cell signaling network at the shoot apex in Arabidopsis.
Proc. Natl Acad. Sci. 103, 1627–1632.
Braam, J., 2005. In touch: plant responses to mechanical stimuli. New
Phytol. 165, 373–389.
Brouzes, E., Farge, E., 2004. Interplay of mechanical deformation and
patterned gene expression in developing embryos. Curr. Opinion
Genet. Dev. 14, 367–374.
Busse, F.H., 1967. On the stability of two-dimensional convection in a
layer heated from below. J. Math. Phys. 46, 140–150.
Douady, S., Couder, Y., 1996a. Phyllotaxis as a dynamical self-organizing
process, Part I: the spiral modes resulting from time-periodic
iterations. J. Theor. Biol. 178, 255–274.
Douady, S., Couder, Y., 1996b. Phyllotaxis as a dynamical self-organizing
process, Part II: the spontaneous formation of a periodicity and the
coexistance of spiral and whorled patterns. J. Theor. Biol. 178,
295–312.
Dumais, J., Steele, C.R., 2000. New evidence for the role of mechanical
forces in the shoot apical meristem. J. Plant Growth Regul. 19, 7–18.
Fleming, A.J., 2006. Leaf initiation: the integration of growth and cell
division. Plant Mol. Biol. 60, 905–914.

ARTICLE IN PRESSA.C. Newell et al. / Journal of Theoretical Biology 251 (2008) 421–439 439
Fleming, A.J., McQueen-Mason, S., Mandel, T., Kuhlemeier, C., 1997.
Induction of leaf primordia by the cell wall protein expansion. Science
276.
Goriely, A., Ben Amar, M., 2005a. Differential growth and instability in
elastic shells. Phys. Rev. Lett. 94, 198103.
Goriely, A., Ben Amar, M., 2005b. Growth and instabilities in elastic
tissues. J. Mech. Phys. Solids. 53, 2284–2319.
Green, P.B., 1999. Expression of pattern in plants: combining molecular
and calculus-based paradigms. Am. J. Bot. 86.
Green, P.B., Steele, C.S., Rennich, S.C., 1998. How plants produce
patterns. A review and a proposal that undulating field behavior is the
mechanism. In: Jean, R.V., Barabe, D. (Eds.), Symmetry in Plants.
World Scientific, Singapore, pp. 359–392.
Heisler, M.G., Jonsson, H., 2006. Modeling auxin transport and plant
development. J. Plant Growth Regul. doi: 10.1007/s00344-006-0066-x.
Hernandez, L.H., Green, P.B., 1993. Transductions for the expression of
structural pattern: analysis in sunflower. Plant Cell 5, 1725–1738.
Hofmeister, W., 1868. Allegmeine Morphologie der Gewachse, Handbuch
der Physiologischen Botanik. Engelmann, Leipzig.
Hotton, S., Johnson, V., Wilbarger, J., Zwieniecki, K., Atela, P., Gole, C.,
Dumais, J., 2006. The possible and the actual in phyllotaxis: bridging
the gap between experimental observations and iterative models.
J. Plant Growth Regul. 25, 313–323.
van Iterson, I., 1907. Mathematische und Mikroskopisch-Anatomische
Studien uber Blattstellungen nebst Betrachtungen uber den Schalenbau
der Miliolinen. Gustav Fischer, Jena.
Jonsson, H., Heisler, M.G., Shapiro, B.E., Meyerowitz, E.M., Mjolsness,
E., 2006. An auxin-driven polarized transport model for phyllotaxis.
Proc. Natl Acad. Sci. 103, 1633–1638.
Koiter, W.T., 1963. Proc. K. Ned. Akad. Wet. B Phys. Sci. 66, 263.
Levitov, L.S., 1991a. Energetic approach to phyllotaxis. Europhys. Lett.
14, 533–539.
Levitov, L.S., 1991b. Phyllotaxis of flux lattices in layered super-
conductors. Phys. Rev. Lett. 66, 224–227.
Meinhardt, H., 1984. Models of Biological Pattern Formation. Academic
Press, London.
Newell, A.C., Shipman, P.D., 2005. Plants and Fibonacci. J. Stat. Phys.
121 (5–6), 937–968.
Reinhardt, D., Mandel, T., Kuhlemeier, C., 2000. Auxin regulates the
initiation and radial position of lateral organs. Plant Cell 12, 501–518.
Reinhardt, D., Pesce, E.-R., Stieger, P., Mandel, T., Baltensperger, K.,
Bennett, M., Traas, J., Friml, J., Kuhlemeier, C., 2003. Regulation of
phyllotaxis by polar auxin transport. Nature 426, 255–260.
Richards, F.J., 1951. Phyllotaxis: its quantitative expression and relation
to growth in the apex. Philos. Trans. R. Soc. B 235, 509–564.
Schoute, J.C., 1913. Beitrage zur Blattstellungslehre I. Die Theorie. Rec.
Trav. Bot. Neerl. 10, 153–339.
Schwabe, W.W., Clewer, A.G., 1984. Phyllotaxis—a simple computer
model based on the theory of a polarly-induced inhibitor. J. Theor.
Biol. 109, 595–619.
Schwendener, S., 1909. Theorie der Blattstellungen. Sitzungsber. Akad.
Wiss. Berlin 741–773.
Sharon, E., Roman, B., Swinney, H.L., 2007. Geometrically-driven wrinkling
observed in free plastic sheets and leaves. Phys. Rev. E 75, 046211.
Shipman, P.D., Newell, A.C., 2004. Phyllotactic patterns on plants. Phys.
Rev. Lett. 92 (16), 168102.
Shipman, P.D., Newell, A.C., 2005. Polygonal planforms and phyllotaxis
on plants. J. Theor. Biol. 236, 154–197.
Shraiman, B.I., 2005. Mechanical feedback as a possible regulator of tissue
growth. Proc. Natl Acad. Sci. 102.
Smith, R.S., Guyomarc’h, S., Mandel, T., Reinhardt, D., Kuhlemeier, C.,
Prusinkiewicz, P., 2006. A plausible model of phyllotaxis. Proc. Natl
Acad. Sci. 103, 1301–1306.
Snow, M., Snow, R., 1951. On the presence of tissue tension in apices.
New Phytol. 50, 185–484.
Snow, M., Snow, R., 1952. Minimum areas and leaf determination. Proc.
R. Soc. B 139, 545–566.
Veen, A.H., Lindenmayer, A., 1977. Diffusion mechanism for phyllotaxis,
theoretical, physico-chemical and computer study. Plant Physiol. 60,
127–139.
Vieten, A., Vanneste, S., Wisniewska, W., Benkova, E., Benjamins, R.,
Beeckman, T., Luschnig, C., Friml, J., 2005. Functional redundancy of
PIN proteins is accompanied by auxin-dependent cross-regulation of
PIN expression. Development 132, 4521–4531.
Williams, R.F., 1975. The Shoot Apex and Leaf Growth. Cambridge
University Press, Cambridge.