Embed Size (px)
Citation preview
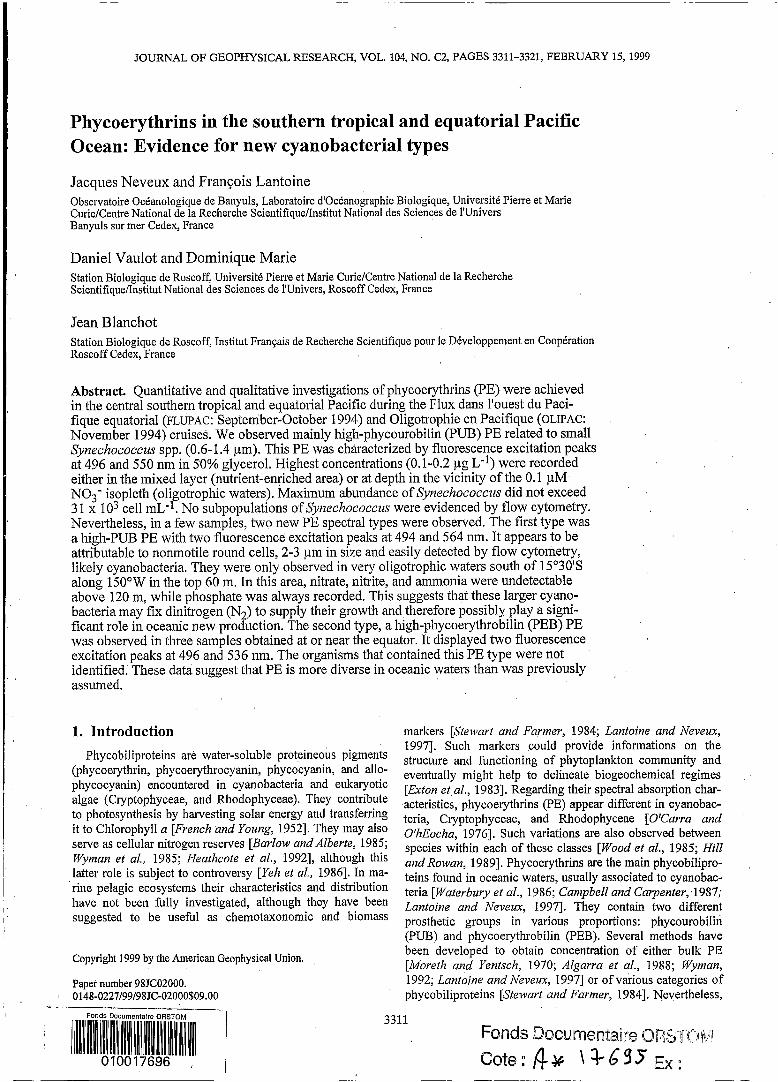
JOURNAL OF GEOPHYSICAL RESEARCH, VOL. 104, NO. C2, PAGES 3311-3321, FEBRUARY 15, 1999
Phycoerythrins in the southern tropical and equatorial Pacific Ocean: Evidence for new cyanobacterial types
Jacques Neveux and François Lantoine Observatoire Océanologique de Banyuls, Laboratoire d'Océanographie Biologique, Université Pierre et Marie CurieKentre National de la Recherche Scientifique/Institut National des Sciences de l'Univers Banyuls sur mer Cedex, France
Daniel Vaulot and Dominique Marie Station Biologique de Roscoff, Université Pierre et Marie CurieKentre National de la Recherche ScientifiqueDnstitut National des Sciences de l'univers, Roscoff Cedex, France
Jean Blanchot Station Biologique de Roscoff, Institut Français de Recherche Scientifique pour le Développement en Coopération Roscoff Cedex, France
Abstract. Quantitative and qualitative investigations of phycoerythrins (PE) were achieved in the central southern tropical and equatorial Pacific during the Flux dans l'ouest du Paci- fique equatorial (FLUPAC: September-October 1994) and Oligotrophie en Pacifique (OLIPAC: November 1994) cruises. We observed mainly high-phycourobilin (PUB) PE related to small Syneehococcus spp. (0.6-1.4 pm). This PE was characterized by fluorescence excitation peaks at 496 and 550 nm in 50% glycerol. Highest concentrations (0.1-0.2 pg L-l) were recorded either in the mixed layer (nutrient-eryiched area) or at depth in the vicinity of the O. 1 pM NO3- isopleth (oligotrophic waters). Maximum abundance of Synechoeoceus did not exceed 3 1 x lo3 cell mL-1. No subpopulations of Synechoeoceus were evidenced by flow cytometry. Nevertheless, in a few samples, two new PE spectral types were observed. The first type was a high-PUB PE with two fluorescence excitation peaks at 494 and 564 nm. It appears to be attributable to nonmotile round cells, 2-3 pm in size and easily detected by flow cytometry, likely cyanobacteria. They were only observed in very oligotrophic waters south of 15'30's along 150'W in the top 60 m. In this area, nitrate, nitrite, and ammonia were undetectable above 120 m, while phosphate was always recorded. This suggests that these larger cyano- bacteria may fix dinitrogen (N2) to supply their growth and therefore possibly play a signi- ficant role in oceanic new production. The second type, a high-phycoerythrobilin (PEB) PE was observed in three samples obtained at or near the equator. It displayed two fluorescence excitation peaks at 496 and 536 nm. The organisms that contained this PE type were not identified. These data suggest that PE is more diverse in oceanic waters than was previously assumed.
1. Introduction Phycobiliproteins ase water-soluble proteineous pigments
(phycoerythrin, phycoerythrocyanin, phycocyanin, and allo- phycocyanin) encountered in cyanobacteria and eukaryotic algae (Cryptophyceae, and Rhodophyceae). They contribute to photosynthesis by harvesting solar energy and transferring it to Chlorophyll a [French and Young, 19521. They may also serve as cellular nitrogen reserves [Barlow and Alberte, 1985; Wyman et al., 1985; Heathcote et al., 19921, although this latter role is subject to controversy [I'eh et al., 19861. In ma- rine pelagic ecosystems their characteristics and distribution have not been fully investigated, although they have been suggested to be useful as chemotaxonomic and biomass
Copyright 1999 by the American Geophysical Union.
Paper number 98JC02000. 1 0148-0227/99/98JC-02000$09.00 -
markers [Stewart and Farmer, 1984; Lantoine and Neveux, 19971. Such markers could provide informations on the structure and functioning of phytoplankton community and eventually might help to delineate biogeochemical regimes [Exton et al., 19831. Regarding their spectral absorption char- acteristics, phycoerythrins (PE) appear different in cyanobac- teria, Cryptophyceae, and Rhodophyceae [O'Carra and O'hEocha, 19761. Such variations are also observed between species within each of these classes [Wood et al., 1985; Hill and Rowan, 19891. Phycoerythrins are the main phycobilipro- teins found in oceanic waters, usually associated to cyanobac- teria [Waterbury et al., 1986; Campbell and Carpenter, 1987; Lantoine and Neveux, 19971. They contain two different prosthetic groups in various proportions: phycourobilin (PUB) and phycoerythrobilin (PEB). Several methods have been developed to obtain concentration of either bulk PE [Moreth and Yentsch, 1970; Algarra et al., 1988; Wynian, 1992; Lantoine and Neveux, 19971 or of various categories of phycobiliproteins [Stewart and Farmer, 19841. Nevertheless,
3312 NEVEUX ET AL.: PHYCOERYTHRINS IN THE PACIFIC OCEAN
relatively few quantitative data on bulk PE in the field are available today (Mediterranean Sea [Algarra et al., 1988; Lantoine, 19951, Atlantic Ocean [Glover et al., 1988a; Lan- toine and Neveux, 19971, and Pacific Ocean [Bidigare and Ondrzisek, 19961). Qualitative information is even more scarce. Our present views on oceanic PE result from studies of various PE-containing marine species that have been isolated in culture [Alberte et al., 1984; Ong et al., 1984; Wood et al., 19851. Flow cytometry has allowed the mapping of areas of occurrence for high and low PUB Synechococcais in the North Atlantic Ocean and Caribbean Sea [Olson et al., 19881. Some direct measurements have been recently reported in the Atlantic Ocean [Lantoine and Neveux, 19971, the Mediterra- nean Sea [Lantoine, 19951, and the Black Sea [Shalapenok and Shalapenok, 19971. The present paper provides data on the quantitative and qualitative distribution of PE in the southern tropical and equatorial Pacific Ocean sampled in September-November 1994. We also examine the relationship between the PE concentration and the abundance and orange fluorescence of S'~nechococczrs cells obtained by flow cy- tometry.
2. Material and Methods 2.1. Phycoerythrin Determin a t' ion
Vertical profiles were sampled at several stations during the Flux dans l'ouest du Pacifique equatorial (FLUPAC: Sep-
' tember 23 to October 29, 1994) and Oligotrophie en Pacifique (OLIPAC: November 3 to December 1, 1994) cruises (Figure 1). Three transects were completed: the first from 15"s to 6"N along 165"E, the second along the equator from 165"E to 150"W, and the third from 16"s to ION along 150"W. Water was sampled with a rosette composed by 12 L Niskin bottles and coupled with a SeaBird conductivity-temperature-depth (CTD) probe. At each depth, 3 L of seawater were filtered onto a 47 mm Whatman GF/F glass fiber filter. Filters were stored during 2-8 days in liquid nitrogen before analysis. In previous studies [Lantoine and Nevem, 19971 PE were ex- tracted by thawing and grinding the filters in 0.1 M (pH = 6.5) phosphate buffer. As PE extraction may be difficult for some
'
10'N-I FLUPAC c 63 66 69 7273 75 O' -
- 21
O" v
Tahiti - New Caledonia -
New Zealand
I I I I I 1 1 150'E 180' 150'W 130'W
Figure 1. Ship track and sampling stations for phyco- erythrins (PE) measurements. Station numbers of the Oligotrophie en Pacifique (OLIPAC) cruise are noted in italics. Open squares represent long-term stations.
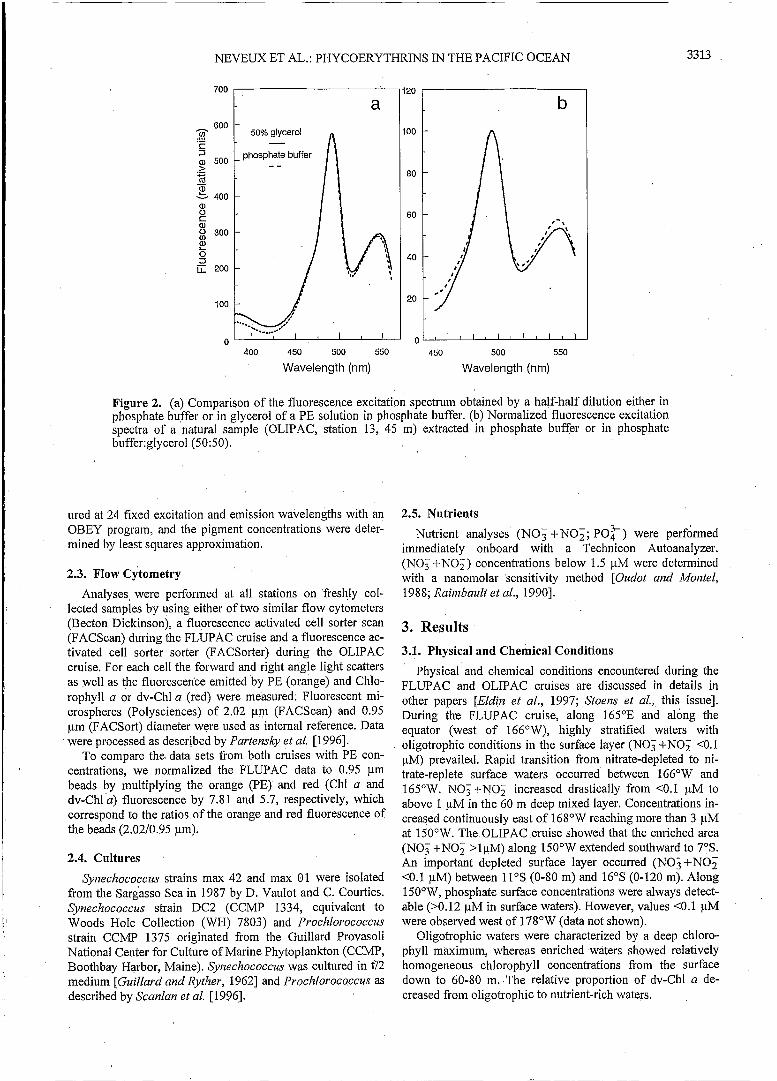
strains [Glover et al., 1988a]-, we decided to grind the filters in glass tubes containing 6 mL of 50% glycerol in phosphate buffer, following the so-called in vivo method of Wynzan [1992]. Glycerol enhances the in vivo PE fluorescence by un- coupling the energy transfer between PE and Chlorophyll a in intact cells. The extracts were vigorously shaken and then centrifuged at 3500 rpm. After transferring the supernatant into a 1 cm square measuring cuvette, fluorescence was measured on a Perkin Elmer MPF 66 spectrofluorometer us- ing an OBEY program [Lantoine and Nevezrx, 19971. The program first performed an excitation scan from 450 to 560 nm (emission: 575 nm) and then, depending on the excitation maximum found, an emission scan from 530 to 700 nm (excitation: 495 nm) or from 550 to 700 nm (excitation: 530 nm). Excitation and emission slits were set respectively to 5 and 10 nm. An additional measurement at fixed wavelengths (hexcitation = 610 nm; hemission = 650 nm; integration time = 2 s) was performed to check the presence of phycocyanin. Exci- tation and emission blank spectra were performed as follows: a new GF/F filter, impregnated with 0.2 pm pore size filtered seawater, was ground into 6 mL of a 50% glycerol solution. After centrifugation at 3500 rpm the blank spectra were re- corded and subtracted from the raw spectra of the PE extracts. Equal concentrations of PE dissolved either in phosphate buffer or in 50% glycerol showed very similar fluorescence excitation properties (Figure 2a). Therefore we calculated PE concentrations using the areas under the fluorescence excita- tion spectra, the PUBPEB ratio (495/548 nm ratio), and the formulae determined for phosphate buffer solutions [Lantoine and Neveux, 19971.
Because of the low PE concentrations observed during the first transect at 165"E, we improved the sensitivity of the as- say by increasing the excitation and emission slit widths (10 and 20 nm, respectively). In order to avoid artifacts associated with background cellular fluorescence it was necessary to shift the measuring emission wavelength from 575 to 585 nm. These changes in the optical setup were taken into account in the calculation of PE concentration by dividing the measured excitation area by 2.1.
Qualitative information was difficult to obtain for PE con- centrations <0.010 pg L-'. In such cases the first excitation peak near 495 nm was generally visible, but a significant scattering signal was superimposed on top of the second peak (550 nm) which was then ill-defined. Moreover, significant contamination of the spectra was also noted below 470 nm. In these cases, PE concentrations were assessed from the fluo- rescence at 495 nm, assuming similar excitation spectra and PUBPEB ratio to those observed at the depth of the PE maximum of the same station.
In some samples we compared the PE concentration esti- mated either with phosphate buffer [Lantoine and Neveux, 19971 or phosphate buffer:glycerol (50:50) [Wynzan, 19921 extraction. The latter procedure led clearly to 1.5-2 times higher values of PE and consequently would be preferred for quantitative PE estimation. Qualitative spectral information, however, was similar among both procedures (Figure 2b).
2.2. Chlorophyll Determin a t' ion Chlorophylls and phaeopigments including divinyl Chlo-
rophylls a (dv-Chl a) and b (dv-Chl b) were assessed by the spectrofluorometric method of Neveux and Lantoine [ 19931 using a MPF 66 spectrofluorometer. Fluorescence was meas-
NEVEUX ET AL.: PHYCOERYTHRINS IN THE PACIFIC OCEAN
700
a 600
500
400
300
200
1 O0
O I I I
400 450 500 550
Wavelength (nm)
20
O0
80
60
40
20
O
b
450 500 550
Wavelength (nm)
3313
Figure 2. (a) Comparison of the fluorescence excitation spectrum obtained by a half-half dilution either in phosphate buffer or in glycerol of a PE solution in phosphate buffer. (b) Normalized fluorescence excitation spectra of a natural sample (OLIPAC, station 13, 45 m) extracted in phosphate buffer or in phosphate buffer:glycerol (5 O: 5 O).
ured at 24 fixed excitation and emission wavelengths with an OBEY program, and the pigment concentrations were deter- mined by least squares approximation.
2.3. Flow Cytometry Analyses, were performed at all stations on freshly col-
lected samples by using either of two similar flow cytometers (Becton Dickinson), a fluorescence activated cell sorter scan (FACScan) during the FLUPAC cruise and a fluorescence ac- tivated cell sorter sorter (FACSorter) during the OLIPAC cruise. For each cell the forward and right angle light scatters as well as the fluorescence emitted by PE (orange) and Chlo- rophyll a or dv-Chl a (red) were measured. Fluorescent mi- crospheres (Polysciences) of 2.02 pm (FACScan) and 0.95 pm (FACSort) diameter were used as internal reference. Data were processed as described by Partensky et al. [1996].
To compare the data sets from both cruises with PE con- centrations, we normalized the FLUPAC data to 0.95 pm beads by multiplying the orange (PE) and red (Chl a and dv-Chl a) fluorescence by 7.81 and 5.7, respectively, which correspond to the ratios of the orange and red fluorescence of the beads (2.02/0.95 pm).
2.4. Cultures
Syizechococcus strains max 42 and max O1 were isolated from the Sargasso Sea in 1987 by D. Vaulot and C. Courties. S'nechococcus strain DC2 (CCMP 1334, equivalent to Woods Hole Collection (WH) 7803) and Prochlorococcus strain CCMP 1375 originated from the Guillard Provasoli National Center for Culture of Marine Phytoplankton (CCMP, Boothbay Harbor, Maine). Synechococcus was cultured in f/2 medium [Guillard and Ryther, 19621 and Prochlorococcus as described by Scanlan et al. [1996].
2.5. Nutrients Nutrient analyses (NO; + N o i ; PO:) were performed
immediately onboard with a Technicon Autoanalyzer. (NO, +NO,) concentrations below 1.5 pM were determined with a nanomolar sensitivity method [Oudot aizd Montel, 1988; Raimbault et al., 19901.
3. Results 3.1. Physical and Chemical Conditions
Physical and chemical conditions encountered during the FLUPAC and OLIPAC cruises are discussed in details in other papers [Eldin et al., 1997; Stoeiis et al., this issue]. During the FLUPAC cruise, along 165"E and along the equator (west of 166"W), highly stratified waters with oligotrophic conditions in the surface layer (NO; +NO, <O.l pM) prevailed. Rapid transition from nitrate-depleted to ni- trate-replete surface waters occurred between 166"W and 165"W. NO;+NO; increased drastically from <0.1 pM to above 1 pM in the 60 m deep mixed layer. Concentrations in- creased continuously east of 168"W reaching more than 3 pM at 150"W. The OLIPAC cruise showed that the enriched area (NO; +NO; >lpM) along 150"W extended southward to 7"s. An important depleted surface layer occurred (NO; +NO, <0.1 pM) between 11"s (0-80 m) and 16"s (0-120 m). Along 150°W, phosphate surface concentrations were always detect- able (>0.12 pM in surface waters). However, values <O.l pM were observed west of 178"W (data not shown).
Oligotrophic waters were characterized by a deep chloro- phyll maximum, whereas enriched waters showed relatively homogeneous chlorophyll concentrations from the surface down to 60-80 m. The relative proportion of dv-Chl a de- creased from oligotrophic to nutrient-rich waters.
3314 NEVEUX ET AL.: PHYCOERYTHRINS IN THE PACIFIC OCEAN
O N O 60s 120s Phycoerythiin concentration (pg El)
O
h
E Q 8 1Ml
although surface nitrate concentration .-ept increasing, Svnechococczis abundance decreased.
3.2.3. Transect along 150"W. North of 13"S, the Synechococc~is vertical cell distribution was homogeneous and abundance was maximal in the surface mixed layer (Figure 5). The highest values (20-27 x lo3 cell mL-') were observed between 2'30' and 8"s. Low concentration of S'wechococczis (<2S x lo3 cell mL-') appeared between 13" and 16"s when the 0.1 pM nitrate isopleth deepened down to 100-120 m. At 16"S, flow cytometric analyses (Figure 6) showed the presence of an orange fluorescing (0.5-1 x lo3 cell 1nL-I) population of larger cell (around 2-3 pm in diame- ter) than the small Synechococczrs (0.6-1.4 pm). They were determined by epifluorescence microscopy to be nonmotile round cells emitting orange fluorescence, closely resembling cyanobacteria.
6'N O GUS 120s Total Orange Fluorescence (relative units)
G O N O eos 120s Degrees Latitude
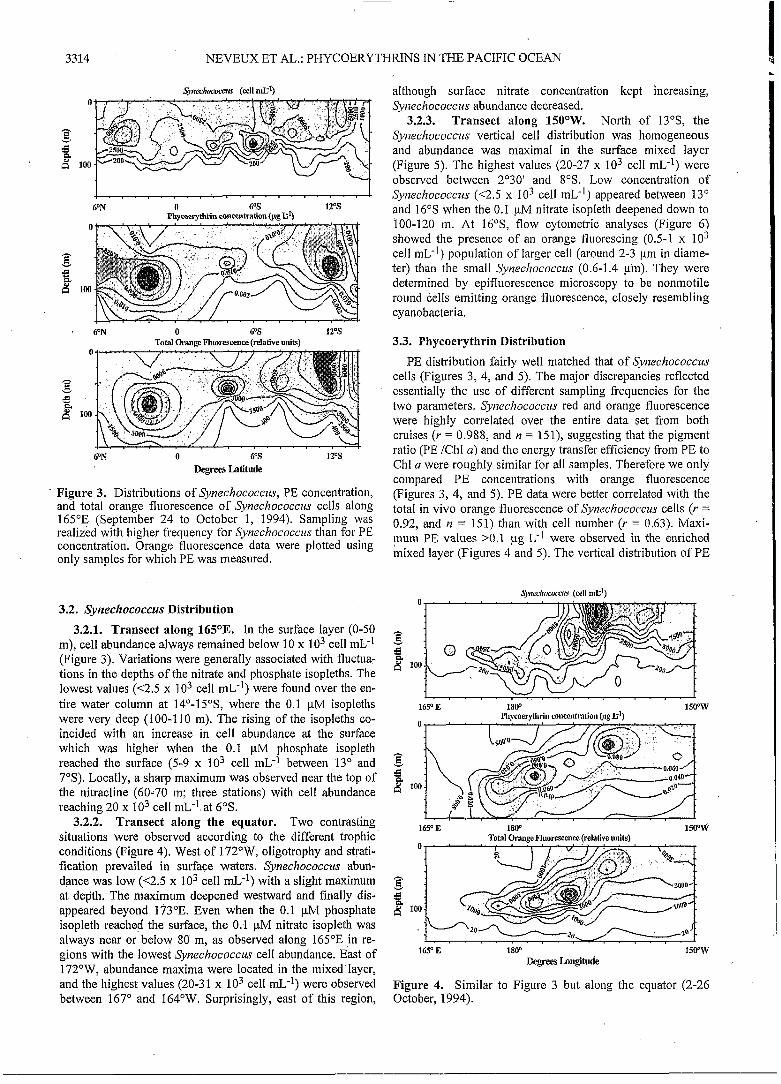
. Figure 3. Distributions of Synechococczq PE concentration, and total orange fluorescence of Svnechococczis cells along 165"E (September 24 to October 1, 1994). Sampling was realized with higher frequency for Svnechococczis than for PE concentration. Orange fluorescence data were plotted using only samples for which PE was measured.
3.2. Syïzeclzococcus Distribution
3,2.1. Transect along 165OE. In the surface layer (0-50 m), cell abundance always remained below 10 x lo3 cell mL-' (Figure 3). Variations were generally associated with fluctua- tions in the depths of the nitrate and phosphate isopleths. The lowest values (<2.5 x lo3 cell mL-') were found over the en- tire water column at 14"-15"S, where the 0.1 pM isopleths were very deep (100-1 10 m). The rising of the isopleths co- incided with an increase in cell abundance at the surface which was higher when the 0.1 pM phosphate isopleth reached the surface (5-9 x IO3 cell mL-' between 13" and 7"s). Locally, a sharp maximum was observed near the top of the nitracline (60-70 in; three stations) with cell abundance reaching 20 x lo3 cell mL" at 6"s.
3.2.2. Transect along the equator. Two contrasting situations were observed according to the different trophic conditions (Figure 4). West of 172"W, oligotrophy and strati- fication prevailed in surface waters. Synechococczis abun- dance was low (<2.5 x lo3 cell mL-') with a slight maximum at depth. The maximum deepened westward and finally dis- appeared beyond 173"E. Even when the 0.1 pM phosphate isopleth reached the surface, the 0.1 pM nitrate isopleth was always near or below 80 m, as observed along 165"E in re- gions with the lowest Synechococcus cell abundance. East of 172"W, abundance maxima were located in the mixed layer, and the highest values (20-3 1 x lo3 cell mL-') were observed between 167" and 164"W. Surprisingly, east of this region,
3.3. Phycoerythrin Distribution
PE distribution fairly well matched that of Synechococczrs cells (Figures 3, 4, and 5). The major discrepancies reflected essentially the use of different sampling frequencies for the two parameters. Synechococcus red and orange fluorescence were highly correlated over the entire data set from both cruises (Y = 0.988, and n = 151), suggesting that the pigment ratio (PE /Ch1 a) and the energy transfer efficiency from PE to Chl a were roughly similar for all samples. Therefore we only compared PE concentrations with orange fluorescence (Figures 3, 4, and 5). PE data were better correlated with the total in vivo orange fluorescence of Synechococczis cells (Y = 0.92, and n = 151) than with cell number (Y = 0.63). Maxi- !num PE values >0.1 pg L-' were observed in the enriched mixed layer (Figures 4 and 5). The vertical distribution of PE
O
h
8 e 8 loo
1 . . , . , w- , . , t 185' E 1800 1500W
Phvcoervthrin concentration fue E')
O
h 8 e 8 loo
165' E 1800 Total Orange Fluorescence (relative units)
I
165' E 1800 ~cgrees Longitude
1500W
Figure 4. Similar to Figure 3 but along the equator (2-26 October, 1994).

NEVEUX ET AL.: PHYCOERYTHRINS IN THE PACIFIC OCEAN 3315
concentration always showed a maximum at depth whatever the vertical distribution of Synechococcus cells was (Figures 3, 4, 5, and 7). For instance, at station 12 (OLIPAC) the intra- cellular PE concentration varied from 2.6 to 16 fg cell-', and the vertical distribution of the total orange fluorescence of Synechococcus cells was very similar to that of PE (Figure 7). The lowest values of intracellular PE were observed in surface oligotrophic waters (0.5-1.0 fg cell-') and the highest values in samples beyond 100 ni depth (30-50 fg cell-I). These val- ues were in agreement with the ranges observed previously [Glover et al., 1988a; Lantoine and Neveux, 19971. In the en- riched area, depth profiles showed that the PE maximum was generally at the level or slightly above the total Chl a (TChl a = Chl a + dv-Chl a) maximum. In oligotrophic conditions, the TChl a maximum was distinctly deeper than the PE maxi- mum.
Among Syneckococcus, those containing high-PUB PE (-96 out of the 110 usable excitation spectra) were dominant throughout the sampling area. The excitation peaks corre- sponding to the presence of PUB and PEB were located at 496 f 1 and 549 f 2 nm, respectively, while the emission peak was at 570 ik 2 nm. The PUB/PEB ratio (first /second excitation peak ratio) ranged from 1.51 to 2.00. Along 150"W it slightly increased northward. The vertical mean value ranged from 1.68 to 1.73 south of 7"s and from 1.78 to 1.85 between 7" and 1"s. Along the equator it was lower east of 167"W (1.55-1.65). It was clearly higher west of 17OoW, reaching values close to 2 in the PE maxima. In this region, however, the low cell concentrations at the surface did not allow for precise estimates of the PUBPEB ratio. In the en- riched areas the vertical distribution of the PUB/PEB ratio was relatively homogeneous (Figure 7).
. -
I oo IO' 102 lo3 lo4
8 8 c
v)
. -
1 oo 1 o' 1 o2 I o3 I o4 Orange Fluorescence
10s 40s 8% 16OS
Phvcaervthrin concentration fue E')
... ..*I:
.&Y' ..&. ..!. .. .. , .
LL . ' Cyanobacteria I .. I
10s 40s Bas 12% 16%
Total Orange Fluorescence (relative units) O
-3 v
B 100
5 la
J . . . . c . . , " - . . . . . 10s 40s 80s 120s 16%
Degrees Latitude
Figure 5. Similar to Figure 3 but along 150"W (5-29 No- vember, 1994).
Figure 6. Comparison of flow cytometric signature of the larger coccoid cyanobacteria and Synechococcus (station 21, conductivity-tempereture-depth (CTD) 146, 45 m): (a) red versus orange fluorescence and (b) green versus orange fluo- rescence. Bead size is 0.95 pin.
Two types of unusual PE excitation spectra were observed in the more aligotrophic regions. First, at 16"S-15O0W during the OLIPAC cruise the second excitation peak was shifted beypnd 560 nm (Figure 8), while the first peak was at 494 nm. As the automated excitation scan stopped at 560 nm, it was necessary to complete it by recording the fluorescence beyond this wavelength in manual mode (emission 595 nm), which revealed the second excitation peak at 564 nm (Figure 9). The 494/564 nm ratio was -3, slightly higher than esti- mated with the routine procedure (2.5; see Figure 8). This dif- ference resulted probably from the existence of a small resid- ual scattering signal around 555-560 nm (even after the blank correction). The fluorescence emission maximum also showed a shift toward higher wavelength (576 nm) in comparison to that of Synechococcus (570 nm; Figure 8). This very high- PUB PE was clearly related to the population of 2-3 pm cya-

3316
0 -
20
40 h
v E 60'
: 5 Q 8 0 -
100
NEVEUX ET AL.: PHYCOERYTHRINS IN THE PACIFIC OCEAN
- -
-
Phycoerythrin concentration fpg Cl) Phycoerythrin concentration fpg Cl) O 0.05 0.10 0.15 0.20 o 0.04 0.08 0.12
O
20 ~ a ' l m . . ' .%.. ' ' - station 12 ...... -
... ......... .....
........
.... Syn 4 100
120 PE ..mi. .... .....
140' ' ' ' ' ' ' I
......... ............................................................
. Station 69 FLUPAC
O 5 10 15 20 2 5 0 1 2 3 4 5 6 7
Cell number (thousands) Celi number (thousands)
PE/Cell (fg) Phycoerythrin concentration fpg Cl) O 2 4 6 8 i0 12 14 16 18 O . 0.05 0.10 0.15
PEICell -a-
l I I . I I
2.0
PUBIPEB 4- LI 140
O 0.5 1.0 1.5
PU B/P EB O 2 4 6 8 1 0 1 2 1 4
Total orange fluorescence
Figure 7. Depth profiles of Synechococczu (Syn) and PE concentration at (a) station 12 (OLIPAC) and (b) Station 69 of the Flux dans l'ouest du Pacifique equatorial (FLUPAC) cruise. (c) and (d) Depth profiles of PE concentration per cell, phycourobilin/phycoerythrobilin (PUB/PEB) ratio and total orange fluorescence (OF) of Synechococczis cells (mean .cell fluorescence multiplied by cell number) at station 12 (OLIPAC). Horizontal dotted line corresponds to deep chlorophyll maximum.
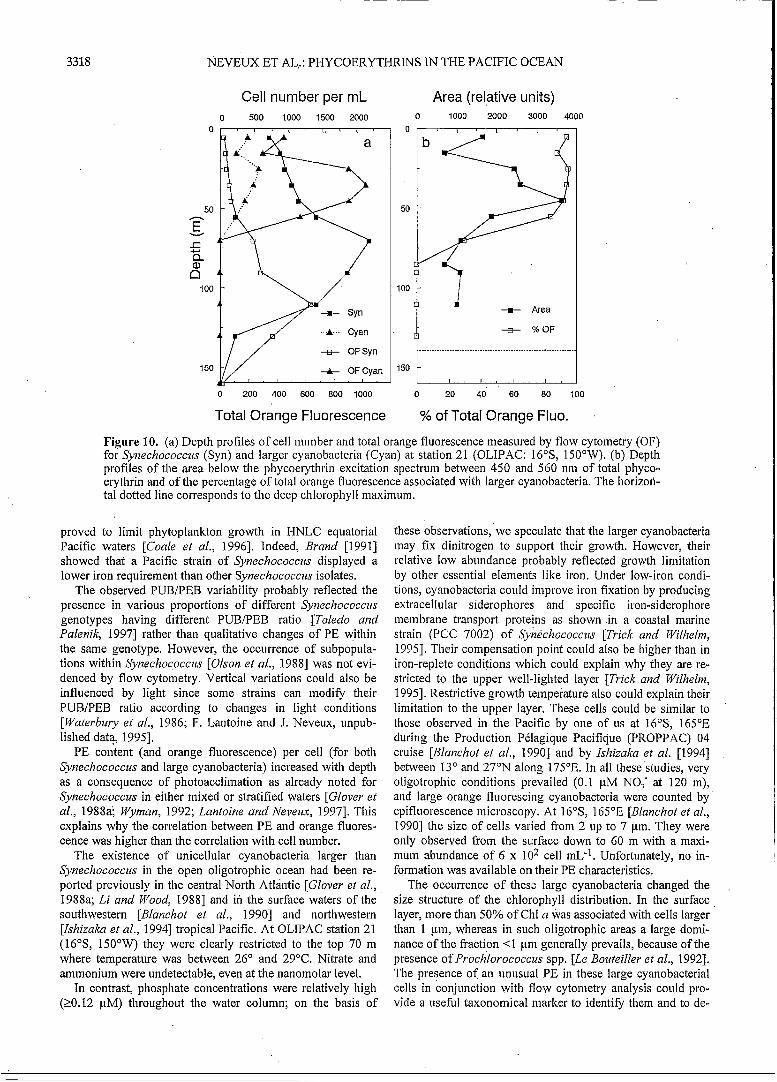
nobacteria cells detected by their flow cytometric signature (Figure 6). These cells were only observed in the top 70 m (Figure 10). At this station, Synechococczis abundance was very low and exhibited a maximum at 70 m (2.5 x lo3 cell mL-'). The orange fluorescence per cell increased between O and 70 m in the same prdportion (x 2.7) for both Synechococ- czis and the large coccoid cyanobacterial cells. As the orange fluorescence of the large cells was 25-30 fold higher than that of Synechococczis, more than 90% of the total orange fluores- cence originated from the large cells in the upper 50 in (Figure IO).
Another unusual type of PE was observed in three samples taken during FLUPAC (Station 12: 4"S, 165"E at 70 and 90 m; Station 31: O", 167"E at 40 in). These samples were char- acterized by a second excitation peak located at 536 nm in- stead of 549 nm that was sometimes higher than the first peak at 498 nm (Figure 9). When such unusual PE excitation spec- tra were observed, flow cytometry did not detect any peculiar orange fluorescing population. A possible explanation could be the presence of irregularly distributed PE-containing or- ganisms, represented either by relatively large cells or by colonies of cyanobacteria (filamentous- or mucilaginous ag- gregates). This was clearly not Oscillatoria (=Tuichodes- mizrnz) spp., although some variability in PE spectral charac- teristics was observed in this genus [Fzijita and Shimzaa, 1974; Shinzzrra and Fzijita, 1975; Haxo et al., 19871, no
.
known strain exhibits a peak near 536 nm. The unusual PE could also belong to symbiotic cyanobacteria (phaeosomes) within large cells of Dynophysiales (Dinophyceae [Lucas, 19911) or diatoms [Magzre et al., 19771 but not to known Cryptophyceae (see review by Rowan [1989]).
4. Discussion and Conclusions Qualitative information on PE and more generally on phy-
cobiliproteins in marine pelagic waters is relatively scarce. First, high-PEB [Kursar et al., 1981; Wood, 19851, and then high-PUB [Ong et al., 19841 PE-containing Synechococczis have been recognized in oceanic waters. In the open ocean, dual excitation beam flow cytometry showed that high-PUB Synechococczis are most frequently observed [Olson et al., 19881. This has been confirmed by excitation spectra obtained in oligotrophic waters [Lantoine and Neveux, 19971. How- ever, high-PEB Synechococczis could play a significant role in more coastal mesotrophic and eutrophic waters [Olson et al., 1988; 19901 where cell and PE concentration can reach 400 x lo3 cell mL-' and 3. pg L-I, respectively [Partensky et al., 1996; Lantoine and Neveux, 19971.
Our results prove that high-PUB PE-containing @necho- cocczis largely determined the distribution and the spectral characteristics of PE in oligotrophic and mesotrophic areas of the central equatorial and tropical Pacific. The lowest concen-
120 h
+ u) .- 5 100 a, > .x= 80 Kí a,
60 a, o K a, 40 o
20
- L
8
E o 3
I ,
NEVEUX ET AL.: PHYCOERYTHRINS IN THE PACIFIC OCEAN
550 6W 653 7W
.c .- 100
- 5 80 2 a, 60
8 40 9! o 20
O h
> .-
v
o K
u)
3
h c .? 100 a,
m 2 80
.!!. 60
40
-
a,
o E 20
s o 0
1 O0
80
60
40
20
3317
O
Wavelengths (nm) Wavelengths (nm)
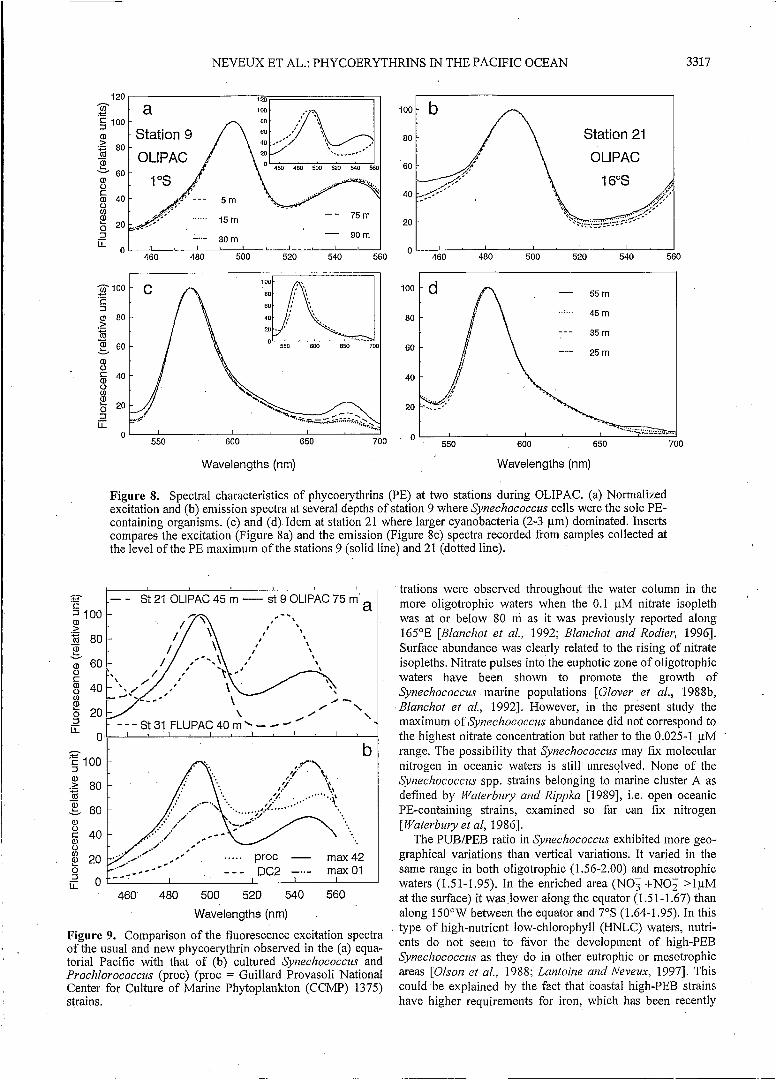
Figure S. Spectral characteristics of phycoerythrins (PE) at two stations during OLIPAC. (a) Normalized excitation and (b) emission spectra at several depths of station 9 where Synechococcus cells were the sole PE- containing organisms. (c) and (d) Idem at station 21 where larger cyanobacteria (2-3 pm) dominated. Inserts compares the excitation (Figure Sa) and the emission (Figure 8c) spectra recorded from samples collected at the level of the PE maximum of the stations 9 (solid line) and 21 (dotted line).
a l 1- - st 21 OLIPAC 45 m - st 9 OLIPAC 75 m'
t b
- 460 480 500 520 540 560
Wavelengths (nm)
Figure 9. Comparison of the fluorescence excitation spectra of the usual and new phycoerythrin observed in the (a) equa- torial Pacific with that of (b) cultured Syneclzococczw and Procldorococcus (proc) (proc = Guillard Provasoli National Center for Culture of Marine Phytoplankton (CCMP) 1375) strains.
trations were observed throughout the water column in the more oligotrophic waters when the 0.1 pM nitrate isopleth was at or below 80 in as it was previously reported along 165"E [Blanchot et al., 1992; Blanchot and Rodier, 19961. Surface abundance was clearly related to the rising of nitrate isopleths. Nitrate pulses into the euphotic zone of oligotrophic waters have been shown to promote the growth of Sy~zechococcus marine populations [Glover et al., 1988b, Blanchot et a/., 19921. However, in the present study the maximum of Synechococcz~s abundance did not correspond to the highest nitrate concentration but rather to the 0.025-1 pM '
range. The possibility that Synec/zococczw may fix molecular nitrogen in oceanic waters is still unresolved. None of the ~vnechococcz~s spp. strains belonging to marine cluster A as defined by Waterbury and Rippka [1989], i.e. open oceanic PE-containing strains, examined so far can fix nitrogen [Waterbury et al, 19861.
The PUB/PEB ratio in Svtzechococcza exhibited more geo- graphical variations than vertical variations. It varied in the same range in both oligotrophic (1.56-2.00) and mesotrophic waters (1.51-1.95). In the enriched area (NOi+NO; >1pM at the surface) it was lower along the equator (1.51-1.67) than along 150"W between the equator and 7"s (1.64-1.95). In this type of high-nutrient low-chlorophyll (HNLC) waters, nutri- ents do not seem to favor the development of high-PEI3 Synechococcus as they do in other eutrophic or mesotrophic areas [Olson et al., 1988; Lantoine and Nevezrx, 19971. This could be explained by the fact that coastal high-PEB strains have higher requirements for iron, which has been recently
3318
~~ ~ ~ _ _ _ _
NEVEUX ET AL,.: PHYCOERYTHRINS IN THE PACIFIC OCEAN
Cell number per mL O 500 1000 1500 2000
-E- OFSyn
O 200 400 600 800 1000
Total Orange Fluorescence
Area (relative units) O 1000 2000 3000 4000
-6- %OF
O 20 40 60 80 100
"/o of Total Orange Fluo.
Figure 10. (a) Depth profiles of cell number and total orange fluorescence measured by flow cytometry (OF) for Synechococcus (Syn) and larger cyanobacteria (Cyan) at station 21 (OLIPAC: 16"S, 150"W). (b) Depth profiles of the area below the phycoerythrin excitation spectrum between 450 and 560 nm of total phyco- erythrin and of the percentage of total orange fluorescence associated with larger cyanobacteria. The horizori- tal dotted line corresponds to the deep chlorophyll maximuin.
proved to limit phytoplankton growth in HNLC equatorial Pacific waters [Coale et al., 19961. Indeed, Brand [1991] showed that a Pacific strain of Syneclzococczis displayed a lower iron requirement than other Synechococciis isolates.
The observed PUB/PEB variability probably reflected the presence in various proportions of different Synechococczis genotypes having different PUB/PEB ratio [Toledo and Palenik, 19971 rather than qualitative changes of PE within the same genotype. However, the occurrence of subpopula- tions within Synechococczis [Olson et al., 19881 was not evi- denced by flow cytometry. Vertical variations could also be influenced by light since some strains can modify their PUB/PEB ratio according to changes in light conditions [Waterbury et al., 1986; F. Lantoine and J. Neveux, unpub- lished data, 19951.
PE content (and orange fluorescence) per cell (for both Synechococczis and large cyanobacteria) increased with depth as a consequence of photoacclimation as already noted for Synechococcus in either mixed or stratified waters [Glover et al., 1988a; Wyman, 1992; Lantoine and Neveux, 19971. This explains why the correlation between PE and orange fluores- cence was higher than the correlation with cell number.
The existence of unicellular cyanobacteria larger than Synechococczis in the open oligotrophic ocean had been re- ported previously in the central North Atlantic [Glover et al., 1988a; Li and Wood, 19881 and in the surface waters of the southwestern [Blanchot et al., 19901 and northwestern [Ishizaka et al., 19941 tropical Pacific. At OLIPAC station 21 (16"S, 150"W) they were clearly restricted to the top 70 m where temperature was between 26" and 29°C. Nitrate and ammonium were undetectable, even at the nanomolar level.
In contrast, phosphate concentrations were relatively high (20.12 pM) throughout the water column; on the basis of
these observations, we speculate that the larger cyanobacteria may fix dinitrogen to support their growth. However, their relative low abundance probably reflected growth limitation by other essential elements like iron. Under low-iron condi- tions, cyanobacteria could improve iron fixation by producing extracellular siderophores and specific iron-siderophore membrane transport proteins as shown in a coastal marine strain (Pee 7002) of Sjmechococczis [nick and Wilhdin, 19951. Their compensation point could also be higher than in iron-replete conditions which could explain why they are re- stricted to the upper well-lighted layer [Trick and Wilhelrn, 19951. Restrictive growth temperature also could explain their limitation to the upper layer. These cells could be similar to those observed in the Pacific by one of us at 16"S, 165"E during the Production Pélagique Pacifique (PROPPAC) 04 cruise [Blanchot et al., 19901 and by Ishizaka et al. [1994] between 13" and 27"N along 175"E. In all these studies, very oligotrophic conditions prevailed (0.1 pM NO, at 120 m), and large orange fluorescing cyanobacteria were counted by epifluorescence microscopy. At 1G"S, 165"E [Blanchot et al., 19901 the size of cells varied from 2 up to 7 pm. They were only observed from the surface down to 60 m with a maxi- mum abundance of 6 x lo2 cell mL-'. Unfortunately, no in- formation was available on their PE characteristics.
The occurrence of these large cyanobacteria changed the size structure of the chlorophyll distribution. In the surface layer, more than 50% of Chl a was associated with cells larger than 1 pin, whereas in such oligotrophic areas a large domi- nance of the fraction <1 pin generally prevails, because of the presence of ProchIorococcars spp. [Le Bouteiller et al., 19921. The presence of an unusual PE in these large cyanobacterial cells in conjunction with flow cytometry analysis could pro- vide a useful taxonomical marlier to identify them and to de-
NEVEUX ET AL.: PHYCOERYTHRINS IN THE PACIFIC OCEAN 3319
Table 1. Excitation and Emission Wavelength Maxima for the Different PE Discussed in This Paper
Exc PUB Exc PEB (nm) PUB/PEB " Em PE (nm) Reference (nm)
All samples
Large (Synechococcus) 496 549 1.58-1.98 570 this study
cyanobacteria 494' 564' 3' 576' this study Three samples 498' 536' 0.65-1.20 570 this study T,.iclzodesnziunz 495 547 and 565 ? 573 Fujita and Shiinui-a [1974]
Proclzlorococcus 496 552 , 1.38 568 this study; Hess et al. [I9961
?lie abbreviations are defined as PE, phycoerythrins; Exc, excitation; Em, emission; PUB, phycourobilin; PEB, phycoerythrobilin. Indicates a departure from standard ~~zec/~ococcus characteristics.
termine their spatial and temporal distribution. In some re- spects their ecological habitat resembles to this of Tricho- destniunz spp. [Capone et al., 19971. Further experimental study or the use of genetic markers (e.g., nitrogen fixation probes) will be necessary to determine whether they can fix dinitrogen. Their high-PUB PE is characterized by the pre- dominance of the first fluorescence excitation peak at 494 nm over the second peak related to PEB at 564 nm. Until now, high-PUB-type PE have only been observed in cyanobacteria. In addition to some Syrzechococcus (e.g. WH8103 strain [Ong et al., 1984]), N,-fixing Synechocystis spp. isolated from coastal tropical waters by Waterbziry and Rippka [ 19891 pres- ent a very high-PUB PE. However, in all these species the second excitation peak of PE is around 547-550 nin [Ong et al., 1984; Sivanson et al., 19911, distinctly at shorter wave- lengths than that of the large cyanobacteria observed during OLIPAC.
The presence of PUB confers to all PE-containing organ- isins an absorption peak that shows relatively little variability in its position (496 -t 2 nm). The second peak related to the presence of PEB appears more variable depending on the con- formation of the native PE. Schematically, PEB can lead to one or two absorption peaks (one of these two peaks can be reduced to a shoulder) in the range between 530 and 570 nm [Rowan, 19891. For instance two absorption peaks originate from PEB in Trichodestniuin thiebautii (547 and 565 nm [Shimzua and Fujita, 19751) whereas only one peak is gen- erally observed in Synechococcus spp. (around 547-55 1 nm) (see review by Rowan [1989]). The occurrence of PE with two peaks either at 494 and 564 nm (Station 21 OLIPAC) or at 496 and 536 nin (Station 31 FLUPAC) represents a poten- tially unique characteristic which, to our knowledge, has not been observed previously either in the field or in cultures. Figure 9 and Table 1 compare the novel PE with those found in various strains of small Synechococcus in culture. Almost all samples in the present studies have PE spectral character- istics similar to those of inax 42, a strain isolated at depth from the Sargasso Sea. During these two cruises we have not found any evidence of high-phycocyanin cyanobacteria, con- firming previous investigations in the open ocean [Murphy and Haugen, 1985; Waterbury et al., 1986; Canzpbell and Cai-penter, 1987; Lantoine and Neveux, 19971. The presence of PUB in the PE of oceanic cyanobacteria (filamentous or solitary) is considered as a chromatic adaptation to blue light which penetrates deeper than other wavelengths in the water column [Wood, 19851 and would allow the sustaining of photosynthesis down to 100-120 m in oligotrophic regions. If the high-PUB-containing Syrzechococcus can be effectively
observed from the surface down to 120 m depth, the high- PUB larger cyanobacteria seem confined to shallower and better lit layers (0-70 in). This suggests that the ecological re- quirements and physiological properties of the two cell types may be different.
The diversity of PE in oceanic waters clearly appears to be more important than was previously assumed. Recently, low amounts of a new type of PE have been reported in Pro- chlorococcus spp. (strain CCMP 1375 [Hess et al., 19961). Its fluorescence excitation spectrum shows two peaks at 496 and 552-553 nm and a shoulder near 527 nm (50% glycerol: Fig- ure 9 and Table l), and its emission spectrum shows a peak at 568 nm. In Prochlorococcus cultures, PE spectrum can only be detected, however, after concentrating cells illuminated by low liglit'[Hess et al., 19961. We tried to measure Prochloro- coccus PE spectrum during the OLIPAC cruise on samples collected at 130-140 in, depths at which the orange fluores- cence of Prochlorococcus PE was clearly detected by flow cytoinetry [Hess et al., 19963. Prochlorococcus cells from 10 L of seawater were collected on GF/F after prefiltration through 0.6 pin (to eliminate Synechococcus), but no signal could be detected, most likely because the intracellular PE concentration and the cell abundance (13 x lo3 cells in 10 L at 130 in) were too low.
Phycobiliprotein spectral characterization can constitute a useful tool for taxonomical and ecological studies. The diffi- culty of analyzing thein could be overcome, at least partly, with a better knowledge of the diversity of PE in the ocean and of the effect of environmental factors on the PE character- istics of cultured strains. With such data at hand it would then be possible to determine the contribution of the different PE types from 3-D fluorescence spectra of bulk PE using least squares approximation or other spectral decomposition methods. The recognition of new types of PE should encour- age efforts to isolate in culture the organisms that synthesize them. This step is essential to investigate further the physiol- ogy and the role of these organisms in marine ecosystems and to understand why the larger cyanobacteria observed at 16"s- 150"W are apparently restricted to highly oligotrophic and illuminated waters.
1
Acknowledgments. The authors wish to thank the officers and crew of the R/V Atalante for their help during the EPOPE France- JGOFS studies, the chief scientists of FLUPAC, R. Le Borgne, and OLIPAC, B. Coste, as well as Y. Dandonneau for coordinating the EPOPE program and the guest editors for improving the final ver- sion of the manuscript. The chemical data are due to the courtesy of M. Rodier and P. Raimbault, and the CTD data are due to that of C. Bournot, D. Tailliez, G.Eldin, F. Gallois and J. Y. Panche. This work
3320 NEVEUX ET AL.: PHYCOERYTHRINS IN THE PACIFIC OCEAN
was financed by tlie Université Pierre et Marie Curie, the Centre National de la Recherche Scientifique (INSU, UMR 7621), tlie Insti- tut Français pour la Recherche et l'Exploration de la Mer (IFREMER) and the Institut Français de la Recherche Scientifique pour le Développement en Coopération (ORSTOM). DV and DM were partially supported by MAST contract CT95-0016 (MEDEA) as well as tlie ACC-SV7 BioSystematics network.
References Alberte, R. S., A. M. Wood, T. A. Kursar, and R. R. L. Guillard,
Novel phycoerythrins in marine &nechococcus spp., Plant Phy- siology, 75,732-739, 1984.
Algarra, P., M. Estrada, and X. Niell, Phycobiliprotein distribution across the western Mediterranean divergence, Deep Sea Res.,
Barlow, R. C., and R. S. Alberte, Photosynthetic characteristics of phycoerythrin-containing marine $vnechococczis spp., I, Re- sponses to growth photon flux density. Mar. Biol., 86, 63-74, 1985.
Bidigare, R. R., and M. Ondrusek, Spatial and temporal variability of phytoplankton pigment distributions in tlie central equatorial Pacific Ocean, Deep Sea Res., Part II, 43,809-833,1996.
Blanchot, J., and M. Rodier, Picophytoplankton abundance and biomass in tlie western tropical Pacific Ocean during tlie 1992 EI Niño year: Results from flow cytometry, Deep Sea Res., Part I ,
Blanchot, J, J. Downs, C. Dupouy-Douchement, H. Higgins, R. Le Borgne, M.-H. Radenac, and M. Rodier, Rapport de la campagne PROPPAC 04 à bord du navire le SUROIT (30 Octobre au 26 Novembre 1989), Rapport des Missions Sciences de la Mer, pp. 1-77, Inst. Français de Rech. Sci. pour le Dév. en Coop., 1990.
Blanchot, J., M. Rodier, and A. Le Bouteiller, Effect of EI Niño Southern Oscillation events on the distribution and abundance of phytoplankton in tlie western Pacific tropical ocean along 165"E, J. Planliton Res., 14, 137-156, 1992.
Brand, L. E., Minimum iron requirements of marine phytoplankton and the implications for tlie biogeochemical control of new pro- duction, Lbnnol. Oceanogr, 36, 1756-1771, 1991.
Campbell, L., and E. J. Carpenter, Characterization of phyco- erythrin-containing zimchococcus spp. populations by immuno- fluorescence, J. Plankton Res., 9, 1167-1 181, 1987.
Capone, D. G., J. P. Zehr, H. W. Paerl, B. Bergman, and E. J. Car- penter, Trichodesnzizinz, a globally significant cyanobacterium, Science, 276, 1221-1229, 1997.
Coale, K.H., et al., A massive phytoplankton bloom induced by an ecosystem scale iron fertilization experiment in tlie equatorial Pacific Ocean, Natzire, 3S3,495-501, 1996.
Eldin, G., M. Rodier, and M.-H. Radenac, Physical and nutrient variability in tlie upper equatorial Pacific associated with west- erly wind forcing and wave activity, Deep Sea Res., Part II, 44,
Exton, R. J., W. M. Houghton, W. Esaias, L. W. Haas, and D. Hay- ward, Spectral differences and temporal stability of phyco- erythrin fluorescence in estuarine and coastal waters due to tlie domination of labile cryptophytes and stabile cyanobacteria, Linznol. Oceanogr., 28, 1225-1231, 1983.
French, C. S., and V. K. Young, The fluorescence spectra of red al- gae and tlie transfer of energy from phycoerythrin to pliycocya- nin and clilorophyll, J. Gen. Pl?~~siol., 35, 873-890, 1952.
Fujita, Y., and S. Shimura, Phycoerythrin of tlie marine blue-green alga Trichodesiniunz thiebnutii. Plant and Cell Physiology, 15,
Glover, 1-1. E.. B. B. Prézelin, L. Campbell, and M. Wynian, Pico- and ultraplankton Sargasso Sea communities: Variability and comparative distributions of Synechococczis spp. and algae, Mar, Ecol. Prog. Ser., 49, 127-139, 1988a.
Glover, H. E., B. B. Prézelin, L. Campbell, M. Wyman, and C. Gar- side, A nitrate-dependent Synechococczis bloom in surface Sar- gasso Sea water, Nature, 331, 161-163, 198%.
Guillard, R. R. L., and J. FI. Ryther, Studies of marine planktonic diatoms, I, Cyclotella nana Hustedt and Denottila confervaceae (Cleve) Gran, Can. J. Microbiol., 8,229-239, 1962.
Haxo, F. T., R. A. Lewin, K. W. Lee, and M-R. Li, Fine structure and pigments of Oscillatoria (Trichodes~nitiriz) aff. thiebautii (Cyanophyta) in culture. Phycologia, 26,443-456, 1987.
PnrtA, 35, 1425-1430, 1988.
43, 877-895, 1996.
1783-1800,1997.
939-942, 1974.
Heathcote, P., M. Wyman, N. G. Carr, and G. S. Beddard, Partial uncoupling of energy transfer from phycoerythrin in tlie marine cyanobacterium Synechococctrs spp. WH7803, Bioclzim. Biophys.
Hess, W., F. Partensky, G. W. M. Van der Staay, J. M. Garcia-Fer- nandez, T. Börner, and D. Vaulot, Coexistence of phycoerythrin and a chloropliyll a/b antenna in a marine prokaryote, Proc. Natl. Acad. Sci. U.S.A., 93, 11,126-11,130, 1996.
Hill, D. R. A., and K. S. Rowan, Tlie biliproteins of the Cryptopliy- ceae, Phycologia, 28,455-463, 1989.
Ishizalca, J., H. Kiyosawa, E;. Ishida, K. Ishikawa, and M. Takahashi, Meridional distribution and carbon biomass of autotrophic pico- plankton in tlie central North Pacific during late northern summer 1990, Deep Sea Res., Part I, 31, 1745-1766,1994.
Kursar, T. A., H. Swift, and R. S. Alberte, Morphology of a novel cyanobacterium and characterization of light-harvesting com- plexes from it: Iniplications for phycobiliprotein evolution, Proc. Nntl. Acad. Sci. U.S.A., 78. 6888-6892, 1981.
Lantoine, F., Caractérisation et distribution des différentes popula- tions du picoplancton (picoeucaryotes, $ynec/zococcus, spp., Pro- chlorococcus spp.) dans diverses situations trophiques (Atlantique tropical, Golfe du Lion). Pli. D. thèse, Univ. Pierre et Marie Curie, Paris, 1995.
Lantoine, F., and J. Neveux, Spatid and seasonal variations in abun- dance and spectral characteristics of phycoerythrins in the tropi- cal northeastern Atlantic Ocean, Deep Sea Res., Part I, 44, 223- 246, 1997.
Le Bouteiller, A., J. Blanchot, and M. Rodier, Size distribution pat- tern of phytoplankton in the western Pacific: Towards a gencrali-
Acta, 1099,267-270, 1992.
zation for tlie tropical open ocean, Deep Sen Res., Port A, 39, 805-823. 1992.
Li, W. E;. W., and A. M. Wood, Vertical distribution of North At- lantic ultraphytoplankton: Analysis by flow cytometry and epifluorescence microscopy, Deep Sen Res.. Part A, 35, 1615- 1638, 1988.
Lucas, I. A. N., Symbionts of tlie tropical Dinopliysiales (Dinophyceae), Ophelia, 33,213-224, 1991.
Mague, T. H., F. C. Mague, and O. Holm-Ilansen, Physiology and chemical composition of nitrogen-fixing phytoplankton in tlie central Pacific Ocean, Adne Biol., 41,213-227, 1977.
Moreth, C. M., and C. S. Yentsch, A sensitive method for tlie de- termination of open ocean phytoplankton phycoerythrin pigments by fluorescence, Litnnol. Oceunogr., 15,313-317, 1970.
Murphy, L. S., and E. M. I-Iaugen, Tlie distribution and abundance of phototrophic ultraplankton in the North Atlantic, Lininol. Oceanogr., 3447-58, 1985.
Neveux, J., and F. Lantoine, Spectrofluorometric assay of chloro- phylls and phaeopigments using tlie least squares approximation technique, Deep Sea Res., Part A, 40, 1747-1765, 1993.
O'Carra, P., and C. O'hEocha, Algal bibliproteins and phycobilins, in Cheniistry and Biocheinistry of Plant Piginenis, edited by T. W. Goodwin, pp. 328-376,Academic, San Diego, Calif., 1976.
Olson, R. J., S. W. Chisholm, E. R. Zettler, and E. V. Armbrust, Analysis of Synechococczis pigment types in tlie sea using single and dual beam flow cytometry, Deep Sea Res., Part A , 35, 425- 440, 1988.
Olson, R. J., S. W. Chisholm, E. R. Zettler, and E. V. Armbrust, Pigment, size and distribution of Synecl~ococczis in tlie North Atlantic and Pacific Oceans, Limnol. Ocennogr., 35, 45-58, 1990.
Ong, L. J., A. N. Glazer, and J. B. Waterbury, An unusual phyco- erythrin from a marine cyanobacterium, Science, 224, 80-83, 1984.
Oudot, C., and Y. Montel, A high sensitivity method for tlie deter- mination of nanomolar concentrations of nitrate and nitrite in seawater with a Technicon AutoAnalyser II, hínr. Chenz., 24,
Partensky, F., J. Blanchot, F. Lantoine, J. Neveux, and D. Marie, Vertical structure of picophytoplankton at different trophic sites of the tropical northeastern Atlantic Ocean, Deep Sen Res., Part
Raimbault, P., G. Slawyk, B. Coste, and J. Fry, Feasability of using an automated procedure for the determination of seawater nitrate in the 0-100 nM range: Examples from field and cultures, Mar. Bio/., 104,347-351, 1990.
Rowan, K. S., Photosynthetic Piginenis of Algae, 334 pp., Cam- bridge Univ. Press, New York, 1989.
239-252, 1988.
I, 43, 1191-1213, 1996.
~ ~~ ~ ~~ ~
NEVEUX ET AL.: PHYCOERYTHRINS ÏN THE PACIFIC OCEAN 3321
Scanlan, D. J., W. R. Hess, F. Partensky, J. Newman, and D. Vaulot, High degree of genetic variation in Prochlorococcus (Prochlo- rophyta) revealed by RFLP analysis, Eur. J . Phycol., 31, 1-9, 1996.
Shalapenok, L. S., and A. Shalapenok, Heterogeneous pigment com- position of phycoerythrin-containing picocyanobacteria S’necho- coccus spp. in the Black Sea, Microbiology, 66, 80-84, 1997.
Shimura, S., and Y. Fujita, Phycoerythrin and pl~otosyntl~esis of the pelagic blue-green alga Trichodesiniutn thiebautii in the waters of Kurosliio, Japan, Marine Biology, 31, 121-128, 1975.
Stewart, D. E., and F. H. Farmer, Extraction, identification, and quantification of phycobiliprotein pigments from phototrophic plankton, Limnol. Oceanogr., 29,392-397, 1984.
Stoens, A., et al., The coupled physical new production system in the equatorial Pacific during the 1992-1995 EI Niño, J. Geophys. Res., this issue.
Swanson, R. V., L. J. Ong, S. M. Wilbanks, and A. N. Glazer, Phy- cberythrins of marine unicellular cyanobacteria, II, Characteriza- tion of phycobiliproteins with unusually high phycourobilin content, J. Bio. Chein., 15, 9528-9534, 1991.
Toledo, G., and B. Palenik, Synechococcus diversity in the Califor- nia current as seen by RNA polymerase (rpoC1) gene sequences of isolated strains, Appl. Etzviron. Microbiol., 63, 4298-4303, 1997.
Trick, C. G., and S. W. Willielm, Physiological changes in coastal marine cyanobacterium Synechococcus sp. PCC 7002 exposed to low ferric ion level, Mar. Chein., 50,207-217, 1995.
Waterbury, J. B., R. Rippka, Order Chroococcales, in Bergey ’s Manu- al of Systematic Bacteriology, vol. 3, edited by J. T. Staley et al., pp. 1729-1746, Williams and Wilkins, Baltimore, Md., 1989.
Waterbury, J. B., S. W. Watson, F. W. Valois, and D. G. Franks, Biological and ecological characterization of the marine unicellu- lar cyanobacterium Synechococcus, in Pl7otosynthefic Picoplank- ton, edited by T. Platt and W. K. W. Li, Can. Bull. Fish. Aquat. Sci., 214,71-120, 1986.
Wood, A. M., Adaptation of photosynthetic apparatus of marine ul- traplanlcton to natural light fields, Nature, 316, 253-255, 1985.
Wood, A. M., P. K. Horan, K. Muirhead, D. A. Phinney, C. M. Yentsch, and J. B. Waterbury, Discrimination between types of pigments in marine S~~t~echococczcs spp. by scanning swectros- ~~
copy, epifluorescence -microscopy, and- flow cytometry, kinznol. Oceuno~r., 30, 1303-1315, 1985.
Wyman,‘M, Án in vivo metliod for the estimation of phycoerythrin concentrations in marine cyanobacteria (Synechococcus spp.), Limnol. Oceatzogr., 37, 1300-1306, 1992.
Wyman, M., R. P. F. Gregory, and N. G. Carr, Novel role for phyco- erythrin in a marine cyanobacterium Synechococcus Strain DC2, Science, 230,818-820, 1985.
Yeh, S. W., I. J Ong., A. N. Glazer, M. Wyman, and R. P. F. Greg- ory, Role of phycoerythrin in marine picoplankton Synechococ- cus spp., Science, 234, 1422-1423, 1986.
J. Blanchot, Station Biologique de Roscoff, Institut Français de Recherche Scientifique pour le DéJeloppement en Coopération, BP 74, F-29682 Roscoff Cedex, France. (e-mail: blanchot@sb-roscoff.
F. Lantoine and J. Neveux, Observatoire Océanologique de Banyuls, Laboratoire d’Océanographie Biologique, Université Pierre et Marie CurieKentre National de la Recherche Scientifique/Institut National des Sciences de l’Univers, BP 44, F-66651 Banyuls sur mer Cedex, France. (e-mail: [email protected]; jneveuxa arago.obs-banyuls.fr)
D. Marie and D. Vaulot, Station Biologique de Roscoff, Univer- sité Pierre et Marie CurieKentre National de la Recherche Scienti- fiquehstitut National des Sciences de l’Univers, BP 74, F-29682 Roscoff Cedex, France. (e-mail: marieQsb-roscoff.fr; vaulot@sb- roscoff.fr)
(Received August 29, 1997; revised May 29, 1998; accepted June 12, 1998.)
fr)
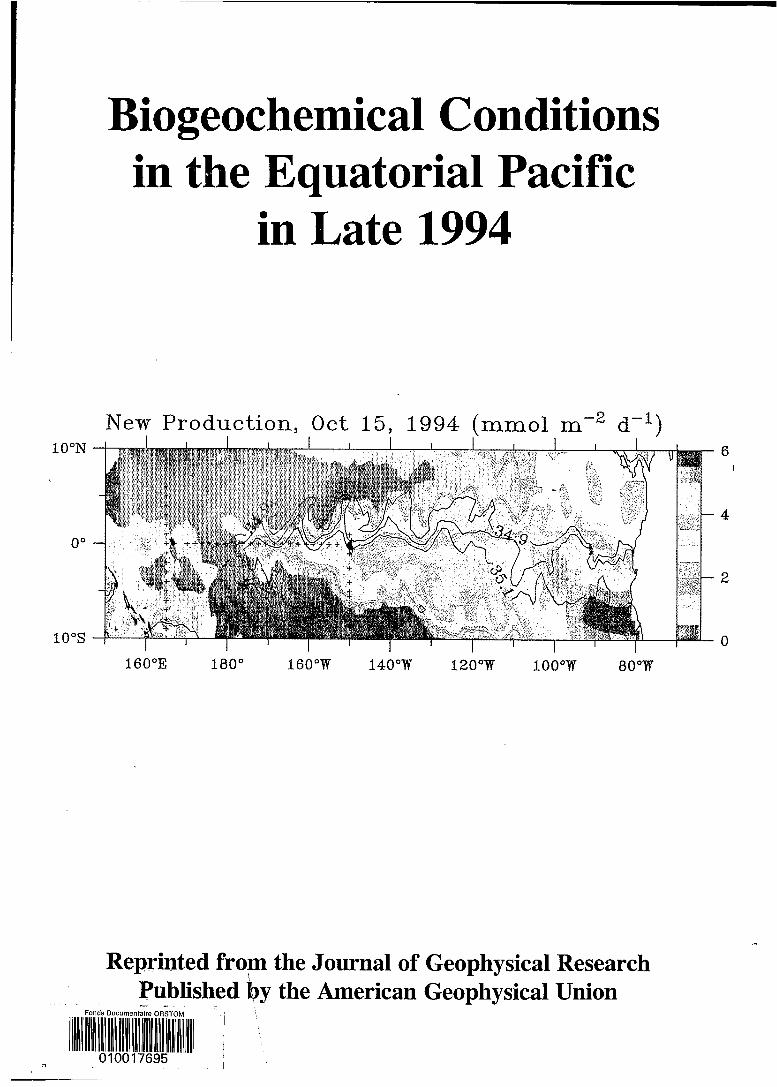
Biogeochemical Conditions in the Equatorial Pacific
in Late 1994
New Production, Oct 15, 1994 (mmol m -2 d-1) 1O"N 6
I
4
O"
2
10"s O 160"E 180" 160"W 140"W 120"W 100"W 80"W
Reprinted from the Journal of Geophysical Research Published by the American Geophysical Union - -

![General circulation of the tropical lower stratosphere - The general circulation of the tropical lower...equatorial latitudes' [Wexler, 1951]. Berson's upper air studies over Africa](https://img.pdfslide.us/doc/110x75/5e6aa248d33ce351342ba0f2/general-circulation-of-the-tropical-lower-stratosphere-the-general-circulation.jpg)