Embed Size (px)
Citation preview
www.elsevier.com/locate/rseRemote Sensing of Environment 89 (2004) 381–392
Phycocyanin detection from LANDSAT TM data for mapping
cyanobacterial blooms in Lake Erie
Robert K. Vincenta,*, Xiaoming Qina, R. Michael L. McKayb, Jeffrey Minerb,Kevin Czajkowskic, Jeffrey Savinod, Thomas Bridgemand
aDepartment of Geology, Bowling Green State University, 217 Life Sciences Building, Bowling Green, OH 43403, USAbDepartment of Biological Sciences, Bowling Green State University, 190 Overman Hall, Bowling Green, OH 43403-0218, USA
cDepartment of Geography and Planning, University of Toledo, University Hall, 4580A, 2801 West Bancroft Street, Toledo, OH 43606, USAdUniversity of Toledo Lake Erie Centre, 6200 Bayshore Rd., Oregon, OH 43618, USA
Received 2 May 2003; received in revised form 14 October 2003; accepted 28 October 2003
Abstract
Algorithms were developed from LANDSAT 7 ETM+ data for the July 1, 2000 overpass and LANDSAT 5 Thematic Mapper (TM) data
for the September 27, 2000 overpass for Path 20 Row 31 (including Toledo, OH) to measure relative phycocyanin content (PC) and turbidity
in the western basin of Lake Erie. Water samples were collected from discrete hydrographic stations arranged in a 20� 4 km grid adjacent to
the Ohio shoreline during a 6-h period spanning each of the two LANDSAT overpasses. The samples were analyzed for chlorophyll (chl) a
content and turbidity. In addition, the concentration of phycocyanin, a light-harvesting pigment associated with cyanobacteria, was estimated
from the ratio of phycocyanin/chl a in vivo fluorescence (IVPF/IVCF). A dark-object-subtracted, spectral ratio model derived from the July
1, 2000 data was found to be the most robust, when applied to the September 27, 2000 data. The same July 1, 2000 model (or algorithm) for
PC was then applied to LANDSAT 7 ETM+ frames for July 16 and August 1, 2002 of the Path 19 Row 31 frame (including Cleveland, OH)
and to the August 8, 2002 frame of Path 20 Row 31. Moderate, very low, and high PC values were detected in the western basin of Lake Erie
on July 16, August, 1, and August 8, 2002, respectively. On September 17, 2002, local media reported a large Microcystis bloom in the
western basin. The high PC values on August 8, 2002 may have represented early stage detection of the large Microcystis bloom that was
reported 5 weeks later. The PC algorithm derived in this study will improve our understanding of the temporal and spatial dynamics of
cyanobacterial bloom formation in Lake Erie and other systems. It may also serve to alert municipalities to the presence of potentially toxic
bloom events.
D 2003 Elsevier Inc. All rights reserved.
Keywords: Remote sensing; Microcystis; Lake Erie; Phycocyanin; Algal blooms; Toxic algae; Cyanobacteria; Water quality; LANDSAT TM
1. Introduction
The Laurentian Great Lakes have experienced toxin-
producing blooms of the cyanobacterium Microcystis on a
number of occasions over the past decade, including a
massive bloom in Lake Erie in 1995 that caused a variety
of water quality problems and attracted broad public con-
cerns (Brittain et al., 2000; Budd, Beeton, Stumpf, Culver,
& Kerfoot, 2002; Taylor, 1997). With the availability of
LANDSAT Thematic Mapper (TM) imagery featuring an
overpass cycle of every 16 days (8-day intervals, if both
LANDSAT 5 and 7 are employed), our goal was to develop
0034-4257/$ - see front matter D 2003 Elsevier Inc. All rights reserved.
doi:10.1016/j.rse.2003.10.014
* Corresponding author. Tel.: +1-419-372-0160; fax: +1-419-372-
7205.
E-mail address: [email protected] (R.K. Vincent).
a set of algorithms for detecting cyanobacterial blooms in
Lake Erie, based on a unique spectral signature produced by
phycocyanin, a light-harvesting pigment complex ubiqui-
tous among cyanophytes.
The two primary questions addressed in this study were:
(1) Can the concentration and spatial distribution of
cyanobacteria be assessed by use of the LANDSAT
TM sensor’s six visible/reflective infrared spectral
bands with 28.5-m spatial resolution, and if so, by
what margin of error?
(2) Can the algorithms be used to detect early stage
formation of cyanobacterial blooms?
In this study, we took advantage of two technology-based
approaches: the use of remote sensing as a tool to study
R.K. Vincent et al. / Remote Sensing of Environment 89 (2004) 381–392382
regional-scale aquatic ecosystem dynamics, and the use of
sensitive fluorescence methods to identify and quantify algal
pigments. The study has potential economic and public
health value to municipalities located along the lake because
it aims toward measuring the abundance of cyanobacteria on
a sufficiently timely basis to allow municipalities and
recreation facilities that depend on Lake Erie for drinking
water to respond to the threat. The best resulting algorithm
was applied to Lake Erie and its tributaries, as well as to
some small inland lakes in Northern Ohio, though only Lake
Erie results are reported here. It also has potential for
assisting future assessment and monitoring of cyanobacteria
blooms, water quality, and aquatic ecosystem health in other
regions and, perhaps, on a global scale. These results were
obtained in a freshwater lake, however, and the algorithm
may require changes for use in marine environments.
Powerful remote sensing techniques have become avail-
able in the last two decades that facilitate the study of large-
scale biological processes in difficult environments. At least
three satellites have been commonly used for phytoplankton
mapping: AVHRR, SEAWIFS, and MODIS, all of which
have spatial resolutions that range from 250 to 1000 m in
pixel size. Because our interests transcend Lake Erie to
include its tributaries, as well as small inland lakes, we
chose the 28.5-m resolution of the six visible/reflective IR
spectral bands of LANDSAT TM and ETM+. The avail-
ability of LANDSAT TM data within 24–48 h through the
OhioView consortium (a remote sensing consortium of 11
of Ohio’s public research universities) permits non-govern-
ment scientists to perform time-sensitive research with
LANDSAT data for the first time since LANDSAT I was
orbited in 1972.
Most freshwater systems in the world are affected by
anthropogenic eutrophication, leading to undesirable
increases in planktonic and benthic biomass. These phe-
nomena often show large local differences and interactions
with patterns of water flow. Among various problems, the
amount and distribution of nuisance-forming cyanobacteria
is of primary concern for water management. Cyanobacte-
rial blooms may cause a variety of water quality problems,
including dissolved oxygen depletion and subsequent fish
kills, aesthetic nuisances (e.g., odors, scums, fish tainting,
unsightliness), and unpalatable and possibly unsafe drinking
water (Carmichael, 2001). Such problems can severely limit
aquatic habitat, recreational activities, fisheries, and use of a
water body as a potable water resource. Microcystis, a
common bloom-forming species of cyanobacteria, was
regularly documented in Lake Erie several decades ago,
when the lake was heavily eutrophied as a result of
anthropogenic activities (Makarewicz, 1993). Subsequent
phosphorus abatement strategies initiated as part of the
Great Lakes Water Quality Agreement have been largely
successful resulting in a reduction in algal biomass and
greater lake transparency. Despite these actions, blooms of
Microcystis have returned to Lake Erie, recurring each
summer since 1995. The return of the blooms appears to
coincide with the spread of invasive zebra mussels through-
out Lake Erie and is possibly related to selective filtration of
other phytoplankton by the mussels and rejection of Micro-
cystis spp. (Vanderploeg et al., 2001). During September,
1995, Lake Erie experienced a Microcystis bloom resem-
bling a thick slick of grass-green paint that extended over
the entire surface of the western basin (Brittain et al., 2000;
Budd et al., 2002; Taylor, 1997). Another notable bloom
was reported in September, 1998 (Lake Erie LaMP, 2002).
These blooms are of special concern because at least some
Lake Erie strains of Microcystis produce the peptide hep-
atotoxin microcystin, which is harmful to waterfowl or other
animals that might drink the untreated water (Brittain et al.,
2000). Microcystin has also been identified as a tumor
promoter, making long-term ingestion of even low levels
of the toxin of concern (Carmichael, 2001; Falconer &
Humpage, 1996).
It would be of economic and public health value to be
able to detect early stage (emergent) blooms of cyanobac-
teria, and Microcystis in particular, especially if it is on a
sufficiently timely basis for municipalities and recreation
facilities to implement a response plan. It has been shown
that remote sensing technology can be used to estimate the
concentration and distribution of cyanobacteria through
measuring the concentration of the pigment phycocyanin
(Dekker, 1993), which is indicative of the presence of
cyanobacteria. In waters off the southeastern coastal U.S.
and the Gulf of Mexico, Subramaniam, Brown, Hood,
Carpenter, and Capone (2001) have applied a multispectral
classification algorithm that employs data from the Sea-
viewing Wide Field-of-View Sensor (SeaWiFS) for map-
ping blooms of Trichodesmium, a marine cyanobacterium.
In cyanobacteria, phycobiliproteins constitute the major
photosynthetic accessory pigments (MacColl & Guard-Fri-
ar, 1987). Whereas in marine species the pink-colored
phycoerythrin is the dominant accessory pigment, in fresh-
water taxa, such as Microcystis, phycocyanin is the domi-
nant pigment (MacColl & Guard-Friar, 1987). With the
availability of LANDSAT 7 imagery, we proposed to
develop a LANDSAT TM algorithm for detecting levels
of phycocyanin in western Lake Erie. We also mapped
turbidity in Lake Erie and its tributaries, to investigate
relationships between phycocyanin and turbidity.
2. Materials and methods
We conducted our first experiment on July 1, 2000, a day
of LANDSAT 7 overpass. Thirty sites with a grid spacing of
2 km over three, 20-km-long lines were surveyed (with GPS
coordinates) in Maumee Bay, which is located at the
southwestern corner of Lake Erie, with surface water
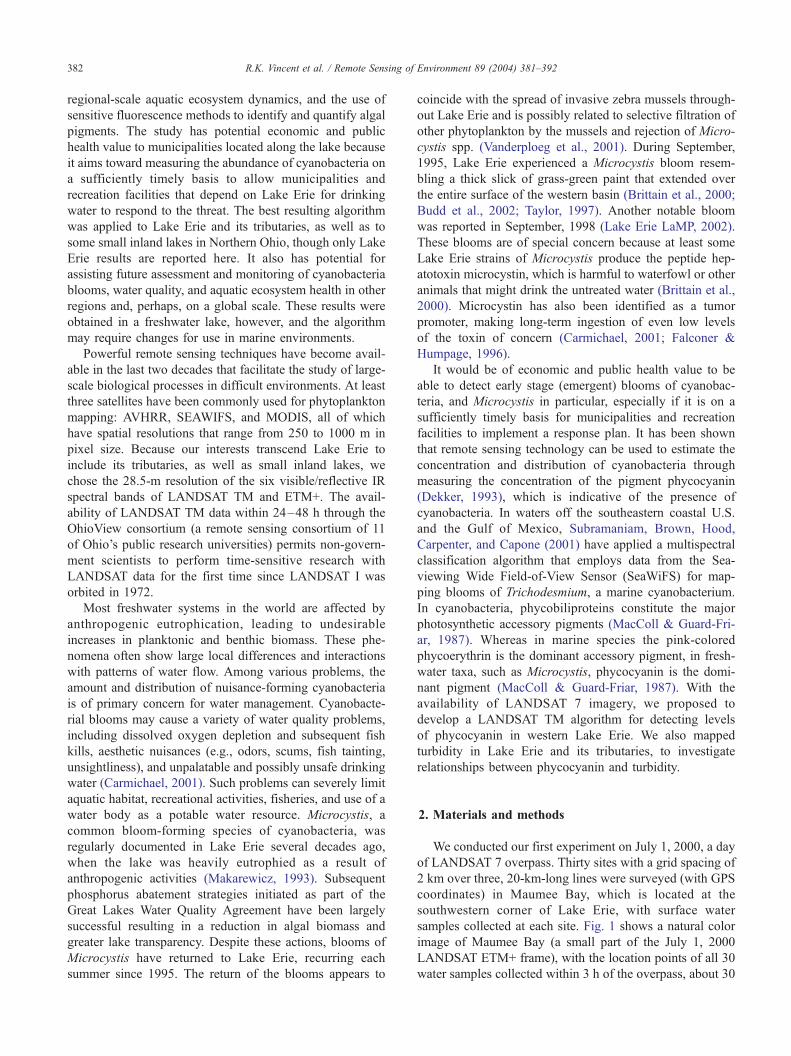
samples collected at each site. Fig. 1 shows a natural color
image of Maumee Bay (a small part of the July 1, 2000
LANDSAT ETM+ frame), with the location points of all 30
water samples collected within 3 h of the overpass, about 30
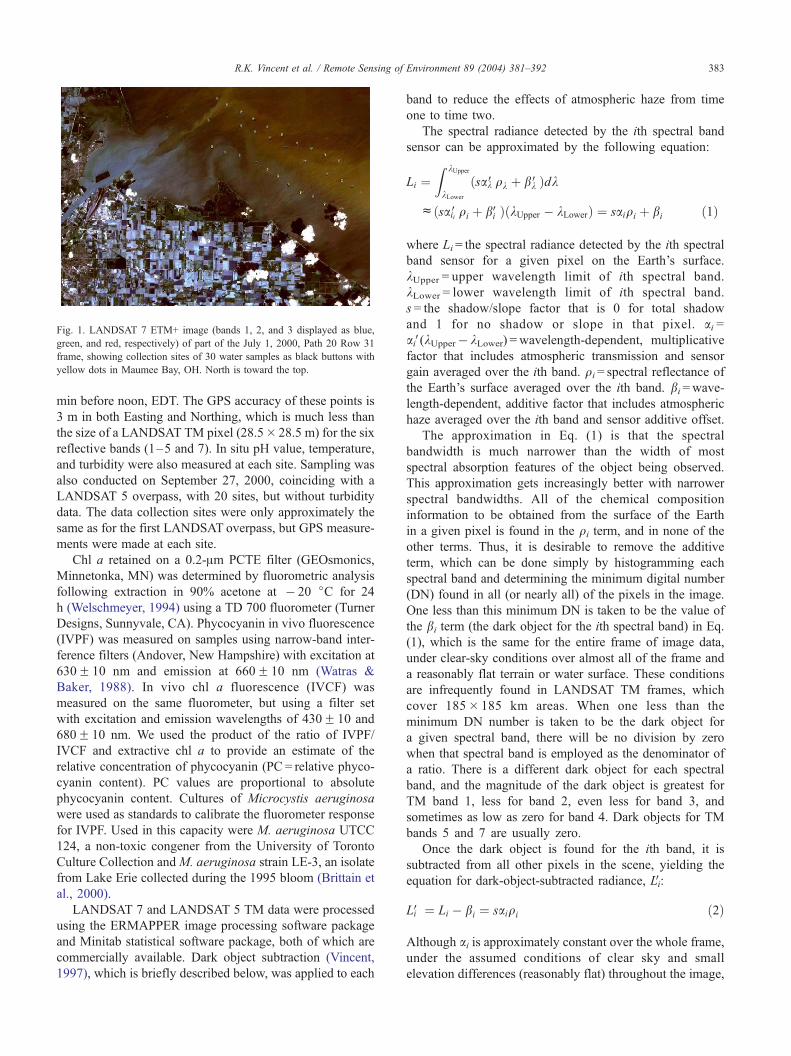
Fig. 1. LANDSAT 7 ETM+ image (bands 1, 2, and 3 displayed as blue,
green, and red, respectively) of part of the July 1, 2000, Path 20 Row 31
frame, showing collection sites of 30 water samples as black buttons with
yellow dots in Maumee Bay, OH. North is toward the top.
R.K. Vincent et al. / Remote Sensing of Environment 89 (2004) 381–392 383
min before noon, EDT. The GPS accuracy of these points is
3 m in both Easting and Northing, which is much less than
the size of a LANDSAT TM pixel (28.5� 28.5 m) for the six
reflective bands (1–5 and 7). In situ pH value, temperature,
and turbidity were also measured at each site. Sampling was
also conducted on September 27, 2000, coinciding with a
LANDSAT 5 overpass, with 20 sites, but without turbidity
data. The data collection sites were only approximately the
same as for the first LANDSAT overpass, but GPS measure-
ments were made at each site.
Chl a retained on a 0.2-Am PCTE filter (GEOsmonics,
Minnetonka, MN) was determined by fluorometric analysis
following extraction in 90% acetone at � 20 jC for 24
h (Welschmeyer, 1994) using a TD 700 fluorometer (Turner
Designs, Sunnyvale, CA). Phycocyanin in vivo fluorescence
(IVPF) was measured on samples using narrow-band inter-
ference filters (Andover, New Hampshire) with excitation at
630F 10 nm and emission at 660F 10 nm (Watras &
Baker, 1988). In vivo chl a fluorescence (IVCF) was
measured on the same fluorometer, but using a filter set
with excitation and emission wavelengths of 430F 10 and
680F 10 nm. We used the product of the ratio of IVPF/
IVCF and extractive chl a to provide an estimate of the
relative concentration of phycocyanin (PC = relative phyco-
cyanin content). PC values are proportional to absolute
phycocyanin content. Cultures of Microcystis aeruginosa
were used as standards to calibrate the fluorometer response
for IVPF. Used in this capacity were M. aeruginosa UTCC
124, a non-toxic congener from the University of Toronto
Culture Collection andM. aeruginosa strain LE-3, an isolate
from Lake Erie collected during the 1995 bloom (Brittain et
al., 2000).
LANDSAT 7 and LANDSAT 5 TM data were processed
using the ERMAPPER image processing software package
and Minitab statistical software package, both of which are
commercially available. Dark object subtraction (Vincent,
1997), which is briefly described below, was applied to each
band to reduce the effects of atmospheric haze from time
one to time two.
The spectral radiance detected by the ith spectral band
sensor can be approximated by the following equation:
Li ¼Z kUpper
kLower
ðsakVqk þ bkVÞdk
cðsaiiVqi þ biVÞðkUpper � kLowerÞ ¼ saiqi þ bi ð1Þ
where Li= the spectral radiance detected by the ith spectral
band sensor for a given pixel on the Earth’s surface.
kUpper = upper wavelength limit of ith spectral band.
kLower = lower wavelength limit of ith spectral band.
s = the shadow/slope factor that is 0 for total shadow
and 1 for no shadow or slope in that pixel. ai =aiV(kUpper� kLower) =wavelength-dependent, multiplicative
factor that includes atmospheric transmission and sensor
gain averaged over the ith band. qi= spectral reflectance of
the Earth’s surface averaged over the ith band. bi=wave-
length-dependent, additive factor that includes atmospheric
haze averaged over the ith band and sensor additive offset.
The approximation in Eq. (1) is that the spectral
bandwidth is much narrower than the width of most
spectral absorption features of the object being observed.
This approximation gets increasingly better with narrower
spectral bandwidths. All of the chemical composition
information to be obtained from the surface of the Earth
in a given pixel is found in the qi term, and in none of the
other terms. Thus, it is desirable to remove the additive
term, which can be done simply by histogramming each
spectral band and determining the minimum digital number
(DN) found in all (or nearly all) of the pixels in the image.
One less than this minimum DN is taken to be the value of
the bi term (the dark object for the ith spectral band) in Eq.
(1), which is the same for the entire frame of image data,
under clear-sky conditions over almost all of the frame and
a reasonably flat terrain or water surface. These conditions
are infrequently found in LANDSAT TM frames, which
cover 185� 185 km areas. When one less than the
minimum DN number is taken to be the dark object for
a given spectral band, there will be no division by zero
when that spectral band is employed as the denominator of
a ratio. There is a different dark object for each spectral
band, and the magnitude of the dark object is greatest for
TM band 1, less for band 2, even less for band 3, and
sometimes as low as zero for band 4. Dark objects for TM
bands 5 and 7 are usually zero.
Once the dark object is found for the ith band, it is
subtracted from all other pixels in the scene, yielding the
equation for dark-object-subtracted radiance, LiV:
LiV ¼ Li � bi ¼ saiqi ð2Þ
Although ai is approximately constant over the whole frame,
under the assumed conditions of clear sky and small
elevation differences (reasonably flat) throughout the image,
R.K. Vincent et al. / Remote Sensing of Environment 89 (2004) 381–392384
both s and qi vary from pixel to pixel. Because s holds no
information about the chemical composition of the pixel, it
is highly desirable that it should be eliminated, which can be
accomplished with a spectral ratio (Vincent, 1997). A
spectral ratio, denoted as Ri,j, is the quotient of the dark-
object-subtracted radiances in the ith and jth spectral bands,
or
Ri;j ¼LiV
LjV¼ saiqi
sajqj
¼ aiaj
� �qi
qj
!ð3Þ
Note that the shadow/slope factor is cancelled out, and what
is left are two multiplicative terms, the first of which is an
atmospheric/multiplicative gain factor that is the same
throughout the image, under the assumed conditions. The
second term is a ratio of reflectances in the ith and jth bands
for the pixel being observed and carries all the information
about chemical composition. The spectral ratio of Eq. (3)
has been demonstrated many times on land to be more
robust to solar illumination, atmospheric, and sensor param-
eter changes than any parameter based on linear combina-
tions of single spectral bands because both bi and s have
been removed by the dark-object-corrected ratio process.
LiVfor six single bands of TM and the 15 non-reciprocal
spectral ratios (Ri,j) that can be produced from those six
single bands were extracted from the image data for each of
the pixels that contained the water sample collection sites
for the July 1, 2000 overpass of LANDSAT 7 (30 samples)
and the September 27, 2000 overpass of LANDSAT 5 (22
samples). Both types of data (single band combinations and
spectral ratio combinations) were used to construct multiple
regression models describing the relationship between the
LANDSAT TM data and each of the measured values of
turbidity, chl a, and the ratio IVPF/IVCF, as well as PC,
which was estimated for each water sample from the product
of chl a content and the IVPF/IVCF ratio.
We chose not to employ preconceived notions con-
cerning the best single bands or the best spectral ratios
for mapping the parameters of interest (PC and turbidity);
rather, we entered all of them and let the multiple
regression method sort the best ones out. The best multiple
regression models for PC and turbidity were sought
separately for linear combinations of single band and linear
combinations of spectral ratios. It was our expectation,
from Eq. (3) and past experience on land experiments, that
the spectral ratio models would be more robust (applicable
to data collected from later dates) than the single band
models. These expectations were proved correct, as shown
in the next section.
The mathematical models (algorithms) of PC and turbid-
ity for both LANDSAT 7 and LANDSAT 5 images (for a
given type of input) were generated by using a three-step
procedure in the MINITAB commercial software package:
first, best subsets regression (employing both forward and
backward step-wise linear regression) was employed, with
only the top two models (on the basis of highest R2)
reported for each number of variables; second, the top three
reported models, based on R2(adjusted), were tested for
autocorrelation with a Durbin–Watson (DW) statistical test
(Durbin & Watson, 1951); third, the model which had the
highest R2(adjusted) value, that also passed the DW test was
selected as the best model for that type of input. This
procedure has been discussed in greater detail elsewhere
(Vincent, 2000). Although the DW test is more commonly
employed in judging autocorrelation in multiple regression
models of time series (multiple time inputs), it is equally
useful for judging autocorrelation in regression models from
multiple spectral band inputs. The test applies to regression
models produced from any type of multiple inputs. The best
model of each type of input (single bands and spectral
ratios) was applied to the image the model came from, as
well as to another image (with a different overpass date in
year 2000), to test how well and how robustly each type of
regression model performed. For all final models reported
here, PV 0.0005, where P is the F-statistic probability;
therefore, they are significant to at least the 0.1% level.
We then applied the best PC and turbidity models from
July 1, 2000 to LANDSAT 7 data collected on July 16, 2002
and August 1, 2002 of the Path 19 Row 31 frame and on
August 8, 2002 of the adjacent frame area to the West (Past
20 Row 31). It was later reported by local media that a
Microcystis bloom occurred in the western basin of Lake
Erie late in the summer of 2002.
3. Results and discussions
For the LANDSAT 7 image collected on July 1, 2000,
strong correlations between predicted and actual PC were
found for both the best model with single band inputs and
the best model with spectral ratio inputs (hereafter called the
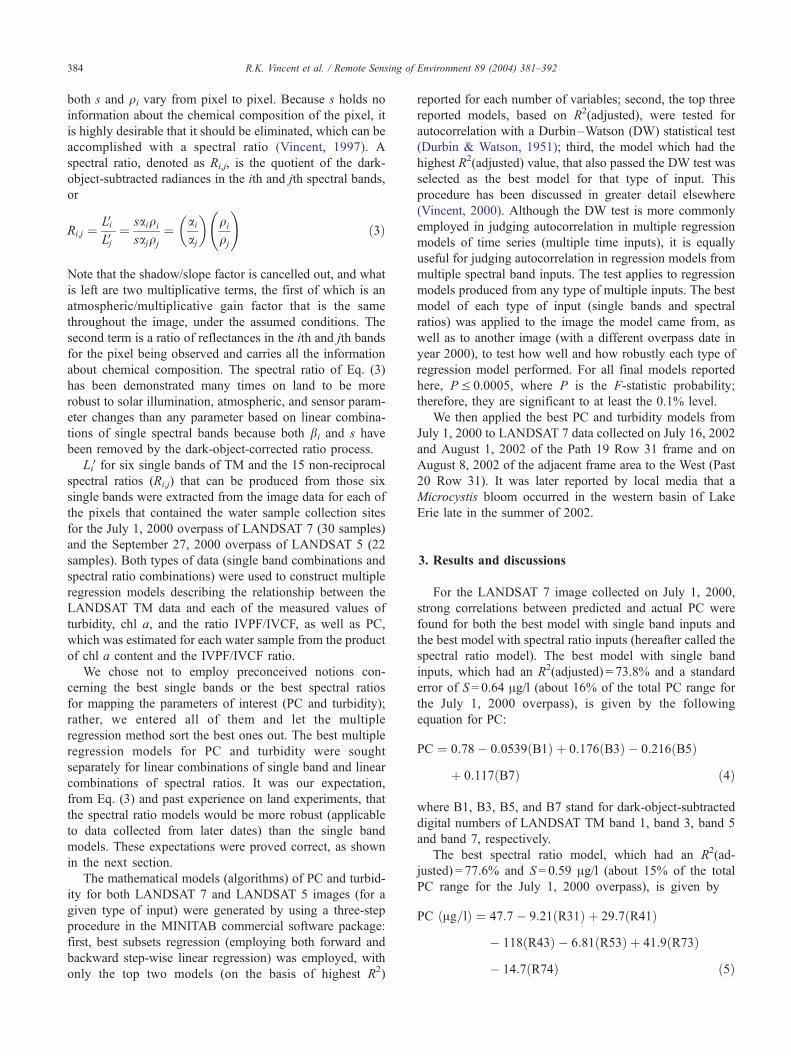
spectral ratio model). The best model with single band
inputs, which had an R2(adjusted) = 73.8% and a standard
error of S = 0.64 Ag/l (about 16% of the total PC range for
the July 1, 2000 overpass), is given by the following
equation for PC:
PC ¼ 0:78� 0:0539ðB1Þ þ 0:176ðB3Þ � 0:216ðB5Þ
þ 0:117ðB7Þ ð4Þ
where B1, B3, B5, and B7 stand for dark-object-subtracted
digital numbers of LANDSAT TM band 1, band 3, band 5
and band 7, respectively.
The best spectral ratio model, which had an R2(ad-
justed) = 77.6% and S = 0.59 Ag/l (about 15% of the total
PC range for the July 1, 2000 overpass), is given by
PC ðAg=lÞ ¼ 47:7� 9:21ðR31Þ þ 29:7ðR41Þ
� 118ðR43Þ � 6:81ðR53Þ þ 41:9ðR73Þ
� 14:7ðR74Þ ð5Þ
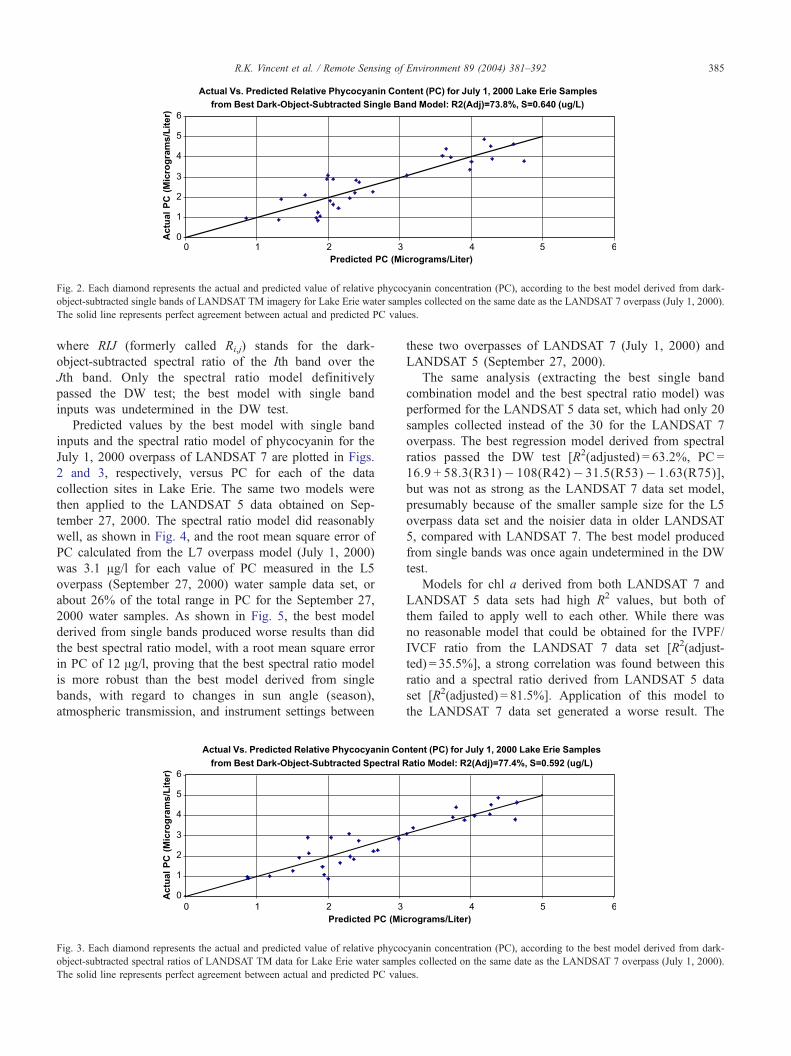
Fig. 2. Each diamond represents the actual and predicted value of relative phycocyanin concentration (PC), according to the best model derived from dark-
object-subtracted single bands of LANDSAT TM imagery for Lake Erie water samples collected on the same date as the LANDSAT 7 overpass (July 1, 2000).
The solid line represents perfect agreement between actual and predicted PC values.
R.K. Vincent et al. / Remote Sensing of Environment 89 (2004) 381–392 385
where RIJ (formerly called Ri,j) stands for the dark-
object-subtracted spectral ratio of the Ith band over the
Jth band. Only the spectral ratio model definitively
passed the DW test; the best model with single band
inputs was undetermined in the DW test.
Predicted values by the best model with single band
inputs and the spectral ratio model of phycocyanin for the
July 1, 2000 overpass of LANDSAT 7 are plotted in Figs.
2 and 3, respectively, versus PC for each of the data
collection sites in Lake Erie. The same two models were
then applied to the LANDSAT 5 data obtained on Sep-
tember 27, 2000. The spectral ratio model did reasonably
well, as shown in Fig. 4, and the root mean square error of
PC calculated from the L7 overpass model (July 1, 2000)
was 3.1 Ag/l for each value of PC measured in the L5
overpass (September 27, 2000) water sample data set, or
about 26% of the total range in PC for the September 27,
2000 water samples. As shown in Fig. 5, the best model
derived from single bands produced worse results than did
the best spectral ratio model, with a root mean square error
in PC of 12 Ag/l, proving that the best spectral ratio model
is more robust than the best model derived from single
bands, with regard to changes in sun angle (season),
atmospheric transmission, and instrument settings between
Fig. 3. Each diamond represents the actual and predicted value of relative phyco
object-subtracted spectral ratios of LANDSAT TM data for Lake Erie water samp
The solid line represents perfect agreement between actual and predicted PC valu
these two overpasses of LANDSAT 7 (July 1, 2000) and
LANDSAT 5 (September 27, 2000).
The same analysis (extracting the best single band
combination model and the best spectral ratio model) was
performed for the LANDSAT 5 data set, which had only 20
samples collected instead of the 30 for the LANDSAT 7
overpass. The best regression model derived from spectral
ratios passed the DW test [R2(adjusted) = 63.2%, PC =
16.9 + 58.3(R31)� 108(R42)� 31.5(R53)� 1.63(R75)],
but was not as strong as the LANDSAT 7 data set model,
presumably because of the smaller sample size for the L5
overpass data set and the noisier data in older LANDSAT
5, compared with LANDSAT 7. The best model produced
from single bands was once again undetermined in the DW
test.
Models for chl a derived from both LANDSAT 7 and
LANDSAT 5 data sets had high R2 values, but both of
them failed to apply well to each other. While there was
no reasonable model that could be obtained for the IVPF/
IVCF ratio from the LANDSAT 7 data set [R2(adjust-
ted) = 35.5%], a strong correlation was found between this
ratio and a spectral ratio derived from LANDSAT 5 data
set [R2(adjusted) = 81.5%]. Application of this model to
the LANDSAT 7 data set generated a worse result. The
cyanin concentration (PC), according to the best model derived from dark-
les collected on the same date as the LANDSAT 7 overpass (July 1, 2000).
es.
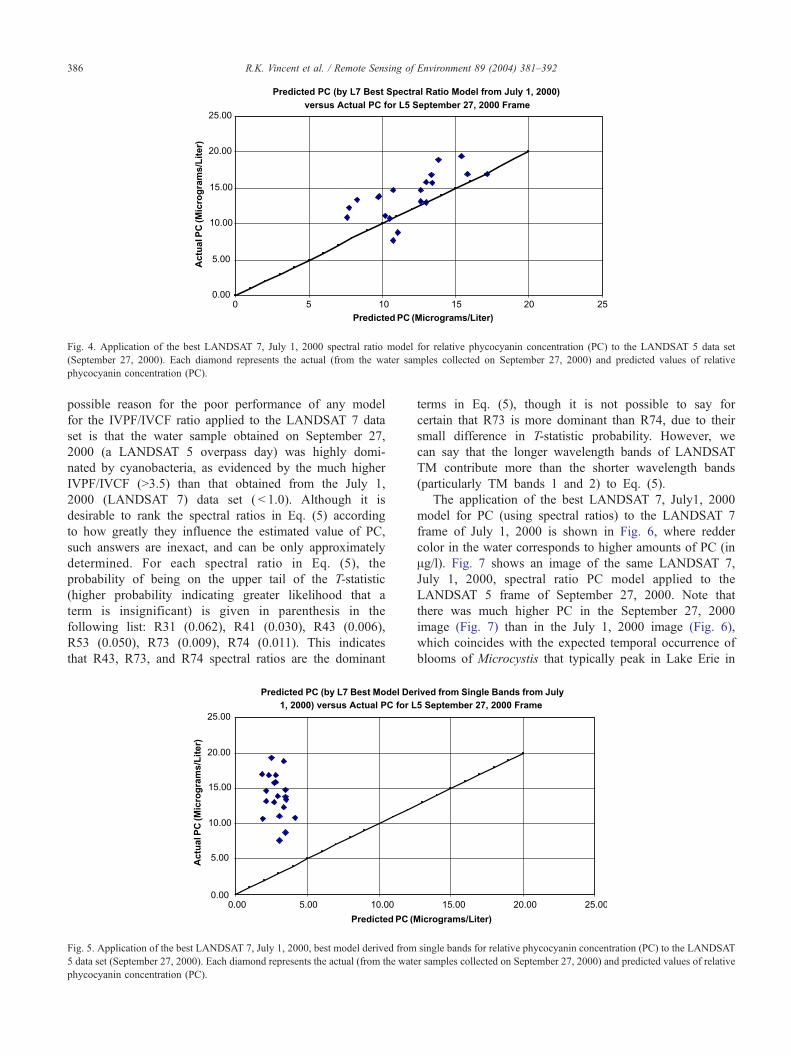
Fig. 4. Application of the best LANDSAT 7, July 1, 2000 spectral ratio model for relative phycocyanin concentration (PC) to the LANDSAT 5 data set
(September 27, 2000). Each diamond represents the actual (from the water samples collected on September 27, 2000) and predicted values of relative
phycocyanin concentration (PC).
R.K. Vincent et al. / Remote Sensing of Environment 89 (2004) 381–392386
possible reason for the poor performance of any model
for the IVPF/IVCF ratio applied to the LANDSAT 7 data
set is that the water sample obtained on September 27,
2000 (a LANDSAT 5 overpass day) was highly domi-
nated by cyanobacteria, as evidenced by the much higher
IVPF/IVCF (>3.5) than that obtained from the July 1,
2000 (LANDSAT 7) data set ( < 1.0). Although it is
desirable to rank the spectral ratios in Eq. (5) according
to how greatly they influence the estimated value of PC,
such answers are inexact, and can be only approximately
determined. For each spectral ratio in Eq. (5), the
probability of being on the upper tail of the T-statistic
(higher probability indicating greater likelihood that a
term is insignificant) is given in parenthesis in the
following list: R31 (0.062), R41 (0.030), R43 (0.006),
R53 (0.050), R73 (0.009), R74 (0.011). This indicates
that R43, R73, and R74 spectral ratios are the dominant
Fig. 5. Application of the best LANDSAT 7, July 1, 2000, best model derived from
5 data set (September 27, 2000). Each diamond represents the actual (from the wate
phycocyanin concentration (PC).
terms in Eq. (5), though it is not possible to say for
certain that R73 is more dominant than R74, due to their
small difference in T-statistic probability. However, we
can say that the longer wavelength bands of LANDSAT
TM contribute more than the shorter wavelength bands
(particularly TM bands 1 and 2) to Eq. (5).
The application of the best LANDSAT 7, July1, 2000
model for PC (using spectral ratios) to the LANDSAT 7
frame of July 1, 2000 is shown in Fig. 6, where redder
color in the water corresponds to higher amounts of PC (in
Ag/l). Fig. 7 shows an image of the same LANDSAT 7,
July 1, 2000, spectral ratio PC model applied to the
LANDSAT 5 frame of September 27, 2000. Note that
there was much higher PC in the September 27, 2000
image (Fig. 7) than in the July 1, 2000 image (Fig. 6),
which coincides with the expected temporal occurrence of
blooms of Microcystis that typically peak in Lake Erie in
single bands for relative phycocyanin concentration (PC) to the LANDSAT
r samples collected on September 27, 2000) and predicted values of relative
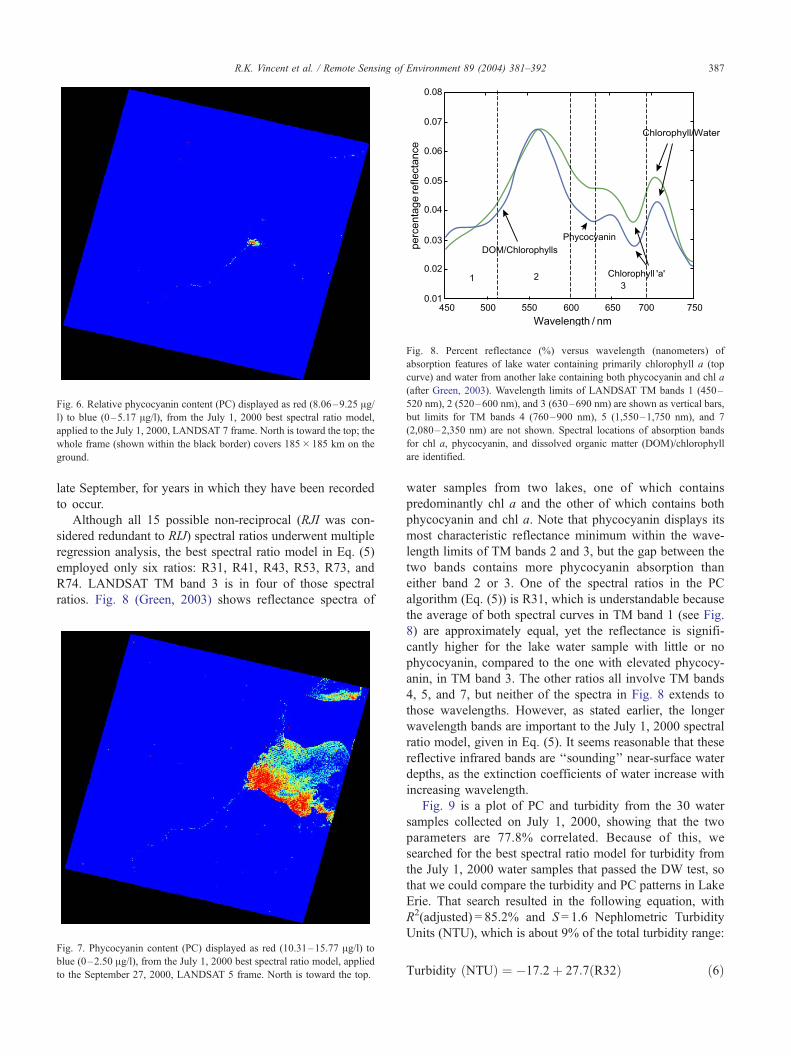
Fig. 6. Relative phycocyanin content (PC) displayed as red (8.06–9.25 Ag/l) to blue (0–5.17 Ag/l), from the July 1, 2000 best spectral ratio model,
applied to the July 1, 2000, LANDSAT 7 frame. North is toward the top; the
whole frame (shown within the black border) covers 185� 185 km on the
ground.
Fig. 8. Percent reflectance (%) versus wavelength (nanometers) of
absorption features of lake water containing primarily chlorophyll a (top
curve) and water from another lake containing both phycocyanin and chl a
(after Green, 2003). Wavelength limits of LANDSAT TM bands 1 (450–
520 nm), 2 (520–600 nm), and 3 (630–690 nm) are shown as vertical bars,
but limits for TM bands 4 (760–900 nm), 5 (1,550–1,750 nm), and 7
(2,080–2,350 nm) are not shown. Spectral locations of absorption bands
for chl a, phycocyanin, and dissolved organic matter (DOM)/chlorophyll
are identified.
R.K. Vincent et al. / Remote Sensing of Environment 89 (2004) 381–392 387
late September, for years in which they have been recorded
to occur.
Although all 15 possible non-reciprocal (RJI was con-
sidered redundant to RIJ) spectral ratios underwent multiple
regression analysis, the best spectral ratio model in Eq. (5)
employed only six ratios: R31, R41, R43, R53, R73, and
R74. LANDSAT TM band 3 is in four of those spectral
ratios. Fig. 8 (Green, 2003) shows reflectance spectra of
Fig. 7. Phycocyanin content (PC) displayed as red (10.31–15.77 Ag/l) toblue (0–2.50 Ag/l), from the July 1, 2000 best spectral ratio model, applied
to the September 27, 2000, LANDSAT 5 frame. North is toward the top.
water samples from two lakes, one of which contains
predominantly chl a and the other of which contains both
phycocyanin and chl a. Note that phycocyanin displays its
most characteristic reflectance minimum within the wave-
length limits of TM bands 2 and 3, but the gap between the
two bands contains more phycocyanin absorption than
either band 2 or 3. One of the spectral ratios in the PC
algorithm (Eq. (5)) is R31, which is understandable because
the average of both spectral curves in TM band 1 (see Fig.
8) are approximately equal, yet the reflectance is signifi-
cantly higher for the lake water sample with little or no
phycocyanin, compared to the one with elevated phycocy-
anin, in TM band 3. The other ratios all involve TM bands
4, 5, and 7, but neither of the spectra in Fig. 8 extends to
those wavelengths. However, as stated earlier, the longer
wavelength bands are important to the July 1, 2000 spectral
ratio model, given in Eq. (5). It seems reasonable that these
reflective infrared bands are ‘‘sounding’’ near-surface water
depths, as the extinction coefficients of water increase with
increasing wavelength.
Fig. 9 is a plot of PC and turbidity from the 30 water
samples collected on July 1, 2000, showing that the two
parameters are 77.8% correlated. Because of this, we
searched for the best spectral ratio model for turbidity from
the July 1, 2000 water samples that passed the DW test, so
that we could compare the turbidity and PC patterns in Lake
Erie. That search resulted in the following equation, with
R2(adjusted) = 85.2% and S = 1.6 Nephlometric Turbidity
Units (NTU), which is about 9% of the total turbidity range:
Turbidity ðNTUÞ ¼ �17:2þ 27:7ðR32Þ ð6Þ
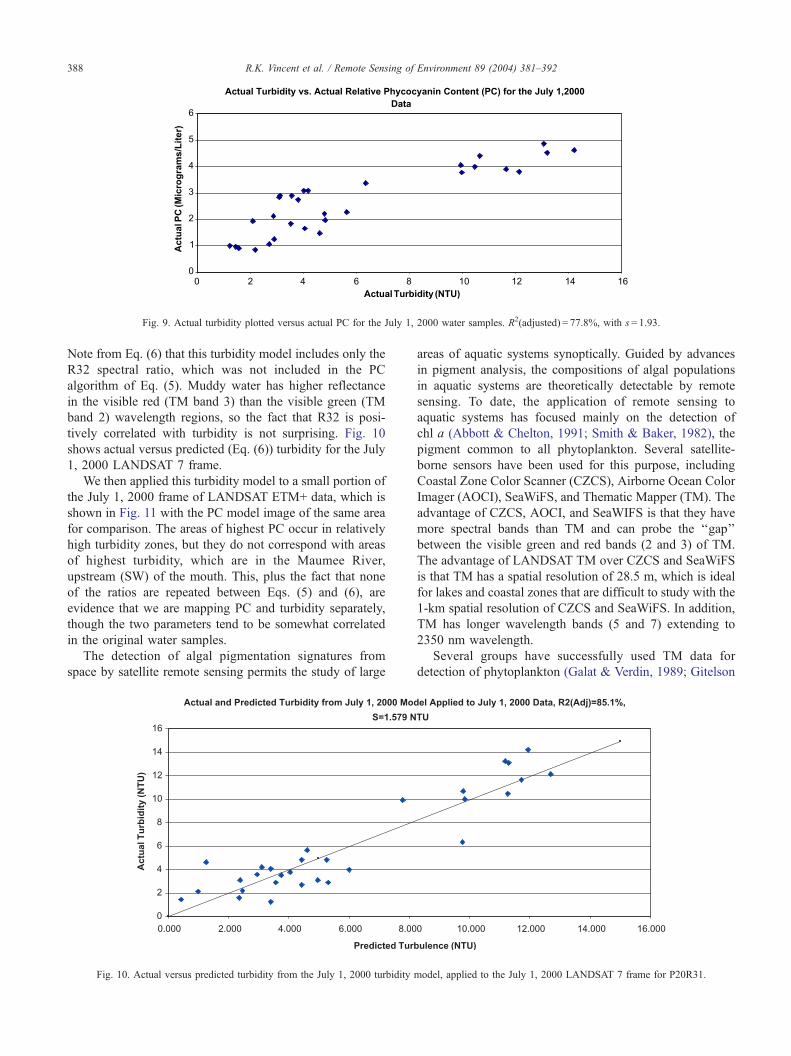
Fig. 9. Actual turbidity plotted versus actual PC for the July 1, 2000 water samples. R2(adjusted) = 77.8%, with s = 1.93.
R.K. Vincent et al. / Remote Sensing of Environment 89 (2004) 381–392388
Note from Eq. (6) that this turbidity model includes only the
R32 spectral ratio, which was not included in the PC
algorithm of Eq. (5). Muddy water has higher reflectance
in the visible red (TM band 3) than the visible green (TM
band 2) wavelength regions, so the fact that R32 is posi-
tively correlated with turbidity is not surprising. Fig. 10
shows actual versus predicted (Eq. (6)) turbidity for the July
1, 2000 LANDSAT 7 frame.
We then applied this turbidity model to a small portion of
the July 1, 2000 frame of LANDSAT ETM+ data, which is
shown in Fig. 11 with the PC model image of the same area
for comparison. The areas of highest PC occur in relatively
high turbidity zones, but they do not correspond with areas
of highest turbidity, which are in the Maumee River,
upstream (SW) of the mouth. This, plus the fact that none
of the ratios are repeated between Eqs. (5) and (6), are
evidence that we are mapping PC and turbidity separately,
though the two parameters tend to be somewhat correlated
in the original water samples.
The detection of algal pigmentation signatures from
space by satellite remote sensing permits the study of large
Fig. 10. Actual versus predicted turbidity from the July 1, 2000 turbidity
areas of aquatic systems synoptically. Guided by advances
in pigment analysis, the compositions of algal populations
in aquatic systems are theoretically detectable by remote
sensing. To date, the application of remote sensing to
aquatic systems has focused mainly on the detection of
chl a (Abbott & Chelton, 1991; Smith & Baker, 1982), the
pigment common to all phytoplankton. Several satellite-
borne sensors have been used for this purpose, including
Coastal Zone Color Scanner (CZCS), Airborne Ocean Color
Imager (AOCI), SeaWiFS, and Thematic Mapper (TM). The
advantage of CZCS, AOCI, and SeaWIFS is that they have
more spectral bands than TM and can probe the ‘‘gap’’
between the visible green and red bands (2 and 3) of TM.
The advantage of LANDSAT TM over CZCS and SeaWiFS
is that TM has a spatial resolution of 28.5 m, which is ideal
for lakes and coastal zones that are difficult to study with the
1-km spatial resolution of CZCS and SeaWiFS. In addition,
TM has longer wavelength bands (5 and 7) extending to
2350 nm wavelength.
Several groups have successfully used TM data for
detection of phytoplankton (Galat & Verdin, 1989; Gitelson
model, applied to the July 1, 2000 LANDSAT 7 frame for P20R31.
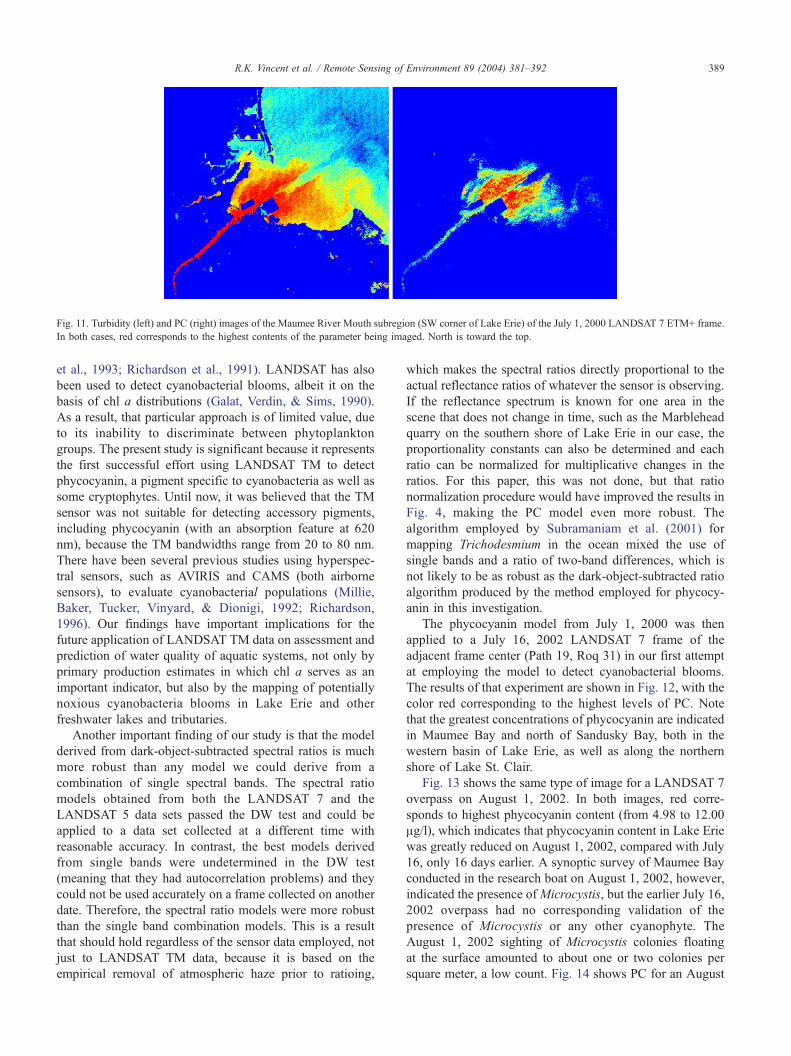
Fig. 11. Turbidity (left) and PC (right) images of the Maumee River Mouth subregion (SW corner of Lake Erie) of the July 1, 2000 LANDSAT 7 ETM+ frame.
In both cases, red corresponds to the highest contents of the parameter being imaged. North is toward the top.
R.K. Vincent et al. / Remote Sensing of Environment 89 (2004) 381–392 389
et al., 1993; Richardson et al., 1991). LANDSAT has also
been used to detect cyanobacterial blooms, albeit it on the
basis of chl a distributions (Galat, Verdin, & Sims, 1990).
As a result, that particular approach is of limited value, due
to its inability to discriminate between phytoplankton
groups. The present study is significant because it represents
the first successful effort using LANDSAT TM to detect
phycocyanin, a pigment specific to cyanobacteria as well as
some cryptophytes. Until now, it was believed that the TM
sensor was not suitable for detecting accessory pigments,
including phycocyanin (with an absorption feature at 620
nm), because the TM bandwidths range from 20 to 80 nm.
There have been several previous studies using hyperspec-
tral sensors, such as AVIRIS and CAMS (both airborne
sensors), to evaluate cyanobacterial populations (Millie,
Baker, Tucker, Vinyard, & Dionigi, 1992; Richardson,
1996). Our findings have important implications for the
future application of LANDSAT TM data on assessment and
prediction of water quality of aquatic systems, not only by
primary production estimates in which chl a serves as an
important indicator, but also by the mapping of potentially
noxious cyanobacteria blooms in Lake Erie and other
freshwater lakes and tributaries.
Another important finding of our study is that the model
derived from dark-object-subtracted spectral ratios is much
more robust than any model we could derive from a
combination of single spectral bands. The spectral ratio
models obtained from both the LANDSAT 7 and the
LANDSAT 5 data sets passed the DW test and could be
applied to a data set collected at a different time with
reasonable accuracy. In contrast, the best models derived
from single bands were undetermined in the DW test
(meaning that they had autocorrelation problems) and they
could not be used accurately on a frame collected on another
date. Therefore, the spectral ratio models were more robust
than the single band combination models. This is a result
that should hold regardless of the sensor data employed, not
just to LANDSAT TM data, because it is based on the
empirical removal of atmospheric haze prior to ratioing,
which makes the spectral ratios directly proportional to the
actual reflectance ratios of whatever the sensor is observing.
If the reflectance spectrum is known for one area in the
scene that does not change in time, such as the Marblehead
quarry on the southern shore of Lake Erie in our case, the
proportionality constants can also be determined and each
ratio can be normalized for multiplicative changes in the
ratios. For this paper, this was not done, but that ratio
normalization procedure would have improved the results in
Fig. 4, making the PC model even more robust. The
algorithm employed by Subramaniam et al. (2001) for
mapping Trichodesmium in the ocean mixed the use of
single bands and a ratio of two-band differences, which is
not likely to be as robust as the dark-object-subtracted ratio
algorithm produced by the method employed for phycocy-
anin in this investigation.
The phycocyanin model from July 1, 2000 was then
applied to a July 16, 2002 LANDSAT 7 frame of the
adjacent frame center (Path 19, Roq 31) in our first attempt
at employing the model to detect cyanobacterial blooms.
The results of that experiment are shown in Fig. 12, with the
color red corresponding to the highest levels of PC. Note
that the greatest concentrations of phycocyanin are indicated
in Maumee Bay and north of Sandusky Bay, both in the
western basin of Lake Erie, as well as along the northern
shore of Lake St. Clair.
Fig. 13 shows the same type of image for a LANDSAT 7
overpass on August 1, 2002. In both images, red corre-
sponds to highest phycocyanin content (from 4.98 to 12.00
Ag/l), which indicates that phycocyanin content in Lake Erie
was greatly reduced on August 1, 2002, compared with July
16, only 16 days earlier. A synoptic survey of Maumee Bay
conducted in the research boat on August 1, 2002, however,
indicated the presence ofMicrocystis, but the earlier July 16,
2002 overpass had no corresponding validation of the
presence of Microcystis or any other cyanophyte. The
August 1, 2002 sighting of Microcystis colonies floating
at the surface amounted to about one or two colonies per
square meter, a low count. Fig. 14 shows PC for an August
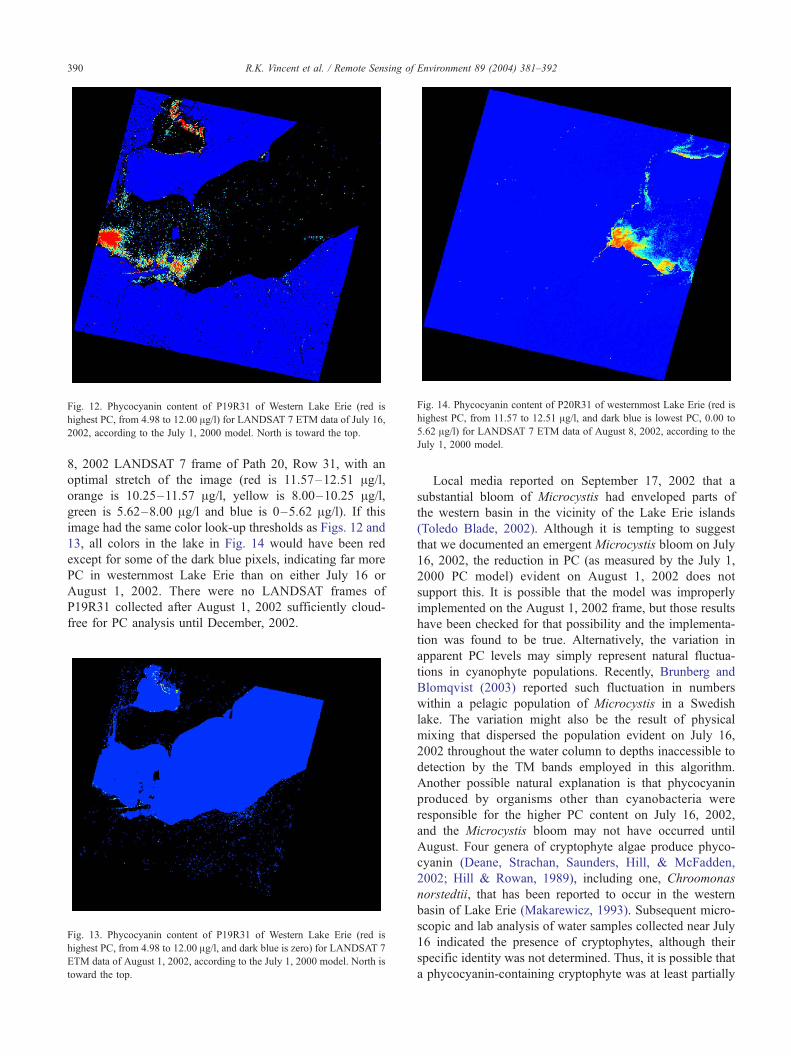
Fig. 14. Phycocyanin content of P20R31 of westernmost Lake Erie (red is
highest PC, from 11.57 to 12.51 Ag/l, and dark blue is lowest PC, 0.00 to
5.62 Ag/l) for LANDSAT 7 ETM data of August 8, 2002, according to the
July 1, 2000 model.
Fig. 12. Phycocyanin content of P19R31 of Western Lake Erie (red is
highest PC, from 4.98 to 12.00 Ag/l) for LANDSAT 7 ETM data of July 16,
2002, according to the July 1, 2000 model. North is toward the top.
R.K. Vincent et al. / Remote Sensing of Environment 89 (2004) 381–392390
8, 2002 LANDSAT 7 frame of Path 20, Row 31, with an
optimal stretch of the image (red is 11.57–12.51 Ag/l,orange is 10.25–11.57 Ag/l, yellow is 8.00–10.25 Ag/l,green is 5.62–8.00 Ag/l and blue is 0–5.62 Ag/l). If this
image had the same color look-up thresholds as Figs. 12 and
13, all colors in the lake in Fig. 14 would have been red
except for some of the dark blue pixels, indicating far more
PC in westernmost Lake Erie than on either July 16 or
August 1, 2002. There were no LANDSAT frames of
P19R31 collected after August 1, 2002 sufficiently cloud-
free for PC analysis until December, 2002.
Fig. 13. Phycocyanin content of P19R31 of Western Lake Erie (red is
highest PC, from 4.98 to 12.00 Ag/l, and dark blue is zero) for LANDSAT 7
ETM data of August 1, 2002, according to the July 1, 2000 model. North is
toward the top.
Local media reported on September 17, 2002 that a
substantial bloom of Microcystis had enveloped parts of
the western basin in the vicinity of the Lake Erie islands
(Toledo Blade, 2002). Although it is tempting to suggest
that we documented an emergent Microcystis bloom on July
16, 2002, the reduction in PC (as measured by the July 1,
2000 PC model) evident on August 1, 2002 does not
support this. It is possible that the model was improperly
implemented on the August 1, 2002 frame, but those results
have been checked for that possibility and the implementa-
tion was found to be true. Alternatively, the variation in
apparent PC levels may simply represent natural fluctua-
tions in cyanophyte populations. Recently, Brunberg and
Blomqvist (2003) reported such fluctuation in numbers
within a pelagic population of Microcystis in a Swedish
lake. The variation might also be the result of physical
mixing that dispersed the population evident on July 16,
2002 throughout the water column to depths inaccessible to
detection by the TM bands employed in this algorithm.
Another possible natural explanation is that phycocyanin
produced by organisms other than cyanobacteria were
responsible for the higher PC content on July 16, 2002,
and the Microcystis bloom may not have occurred until
August. Four genera of cryptophyte algae produce phyco-
cyanin (Deane, Strachan, Saunders, Hill, & McFadden,
2002; Hill & Rowan, 1989), including one, Chroomonas
norstedtii, that has been reported to occur in the western
basin of Lake Erie (Makarewicz, 1993). Subsequent micro-
scopic and lab analysis of water samples collected near July
16 indicated the presence of cryptophytes, although their
specific identity was not determined. Thus, it is possible that
a phycocyanin-containing cryptophyte was at least partially
R.K. Vincent et al. / Remote Sensing of Environment 89 (2004) 381–392 391
responsible for the phycocyanin signature observed on July
16 (Fig. 12). Similarly, single-celled cyanobacteria (such as
Synechococcus and Synechocystis) might be responsible for
the elevated phycocyanin signature, yet would not have
been readily observed as part of routine microscopic exam-
ination of the water samples from that date.
In either case, it seems likely that at least the August 8,
2002 image (Fig. 14) represented the initial stages of a large
Microcystis bloom reported on September 17 in local media.
However, the occurrence of a reduced PC content on August
1, 2002, presents complications that keep us from claiming a
definitive answer to our second objective: ‘‘Can the algo-
rithms be used to detect early stage formation of cyanobac-
terial blooms?’’
4. Conclusions
Since the extensive bloom of Microcystis in Lake Erie in
1995 (Brittain et al., 2000; Budd et al., 2002), researchers
have continued to examine various potential bloom-causing
conditions such as changes in nutrients, temperature, light
levels, or even selective feeding—and subsequent rejection
as pseudofaces by zebra mussels (Vanderploeg et al., 2001).
Our work is the first effort that employs LANDSAT TM
remote sensing technology for quantitatively mapping PC
of freshwater lakes from space. From water samples
collected during two LANDSAT overpasses, a spectral
ratio algorithm (Eq. (5)) for PC with a standard error of
0.6 Ag/l (about 15% of the PC total range on July 1, 2000)
was created that predicted the PC values on a LANDSAT
5 overpass with a root mean square error of 3.1 Ag/l (about26% of the PC total range on September 27, 2000). This
error is sufficiently small to permit us to map large
increases in PC that occur seasonally, and hence, to map
cyanobacterial blooms, with the assumption that they also
create differences in PC of similar or larger magnitude.
Because the PC and turbidity data from the July 1, 2000
water samples were somewhat correlated, we also created a
turbidity model and showed that the highest PC values and
the highest turbidity values did not coincide, though the
highest PC values were found in relatively high turbidity
areas. This, plus the non-overlap in spectral ratios
employed by the PC and turbidity algorithms, provided
evidence that we were mapping PC and turbidity separate-
ly. We submit, therefore, that we have affirmatively an-
swered the first question posed in Introduction.
The second question was not completely answered by
this investigation, though the August 8, 2002 LANDSAT 7
frame for P20R31 (including the city of Toledo) showed a
marked increase in PC (using the best July 1, 2000, PC
spectral ratio model) from both July 16 and August 1, 2002,
and local media on September 17, 2002 announced a major
Microcystis bloom. The drop in PC content from July 16 to
August 1, 2002 presents a complication that has yet to be
resolved, though it could have been caused by phycocyanin
from other phytoplankton (cryptophytes or other cyanobac-
teria) on July 16, 2002, or as a result of natural fluctuations
in a population of Microcystis.
Answers to these questions are feasible because we take
advantage of two technology-based approaches: the use of
remote sensing, which quantitatively measures light ref-
lected from the surface of the earth, as a tool to study
regional-scale aquatic ecosystem dynamics, and the refine-
ment of techniques to identify and quantify algal pigments
(Richardson, 1996). We conclude our preliminary findings
as follows:
1. The LANDSAT TM sensor can be used to evaluate water
quality by detecting accessory pigments of algae, such as
phycocyanin, despite the relatively wide range of the
sensor’s spectral bandwidth. Detection of phycocyanin
may serve as a tool to detect and map cyanobacterial
blooms, including blooms of the noxious Microcystis.
2. The PC algorithm can be applied to both LANDSAT 7
and LANDSAT 5 data sets, which together provide an 8-
day monitoring interval instead of the 16-day interval
that only one satellite provides.
3. Multiple regression models with spectral ratio inputs are
more robust and reliable than multiple regression models
with single band inputs for mapping PC from LANDSAT
TM data.
4. The 28.5-m spatial resolution of LANDSAT TM bands
1–5 and 7, which were the only ones used in this
experiment, is adequate to resolve locations upstream
into Lake Erie tributaries for measurement of PC and
turbidity.
Mass blooms of cyanobacteria occur in freshwater and
estuarine ecosystems throughout the world. However, we do
not yet know whether this or some other phycocyanin
algorithm can be made to work in saltwater.
Acknowledgements
We wish to thank the OhioView remote sensing
consortium, of which both Bowling Green State University
and the University of Toledo are members, for providing
the LANDSAT TM data free of charge and the NASA
Glenn Research Center for funding this research. Professor
Wayne Carmichael (Wright State University) provided a
Lake Erie strain of Microcystis used in this research. We
also thank the University of Toledo’s Lake Erie Center for
the use of their research vessel to collect water samples in
Lake Erie.
References
Abbott, M. R., & Chelton, D. B. (1991). Advances in passive remote
sensing of the ocean. Geophysics, 571–589 (Suppl.).
R.K. Vincent et al. / Remote Sensing of Environment 89 (2004) 381–392392
Brittain, S.M.,Wang, J., Babcock-Jackson, L., Carmichael,W.W., Rinehart,
K. L., & Culver, D. A. (2000). Isolation and characterization of micro-
cystins, cyclic heptapeptide hepatotoxins from a Lake Erie strain of Mi-
crocystis aeruginosa. Journal of Great Lakes Research, 26, 241–249.
Brunberg, A. -K., & Blomqvist, P. (2003). Recruitment of Microcystis
(Cyanophyceae) from lake sediments: The importance of littoral inoc-
ula. Journal of Phycology, 39, 58–63.
Budd, J. W., Beeton, A. M., Stumpf, R. P., Culver, D. A., & Kerfoot, W. C.
(2002). Satellite observations of Microcystis blooms in Western Lake
Erie. Verhandlungen-Internationale Vereinigung fur Theoretische und
Angewandte Limnologie, 27, 3787–3793.
Carmichael, W. W. (2001). Health effects of toxin-producing cyanobacte-
ria: ‘‘The CyanoHABs’’. Human and Ecological Risk Assessment, 7,
1393–1407.
Deane, J. A., Strachan, I. M., Saunders, G. W., Hill, D. R. A., & McFadden,
G. I. (2002). Cryptomonad evolution: Nuclear 18S rDNA phylogeny
versus cell morphology and pigmentation. Journal of Phycology, 38,
1236–1244.
Dekker, A. G. (1993). Detection of optical water quality parameters for
eutrophic waters by high resolution remote sensing. PhD thesis. Am-
sterdam: Free University.
Durbin, J., & Watson, G. S. (1951). Testing for serial correlation in least
squares regression: II. Biometrica, 38, 159–178.
Falconer, I. R., & Humpage, A. R. (1996). Tumour production by cyano-
bacterial toxins. Phycologia, 35(Suppl. 6), 74–79.
Galat, D. L., & Verdin, J. P. (1989). Patchiness, collapse and succession of
a cyanobacterial bloom evaluated by synoptic sampling and remote
sensing. Journal of Plankton Research, 11, 925–948.
Galat, D. L., Verdin, J. P., & Sims, L. L. (1990). Large-scale patterns of
Nodularia spumigena blooms in Pyramid Lake, Nevada, determined
from Landsat imagery: 1972–1986. Hydrobiologia, 197, 147–164.
Gitelson, A., Garbuzov, G., Szilagyi, F., Mittenzwey, K. H., Karnieli, A., &
Kaiser, A. (1993). Quantitative remote sensing methods for real-time
monitoring of inland waters quality. International Journal of Remote
Sensing, 14, 1269–1295.
Green, S. (2003). The Effect of Chlorophyll Concentration on Air-
borne Hyperspectral Reflectance, http://www.ucd.ie/~app-phys/stuart/
MODEL.HTM.
Hill, D. R. A., & Rowan, K. S. (1989). The biliproteins of the Cryptophy-
ceae. Phycologia, 28, 455–463.
Lake Erie LaMP (2002). In J. Letterhos, & J. Vincent (Eds.), The Lake Erie
lakewide management plan. Environment Canada, Ontario Region and
U.S. Environmental Protection Agency, Region 5, Chicago, Ill, avail-
able at: http://www.epa.gov/glnpo/lakeerie/2002update/.
MacColl, R., & Guard-Friae, D. (1987). Phycobiliproteins. Boca Raton,
FL: CRC Press.
Makarewicz, J. C. (1993). Phytoplankton biomass and species compo-
sition in Lake Erie, 1970 to 1987. Journal of Great Lakes Research,
19, 258–274.
Millie, D. F., Baker, M. C., Tucker, C. S., Vinyard, B. T., & Dionigi, C. P.
(1992). High-resolution airborne remote sensing of bloom-forming phy-
toplankton. Journal of Phycology, 28, 281–290.
Richardson, L. L. (1996). Remote sensing of algal bloom dynamics. Bio-
Science, 44, 492–501.
Richardson, L. L., Bachoon, D., Ingram-Willey, V., Chee, C. C., Chow, C.,
& Weinstock, K. (1991). Remote sensing of the biological dynamics of
large-scale salt evaporation ponds. Proceedings of the International
Symposium on Remote Sensing of Environment; 27–31 May; Rio de
Janeiro, Brazil (pp. 611–623).
Smith, R. C., & Baker, K. S. (1982). Oceanic chlorophyll concentrations as
determined by satellite (Nimbus-7 Coastal Zone Color Scanner). Ma-
rine Biology, 66, 269–279.
Subramaniam, A., Brown, C. W., Hood, R. R., Carpenter, E. J., &
Capone, D. G. (2001). Detecting Trichodesmium blooms in SeaWiFS
imagery. Deep-Sea Research. Part 2. Topical Studies in Oceanogra-
phy, 49(1–3), 107–121.
Taylor, R. (1997). That bloomin’ Microcystis: Where’d it come from?
Where’d it go? Twine Line, 19, 1.
Toledo Blade (2002). Toxic algae thrive in summer’s heat, article ID:
0209170185, Published on September 17, 2002. Toledo, OH: The
Toledo Blade Co.
Vanderploeg, H. A., Liebig, J. R., Carmichael, W. W., Agy, M. A., Johen-
gen, T. H., Fahnenstiel, G. L., & Nalepa, T. F. (2001). Zebra mussel
(Dreissena polymorpha) selective filtration promoted toxic Microcystis
blooms in Saginaw Bay (Lake Huron) and Lake Erie. Canadian Journal
of Fisheries and Aquatic Sciences, 58, 1208–1221.
Vincent, R. K. (1997). Fundamentals of geological and environmental
remote sensing ( pp. 102–108). Upper Saddle River, NJ: Prentice-
Hall.
Vincent, R. K. (2000). Forecasts of monthly averaged daily temperature
highs in Bowling Green, Ohio from monthly sea surface temperature
anomalies in the Eastern Pacific ocean during the previous year. Photo-
grammetric Engineering and Remote Sensing, 66(8), 1001–1009.
Watras, C. J., & Baker, A. L. (1988). Detection of planktonic cyanobacteria
by tandem in vivo fluorometry. Hydrobiologia, 169, 77–84.
Welschmeyer, N. A. (1994). Fluorometric analysis of chlorophyll a in the
presence of chlorophyll b and pheopigments. Limnology and Ocean-
ography, 41, 1425–1437.