Embed Size (px)
Citation preview
PHY102M
Henry Schreiner
The University of Texas at Austin
Using spreadsheets forlab work
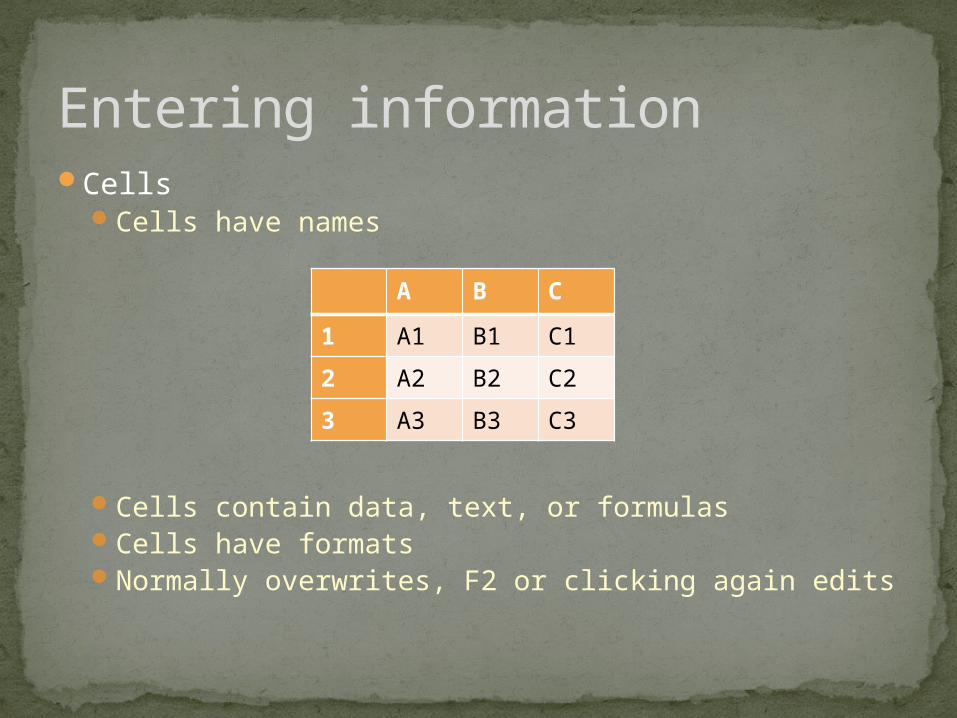
CellsCells have names
Cells contain data, text, or formulasCells have formatsNormally overwrites, F2 or clicking again edits
Entering information
A B C
1 A1 B1 C1
2 A2 B2 C2
3 A3 B3 C3
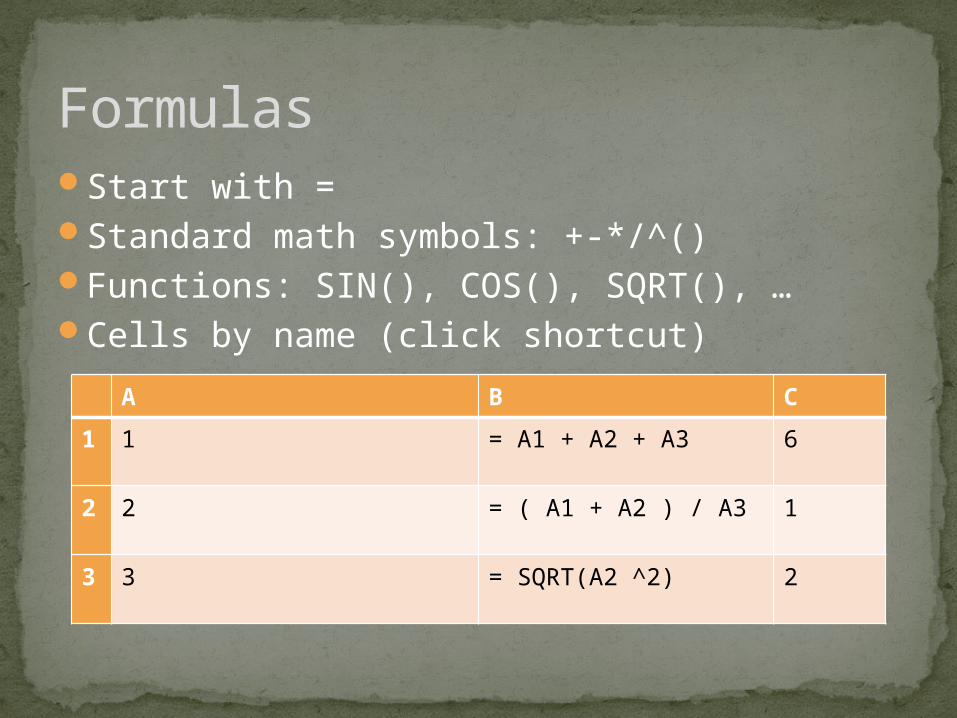
Start with =Standard math symbols: +-*/^()Functions: SIN(), COS(), SQRT(), …Cells by name (click shortcut)
Formulas
A B C
1 1 = A1 + A2 + A3 6
2 2 = ( A1 + A2 ) / A3 1
3 3 = SQRT(A2 ^2) 2
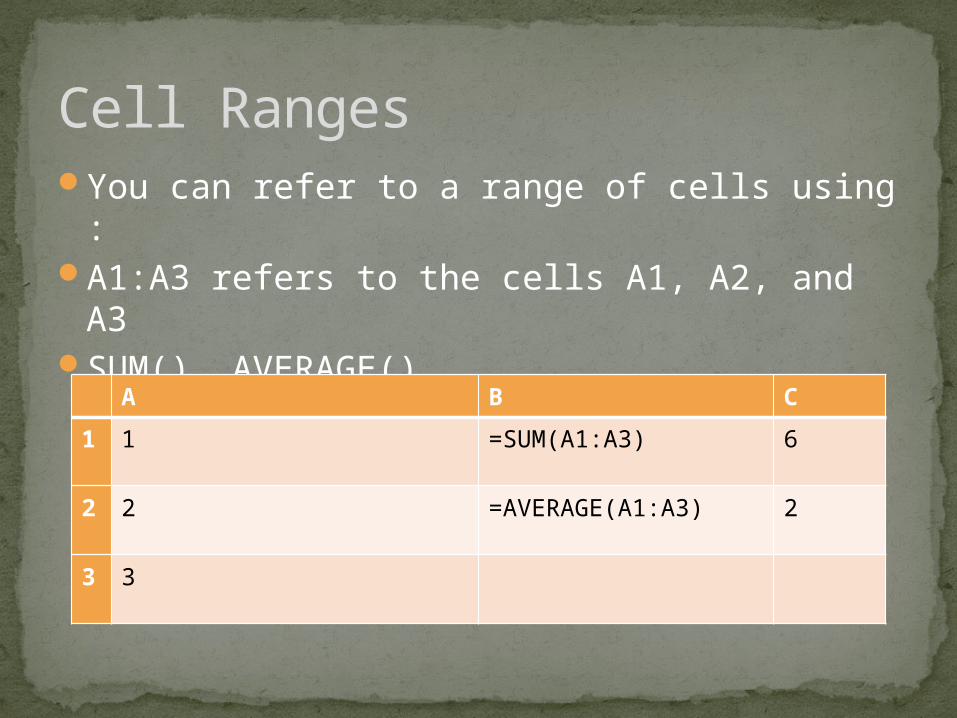
You can refer to a range of cells using :A1:A3 refers to the cells A1, A2, and A3SUM(), AVERAGE(), …
Cell Ranges
A B C
1 1 =SUM(A1:A3) 6
2 2 =AVERAGE(A1:A3) 2
3 3
Normal copy/paste copies formulasMore options available
NumbersFormatsLinked cells
Copy and paste
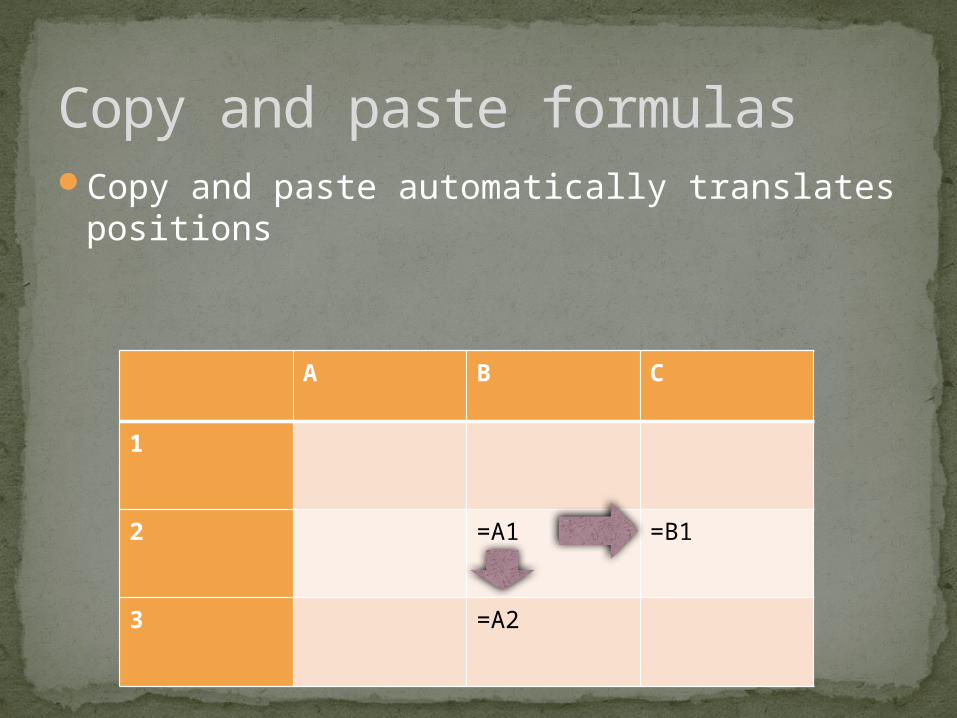
Copy and paste automatically translates positions
Copy and paste formulas
A B C
1
2 =A1 =B1
3 =A2
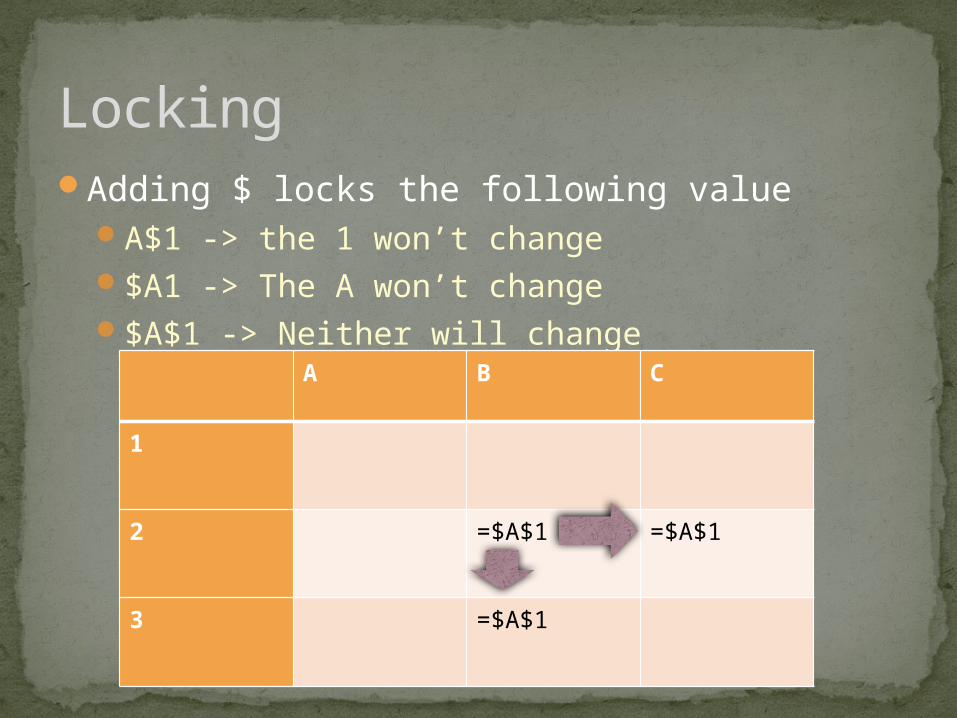
Adding $ locks the following valueA$1 -> the 1 won’t change$A1 -> The A won’t change$A$1 -> Neither will change
Locking
A B C
1
2 =$A$1 =$A$1
3 =$A$1
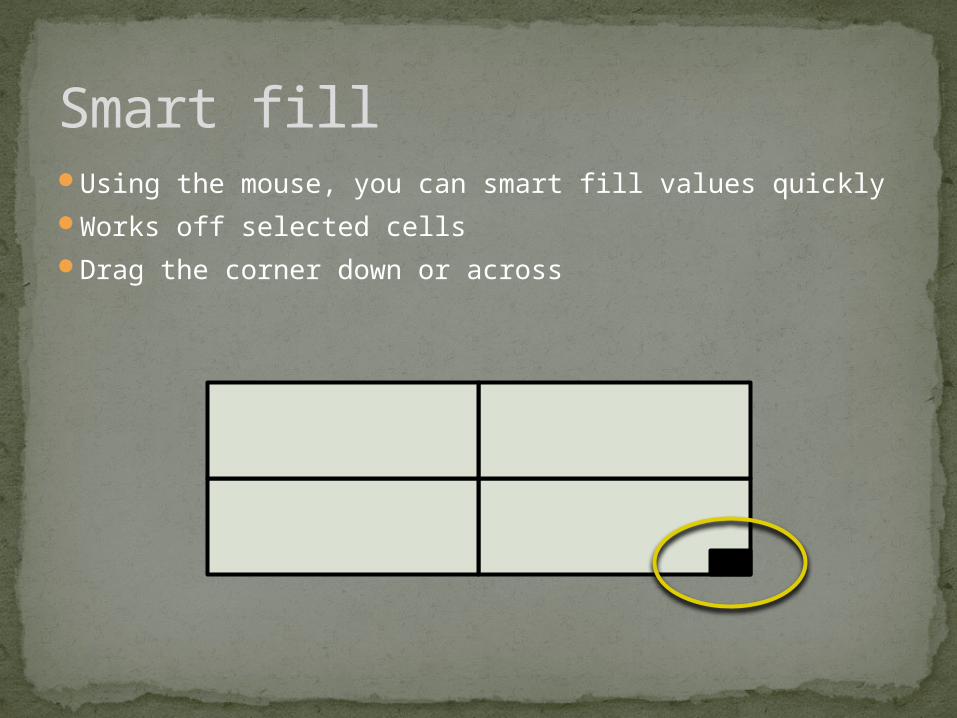
Using the mouse, you can smart fill values quicklyWorks off selected cellsDrag the corner down or across
Smart fill
Using the mouse, you can smart fill values quickly
Works off selected cellsDrag the corner down or across
Formulas -> Like copy/pasteNumbers/Text -> Tries to guess the series
Smart fill
PI()SIN(x), COS(x), TAN(x)ASIN(x), ACOS(x), ATAN(x)SQRT(x)RADIANS(x), DEGREES(x)SUM(x), AVERAGE(X)CONVERT(x, “from”, “to”)SLOPE(y,x), INTERCEPT(y,x)
Handy formulas
Select a rangeInsert graphChoose typeFormat optionsLabelsTrend line and optionMove to separate sheet
Graphing
Changing typeChanging data sourceMultiple data sources on one graph
Advanced graphing
Page rangesScale to fitUse sheets if you can!Different views available
Printing
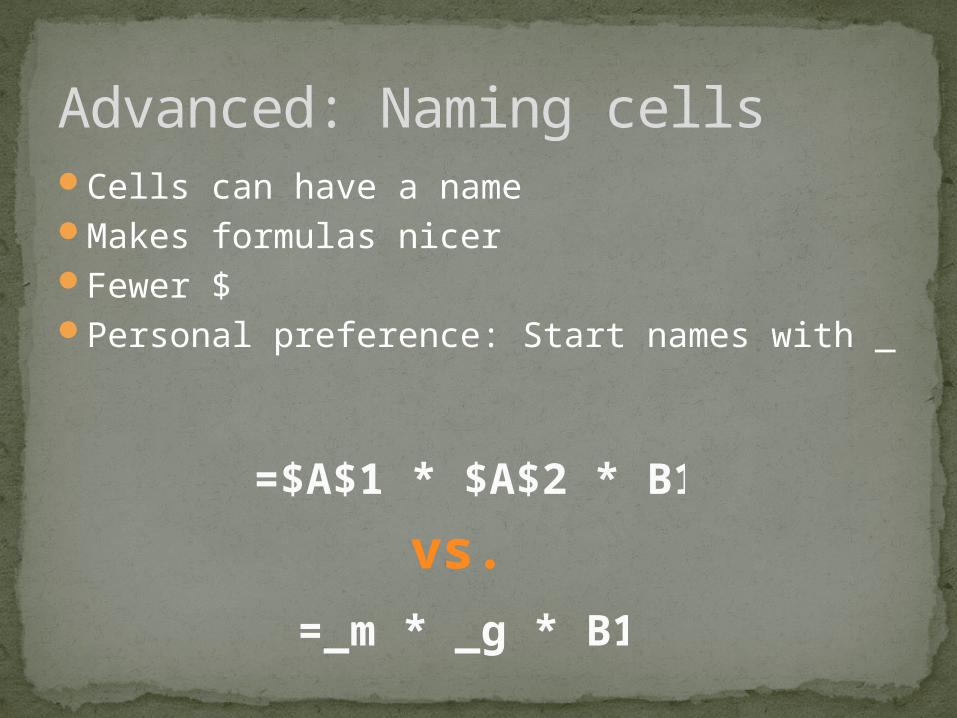
Cells can have a nameMakes formulas nicerFewer $Personal preference: Start names with _
Advanced: Naming cells
=$A$1 * $A$2 * B1
=_m * _g * B1
vs.
Use control to select ranges that don’t touchUseful for graphingAlso works in some other programs
Advanced: Unconnected selection
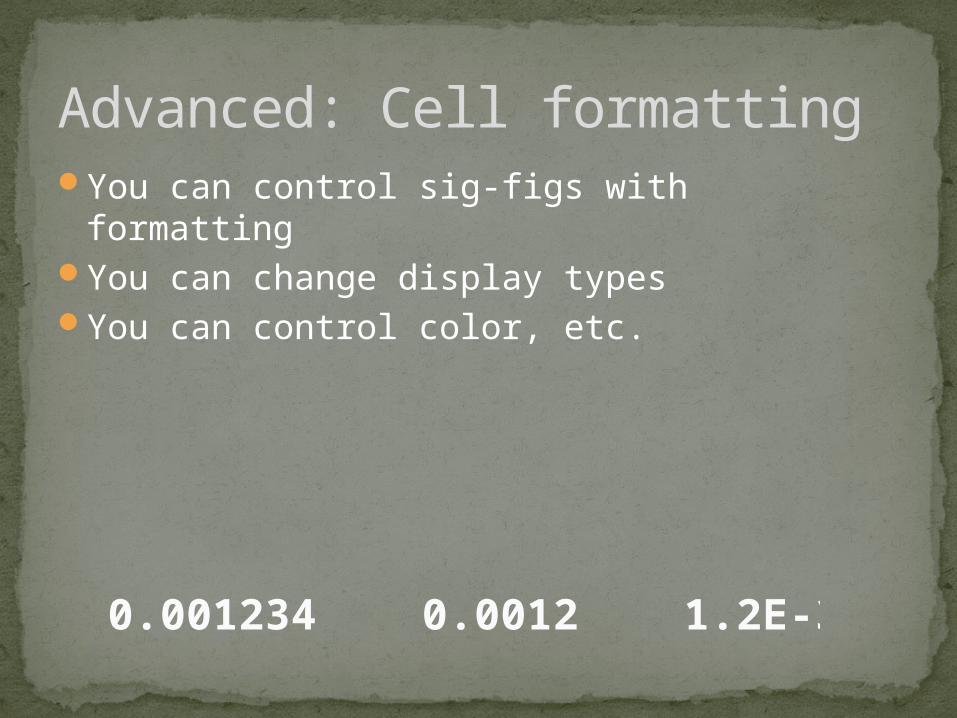
You can control sig-figs with formattingYou can change display typesYou can control color, etc.
Advanced: Cell formatting
0.001234 0.0012 1.2E-3
Super/subscriptsGreek lettersSpecial symbolsForce text with ‘
Advanced: Special text
Tables allow simple manipulation of tabular data
Auto-fills, auto-updates for formulasNicer range names (?)Easy sorting
Advanced: Tables (Excel)
List of functionsCan move cells by draggingCan show formulasCan show dependents
Sort: not (usually) a formula
Advanced: Formula helpers
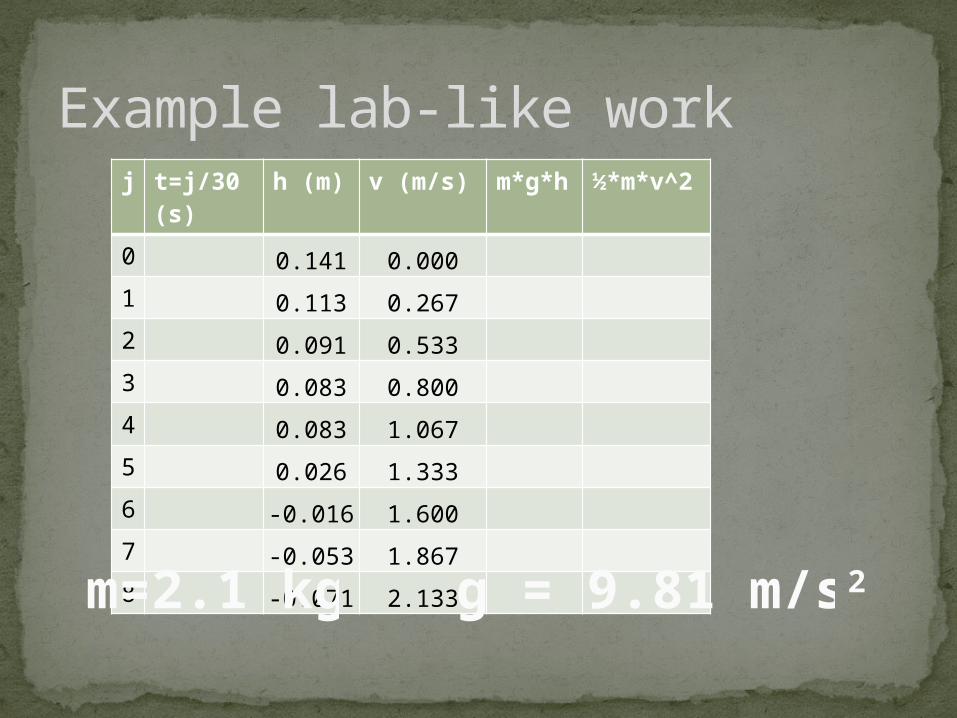
j t=j/30 (s)
h (m) v (m/s) m*g*h
½*m*v^2
0 0.141 0.0001 0.113 0.2672 0.091 0.5333 0.083 0.8004 0.083 1.0675 0.026 1.3336 -0.016 1.6007 -0.053 1.8678 -0.071 2.133
Example lab-like work
m=2.1 kg g = 9.81 m/s2
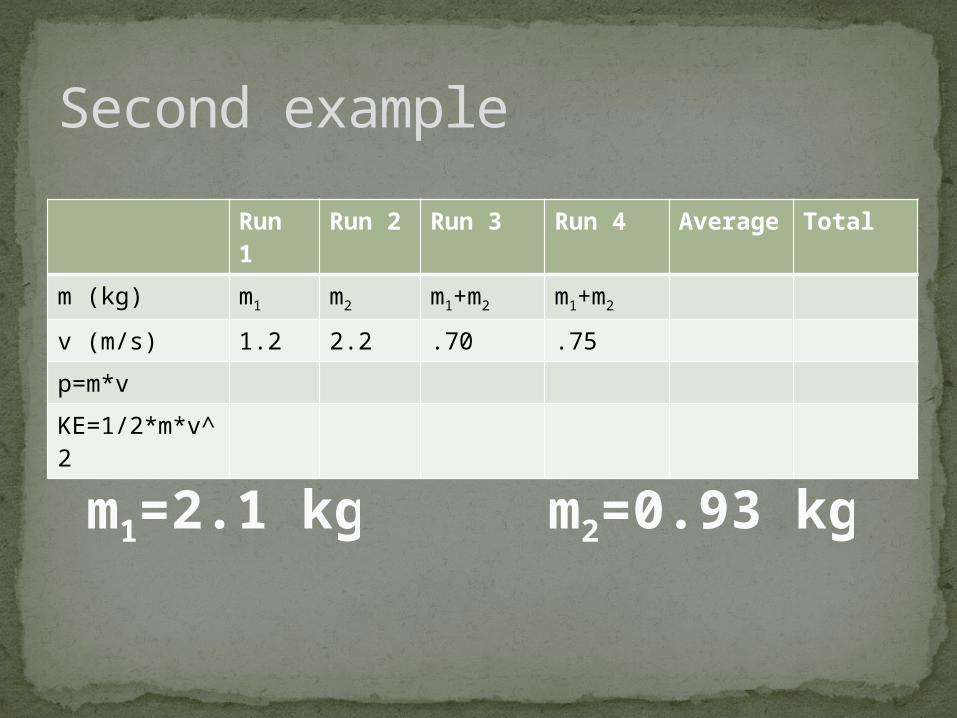
Run 1
Run 2 Run 3 Run 4 Average
Total
m (kg) m1 m2 m1+m2 m1+m2
v (m/s) 1.2 2.2 .70 .75
p=m*v
KE=1/2*m*v^2
Second example
m1=2.1 kg m2=0.93 kg
Appendix A in lab manualSpecific tutorials on 102M website
Look for help onlineLook for YouTube videos
Ask
More help