Embed Size (px)
Citation preview
Photovoltaic Power Systems
For Rural ITS
Mark Aragon Traffic Operations
ITS Design
Jon Dickinson Traffic Operations
ITS Project Management
1
Photovoltaic Systems for Rural ITS
Presentation Topics
1. Introduction and Background
2. System Overview
3. Design Methods and Calculations
4. System Lifecycle costs
5. Potential Pitfalls and Lessons Learned
2
Photovoltaic systems benefit the state by allowing deployment of ITS systems at critical rural locations where commercial power sources are either unavailable or cost prohibitive.
Existing systems are typically low power (less than 20 watts), however, increased efficiency and reduced costs are increasing the power threshold.
Increased options and improved technology in photovoltaic (PV) system components allow for more diversity in design. This allows for a more streamline design to meet the specific needs of the application thereby increasing efficiency and reducing costs.
Introduction and Background
3
PV Systems Background
• The first systems were used for solar flashers with low power requirements (<10 watts).
• Systems were pre-packaged and self-contained.
• Contractor designed and selected in accordance with performance specifications and loading requirements.
• Contractor has no long term ownership or accountability in the system. This may lead to increased risk of system failure and increased maintenance costs.
• Newer systems and components have greater capability and complexity.
• This has created a need for development of component level design standards and specifications for PV systems.
4
Current NDOT PV Inventory
• Flashing Warning Signs: 32 • Road Weather Information System (RWIS): 29 • Highway Advisory Radio (HAR): 1
Solar power is used extensively throughout the state of Nevada for deployment of Flashing Warning Signs, Road Weather Information Systems (RWIS) and Highway Advisory Radio (HAR). Nevada's arid climate and average high elevation provide an ideal environment for photovoltaic power systems.
Current Rural PV Systems in Nevada
5
Solar Power Advantages
• Flexibility: Self contained systems allow ITS devices to be placed in optimal locations without the constraints of distance or right-of-way
• Autonomy: no need for 3rd party agreements (easements, line extension agreements, etc.)
• Reliability: The sun is a reliable energy source not subject to surges and blackouts
• Low maintenance: newer systems are more reliable and require less preventative maintenance.
• Green: Once installed, the system has minimal environmental impact.
6
Solar Power Disadvantages
•Higher initial capital cost.
•Lifecycle cost is usually greater than metered service.
•Cost per kilowatt hour exceeds commercial energy cost.
•Reliability is subject to local weather conditions.
•Periodic replacement of components (batteries,
controllers, etc.).
•Theft and vandalism.
7
A Brief History of Photovoltaics
• 1953: First working silicon PV cell developed at Bell Labs 4%
efficiency.
• 1958: First used in space satellites in 1958. Commercial applications
were too costly at this time (around $300 per watt).
• 1960: Efficiency of 14% achieved.
• 1970: Cost is down to $20 per watt allowing use several terrestrial
applications (mostly public works).
• 1980: Solar power plants appear with worldwide production
exceeding 21.3 MW. Residential installations are becoming more
common.
• 2000: Worldwide solar productions exceeds 1000 MW. Solar power
systems are readily available for commercial and residential
applications.
8
Photovoltaics in the New Millennium
•Since the year 2000, PV use has increased exponentially, while costs continue to decline. •Global demand for PV technology is predicted to increase by 75 GW in the next 5 years. As of 2009: •Worldwide annual PV production has gone from 3.7 GW in 2007 to 10.7 GW in 2009, about 70% increase per year. •Cumulative PV capacity in the United States surpassed 1 GW. •PV cost as low as $2.50 per watt.
9
Types of Photovoltaic Systems
1. Grid tied system: PV provides primary power with any unused power returned to the power grid. Grid power is used when demand exceeds solar output. Battery backup is optional with this type of system.
2. Grid fall-back system: PV is primary source of power with switch over to grid power when solar power source is unavailable (no sun or backup batteries are drained).
3. Hybrid System: PV is primary source of power with an alternative power source such as a generator, windmill, or hydropower system. This would be suitable for rural ITS applications where wind generated power could supplement the lack of PV power during periods of low insolation (incident solar radiation). NDOT has been looking into such a hybrid system for future installations (Mt. Rose Summit on SR 431).
4. Stand-alone system: PV is the sole source of power with backup batteries during periods of low solar insolation. This is the system type most commonly used for rural ITS applications in Nevada.
There are several more configurations possible, however, the focus of this presentation will be on the stand-alone system since it is the best suited for rural ITS, where commercial power is unavailable.
10
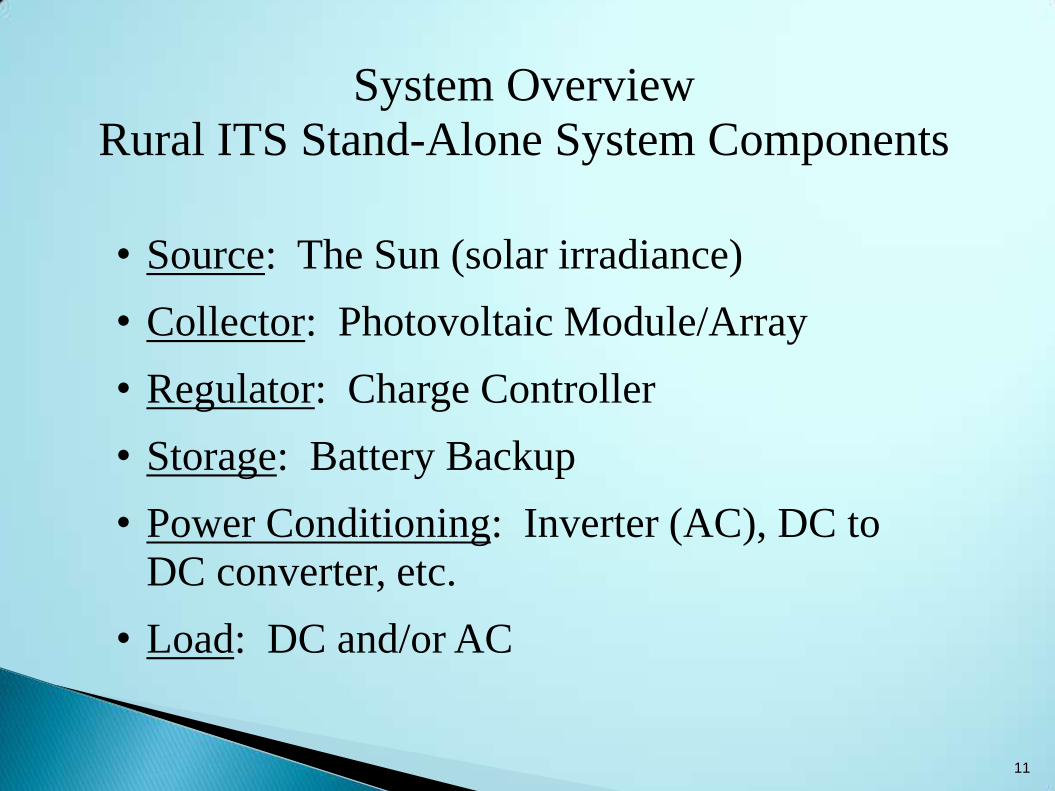
System Overview
Rural ITS Stand-Alone System Components
• Source: The Sun (solar irradiance)
• Collector: Photovoltaic Module/Array
• Regulator: Charge Controller
• Storage: Battery Backup
• Power Conditioning: Inverter (AC), DC to
DC converter, etc.
• Load: DC and/or AC
11
Photovoltaic Module/Array
Backup Batteries
Charge Controller
Inverter* (If AC power
required)
DC Load (Load Control)
AC Load
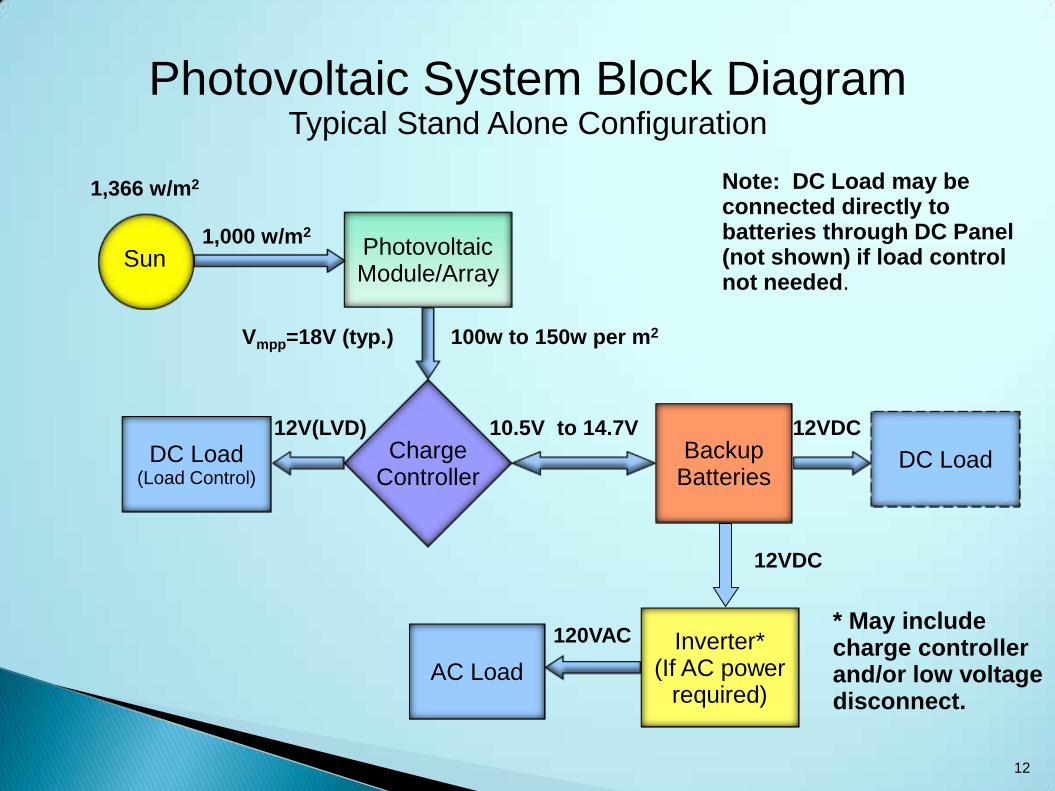
Photovoltaic System Block Diagram Typical Stand Alone Configuration
Vmpp=18V (typ.)
10.5V to 14.7V
12VDC
Note: DC Load may be connected directly to batteries through DC Panel (not shown) if load control not needed.
120VAC
1,366 w/m2
Sun
100w to 150w per m2
1,000 w/m2
12V(LVD)
DC Load
12VDC
12
* May include charge controller and/or low voltage disconnect.
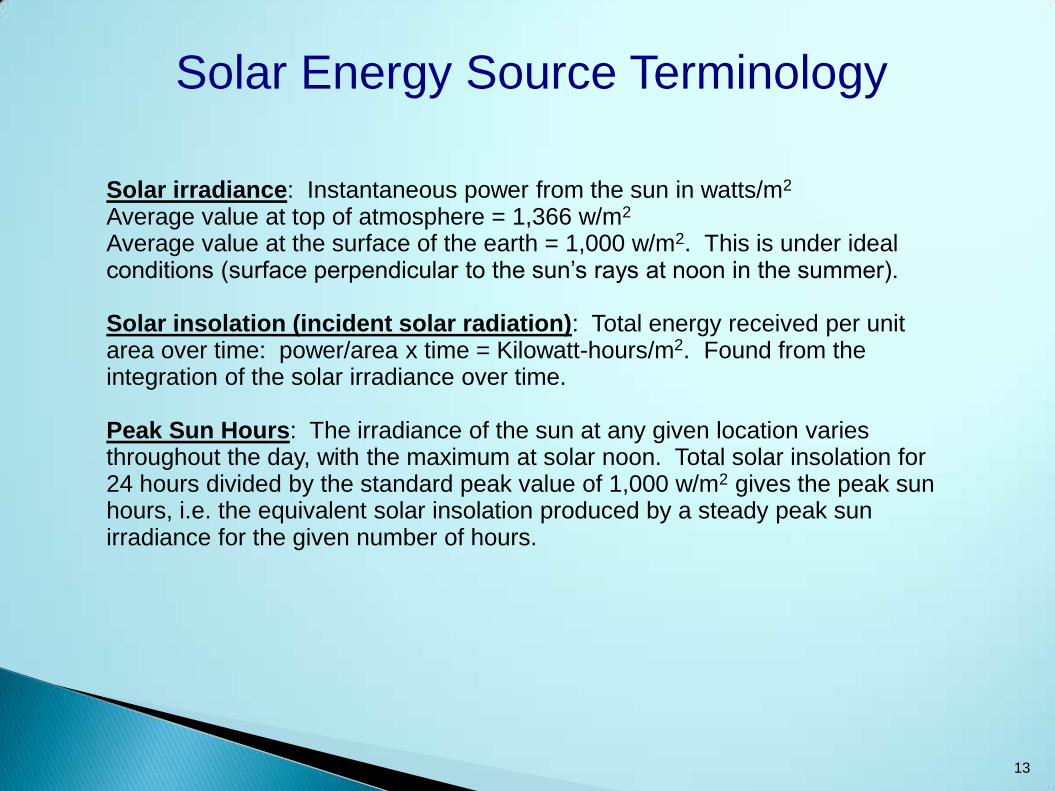
Solar irradiance: Instantaneous power from the sun in watts/m2
Average value at top of atmosphere = 1,366 w/m2
Average value at the surface of the earth = 1,000 w/m2. This is under ideal conditions (surface perpendicular to the sun’s rays at noon in the summer). Solar insolation (incident solar radiation): Total energy received per unit area over time: power/area x time = Kilowatt-hours/m2. Found from the integration of the solar irradiance over time. Peak Sun Hours: The irradiance of the sun at any given location varies throughout the day, with the maximum at solar noon. Total solar insolation for 24 hours divided by the standard peak value of 1,000 w/m2 gives the peak sun hours, i.e. the equivalent solar insolation produced by a steady peak sun irradiance for the given number of hours.
Solar Energy Source Terminology
13
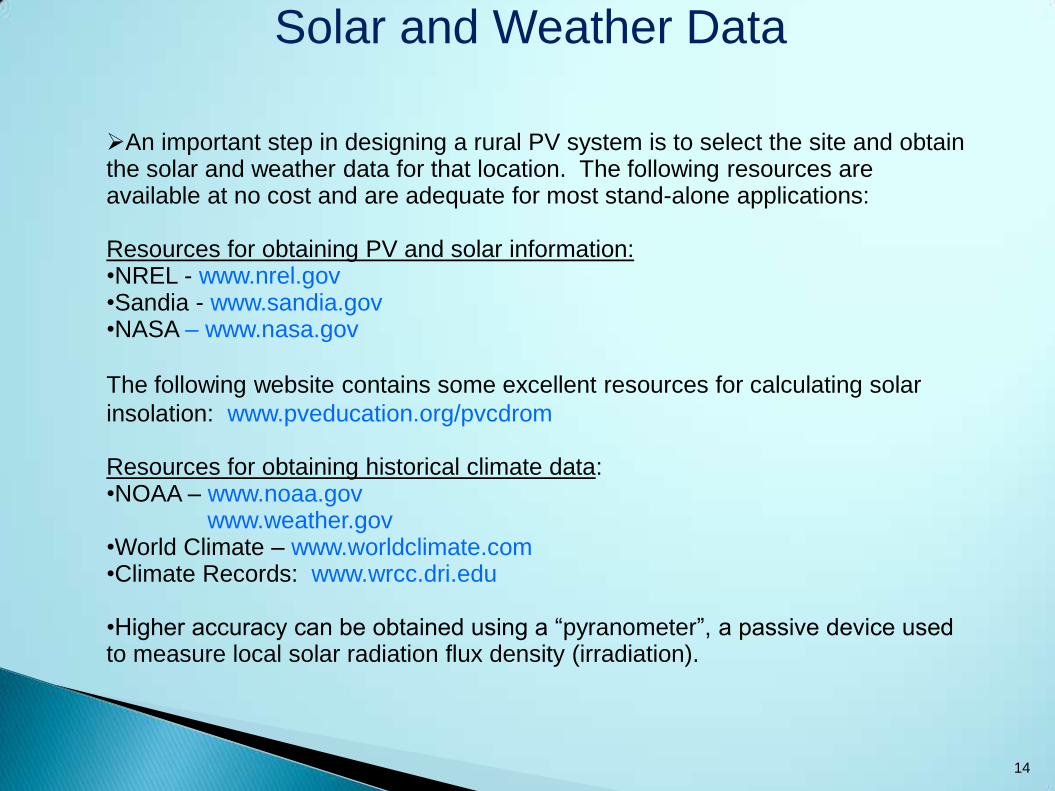
Solar and Weather Data
An important step in designing a rural PV system is to select the site and obtain the solar and weather data for that location. The following resources are available at no cost and are adequate for most stand-alone applications: Resources for obtaining PV and solar information: •NREL - www.nrel.gov •Sandia - www.sandia.gov •NASA – www.nasa.gov
The following website contains some excellent resources for calculating solar
insolation: www.pveducation.org/pvcdrom Resources for obtaining historical climate data: •NOAA – www.noaa.gov
www.weather.gov •World Climate – www.worldclimate.com •Climate Records: www.wrcc.dri.edu •Higher accuracy can be obtained using a “pyranometer”, a passive device used to measure local solar radiation flux density (irradiation).
14
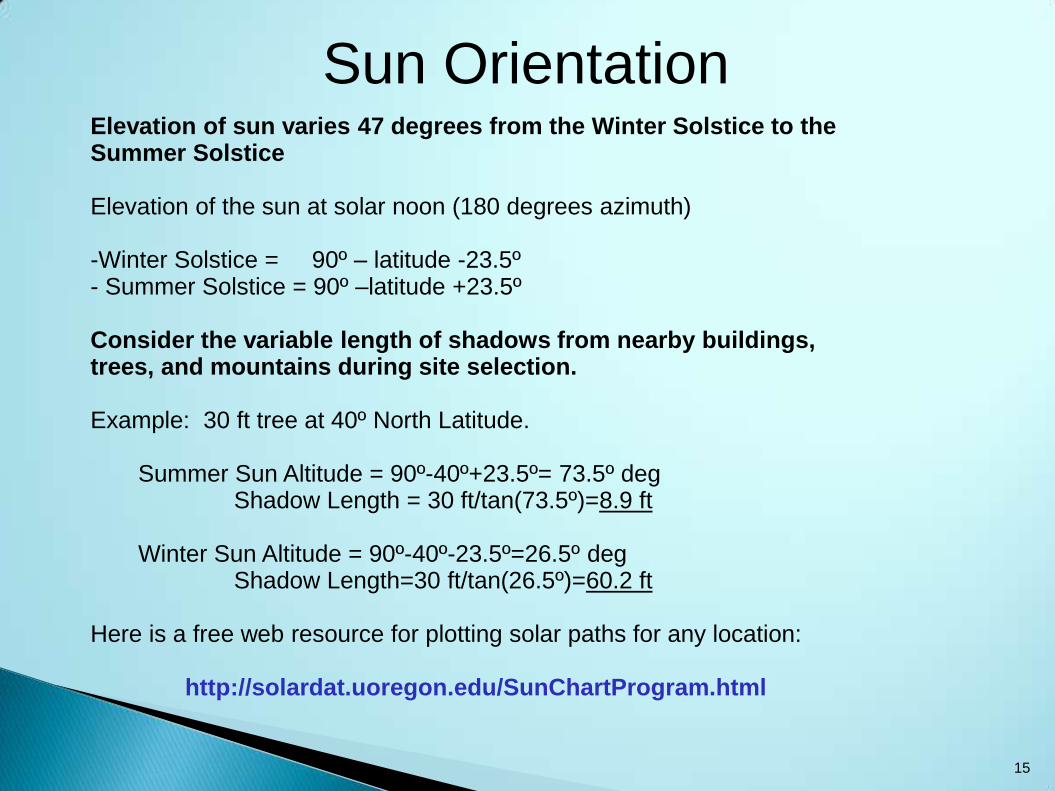
Sun Orientation Elevation of sun varies 47 degrees from the Winter Solstice to the Summer Solstice Elevation of the sun at solar noon (180 degrees azimuth) -Winter Solstice = 90º – latitude -23.5º - Summer Solstice = 90º –latitude +23.5º Consider the variable length of shadows from nearby buildings, trees, and mountains during site selection. Example: 30 ft tree at 40º North Latitude. Summer Sun Altitude = 90º-40º+23.5º= 73.5º deg Shadow Length = 30 ft/tan(73.5º)=8.9 ft Winter Sun Altitude = 90º-40º-23.5º=26.5º deg Shadow Length=30 ft/tan(26.5º)=60.2 ft Here is a free web resource for plotting solar paths for any location:
http://solardat.uoregon.edu/SunChartProgram.html
15
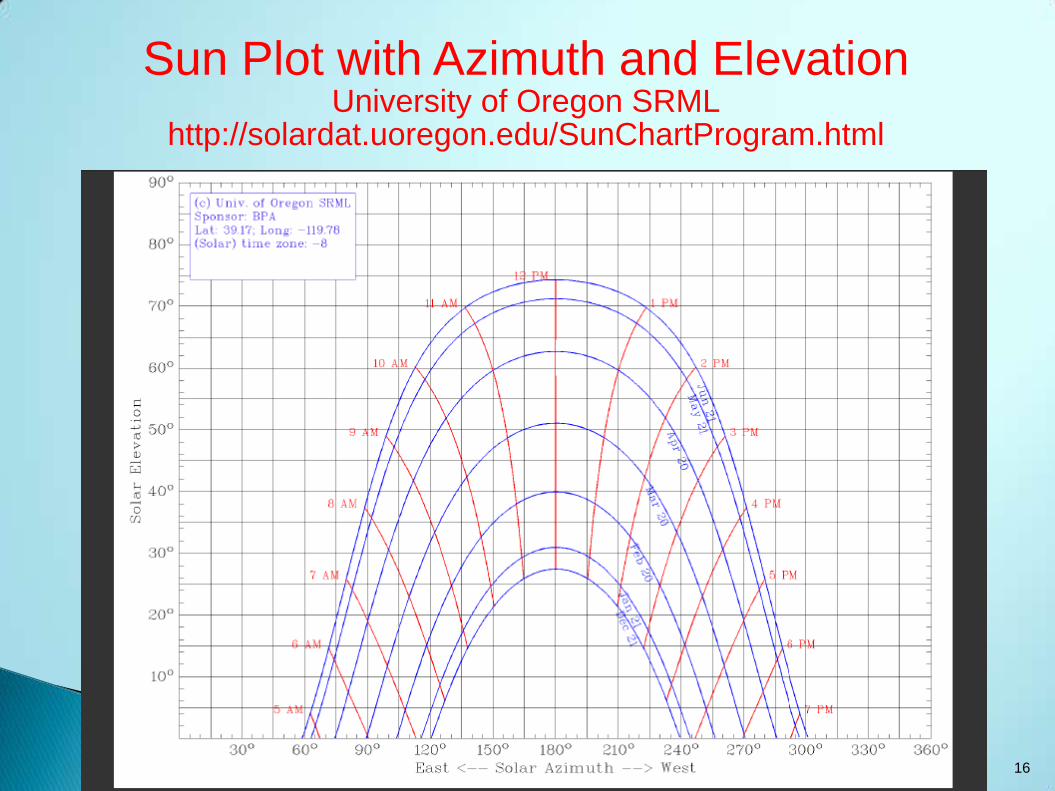
Sun Plot with Azimuth and Elevation University of Oregon SRML
http://solardat.uoregon.edu/SunChartProgram.html
16
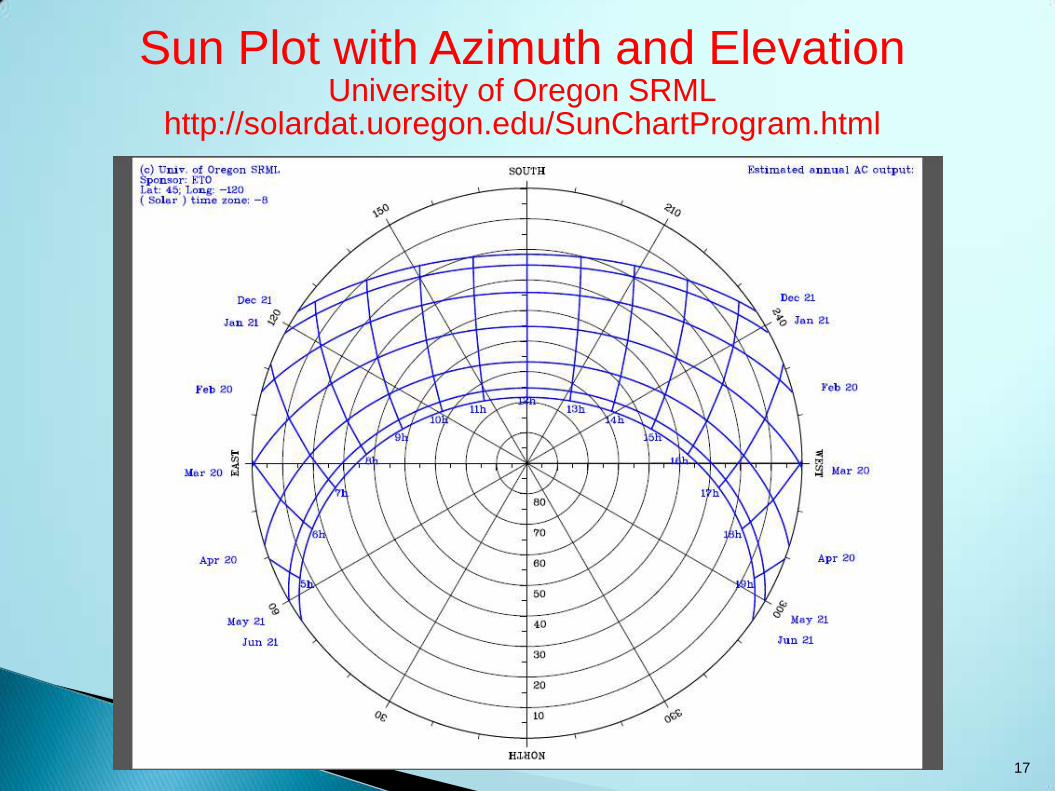
Sun Plot with Azimuth and Elevation University of Oregon SRML
http://solardat.uoregon.edu/SunChartProgram.html
17
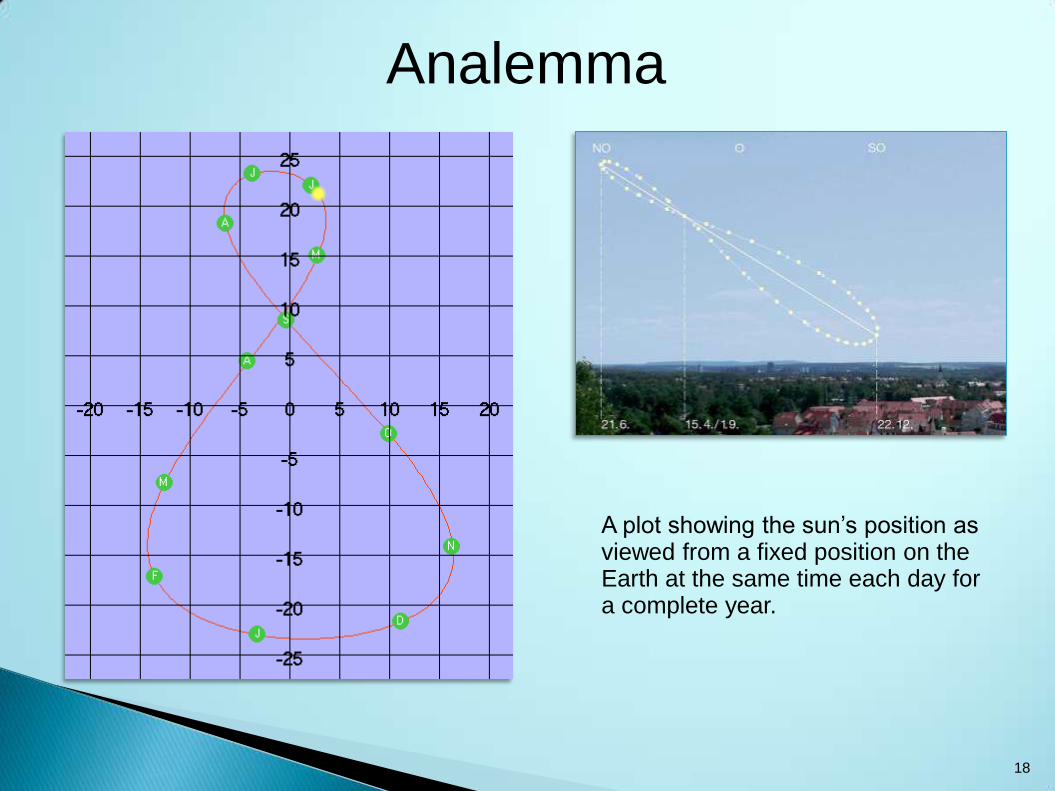
Analemma
18
A plot showing the sun’s position as viewed from a fixed position on the Earth at the same time each day for a complete year.
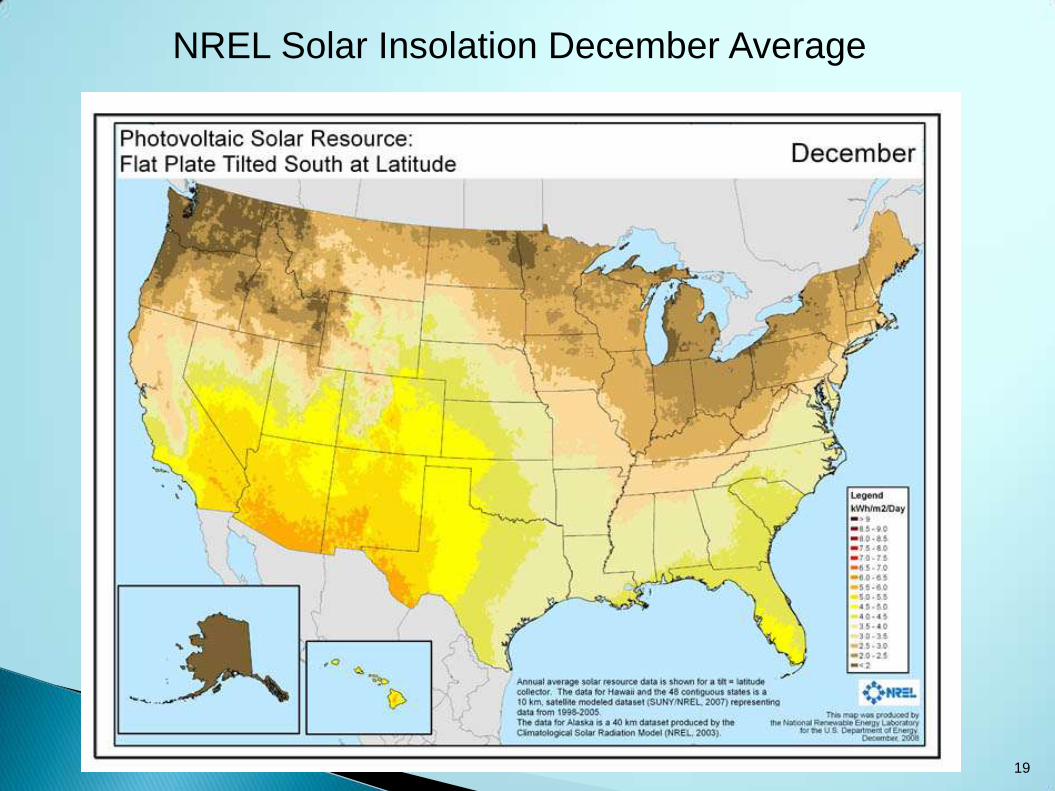
NREL Solar Insolation December Average
19
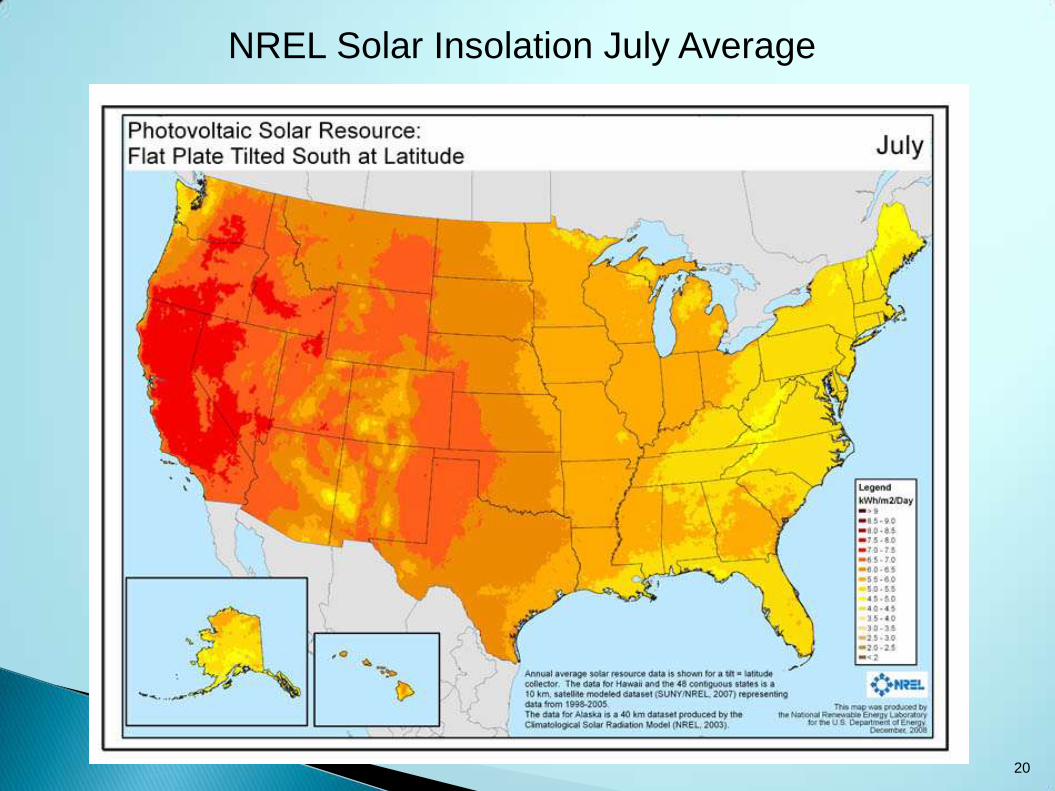
NREL Solar Insolation July Average
20
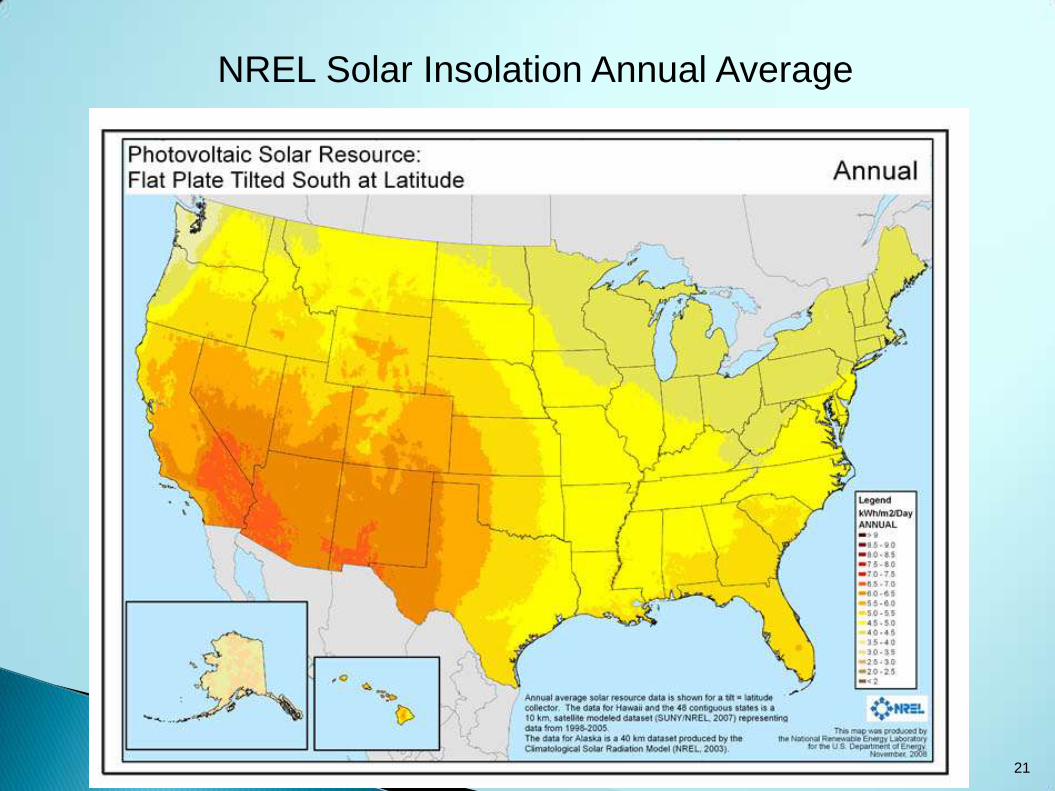
NREL Solar Insolation Annual Average
21
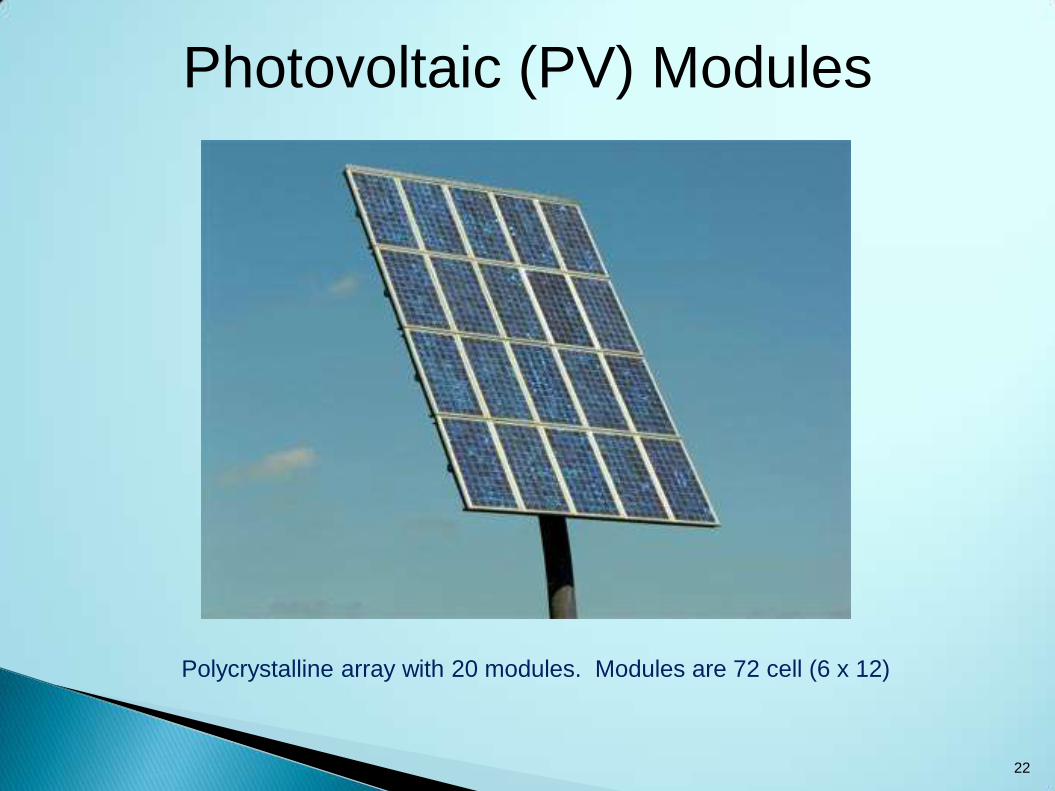
Photovoltaic (PV) Modules
Polycrystalline array with 20 modules. Modules are 72 cell (6 x 12)
22
Photovoltaic Cell
Description and theory of operation
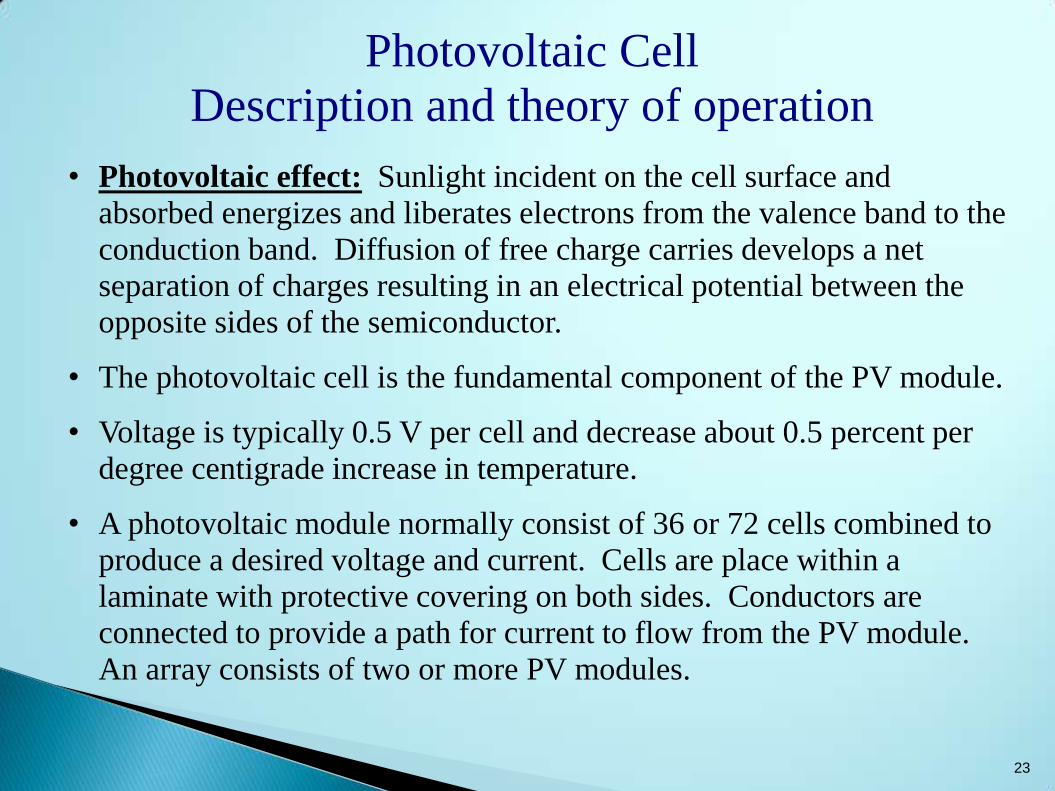
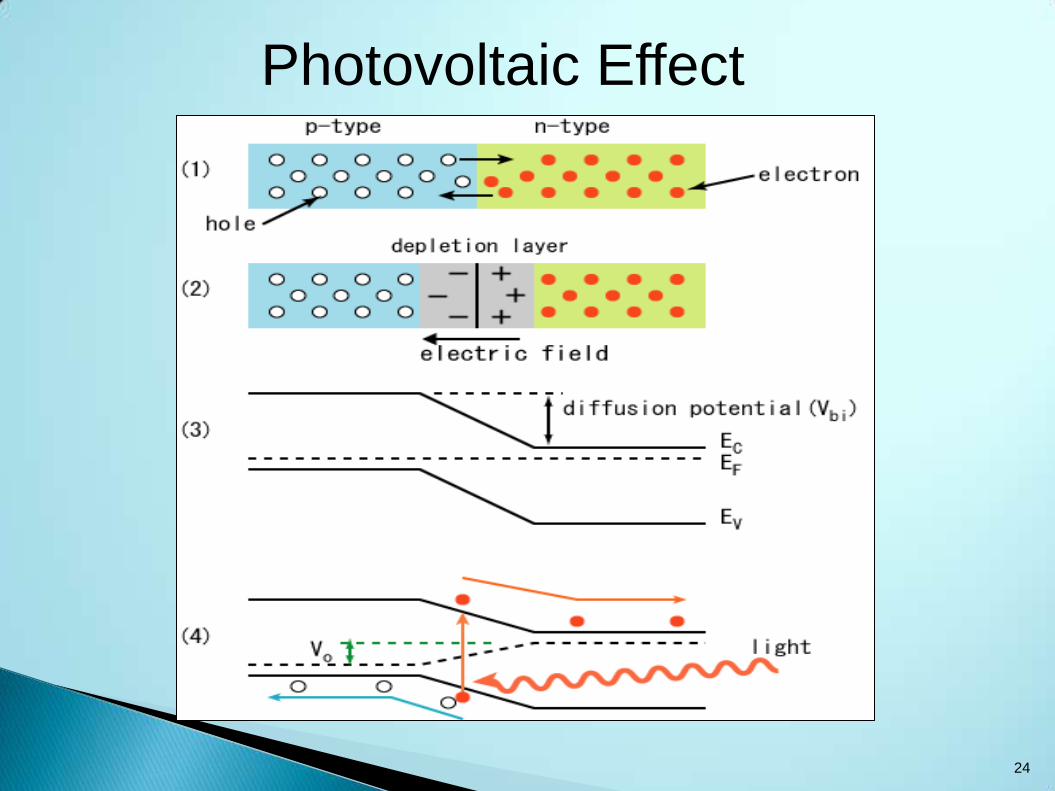
• Photovoltaic effect: Sunlight incident on the cell surface and
absorbed energizes and liberates electrons from the valence band to the
conduction band. Diffusion of free charge carries develops a net
separation of charges resulting in an electrical potential between the
opposite sides of the semiconductor.
• The photovoltaic cell is the fundamental component of the PV module.
• Voltage is typically 0.5 V per cell and decrease about 0.5 percent per
degree centigrade increase in temperature.
• A photovoltaic module normally consist of 36 or 72 cells combined to
produce a desired voltage and current. Cells are place within a
laminate with protective covering on both sides. Conductors are
connected to provide a path for current to flow from the PV module.
An array consists of two or more PV modules.
23
Photovoltaic Effect
24
Photovoltaic Cells
Three Types
1. Monocrystalline
2. Thin film
3. Polycrystalline
25
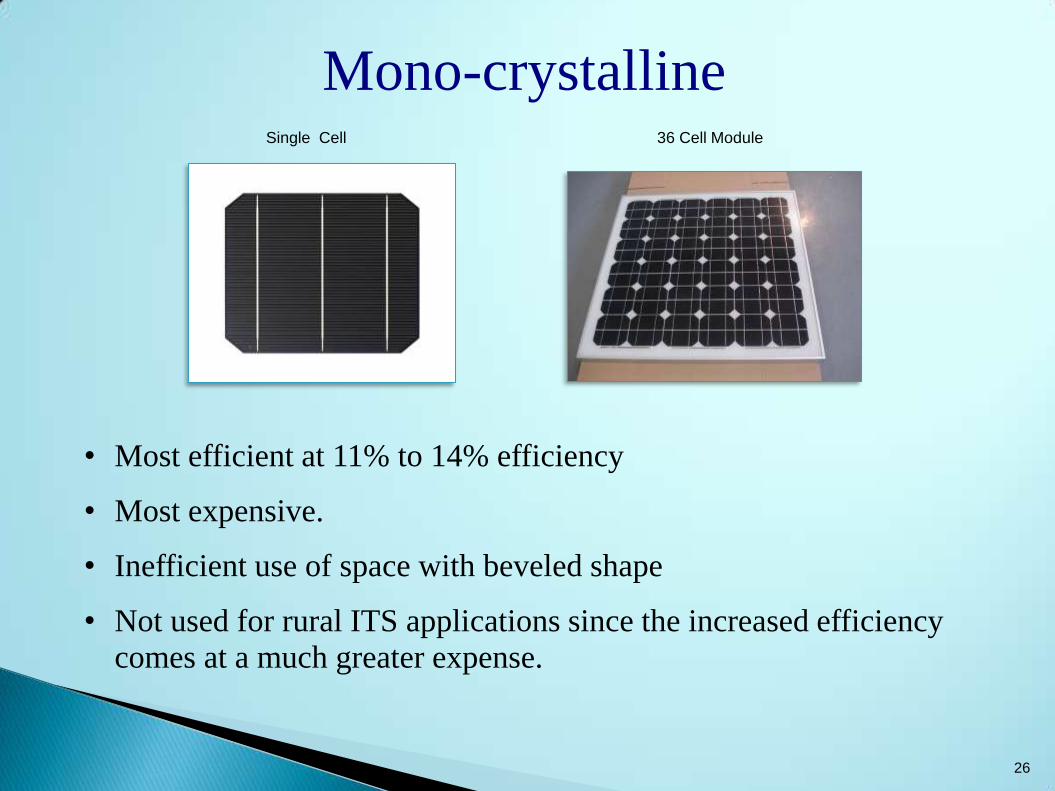
Mono-crystalline
• Most efficient at 11% to 14% efficiency
• Most expensive.
• Inefficient use of space with beveled shape
• Not used for rural ITS applications since the increased efficiency
comes at a much greater expense.
Single Cell 36 Cell Module
26
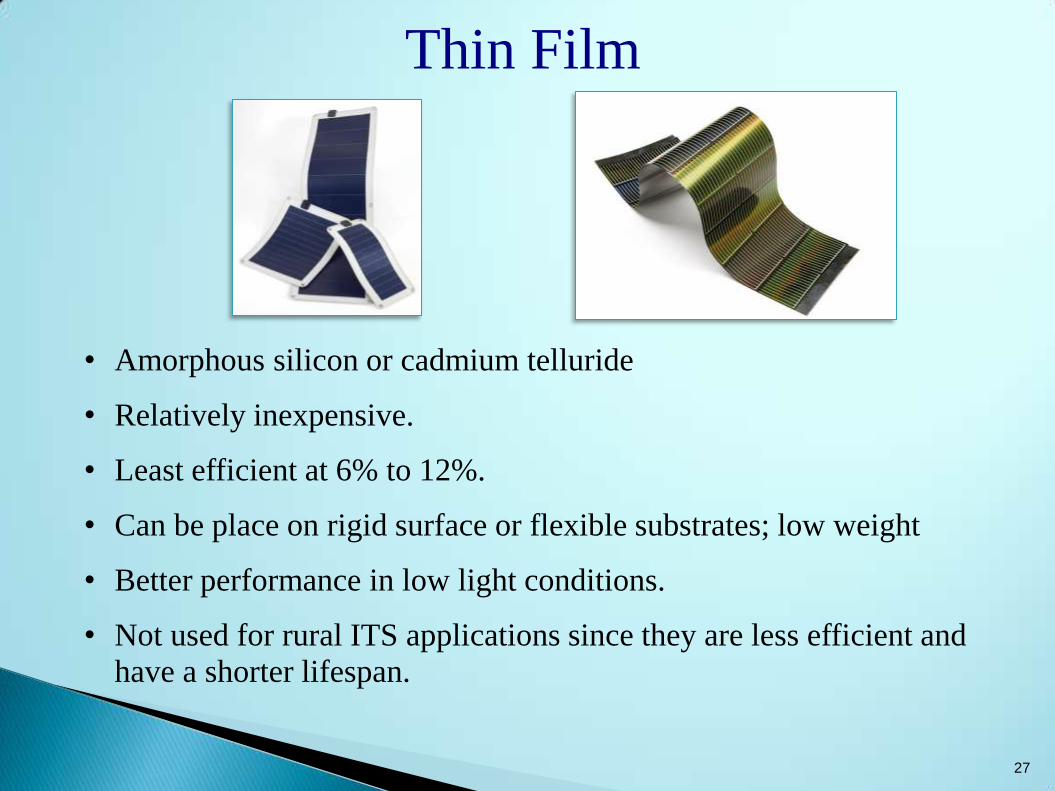
Thin Film
• Amorphous silicon or cadmium telluride
• Relatively inexpensive.
• Least efficient at 6% to 12%.
• Can be place on rigid surface or flexible substrates; low weight
• Better performance in low light conditions.
• Not used for rural ITS applications since they are less efficient and
have a shorter lifespan.
27
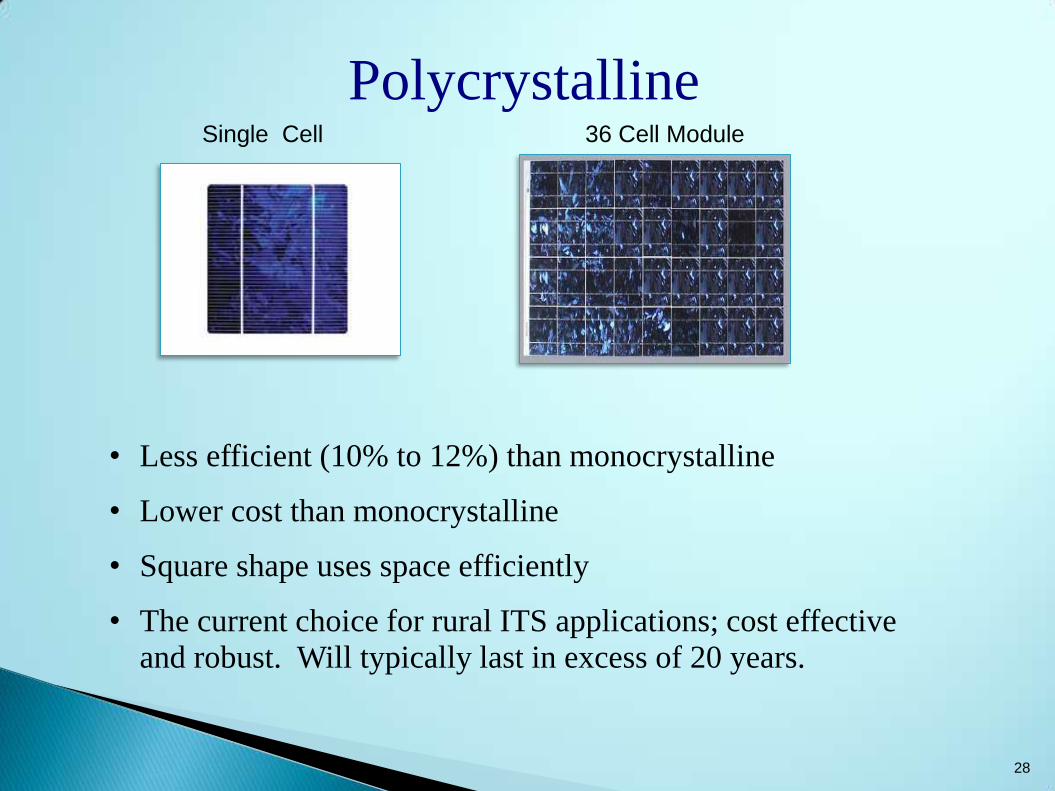
Polycrystalline
• Less efficient (10% to 12%) than monocrystalline
• Lower cost than monocrystalline
• Square shape uses space efficiently
• The current choice for rural ITS applications; cost effective
and robust. Will typically last in excess of 20 years.
Single Cell 36 Cell Module
28
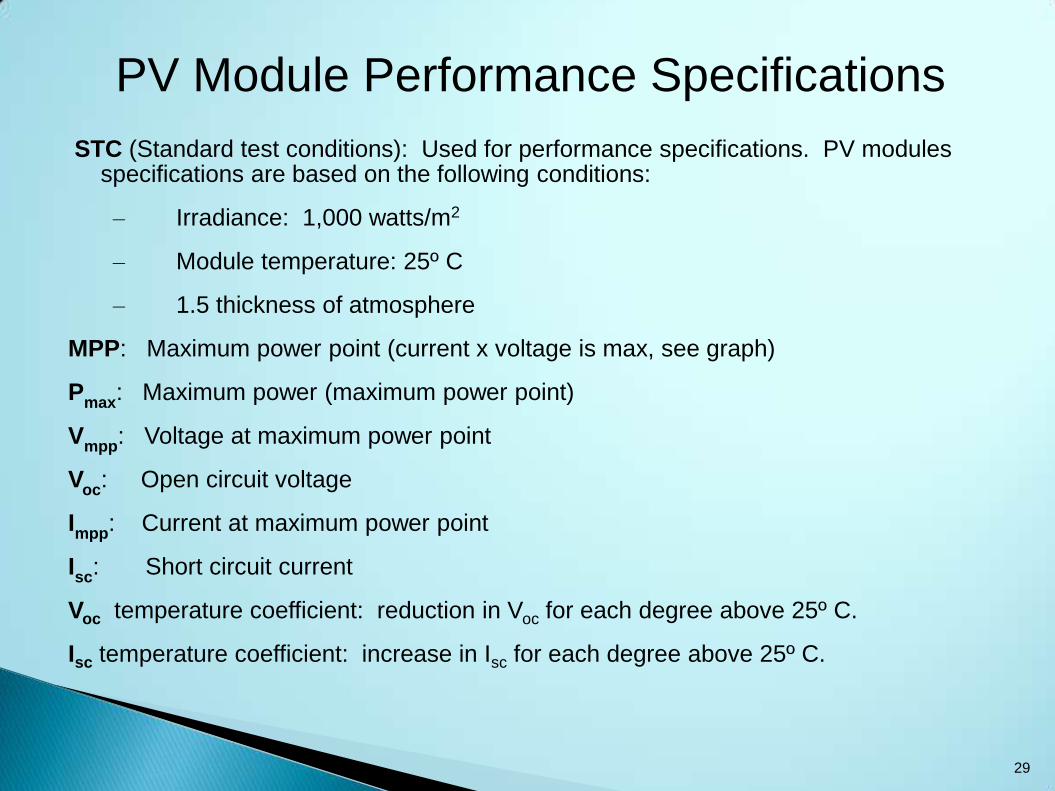
PV Module Performance Specifications
STC (Standard test conditions): Used for performance specifications. PV modules specifications are based on the following conditions:
– Irradiance: 1,000 watts/m2
– Module temperature: 25º C
– 1.5 thickness of atmosphere
MPP: Maximum power point (current x voltage is max, see graph)
Pmax
: Maximum power (maximum power point)
Vmpp
: Voltage at maximum power point
Voc
: Open circuit voltage
Impp
: Current at maximum power point
Isc
: Short circuit current
Voc temperature coefficient: reduction in Voc for each degree above 25º C.
Isc temperature coefficient: increase in Isc for each degree above 25º C.
29
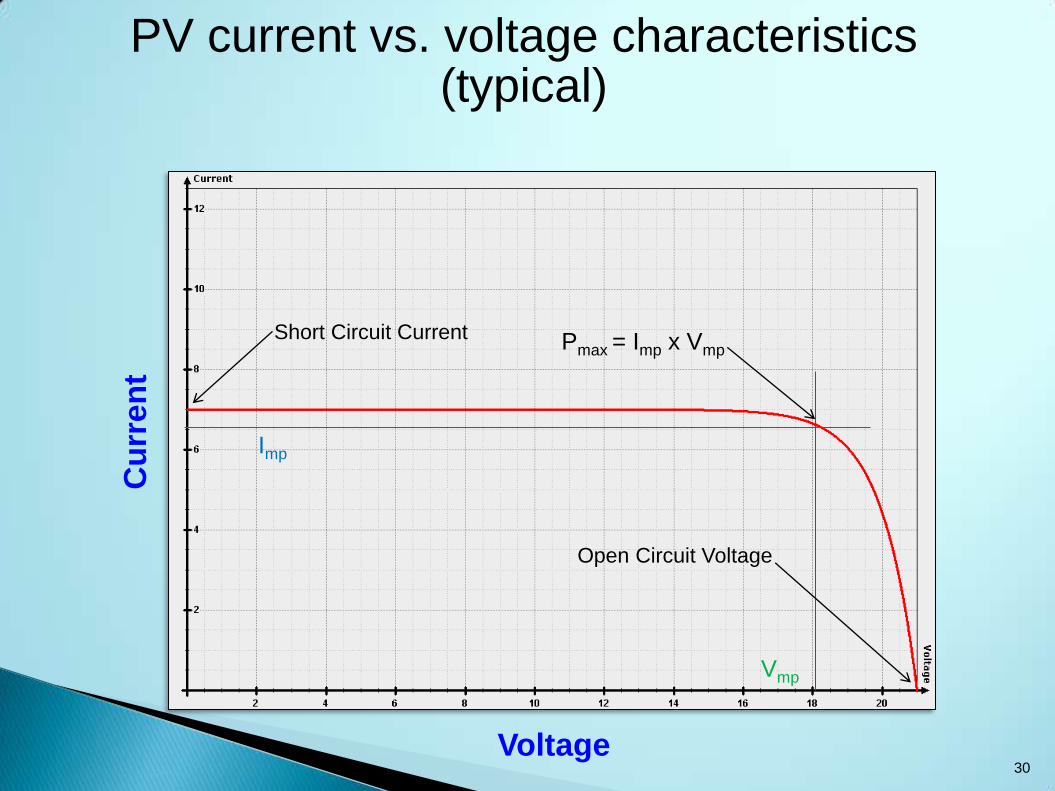
PV current vs. voltage characteristics (typical)
Cu
rren
t
Voltage
Pmax
= Imp
x Vmp
30
Short Circuit Current
Open Circuit Voltage
Imp
Vmp
Pmax = Imp x Vmp
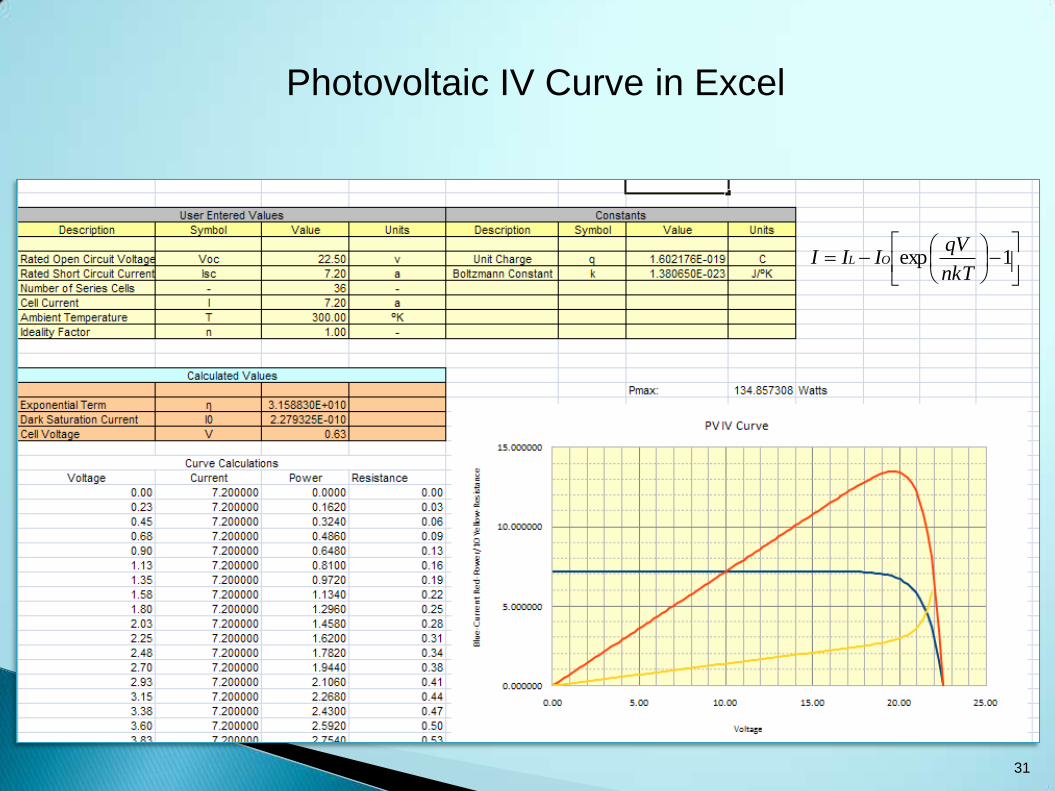
Photovoltaic IV Curve in Excel
Might add IV curve application in excel if time allows.
31
1exp
nkT
qVIII OL
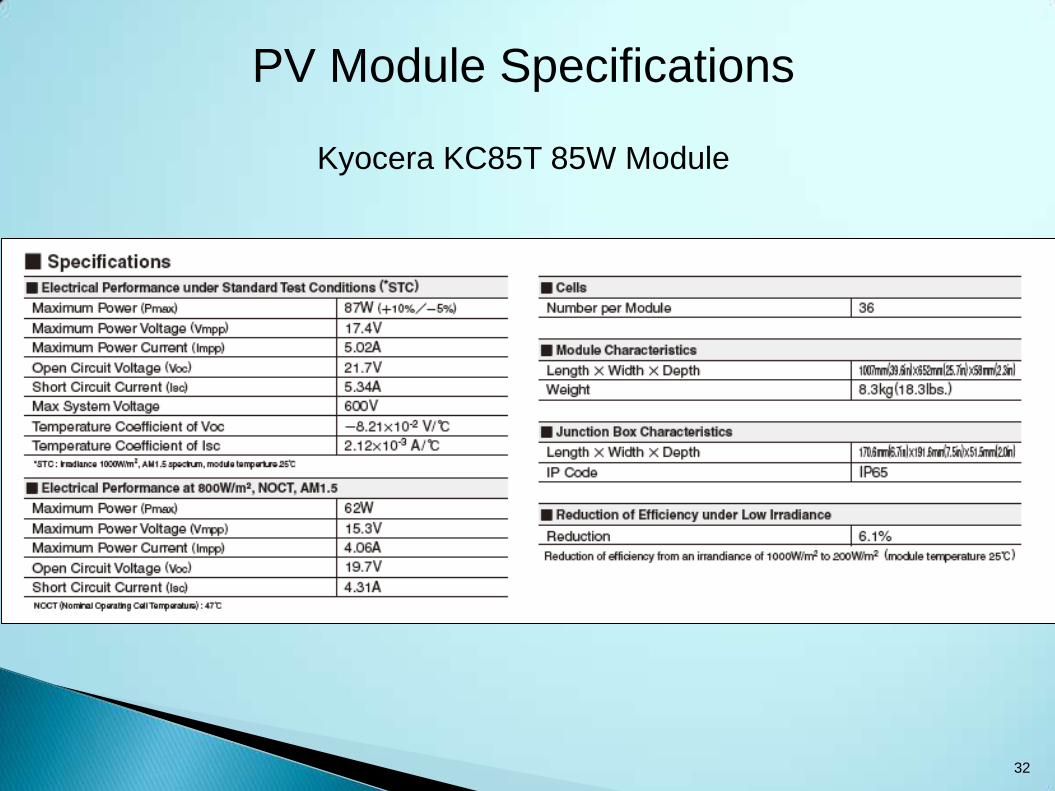
PV Module Specifications
Kyocera KC85T 85W Module
32
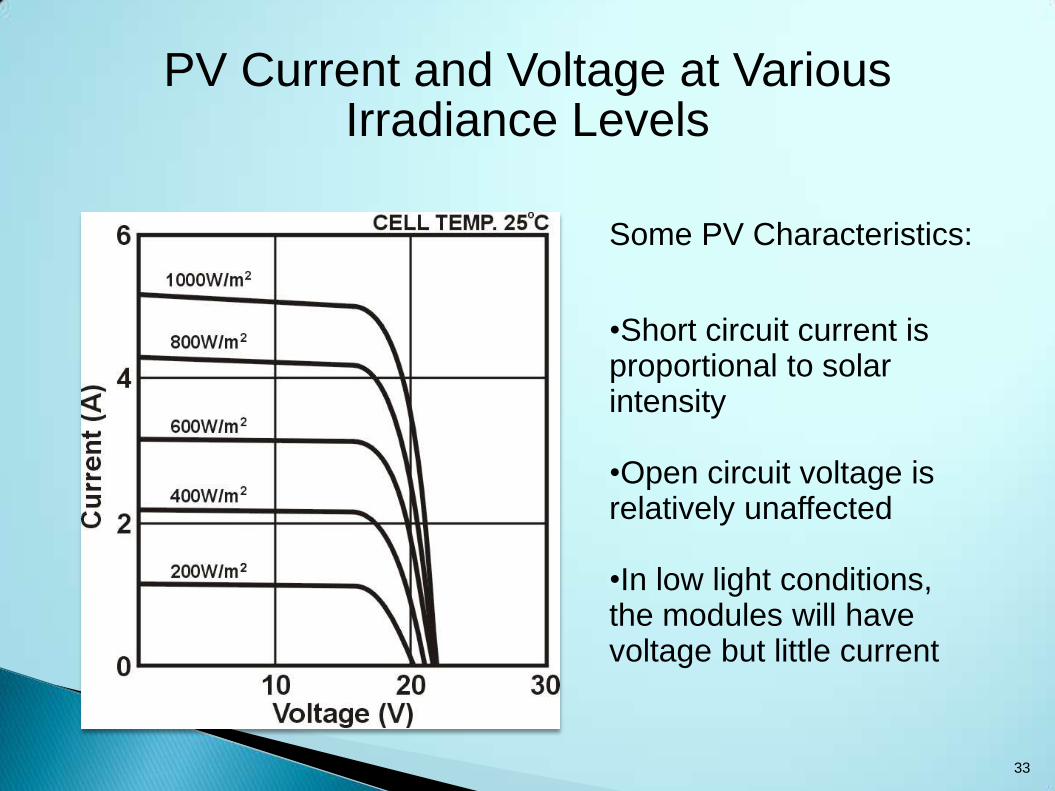
PV Current and Voltage at Various Irradiance Levels
•Short circuit current is proportional to solar intensity •Open circuit voltage is relatively unaffected •In low light conditions, the modules will have voltage but little current
Some PV Characteristics:
33
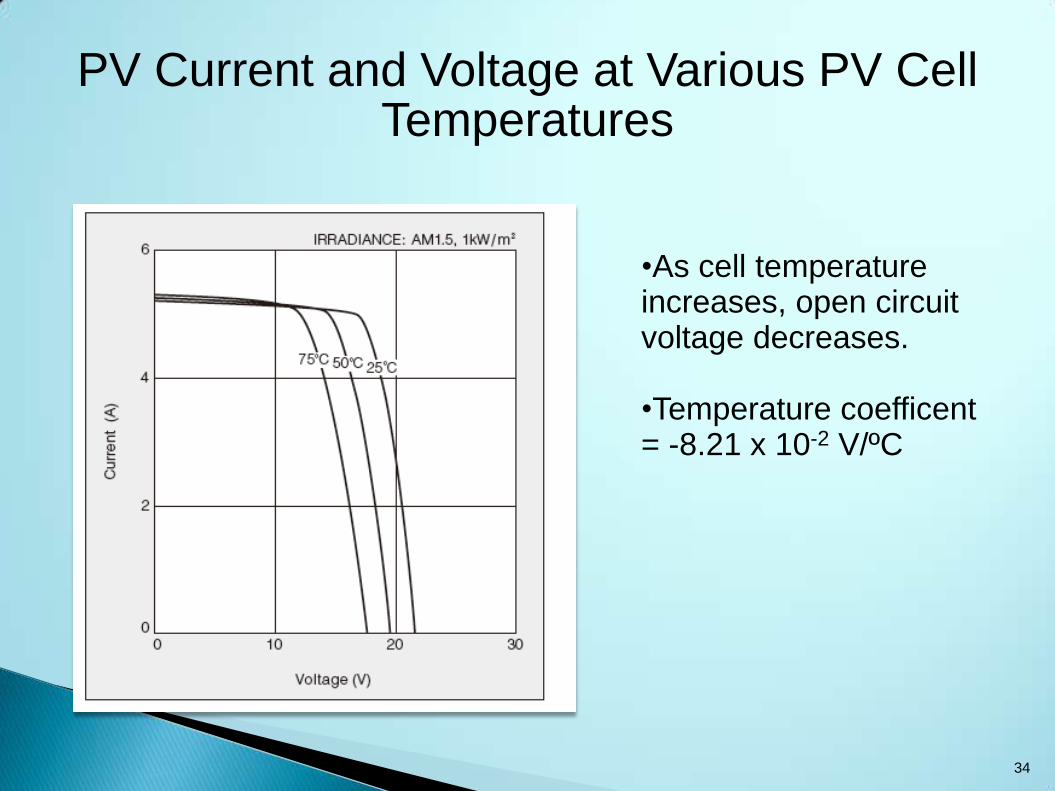
PV Current and Voltage at Various PV Cell Temperatures
•As cell temperature increases, open circuit voltage decreases. •Temperature coefficent = -8.21 x 10⁻² V/ºC
34
Battery Backup
Some Battery Terms and Definitions: Cell: Fundamental battery unit. A typical 12V battery has 6 cells of 2v each connected in series for a total of 12V. Amp-Hour Capacity: the amount of charge in a fully charged battery. This is dependent on the discharge rate, usually stated in terms of hours using the “C” designation (C/100 = 100 hour capacity, C/20 = 20 hour capacity). Depth of discharge (DOD): the amount (in percentage of capacity) that a battery is discharged. Can be determined by measuring the voltage or specific gravity. State of charge (SOC): the inverse of DOD (= 100-DOD); the percentage of capacity remaining. Cycle: One complete charge and discharge. The number of cycles available is dependent on frequency and depth of discharge.
35
Battery Backup Types
• Rural ITS and solar power in general require the lead-acid, deep cycle type of battery. It is constructed with thicker plates and designed for repeated deep discharge.
• Rural ITS devices require a back up battery that is robust, easily maintained, affordable, and able to withstand repeated cycles of deep discharge (50% to 80%).
Three main type of deep cycle lead-acid batteries:
1. Flooded (wet): original type. Very reliable and economical. Require regular maintenance to maintain water levels. Must be stored in a well ventilated enclosure. Can be used for rural ITS as long as temperatures are not too extreme.
2. Gelled (gel cells): Electrolyte is “gelled” to prevent spilling. Require less maintenance but have much higher initial cost. Must be charged at a lower rate than conventional flooded batteries.
3. AGM (Absorbed Glass Mat): Utilize a Boron-Silicate glass mat between the plates. Better suited to low temperature environments (will not freeze). Low maintenance since there is little to no water loss. Cost is comparable to gel cells but with better performance. Much lower ventilation requirements; can be stored in ground enclosures.
36
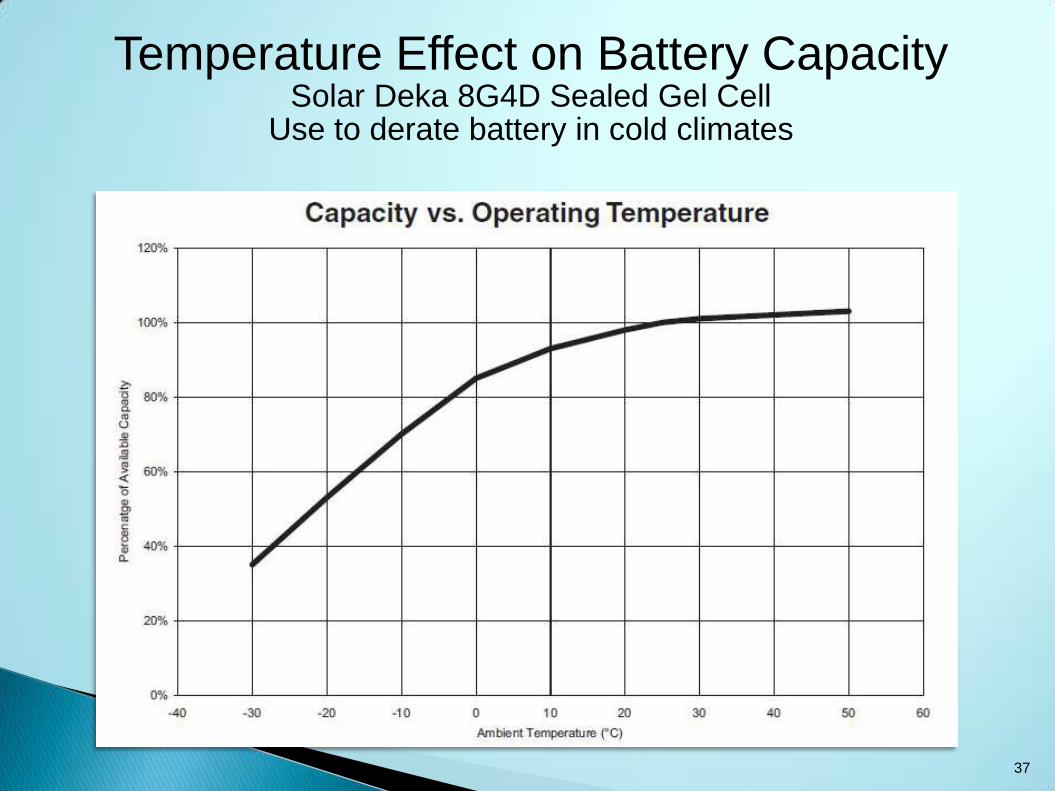
Temperature Effect on Battery Capacity Solar Deka 8G4D Sealed Gel Cell
Use to derate battery in cold climates
37
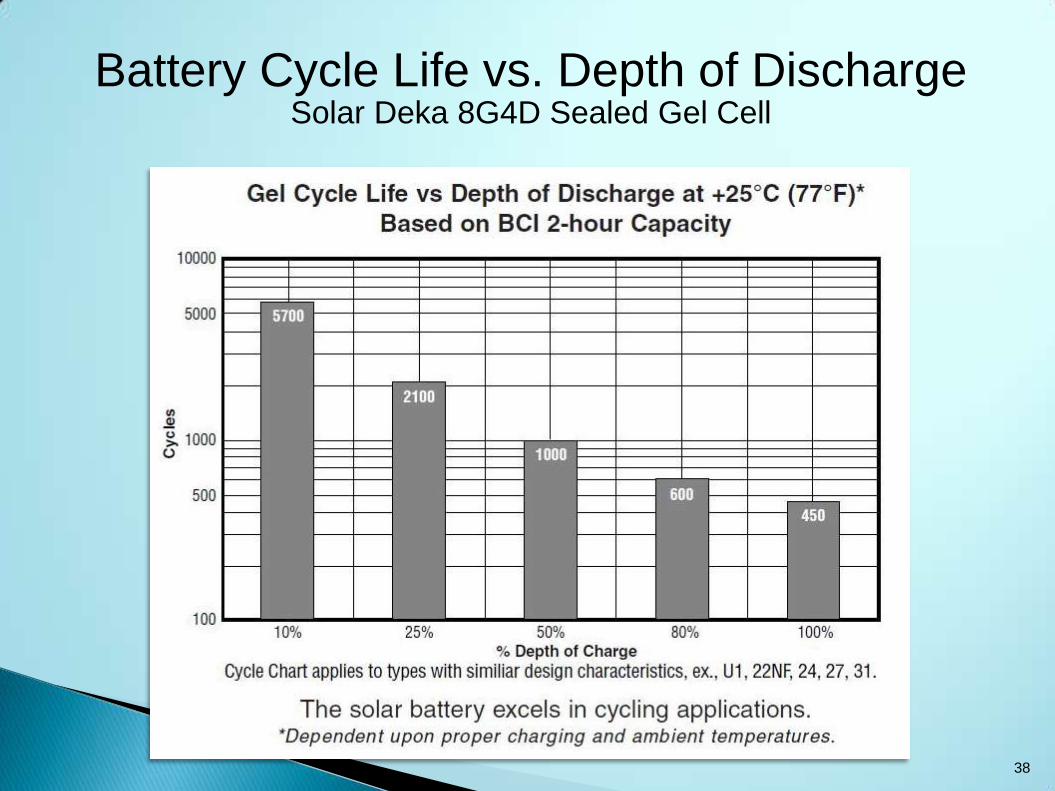
Battery Cycle Life vs. Depth of Discharge Solar Deka 8G4D Sealed Gel Cell
38
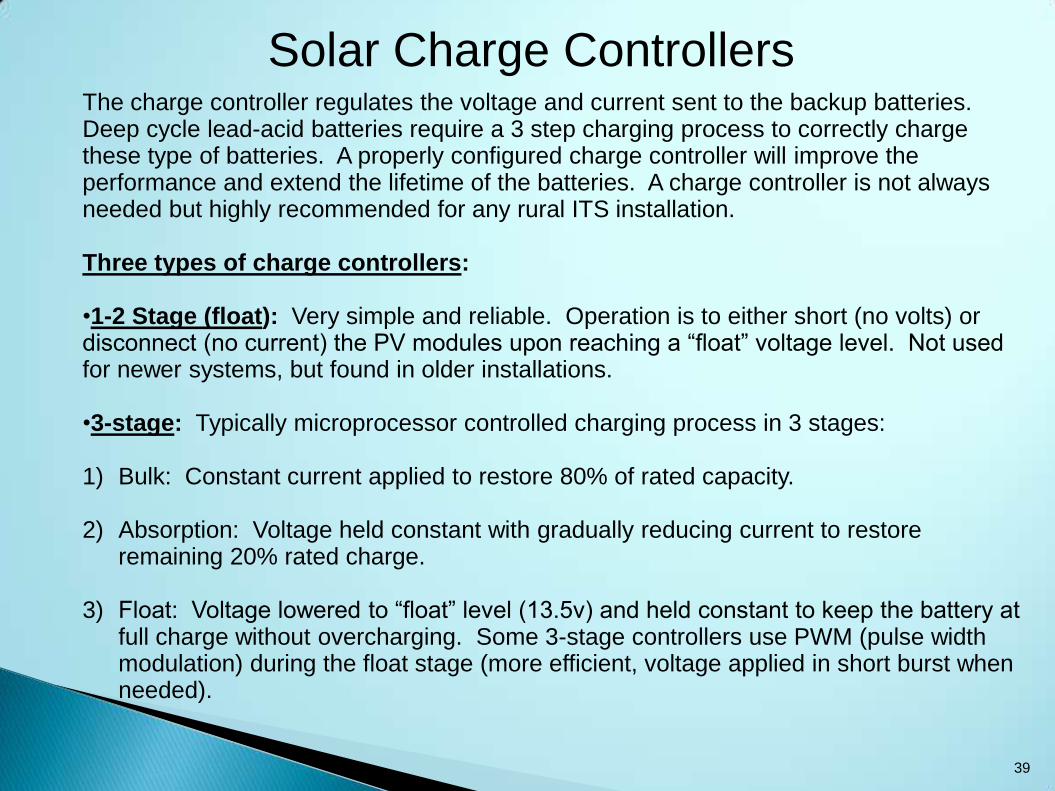
Solar Charge Controllers The charge controller regulates the voltage and current sent to the backup batteries. Deep cycle lead-acid batteries require a 3 step charging process to correctly charge these type of batteries. A properly configured charge controller will improve the performance and extend the lifetime of the batteries. A charge controller is not always needed but highly recommended for any rural ITS installation. Three types of charge controllers: •1-2 Stage (float): Very simple and reliable. Operation is to either short (no volts) or disconnect (no current) the PV modules upon reaching a “float” voltage level. Not used for newer systems, but found in older installations. •3-stage: Typically microprocessor controlled charging process in 3 stages: 1) Bulk: Constant current applied to restore 80% of rated capacity.
2) Absorption: Voltage held constant with gradually reducing current to restore
remaining 20% rated charge.
3) Float: Voltage lowered to “float” level (13.5v) and held constant to keep the battery at full charge without overcharging. Some 3-stage controllers use PWM (pulse width modulation) during the float stage (more efficient, voltage applied in short burst when needed).
39
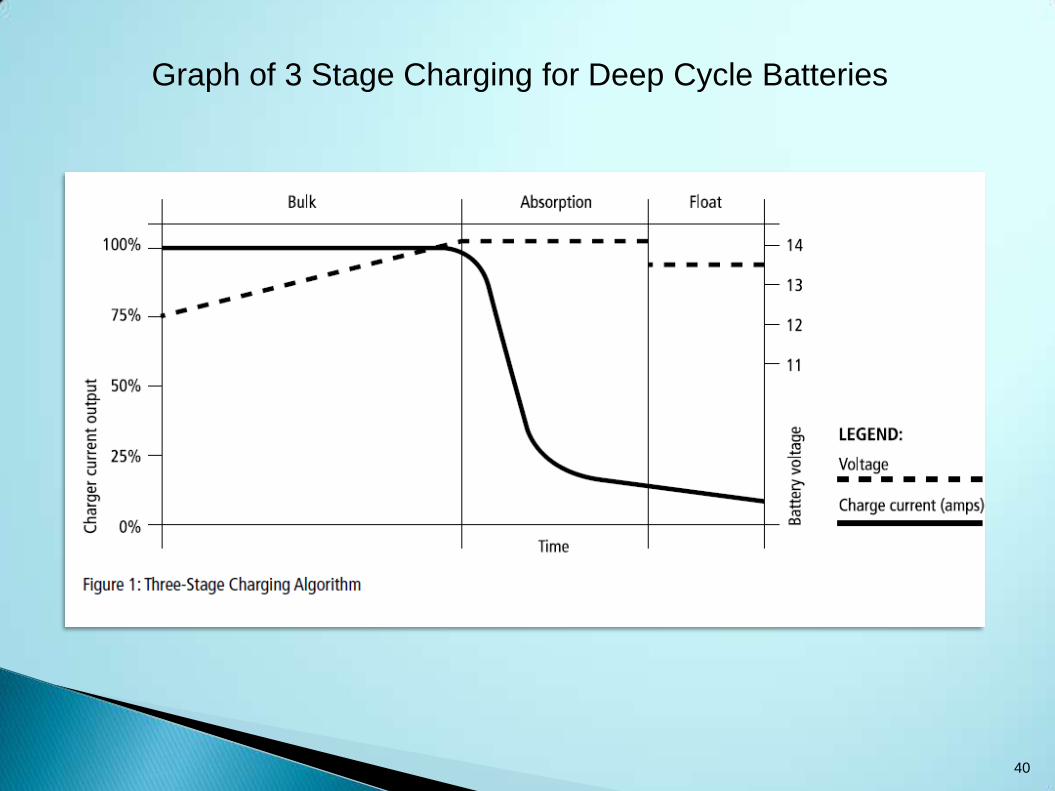
Graph of 3 Stage Charging for Deep Cycle Batteries
40
Solar Charge Controllers
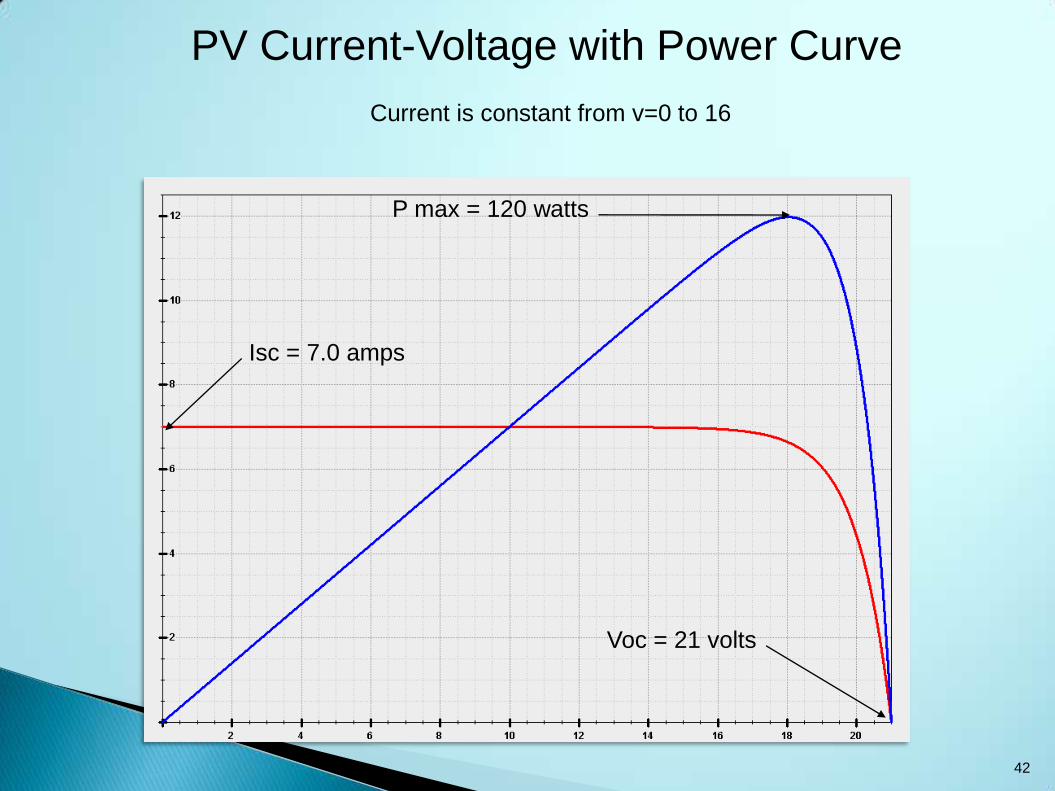
•Maximum Power Point Tracking (MPPT): Charges the battery just like a three stage charger except it contains circuitry to track the maximum power point PV module thereby making the most effective use of the PV rated power output. Downside is the cost, so may only be justified for locations with low PV output or colder climates. How MPPT works: •The MPPT controller operates by adjusting the loading to the PV module so that it is operating at the maximum power point. The controller (using a high frequency DC-DC converter) converts the voltage down to the battery level, while increasing the current to maintain the maximum power level. •Referring to the power curve (next slide), a typical charger will operate at 12v (to charge the battery). With a current of around 7 amps, the power is 84 watts, well below the 120 watt power rating of the PV module. •The controller will pull current from the module at the optimal operating point of 18v, with a power output just below the rated maximum (90% to 95% efficiency) The controller adjusts to changes in the maximum power point due to temperature and insolation changes.
41
PV Current-Voltage with Power Curve
Isc = 7.0 amps
Voc = 21 volts
P max = 120 watts
Current is constant from v=0 to 16
42
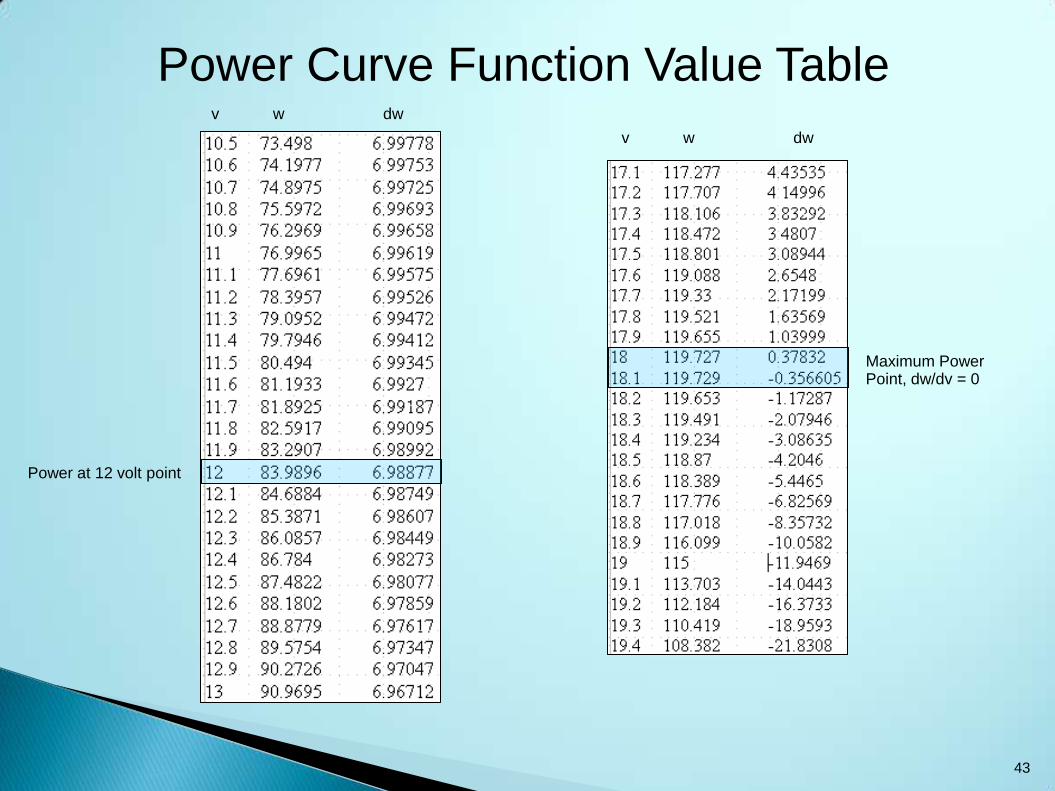
Power Curve Function Value Table
Maximum Power Point, dw/dv = 0
Power at 12 volt point
v w dw
v w dw
43
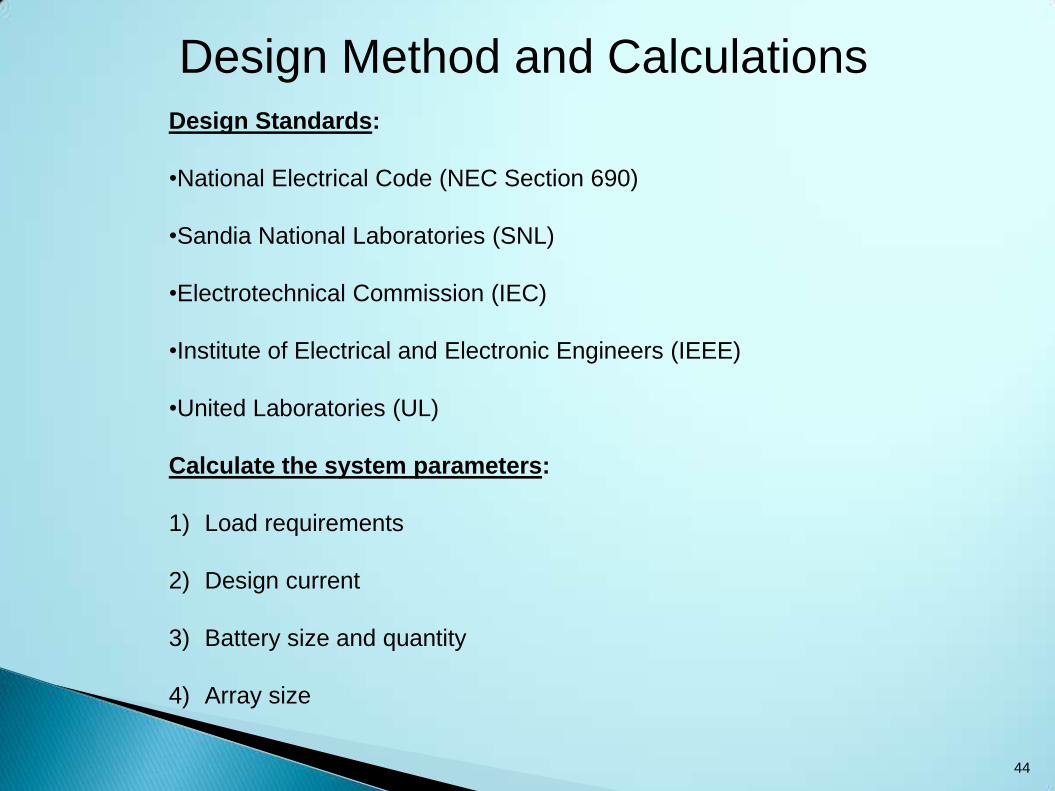
Design Method and Calculations Design Standards:
•National Electrical Code (NEC Section 690)
•Sandia National Laboratories (SNL)
•Electrotechnical Commission (IEC)
•Institute of Electrical and Electronic Engineers (IEEE)
•United Laboratories (UL)
Calculate the system parameters:
1) Load requirements
2) Design current
3) Battery size and quantity
4) Array size
44
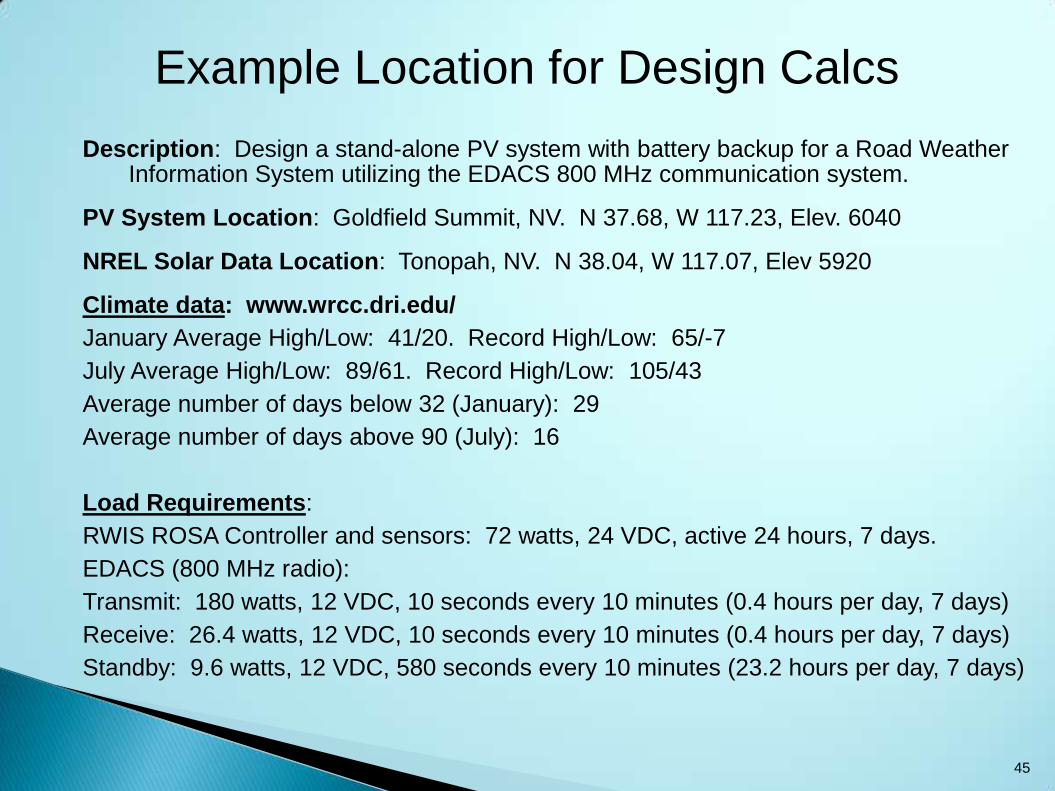
Example Location for Design Calcs
Description: Design a stand-alone PV system with battery backup for a Road Weather Information System utilizing the EDACS 800 MHz communication system.
PV System Location: Goldfield Summit, NV. N 37.68, W 117.23, Elev. 6040
NREL Solar Data Location: Tonopah, NV. N 38.04, W 117.07, Elev 5920
Climate data: www.wrcc.dri.edu/
January Average High/Low: 41/20. Record High/Low: 65/-7
July Average High/Low: 89/61. Record High/Low: 105/43
Average number of days below 32 (January): 29
Average number of days above 90 (July): 16
Load Requirements:
RWIS ROSA Controller and sensors: 72 watts, 24 VDC, active 24 hours, 7 days.
EDACS (800 MHz radio):
Transmit: 180 watts, 12 VDC, 10 seconds every 10 minutes (0.4 hours per day, 7 days)
Receive: 26.4 watts, 12 VDC, 10 seconds every 10 minutes (0.4 hours per day, 7 days)
Standby: 9.6 watts, 12 VDC, 580 seconds every 10 minutes (23.2 hours per day, 7 days)
45
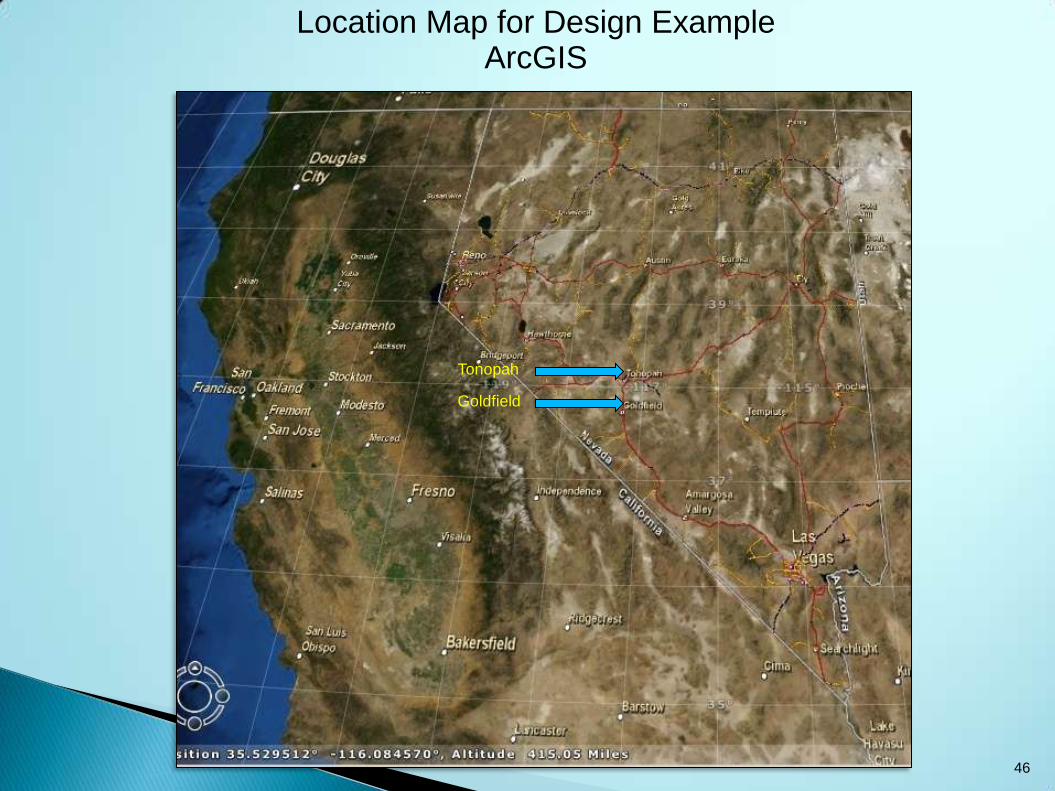
Tonopah
Goldfield
Location Map for Design Example ArcGIS
46
Load Calculation Method
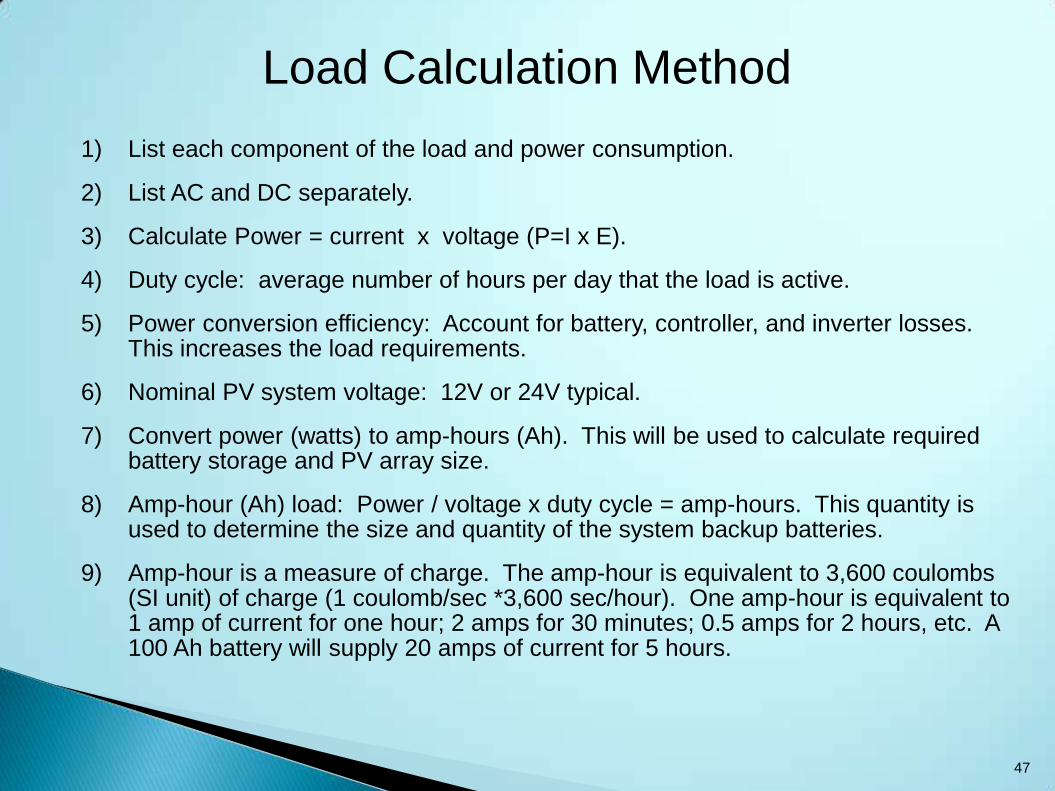
1) List each component of the load and power consumption.
2) List AC and DC separately.
3) Calculate Power = current x voltage (P=I x E).
4) Duty cycle: average number of hours per day that the load is active.
5) Power conversion efficiency: Account for battery, controller, and inverter losses. This increases the load requirements.
6) Nominal PV system voltage: 12V or 24V typical.
7) Convert power (watts) to amp-hours (Ah). This will be used to calculate required battery storage and PV array size.
8) Amp-hour (Ah) load: Power / voltage x duty cycle = amp-hours. This quantity is used to determine the size and quantity of the system backup batteries.
9) Amp-hour is a measure of charge. The amp-hour is equivalent to 3,600 coulombs (SI unit) of charge (1 coulomb/sec *3,600 sec/hour). One amp-hour is equivalent to 1 amp of current for one hour; 2 amps for 30 minutes; 0.5 amps for 2 hours, etc. A 100 Ah battery will supply 20 amps of current for 5 hours.
47
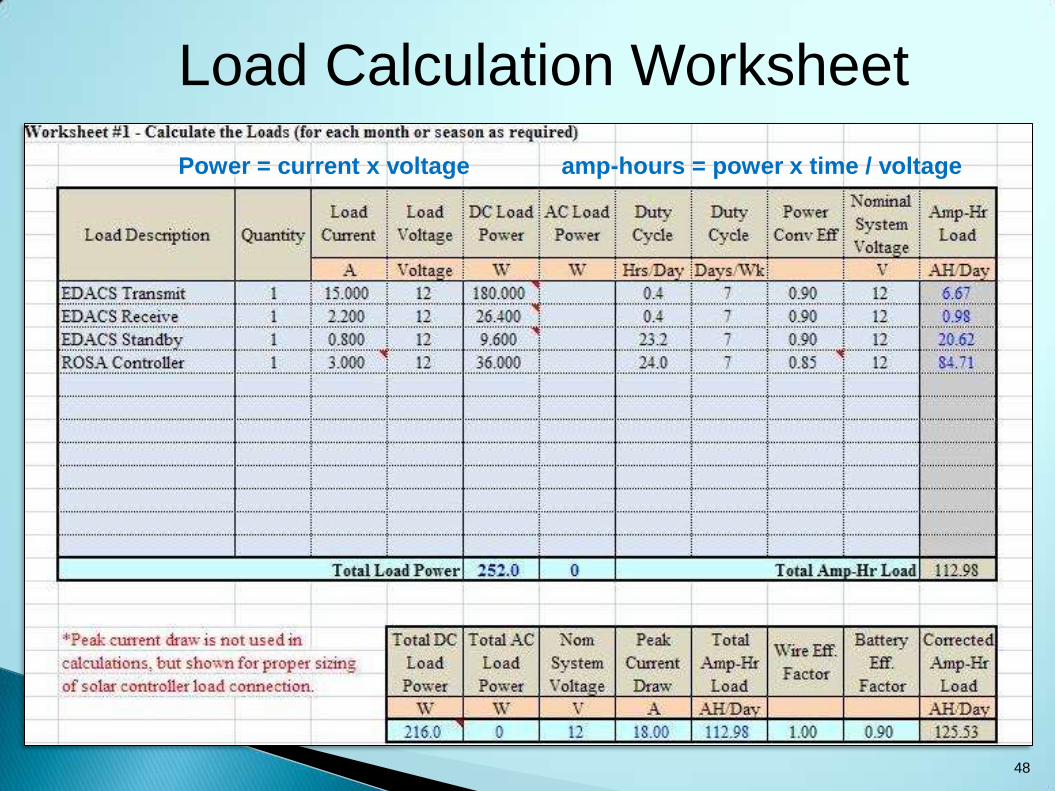
Load Calculation Worksheet
48
Power = current x voltage amp-hours = power x time / voltage
Calculate Design Current and PV Module Tilt
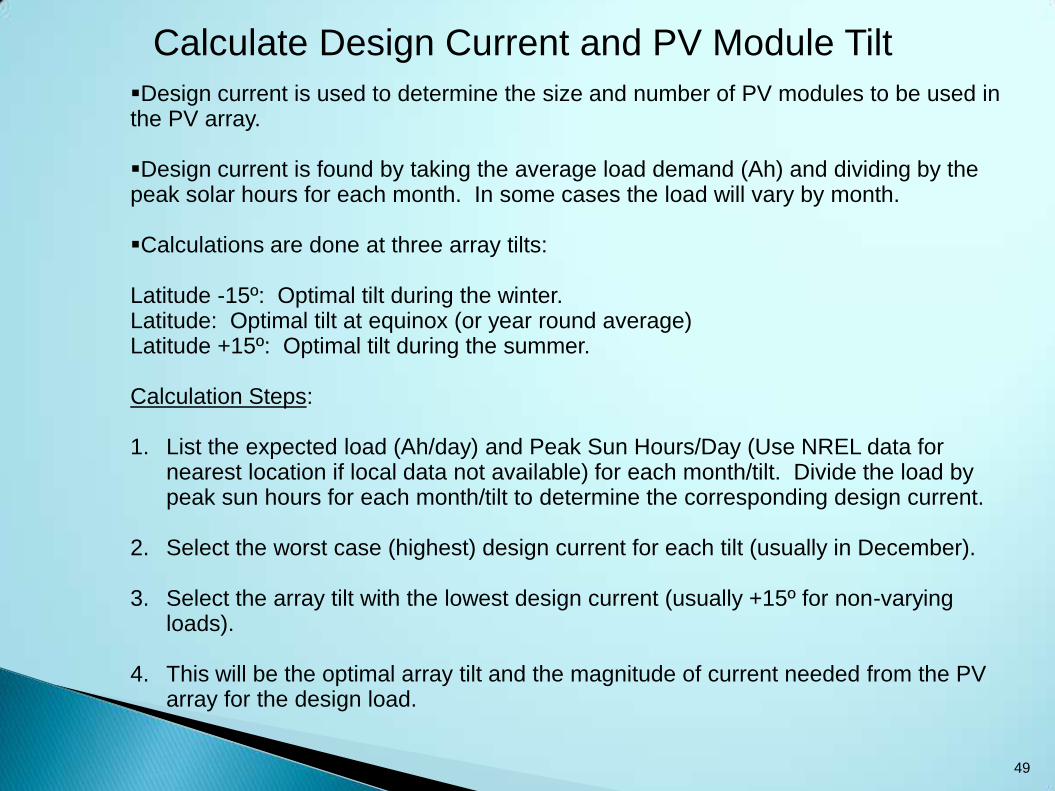
Design current is used to determine the size and number of PV modules to be used in the PV array. Design current is found by taking the average load demand (Ah) and dividing by the peak solar hours for each month. In some cases the load will vary by month. Calculations are done at three array tilts: Latitude -15º: Optimal tilt during the winter. Latitude: Optimal tilt at equinox (or year round average) Latitude +15º: Optimal tilt during the summer. Calculation Steps: 1. List the expected load (Ah/day) and Peak Sun Hours/Day (Use NREL data for
nearest location if local data not available) for each month/tilt. Divide the load by peak sun hours for each month/tilt to determine the corresponding design current.
2. Select the worst case (highest) design current for each tilt (usually in December).
3. Select the array tilt with the lowest design current (usually +15º for non-varying loads).
4. This will be the optimal array tilt and the magnitude of current needed from the PV array for the design load.
49
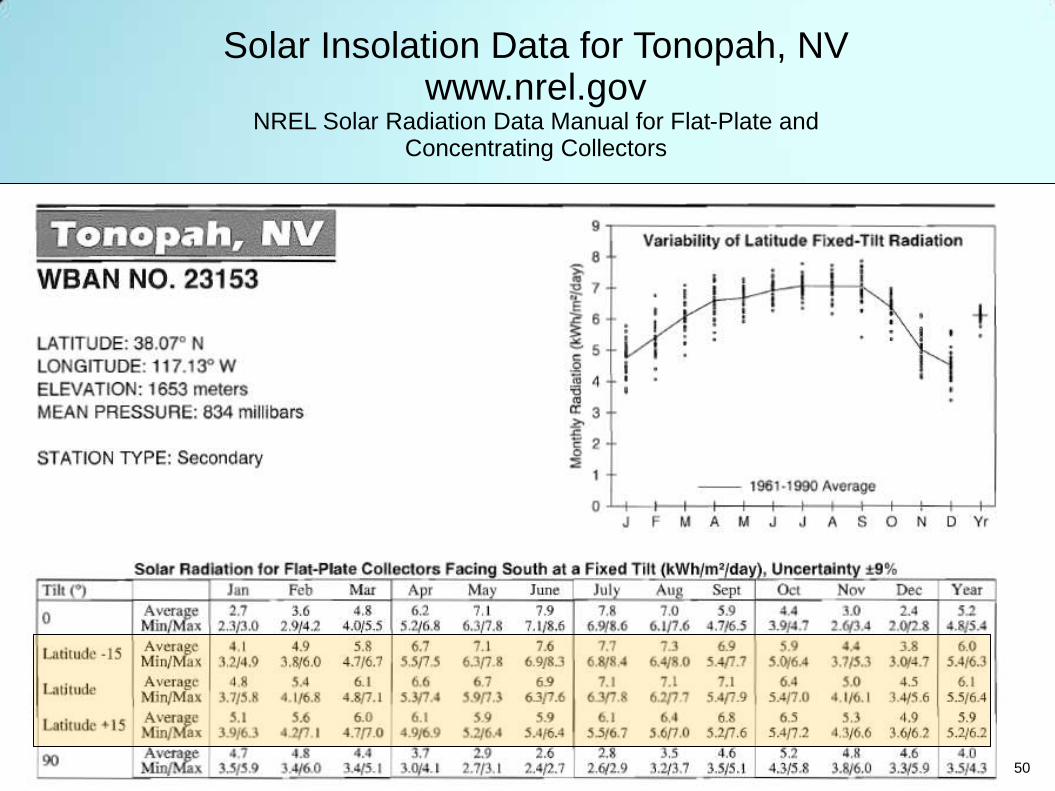
Solar Insolation Data for Tonopah, NV www.nrel.gov
NREL Solar Radiation Data Manual for Flat-Plate and Concentrating Collectors
50
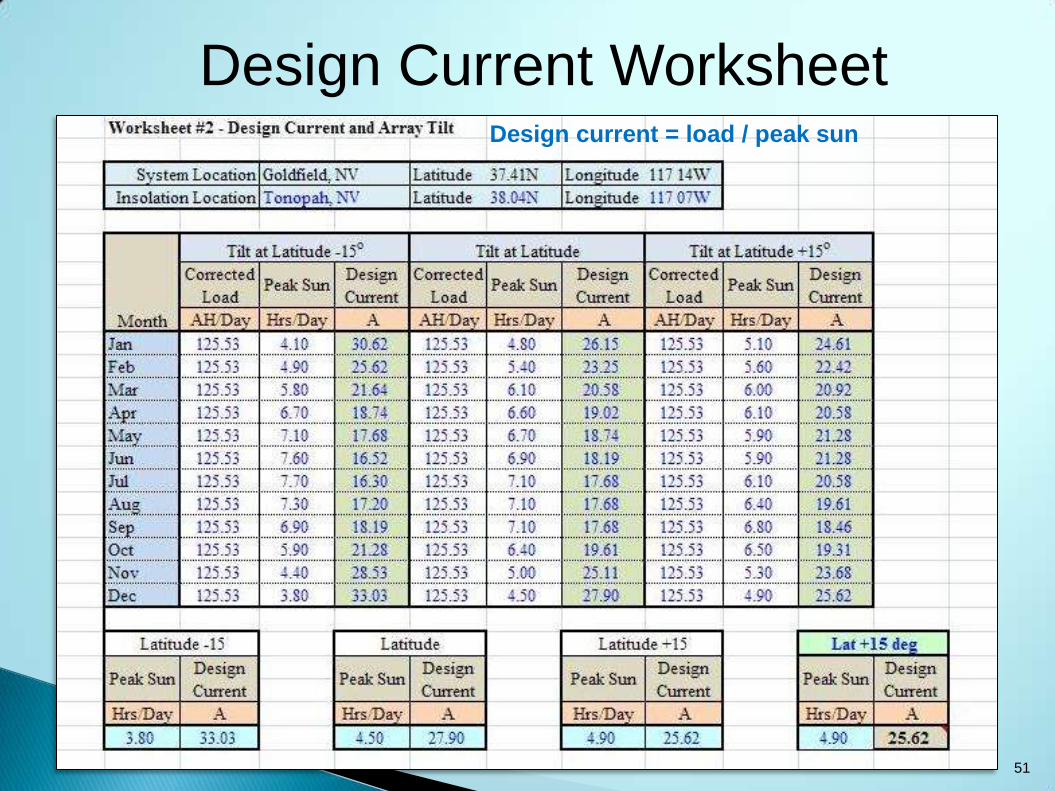
Design Current Worksheet
51
Design current = load / peak sun
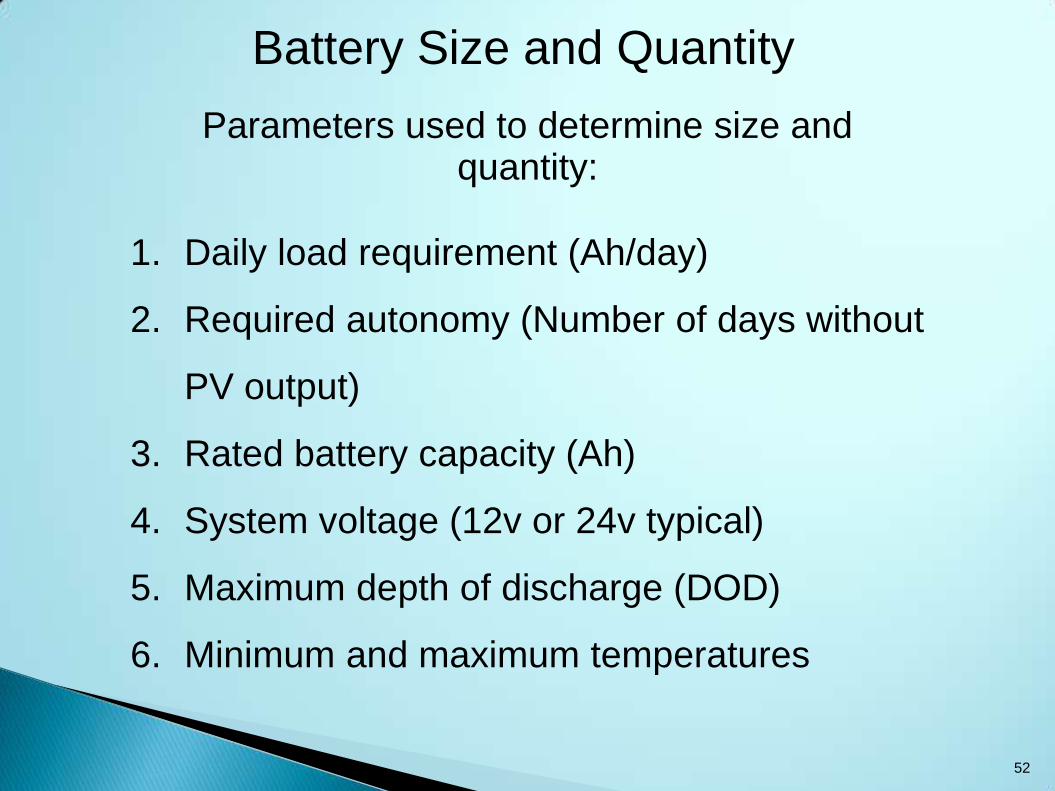
Battery Size and Quantity
Parameters used to determine size and quantity:
1. Daily load requirement (Ah/day)
2. Required autonomy (Number of days without
PV output)
3. Rated battery capacity (Ah)
4. System voltage (12v or 24v typical)
5. Maximum depth of discharge (DOD)
6. Minimum and maximum temperatures
52
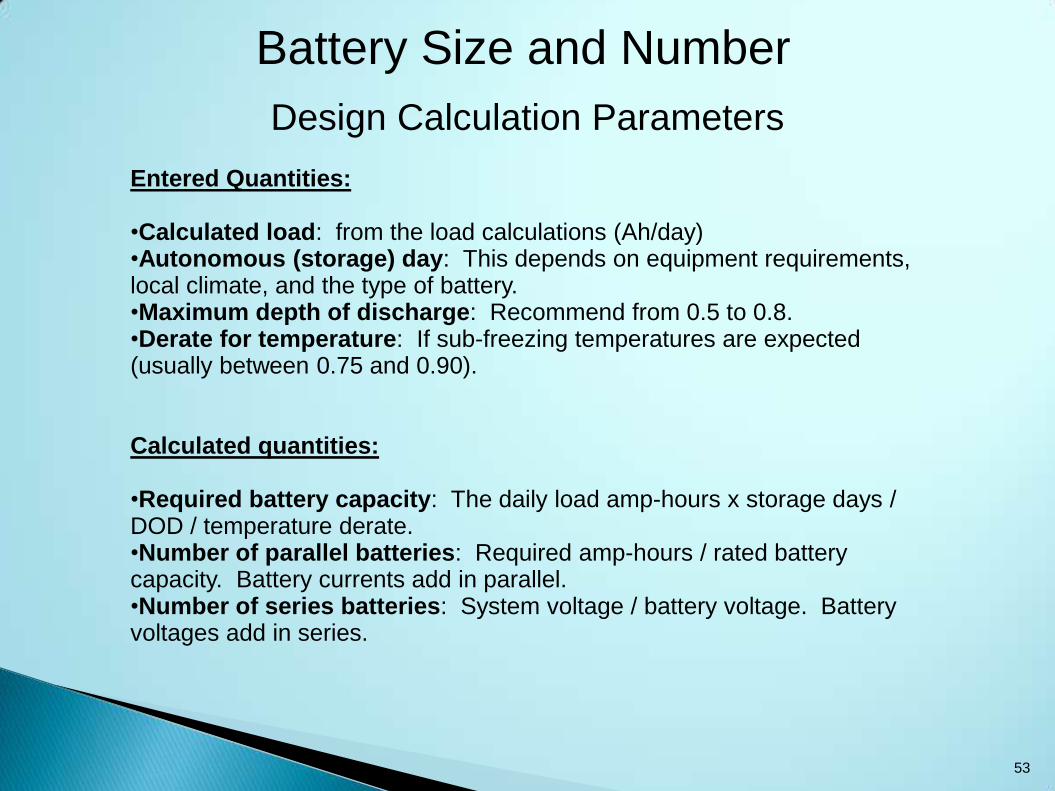
Battery Size and Number
Design Calculation Parameters Entered Quantities: •Calculated load: from the load calculations (Ah/day) •Autonomous (storage) day: This depends on equipment requirements, local climate, and the type of battery. •Maximum depth of discharge: Recommend from 0.5 to 0.8. •Derate for temperature: If sub-freezing temperatures are expected (usually between 0.75 and 0.90). Calculated quantities: •Required battery capacity: The daily load amp-hours x storage days / DOD / temperature derate. •Number of parallel batteries: Required amp-hours / rated battery capacity. Battery currents add in parallel. •Number of series batteries: System voltage / battery voltage. Battery voltages add in series.
53
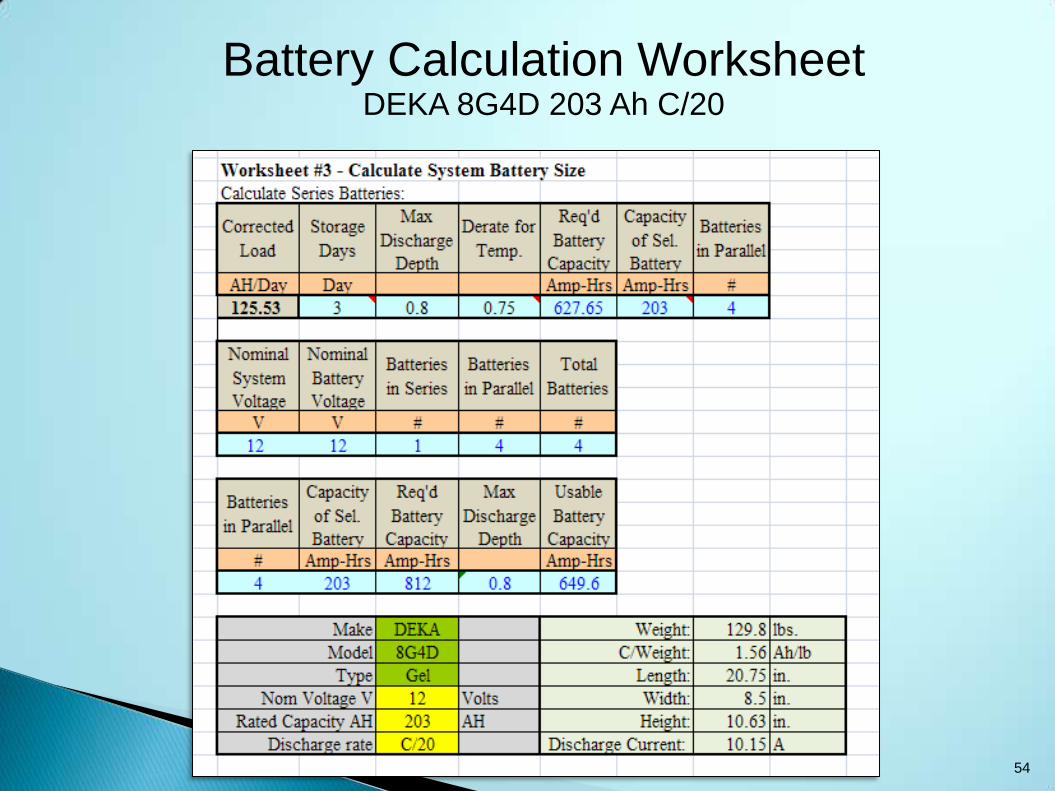
Battery Calculation Worksheet DEKA 8G4D 203 Ah C/20
54
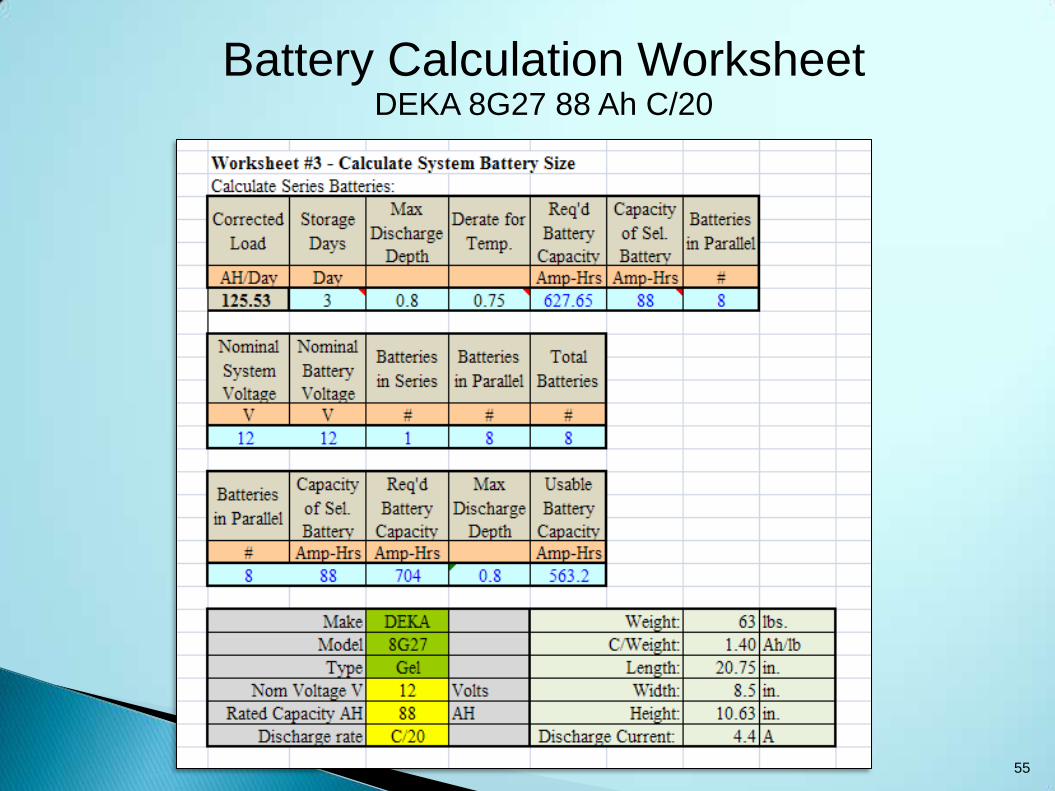
Battery Calculation Worksheet DEKA 8G27 88 Ah C/20
55
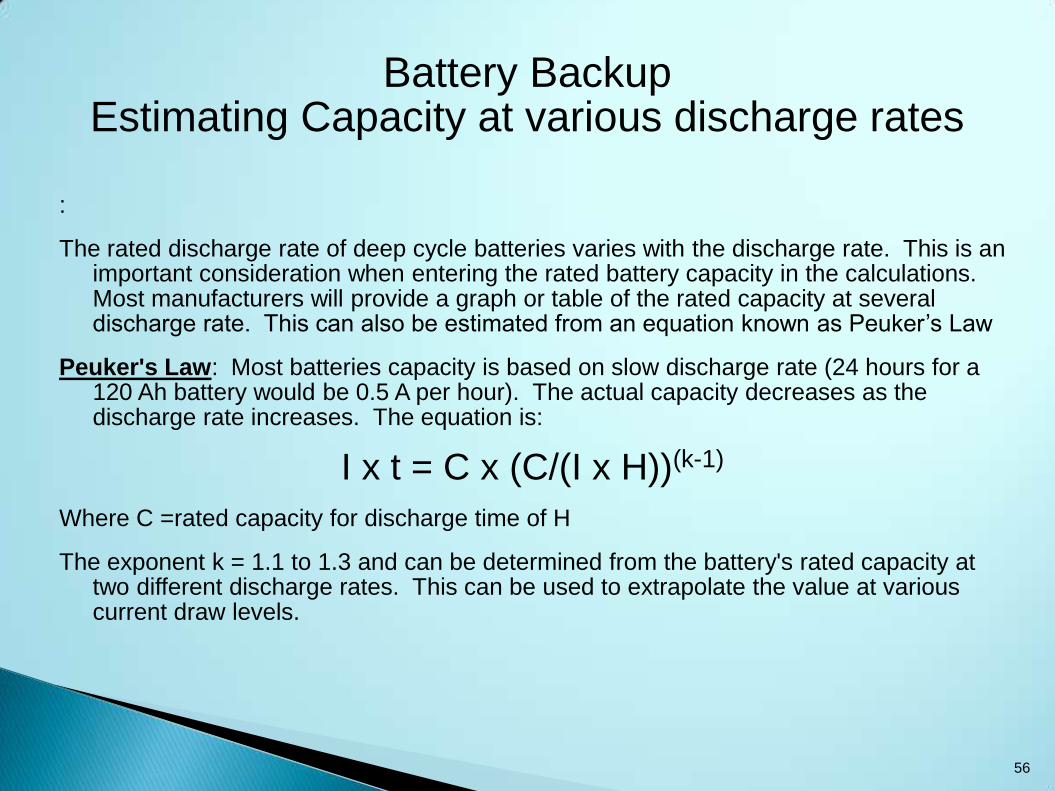
Battery Backup Estimating Capacity at various discharge rates
:
The rated discharge rate of deep cycle batteries varies with the discharge rate. This is an important consideration when entering the rated battery capacity in the calculations. Most manufacturers will provide a graph or table of the rated capacity at several discharge rate. This can also be estimated from an equation known as Peuker’s Law
Peuker's Law: Most batteries capacity is based on slow discharge rate (24 hours for a 120 Ah battery would be 0.5 A per hour). The actual capacity decreases as the discharge rate increases. The equation is:
I x t = C x (C/(I x H))(k-1)
Where C =rated capacity for discharge time of H
The exponent k = 1.1 to 1.3 and can be determined from the battery's rated capacity at two different discharge rates. This can be used to extrapolate the value at various current draw levels.
56
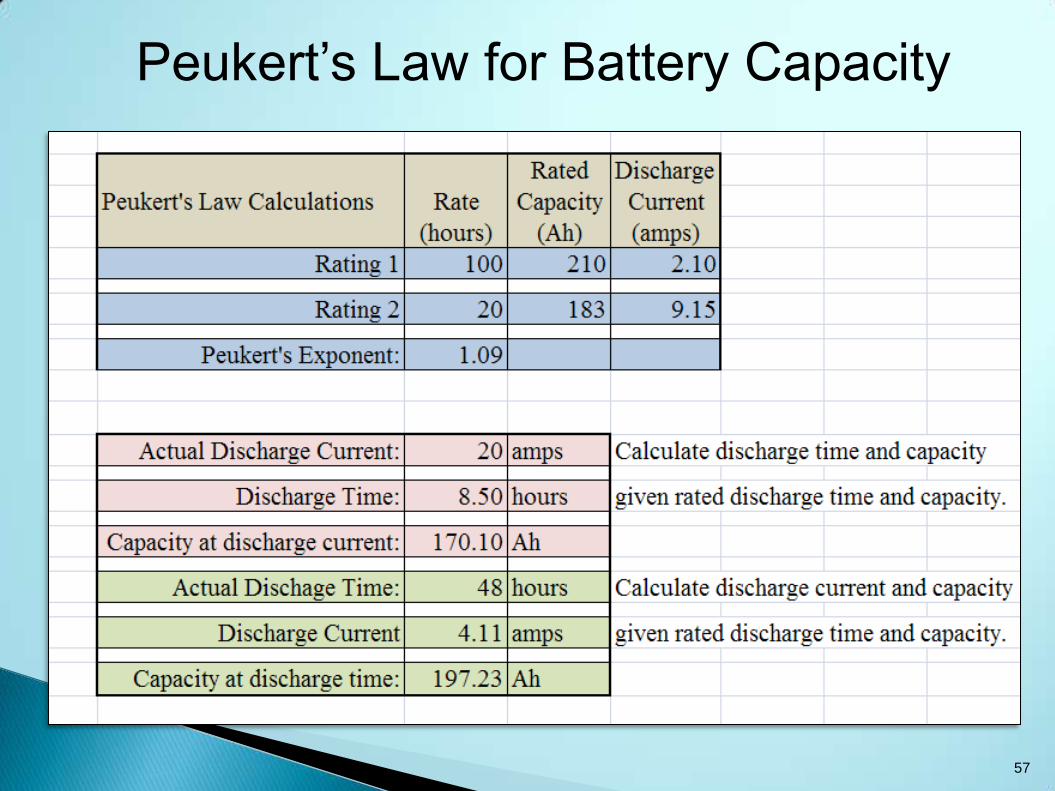
Peukert’s Law for Battery Capacity
57
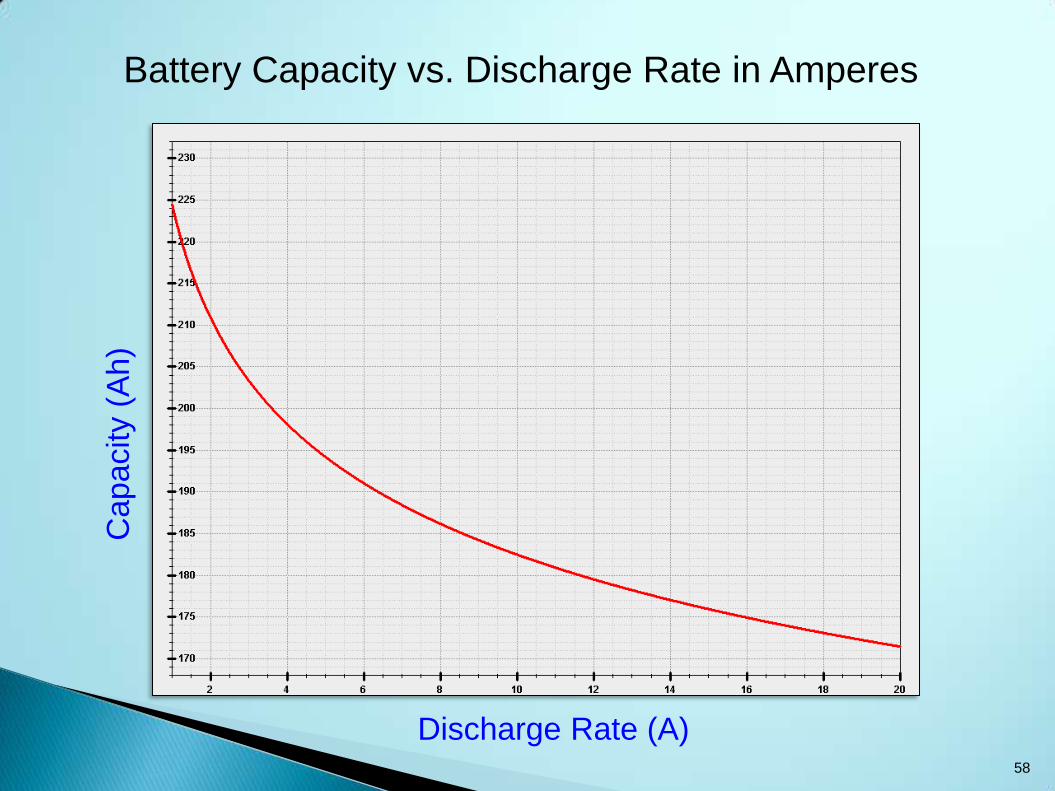
Battery Capacity vs. Discharge Rate in Amperes
Discharge Rate (A)
Capacity (
Ah)
58
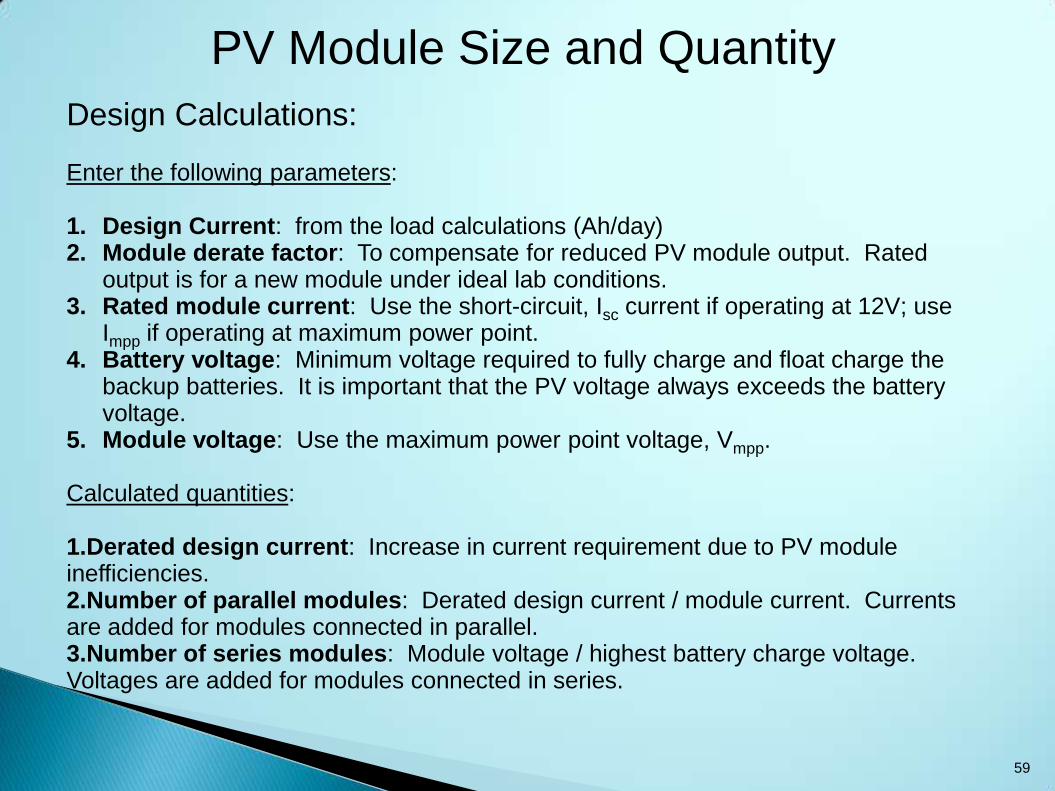
PV Module Size and Quantity
Design Calculations: Enter the following parameters: 1. Design Current: from the load calculations (Ah/day) 2. Module derate factor: To compensate for reduced PV module output. Rated
output is for a new module under ideal lab conditions. 3. Rated module current: Use the short-circuit, Isc current if operating at 12V; use
Impp if operating at maximum power point. 4. Battery voltage: Minimum voltage required to fully charge and float charge the
backup batteries. It is important that the PV voltage always exceeds the battery voltage.
5. Module voltage: Use the maximum power point voltage, Vmpp. Calculated quantities: 1.Derated design current: Increase in current requirement due to PV module inefficiencies. 2.Number of parallel modules: Derated design current / module current. Currents are added for modules connected in parallel. 3.Number of series modules: Module voltage / highest battery charge voltage. Voltages are added for modules connected in series.
59
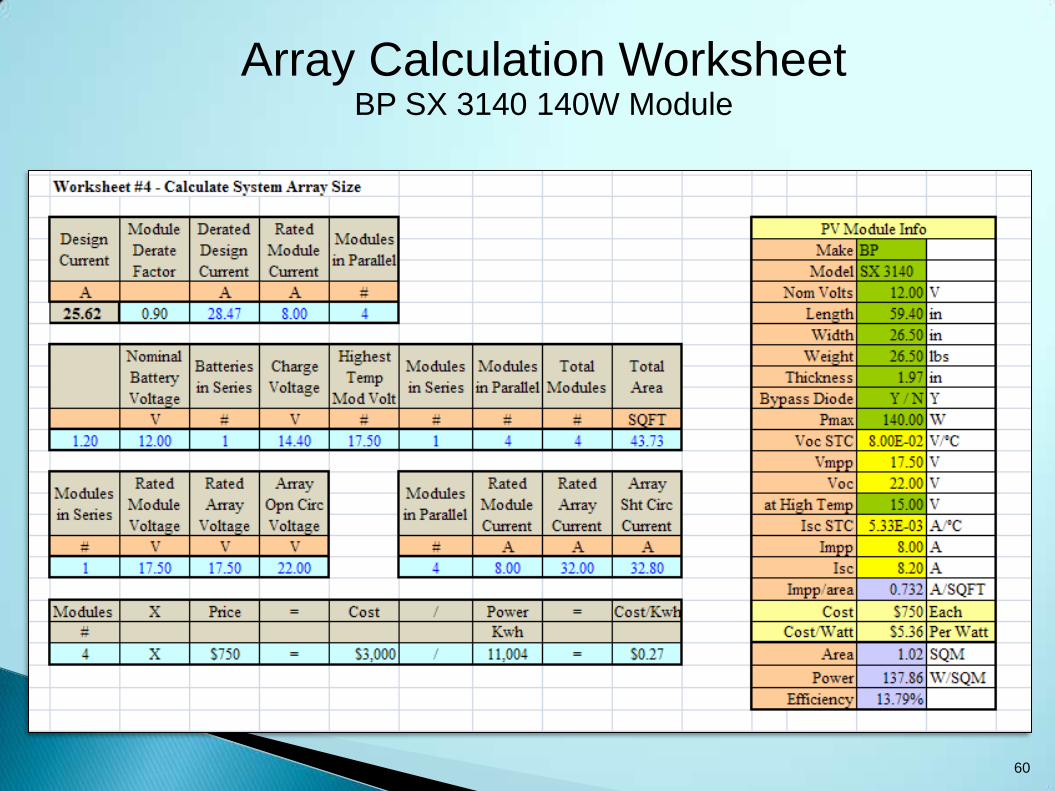
Array Calculation Worksheet BP SX 3140 140W Module
60
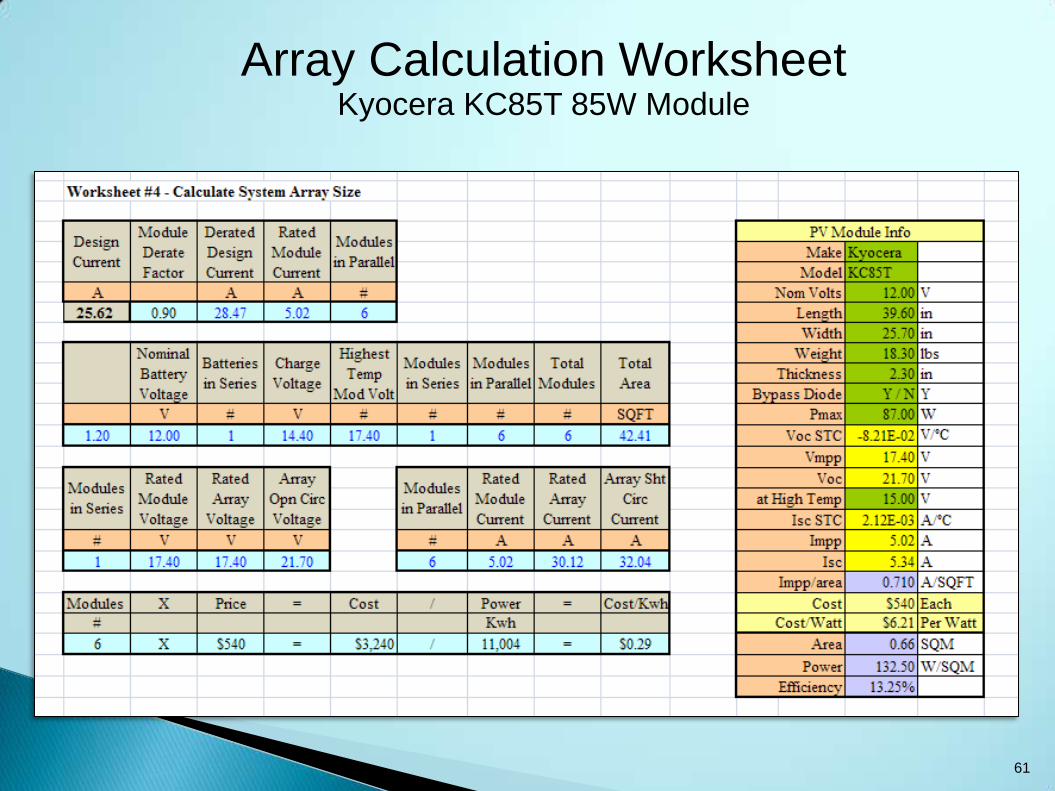
Array Calculation Worksheet Kyocera KC85T 85W Module
61
Lifecycle Cost Analysis
•Lifecycle cost (LCC) analysis is a method of comparing the long term cost among two or more alternative designs for a project. •LCC for rural ITS begins by comparing the cost of municipal power (if available) to the cost of a PV system. •The typical term for the LCC for PV installations is 20 years. •If the initial analysis finds PV to be the best option, then LCC can be calculated for two or more alternative designs.
62
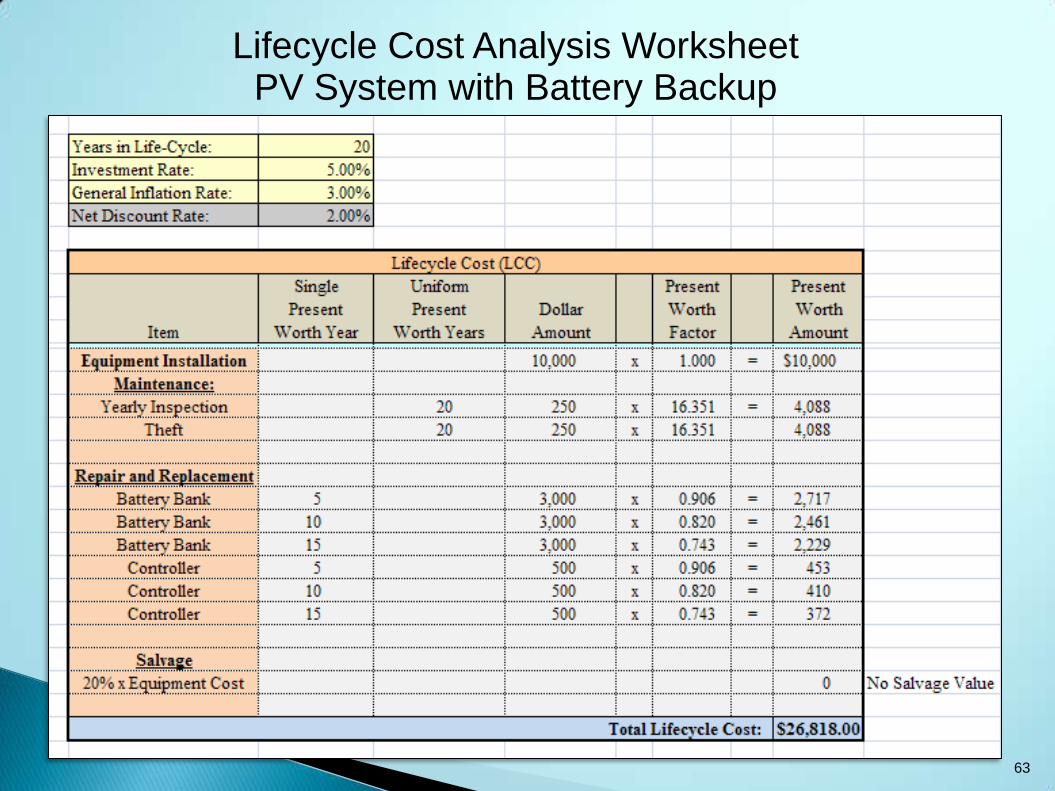
Lifecycle Cost Analysis Worksheet PV System with Battery Backup
63
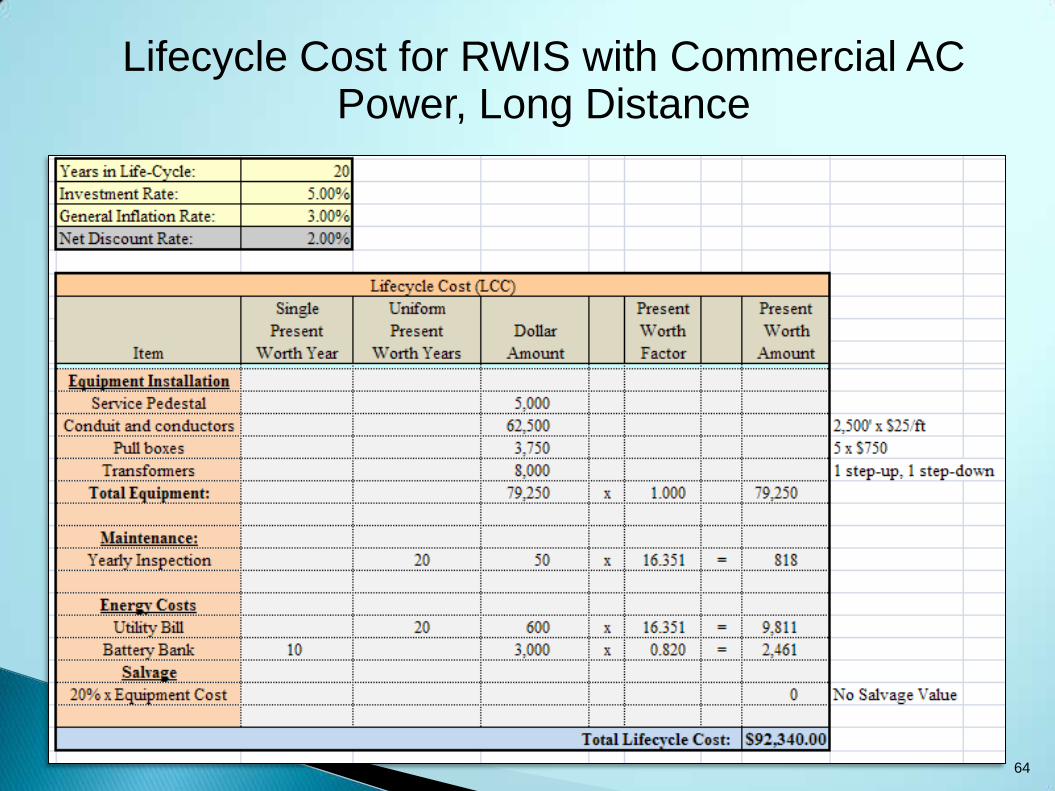
Lifecycle Cost for RWIS with Commercial AC Power, Long Distance
64
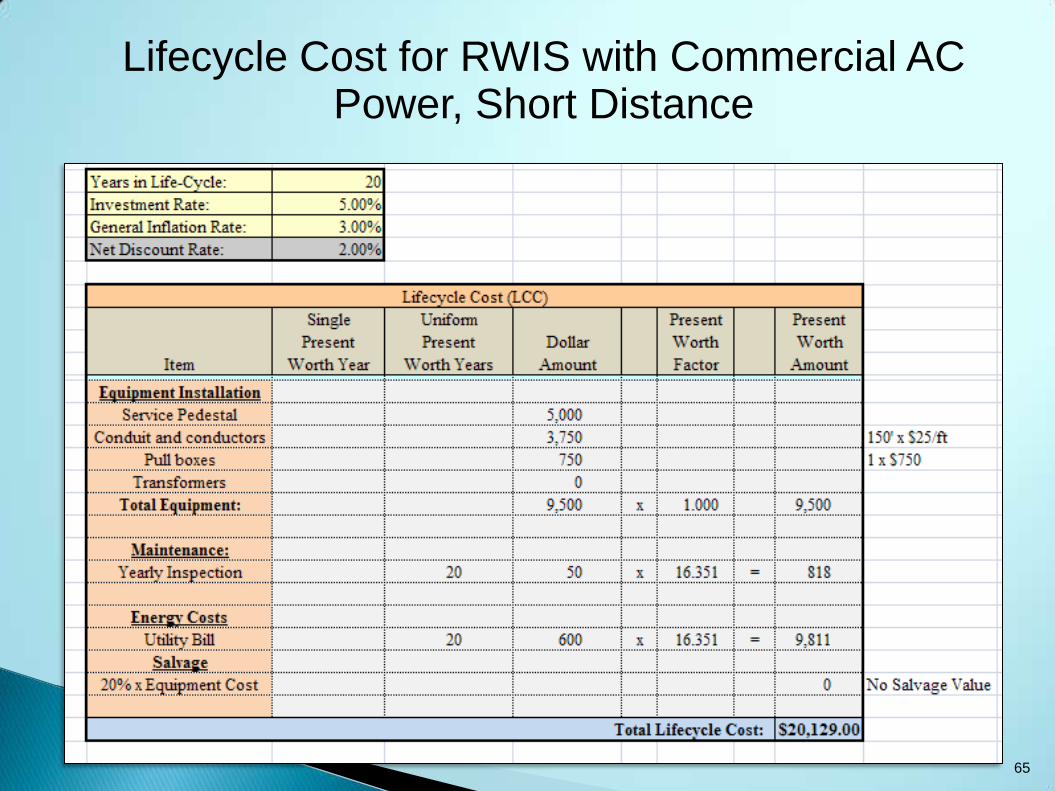
Lifecycle Cost for RWIS with Commercial AC Power, Short Distance
65
Equipment Reliability in Rural ITS Applications:
Photovoltaic Modules: The PV modules used (Kyocera and BP) have operated very reliably without any failures. The panels are rated to operate for 20 years without diminished performance. The only replacement required so far is from vandalism or theft. PV modules can sustain damage from vandalism (gunshot or struck by thrown objects) and continue to operate at a diminished level. Solar charger/controllers: All the solar controllers used for rural ITS applications are field hardened and have performed well in the field. The controllers normally last about 5-7 years before replacement, well beyond the 3 year warranty. Back up Batteries: The back up batteries used are sealed Gel Cell and typically last about 3-4 years before replacement. There are some that have lasted up to 6 years. These batteries have held up well in cold weather locations, where sub-zero temperatures are common in winter. Overall, the components used by NDOT have been very reliable and have withstood the temperature extremes (100º in summer to subzero in winter). All system components are specified to be field hardened and designed for outdoor use. Failures, when they occur, are usually a result of improper design, mismatched components, or improper installation.
66
PV Systems Maintenance Schedule
District 2 performs a pre-winter inspection of all sites beginning each September:
1. Physically inspect pole, foundation, mounting hardware, cabinets, PV modules, batteries, cables and connectors.
2. Perform testing of all system components to verify PV output, controller performance, and battery SOC and capacity.
3. Repair or replace all faulty or under performing equipment. Clean batteries and equipment and tighten all loose connections.
4. Clean PV panels. Adjust panel mount and tighten if necessary.
67
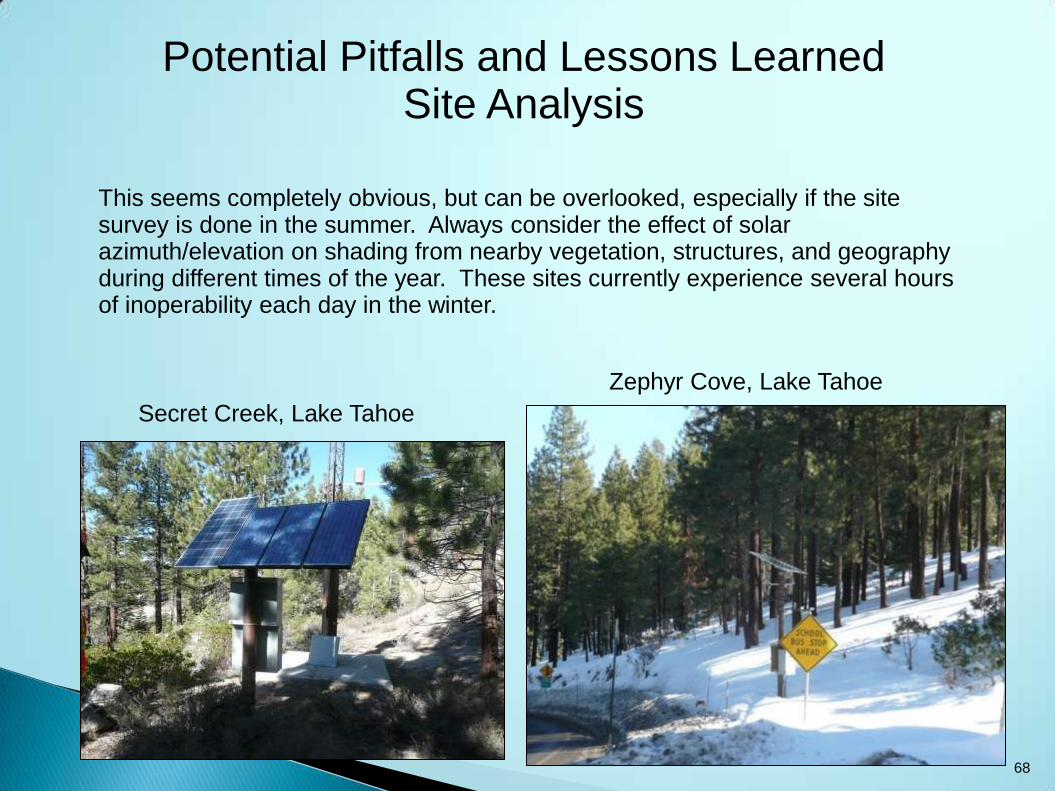
Potential Pitfalls and Lessons Learned Site Analysis
This seems completely obvious, but can be overlooked, especially if the site survey is done in the summer. Always consider the effect of solar azimuth/elevation on shading from nearby vegetation, structures, and geography during different times of the year. These sites currently experience several hours of inoperability each day in the winter.
Secret Creek, Lake Tahoe
Zephyr Cove, Lake Tahoe
68
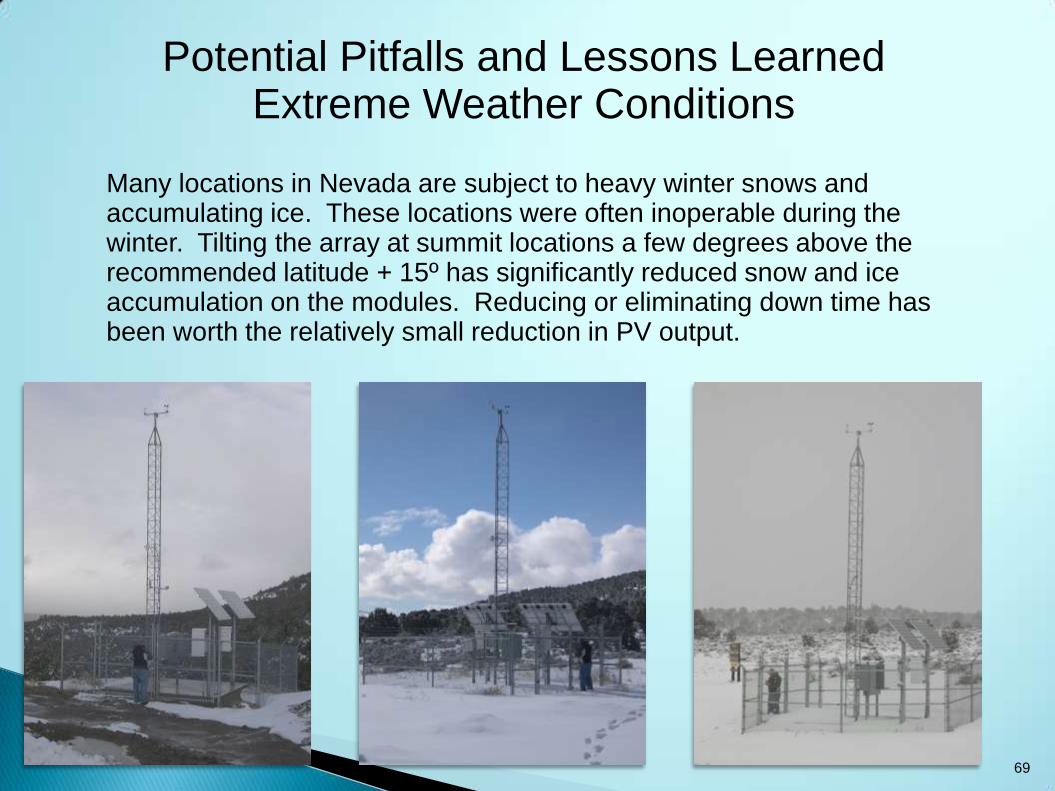
Potential Pitfalls and Lessons Learned Extreme Weather Conditions
Many locations in Nevada are subject to heavy winter snows and accumulating ice. These locations were often inoperable during the winter. Tilting the array at summit locations a few degrees above the recommended latitude + 15º has significantly reduced snow and ice accumulation on the modules. Reducing or eliminating down time has been worth the relatively small reduction in PV output.
69
Matching System Components
Pitfall:
• Though not a PV system, this provides an example of improperly sized BOC (balance of system) components.
• A controller (same as used in PV systems) was used to charge a Trailblazer back up battery system at night (when the street lighting system was active). The system runs off the batteries during the daytime (when AC is off).
• Some of the trailblazers in Las Vegas were failing because the controller used did not supply enough current to fully charge the batteries during the limited cycle time (worse in summer).
Lesson Learned:
The selection of the solar charger/controller should not be done until the size and number of back up batteries have been determined.
The controller should be sized to 1.25 x the minimum amount of current needed
to fully charge the batteries during each cycle.
70
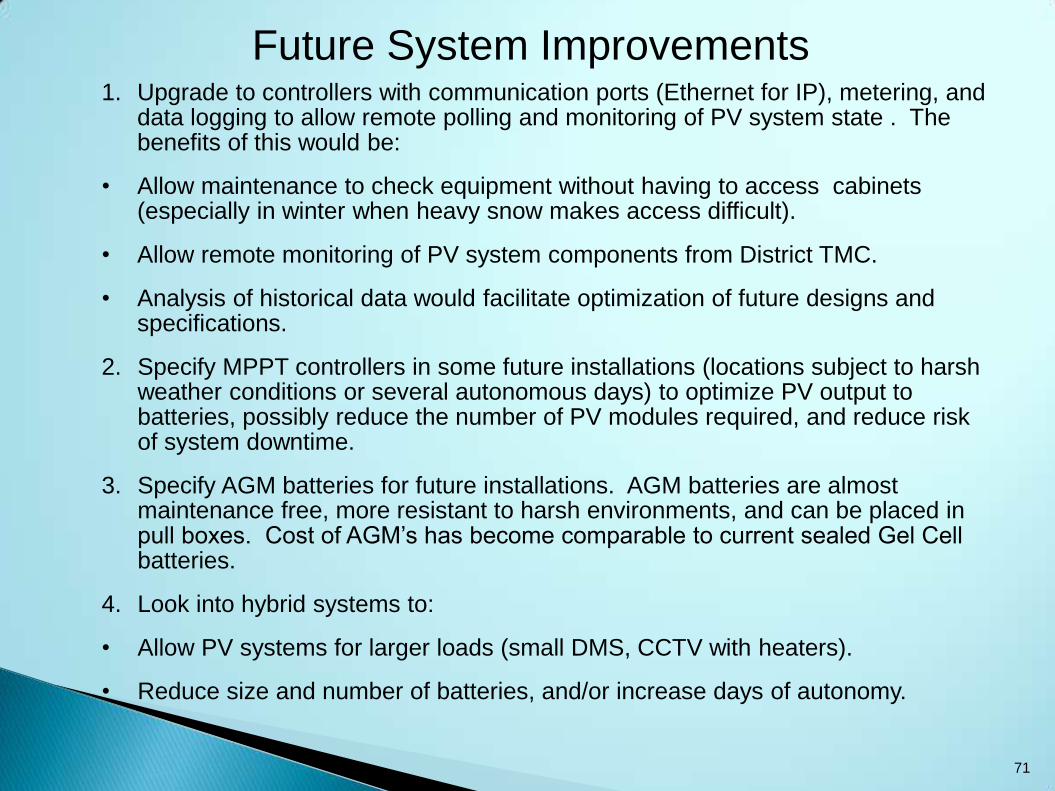
Future System Improvements 1. Upgrade to controllers with communication ports (Ethernet for IP), metering, and
data logging to allow remote polling and monitoring of PV system state . The benefits of this would be:
• Allow maintenance to check equipment without having to access cabinets (especially in winter when heavy snow makes access difficult).
• Allow remote monitoring of PV system components from District TMC.
• Analysis of historical data would facilitate optimization of future designs and specifications.
2. Specify MPPT controllers in some future installations (locations subject to harsh weather conditions or several autonomous days) to optimize PV output to batteries, possibly reduce the number of PV modules required, and reduce risk of system downtime.
3. Specify AGM batteries for future installations. AGM batteries are almost maintenance free, more resistant to harsh environments, and can be placed in pull boxes. Cost of AGM’s has become comparable to current sealed Gel Cell batteries.
4. Look into hybrid systems to:
• Allow PV systems for larger loads (small DMS, CCTV with heaters).
• Reduce size and number of batteries, and/or increase days of autonomy.
71
Photovoltaic Module/Array
Backup Batteries
Charge Controller
DC Load (Load Control)
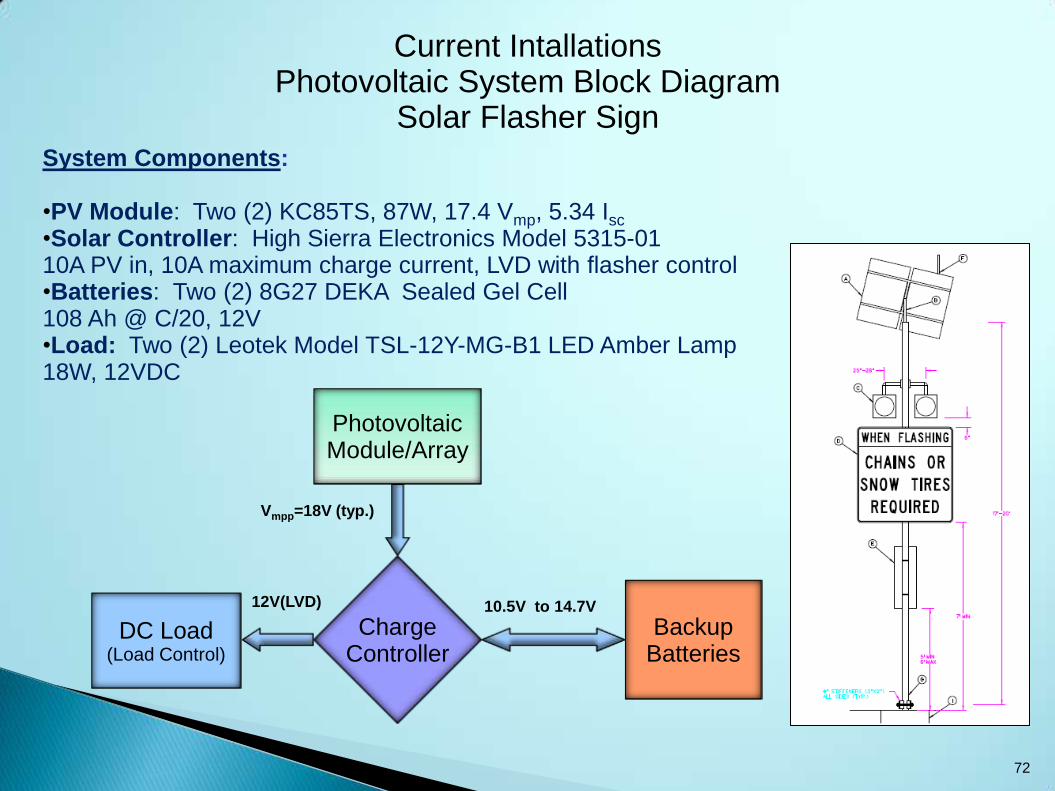
Current Intallations Photovoltaic System Block Diagram
Solar Flasher Sign
Vmpp=18V (typ.)
10.5V to 14.7V 12V(LVD)
System Components:
•PV Module: Two (2) KC85TS, 87W, 17.4 Vmp, 5.34 Isc
•Solar Controller: High Sierra Electronics Model 5315-01 10A PV in, 10A maximum charge current, LVD with flasher control •Batteries: Two (2) 8G27 DEKA Sealed Gel Cell 108 Ah @ C/20, 12V •Load: Two (2) Leotek Model TSL-12Y-MG-B1 LED Amber Lamp 18W, 12VDC
72
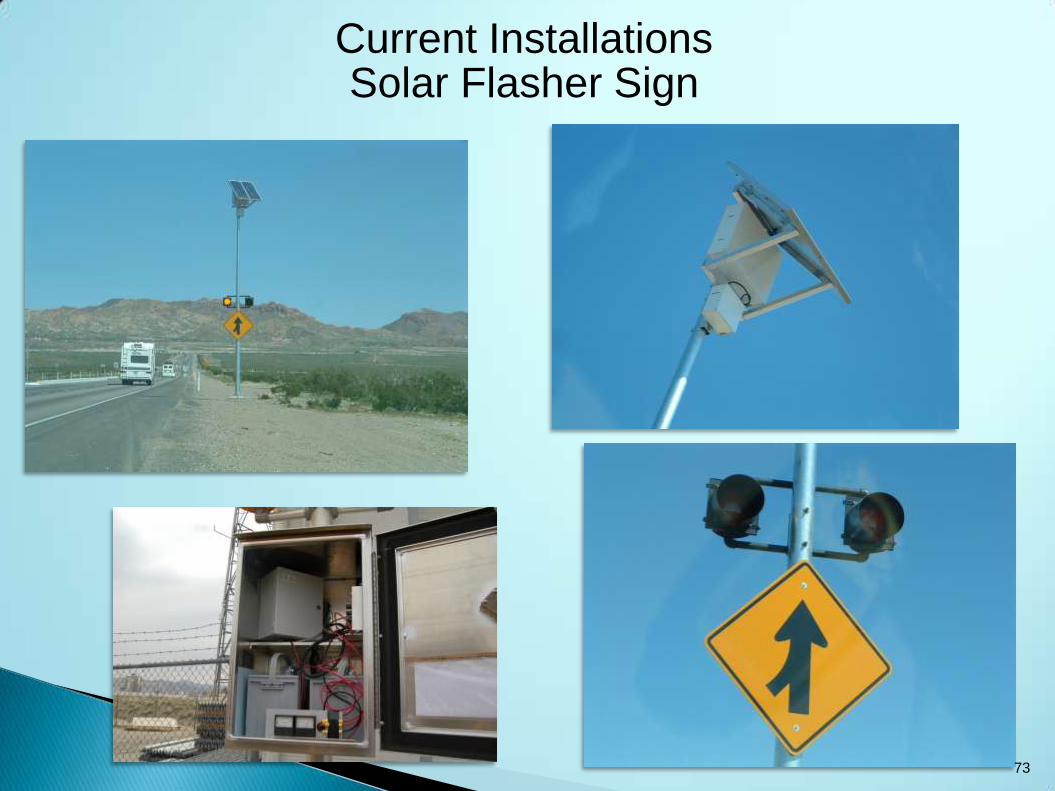
Current Installations Solar Flasher Sign
73
Photovoltaic Module/Array
Backup Batteries
Charge Controller
DC Load (Load Control)
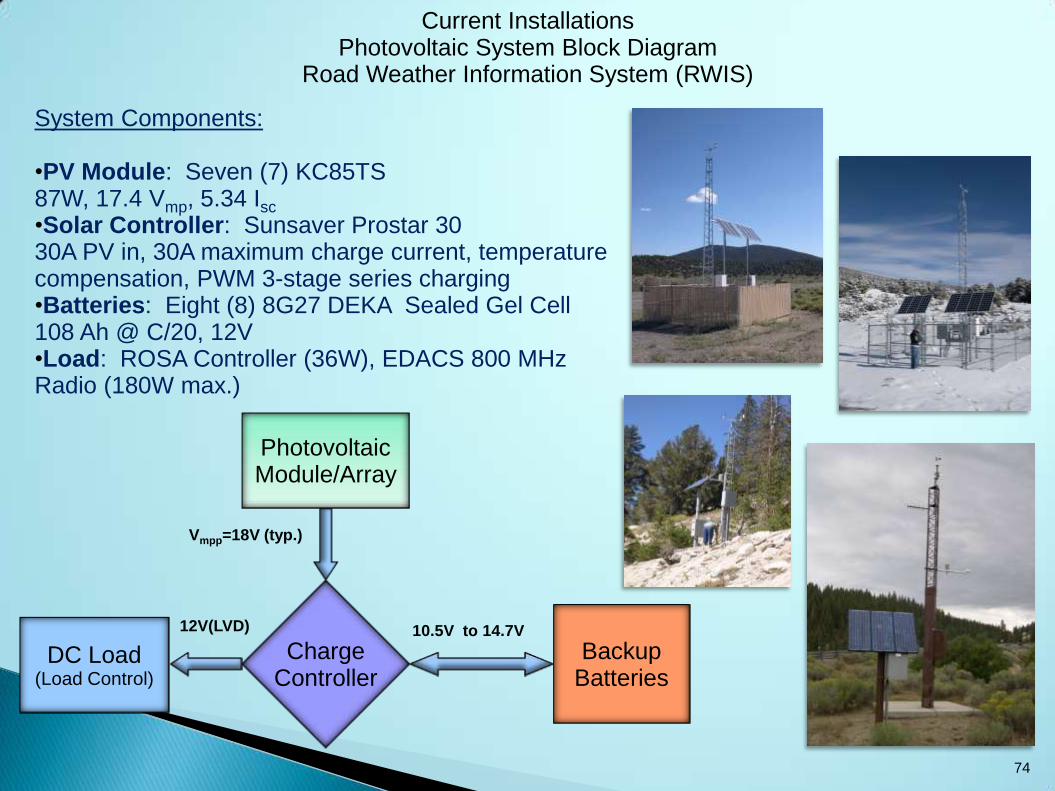
Current Installations Photovoltaic System Block Diagram
Road Weather Information System (RWIS)
Vmpp=18V (typ.)
10.5V to 14.7V 12V(LVD)
System Components: •PV Module: Seven (7) KC85TS 87W, 17.4 Vmp, 5.34 Isc
•Solar Controller: Sunsaver Prostar 30 30A PV in, 30A maximum charge current, temperature compensation, PWM 3-stage series charging •Batteries: Eight (8) 8G27 DEKA Sealed Gel Cell 108 Ah @ C/20, 12V •Load: ROSA Controller (36W), EDACS 800 MHz Radio (180W max.)
74
Live Demonstration Equipment
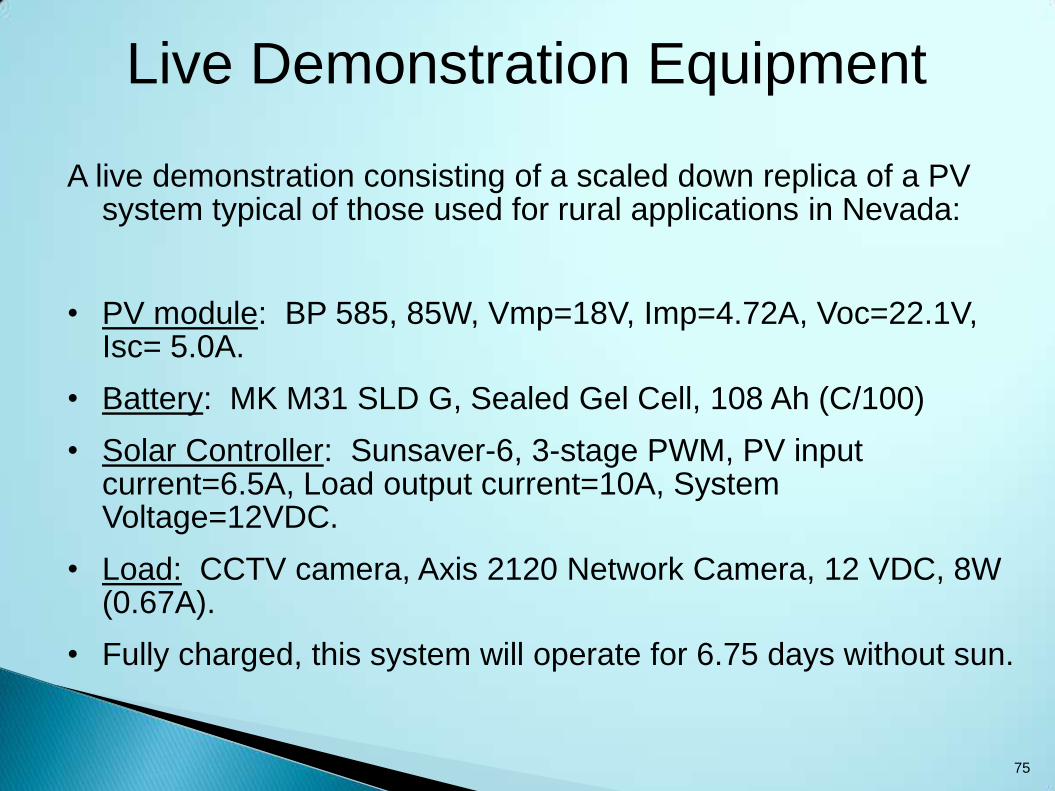
A live demonstration consisting of a scaled down replica of a PV system typical of those used for rural applications in Nevada:
• PV module: BP 585, 85W, Vmp=18V, Imp=4.72A, Voc=22.1V, Isc= 5.0A.
• Battery: MK M31 SLD G, Sealed Gel Cell, 108 Ah (C/100)
• Solar Controller: Sunsaver-6, 3-stage PWM, PV input current=6.5A, Load output current=10A, System Voltage=12VDC.
• Load: CCTV camera, Axis 2120 Network Camera, 12 VDC, 8W (0.67A).
• Fully charged, this system will operate for 6.75 days without sun.
75
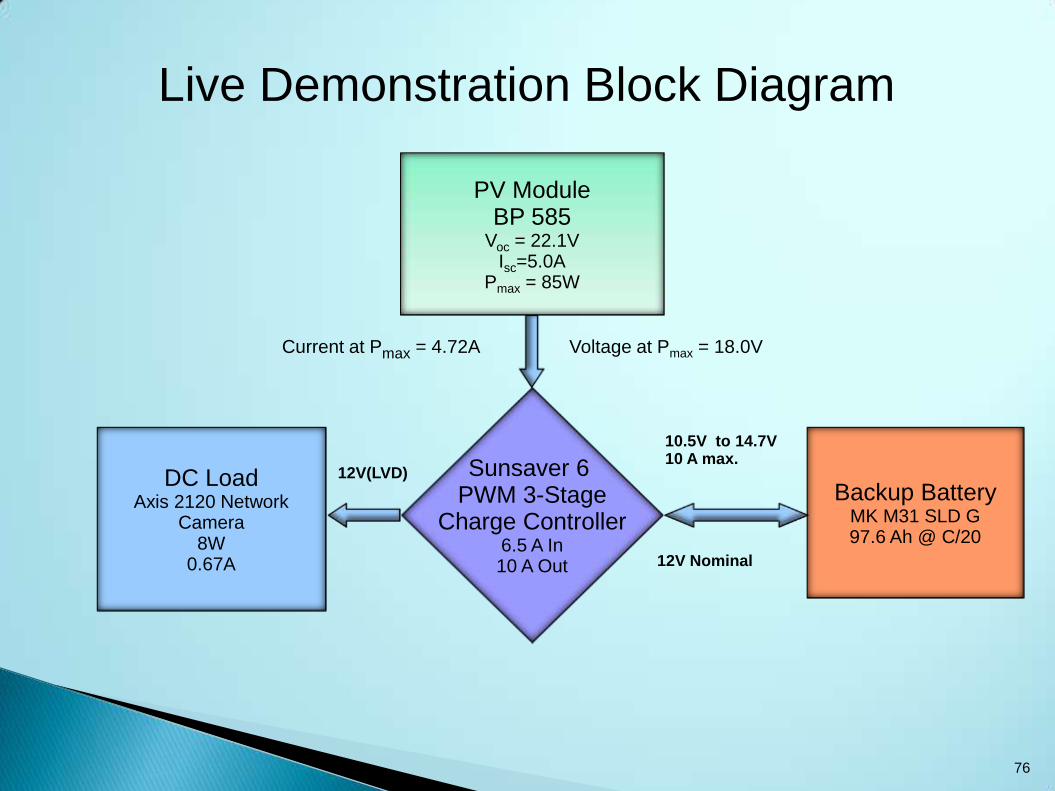
PV Module BP 585
Voc = 22.1V Isc=5.0A
Pmax = 85W
Backup Battery MK M31 SLD G 97.6 Ah @ C/20
Sunsaver 6 PWM 3-Stage
Charge Controller 6.5 A In 10 A Out
DC Load Axis 2120 Network
Camera 8W
0.67A
Live Demonstration Block Diagram
10.5V to 14.7V 10 A max. 12V(LVD)
Current at Pmax = 4.72A Voltage at Pmax = 18.0V
12V Nominal
76
Conclusion •Photovoltaic Systems offer a cost effective solution to providing power for rural ITS applications where commercial power is either unavailable or too costly.
•While it is always desirable to use commercial AC power, PV systems allow rural ITS devices to be placed where needed without the constraint of having to locate near existing AC facilities.
•PV systems are relatively easy to design, install, and maintain.
•Future systems will offer greater benefits with cost reductions and improvements in system components. Special Thanks to: Jessie Lidder, District 2 Communications Kevin Chatfield, District 2 Communications Bill Hance, District 3 Communications Dan Preslar, Vice President, Transcore, Inc. For providing invaluable input and support.
77
![TRAFFIC DATA PLATFORM AS ITS INFRASTRUCTURE FOR ...€¦ · 2. Airborne traffic data Traffic data from aerial radar or video images [5, 6] (extraction of relevant traffic information](https://img.pdfslide.us/doc/110x75/5f087e867e708231d42249d2/traffic-data-platform-as-its-infrastructure-for-2-airborne-traffic-data-traffic.jpg)