Embed Size (px)
Citation preview
Photosynthetic efficiency ofDunaliella tertiolectaunder shortlight/dark cycles
Marcel Janssena,*, Peter Slendersa, Johannes Trampera, Luuc R. Murb, ReneH. Wijffelsa
aFood and Bioprocess Engineering Group, Wageningen University, The NetherlandsbAmsterdam Research Institute for Substances in Ecosystems, University of Amsterdam, The Netherlands
Received 21 August 2000; received in revised form 7 May 2001; accepted 4 June 2001
Abstract
Inside photobioreactors algae are exposed to light/dark fluctuations. In this study the marine green algaDunaliella tertiolectawascultivated under short light/dark cycles of 3/3 s, 94/94 ms and 31/156 ms as found in medium and short light-path reactors. The photon fluxdensity (PFD) during the light period was 440–455mmol m22 s21 and, under the 31/156 ms cycle only, 1025mmol m22 s21. Thephotosynthetic efficiency was determined and expressed as the biomass yield on light energy in gram protein produced per mol of photonsabsorbed. The yield under the 94/94 ms cycle was higher than the yield under continuous light of 440–455mmol m22 s21. Apparently alight integration effect occurs under the 94/94 ms cycle together with an increase of the photosynthetic efficiency. On the contrary, at the3/3 s cycle the efficiency decreased. Also under the 31/156 ms cycle, with 1025mmol m22 s21 in the light period, the yield was lower thanunder continuous light. The results obtained under the 31/156 ms light/dark cycle are discussed with respect to the performance of shortlight-path flat panel photobioreactors operated at high biomass densities. © 2001 Elsevier Science Inc. All rights reserved.
Keywords:Microalgae;Dunaliella tertiolecta; light/dark cycles; photosynthetic efficiency; biomass yield; photobioreactors
1. Introduction
Large-scale cultivation of algal monocultures is still lim-ited to a small number of species cultivated in open racewayponds. The constraining factor is that many species needcontrolled and aseptic conditions and therefore need to becultivated in closed photobioreactors. Several types ofclosed photobioreactors have been developed and studiedbut either the productivity is low or scale-up is problematic.Because light energy is the limiting substrate in such sys-tems it is important to focus on the photosynthetic efficiencyor the biomass yield on light energy. The light regime insidephotobioreactors is complicated: algae are exposed to high-intensity sunlight in the so-called photic zone close to thereactor surface and complete darkness in the interior. As aresult, algae are exposed to certain light/dark cycles, whichcould have a considerable effect on the photosyntheticefficiency.
Short light/dark cycles of several seconds to tenths of a
second are found in well-mixed medium light-path (40–300mm) or short light-path (,40 mm) reactors like bubblecolumns, tubular reactors or flat panels. It has already beendemonstrated that short cycles can have a strong influenceon photosynthetic activity and specific growth rate [1–3].The term light integration is often used in this respect. Incontinuous light the specific growth rate or oxygen produc-tion rate can be written as a saturating function of thephoton flux density (PFD):m 5 f(PFD). The initial rate isnearly proportional to PFD and approaches a horizontalasymptote at higher PFDs defined as the maximum rate. Onthe other hand, under light/dark cycles algae are exposed toa certain PFD during the light period and no photon flux atall in the dark zone. The fraction of time the cells areilluminated during a cycle (e) can be used to predict thegrowth rate: with full integration of light:m 5 f(e.PFD), andwith no integration of light:m 5 e.f(PFD). Since the growthrate or oxygen production rate is a saturating function ofPFD it is clear that under saturating PFDs: f(e.PFD) $e.f(PFD). In other words, due to light integration the ratewill decrease less than proportional to a decrease of the lightfraction (e).
In several studies light integration under short light/dark
* Corresponding author. Tel.:131 (0)317 483396; fax:131 (0)317482237.
E-mail address:[email protected] (M. Janssen).
www.elsevier.com/locate/enzmictecEnzyme and Microbial Technology 29 (2001) 298–305
0141-0229/01/$ – see front matter © 2001 Elsevier Science Inc. All rights reserved.PII: S0141-0229(01)00387-8
cycles was demonstrated during oxygen production mea-surements with the green algaChlorella and the diatomPhaeodactylum[1,2,4]. Also in more recent studies lightintegration was observed for other green algae and cya-nobacteria with respect to specific oxygen production andspecific growth rate [3,5,6].
The occurrence of light integration can be explained withthe fact that light energy can be utilized more efficiently bythe photosynthetic apparatus if it is delivered in small pulsesseparated in time in comparison to a constant flux. Thiscould lead to the partial re-oxidation of the plastoquinonepool in the photosynthetic membrane during dark periodsgiving rise to an increased capacity to convert light energyinto chemical energy during the light pulse [3]. In addition,changes in the oxidation/reduction state could influence theantenna size of the photosynthetic apparatus [7]. In thatsituation specific light absorption could increase and theefficiency increase due to light/dark cycling could be lower.Because of this, also the specific light absorption should beconsidered when evaluating the effect of light/dark fluctu-ations. Nevertheless, intense mixing of algal cultures, lead-ing to short light/dark cycles, could lead to higher photo-synthetic efficiencies.
Strong evidence for this mixing-induced increase of thephotosynthetic efficiency is provided by the studies done inshort light-path (1.3–2.6 cm) flat panel reactors [8,9]. Inthese studies photosynthetic efficiencies of 15% were foundfor the cyanobacteriumSpirulina platensis.The photosyn-thetic efficiency was based on the energy content of thebiomass produced and photons absorbed. The PFD at thereactor surface was 1800mmol.m22.s21 which resemblesintense sunlight. Probably the PFD can be increased furtherto 2500mmol.m22.s21 without affecting the efficiency [10].For comparison, the highest photosynthetic efficiencies re-ported in other studies range from 10% to 18% and a
theoretical limit was calculated at 29% [11]. These labora-tory studies were carried out under light-limiting conditionsand, usually, at a low PFD yielding the highest efficiency[12]. On the other hand, the PFD on the flat panel surfacewas very high, but the light/dark cycles were very short(,200 ms) [8,9]. Therefore it was suggested that lightenergy was integrated in time and very efficiently directedto growth.
The photosynthetic efficiency in these pilot-scale sys-tems could be determined easily [8,9]. The actual light/darkcycles inside the reactor, however, could not be clearlydetermined or calculated by the authors. On the other hand,in lab-scale experiments the light/dark cycle could be con-trolled very well but the specific rate of light absorption wasnever determined. Although light integration was demon-strated it was not possible to draw conclusions concerningthe photosynthetic efficiency without accurate knowledge ofspecific light absorption [2,3]. In addition, in most studiesalgae were not allowed to acclimate (.3 generation times)to the light/dark cycles studied [1,2,4,6].
In the present study the photosynthetic efficiency wasdirectly measured as the biomass yield on light energy. Thisis done in lab-scale reactors after acclimation to preciselydefined light/dark cycles of several seconds to tenths of asecond. The green algaDunaliella tertiolectawas cultivatedunder light/dark (L/D) cycles of 3/3 s, 94/94 ms and 31/156ms. For comparison the alga was also cultivated undercontinuous light of low and high light intensity. It wasdemonstrated that under the 94/94 ms cycle a light integra-tion effect takes place and that photosynthetic efficiencyincreases in comparison to continuous illumination. Thisconfirms the expectations from other studies that light inte-gration can take place in short light-path reactors togetherwith an increase of the photosynthetic efficiency. Under the3/3 s and the 31/156 ms L/D cycles the efficiency was lowerin comparison to continuous illumination. The results ob-tained under the 31/156 ms L/D cycle are discussed withrespect to the performance of short light-path flat panelphotobioreactors operated at high biomass densities.
2. Materials and methods
2.1. Organism and medium
Dunaliella tertiolectaCCAP 19/6B was obtained fromthe Culture Collection of Algae and Protozoa (Oban, UK).D. tertiolectawas cultivated in artificial seawater mediumas described previously [13].Dunaliella was maintained aspure suspended culture in 100 ml erlenmeyer flasks con-taining 50 ml of medium. The cultures were not stirred andplaced at 20°C, at a photon flux density (PFD) of 50–70mmol m22 s21 under a 16/8 h day/night cycle. Every threeweeks 0.5 ml of a culture was transferred to a new flaskcontaining fresh medium. The reactor was inoculated di-rectly with the culture of one flask.
Nomenclature
PAR photosynthetic active radiation, 400–700 nmPFD photon flux density in PAR-range [mmol m22
s21]PFDav time-averaged PFD [mol m22 d21]OD680 optical density at 680 nm [-]SCA750 scattering at 750 nm measured with integrat-
ing [-] spheree light fraction within light/dark cycle [-]m specific growth rate [h21]a*
prot average spectral absorption coefficient, [m2 g21]based on protein
a*750 absorption coefficient, based on SCA750 [m21
SCA75021]
Yx, E biomass yield on light energy, protein per pho-tons [g mol21]
299M. Janssen et al. / Enzyme and Microbial Technology 29 (2001) 298–305
2.2. Reactor set-up
Dunaliellawas cultivated in a flat bioreactor placed in anaquarium filled with water as described previously [13]. Thewater was maintained at the cultivation temperature, 30°C.The reactor had a 1000 ml liquid volume and a 3 cm lightpath. The liquid was mixed by air bubbled at a rate of 21.5liters h21. The pH was maintained between 7.85 and 8.05 bypulsed addition of carbon dioxide to the air flow. As a result,also the carbon-dioxide concentration was maintained con-stant.
The front side of the reactor as a whole was illuminatedwith a panel (width3 height5 20 3 30 cm) of 1452 lightemitting diodes (LEDs) which was placed outside the aquar-ium. During cultivation always a 16/8 h day/night cycle wasapplied comparable to day/night cycles in outdoor photo-bioreactors. In addition, the lamps could be alternatelyturned on and off to create short light/dark cycles withvariable cycle length (188 ms and 6 s) and light fractions(0.5 and 0.167) during the day, see below. The algal culturesin the bioreactors were maintained for one week under acertain light regime and were diluted daily.
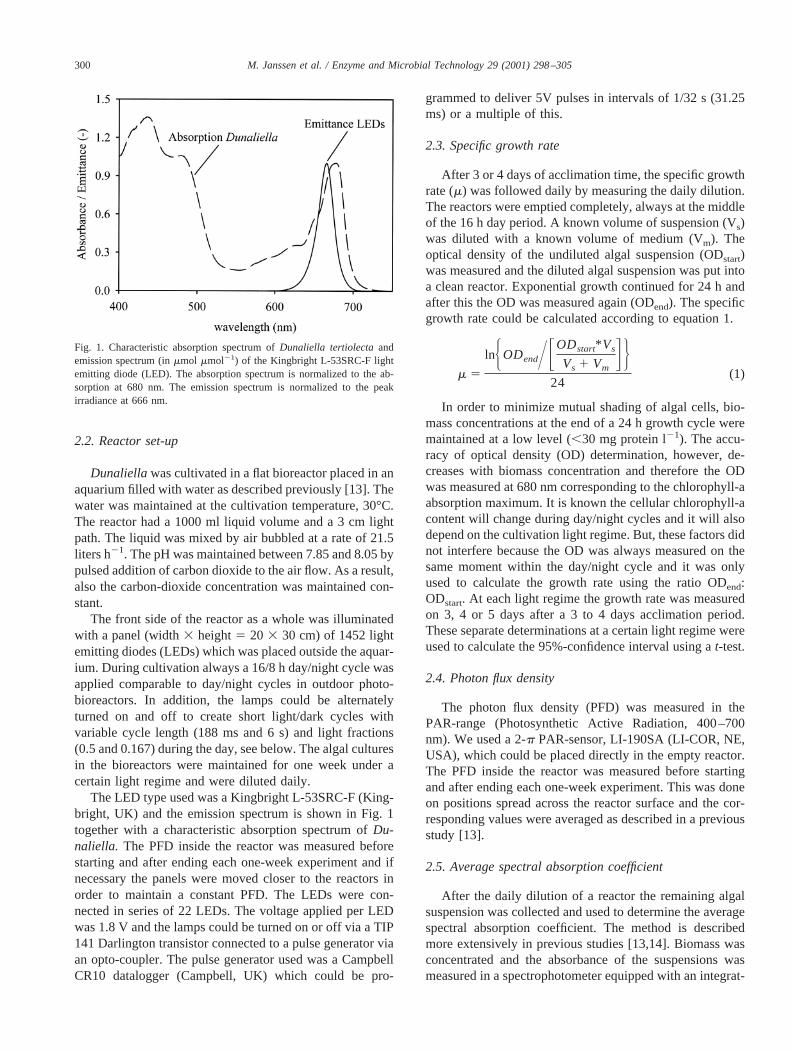
The LED type used was a Kingbright L-53SRC-F (King-bright, UK) and the emission spectrum is shown in Fig. 1together with a characteristic absorption spectrum ofDu-naliella. The PFD inside the reactor was measured beforestarting and after ending each one-week experiment and ifnecessary the panels were moved closer to the reactors inorder to maintain a constant PFD. The LEDs were con-nected in series of 22 LEDs. The voltage applied per LEDwas 1.8 V and the lamps could be turned on or off via a TIP141 Darlington transistor connected to a pulse generator viaan opto-coupler. The pulse generator used was a CampbellCR10 datalogger (Campbell, UK) which could be pro-
grammed to deliver 5V pulses in intervals of 1/32 s (31.25ms) or a multiple of this.
2.3. Specific growth rate
After 3 or 4 days of acclimation time, the specific growthrate (m) was followed daily by measuring the daily dilution.The reactors were emptied completely, always at the middleof the 16 h day period. A known volume of suspension (Vs)was diluted with a known volume of medium (Vm). Theoptical density of the undiluted algal suspension (ODstart)was measured and the diluted algal suspension was put intoa clean reactor. Exponential growth continued for 24 h andafter this the OD was measured again (ODend). The specificgrowth rate could be calculated according to equation 1.
m 5
lnHODendYFODstart* Vs
Vs 1 VmGJ
24(1)
In order to minimize mutual shading of algal cells, bio-mass concentrations at the end of a 24 h growth cycle weremaintained at a low level (,30 mg protein l21). The accu-racy of optical density (OD) determination, however, de-creases with biomass concentration and therefore the ODwas measured at 680 nm corresponding to the chlorophyll-aabsorption maximum. It is known the cellular chlorophyll-acontent will change during day/night cycles and it will alsodepend on the cultivation light regime. But, these factors didnot interfere because the OD was always measured on thesame moment within the day/night cycle and it was onlyused to calculate the growth rate using the ratio ODend:ODstart. At each light regime the growth rate was measuredon 3, 4 or 5 days after a 3 to 4days acclimation period.These separate determinations at a certain light regime wereused to calculate the 95%-confidence interval using at-test.
2.4. Photon flux density
The photon flux density (PFD) was measured in thePAR-range (Photosynthetic Active Radiation, 400–700nm). We used a 2-p PAR-sensor, LI-190SA (LI-COR, NE,USA), which could be placed directly in the empty reactor.The PFD inside the reactor was measured before startingand after ending each one-week experiment. This was doneon positions spread across the reactor surface and the cor-responding values were averaged as described in a previousstudy [13].
2.5. Average spectral absorption coefficient
After the daily dilution of a reactor the remaining algalsuspension was collected and used to determine the averagespectral absorption coefficient. The method is describedmore extensively in previous studies [13,14]. Biomass wasconcentrated and the absorbance of the suspensions wasmeasured in a spectrophotometer equipped with an integrat-
Fig. 1. Characteristic absorption spectrum ofDunaliella tertiolectaandemission spectrum (inmmol mmol21) of the Kingbright L-53SRC-F lightemitting diode (LED). The absorption spectrum is normalized to the ab-sorption at 680 nm. The emission spectrum is normalized to the peakirradiance at 666 nm.
300 M. Janssen et al. / Enzyme and Microbial Technology 29 (2001) 298–305
ing sphere. Forward-scattered light was collected with thisset-up. Absorbance was measured from 400 to 700 nm.Average absorbance between 740 and 750 nm was mea-sured too and subtracted from the absorbance between 400and 700 nm because the pigments do no absorb in this rangeand the absorbance must be caused by residual scattering[15]. Afterwards, the protein content of the suspensions wasdetermined.
From the absorbance scans the specific average spectralabsorption coefficient, light-absorbing surface per amountof protein (a*prot), was calculated according to Dubinsky etal. [16]. The relative spectral distribution of the light emit-ting diodes (Fig. 1) was needed for these calculations andwas measured from 400 to 700 nm with a spectroradiometer(SR 9910, Macam, UK). Similar to optical density measure-ments the average absorption between 740 and 750 nm(SCA750) was caused by scattering and could be used as ameasure of cell number. Therefore the average light absorp-tion was expressed on this value too and was designated asa*
750 in m21 SCA75021.
2.6. Protein concentration
Protein concentration in the samples used for the mea-surement of the average spectral absorption coefficient wasdetermined immediately after the absorbance measurement.Each sample was diluted to a protein concentration of 50–100 mg l21 using fresh medium and 1 ml samples werestored at -80°C. After thawing the cells were broken and atthe same time protein was precipitated with 0.1 ml 20% w/vtrichloroacetic acid. The suspensions were centrifuged(9100 RCF, 10 min, 4°C) and the pellets were re-suspendedin 1 N sodium hydroxide. Following, the samples wereheated for 5 min at 70°C to dissolve the protein. After thispretreatment protein was determined following the Bradfordmethod [17] using a commercially available kit (CoomassieProtein Assay Reagent, Pierce, USA). Bovine serum albu-mine (fraction V, crystallized, A-4378, Sigma) was used asa standard.
2.7. Biomass yield on light energy
The biomass yield on light energy (Yx,E) was determinedon protein basis: gram protein produced per mol of photonsabsorbed. The yield was calculated by dividing the specificgrowth rate by the specific light absorption rate according toequation 2. In this equatione is the fraction of time the algaeare illuminated within a light/dark cycle. The PFD is theaverage value measured inside the empty reactor and wasassumed to be constant. This assumption was allowed be-cause we used bioreactors with a small light path and theculture was maintained at low density (,30 mg protein l21).
Yx,E 5m
a*prot* PFD*3600*F16
24G* «
(2)
3. Results and discussion
3.1. Specific growth rate
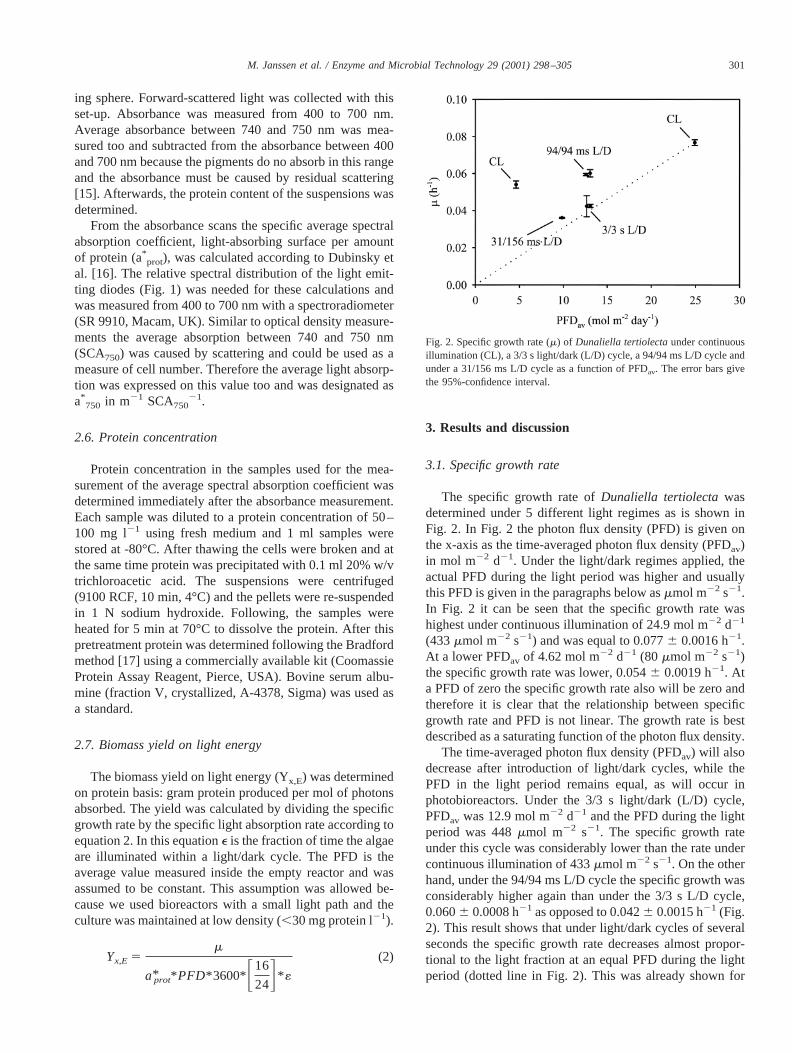
The specific growth rate ofDunaliella tertiolectawasdetermined under 5 different light regimes as is shown inFig. 2. In Fig. 2 the photon flux density (PFD) is given onthe x-axis as the time-averaged photon flux density (PFDav)in mol m22 d21. Under the light/dark regimes applied, theactual PFD during the light period was higher and usuallythis PFD is given in the paragraphs below asmmol m22 s21.In Fig. 2 it can be seen that the specific growth rate washighest under continuous illumination of 24.9 mol m22 d21
(433mmol m22 s21) and was equal to 0.0776 0.0016 h21.At a lower PFDav of 4.62 mol m22 d21 (80 mmol m22 s21)the specific growth rate was lower, 0.0546 0.0019 h21. Ata PFD of zero the specific growth rate also will be zero andtherefore it is clear that the relationship between specificgrowth rate and PFD is not linear. The growth rate is bestdescribed as a saturating function of the photon flux density.
The time-averaged photon flux density (PFDav) will alsodecrease after introduction of light/dark cycles, while thePFD in the light period remains equal, as will occur inphotobioreactors. Under the 3/3 s light/dark (L/D) cycle,PFDav was 12.9 mol m22 d21 and the PFD during the lightperiod was 448mmol m22 s21. The specific growth rateunder this cycle was considerably lower than the rate undercontinuous illumination of 433mmol m22 s21. On the otherhand, under the 94/94 ms L/D cycle the specific growth wasconsiderably higher again than under the 3/3 s L/D cycle,0.0606 0.0008 h21 as opposed to 0.0426 0.0015 h21 (Fig.2). This result shows that under light/dark cycles of severalseconds the specific growth rate decreases almost propor-tional to the light fraction at an equal PFD during the lightperiod (dotted line in Fig. 2). This was already shown for
Fig. 2. Specific growth rate (m) of Dunaliella tertiolectaunder continuousillumination (CL), a 3/3 s light/dark (L/D) cycle, a 94/94 ms L/D cycle andunder a 31/156 ms L/D cycle as a function of PFDav. The error bars givethe 95%-confidence interval.
301M. Janssen et al. / Enzyme and Microbial Technology 29 (2001) 298–305
Dunaliella, Chlamydomonasand Chlorella in previousstudies [13,14,18]. But, under a 94/94 ms L/day cycle spe-cific growth is considerably faster then under the 3/3 s cycle.This is clear evidence that considerable light integrationoccurs when the cycle time is sufficiently small.
Besides cycle time also the PFD in the light period andthe relative size of the light period have a big influence. Thespecific growth rate was lowest under the 31/156 ms light/dark cycle. The PFD during the light period was increasedfrom 430–455 to 1025mmol.m22 s21 to approach thesituation in photobioreactors with a steep light gradient anda high PFD at the surface. Although the cycle time was only188 ms the light integration effect almost disappeared (Fig.2).
3.2. Specific light absorption
The specific average spectral absorption coefficient(a*
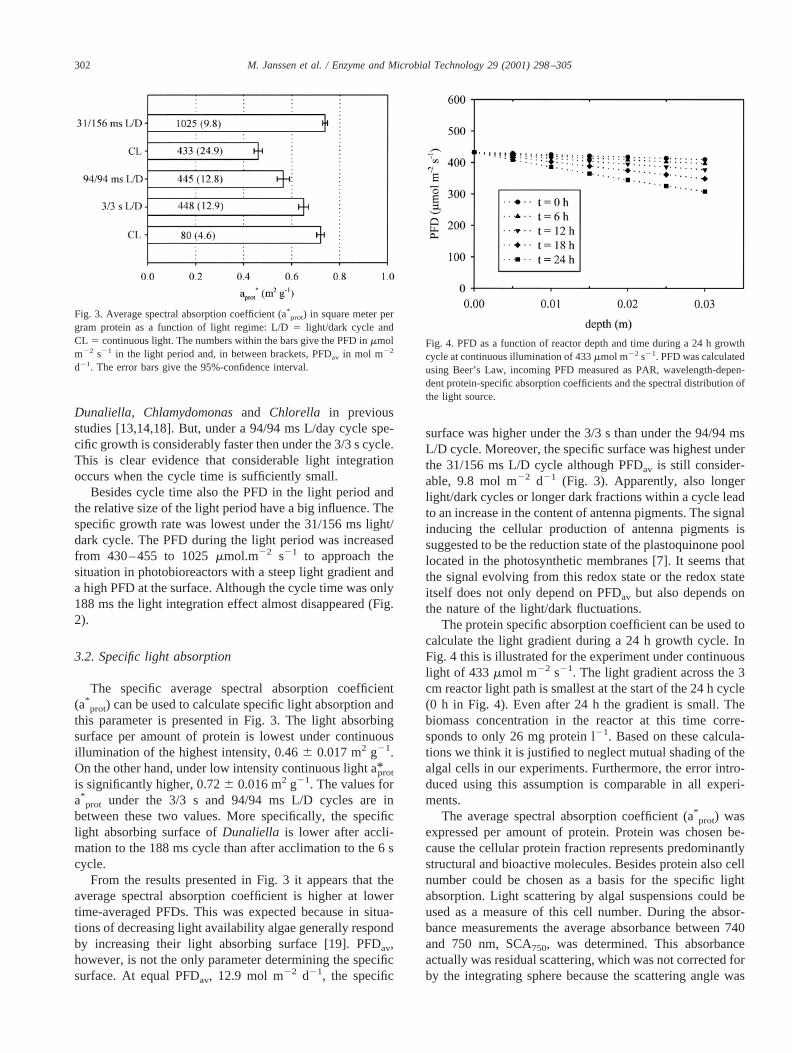
prot) can be used to calculate specific light absorption andthis parameter is presented in Fig. 3. The light absorbingsurface per amount of protein is lowest under continuousillumination of the highest intensity, 0.466 0.017 m2 g21.On the other hand, under low intensity continuous light a*prot
is significantly higher, 0.726 0.016 m2 g21. The values fora*
prot under the 3/3 s and 94/94 ms L/D cycles are inbetween these two values. More specifically, the specificlight absorbing surface ofDunaliella is lower after accli-mation to the 188 ms cycle than after acclimation to the 6 scycle.
From the results presented in Fig. 3 it appears that theaverage spectral absorption coefficient is higher at lowertime-averaged PFDs. This was expected because in situa-tions of decreasing light availability algae generally respondby increasing their light absorbing surface [19]. PFDav,however, is not the only parameter determining the specificsurface. At equal PFDav, 12.9 mol m22 d21, the specific
surface was higher under the 3/3 s than under the 94/94 msL/D cycle. Moreover, the specific surface was highest underthe 31/156 ms L/D cycle although PFDav is still consider-able, 9.8 mol m22 d21 (Fig. 3). Apparently, also longerlight/dark cycles or longer dark fractions within a cycle leadto an increase in the content of antenna pigments. The signalinducing the cellular production of antenna pigments issuggested to be the reduction state of the plastoquinone poollocated in the photosynthetic membranes [7]. It seems thatthe signal evolving from this redox state or the redox stateitself does not only depend on PFDav but also depends onthe nature of the light/dark fluctuations.
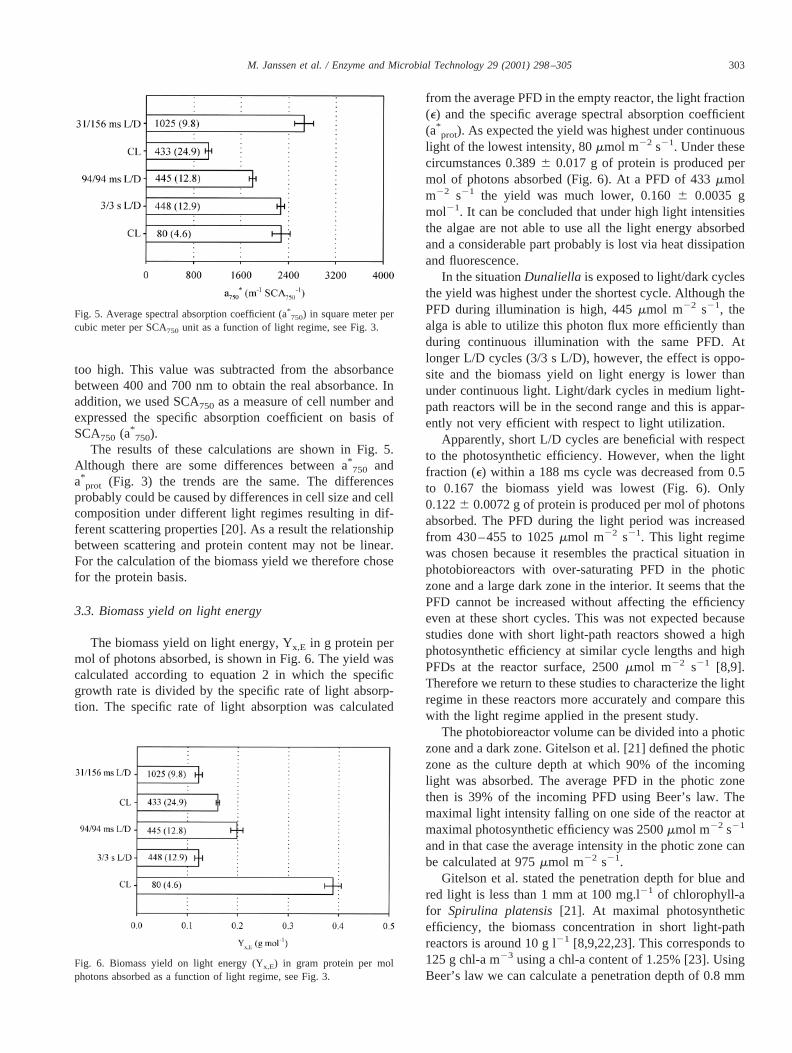
The protein specific absorption coefficient can be used tocalculate the light gradient during a 24 h growth cycle. InFig. 4 this is illustrated for the experiment under continuouslight of 433mmol m22 s21. The light gradient across the 3cm reactor light path is smallest at the start of the 24 h cycle(0 h in Fig. 4). Even after 24 h the gradient is small. Thebiomass concentration in the reactor at this time corre-sponds to only 26 mg protein l21. Based on these calcula-tions we think it is justified to neglect mutual shading of thealgal cells in our experiments. Furthermore, the error intro-duced using this assumption is comparable in all experi-ments.
The average spectral absorption coefficient (a*prot) was
expressed per amount of protein. Protein was chosen be-cause the cellular protein fraction represents predominantlystructural and bioactive molecules. Besides protein also cellnumber could be chosen as a basis for the specific lightabsorption. Light scattering by algal suspensions could beused as a measure of this cell number. During the absor-bance measurements the average absorbance between 740and 750 nm, SCA750, was determined. This absorbanceactually was residual scattering, which was not corrected forby the integrating sphere because the scattering angle was
Fig. 3. Average spectral absorption coefficient (a*prot) in square meter per
gram protein as a function of light regime: L/D5 light/dark cycle andCL 5 continuous light. The numbers within the bars give the PFD inmmolm22 s21 in the light period and, in between brackets, PFDav in mol m22
d21. The error bars give the 95%-confidence interval.
Fig. 4. PFD as a function of reactor depth and time during a 24 h growthcycle at continuous illumination of 433mmol m22 s21. PFD was calculatedusing Beer’s Law, incoming PFD measured as PAR, wavelength-depen-dent protein-specific absorption coefficients and the spectral distribution ofthe light source.
302 M. Janssen et al. / Enzyme and Microbial Technology 29 (2001) 298–305
too high. This value was subtracted from the absorbancebetween 400 and 700 nm to obtain the real absorbance. Inaddition, we used SCA750 as a measure of cell number andexpressed the specific absorption coefficient on basis ofSCA750 (a*
750).The results of these calculations are shown in Fig. 5.
Although there are some differences between a*750 and
a*prot (Fig. 3) the trends are the same. The differences
probably could be caused by differences in cell size and cellcomposition under different light regimes resulting in dif-ferent scattering properties [20]. As a result the relationshipbetween scattering and protein content may not be linear.For the calculation of the biomass yield we therefore chosefor the protein basis.
3.3. Biomass yield on light energy
The biomass yield on light energy, Yx,E in g protein permol of photons absorbed, is shown in Fig. 6. The yield wascalculated according to equation 2 in which the specificgrowth rate is divided by the specific rate of light absorp-tion. The specific rate of light absorption was calculated
from the average PFD in the empty reactor, the light fraction(e) and the specific average spectral absorption coefficient(a*
prot). As expected the yield was highest under continuouslight of the lowest intensity, 80mmol m22 s21. Under thesecircumstances 0.3896 0.017 g of protein is produced permol of photons absorbed (Fig. 6). At a PFD of 433mmolm22 s21 the yield was much lower, 0.1606 0.0035 gmol21. It can be concluded that under high light intensitiesthe algae are not able to use all the light energy absorbedand a considerable part probably is lost via heat dissipationand fluorescence.
In the situationDunaliella is exposed to light/dark cyclesthe yield was highest under the shortest cycle. Although thePFD during illumination is high, 445mmol m22 s21, thealga is able to utilize this photon flux more efficiently thanduring continuous illumination with the same PFD. Atlonger L/D cycles (3/3 s L/D), however, the effect is oppo-site and the biomass yield on light energy is lower thanunder continuous light. Light/dark cycles in medium light-path reactors will be in the second range and this is appar-ently not very efficient with respect to light utilization.
Apparently, short L/D cycles are beneficial with respectto the photosynthetic efficiency. However, when the lightfraction (e) within a 188 ms cycle was decreased from 0.5to 0.167 the biomass yield was lowest (Fig. 6). Only0.1226 0.0072 g of protein is produced per mol of photonsabsorbed. The PFD during the light period was increasedfrom 430–455 to 1025mmol m22 s21. This light regimewas chosen because it resembles the practical situation inphotobioreactors with over-saturating PFD in the photiczone and a large dark zone in the interior. It seems that thePFD cannot be increased without affecting the efficiencyeven at these short cycles. This was not expected becausestudies done with short light-path reactors showed a highphotosynthetic efficiency at similar cycle lengths and highPFDs at the reactor surface, 2500mmol m22 s21 [8,9].Therefore we return to these studies to characterize the lightregime in these reactors more accurately and compare thiswith the light regime applied in the present study.
The photobioreactor volume can be divided into a photiczone and a dark zone. Gitelson et al. [21] defined the photiczone as the culture depth at which 90% of the incominglight was absorbed. The average PFD in the photic zonethen is 39% of the incoming PFD using Beer’s law. Themaximal light intensity falling on one side of the reactor atmaximal photosynthetic efficiency was 2500mmol m22 s21
and in that case the average intensity in the photic zone canbe calculated at 975mmol m22 s21.
Gitelson et al. stated the penetration depth for blue andred light is less than 1 mm at 100 mg.l21 of chlorophyll-afor Spirulina platensis[21]. At maximal photosyntheticefficiency, the biomass concentration in short light-pathreactors is around 10 g l21 [8,9,22,23]. This corresponds to125 g chl-a m23 using a chl-a content of 1.25% [23]. UsingBeer’s law we can calculate a penetration depth of 0.8 mm
Fig. 5. Average spectral absorption coefficient (a*750) in square meter per
cubic meter per SCA750 unit as a function of light regime, see Fig. 3.
Fig. 6. Biomass yield on light energy (Yx,E) in gram protein per molphotons absorbed as a function of light regime, see Fig. 3.
303M. Janssen et al. / Enzyme and Microbial Technology 29 (2001) 298–305
for red light. This corresponds to a light fraction (e) of 0.062or 0.031 for a light path of 1.3 or 2.6 cm, respectively.
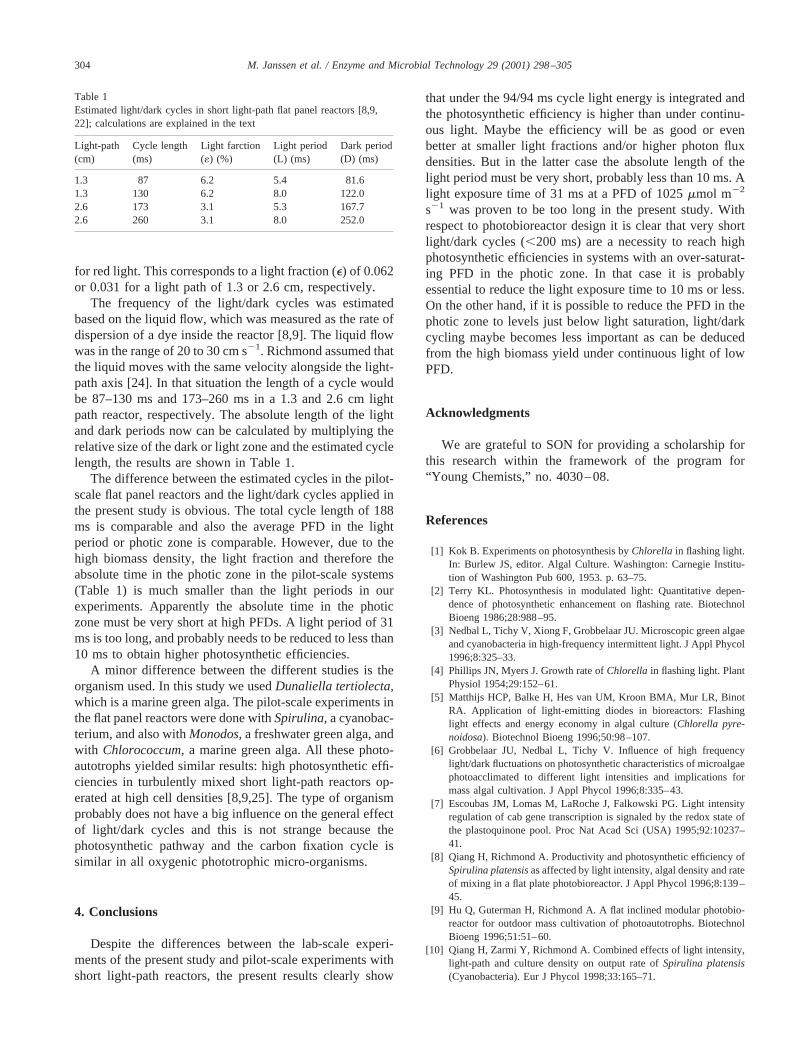
The frequency of the light/dark cycles was estimatedbased on the liquid flow, which was measured as the rate ofdispersion of a dye inside the reactor [8,9]. The liquid flowwas in the range of 20 to 30 cm s21. Richmond assumed thatthe liquid moves with the same velocity alongside the light-path axis [24]. In that situation the length of a cycle wouldbe 87–130 ms and 173–260 ms in a 1.3 and 2.6 cm lightpath reactor, respectively. The absolute length of the lightand dark periods now can be calculated by multiplying therelative size of the dark or light zone and the estimated cyclelength, the results are shown in Table 1.
The difference between the estimated cycles in the pilot-scale flat panel reactors and the light/dark cycles applied inthe present study is obvious. The total cycle length of 188ms is comparable and also the average PFD in the lightperiod or photic zone is comparable. However, due to thehigh biomass density, the light fraction and therefore theabsolute time in the photic zone in the pilot-scale systems(Table 1) is much smaller than the light periods in ourexperiments. Apparently the absolute time in the photiczone must be very short at high PFDs. A light period of 31ms is too long, and probably needs to be reduced to less than10 ms to obtain higher photosynthetic efficiencies.
A minor difference between the different studies is theorganism used. In this study we usedDunaliella tertiolecta,which is a marine green alga. The pilot-scale experiments inthe flat panel reactors were done withSpirulina,a cyanobac-terium, and also withMonodos,a freshwater green alga, andwith Chlorococcum,a marine green alga. All these photo-autotrophs yielded similar results: high photosynthetic effi-ciencies in turbulently mixed short light-path reactors op-erated at high cell densities [8,9,25]. The type of organismprobably does not have a big influence on the general effectof light/dark cycles and this is not strange because thephotosynthetic pathway and the carbon fixation cycle issimilar in all oxygenic phototrophic micro-organisms.
4. Conclusions
Despite the differences between the lab-scale experi-ments of the present study and pilot-scale experiments withshort light-path reactors, the present results clearly show
that under the 94/94 ms cycle light energy is integrated andthe photosynthetic efficiency is higher than under continu-ous light. Maybe the efficiency will be as good or evenbetter at smaller light fractions and/or higher photon fluxdensities. But in the latter case the absolute length of thelight period must be very short, probably less than 10 ms. Alight exposure time of 31 ms at a PFD of 1025mmol m22
s21 was proven to be too long in the present study. Withrespect to photobioreactor design it is clear that very shortlight/dark cycles (,200 ms) are a necessity to reach highphotosynthetic efficiencies in systems with an over-saturat-ing PFD in the photic zone. In that case it is probablyessential to reduce the light exposure time to 10 ms or less.On the other hand, if it is possible to reduce the PFD in thephotic zone to levels just below light saturation, light/darkcycling maybe becomes less important as can be deducedfrom the high biomass yield under continuous light of lowPFD.
Acknowledgments
We are grateful to SON for providing a scholarship forthis research within the framework of the program for“Young Chemists,” no. 4030–08.
References
[1] Kok B. Experiments on photosynthesis byChlorella in flashing light.In: Burlew JS, editor. Algal Culture. Washington: Carnegie Institu-tion of Washington Pub 600, 1953. p. 63–75.
[2] Terry KL. Photosynthesis in modulated light: Quantitative depen-dence of photosynthetic enhancement on flashing rate. BiotechnolBioeng 1986;28:988–95.
[3] Nedbal L, Tichy V, Xiong F, Grobbelaar JU. Microscopic green algaeand cyanobacteria in high-frequency intermittent light. J Appl Phycol1996;8:325–33.
[4] Phillips JN, Myers J. Growth rate ofChlorella in flashing light. PlantPhysiol 1954;29:152–61.
[5] Matthijs HCP, Balke H, Hes van UM, Kroon BMA, Mur LR, BinotRA. Application of light-emitting diodes in bioreactors: Flashinglight effects and energy economy in algal culture (Chlorella pyre-noidosa). Biotechnol Bioeng 1996;50:98–107.
[6] Grobbelaar JU, Nedbal L, Tichy V. Influence of high frequencylight/dark fluctuations on photosynthetic characteristics of microalgaephotoacclimated to different light intensities and implications formass algal cultivation. J Appl Phycol 1996;8:335–43.
[7] Escoubas JM, Lomas M, LaRoche J, Falkowski PG. Light intensityregulation of cab gene transcription is signaled by the redox state ofthe plastoquinone pool. Proc Nat Acad Sci (USA) 1995;92:10237–41.
[8] Qiang H, Richmond A. Productivity and photosynthetic efficiency ofSpirulina platensisas affected by light intensity, algal density and rateof mixing in a flat plate photobioreactor. J Appl Phycol 1996;8:139–45.
[9] Hu Q, Guterman H, Richmond A. A flat inclined modular photobio-reactor for outdoor mass cultivation of photoautotrophs. BiotechnolBioeng 1996;51:51–60.
[10] Qiang H, Zarmi Y, Richmond A. Combined effects of light intensity,light-path and culture density on output rate ofSpirulina platensis(Cyanobacteria). Eur J Phycol 1998;33:165–71.
Table 1Estimated light/dark cycles in short light-path flat panel reactors [8,9,22]; calculations are explained in the text
Light-path(cm)
Cycle length(ms)
Light farction(«) (%)
Light period(L) (ms)
Dark period(D) (ms)
1.3 87 6.2 5.4 81.61.3 130 6.2 8.0 122.02.6 173 3.1 5.3 167.72.6 260 3.1 8.0 252.0
304 M. Janssen et al. / Enzyme and Microbial Technology 29 (2001) 298–305
[11] Pulz O, Scheibenbogen K. Photobioreactors: Design, and perfor-mance with respect to light energy input. In: Scheper T, editor.Advances in Biochemical Engineering/Biotechnology, Vol. 59. Ber-lin Heidelberg: Springer-Verlag, 1998. p. 123–52.
[12] Pirt SJ, Lee YK, Richmond A, Watts Pirt M. The photosyntheticefficiency ofChlorellabiomass growth with reference to solar energyutilisation. J Chem Tech Biotechnol 1980;30:25–34.
[13] Janssen M, de Bresser L, Baijens T, Tramper J, Mur LR, Snel JFH,Wijffels RH. Scale-up aspects of photobioreactors: effects of mixing-induced light/dark cycles. J Appl Phycol 2000;12:225–37.
[14] Janssen M, de Winter M, Tramper J, Mur LR, Snel JFH, Wijffels RH.Efficiency of light utilization ofChlamydomonas reinhardtiiundermedium-duration light/dark cycles. J Biotechnol 2000;78:123–37.
[15] Duysens LNM. The flattening of the absorption spectrum of suspen-sions, as compared to that of solutions. Biochim Biophys Acta 1956;19:1–12.
[16] Dubinsky Z, Falkowski PG, Wyman K. Light harvesting and utiliza-tion by phytoplankton. Plant Cell Physiol 1986;27:1335–49.
[17] Bradford MM. A rapid, and sensitive method for the quantitation ofmicrogram quantities of protein utilizing the principle of protein-dyebinding. Analyt Biochem 1976;72:248–54.
[18] Janssen M, Kuijpers TC, Veldhoen B, Ternbach MB, Tramper J, MurLR, Wijffels RH. Specific growth rate ofChlamydomonas reinhardtii
andChlorella sorokinianaunder medium duration light/dark cycles:13–87 s. J Biotechnol 1999;70:323–33.
[19] Falkowski PG, LaRoche J. Minireview: Acclimation to spectral irra-diance in algae. J Phycol. 1991;27:8–14.
[20] Stramski D, Morel A. Optical properties of photosynthetic picoplank-ton in different physiological states as affected by growth irradiance.Deep-Sea Res Part A 1990;37:245–66.
[21] Gitelson A, Qiang H, Richmond A. Photic volume in photobioreac-tors supporting ultrahigh population densities of the photoautotrophSpirulina platensis.Appl environ Microbiol 1996;62:1570–3.
[22] Qiang H, Faiman D, Richmond A. Optimal tilt angles of enclosedreactors for growing photoautotrophic microorganisms outdoors. JFerment Bioeng 1998;85:230–6.
[23] Qiang H, Guterman H, Richmond A. Physiological characteristics ofSpirulina platensis(cyanobacteria) cultured at ultrahigh cell densi-ties. J Phycol 1996;32:1066–73.
[24] Richmond A. Efficient utilization of high irradiance for production ofphotoautotrophic cell mass: a survey. J Appl Phycol 1996;8:381–7.
[25] Hu Q, Kurano N, Kawachi M, Iwasaki I, Miyachi S. Ultrahigh-cell-density culture of a marine green algaChlorococcum littoralein aflat-plate photobioreactor. Appl Microbiol Biotechnol 1998;49:655–62.
305M. Janssen et al. / Enzyme and Microbial Technology 29 (2001) 298–305